the Creative Commons Attribution 4.0 License.
the Creative Commons Attribution 4.0 License.
 | 30 Jan 2019
Emergent stationarity in Yellow River sediment transport and the underlying shift of dominance: from streamflow to vegetation
Sheng Ye
Qihua Ran
Xudong Fu
Chunhong Hu
Guangqian Wang
Gary Parker
Xiuxiu Chen
Siwei Zhang
Soil erosion and sediment transport play important roles in terrestrial landscape evolution and biogeochemical cycles of nutrients and contaminants. Although discharge is considered to be a controlling factor in sediment transport, its correlation with sediment concentration varies across the Yellow River basin (YRB) and is not fully understood. This paper provides analysis from gauges across the YRB covering a range of climates, topographic characteristics, and degrees of human intervention. Our results show that discharge control on sediment transport is dampened at gauges with large mean annual discharge, where sediment concentration becomes more and more stable. This emergent stationarity can be attributed to vegetation resistance. Our analysis shows that sediment concentration follows a bell shape with vegetation index (normalized difference vegetation index, NDVI) at an annual scale despite heterogeneity in climate and landscape. We obtain the counterintuitive result that, as mean annual discharge increases, the dominant control on sediment transport shifts from streamflow erosion to vegetation retardation in the YRB.
- Article
(2777 KB) - Full-text XML
-
Supplement
(4675 KB) - BibTeX
- EndNote


Watershed sediment transport, from hillslope to channel and subsequently the coast, is crucial to erosion management; flood control; river delta development; and the quantification of global biogeochemical cycles of materials such as organic phosphorus, iron, and aluminum (Martin and Meybeck, 1979; He et al., 2014). During the 20th century, human activities significantly modified the landscape, leading to a reduction in sediment yield and coastal retreat worldwide (Walling and Fang, 2003; Syvitski et al., 2005). Known for its severe sediment problems, the Yellow River (YR) has been a hotspot for studies on soil erosion and sediment transport for decades. Since the 1950s, the annual sediment yield has declined by 80 % because of check-dam construction and ecosystem restoration such as the Grain-for-Green project, motivating discussion on the necessity for further expansion of revegetation schemes (Chen et al., 2015).
Most studies on the physical mechanisms of soil erosion and sediment transport were conducted in relatively small sub-catchments (Collins et al., 2004; Ran et al., 2012). In order to interpret the patterns discovered at the basin scale, it is essential to understand the scaling effects of soil erosion and sediment transport. Specifically, would the mechanisms identified at a small scale also prevail at the basin scale? If not, what factors influence upscaling (Mutema et al., 2015; Song et al., 2016)? However, existing studies on the scaling effects of sediment transport are rather limited and show no significant spatial coherence in the scaling of sediment transport (Le Bissonnais et al., 1998; Deasy et al., 2011; Song et al., 2016). Due to the great heterogeneity in the YRB, scaling patterns could be different even within one tributary. Taking the Wuding River as an example, event mean concentration could decrease downstream after the initial increase in one sub-catchment (Zheng et al., 2011) or keep rising until reaching a plateau in another sub-catchment nearby (Fang et al., 2008). Not only the sediment concentration, but also its correlation with discharge varies across the YRB. Although discharge is considered to be one of the controlling factors in sediment transport, how its influence upscales remains to be fully understood. Therefore it is necessary to expand our findings concerning sediment transport from single tributaries to larger scales, especially incorporating diverse climate, environmental, and anthropogenic characteristics, so that we can derive an understanding applicable to the whole YRB. In this paper, we collected observations across the Yellow River basin (YRB) to quantify changes in sediment concentration in the recent decades (Rustomji et al., 2008; Miao et al., 2011; Wang et al., 2016). By analyzing data from gauges across the YRB (Fig. S1 in the Supplement), we attempt to understand how the correlation between sediment concentration and discharge varies across spatial and temporal scales, what are the dominant factors influencing sediment transport in the YRB, and how their contributions vary from place to place.
We collected daily discharge and sediment concentration data from 123 hydrology gauges within our study area: the YRB above the Sanmenxia station, which is the major hydropower station on the YR. From these we selected 68 gauges spanning a range of climate conditions and physiographic areas, from the gauge at the most upstream end of the main stem to the gauges above Tongguan, which is just 100 km upstream of Sanmenxia Dam (Fig. S1). These gauges were selected for at least 15-year (1971–1986) continuous daily discharge and sediment concentration records between 1951 and 1986. For comparison and further examination of our hypothesis, we also extract the annual discharge and concentration data between 2000 and 2012 for seven gauges located at the outlet of the major tributaries from the Yellow River Sediment Bulletin (Fig. S1 green stars).
The vegetation data used in this study correspond to the normalized difference vegetation index (NDVI), which is an index calculated from remote sensing measurements to indicate the density of plant growth (Running et al., 2004). The NDVI data were downloaded from NASA's Land Long Term Data Record (LTDR) project, which provides daily NDVI observations globally at a spatial resolution of 0.05∘. Instead of the NDVI obtained from Global Inventory Modeling and Mapping Studies (GIMMS), the NDVI from the LTDR project is chosen for its better estimation in the YRB (Sun et al., 2015). The daily NDVI data from 44 gauges located on the eight major tributaries were collected and extracted according to the drainage area of the study gauges from 1982 to 2012 (Fig. S1 green stars). The gauges on the main stem of the YR were not used as the water and sediment condition there is more likely controlled by the major dams along the main stem rather than the hillslope characteristics. Annual maximum NDVI values were used to represent the highest vegetation productivity. The precipitation and leaf area index (LAI) data of the US catchments used for comparison are assembled from the first author's previous work (Ye et al., 2015).
To examine the coupling between discharge and sediment concentration at various temporal scales, wavelet coherence analysis was applied to the daily discharge (m3 s−1) and sediment concentration (kg m−3) data following Grinsted et al. (2004). Wavelet transforms decompose time series into time and frequency and can be used to analyze different parts of the time series by varying the window size. They have been applied to geophysical records for the understanding of variability at temporal scales. To examine the co-variation between discharge and concentration in the time frequency domain, we used a wavelet coherence defined as (Grinsted et al., 2004)
where S is a smoothing operator, WXY is the cross-wavelet transform of time series X and Y representing the common power between the two series, s refers to the scale, and WX and WY are the continuous wavelet transforms of time series X and Y respectively. The wavelet coherence can be considered a correlation coefficient of the two time series in the time frequency domain. The region of cone of influence (COI) was delineated in the wavelet coherence images to avoid reduction in confidence caused by edge effects. Localized wavelets were also averaged through temporal scales to obtain global wavelet coherence (Guan et al., 2011). More detailed explanation about wavelet coherence analysis can be found in Grinsted et al. (2004).
The annual discharge (Qa) and the sediment yield (La) were aggregated daily to further examine their correlation:
where Qi (m3 s−1) and Ci (kg m3) are the daily discharge and sediment concentration, Ad is the drainage area (km2) of each gauge, and n is the number of days in each year. This analysis is applied only at an annual scale since this is when the coupling from wavelet coherence analysis is the strongest (the one with the largest wavelet coherence). The annual mean concentration (Ca) was calculated as
The long-term mean annual discharge (Qm) and the long-term mean annual concentration (Cm) were also calculated by averaging for the period of 1951 to 1986. Note that both the parameters Qa and Qm used here are area-specific discharges (mm yr−1). For each gauge, a linear regression was fit to describe the correlation between annual discharge (Qa) and annual mean concentration (Ca). The slope of this linear regression (αQC) is used to describe the rate of change in sediment concentration with changing discharge at an annual scale.

Figure 1Scatter plots between long-term mean annual discharge (Qm) and (a) wavelet Q–C coherence at daily, monthly, and annual scales from the 68 study gauges and (b) slope of the discharge–sediment-concentration regression (αQC) at an annual scale from the 68 study gauges (R2=0.55 and p value <0.0001).
We applied wavelet coherence analysis to daily discharge and sediment concentration data at 68 study gauges across the YRB (Figs. S2, S3). The results show that, across the gauges, the coupling between discharge and concentration (Q–C) declines with mean annual discharge (Qm) at all three temporal scales (Fig. 1a). That is, as Qm increases, the influence of streamflow on sediment transport becomes weaker and weaker across the gauges, both at intra-annual and within-year scales.
This fading impact of streamflow as it increases can be further quantified in terms of a linear regression between discharge (Qa) and mean sediment concentration (Ca) at an annual scale, when the coupling between discharge and concentration (Q–C) is the strongest (Fig. S4). As can be seen from Fig. 1b, though annual mean concentration is positively correlated with annual discharge at most gauges, the slope in the Q–C regression (αQC) declines exponentially with Qm across the gauges (p value <0.0001). The larger Qm is, the less sensitive sediment concentration responds to variation in annual discharge. For example, gauges with αQC less than 0.1 are the ones with Qm larger than 60 mm yr−1. When Qm is larger than 100 mm yr−1, the variation in sediment concentration is less than 1 % of that in streamflow (αQC<0.01), and thus sediment concentration can be approximated as invariant to changing discharge. Most of these gauges are located on the main stem or near the outlets of tributaries. This increased independence between sediment concentration and discharge may be attributed to the heterogeneity in these relatively large catchments.
This emergent stationarity explains the linear correlation between area-specific sediment yield and runoff depth reported in a small sub-watershed in a hilly area of the Loess Plateau (Zheng et al., 2013). Considering the sediment concentration to be constant, the variation in yield is solely dominated by streamflow, resulting in the observed linear discharge–yield relationship. Similar stationarity in sediment concentration has also been found in arid watersheds in Arizona, US (Gao et al., 2013), where the sediment concentration becomes homogeneous among watersheds when their drainage area is larger than 0.01 km2. The difference in threshold for the emergence of approximately discharge-invariant concentration between the YRB and watersheds in Arizona, US, is probably due to the differences in catchment characteristics, i.e., vegetation type and coverage, terrestrial structure, soil properties, etc.
Our analysis shows that mean annual discharge (Qm) is a better indicator of the correlation between water and sediment transport than drainage area, although the last parameter has been used traditionally. Despite the heterogeneity, both the coupling between Q–C and the concentration sensitivity to variation in streamflow decreases with Qm. A closer inspection reveals useful insights. At gauges with smaller values of Qm, discharge is the dominant factor in sediment transport: an increment in annual discharge is amplified in the increment of sediment concentration (αQC>1) (i.e., Gauge 808, 812 in Fig. S4). However, as Qm increases, variation in streamflow is more weakly reflected in variation in sediment concentration, even though annual mean concentration still correlates with annual discharge, (i.e., Gauge 806 in Fig. S4). As Qm continues to increase, sediment concentration becomes almost invariant to discharge, suggesting that the dominant factor of sediment transport has shifted from the discharge to something else.
To further explore the potential cause of this emergent stationarity, we analyzed the vegetation data (NDVI) from 44 of the gauges located on eight major tributaries of the YR (Fig. S1). Our analysis shows that this declining sensitivity in concentration at an annual scale (αQC) is negatively related to vegetation impact across the gauges (Fig. 2).
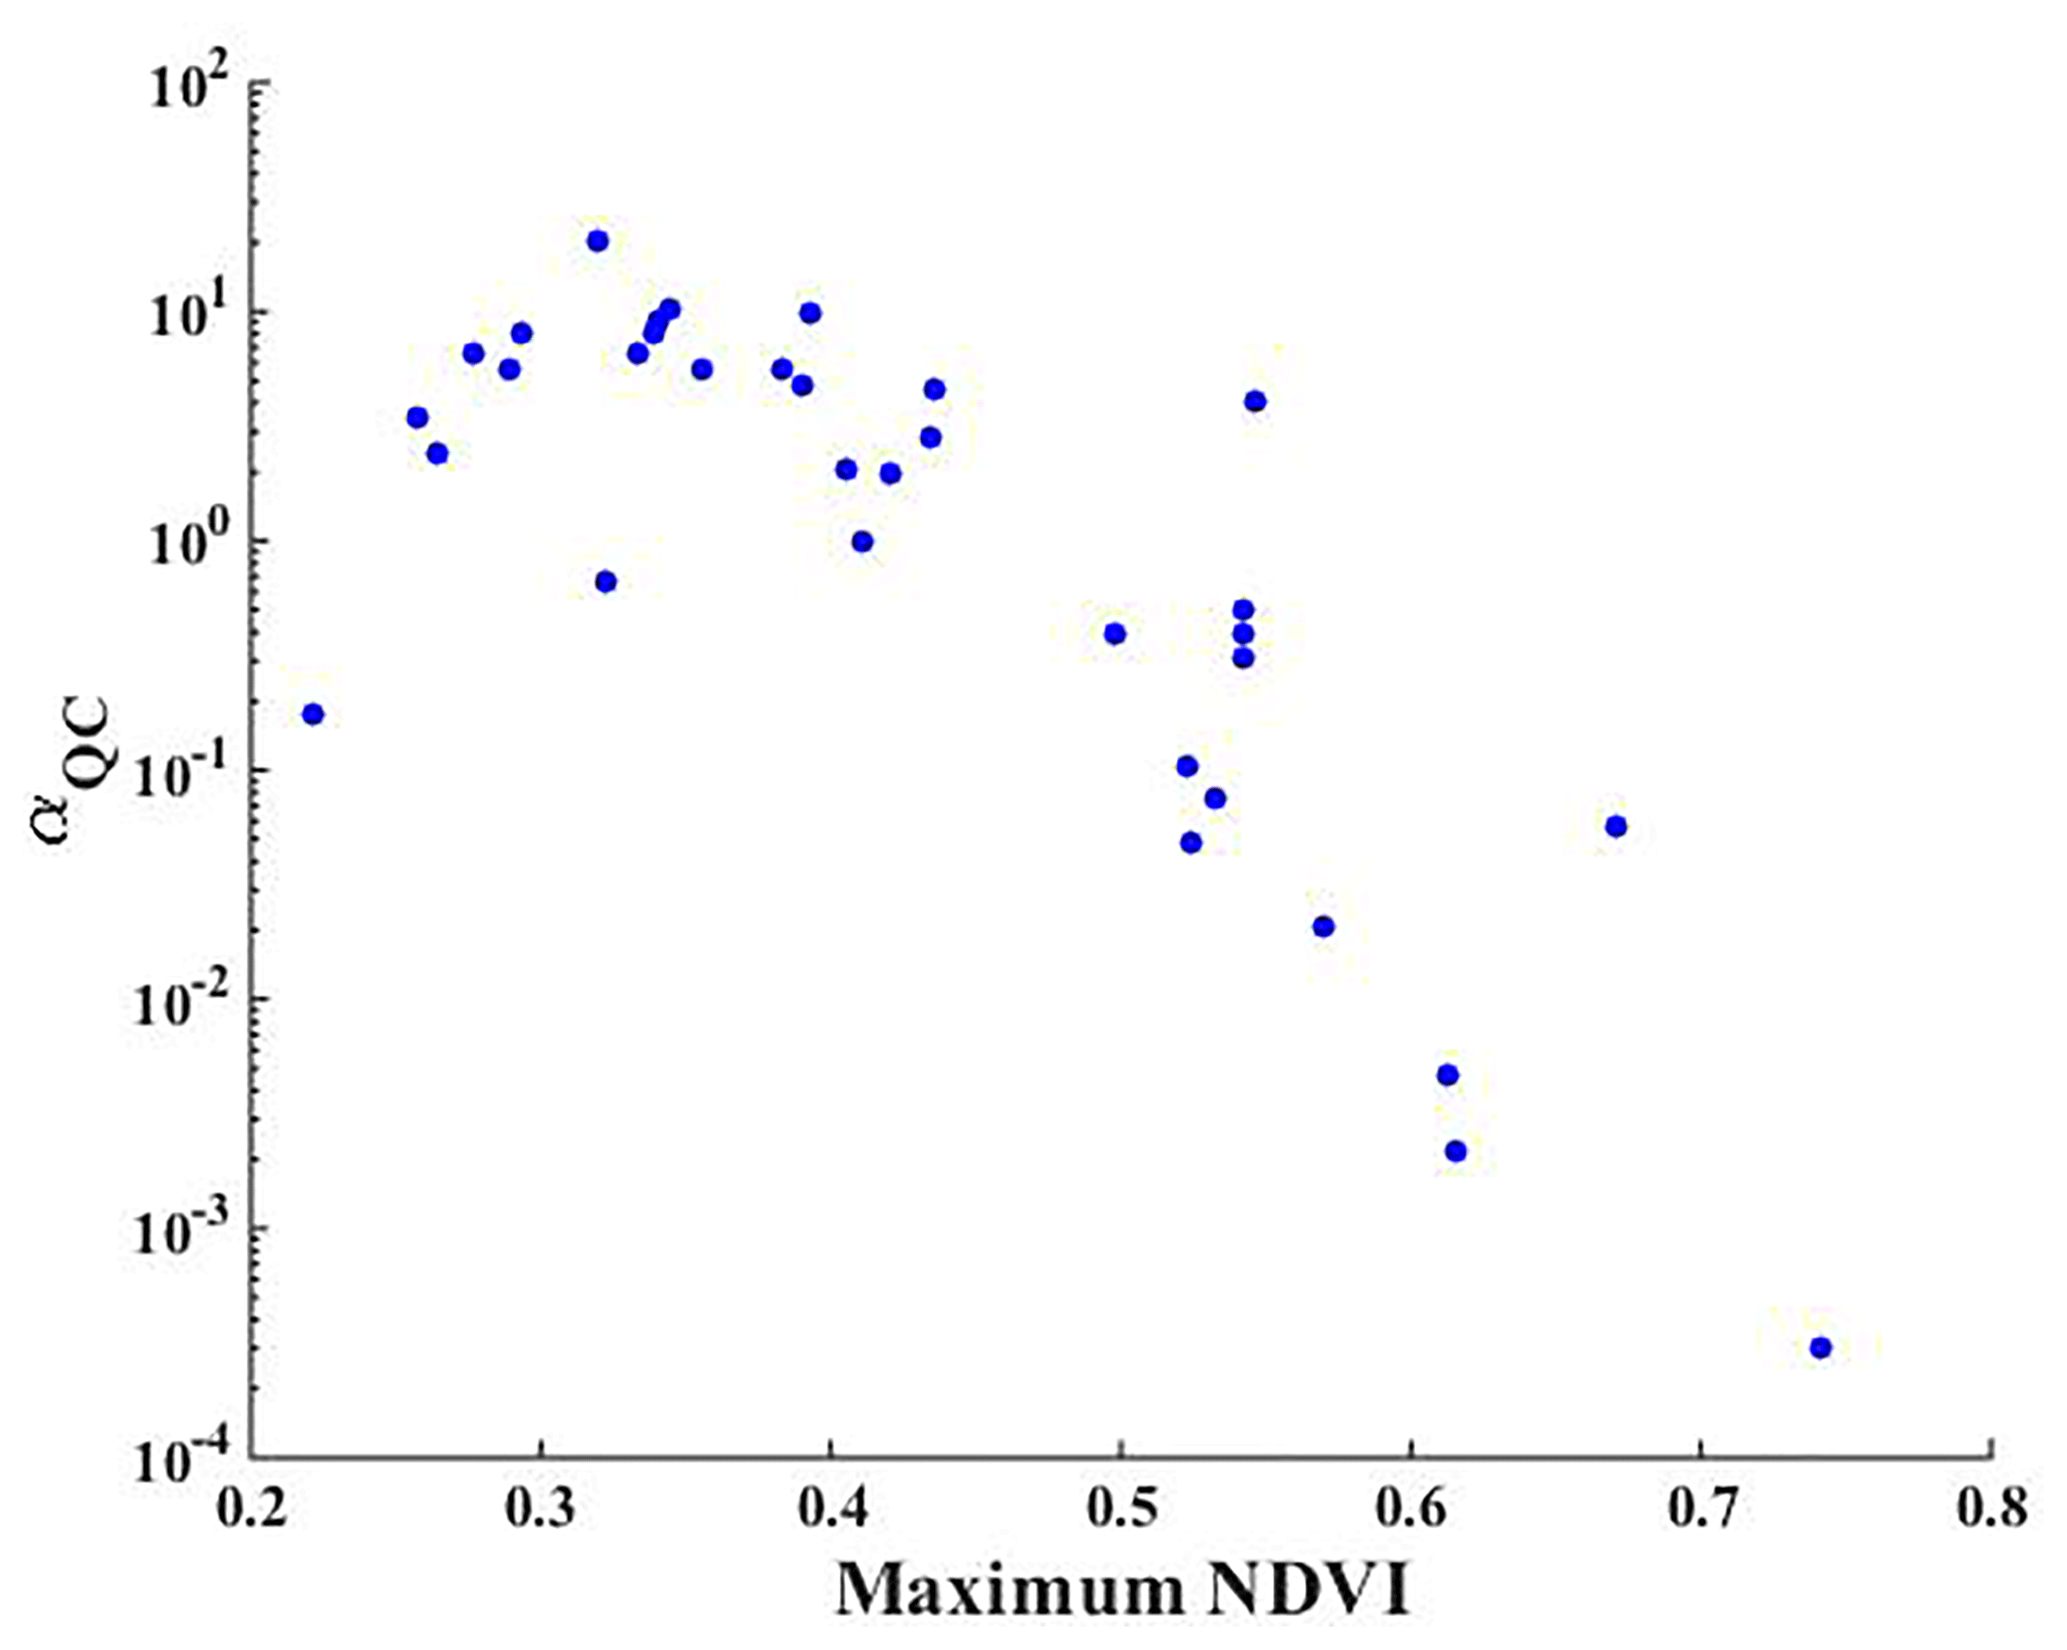
Figure 2Scatter plots between the maximum NDVI and slope in the Q–C regression at an annual scale (αQC) from the 44 study gauges.
For gauges with limited vegetation establishment in their drainage area, the variation in discharge is amplified in sediment transport (αQC>1). The larger the discharge is in a specific year, the more sediment is eroded and mobilized per cubic meter. This dominance of discharge is weakened when vegetation density and coverage increase. Despite the larger sediment carrying capacity of larger discharge, sediment concentration is reduced, probably due to the protection vegetation offers against erosion. As maximum NDVI increases, sediment concentration becomes less and less coupled with discharge at an annual scale. When the vegetation density is sufficiently high, sediment concentration is nearly stable in spite of the variation in discharge, since the dense vegetation coverage protects soil from erosion and traps sediment. That is, the emergent stationarity in sediment concentration corresponding to the variation in discharge at gauges with large Qm can be attributed to the dampened dominance of discharge due to the increasing impact of vegetation retardation.

Figure 3Scatter plot of annual mean concentration and maximum NDVI: (a) at 44 study gauges between 1982 and 1986, where the dots are color-coded by the slope in the Q–C regression (αQC) at each gauge; and (b) at seven gauges with both data from the years 1982 to 1986 (blue dots) and the years 2008 to 2012 (red dots). The R2 for the two fits is 0.6 and 0.44 respectively with a p value <0.001 for both of them.
To further confirm the vegetation impact on sediment transport, we derived the plot between maximum NDVI and mean concentration at an annual scale in Fig. 3a. As we can see, the annual mean sediment concentration follows a bell-shaped correlation with vegetation establishment, with a peak concentration at a value of maximum NDVI of around 0.36. On the falling limb of this bell curve, as NDVI increases, both sediment concentration and αQC decrease consistently. That is, both the value of concentration and its sensitivity to streamflow variation decline with increasing vegetation index on the falling limb. To confirm this impact of vegetation resistance, we also examined the relationship between sediment concentration and other catchment characteristic like dominant soil type. No significant correlation was observed. Although there could still be other factors not considered here that contributed to the decline in sediment concentration, it is undoubted that vegetation is one of the most influential factors of sediment reduction and can be used as a good indicator of the soil erosion and sediment transport in the YRB.
On the rising limb, however, both the value of concentration and its sensitivity to streamflow variation increase with increasing vegetation index. Most gauges have values αQC larger than 1, except one gauge with an extremely small maximum value of NDVI. For these gauges, on the rising limb, vegetal cover is still low in an absolute sense despite increasing NDVI. Sediment concentration is mainly dominated by discharge: fluctuations in streamflow are amplified in concentration (αQC>1). The only gauge with a value of αQC smaller than 1 is gauge Hanjiamao (HJM) at the Wuding River. Although the annual precipitation and discharge at HJM is similar to other gauges along the Wuding River, the annual mean sediment concentration is much smaller. This is because of the extremely high baseflow contribution in discharge at HJM, which is around 90 %, thanks to very intensive check-dam construction there (Dong and Chang, 2014). Since sediment in the YRB is mostly transported during large flow events during the summer, smaller flow events are not capable of transporting significant sediment loads at HJM.
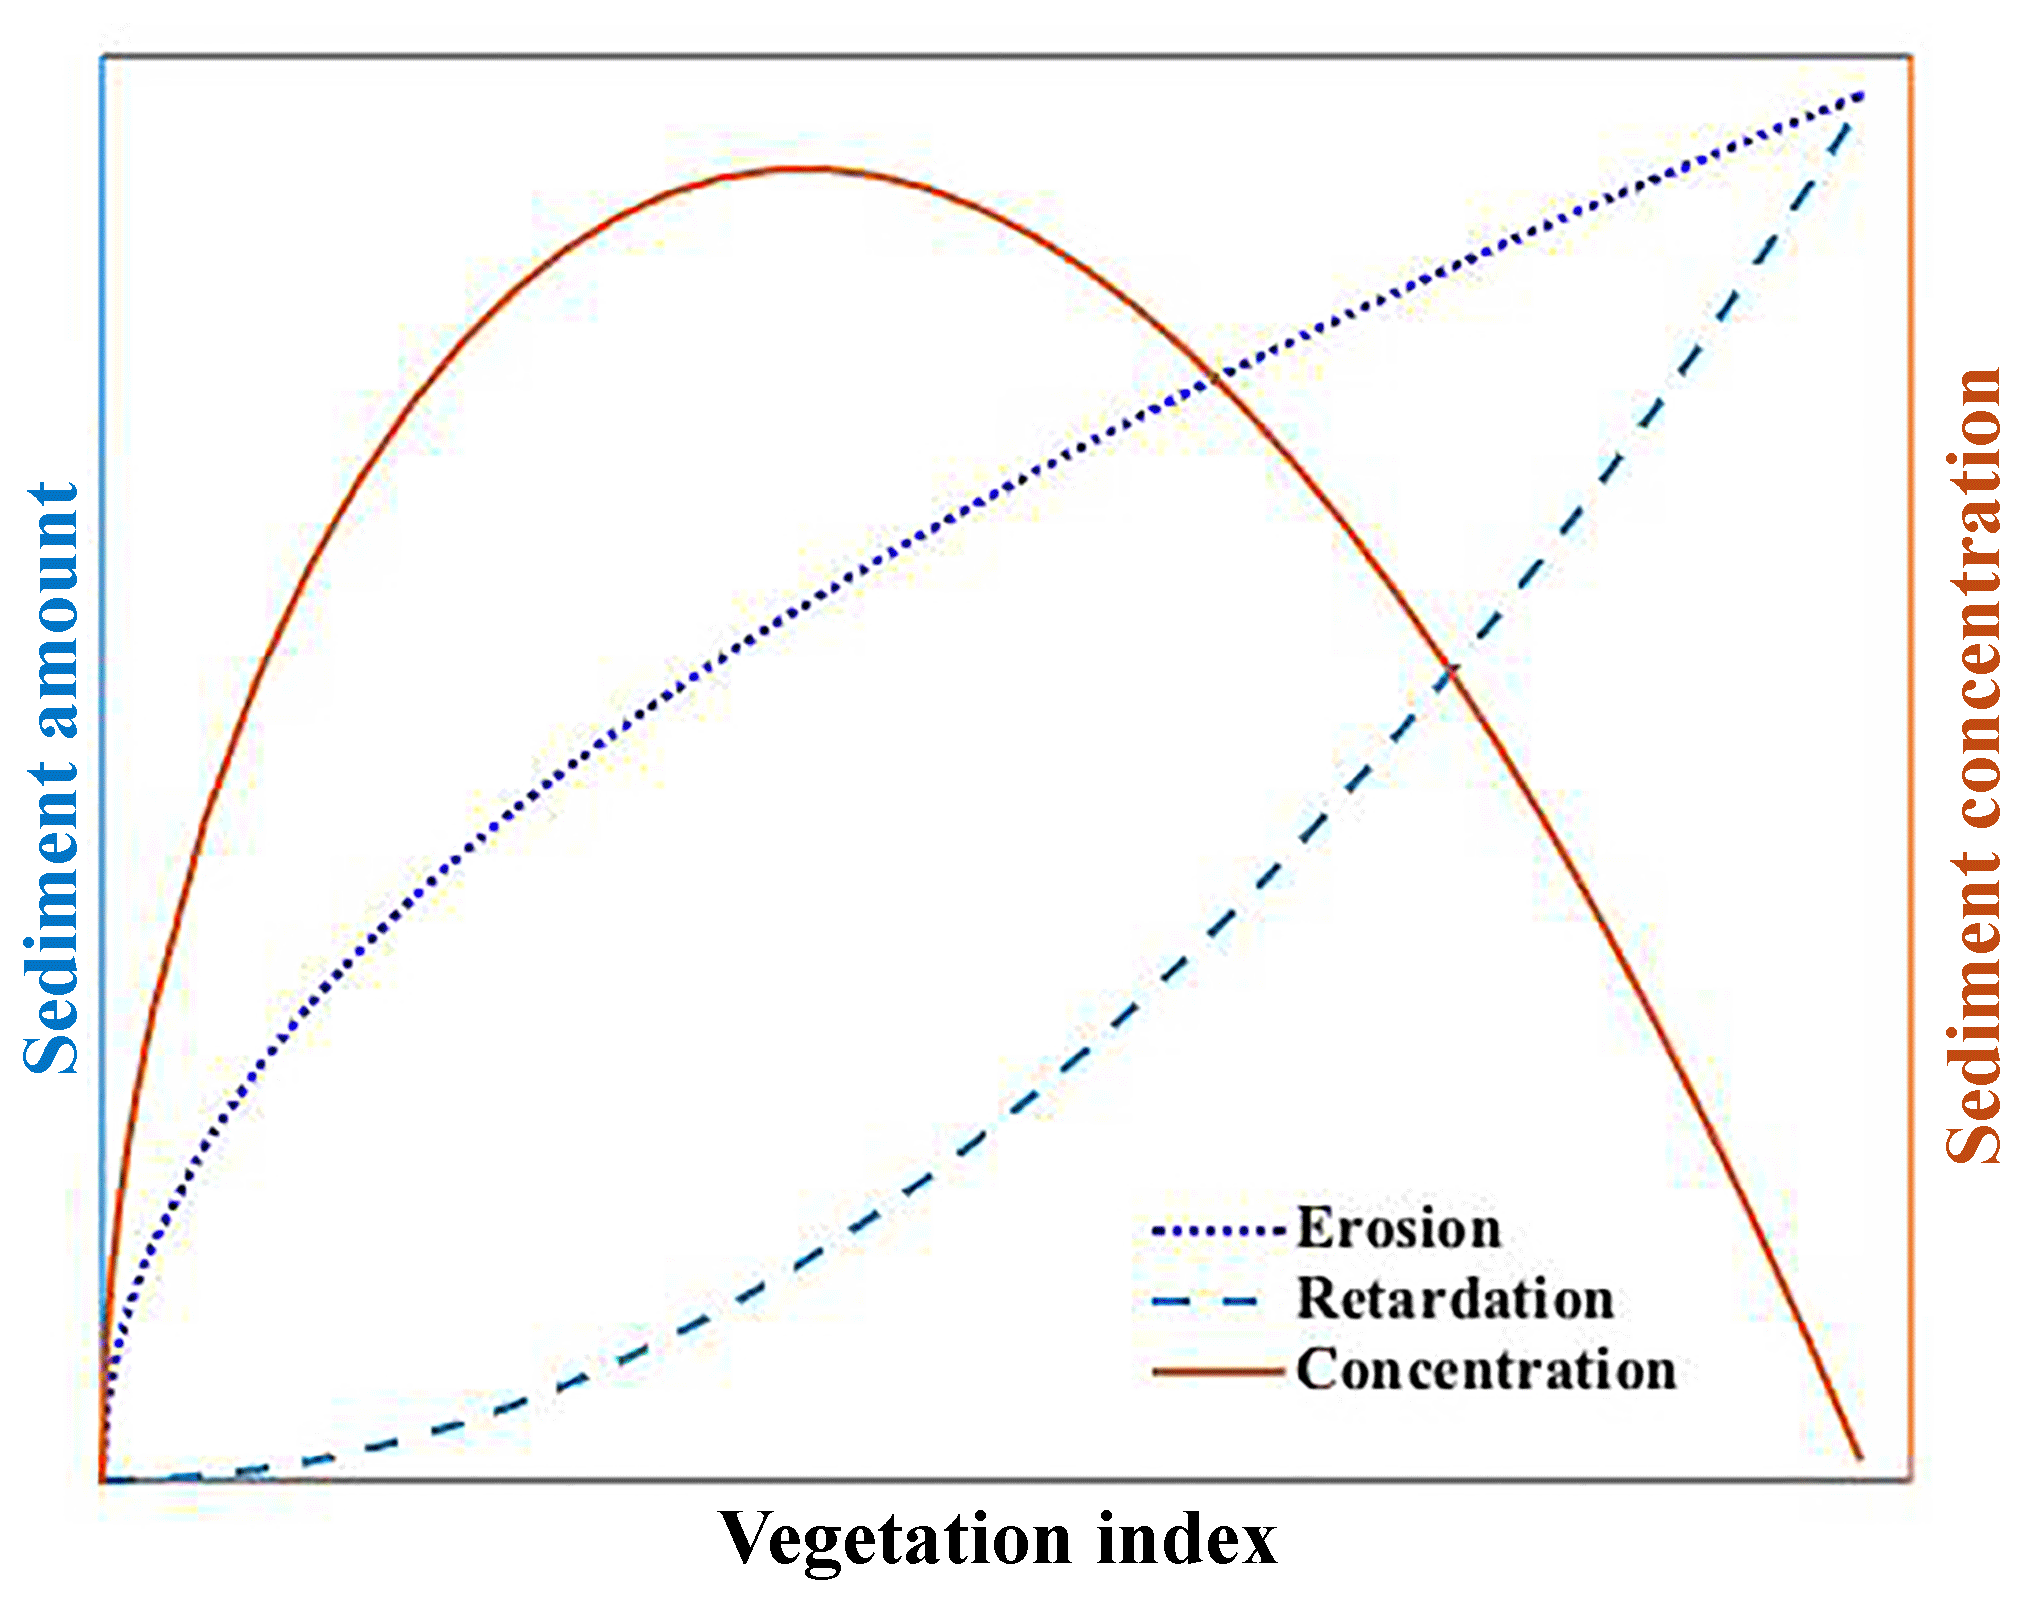
Figure 4Illustration of the correlation between vegetation and sediment erosion, retardation, and the resulting sediment concentration in the YRB. Since vegetation usually increases with discharge, with the rise in discharge, sediment eroded and delivered by streamflow increases rapidly, while the retardation from vegetation is limited at the beginning and increases fast afterwards. This non-synchronous impact on sediment transport leads to the bell shape correlation between sediment concentration and vegetation.
In general, we can conclude that sediment transport is mainly dominated by discharge when the vegetation index is low. With increasing NDVI, the impact of vegetation grows slowly at first and accelerates after the maximum NDVI exceeds 0.36. Eventually, the effect of NDVI takes over the dominance of streamflow and attenuates the variation in sediment concentration (Fig. 4). The nonlinear impact of vegetation in regard to resistance of sediment to erosion is consistent with previous findings (Rogers and Schumm, 1991; Collins et al., 2004; Temmerman et al., 2005; Corenblit et al., 2009). When the vegetation index level is low, its resistance to soil erosion develops slowly as vegetation grows and expands (Rogers and Schumm, 1991), and the capability of vegetation to trap sediment is reduced when submerged by flood (Temmerman et al., 2005) or overland flow. Therefore, for catchments with limited vegetation establishment, the coverage of vegetation is not sufficient to trap sediment, nor is the vegetation able to protrude from the water level during the extreme flow events that transport most of the sediment. Sediment transport in these catchments is usually dominated by discharge. As NDVI increases, vegetation becomes much more capable as an agent of erosion protection and sediment settling (Jordanova and James, 2003; Corenblit et al., 2009). With the compensation from vegetation retardation, sediment and discharge become more and more decoupled as discharge increases, so concentration is nearly invariant to increasing discharge. The transition point in maximum NDVI (around 0.36) is where the increment in vegetation reduction balances with the incremental increase in water erosion. When the capability of vegetation retardation catches up with streamflow erosion, the net soil loss becomes negligible, a condition commonly observed in well-vegetated regions.
In 1999, a large-scale ecosystem restoration project, the Grain-for-Green project, was launched in the YRB for soil conservation (Lv et al., 2012). It has substantially improved vegetation coverage after a decade of implementation (Sun et al., 2015). To validate our hypothesis gain from the early 1980s, we applied a similar analysis to the annual flow and sediment data as well as daily NDVI data at seven gauges located at the outlets of major tributaries from 2008 to 2012 (Fig. S1 green stars). This is the period subsequent to the initiation of the Grain-for-Green project. We have excluded the years right after the implementation of the Grain-for-Green project, when there was an initial drastic change in vegetation coverage and sediment erosion and transport processes.
As we can see from Fig. 3b, there is a significant increase in maximum NDVI for all seven catchments and considerable reduction in mean sediment concentration. This improvement is consistent with the previous report that the Grain-for-Green project has made a remarkable achievement in regard to soil conservation in the YRB (Chen et al., 2015). Comparison of the relationship between sediment concentration and maximum NDVI in the early 1980s and around 2010 shows that the bell shape relationship is sustained even after drastic and significant anthropogenic alteration of the land use and land cover across the whole YRB. Although the vegetation coverage has improved significantly at all seven comparison gauges due to the ecosystem restoration policy, and therefore effectively moderated sediment erosion, the bell shape relationship between maximum NDVI and mean concentration is sustained.
Similar bell shape relationship was also found for the multi-year mean annual precipitation and sediment yield observed in the United States (Langbein and Schumm, 1958). The data used in the analysis of Langbein and Schumm (1958) were collected in the 1950s from more humid and vegetated catchments with limited human intervention, opposite to the YRB where the climate is arid and semi-arid, vegetation coverage is low, and human activities are intensive. However, a similar bell shape was still observed between sediment yield and precipitation. Given the limited anthropogenic activities in these catchments, vegetation growth is probably correlated with annual precipitation due to its adaption to climate, as in other US catchments (Fig. S6). Thus it is likely that a bell shape correlation between vegetation and sediment yield would be found at these US catchments as well. This suggests that the bell shape correlation between vegetation and sediment concentration is not only observed in the YRB with intensive human intervention, but could also be valid outside it. More analyses are needed to test this relationship in other catchments outside the YRB for its universality.
Our analysis shows that across the YRB both the correlation between Q and C and the magnitude of sediment response to the variation in streamflow decrease with Qm. When Qm is sufficiently large (i.e., >60 mm yr−1), sediment concentration reaches a stationary (constant) state at an annual scale. The emergent stationarity at gauges with large Qm is related to the shift of dominance from discharge to vegetation. Because of the slow development of vegetation resistance with increasing discharge for small discharges, discharge dominates the soil erosion and sediment transport process until the maximum NDVI exceeds a threshold (0.36 for this study) at which the parameter governing concentration transits from streamflow erosion to vegetation retardation.
Our findings of the emergent stationarity in sediment concentration and the shift of the dominant mechanism governing the Q–C relation have important implications for water and sediment management at the watershed scale. Our study indicates that, for the gauges with relatively large discharge, the annual mean concentration can be approximated as a constant over a large range of discharges. Thus the estimation of sediment yield can be simply inferred from a simulation of streamflow. First-order estimates of sediment yield for scientific or engineering purposes can be obtained by multiplying the estimated discharge by a constant sediment concentration estimated based upon the vegetation index. The correlation between vegetation and sediment concentration will also be useful for the design of the ongoing ecosystem restoration program known as the Grain-for-Green project. The bell-shaped correlation between maximum NDVI and sediment concentration provides a quantitative way to estimate the potential change in sediment concentration associated with proposed ecosystem restoration planning schemes at and near each tributary. This can help guide land use management so as to allocate the sediment contribution from each of the upstream tributaries in a way that maintains the balance between erosion and deposition in the lower YR.
It is important to collect more data from the current decade (i.e., after the substantial ecosystem restoration) to further validate our findings in regard to emergent stationarity and vegetation impact at more gauges in the YRB. It will be helpful if we could examine our findings in other watersheds worldwide with different climate and vegetation types. Although humid regions are usually considered to be well vegetated, studies show that there could still be erosion issues in these areas due to topographic gradient, precipitation intensity, and soil properties. (Holz et al., 2015). Analysis with more field measurements could also help explain the threshold discharge of the emergent stationarity. Numerical simulations as well as long-term measurements on the soil properties are also needed to further explain the physical mechanism of vegetation retardation: how it develops its impact on soil erosion and sediment transport by changing soil properties and other topographic characteristics during its growth and spread.
All the data used in this study were downloaded from websites indicated in Sect. 2.
The supplement related to this article is available online at: https://doi.org/10.5194/hess-23-549-2019-supplement.
SY and QR conceived the idea; SY conducted the analysis; GP helped refine the work; XC, SZ, and SY collected and processed the data; all authors contributed to the writing.
The authors declare that they have no conflict of interest.
This research was financially supported by the National Key Research and
Development Program of China (2016YFC0402404, 2016YFC0402406) and the
National Natural Science Foundation of China (51509218, 51379184, 51679209).
The authors thank Jinren Ni for insightful discussions.
Edited by: Fuqiang Tian
Reviewed by: two anonymous referees
Chen, Y. P., Wang, K. B., Lin, Y. S., Shi, W. Y., Song, Y., and He, X. H.: Balancing green and grain trade, Nat. Geosci., 8, 739–741, 2015.
Collins, D. B. G., Bras, R. L., and Tucker, G. E.: Modeling the effects of vegetation-erosion coupling on landscape evolution, J. Geophys. Res., 109, 121–141, 2004.
Corenblit, D., Steiger, J., Gurnell, A. M., Tabacchi, E., and Roques, L.: Control of sediment dynamics by vegetation as a key function driving biogeomorphic succession within fluvial corridors, Earth Surf. Proc. Land., 34, 1790–1810, 2009.
Deasy, C., Baxendale, S. A., Heathwaite, A. L., Ridall, G., Hodgkinson, R., and Brazier, R. E.: Advancing understanding of runoff and sediment transfers in agricultural catchments through simultaneous observations across scales, Earth Surf. Proc. Land., 36, 1749–1760, 2011.
Dong, J. and Chang, L.: Analysis of runoff characteristic change and influence for Hailiutu River, J. Water Resour. Water Eng., 25, 143–147, 2014.
Fang, H. Y., Cai, Q. G., Chen, H., and Li, Q. Y.: Temporal changes in suspended sediment transport in a gullied loess basin: The lower Chabagou Creek on the Loess Plateau in China, Earth Surf. Proc. Land., 33, 1977–1992, 2008.
Gao, P., Nearing, M. A., and Commons, M.: Suspended sediment transport at the instantaneous and event time scales in semiarid watersheds of southeastern Arizona, USA, Water Resour. Res., 49, 6857–6870, 2013.
Grinsted, A., Moore, J. C., and Jevrejeva, S.: Application of the cross wavelet transform and wavelet coherence to geophysical time series, Nonlin. Processes Geophys., 11, 561–566, https://doi.org/10.5194/npg-11-561-2004, 2004.
Guan, K., Thompson, S. E., Harman, C. J., Basu, N. B., Rao, P. S. C., Sivapalan, M., Packman, A. I., and Kalita, P. K.: Spatiotemporal scaling of hydrological and agrochemical export dynamics in a tiledrained Midwestern watershed, Water Resour. Res., 47, 1290–1300, 2011.
He, Z., Weng, H., Ho, H., Ran, Q., and Mao, M.: Soil erosion and pollutant transport during rainfall-runoff processes, Water Resour., 41, 604–611, 2014.
Holz, D. J., Williard, K. W. J., Edwards, P. J., and Schoonover, J. E.: Soil erosion in humid regions: a review, J. Contemp. Water Res. Educ., 154, 48–59, 2015.
Jordanova, A. A. and James, C. S.: Experimental Study of Bed Load Transport through Emergent Vegetation, J. Hydraul. Eng., 129, 474–478, 2003.
Langbein,W. B. and Schumm, S. A.: Yield of sediment in relation to mean annual precipitation, Eos Trans. AGU, 39, 1076–1084, 1958.
Le Bissonnais, Y., Benkhadra, H., Chaplot, V., Fox, D., King, D., and Daroussin, J.: Crusting, runoff and sheet erosion on silty loamy soils at various scales and upscaling from m2 to small catchments, Soil Tillage Res., 46, 69–80, 1998.
Lv, Y., Fu, B., Feng, X., Zeng, Y., Liu, Y., Chang, R., Sun, G., and Wu, B.: A policy-driven large scale ecological restoration: quantifying ecosystem services changes in the Loess Plateau of China, PloS One, 7, e31782, https://doi.org/10.1371/journal.pone.0031782.g001, 2012.
Martin, J. M. and Meybeck, M.: Elemental mass-balance of material carried by major world rivers, Mar. Chem., 7, 173–206, 1979.
Miao, C. Y., Ni, J. R., Borthwick, A. G. L., and Yang, L.: A preliminary estimate of human and natural contributions to the changes in water discharge and sediment load in the Yellow River, Global Planet. Change, 76, 196–205, 2011.
Mutema, M., Chaplot, V., Jewitt, G., Chivenge, P., and Bloschl, G.: Annual water, sediment, nutrient, and organic carbon fluxes in river basins: A global meta-analysis as a function of scale, Water Resour. Res., 51, 8949–8972, 2015.
Ran, Q., Su, D., Li, P., and He, Z.: Experimental study of the impact of rainfall characteristics on runoff generation and soil erosion, J. Hydrol., 424–425, 99–111, 2012.
Rogers, R. D. and Schumm, S. A.: The effect of sparse vegetative cover on erosion and sediment yield, J. Hydrol., 123, 19–24, 1991.
Running, S. W., Heinsch, F. A., Zhao, M., Reeves, M., Hashimoto, H., and Nemani, R. R.: A continuous satellite-derived measure of global terrestrial primary production, Bioscience, 54, 547–560, https://doi.org/10.1641/0006-3568(2004)054[0547:ACSMOG]2.0.CO;2, 2004.
Rustomji, P., Zhang, X. P., Hairsine, P. B., Zhang, L., and Zhao, J.: River sediment load and concentration responses to changes in hydrology and catchment management in the Loess Plateau of China, Water Resour. Res., 44, 148–152, 2008.
Song, C., Wang, G., Sun, X., Chang, R., and Mao, T.: Control factors and scale analysis of annual river water, sediments and carbon transport in China, Sci. Rep.-UK, 6, 25963, https://doi.org/10.1038/srep25963, 2016.
Sun, W., Song, X., Mu, X., Gao, P., Wang, F., and Zhao, G.: Spatiotemporal vegetation cover variations associated with climate change and ecological restoration in the Loess Plateau, Agric. Forest Meteorol., 209–210, 87–99, 2015.
Syvitski, J. P. M., Vorosmarty, C. J., Kettner, A. J., and Green, P.: Impact of humans on the flux of terrestrial sediment to the global coastal ocean, Science, 308, 376–380, 2005.
Temmerman, S., Bouma, T. J., Govers, G., Wang, Z. B., De Vries, M. B., and Herman, P. M. J.: Impact of vegetation on flow routing and sedimentation patterns: Three-dimensional modeling for a tidal marsh, J. Geophys. Res., 110, 308–324, 2005.
Walling, D. E. and Fang, D.: Recent trends in the suspended sediment loads of the world's rivers, Global Planet. Change, 39, 111–126, 2003.
Wang, S., Fu, B., Piao, S., Lv, Y., Philippe, C., Feng, X., and Wang, Y.: Reduced sediment transport in the Yellow River due to anthropogenic changes, Nat. Geosci., 9, 38–41, 2016.
Ye, S., Li, H.-Y., Li, S., Leung, L. R., Demissie, Y., Ran, Q., and Blöschl, G.: Vegetation regulation on streamflow intra-annual variability through adaption to climate variations, Geophys. Res. Lett., 42, 10307–10315, https://doi.org/10.1002/2015GL066396, 2015.
Zheng, M. G., Qin, F., Sun, L. Y., Qi, D. L., and Cai, Q. G.: Spatial scale effects on sediment concentration in runoff during flood events for hilly areas of the Loess Plateau, China, Earth Surf. Proc. Land., 36, 1499–1509, 2011.
Zheng, M. G., Qin, F., Yang, J. S., and Cai, Q. G.: The spatio-temporal invariability of sediment concentration and the flow–sediment relationship for hilly areas of the Chinese Loess Plateau, Catena, 109, 164–176, 2013.
- Abstract
- Introduction
- Data and methodology
- The emergent stationarity in sediment concentration
- The vegetation impact: a bell shape
- Validation of the bell shape across time and space
- Implications and conclusion
- Data availability
- Author contributions
- Competing interests
- Acknowledgements
- References
- Supplement