the Creative Commons Attribution 4.0 License.
the Creative Commons Attribution 4.0 License.
 | 19 Nov 2019
Reliable reference for the methane concentrations in Lake Kivu at the beginning of industrial exploitation
Bertram Boehrer
Wolf von Tümpling
Ange Mugisha
Christophe Rogemont
Augusta Umutoni
Dissolved methane in Lake Kivu (East Africa) represents a precious energy deposit for the neighbouring countries, but the high gas loads have also been perceived as a threat by the local population. This is especially the case with respect to potential changes to the lake's stratification during planned industrial exploitation. Both of the above-mentioned issues require accurate and reliable measurements of dissolved gases and temporal changes to take responsible action. Previous data were unable to satisfactorily fulfil these requirements. Prior to our measurements, there was considerable disagreement about prognosticated new formation of methane. We show how measurement accuracy could be significantly improved by implementing equipment that is especially designed and modified for the complex gas conditions in Lake Kivu. Samples were taken from depths of 150 to 430 m to more reliably and more accurately determine the amount of dissolved methane and dissolved carbon dioxide. Beyond the provision of gas concentration profiles at the beginning of exploitation, this investigation can also potentially provide methods to survey the further evolution of gases over time. The use of gas-tight sampling bags produced highly reliable and accurate measurements. Our measurements confirmed the huge amount of stored methane, but clearly did not support the current belief of a significant recharge beyond diffusive loss. Direct measurements with a custom-made gas pressure sensor indicated no imminent danger due to limnic eruptions. However, a further survey of gas pressures is mandatory to detect changing conditions. Using sampling bags and a gas pressure sensor, we introduced reliable and highly accurate measurement approaches for the survey of the further development of gas concentrations. This equipment requires little effort with respect to calibration, which makes it suitable for use in the remote areas of Africa.
- Article
(3375 KB) - Full-text XML
-
Supplement
(1107 KB) - BibTeX
- EndNote


Lake Kivu, located on the border between Rwanda and the Democratic Republic of the Congo in Central and East Africa, contains large amounts of dissolved methane (CH4) in its permanently stratified deep water (Tietze, 1978; Tietze et al., 1980; Schmid et al., 2005). Hence, it represents an important resource for the neighbouring countries, especially Rwanda, which currently has no access to any other hydrocarbon deposit in its territory. The commercial-scale exploitation of this resource was started on 31 December 2015 with the commencement of the KivuWatt power plant operation Phase 1 with an installed capacity of 26 MW. Further power plants are planned on both sides of the border. For responsible handling, observation and the survey of the management prescription, a reliable reference of gas content and the development of suitable measurement equipment for documenting its temporal evolution are mandatory.
In addition to methane, large amounts of carbon dioxide are dissolved in the deep water. Together, these gases potentially pose a risk to the local population, as spontaneous degassing could be feared; this occurs when large amounts of gas are released from such lakes with catastrophic consequences for the local population, such as the spontaneous degassing events at Lake Monoun in 1984 (Sigurdson et al., 1987) and Lake Nyos in 1986 (Kling et al., 1987; Kusakabe, 2015). Previous measurements have indicated rising gas concentrations in Lake Kivu and, hence, an increasing risk over timescales of few decades (Schmid et al., 2005). To avoid any endangerment of the population and to avoid damage to the lake ecology, a management prescription regarding withdrawal depth and deposition of partially degassed deep water and wash water needed to be developed.
A number of measurement campaigns have been carried out, dating back as far as 1935, that have aimed at quantifying the methane deposit in Lake Kivu (Damas, 1937; Schmitz and Kufferath, 1955; Degens et al., 1971, 1973; Tuttle et al., 1990). Samples were either locked in containers and recovered to the surface or hoses were used to bring deep water in a continuous flow to the surface. All of these measurement campaigns, even the more recent measurement trials, struggled with the loss of gas and water while recovering samples (Tassi et al., 2009; Pasche et al., 2011). So far, only one published measurement series used in situ sensors (Schmid et al., 2005).
Currently, the gas content of Lake Kivu is mainly based on the gas concentrations measured in November 2003 by the team led by Michel Halbwachs (published in Schmid et al., 2005). The temporal evolution, i.e. a possible recharge, has been quantified from the difference to measurements by Klaus Tietze in 1974/1975: Schmid et al. (2005) concluded that CH4 concentrations increased by up to 15 % within 3 decades, potentially leading to the increased risk of a gas eruption. According to this prognostication, action to release the gas pressure would have been required to avoid the endangerment of the local population. However, based on a more detailed analysis of the carbon budget of the lake, Pasche et al. (2011) concluded that the concentrations were most likely not increasing as quickly as previously predicted.
In conclusion, the data availability was not sufficient to allow responsible measures to be taken with respect to the exploitation of the gas resource and the risk assessment during exploitation. Hence, the Rwandan government took action and invited specialist teams to implement their measurement approaches in Lake Kivu in order to obtain a data base reliable enough to support political decisions (e.g. Wüest et al., 2012). Thus, various approaches were modified for the special conditions in Lake Kivu, each requiring considerable effort to meet expectations (Schmid et al., 2019). In this paper, we present gas measurements from waters that were collected in sampling bags as well as an analysis of the gas composition by gas chromatography. An intercomparison with competing approaches (Schmid et al., 2019; Grilli et al., 2014, 2018; Bärenbold et al., 2019) will be published separately, and the complex conversion between gas pressures and gas concentrations will also be included in this future publication.
For the special case of Lake Kivu, we felt that a reliable measuring method must be implemented that is able to be used by the local scientific staff to document changes in the gas charge at a later time. Only measurement techniques that required little calibration which could be reliably carried out at a remote location, such as Lake Kivu, were deemed appropriate. The approach should also be comprehensible and avoid any hidden errors. In conclusion, we modified the sampling method from the gas-charged mining lake of Vollert-Sued (Horn et al., 2017) and the Guadiana pit lake (Sánchez-Espana et al., 2014; Boehrer et al., 2016) for the conditions in Lake Kivu. In addition to methane and carbon dioxide concentration, we also included measurements of dissolved solids in this paper. Finally, we measured the total dissolved gas pressure (TDGP) using a customized sensor (for details see Sect. 2.4), as the TDGP is the appropriate measurement for judging the proximity to spontaneous ebullition.
2.1 Lake Kivu
The measurement campaign took place from 9 to 13 March 2018 near Gisenyi and Rubavu on the northern shore of Lake Kivu in Rwanda. Sampling was mainly accomplished from a convenient sampling platform (“GIS” in Fig. 1) at 1.74087∘ S, 29.22602∘ E about 5 km from Gisenyi at a maximum depth of 410 m, while the deepest sample was taken close to the border of the Democratic Republic of the Congo near the deepest location (“DEEP” on Fig. 1) on Rwandan territory 1.79865∘ S, 29.17172∘ E (at a maximum water depth of 450 m) to extend the sampling range as deep as possible. The horizontal distance between the sites and the different sampling dates were not expected to influence comparability, as horizontal transport was much faster than vertical transport and gas production or consumption, as indicated by Schmid and Wüest (2012) and Ross et al. (2015). Therefore, it was reasonable to assume horizontal and temporal steady state for the duration of the campaign. In addition, a few samples from an earlier campaign in 2017 were included in this paper.
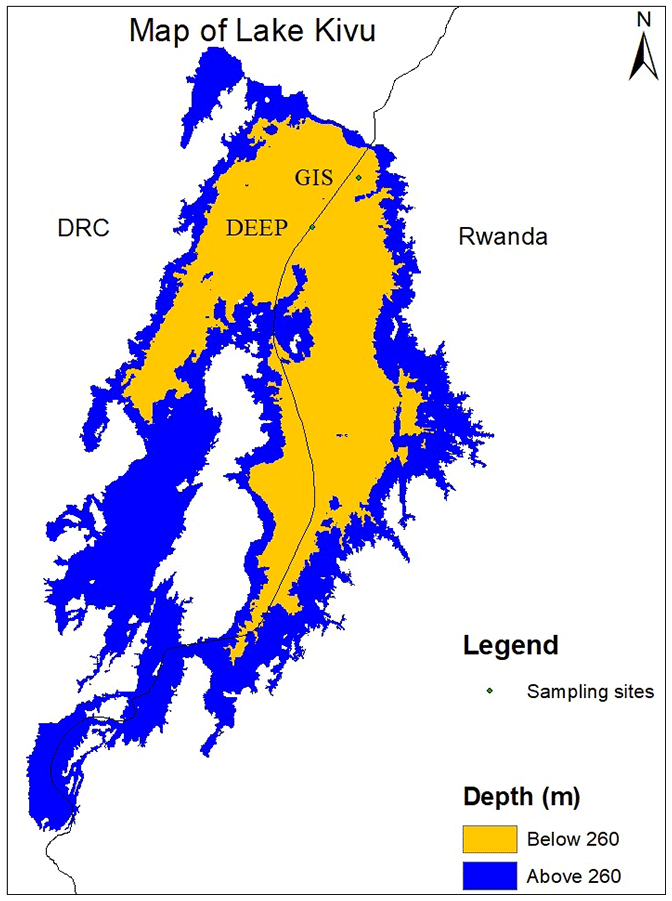
Figure 1Lake Kivu map showing the sampling sites (GIS and DEEP) and the area of the resource zone (below 260 m); morphometric data are based on Ross et al. (2015).
2.2 Multiparameter profiles
Vertical profiles of temperature, electrical conductivity, oxygen concentration, pH and turbidity were measured at the platform and the deep location using a multiparameter probe CTM1143 (Sea and Sun Technology, Germany). Sensor properties and description can be found on https://www.sea-sun-tech.com/ (last access: 15 October 2019).
Here and in all following methods, the pressure (bar) was converted to depth (m) by dividing by 0.0978 bar m−1. Temperature compensation of electrical conductivity to 25 ∘C was carried out using the following equation:
In 2018, the oxygen zero point was slightly off calibration (by +0.37 mg L−1), which was corrected after sampling.
2.3 Water sampling for gas analysis
For gas measurements, gas-tight sampling bags (TECOBAG; see Horn et al., 2017) were lowered to the investigation depths and partially filled with water by operating a pump for a short period. Enough remaining bag capacity was retained to accommodate the total amount of gas when bags were recovered and, thus, pressure was reduced to atmospheric level. Unlike previous implementations of this technique in the lake of Vollert-Sued, Germany (Horn et al., 2017), and Guadiana pit lake, Spain (Boehrer et al., 2016), the pumps were switched on and off by a submersible controller (see Fig. 2). For all sampling events, a CTD probe (Sea and Sun Technology; CTM102) accompanied the sampling equipment for an accurate sampling depth determination. After filling, sampling bags were transported to the Lake Kivu Management Program (LKMP) laboratory and left there over night to equilibrate the gases between the gas and liquid phases.

Figure 2Gas sampling device as used in Lake Kivu with pump controller, submersible pump and protective housing for the sampling bag; a small CTD probe “CTM102” was connected to record depth, electrical conductivity and temperature and started synchronously with the pump controller using a starter plug.
The volume of water was measured by weighing the bags on the laboratory weight scale of the LKMP (subtracting the weight of bags) and dividing by density (e.g. Moreira et al., 2016). The volume of the gas space was then measured by withdrawal through syringes from the bags. Part of the gas withdrawn from the sampling bags was introduced into a gas chromatograph (GC, Perkin-Elmer Clarus 580) in the LKMP laboratory to detect the gas composition quantitatively. Calibration was performed with dry gas standards with compositions of 20 % N2, 40 % CH4 and 40 % CO2 at an accuracy of 0.7 % or better. In all samples, the sum of all detected gases amounted to around 97 %. The remaining undetected 3 % corresponded very well with the expected moisture at laboratory temperatures and was therefore attributed to water vapour. The measured concentrations of CH4 and CO2 were multiplied by the gas volume to yield the amount in the gas space. To determine the entire amount of CH4 in the sample, the residual portions dissolved in the water were calculated assuming equilibrium between the water and gas phase at temperature T and the measured air pressure in the laboratory of 857 mbar as well as a molar volume of gas of 24.465 L mol−1 at standard conditions of 1013.25 mbar and 25 ∘C. We used a Henry coefficient of (see Sander, 2015; in units of (mol L−1) atm−1; temperature as absolute temperature in Kelvin). As the gas volume was of the same order of magnitude as the water inside the bag, this contributed a few percent to the total amount of CH4.
Due to its high solubility, however, a considerable portion of CO2 remained in solution, and, thus, required a more accurate determination. This was carried out using the Henry coefficient for freshwater: (Sander, 2015; units as above). Only in the case of CO2, the dependence of the Henry coefficient on electrical conductivity (of a few percent in the considered range) was included in the calculation: based on electrical conductivity C25 at the sampling depth (see Fig. 2), the Henry coefficient was interpolated between freshwater (C25=0 mS cm−1; Bunsen coefficient of 0.7519) and seawater (C25=53 mS cm−1; Bunsen coefficient of 0.6406) by implementing the factor (given by Sander, 2015; Murray and Riley, 1971; see also Boehrer et al., 2016). In addition, the concentration of bicarbonate in the water phase was calculated based on pH measurements in the laboratory by inserting a sensor after the volume and GC measurements were completed. A dissociation constant of pK1=6.2 was used (Cai and Wang, 1998). Hence, we could evaluate the dissolved inorganic carbon (DIC) as the sum of three contributions: CO2 in gas space, CO2 dissolved in water and ; is practically not present at the given pH. CO2 concentrations in the lake were calculated by adding the CO2 gas volume in the sampling bag and the dissolved amount. The tiny contribution from bicarbonate shifting to dissolved CO2 could be quantified (relative contribution of 10−5) on the base of pH change from the field (multiparameter profiles) to the laboratory measurement. Hence, it could have been neglected without increasing the expected error.
The accuracy of the measurements was estimated from the following contributions: the accuracy of the volume measurement of gas was within 4 % (above 250 m it was within 6 % due to smaller volume) with a syringe; Henry coefficients for fresh water (and salt water) were known within 5 %; and temperature fluctuations in the laboratory allowed for additional error, but less than 5 %. Finally, we need to include an unknown variation of the Henry coefficient with Lake Kivu salts of less than 5 %. We added the single contributions as independent errors. This resulted in an 8 % error for the Henry coefficient. As less than half of the CO2 remained in solution, this contributed less than 4 % to the expected error. In the case of CH4, only a small fraction remained in solution, and the corresponding error contribution was less than 1 %. The error in the measurement of the mass (and volume) of the sample was smaller than 1 %. Altogether, we expected a measurement precision of 5 % for CH4 (7 % above a depth of 250 m) and 6 % for CO2 (8 % above a depth of 250 m). If required, the accuracy could be improved by implementing a better volume measurement of the gas. In the case of CO2, a more exact knowledge of the Henry coefficient would also help. Gas-tight sampling bags for CH4 and CO2 were a precondition, which was very well accomplished for the investigated gases in the bags used (see Horn et al., 2017). In conclusion, the sampling bags represented a simple approach, which required careful sampling and a good understanding of the solubility of gases for the processing of data. Results, however, were reliable as the approach did not provide much space for hidden errors.
2.4 Total gas pressure
For gas pressure measurements, we used a PRO-OCEANUS probe, which was especially customized for the application in Lake Kivu, as standard sensors for total dissolved gas pressure (TDGP) were not suited for the deployment depths and/or expected gas pressures in Lake Kivu. The pressure sensor contained a small gas measurement volume separated from the lake water by a membrane, which was permeable for dissolved gases such as CH4, CO2 and N2. The partial pressures of all gases in the measurement volume adjust to equilibrium with their concentrations in the water. If the total gas pressure inside the gas space equals the outside pressure (hydrostatic plus atmospheric pressure), a virtual gas bubble withstands the pressure at depth and persists long enough to start moving upwards through the water column via its own buoyancy. Hence, the ratio of the total pressure inside the measurement volume compared with the absolute pressure represents a quantification of the proximity of lake water to spontaneous ebullition (e.g. Schmid et al., 2004; Koschorreck et al., 2017).
Before deployment, the sensor needed to be immersed in water for several hours at a total pressure above the surrounding gas pressure. Thereafter, a response time of only few minutes was expected. Measurements were performed from the platform at discrete depths where the probe was left for about 20 to 30 min (Fig. 3). Data were recorded continuously, and from the time series at a depth of 286.1 m, a response time of less than 4 min (half-value time t1∕2 of 150 s) was determined by fitting an exponential curve to the observations. As the available time for measurements was limited and the recovery of the sensor also required time, measurements were carried out at seven discrete depths. The CTM1143 probe accompanied the TDGP sensor for an accurate depth reference.
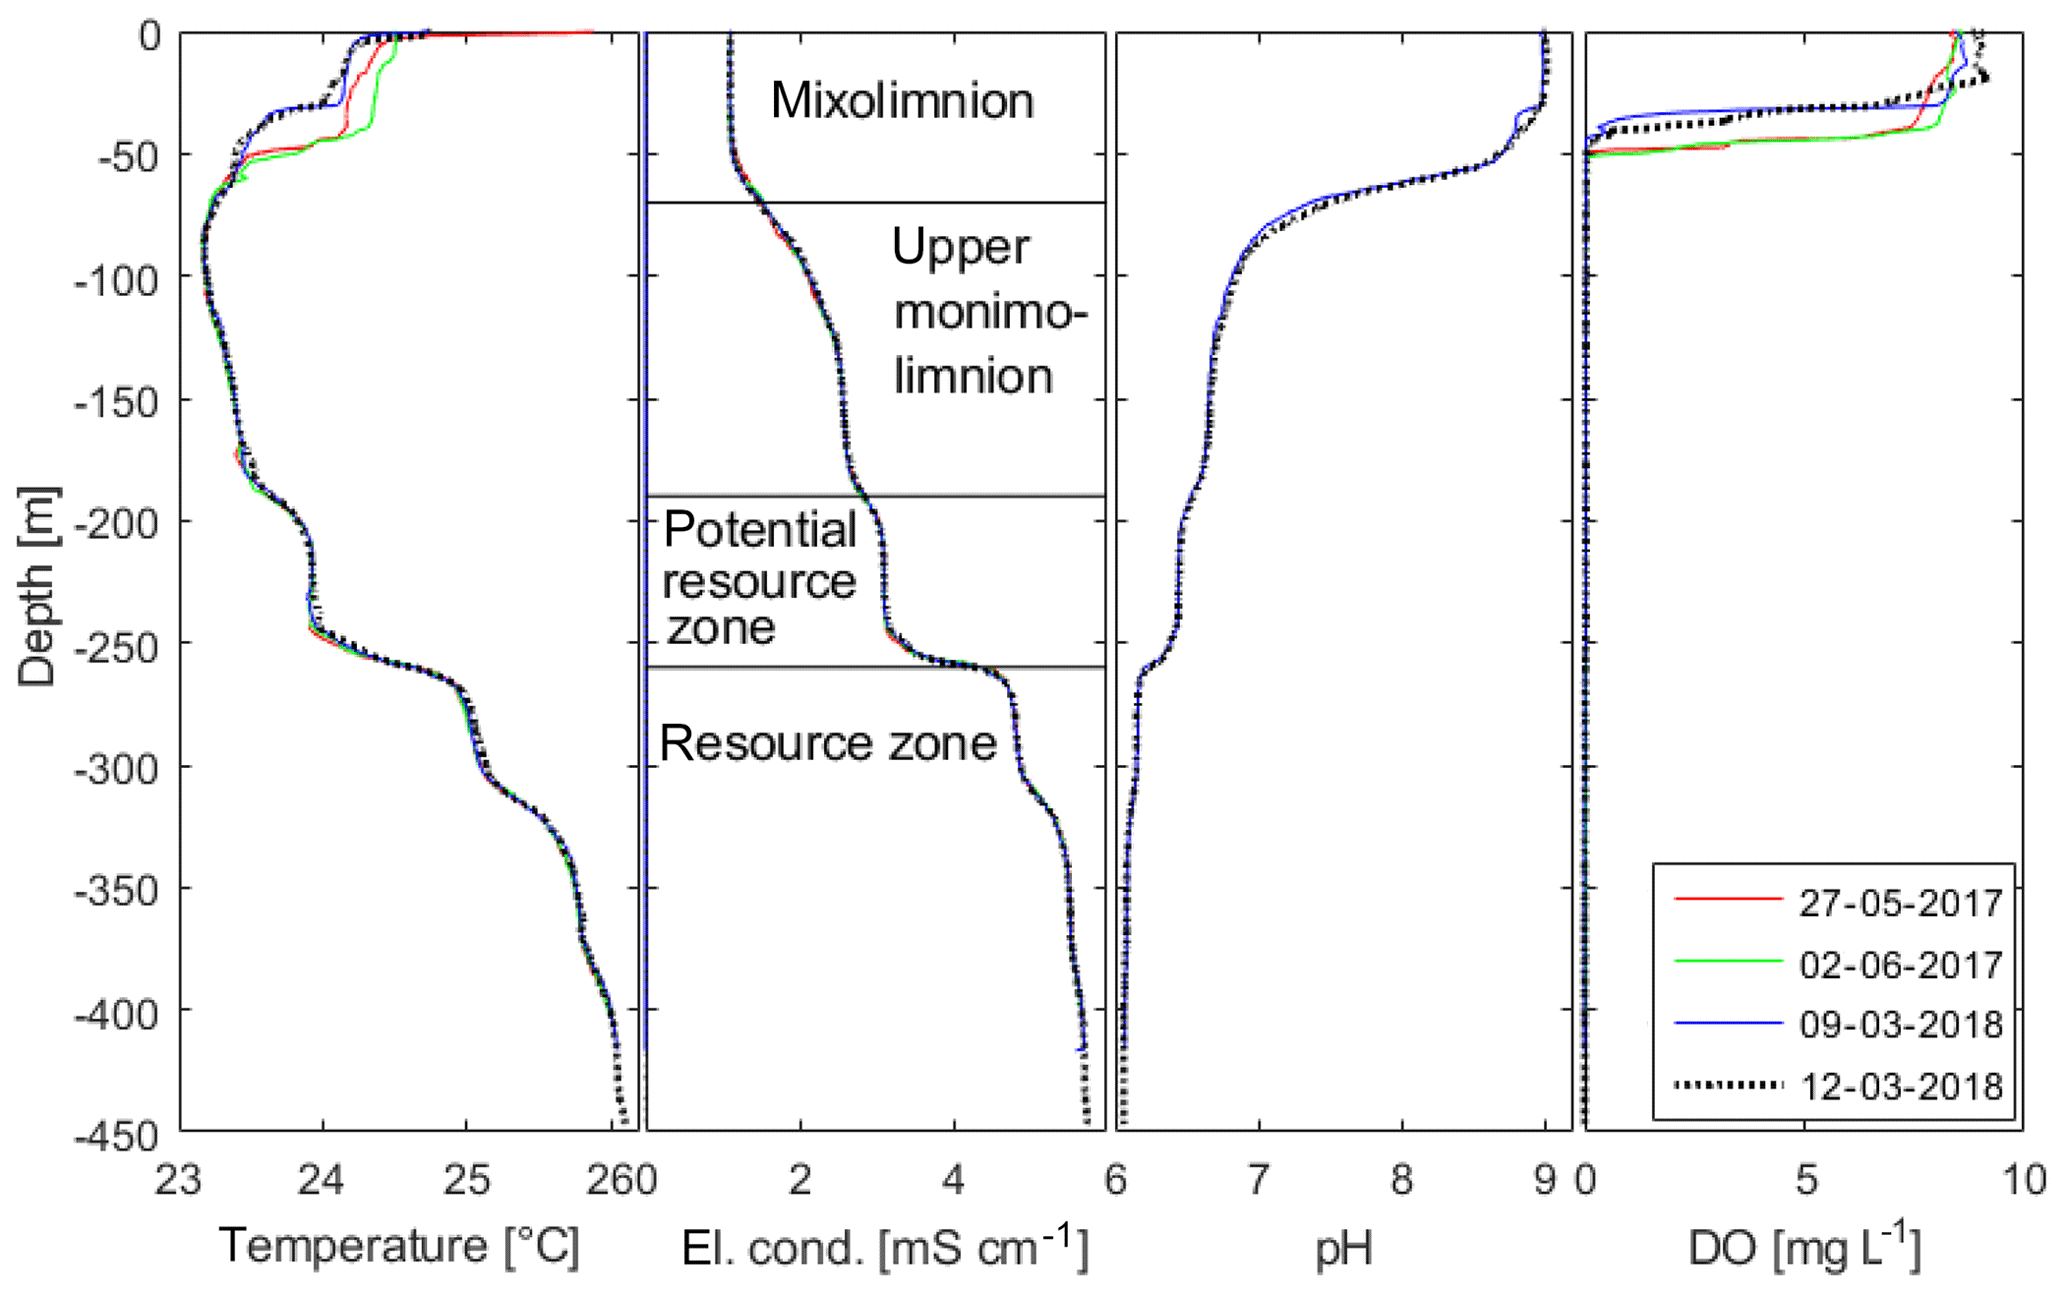
Figure 3Profiles of the in situ temperature, electrical conductivity (El. cond.; temperature compensated for 25 ∘C), pH (only 2018) and dissolved oxygen (DO) concentration of Lake Kivu water against depth. All profiles were measured with the same multiparameter probe (CTM1143, Sea and Sun Technology, Germany) from the “GIS” platform except for the profile on 13 March 2018, which was acquired close to the deepest location “DEEP” on Rwandan territory. The name convention for the separate layers in Lake Kivu is also included. Data available in the Supplement.
In order to compensate for the measured response time, the total gas pressure TDGP at time t was calculated from the measured pressures pmeas at the times t and :
TDGP approached the final value much faster than the original readings pmeas. The expected error of the measurement was estimated from calibration error (<0.5 % of actual measurement) plus 0.04 bar uncertainty from reading.
3.1 Multiparameter profiles
The profile on 13 March 2018 showed typical conditions for the wet season, where the surface layer of the lake (i.e. the top 60 m, which can undergo seasonal mixing during the dry season) is thermally stratified (Fig. 3). There was a steep oxycline with strongly decreasing oxygen concentrations between a depth of 25 and 40 m; below a depth of about 45 m, the water column was anoxic. Below a depth of 60 m in the monimolimnion of this meromictic lake (Boehrer and Schultze, 2008; Gulati et al., 2017; Boehrer et al., 2017), the profile showed the usual stepwise increase in temperature and conductivity and decrease in pH documented in earlier measurements.
In the deep water, the biggest gradient in temperature and electrical conductivity at 260 m represents the upper limit of the resource zone. Below, concentrations are high enough for industrial exploitation. pH values, which are crucial for DIC calculations, are nearly identical to values shown in the work by Schmid et al. (2005).
3.2 Methane and carbon dioxide
A total of 13 depths were sampled in March 2018. In addition, five samples from a previous field campaign on 27 May and 2 June 2017 were included in the analysis. The samples covered the depth range from 150 to 432 m. Sampling was controlled by rope length, while sampling depths were acquired from the measurements of a small CTD accompanying the sampling bags.
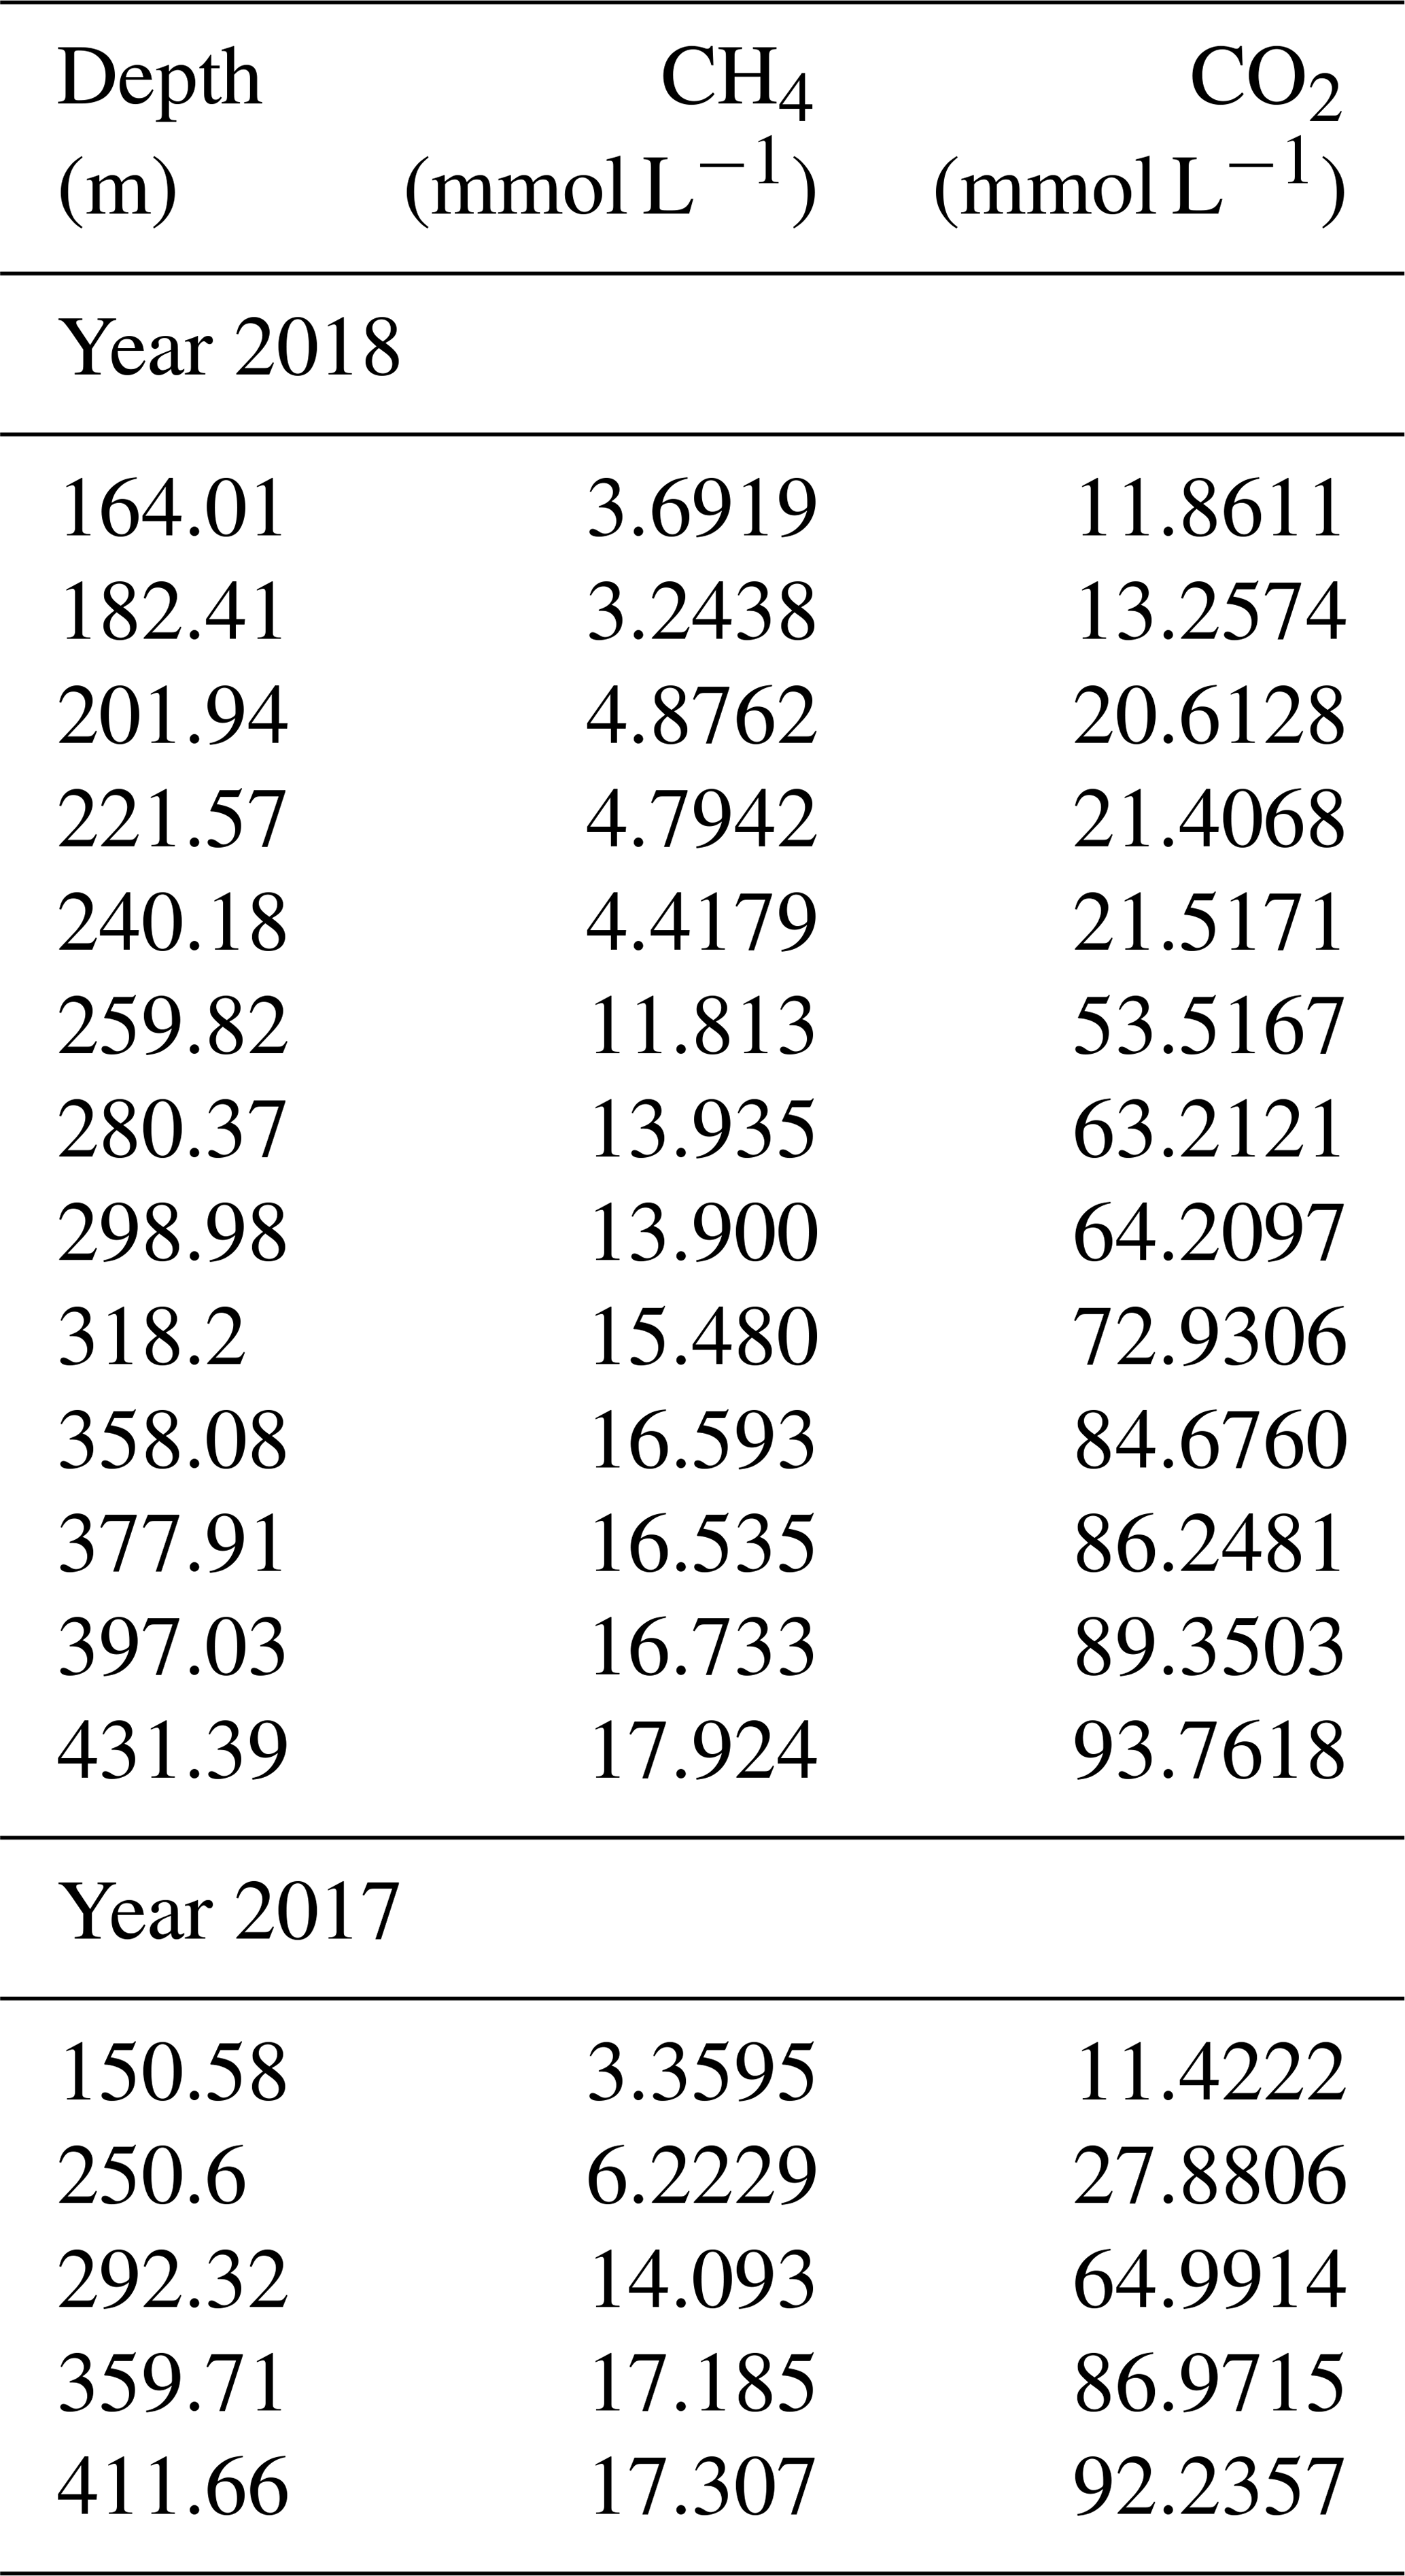
The measurements confirmed the extremely high gas concentrations below a depth of 260 m (“resource zone”) for both methane and carbon dioxide (Fig. 4). Concentrations lay in the expected order of magnitude and results were consistent with each other. No difference was visible between gas measurements in 2017 and 2018. Hence, they were included together in the displays, although the sampling year was annotated. Methane reached close to 18 mmol L−1 in the deepest sample (432 m), while carbon dioxide reached above 90 mmol L−1 (values are included in Table 1).
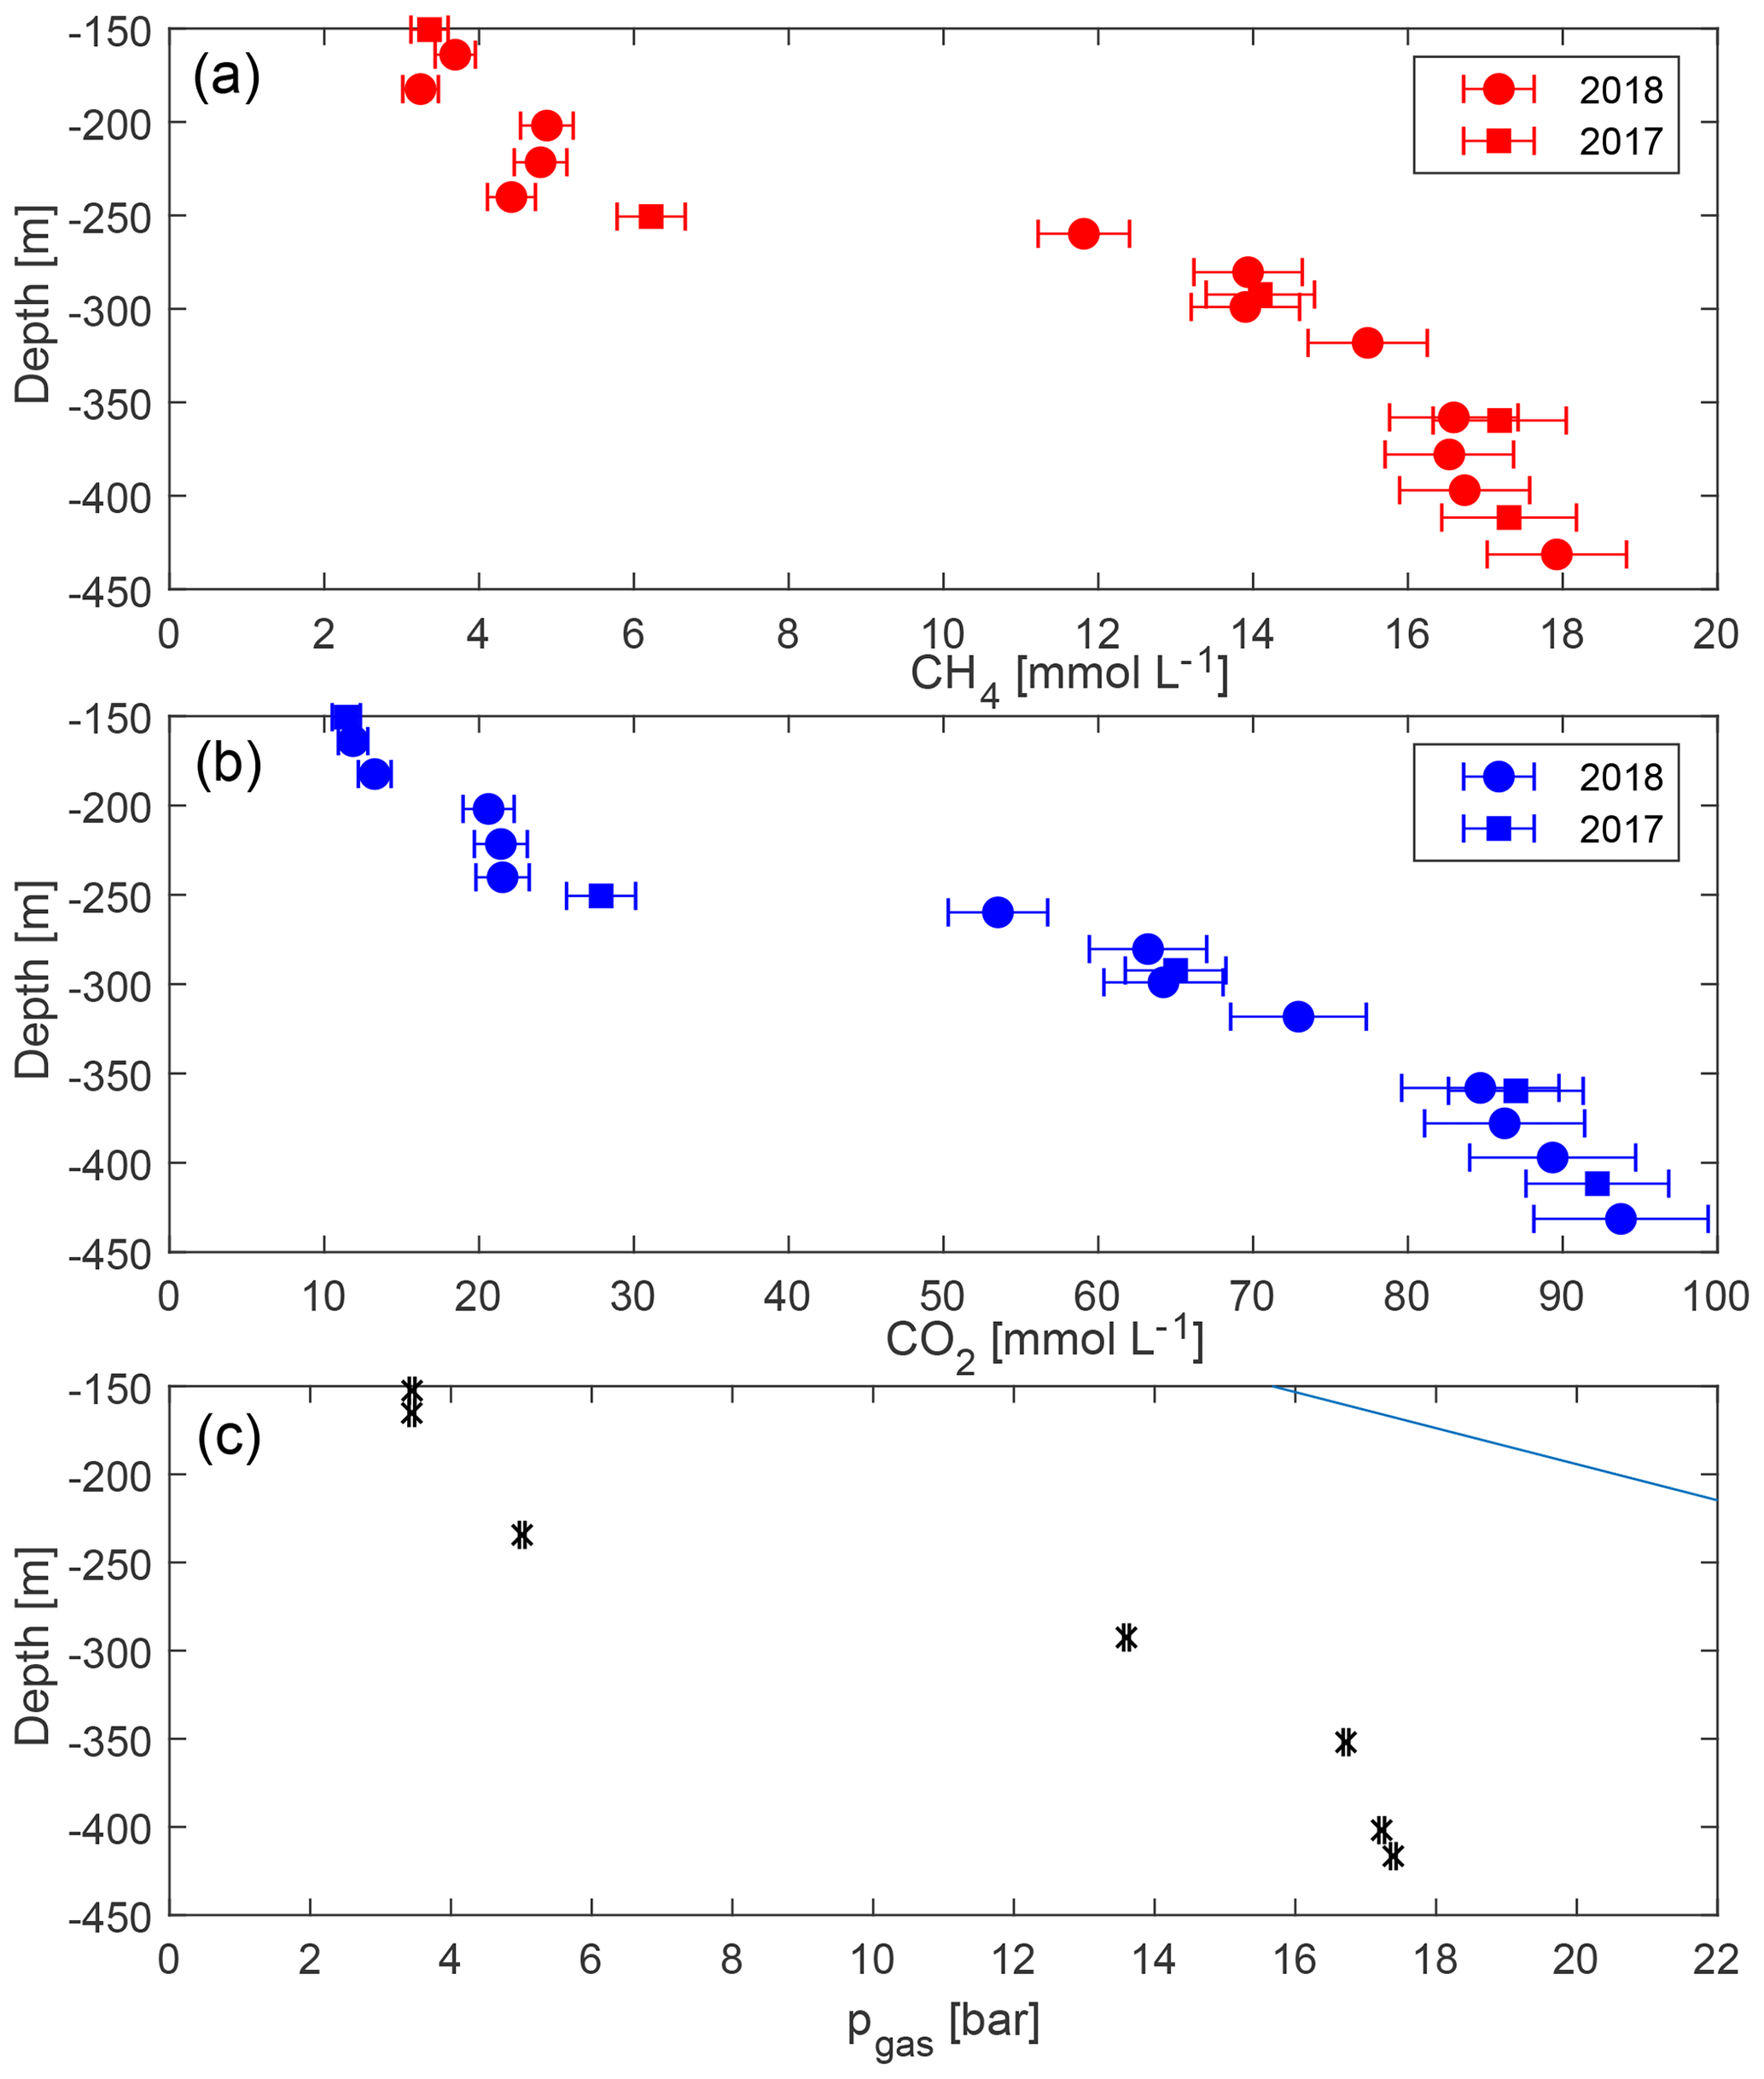
Figure 4Concentrations of methane (a) and carbon dioxide (b) with uncertainties against depth in Lake Kivu. Samples were acquired in May/June 2017 (squares) and March 2018 (circles) at the platform, except for the deepest sample which originated from the “DEEP” site; TDGP measurements were measured at the GIS site (c). (The error bars in (c) are smaller than the symbols.) The solid line represents absolute pressure (hydrostatic plus atmospheric).
Table 1Concentration of methane and carbon dioxide at several depths. Gas measurements originate from sampling bags, the depths originate from the CTM102 probe and are calculated using the following formula: depth [m] = press [dbar] ∕ 0.978 dbar m−1.
3.3 Total gas pressure
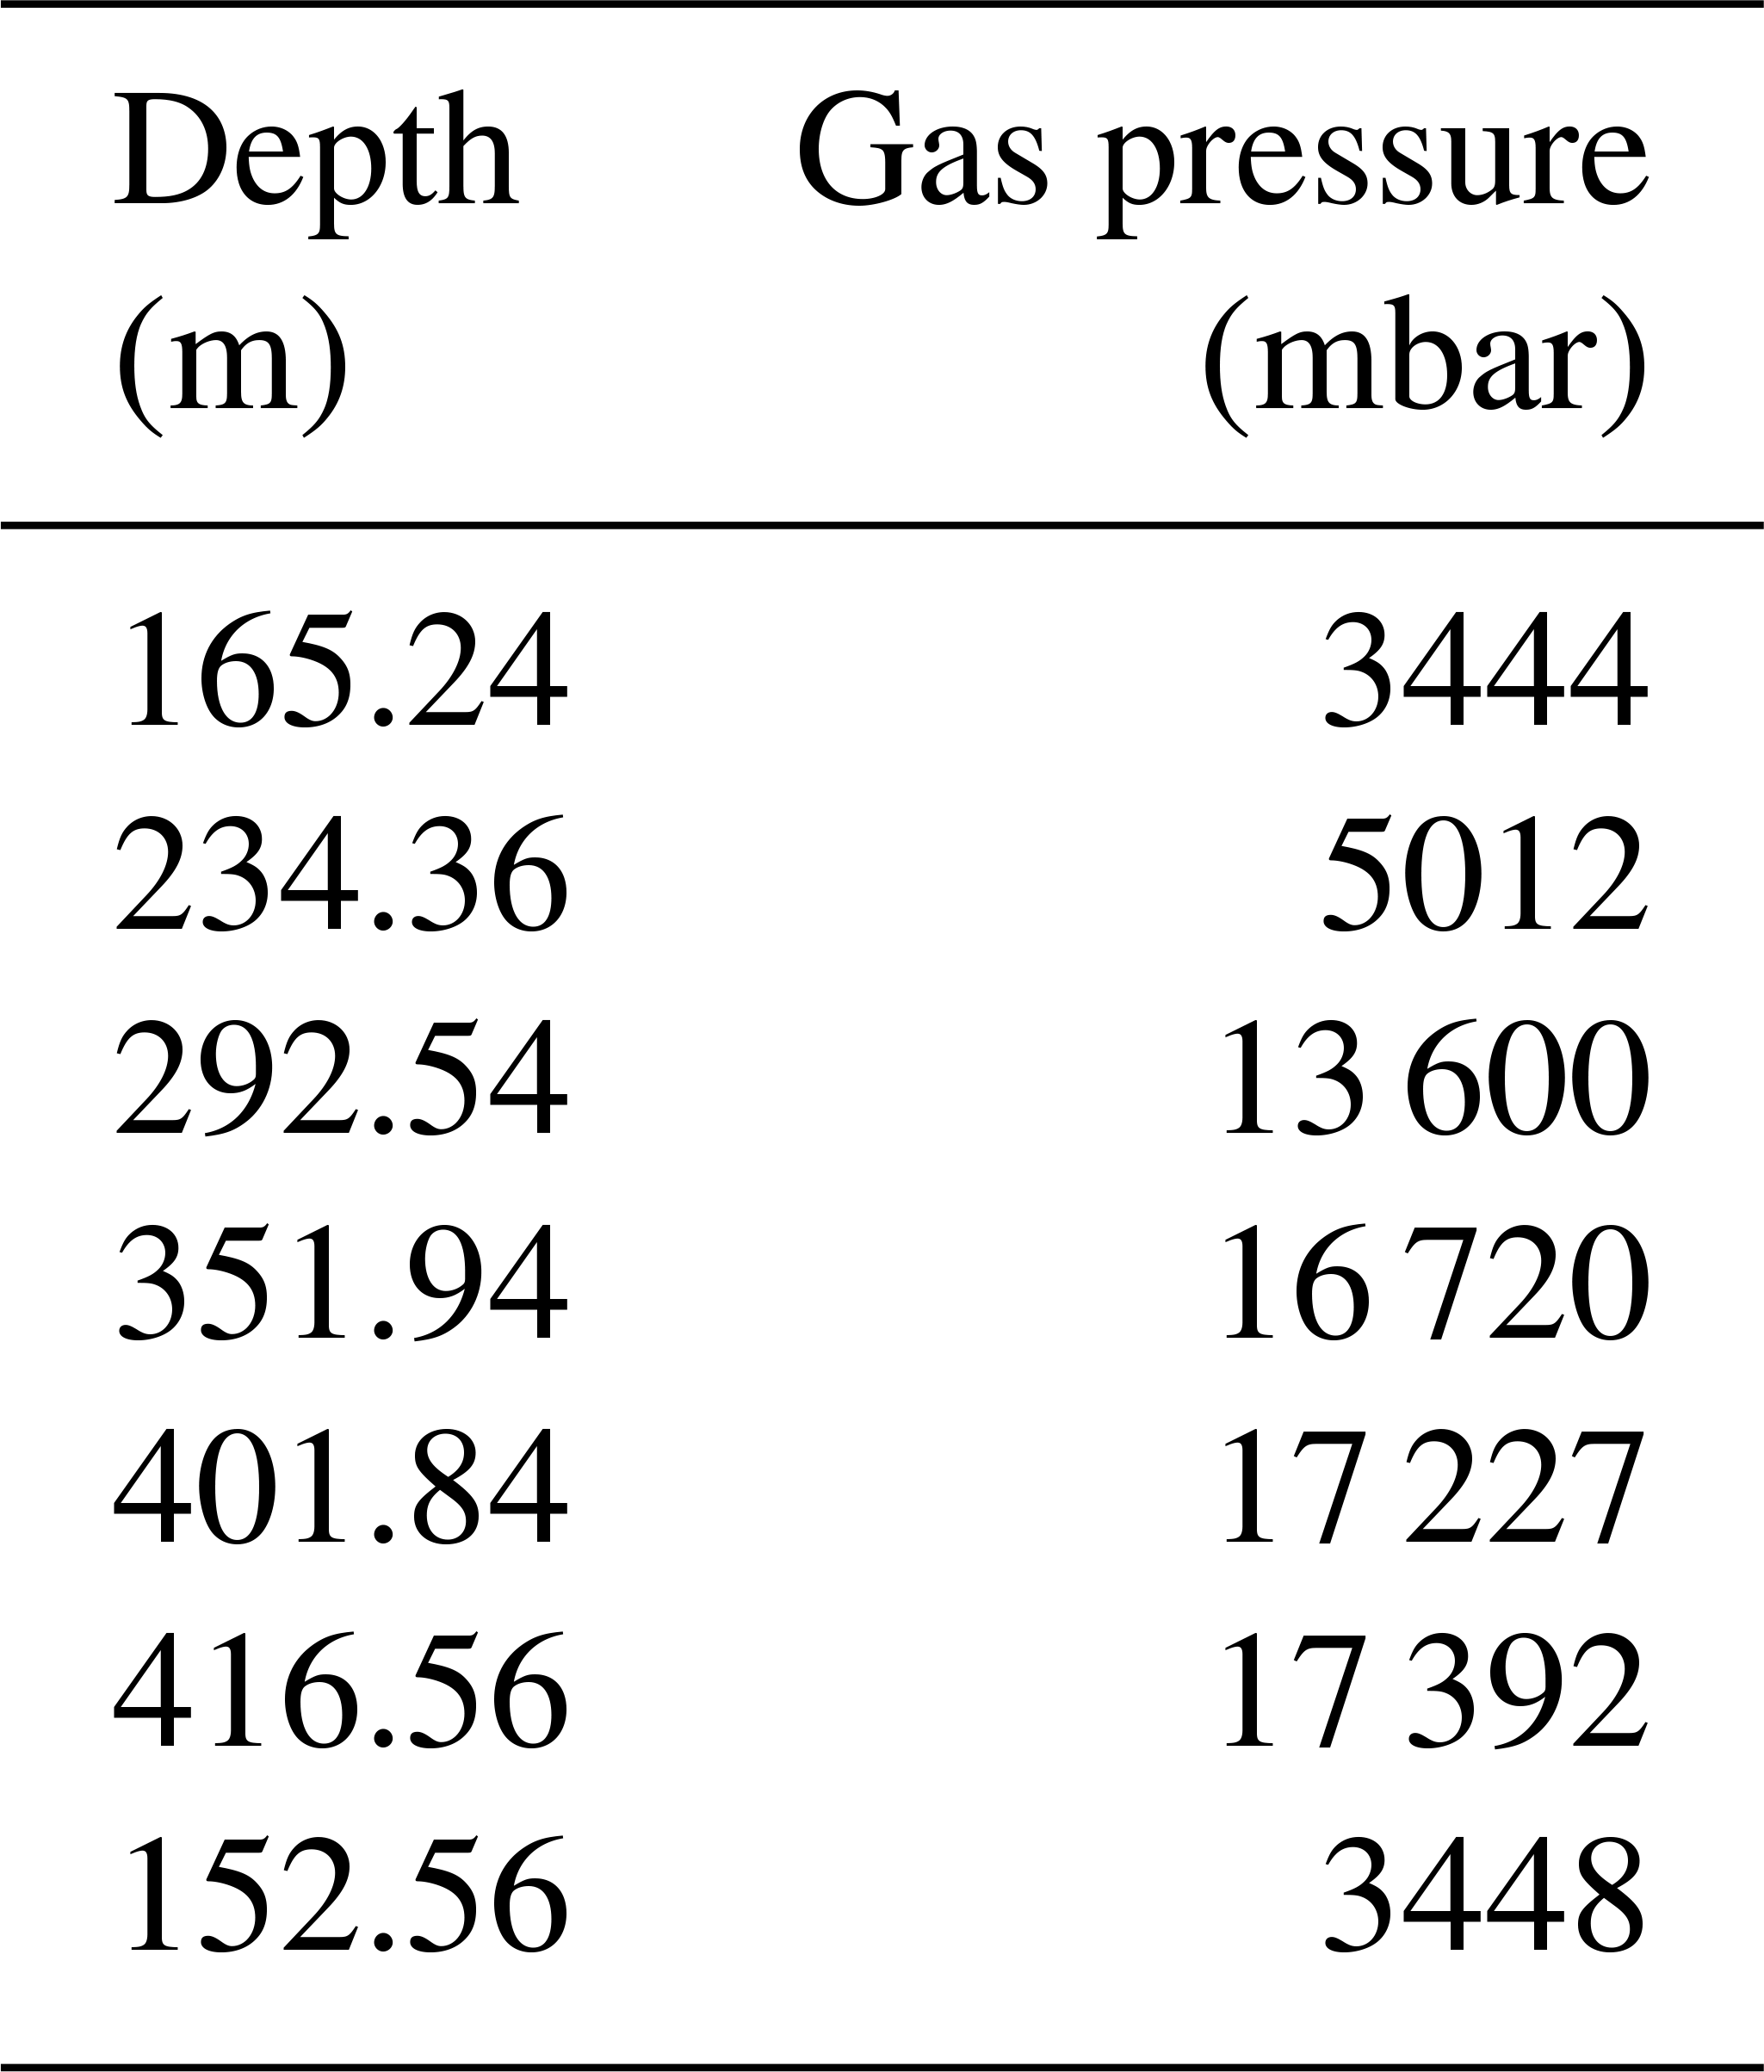
Total dissolved gas pressures increase with depth, reaching more than 17 bar at depths greater than 400 m (Table 2, Fig. 4). Parallel to the measured gas concentrations, the major gradient lay between 230 and 290 m, i.e. between the potential resource zone and the resource zone; hence, it followed the shape of the methane and the carbon dioxide curve. At any depth, the TDGP was much lower than the absolute pressure. Within the resource zone, any water parcel needs to be lifted vertically by at least 150 m for its gas pressure to overcome the absolute pressure and start spontaneous ebullition. At a depth of about 350 m, gas pressure reached approximately 17 bar, which was about half the absolute pressure at this depth. Gas pressures would need to double to form bubbles spontaneously.
Table 2Measured gas pressure against depth. Gas pressures originate from a PRO-OCEANUS sensor; the depths originate from a CTM1143 probe and were calculated using the following formula: depth [m] = press [dbar] ∕ 0.978 dbar m−1.
4.1 Stratification
The profile measurements of temperature, electrical conductivity, oxygen and pH confirmed the picture that was known from previous measurements. Seasonal variability extended down to a depth of about 60 m, which could be seen in the differences of the temperature profiles. Down to this depth, the recirculation also supplied dissolved oxygen, whereas below this depth, a very constant picture was sustained: the stepwise structure of the deep water (monimolimnion), which could be clearly recognized by sharp changes in temperature and electrical conductivity. This concurred with our expectations from the estimated renewal time of close to 1000 years in the deeper monimolimnion (Schmid and Wüest, 2012).
The comparison between profiles from 2017 and 2018 confirmed this picture: the seasonal dynamics was restricted to the upper 50 m, where a difference in temperature and temperature stratification could be detected. The oxycline showed vertical excursions from a depth of about 45 m (May 2017) to a depth of about 30 m in March 2018. Below a depth of 50 m, the measurements showed no temporal variability in temperature, electrical conductivity, pH or oxygen. Small changes in the temperature profile appeared at around 180 m. Beyond this, the measurements confirmed the situation as it was known from earlier campaigns.
4.2 Comparison with earlier gas measurements
Measured concentrations of CH4 and CO2 were compared with previous observations by D. M. Schmitz and J. Kufferath from 1952/1954, Klaus Tietze from 1974/1975, Michel Halbwachs and Jean-Claude Tochon from 2003 (published in Schmid et al., 2005), and Martin Schmid from 2004 (published in Schmid et al., 2005). For the management of the lake, both considering commercial CH4 extraction and the risk of a gas outburst, the most important depth range was the resource zone below the main gradient. In this range, the concentrations from our campaign were between those measured by Klaus Tietze in 1974/1975 and those measured by Michel Halbwachs and Jean-Claude Tochon in 2003 (see Fig. 5).
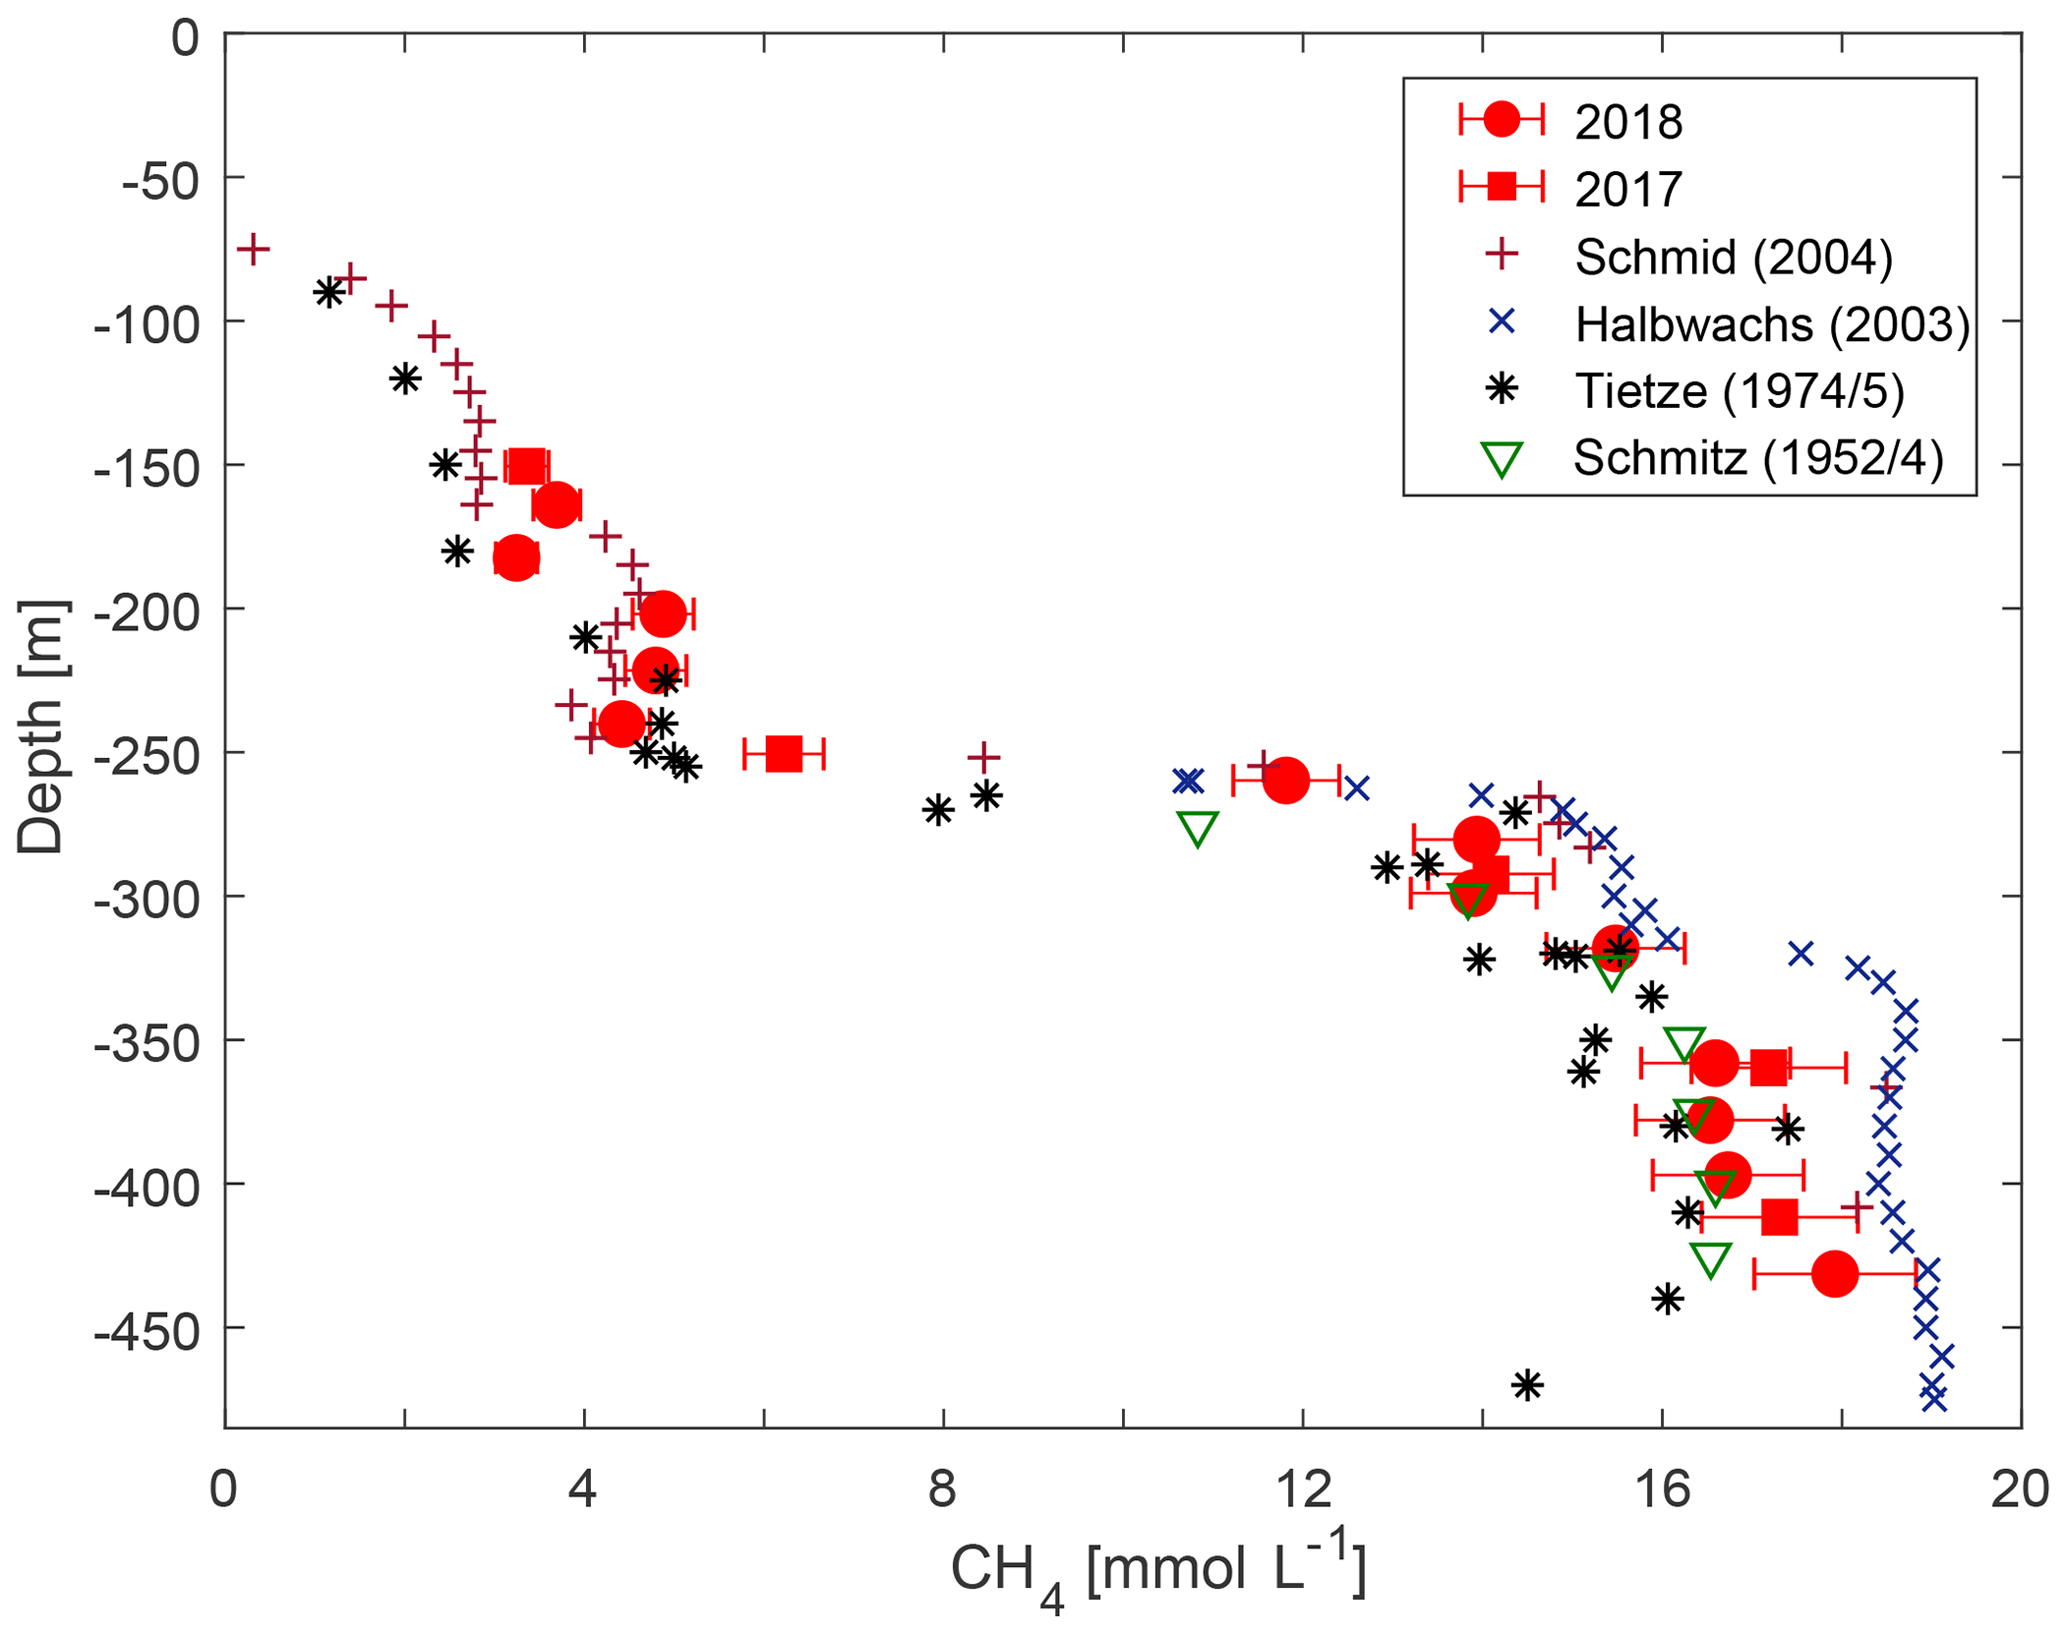
Figure 5Methane concentration from this study compared to previously published observations (numerical values of previous measurements are taken from Schmid et al., 2004).
For CO2, the concentrations agreed well with previous measurements. Above 260 and below 400 m, the measurements lay very close to the Klaus Tietze and Michel Halbwachs data; however, between 260 and 380 m our data showed lower values (Fig. 6) with differences marginally above the expected accuracy of this campaign.

Figure 6Carbon dioxide concentration from this study compared to previously published observations (numerical values of previous measurements are taken from Schmid et al., 2004).
The new measurements did not confirm an increasing trend of methane concentrations in Lake Kivu (as reported in Schmid et al., 2005, see Fig. 5). Although the observed concentrations lay marginally above measurements by Klaus Tietze in 1974/1975, they were significantly lower than the measurements by Michel Halbwachs and Jean-Claude Tochon in 2003. Our conviction is that an increase in methane concentrations over decades followed by a decrease would not represent the true dynamics of CH4 in the deep water. Such variability would be questioned by the residence time of water of nearly 1000 years in the resource zone (Schmid and Wüest, 2012) and the constant electrical conductivity profiles. In addition, the lower concentrations in the present study could not have been caused by the KivuWatt gas extraction, as the volume of water removed was too small and the withdrawal would have resulted in a thinner resource zone but not in lower concentrations. Our observations could not confirm the methane production in the resource zone of 93 g C m−2 yr−1 (0.18 km3 yr−1) as postulated by Pasche et al. (2011), which would correspond to a growth in concentrations by approximately 0.3 % per year. In conclusion, temporal changes in gas concentrations lay below the detection limit at the accuracy of the current and the previous gas measurement methods.
However, a certain amount of methane had to be produced to balance the continuous loss from the lake by upward transport and subsequent oxidation in the surface layer or (to a small extent) emission to the atmosphere (Pasche et al., 2011; Borges et al., 2011; Roland et al., 2018), if concentrations remained constant. This amounted to 32 g C m−2 yr−1 (0.06 km3 yr−1 in the resource zone and 0.013 km3 yr−1 in the potential resource zone) for steady state. Pasche et al. (2011) estimated it to be marginally higher at about 35 g C m−2 yr−1.
4.3 Total gas pressure
The in situ measurements of the TDGP indicated that spontaneous ebullition will not happen at this site in the near future: the difference between the measured gas pressure and the absolute pressure at any depth showed a large safety margin. Furthermore, as the gas concentrations had not changed significantly over the last decades, an abrupt increase towards dangerous conditions was not indicated by our data.
The PRO-OCEANUS custom-made sensor for Lake Kivu showed a convincing performance. After proper preconditioning, the measured response time based on in situ data from Lake Kivu lay just below 4 min (the half-value time was 150 s). This was faster than any previously published similar measurement, but is still too slow for straight profiling. However, we could prove that sufficient data points could be measured in the resource zone (and the potential resource zone) with an acceptable amount of effort. Thus, a spatially better resolved profile such as the one reported in this study would be feasible and is therefore mandatory as a reference for the temporal evolution.
In addition, the accuracy of the TDGP measurement only depended on the calibration of the pressure sensor, which could be accomplished at high accuracy. Hence, this direct in situ measurement would probably be the first to indicate changes in gas concentrations, if proper measurements were carried out at regular intervals. In addition, such gas pressure measurements are appropriate indicators of endangerment due to limnic eruptions and, hence, could serve both purposes.
Gas pressure is attributed to volatile solutes. The major contributors were methane, carbon dioxide and nitrogen. While we had good measurements of methane and carbon dioxide, we were missing data of a similar quality for nitrogen: hence, we could not properly calculate the gas pressure from gas concentrations. In addition, gas pressures at extreme concentrations such as those in Lake Kivu and high absolute pressures show a complex behaviour (see fugacities), and an accurate conversion of gas concentrations to gas pressures would go beyond the scope of this paper.
A quick calculation, based on Henry coefficients at normal pressure (see Sect. 2.3), attributed about 12 bar gas pressure to methane at a depth of 400 m and about 2.6 bar to carbon dioxide; nitrogen was unknown, but was expected to be somewhere between 0 and 1 bar (∼0.68 bar at equilibrium with atmosphere at Lake Kivu's altitude). Other contributions like water (∼0.03 bar) and Argon (∼0.01 bar) were small. This added up to about 15.4 bar. The proper calculations of fugacities will correct these values in the range of 10 %, or possibly even 20 %. The direct measurement from the PRO-OCEANUS sensor showed 17.227 bar. This confirmed the correct order of magnitude for the measurements.
We have presented a sampling method for dissolved gases in Lake Kivu that outperformed all other previously applied techniques in relation to accuracy, applicability and reliability. The required equipment could be cheaply purchased and implemented by the local scientific personnel in the existing facilities. The current accuracy (5 % for methane and 6 % for carbon dioxide in the deep water) was sufficient for most purposes, but could be easily and significantly improved by a better volume measurement.
The new measurements of dissolved gases fell within the range of previously published data. The methane measurements showed slightly higher concentrations than those measured in 1974 (Tietze, 1978; Tietze et al., 1980) but significantly lower concentrations than measurements from 2003 by Michel Halbwachs and 2004 by Schmid et al. (2005). The stratification of deep water showed no significant changes since scientific investigations of corresponding accuracy have been documented. Temperature, electrical conductivity, oxygen and pH in the deep water showed only little temporal variability. Only the upper 50 m showed dynamic seasonal behaviour.
Rising methane concentrations as postulated on the base of earlier measurements were clearly not occurring at the previously estimated rates. Hence, once exploited, a further recharge at a considerable rate is questionable based on the current data. If concentrations are rising, the rates are so low that they cannot be quantified due to the limited accuracy of previous (and current) gas measurements. A comparison with earlier data suggests that Lake Kivu has been close to a dynamic equilibrium, where methane from decomposing organic material and reduced carbon dioxide replaces the amount continuously lost by diffusion (and mixing) to shallower layers of the lake. The current measurements do not indicate the necessity to expand exploitation to prevent limnic eruptions.
For safety assessment, direct measurements of gas pressure are feasible with the prototype used in this study or instruments of similar design. These data quantitatively state how large the safety margin to possible spontaneous ebullition is. The sensor presented is fast enough that high-resolution profiles are feasible within an acceptable time frame. As pressure sensors can be calibrated at high accuracy, direct gas pressure measurements offer the fastest perspective to detect changes in the gas load of Lake Kivu.
Gas measurements are listed in Tables 1 and 2; multiparameter profiles are available from the Supplement.
The supplement related to this article is available online at: https://doi.org/10.5194/hess-23-4707-2019-supplement.
BB was responsible for the design of the sampling equipment and the sampling programme and is also the lead author of this paper. BB, WvT and AM carried out the measurements and sampling in the field and conducted the laboratory measurements; CR implemented and calibrated the gas chromatograph; AU was responsible for setting up the intercalibration campaign and the scientific communication between the scientific groups. All authors contributed to the paper.
The authors declare that they have no conflict of interest.
The authors would like to thank Martin Schmid for providing information prior to the field trips, for help during data evaluation and for the proliferation of data from previous measurements of both methane and carbon dioxide from Schmid et al. (2019); Fabian Bärenbold for critical inspection of methane and carbon dioxide data processing; Maximilian Schmidt for collaboration regarding field and air pressure measurements; Roberto Grilli and Francois Darchambeau for collaboration during the field campaign in 2018; and Mark Barry of PRO-OCEANUS for providing a custom-made gas pressure sensor for Lake Kivu. The authors are also grateful to the technical staff of UFZ and LKMP.
The article processing charges for this open-access publication were covered by a Research Centre of the Helmholtz Association.
This paper was edited by Christian Stamm and reviewed by Minoru Kusakabe and one anonymous referee.
Bärenbold, F., Boehrer, B., Grilli, R., Mugisha, A., von Tümpling, W., Umutoni, A., and Schmid, M.: Updated dissolved gas concentrations in Lake Kivu from an intercomparison project, in review, 2019.
Boehrer, B. and Schultze, M.: Stratification of lakes, Rev. Geophys., 46, RG2005, https://doi.org/10.1029/2006RG000210, 2008.
Boehrer, B., Yusta, I., Magin, K., and Sanchez-España, J.: Quantifying, assessing and removing the extreme gas load from meromictic Guadiana pit lake, Southwest Spain, Sci. Total Environ., 563–564, 486–477, 2016.
Boehrer, B., von Rohden, C., and Schultze, M.: Physical features of meromictic lakes: stratification and circulation, in: Ecology of meromictic lakes. Ecological Studies 228, edited by: Gulati, R. D., Zadereev, E. S., and Degermendzhi, A. G., Springer, Berlin, Heidelberg, Germany, New York, USA, 15–34, 2017.
Borges, A. V., Abril, G., Delille, B., Descy, J.-P., and Darchambeau, F.: Diffusive methane emissions to the atmosphere from Lake Kivu, J. Geophys. Res., 116, G03032, https://doi.org/10.1029/2011JG001673, 2011.
Cai, W.-J. and Wang, Y.: The chemistry, fluxes, and sources of carbon dioxide in the estuarine waters of the Satilla and Altamaha Rivers, Georgia, Limnol. Oceanogr., 43, 657–668, 1998.
Damas, H.: Quelques caractères écologiques de trois lacs équatoriaux: Kivu, Edouard, Ndalaga, Ann. Soc. Roy. Zool. Bel., 68, 121–135, 1937.
Degens, E. T., Deuser, W. G., von Herzen, R. P., Wong, H.-K., Wooding, F. B., Jannasch, H. W., and Kanwisher, J. W.: Lake Kivu expedition: Geophysics, hydrography, sedimentology. Woods Hole Oceanographic Institution, Report 71-52, Woods Hole, MA, USA, 1971.
Degens, E. T., von Herzen, R. P., Wong, H.-K., Deuser, W. G., and Jannasch, H. W.: Lake Kivu: structure, chemistry and biology of an East African Rift Lake, Geol. Rundsch., 62, 245–277, 1973.
Grilli, R., Marrocco, N., Desbois, T., Guillerm, C., Triest, J., Kerstel, E., and Romanini, D.: Invited Article?: SUBGLACIOR: An optical analyzer embedded in an Antarctic ice probe for exploring the past climate, Rev. Sci. Instrum., 85, 1–8, 2014.
Grilli, R., Triest, J., Chappellaz, J., Calzas, M., Desbois, T., Jansson, P., Guillerm, C., Ferré, B., Lechevallier, L., Ledoux, V., and Romanini, D.: SUB-OCEAN: subsea dissolved methane measurements using an embedded laser spectrometer technology, Environ. Sci. Technol., 52, 10543–10551, 2018.
Gulati, R. D., Zadereev, E. S., and Degermendzhi, A. G. (Eds.): Ecology of meromictic lakes. Ecological Studies 228, Springer, Heidelberg, Berlin, Germany, New York, USA, 2017.
Horn, C., Metzler, P., Ullrich, K., Koschorreck, M., and Boehrer, B.: Methane storage and ebullition in monimolimnetic waters of polluted mine pit lake Vollert-Sued, Germany, Sci. Total Environ., 584–585, 1–10, 2017.
Kling, G. W., Clark, M. A., Compton, H. R., Devinee, J. D., Evans, W. C., Humphrey, A. M., Koenigsberg, E. J., Lockwood, J. P., Tuttle, M. L., and Wagner, G. N.: The 1986 Lake Nyos disaster in Cameroon, West Africa, Science, 236, 169–175, 1987.
Koschorreck, M., Henschel, I., and Boehrer B.: Oxygen ebullition from lakes, Geophys. Res. Lett., 44, 9372–9378, 2017.
Kusakabe, M.: Evolution of CO2 Content in Lakes Nyos and Monoun, and Sub-lacustrine CO2-Recharge System at Lake Nyos as Envisaged from CO2∕3He Ratios and Noble Gas Signatures, in: Volcanic Lakes. Advances in Volcanology, edited by: Rouwet, D., Christenson, B., Tassi, F., and Vandemeulebrouck, J., Springer, Berlin, Heidelberg, https://doi.org/10.1007/978-3-642-36833-2_19, 2015.
Moreira, S., Schultze, M., Rahn, K., and Boehrer, B.: A practical approach to lake water density from electrical conductivity and temperature, Hydrol. Earth Syst. Sci., 20, 2975–2986, https://doi.org/10.5194/hess-20-2975-2016, 2016.
Murray, C. N. and Riley, J. P.: The solubility of gases in distilled water and sea water – IV, carbon dioxide, Deep-Sea Res., 18, 533–541, 1971.
Pasche, N., Schmid, M., Vazquez, F., Schubert, C. J., Wüest, A., Kessler, J. D., Pack, M. A., Reeburgh, W. S., and Bürgmann, H.: Methane sources and sinks in Lake Kivu, J. Geophys. Res.-Biogeo., 116, G03006, https://doi.org/10.1029/2011JG001690, 2011.
Roland, F. A. E., Morana, C., Darchambeau, F., Crowe, S. A., Thamdrup, B., Descy, J.-P., and Borges, A. V.: Anaerobic methane oxidation and aerobic methane production in an east African great lake (Lake Kivu), Chemosphere, 168, 756–764, https://doi.org/10.1016/j.jglr.2018.04.003, 2018.
Ross, K. A., Gashugi, E., Gafasi, A., Wüest, A., and Schmid, M.: Characterisation of the Subaquatic Groundwater Discharge That Maintains the Permanent Stratification within Lake Kivu; East Africa, PLoS ONE, 10, e0121217, https://doi.org/10.1371/journal.pone.0121217, 2015.
Sánchez-España, J., Boehrer, B., and Yusta, I.: Extreme carbon dioxide concentrations in acidic pit lakes provoked by water/rock interaction, Environ. Sci. Technol., 48, 4273–4281, 2014.
Sander, R.: Compilation of Henry's law constants (version 4.0) for water as solvent, Atmos. Chem. Phys., 15, 4399–4981, https://doi.org/10.5194/acp-15-4399-2015, 2015.
Schmid, M. and Wüest, A.: Stratification, mixing and transport processes in Lake Kivu, in: Lake Kivu, edited by: Descy, J.-P., Darchambeau, F., and Schmid, M., Springer, Heidelberg, Germany, New York, USA, 13–29, 2012.
Schmid, M., Tietze, K., Halbwachs, M., Lorke, A., McGinnis, D., and Wüest, A.: How hazardous is the gas accumulation in Lake Kivu? Arguments for a risk assessment in light of the Nyiragongo Volcano eruption of 2002, Acta Vulcanologica, 14/15, 115–121, 2004.
Schmid, M., Halbwachs, M., Wehrli, B., and Wüest, A.: Weak mixing in Lake Kivu: New insights indicate increasing risk of uncontrolled gas eruption, Geochem. Geophy. Geosy., 6, Q07009, https://doi.org/10.1029/2004GC000892, 2005.
Schmid, M., Bärenbold, F., Boehrer, F., Darchambeau, F., Grilli, R., Triest, J., and von Tümpling, W.: Intercalibration Campaign for Gas Concentration Measurements in Lake Kivu, Report prepared for the Lake Kivu Monitoring Programme (LKMP) of the Energy Development Corporation Limited (EDCL), Kigali, Rwanda, 2019.
Schmitz, D. M. and Kufferath, J.: Problèmes posés par la présence de gaz dissous dans les eaux profondes du lac Kivu, Bulletin des Séances de l' Académie Royale des Sciences Coloniales, 1, 326–356, 1955.
Sigurdsson, H., Devine, J. D., Tchoua, F. M., Presser, T. S., Pringle, M. K. W., and Evans, W. C.: Origin of the lethal gas burst from Lake Monoun, Cameroon, J. Volcanol. Geoth. Res., 31, 1–16, 1987.
Tassi, F., Vaselli, O., Tedesco, D., Montegrossi, G., Darrah, T., Cuoco, E., Mapendano, M. Y., Poreda, R., and Delgado Huertas, A.: Water and gas chemistry at Lake Kivu (DRC): Geochemical evidence of vertical and horizontal heterogeneities in a multibasin structure, Geochem. Geophy. Geosy., 10, Q02005, https://doi.org/10.1029/2008GC002191, 2009.
Tietze, K.: Geophysikalische Untersuchung des Kivusees und seiner ungewöhnlichen Methangaslagerstätte – Schichtung, Dynamik und Gasgehalt des Seewassers, PhD Thesis, Christian-Albrechts-Universität, Kiel, Germany, 150 pp., 1978.
Tietze, K., Geyh, M., Müller, H., and Schröder, L.: The genesis of methane in Lake Kivu (Central Africa), Geol. Rundsch., 69, 452–472, 1980.
Tuttle, M. L., Lockwood, J. P., and Evans, W. C.: Natural hazards associated with Lake Kivu and adjoining areas of the Birunga volcanic field, Rwanda and Zaire, Central Africa, USGS, Denver CO, USA, 90–691, 1990.
Wüest, A., Jarc, L., Bürgmann, H., Pasche, N., and Schmid, M.: Methane formation and future extraction in Lake Kivu, in: Lake Kivu: Limnology and biogeochemistry of a unique tropical lake, edited by: Descy, J. P., Darchambeau, F., and Schmid, M., Aquatic Ecology Series, Springer Doordrecht Heidelberg New York London , 165–180, 2012.