the Creative Commons Attribution 4.0 License.
the Creative Commons Attribution 4.0 License.
 | 21 Oct 2019
Assessment of climate change impact and difference on the river runoff in four basins in China under 1.5 and 2.0 °C global warming
Hongmei Xu
Lüliu Liu
Yong Wang
Sheng Wang
Ying Hao
Jingjin Ma
To quantify climate change impact and difference on basin-scale river runoff under the limiting global warming thresholds of 1.5 and 2.0 ∘C, this study examined four river basins covering a wide hydroclimatic setting. We analyzed projected climate change in four basins, quantified climate change impact on annual and seasonal runoff based on the Soil Water Assessment Tool, and estimated the uncertainty constrained by the global circulation model (GCM) structure and the representative concentration pathways (RCPs). All statistics for the two river basins (the Shiyang River, SYR, and the Chaobai River, CBR) located in northern China indicated generally warmer and wetter conditions, whereas the two river basins (the Huaihe River, HHR, and the Fujiang River, FJR) located in southern China projected less warming and were inconsistent regarding annual precipitation change. The simulated changes in annual runoff were complex; however, there was no shift in seasonal runoff pattern. The 0.5 ∘C global warming difference resulted in 0.7 and 0.6 ∘C warming in basins in northern and southern China, respectively. This led to a projected precipitation increase by about 2 % for the four basins and to a decrease in simulated annual runoff of 8 % and 1 % in the SYR and the HHR, respectively, but to an increase of 4 % in the CBR and the FJR. The uncertainty in projected annual temperature was dominated by the GCMs or the RCPs; however, that of precipitation was constrained mainly by the GCMs. The 0.5 ∘C difference decreased the uncertainty in the annual precipitation projection and the annual and monthly runoff simulation.
- Article
(955 KB) - Full-text XML
-
Supplement
(1830 KB) - BibTeX
- EndNote


In addition to changes in other variables of the climate system, global temperature has shown warming of 0.85 ∘C during 1880–2012, and a further increase of 2.0–4.0 ∘C is projected over the next 100 years (IPCC, 2013). The goal of 1.5 and 2.0 ∘C global warming relative to the preindustrial climate has been proposed to avoid the dangerous effects of anthropogenic climate change (UNFCCC, 2015). The observed changes in climate have affected both natural and human systems in recent decades. The level of climate change risk at 1.0 or 2.0 ∘C global warming is thought considerable, while that associated with an increase of ≥4.0 ∘C in global warming is considered high to very high (IPCC, 2014). Significant progress has been achieved in comprehensive quantitative assessments of aggregate global climate impact (Schellnhuber et al., 2014). However, climate research is also challenged to provide more robust information on the impact of climate change under different scenarios of global warming (particularly at local and regional scales) to assist the development of sound scientific adaptation and mitigation measures (Huber et al., 2014). For example, a number of areas have been identified with severe projected impacts of warming at 2.0 ∘C (Schleussner et al., 2016).
Observed climate change has caused changes in the global hydrological cycle, and this is expected to have considerable impact on multiple-scale freshwater availability (Müller Schmied et al., 2016). Most regional changes in precipitation can be attributed either to internal variability of the atmospheric circulation or to global warming. Climate change over the 21st century is projected to reduce renewable surface water significantly in most dry subtropical regions, while water resources are projected to increase at high latitudes (IPCC, 2014). At global scale, the extreme rainfall is projected to more frequency under both 1.5 and 2.0 ∘C warming until around 2070s; however, the increase is expected to be higher under 2 ∘C warming after the late 2030s (Zhang and Villarini, 2017). Furthermore, global warming of 2.0 ∘C is anticipated to affect natural runoff in river basins around the world and to dominate runoff changes, even considering human impact (Haddeland et al., 2014). Global warming of 2.0 ∘C will enhance water scarcity in areas projected to experience severe water resource reduction, although uncertainties exist in the projected changes in discharge and in the spatial heterogeneity depending on the contributions from global hydrological models and global climate models (Schewe et al., 2014). For most regions with simulated water resource decrease, the uncertainties in simulated runoff are usually constrained by global hydrological models, which suggests the necessity for improvement of regional- or local-scale hydrological projections (Su et al., 2017). Comparison of the performance of global and regional hydrological models indicates that regional hydrological models are better able to represent the long-term average seasonal dynamics (Hattermann et al., 2017; Gosling et al., 2017).
Within the context of the global temperature increase, China has experienced robust warming that is characterized by the greatest rate of annual mean temperature increase (i.e., more than 0.3 ∘C per 10 years during 1961–2012) in northern areas (Compiling Committee for “Third National Assessment Report for Climate Change”, 2015). River runoff has decreased consistently in the Yellow, Liao, and Songhua rivers but increased in the Pearl River because of increased precipitation in southern China and decreased precipitation in northern China combined with human activities (K. Xu et al., 2010). The runoff of rivers located in northern China, in areas with arid and semiarid climates, is more sensitive to precipitation than in southern China (Xie et al., 2018). The 2.0 ∘C warming threshold will be exceeded under two representative concentration pathways (RCPs), averaged across China, and will be around 2033±15 a under RCP4.5 and 2029±10 a under RCP8.5 (Chen and Zhou, 2016). Simulations suggest that the Yiluo River in northern China will have reduced annual runoff but with a wetter flood season under both 1.5 and 2.0 ∘C warming, while the Beijiang River in southern China will have a slight increase in annual runoff with a drier flood season (Liu et al., 2017). The simulated runoff changes in the Yangtze River decrease under 1.5 ∘C warming; however, it shows opposite changes under 2.0 ∘C global warming (Chen et al., 2017).
The objectives involved in this paper address the following: (1) to detect the level of warming and the change in precipitation in four river basins with differing hydroclimatic characteristics under limiting global warming of 1.5 and 2.0 ∘C, (2) to simulate the changes in river runoff under 1.5 and 2.0 ∘C warming among the four basins, (3) to estimate the uncertainty constrained by global circulation models (GCMs) and RCPs, and (4) to quantify the difference in projected climate changes and simulated changes in river runoff in relation to a 0.5 ∘C global warming difference among the four basins. To achieve these objectives, firstly, we analyze the projected changes in mean annual temperature and precipitation in the selected four basins under 1.5 and 2.0 ∘C warming. Secondly, we investigate the changes in simulated annual and monthly river runoff in the four river basins based on the validated Soil Water Assessment Tool (SWAT). Finally, we quantify the uncertainties in climate change projection and impacts on river runoff based on five GCMs under four RCPs.
2.1 Basins
Four basins that span a wide hydroclimatic gradient from dry to wet were selected as case studies in this research. The locations as well as the physical and hydroclimatic characteristics (based on the observation during 1961–2000) of the selected basins are presented in Fig. 1 and Table 1.
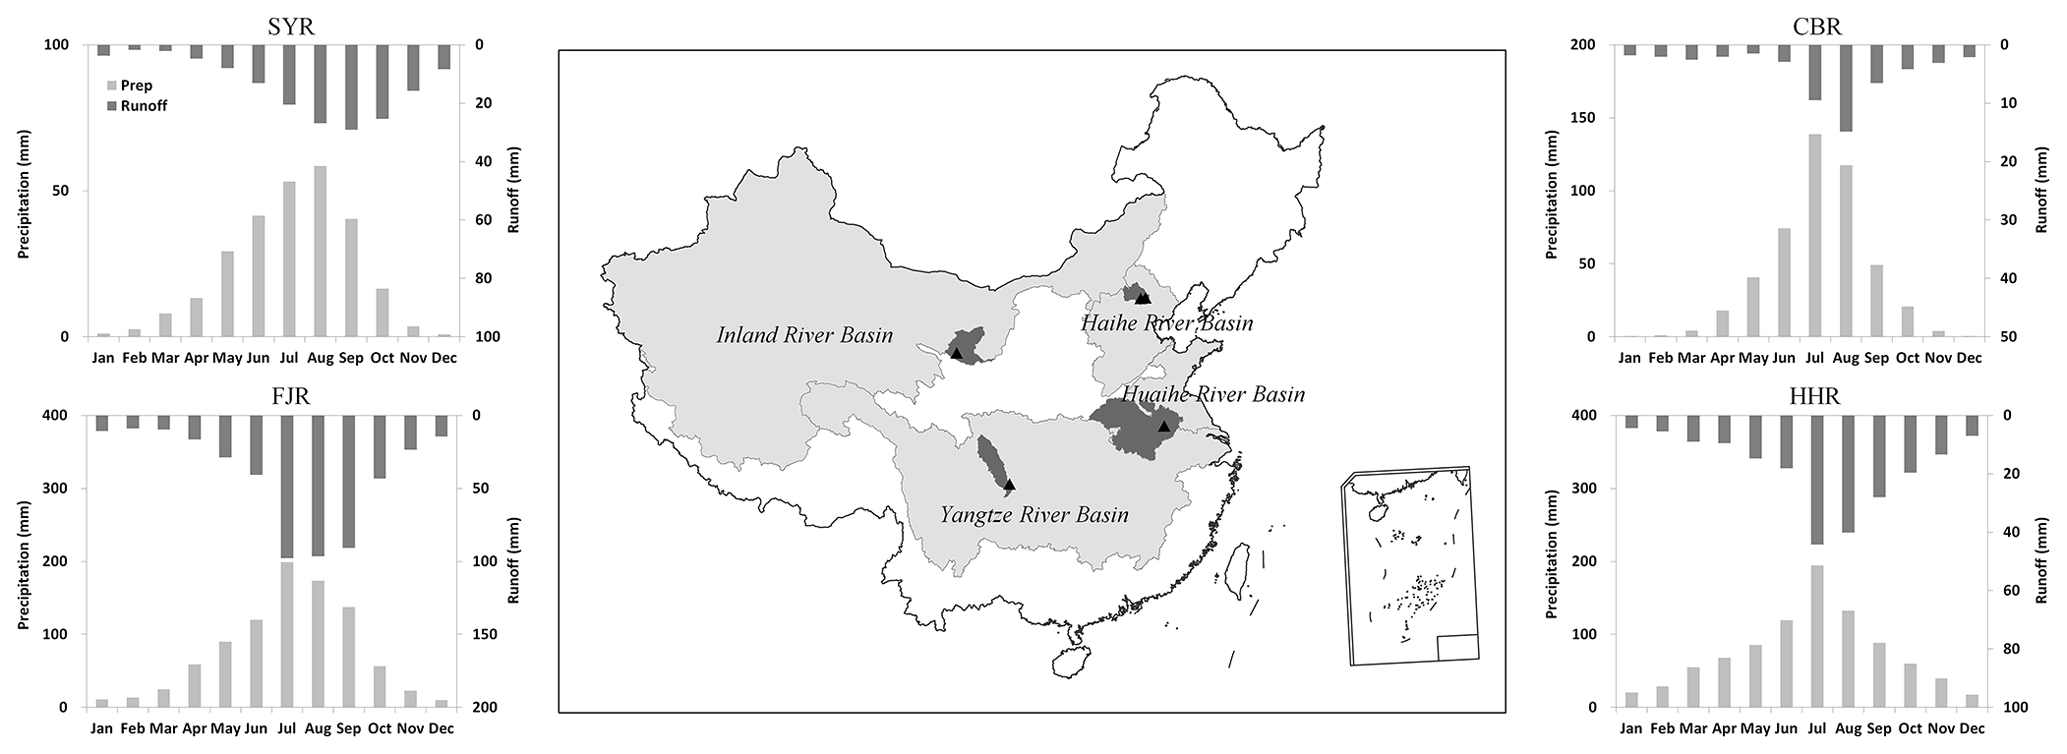
Figure 1Locations and average monthly precipitation/runoff of the four selected basins in China (black triangle: location of hydrological gauges).
Table 1Hydroclimatic characteristics of the four selected basins.
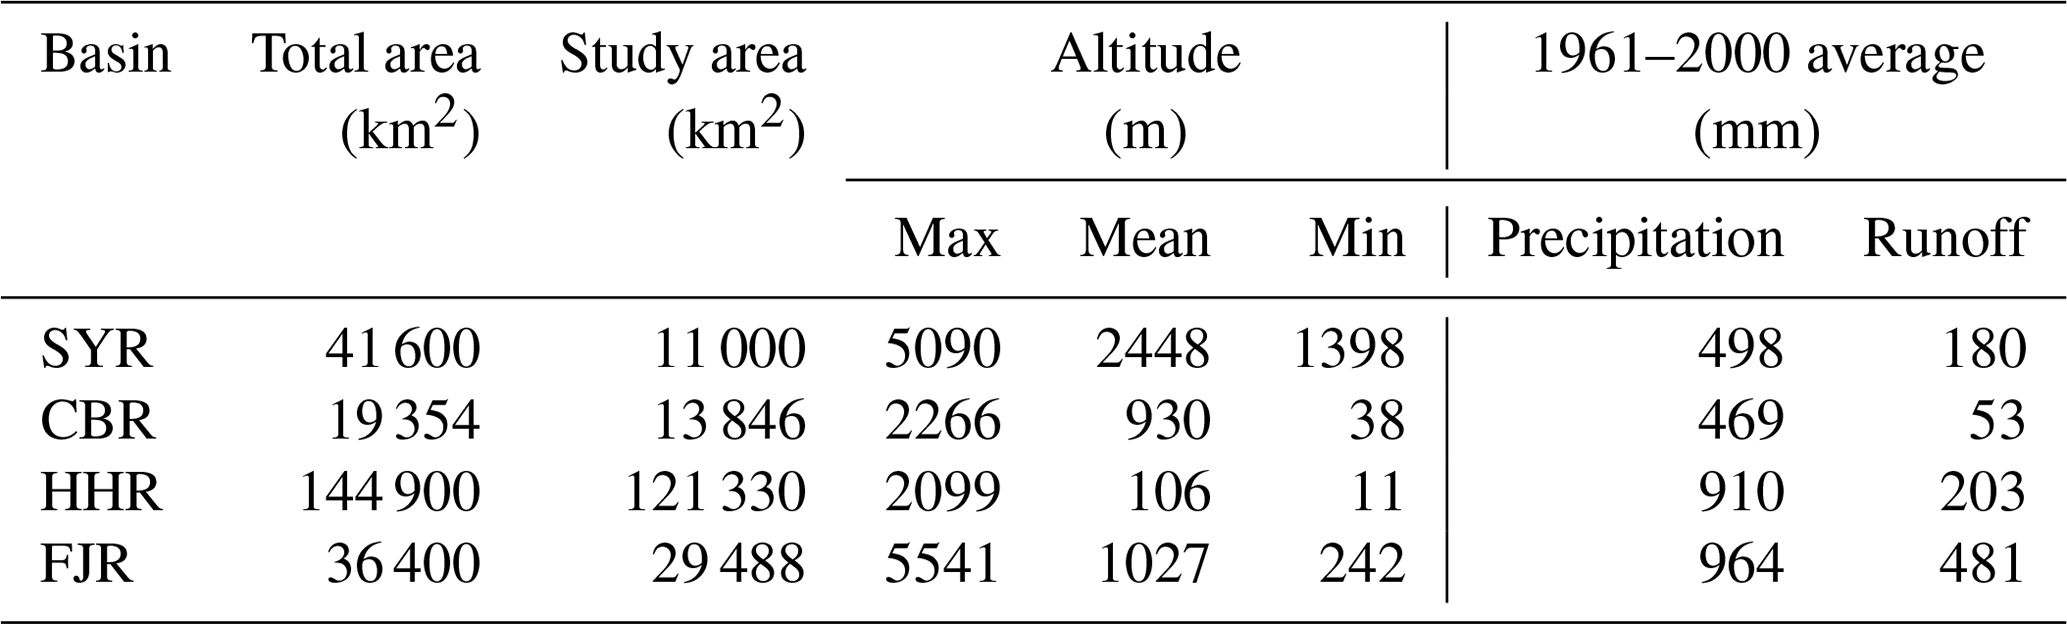
The Shiyang River (SYR) basin is one of three inland river basins in northwestern China. The basin is dominated by a continental temperate arid climate and variable topography. The SYR has eight tributaries that originate in the Qilian Mountains, the total drainage in the mountain area of which (1.1×10⁴ km2) was selected as the study area. River discharge is derived mainly from precipitation and snowmelt water in summer and from groundwater in winter. Of the eight tributaries in the SYR basin, five have decreasing trends in annual streamflow, mainly because of reduced precipitation (Ma et al., 2008). The basin has lost much of its natural vegetation and has undergone gradual desertification due to limited water resources, inappropriate human activities, and the arid climate, which together pose a considerable threat to sustainable agricultural development (Zhu and Li, 2014).
The Chaobai River (CBR) basin is located in the North China Plain and is a tributary of the Haihe River. The basin is dominated by a continental temperate monsoon climate. The CBR originates from the Yanshan Mountains via two tributaries: the Chaohe River and the Baihe River. The total area of the basin above the Xiahui and Zhangjiafen gauging stations (about 1.4×10⁴ km2) was selected as the study area. This watershed is the source of more than half the water supplied to Beijing. Its runoff declined considerably during 1956–2004 because of climate change, land use and land cover change, and increased water consumption (Xu et al., 2014; Yang and Tian, 2009).
The Huaihe River (HHR) basin is an extensive flat plain located in a transition zone between the climates of northern and southern China. The basin is dominated by a warm temperate monsoon semi-humid climate. The upper region of the HHR above the Wujiadu gauging station, which has a drainage area of about 12.1×10⁴ km2, was selected as the study area. Climate change has led to increased severe storms and decreased intense droughts in the HHR basin (Zhang et al., 2015).
The Fujiang River (FJR) is a tributary of the Yangtze River and originates from the Min Mountains located in southwestern China. The FJR basin is dominated by a humid subtropical climate. The area above the Xiaoheba gauging station, which has a drainage area of 2.9×10⁴ km2, was selected as the study area. Because of the high population density, intensive agricultural practices, and decreasing precipitation, the observed river discharge has a decreasing trend; however, high-intensity and long-duration precipitation in this area frequently results in floods and associated landslides (Gao et al., 2017).
2.2 Available data
Consistent spatial datasets, such as the digital elevation model of China generated from a topographic map with 1 : 250 000 scale, the harmonized world soil database with 30 arcsec resolution (FAO/IIASA/ISRIC/ISS-CAS/JRC, 2008), and the digital land use map of China with 1 : 500 000 scale were used for the parameterization of SWAT.
Table 2Goodness of fit of SWAT simulations for monthly runoff of the SYR, CBR, HHR, and FJR.
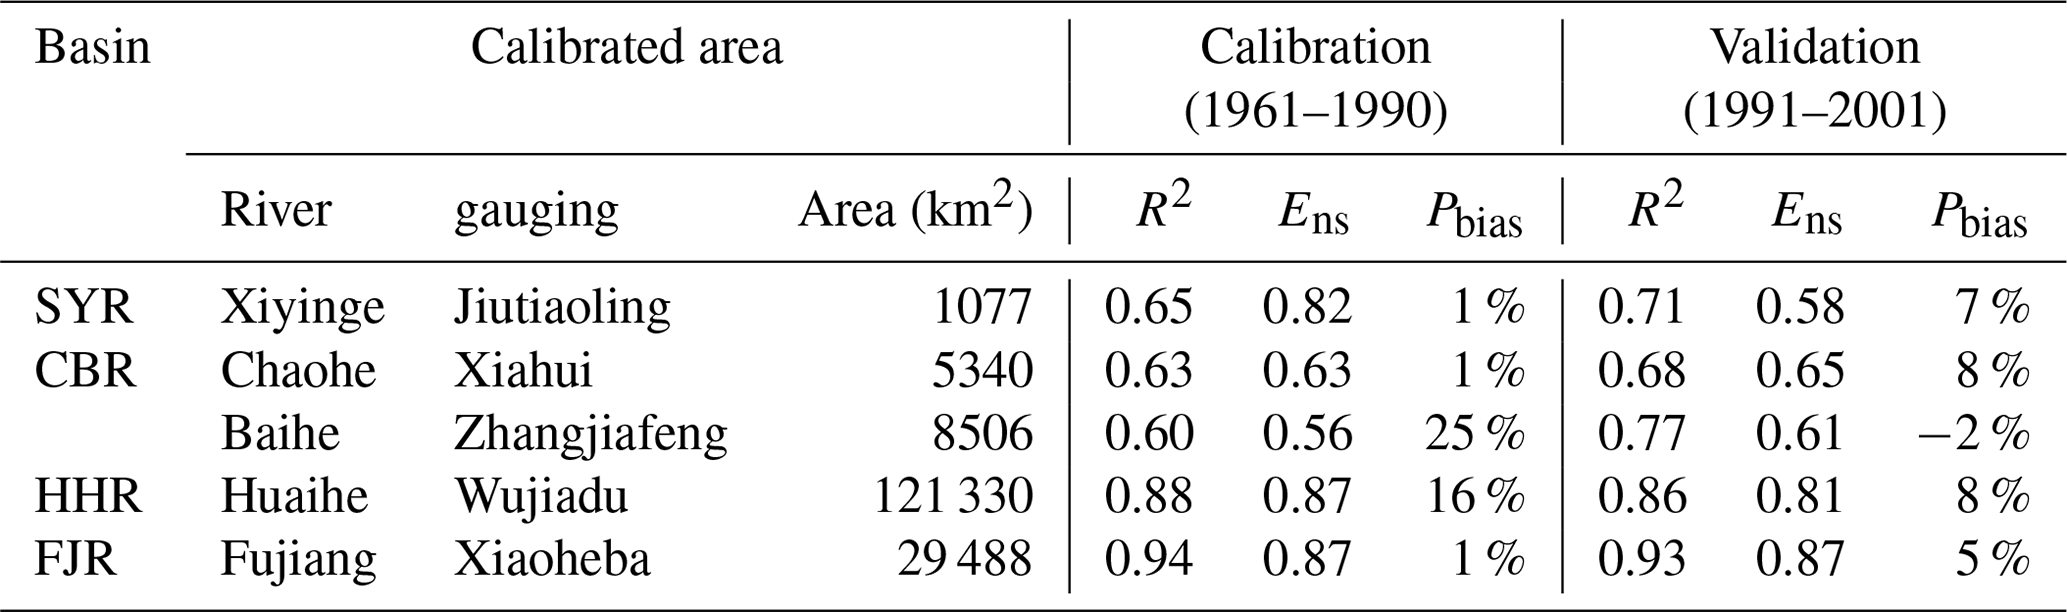
The observed discharge data were provided by the local authorities based on the Water Year Books. Monthly discharge records for selected gauging stations in the four basins (listed in Table 2) for the period of 1961–2001 were used for SWAT evaluation. The daily climate dataset (WATCH Forcing Data: WFD) (Weedon et al., 2010) with a resolution of 0.5∘ covering the period of 1958–2001 was obtained from the Water and Global Change Program. WFD were used for driving the SWAT hydrological model for the historical period and also were used as the basis for GCM output downscaling. Gridded reanalysis climate datasets have been used for hydrological modeling widely, and WFD are considered an acceptable dataset for forcing hydrological models in comparison with gridded observation databases (Essou et al., 2016). Furthermore, WFD have been widely used in climate change impact assessment at regional or catchment scale in China (Hao et al., 2018; Liu et al., 2017; Chen et al., 2017; Su et al., 2017). The comparison of mean annual and monthly temperature and precipitation based on WFD and meteorological observations (OBS) in the four river basins is shown in Table S1 and Fig. S1 in the Supplement. In this study, observations for 50 representative meteorological stations in the four river basins covering the period 1958–2017 were derived from the National Meteorological Information Centre of China of the China Meteorological Administration. For the time period 1961–2001, WFD showed a slight difference in the two river basins in southern China, about 1.3 % and 2.1 % lower in mean annual precipitation and 0.1 and 0.9∘C lower in mean annual temperature in the HHR and the FJR, respectively, while in the two river basins in northern China, there was a less than 20 % difference in mean annual precipitation (14.6 % larger and 20 % lower than observed meteorological observations) and 2.5 and 4.1∘C lower differences in mean annual temperature in the SYR and the CBR. The monthly distribution showed general coherence in the seasonal pattern in temperature and precipitation between WFD and meteorological observation.
GCM outputs were derived from the Inter-Sectoral Impact Model Intercomparison Project for five GCMs (HadGEM2-ES, IPSL-CM5A-LR, MIROC-ESM-CHEM, GFDL-ESM2M, and NorESM1-M) under four RCPs (RCP2.6, RCP4.5, RCP6.0, and RCP8.5) (Warszawski et al., 2014). These models were selected to span global mean temperature change and relative precipitation change as effectively as possible (Warszawski et al., 2014). The FRC index (fractional range coverage) of the five GCMs in the ISI-MIP project is 0.75 and 0.59, respectively, which is better than the five GCMs randomly selected from CMIP5 and can reasonably represent the changes in regional average temperature and precipitation (McSweeny and Jones, 2016). These climate model outputs are spatially interpolated into 0.5∘ resolution and corrected using a trend-preserving bias-correction approach based on WFD for historical simulation (period 1950–2005) and for future projection (period 2006–2099) (Hempel et al., 2013a). The downscaling climate data from GCMs showed very good coherence with WFD for the historical period 1961–2001 in the four river basins in this study (Table S2 and Fig. S2). There were slight differences in WFD and downscaling climate data from GCMs for annual mean, maximum, and minimum temperature in the four river basins, with less than 0.1∘C difference in the SYR, CBR, and HHR, and 0.3∘C larger in the FJR. All five GCMs' historical downscaling data showed good agreement in temperature compared with WFD. For the annual precipitation, there was a generally wetter condition based on the five GCMs' historical downscaling data, with the magnitude less than 15 %. The five GCMs' historical downscaling data could reproduce the monthly distribution of temperature and precipitation well. Such a subset provides climate information that can improve the understanding of both the total uncertainty of future climate impacts and the uncertainty constrained by the use of different GCMs and RCPs.
3.1 Application of SWAT
SWAT is a process-based semi-distributed hydrological model, which can simulate the river flow, water balance, and nutrient transport at basin scale (Gassman et al., 2007). As an open and free tool, SWAT is applied worldwide under various climatic conditions and hydrologic regimes (Arnold et al., 2012).
The simulations using the SWAT model were forced by WFD climate data at a daily time step, and they were warm-up for the period 1958–1960. The SWAT models were then calibrated for 1961–1990 and validated for 1991–2001 using monthly river runoff data from the gauging stations of the four basins. Forcing SWAT by WFD was mainly based on the consideration of reducing the uncertainties in hydrological model parameterization caused by inconsistent climate forcing, because climate model output was corrected based on WFD in the framework of ISI-MIP and was used to force the calibrated SWAT model in the hydrological scenario modeling. Forcing hydrological models with gridded climate/reanalysis climate data and observed climate data results in different parameterization (H. Xu et al., 2010) and has limited impact on the performance of runoff simulation (L. Liu et al., 2012, 2018; Wang et al., 2018).
Using sensitivity analysis procedures embedded in SWAT resulted in the six most sensitive parameters (Table S3) in the hydrological model for each of the four rivers. There were two consistent sensitivity parameters, “CN2” and “GWQMN”, among all four river basins which control the runoff process and soil water moving process, respectively. However, there was a consistent sensitivity parameter for the two river basins located in northern China and southern China, respectively, such as in the two river basins located in northern China; the common sensitivity parameter was “ALPHA_BF”, which reflects the groundwater flow response to changes in recharge. There were specific sensitive parameters for each river basin, such as the temperature-related parameters for snow, “SMTMP” and “TIMP”, in the SYR. The definitions of the parameters are shown in Table S4. The SWAT hydrological model was calibrated based on SWAT-CUP (SWAT Calibration and Uncertainty Programs) (Abbaspour et al., 2007) to improve the fit between simulated and observed discharge. For the SYR, the observed monthly streamflow at the Jiutiaoling gauging station for the Xiyinghe tributary was used for model calibration and validation, while the parameterization was used for the entire SYR. For the CBR, the observed monthly streamflows at the Xiahui gauging station for the Chaohe River and at the Zhangjiafen gauging station for the Baihe River were available for hydrological model calibration and validation separately (Hao et al., 2018). For the HHR and the FJR, the observed monthly discharge in the main stream at gauging stations Wujiangdu and Xiaoheba, respectively, was used for model calibration and validation. However, the auto-calibration did not result in satisfactory performance of the hydrological model in the SYR and the CBR. More extensive manual calibration was undertaken by manually varying the six most sensitive parameters in SWAT, which resulted in an improvement in model performance, and a relative satisfactory fit between observed and simulated monthly river flow was obtained in the SYR and the CBR.
The coefficient of determination (R2) and Nash–Sutcliffe efficiency (Ens) were used to measure the goodness of fit, and percentage of bias (Pbias) was used to assess systematic overestimation or underestimation, and when the absolute value is applied it shows the magnitude (Green and van Griensven, 2008). In general, the model simulation is considered acceptable when the Ens values are greater than 0.5; R2 should exceed 0.6 and the Pbias be less than ±20 % (Moriasi et al., 2007). Furthermore, the performance of the discharge simulation of SWAT was also compared by the graphical plots, including a monthly time series which reflects the month-to-month sequencing and a flow duration curve which shows the frequency distributions of discharge.
Model performance statistics over the calibration and validation periods were all found to be “satisfactory” for the four basins (Table 2). The performance statistics Ens and R2 were both >0.8 and considered highly acceptable for the two basins in southern China (i.e., the HHR and the FJR) for both the calibration and validation periods. The same performance statistics were considered reasonably acceptable for the two basins in northern China (i.e., the SYR and the CBR), with efficiencies in the range 0.58–0.82. The Pbias was generally less than 20 % (except for the Baihe River for the calibration period) in the four rivers. The monthly time series for discharge during the calibration and validation periods (Fig. S3) showed apparently well month to-month sequencing in the four rivers, with general underestimation in monthly discharge in the dry season in the two rivers located in northern China and underestimation for the flooding season in occasional years in the CBR. This was also reflected in the flow duration curve (Fig. S4), with large underestimation for the medium/lower and very high flow for the CBR. Oppositely, there was overestimation in medium/lower flow in both of the two rivers located in southern China, however, with underestimation in higher flow in FJR.
It can be summarized that SWAT appears to capture successfully the underlying hydrology of the four river basins evaluated by the three statistic metrics and compared by the monthly discharge series and the flow duration curve. The successful application of the SWAT in different climate regions is considered adequate verification of the suitability of the model for future climate change impact on runoff in the four selected basins.
3.2 Climate change projection and runoff simulation
The future scenarios for limiting global warming of 1.5 and 2.0 ∘C were derived based on a 30-year running mean of global mean temperature following the methodology of Liu et al. (2017) for each one of the 20 combinations under four RCPs and five GCMs of the climate projection subset. Table S5 showed the averaged middle year of the 30-year samples for all GCMs under each RCP of 1.5 and 2.0 ∘C global warming. There were 18 scenarios under 1.5 ∘C above preindustrial levels and 16 scenarios under 2.0 ∘C. These scenarios were used to quantify the difference in the changes in the projected annual temperature and precipitation in the four river basins by comparing with the baseline period (1976–2005).
To indicate the overall magnitude and difference of the climate change projection under limiting global warming of 1.5 and 2.0 ∘C, the projected changes in mean annual temperature and annual precipitation were quantified by the value of the ensemble mean under all climate scenarios (Ave.) and the projected changes in maximum and minimum annual temperature and annual precipitation (Max. and Min.) among all climate scenarios. The uncertainty caused by RCPs was estimating using the standard deviation of the mean of all GCMs under 1.5 and 2.0∘ global warming, respectively, and the uncertainty constrained by GCMs was estimated using standard deviations of all RCPs under the two global warmings, whereas the overall source of uncertainty in climate change scenarios was estimating using the standard deviation of all 18 and 16 climate scenarios under 1.5 and 2.0∘ global warming.
The hydrological simulation adopted the climate projection subset for the downscaling climate data and the future climate scenarios from five GCMs and validated SWAT models in the four basins, and projected the impact of climate change on river discharges. Generally, the hydrological simulations based on downscaling climate data from five GCMs for the baseline period compared well with those based on WFD and were acceptable for subsequent hydrological projection (Table S6 and Fig. S5). The changes in averages of the annual and monthly runoff were compared based on the simulated runoff under all climate scenarios and with the simulated runoff based on the baseline period (1976–2005) from the five GCMs rather than the actual observed discharge data or simulated discharge forcing by WFD.
The simulated changes in mean annual runoff were quantified by the value of ensemble mean annual runoff of all climate scenarios under 1.5 and 2.0∘C global warming, and mean annual runoff under RCP2.6, RCP4.5, RCP6.0, and RCP8.5, respectively, and mean annual runoff under GCM GFDL-ESM2M, HaDGem2, IPSL_CM5A-LR, MIROC-ESM-CHEM, and NorESM1-M, respectively. The simulated changes in monthly runoff were analyzed by the proportion of monthly runoff in annual runoff using the mean of the baseline period for the five GCMs, and the ensemble mean, maximum, and minimum of simulated monthly runoff under all combined climate scenarios of GCMs and RCPs for 1.5 and 2.0∘C global warming, respectively.
4.1 Projected climate change
The statistics of the projected climate change and uncertainties for the four basins from the 18 scenarios under 1.5 ∘C warming and the 16 scenarios under 2.0 ∘C warming are shown in Table 3.
Table 3Projected changes in annual mean temperature and annual precipitation for the four basins under 1.5 and 2.0 ∘C global warming.
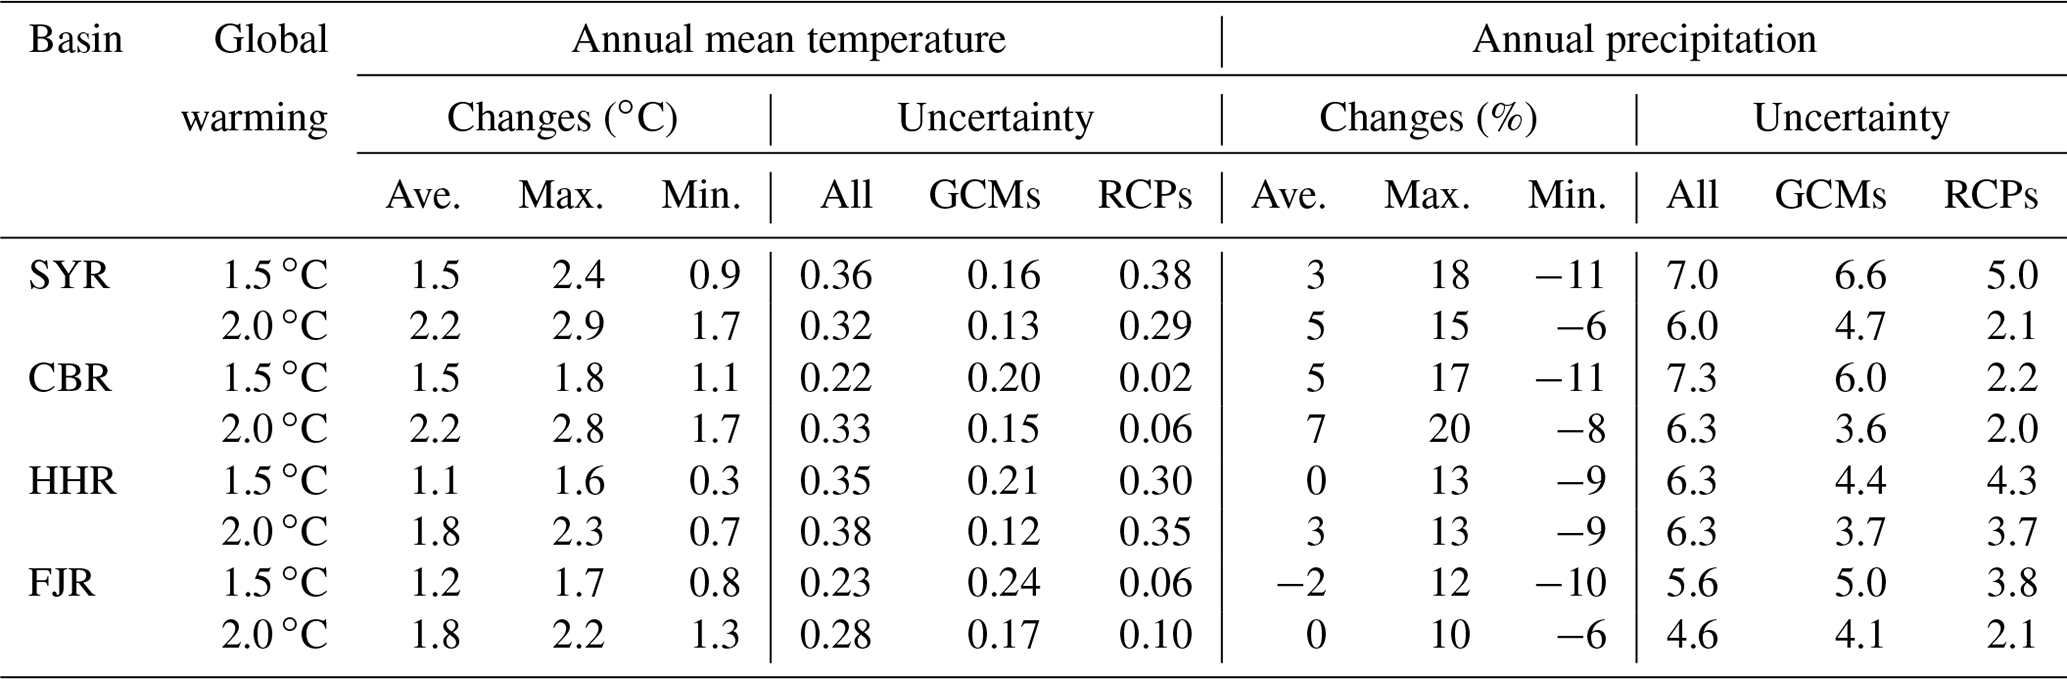
The results show substantial warming for all four basins under two thresholds of global warming. The projected changes in ensemble mean annual temperature show 1.5 ∘C increase under 1.5 ∘C global warming and 2.2 ∘C increase under 2.0 ∘C warming for the SYR and the CBR, while the projected changes in ensemble mean annual precipitation show 3 % and 5 % increase under 1.5 ∘C warming and 5 % and 8 % increase under 2.0 ∘C warming for the SYR and the CBR, respectively. The projected changes in ensemble mean annual temperature show 1.1 and 1.2 ∘C increase under 1.5 ∘C warming and 1.8 ∘C increase under 2.0 ∘C warming for the HHR and the FJR. The projected changes in ensemble mean annual precipitation are minor for the HHR and FJR (i.e., %). All statistics for the two basins in northern China indicate generally warmer and wetter conditions in future compared with the present day. The two basins in southern China are projected to have less warming and no consistent change in the projected ensemble mean annual precipitation.
The greatest range in projected changes in annual mean temperature occurs in the HHR, with the warming range of 0.3–1.6 ∘C under 1.5 ∘C warming and that of 0.7–2.3 ∘C under 2.0 ∘C warming among all projection scenarios. The projected range in annual temperature is also large for the SYR, with a change in the range of warming of 0.9–2.4 ∘C under 1.5 ∘C warming and that of 1.7–2.9 ∘C under 2.0 ∘C warming, respectively. There is no consistency in the direction of the range in projected annual precipitation change among the four river basins, with increases ranging from 10 % to 20 % and decreases ranging from −6 % to −11 %. For the two river basins in southern China, the range of the projected change in annual precipitation is less than for the two basins in northern China.
The uncertainty is substantial in annual precipitation projection compared with that associated with annual temperature projection, with considerable dispersion among the scenarios. Comparing the uncertainty under limiting global warming under 1.5 and 2.0 ∘C, the former has larger uncertainties for the projected change in annual precipitation than that under the latter; however, it is the opposite for the projected change in annual temperature.
There is generally larger uncertainty constrained by the GCMs (i.e., about 1–3 times) than associated with the RCPs for the projected annual precipitation for all four river basins. However, the uncertainty in annual temperature projection associated with the RCPs is larger in the SYR (about 2 times) and in the HHR (about 1.5–3.0 times) than constrained with the GCMs. All these findings show the uncertainty in the projection of annual precipitation mainly constrained by GCM structure across the four river basins, whereas the dominance of the uncertainty associated with either the GCMs or the RCPs in the projection of annual mean temperature is dependent on the basin.
4.2 Simulated annual river runoff
Figure 2 shows the simulated ensemble mean annual river runoff based on all combined climate scenarios and the average simulated annual river runoff of the four RCPs and the average of the five GCMs. The simulated ensemble mean annual runoff decreases for the SYR by about 25 % and 33 % under 1.5 and 2.0 ∘C warming, respectively, and the simulated change for the FJR shows a decrease of about 4 % under 1.5 ∘C warming. The simulated ensemble mean annual river runoff shows an increase with magnitude of about 8 % and 12 % for the CBR and about 8 % and 7 % for the HHR under 1.5 and 2.0 ∘C warming, respectively.
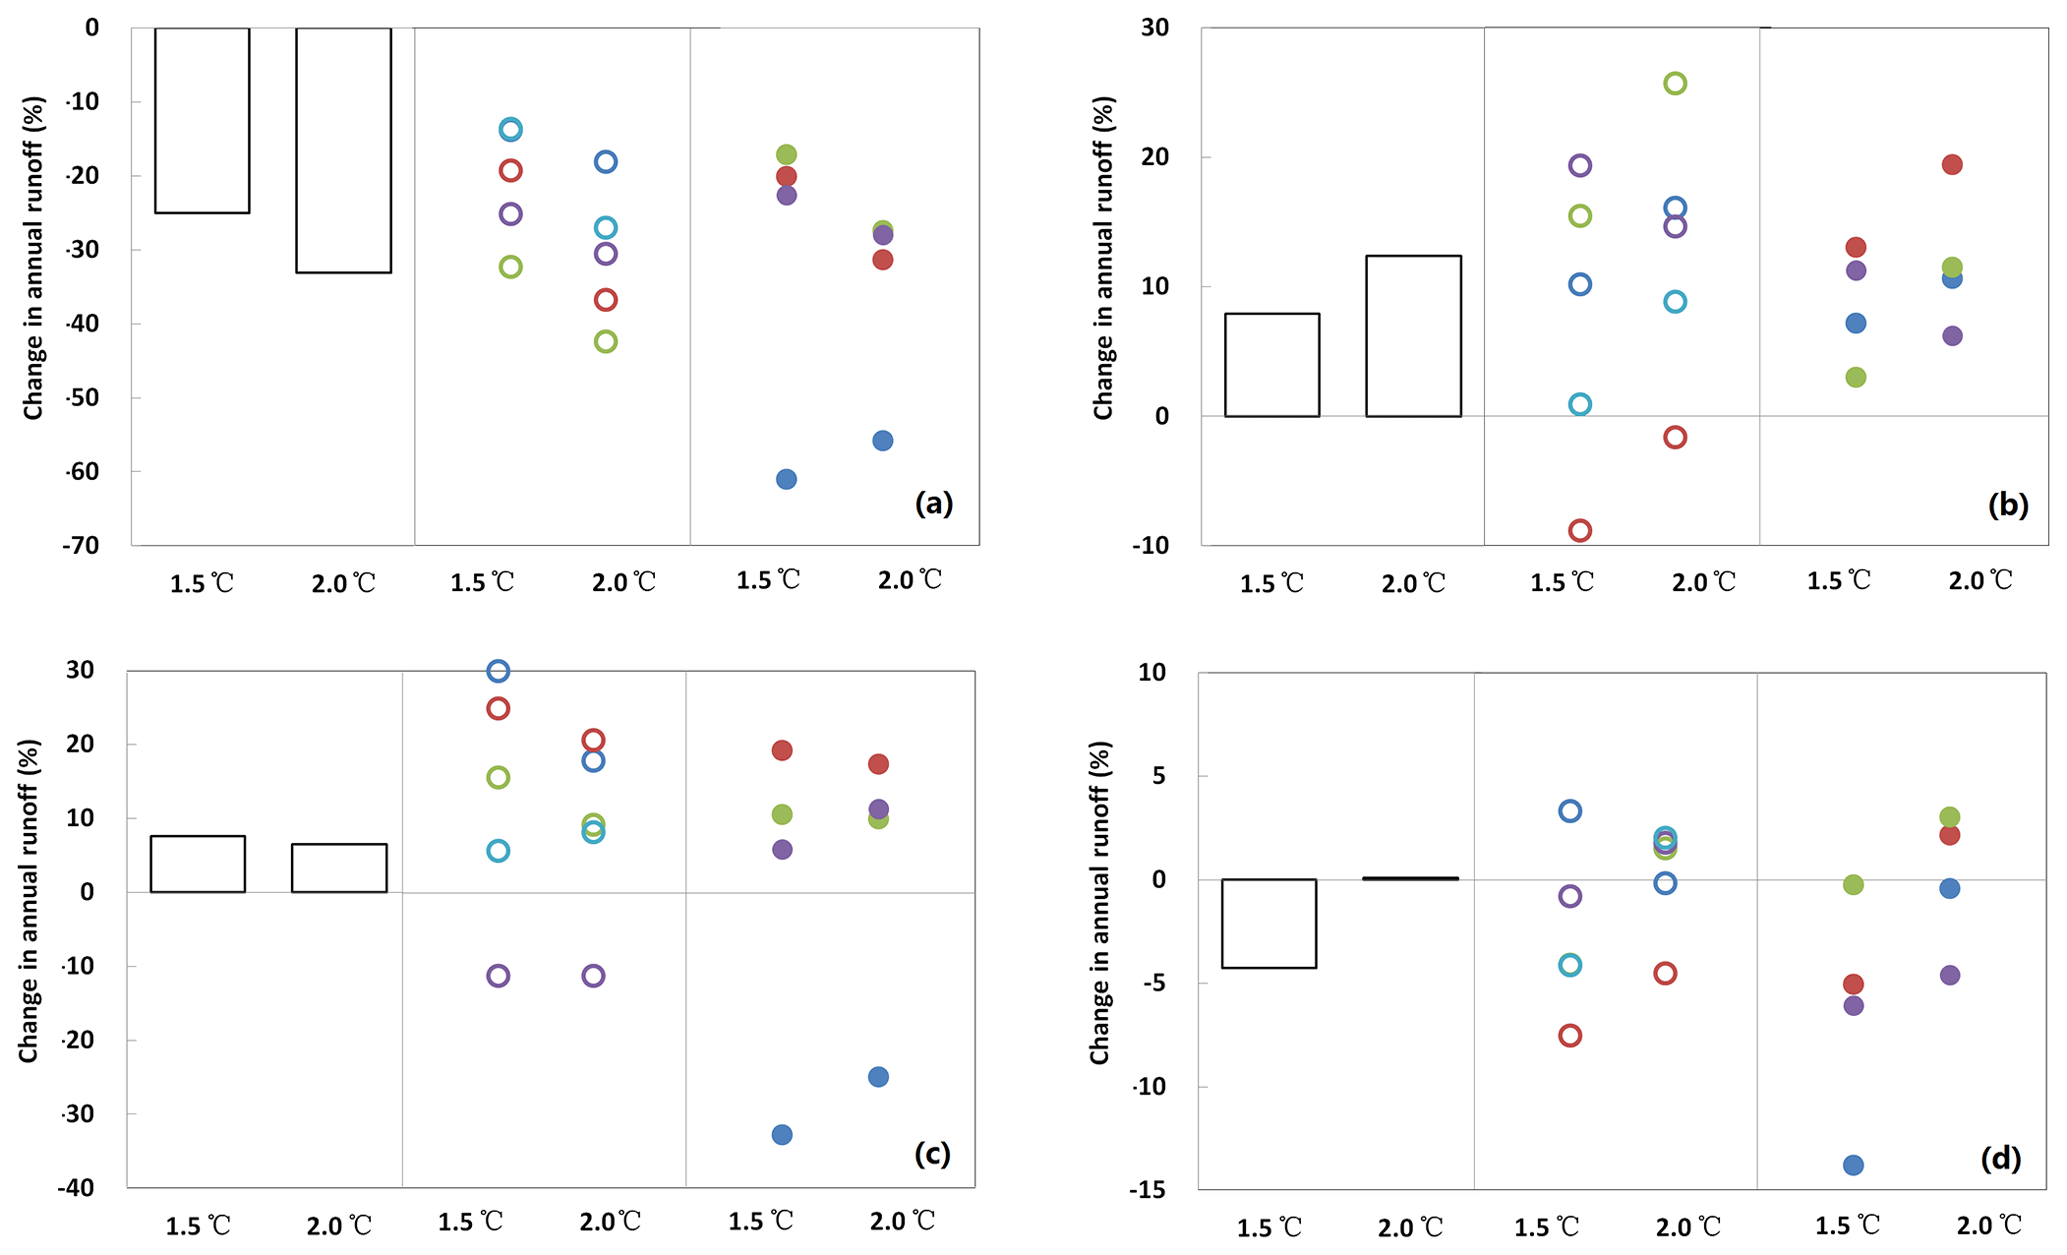
Figure 2Changes in simulated annual river runoff: (a) SYR, (b) CBR, (c) HHR, and (d) FJR under 1.5 and 2 ∘C global warming. (Baseline: 1976–2005; columns represent the simulated changes in mean annual river runoff for all combined scenarios of GCMs and RCPs; hollow circles colored dark blue, red, green, blue, and purple represent the changes in mean annual runoff simulated by five GCMs: GFDL-ESM2M, HaDGem2, IPSL_CM5A-LR, MIROC-ESM-CHEM, and NorESM1-M, respectively; solid circles colored dark blue, red, green, and purple represent the changes in mean annual runoff simulated under four RCPs: RCP2.6, RCP4.5, RCP6.0, and RCP8.5, respectively).
The decrease in the simulated annual river runoff for the SYR occurs across all the combined scenarios, ranging from 0 % to −72 % under 1.5 ∘C warming and from −11 % to −63 % under 2.0 ∘C warming. For the other three river basins, the change in simulated annual river runoff ranges from an increase of 57 % to a decrease of 34 %. The smallest range occurs in the FJR, with a change in simulated annual river runoff in the ranges 10 % to −17 % and 11 % to −11 % under 1.5 and 2.0 ∘C warming, respectively. The largest range occurs in the HHR, with a change in simulated annual river runoff in the range from 57 % to −34 % under 1.5 ∘C warming and from 38 % to −32 % under 2.0 ∘C warming. The simulated change in annual river runoff in the CBR is in the range from 37 % to −34 % under 1.5 ∘C warming and from 39 % to −20 % under 2 ∘C warming.
The simulated change in annual river runoff for the mean of the four RCPs and the five GCMs shows consistent decrease in the range −61 % to −14 % under 1.5 ∘C warming and −56 to −18 % under 2.0 ∘C warming for the SYR, with the largest decrease occurring under RCP2.6. The simulated annual river runoff under the mean of the four RCPs for the CBR shows consistent increase in the range 3 % to 13 % under 1.5 ∘C warming and 6 % to 19 % under 2.0 ∘C warming. For the HHR, the simulated annual river runoff under RCP2.6 shows reduction of −33 % and −25 % under 1.5 and 2.0 ∘C warming, respectively, whereas it increases under the other scenarios by 6 % to 20 % and 10 % to 17 %, respectively. For the FJR, the simulated annual river runoff shows reduction for all RCPs under 1.5 ∘C warming but an increase for RCP4.5 and RCP6.0 under 2.0 ∘C warming.
The simulated annual river runoff for the CBR under HaDGem2 for the mean of the four RCPs shows a decrease of about −9 % and −2 % under 1.5 and 2.0 ∘C warming, respectively, while that of the HHR under NorESM shows a decrease of about −12 %. However, for the FJR, most GCMs show reduction for the simulated annual river runoff in the range from 0 % to −14 % under 1.5 ∘C warming and from 0 % to −5 % under 2.0 ∘C warming, while any increase is no larger than 3 %.
There is less uncertainty in the simulated annual river runoff among all the scenarios under 2.0 ∘C than that of 1.5 ∘C warming when quantified by standard deviation. The uncertainties associated with the RCPs are 1.3–2.6 times those constrained by the GCMs for the SYR and the FJR, while for the CBR, the uncertainties constrained by the GCMs are 2–3 times those associated with the RCPs. For the HHR, the uncertainties associated with the RCPs are the largest under 1.5 ∘C warming, whereas those constrained with the GCMs are the largest under 2.0 ∘C warming.
4.3 Simulated seasonal river runoff
Figure 3 shows the change in the proportion (mean monthly percentage of annual runoff) of maximum, average, and minimum simulated river runoff based on all combined scenarios. For the SYR and FJR, the proportion shows no substantial change (i.e., <1.0 %). For the CBR, a decrease occurs during May–July with a magnitude of about 1.0 % to 2.0 %, and an increase occurs mainly in September and October with a magnitude of <2.0 % under 1.5 ∘C warming. Similarly, a decrease occurs during May–August with a magnitude of 0.4 % to 2.3 % and an increase occurs in September with a magnitude of about 2.0 % under 2.0 ∘C warming, while a decrease occurs mainly during June–August for the HHR, with a magnitude of about 1.0 % to 3.5 % and 1.2 % to 3.4 %, and an increase occurs in May with a magnitude of about 2.0 % and in September with a magnitude of <5 % under 1.5 and 2.0 ∘C warming, respectively.
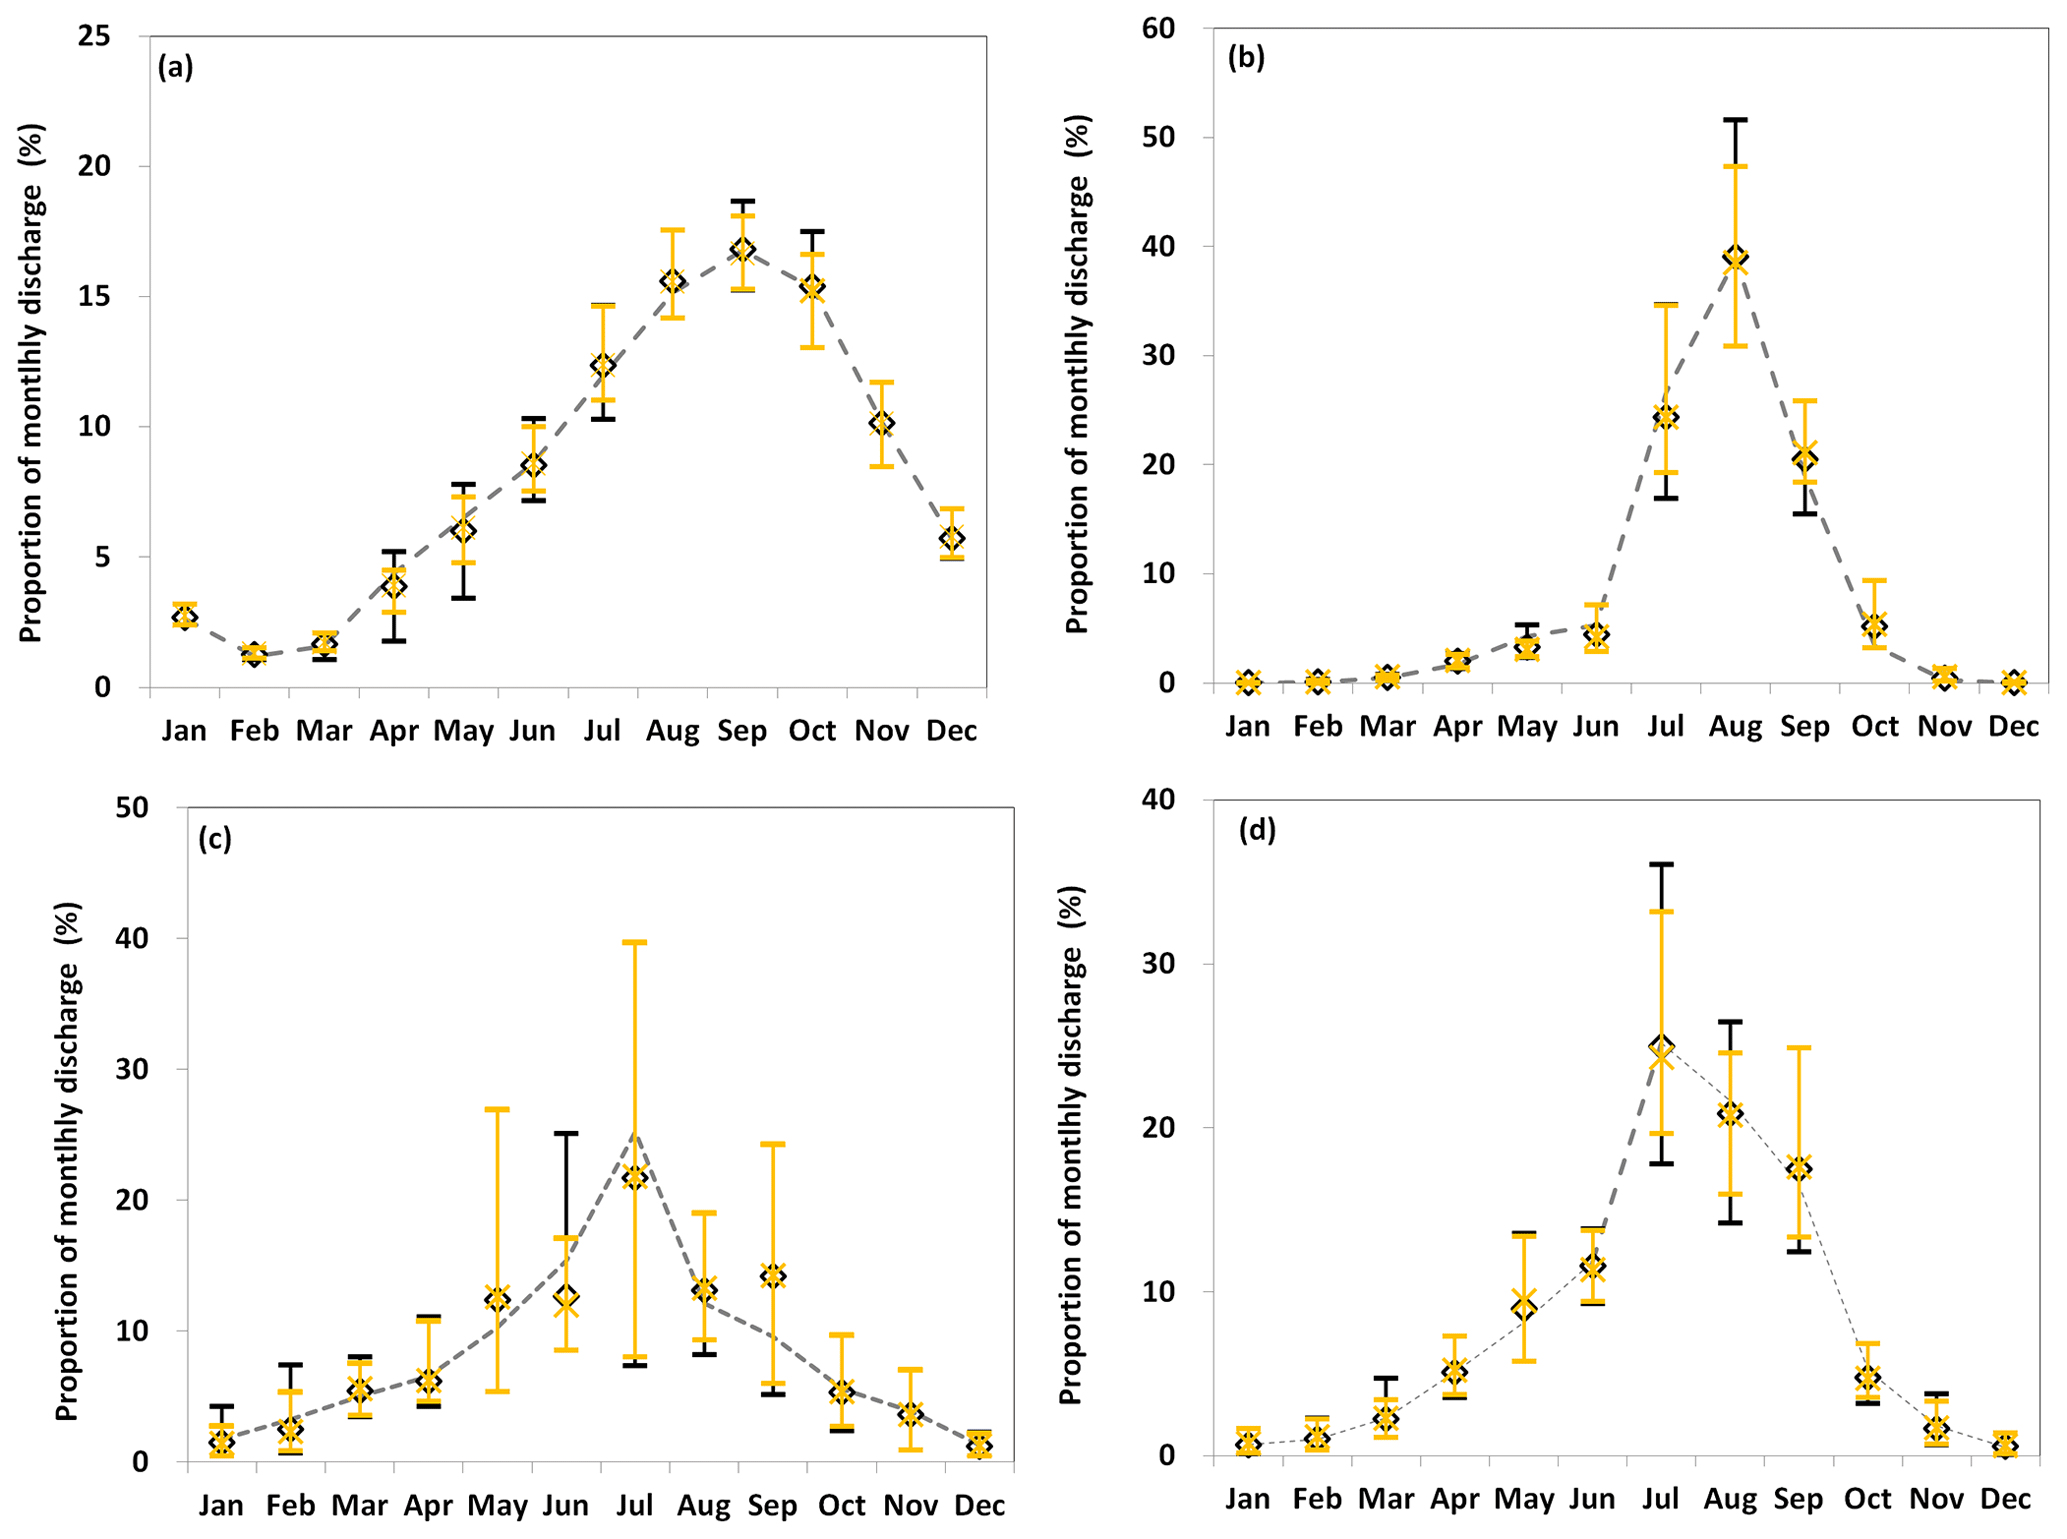
Figure 3Simulated proportion of monthly river runoff in annual runoff: (a) SYR, (b) CBR, (c) HHR, and (d) FJR under 1.5 and 2.0 ∘C global warming. (Baseline: 1976–2005; dotted line: mean of baseline for five GCMs; bars colored black and yellow show the maximum and minimum values of all simulated monthly runoff for all combined climate change scenarios of GCMs and RCPs; black diamonds and yellow crosses represent the mean values for monthly runoff for all combined climate change scenarios of GCMs and RCPs).
For all months, there are generally larger ranges for the mean monthly percentage of annual runoff for 1.5 ∘C warming. These results indicate the uncertainties in simulated monthly runoff are larger under 1.5 ∘C warming than under 2.0 ∘C warming.
5.1 Climate change impact on runoff
Chen et al. (2014) analyzed the effects of climate change on runoff in the Asian monsoon region. They indicated that different basins respond differently to the same climate change scenario. For example, they found that the change in runoff of the Haihe River basin in northern China is highly sensitive to precipitation and temperature. It was established that a considerable increase in precipitation (about 4 %) would be required to keep runoff unchanged in this semi-humid basin in northeastern China, while a smaller precipitation increase (about 2.8 %) would be required to maintain runoff in wetter basins in southern China. Precipitation is the main input of surface water resources and evapotranspiration (ET) is the main output. Previous studies have explored the climatic impacts of ET and runoff in China. For example, M. Liu et al. (2012) analyzed the environmental stress on ET and runoff over eastern China for 1961–2005. They found ET increased in most river basins, while runoff increased in the Pearl River and the southeastern river basins in southern China, but it decreased in the basins of the Haihe and Huaihe rivers in northern China. It was determined that climate change was the dominant factor governing the long-term trend of ET and runoff in southern China. Ma et al. (2008) indicated that decreased precipitation and increased potential ET contribute most to the observed reduction of streamflow in SYR in northwestern China.
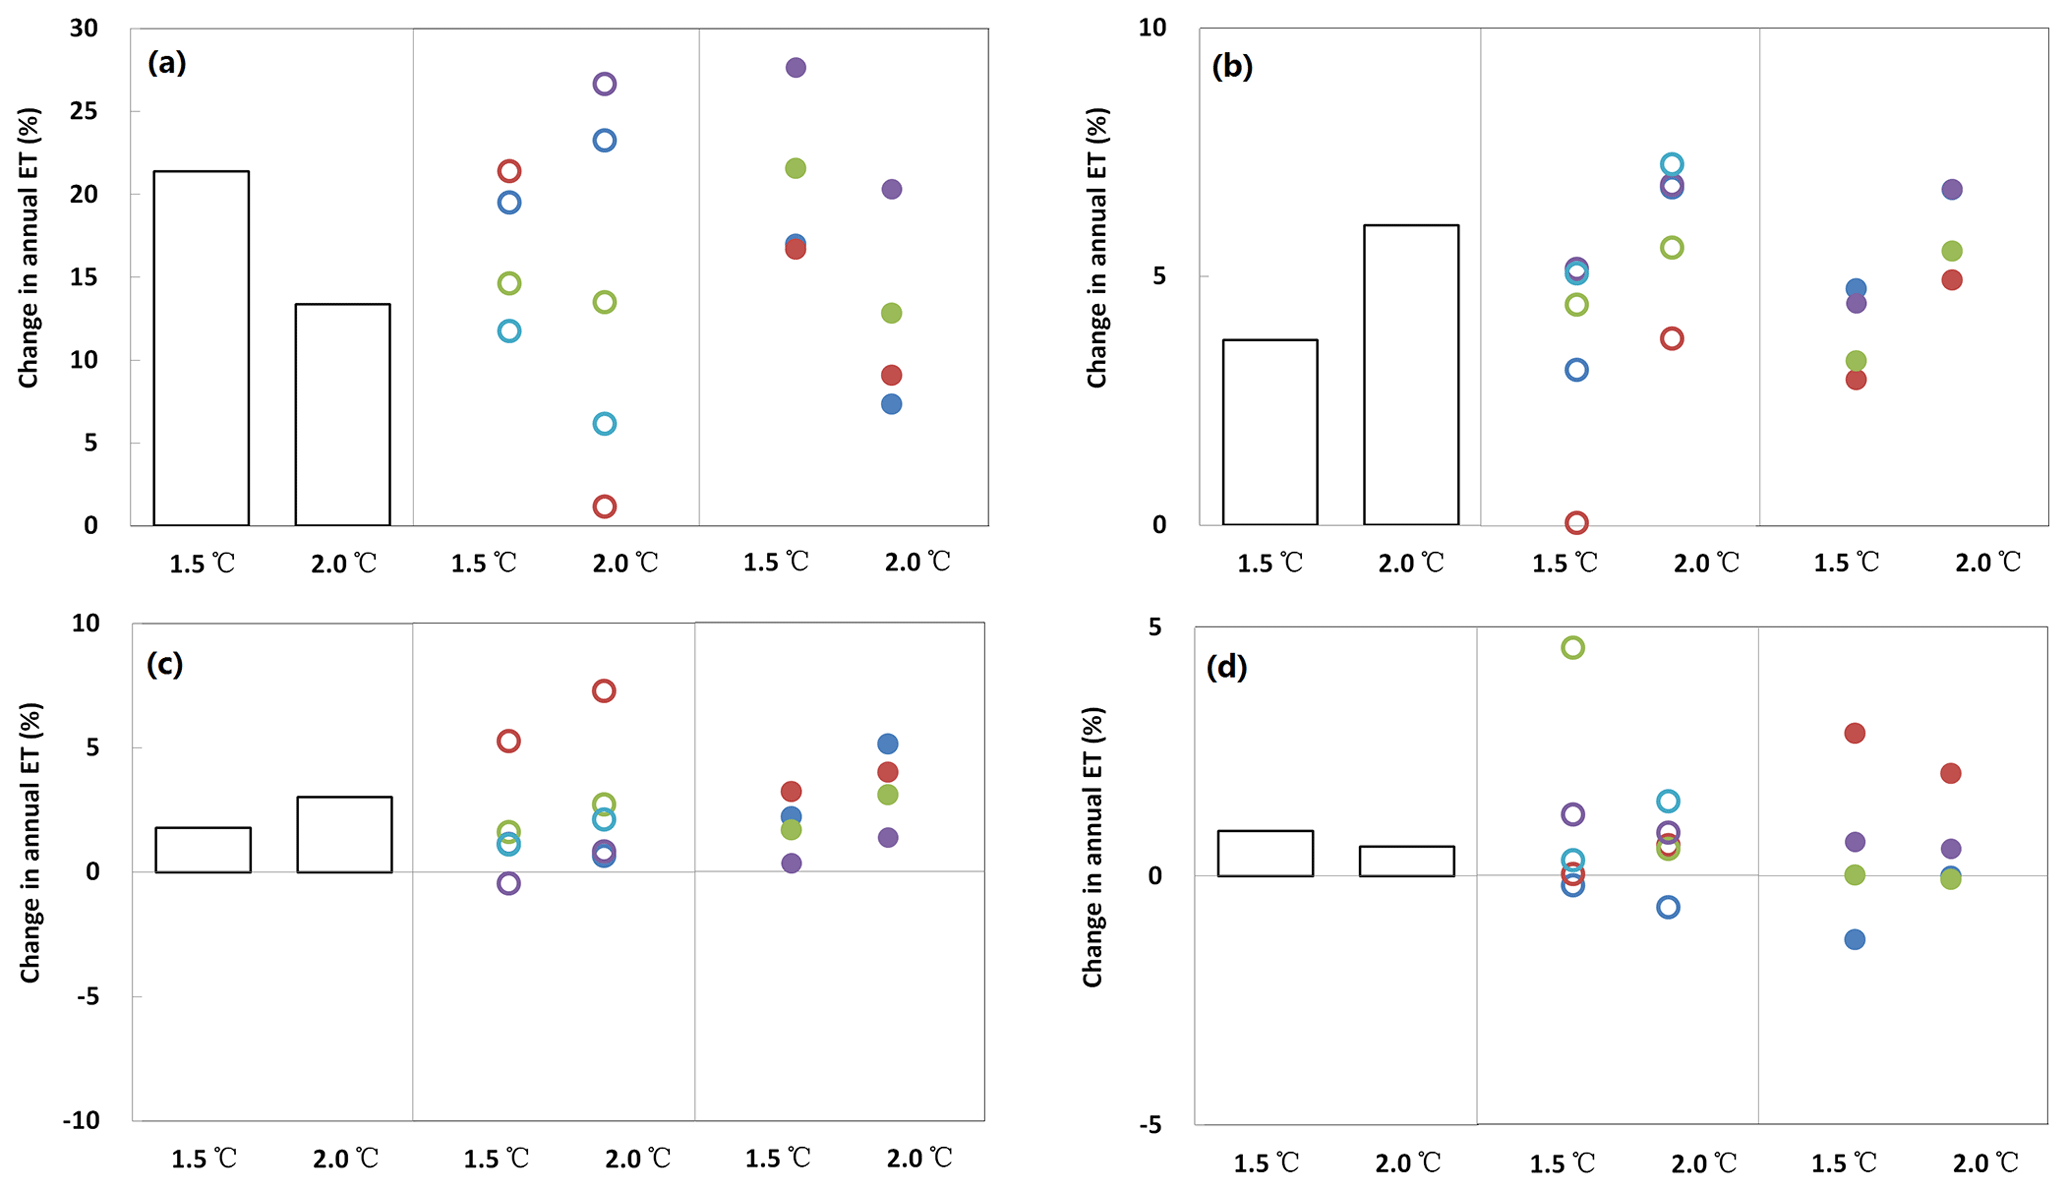
The four river basins in this study represent climate from dry to wet, and the response of runoff to precipitation change is also consistent with the previous findings (Chen et al., 2014; M. Liu et al., 2012; Ma et al., 2008) that more increase in precipitation needs to maintain runoff in drier basins. In this study, a smaller precipitation change (±3 %) would maintain a change in runoff of about 7 % and 8 % in the HHR and of about 0 % and −4 % in the FJR under 1.5 and 2.0 ∘C warming in the wetter area, while for the CBR in a semi-humid climate area, an increase in precipitation of about 5 % and 7 % would maintain an increase in runoff of about 8 % and 12 % under 1.5 and 2.0 ∘C warming. Moreover, for the SYR in the arid climate region, an increase in precipitation of about 5 % and 7 % accompanied a decrease in runoff of about −33 % and −25 %. Further analysis of ET simulation (Fig. 4) indicated a general increase in simulated ET in all four basins. However, the magnitude of the simulated change in ET varies across the basins; i.e., it is larger in the two basins in northern China than in the two basins in southern China. For the two rivers located in northern China, the simulated change in ET in the SYR shows an increase of 21 % and 13 %, while that of the CBR shows an increase of 4 % and 6 % under 1.5 and 2.0 ∘C warming, respectively, which implies the increase in simulated ET contributes most to the decrease in simulated annual runoff in the SYR.
5.2 Uncertainties in the quantitative assessment
This study followed the top-down methodology that was common used in the IPCC AR4 and AR5 WGII reports. Within the IPCC AR4 and AR5 water sectors, most hydrological projection studies use the precipitation and temperature downscaled from GCMs to drive hydrological models. This study adopted climate projection information derived from the Inter-Sectorial Impact Model Intercomparison Project (ISIMIP). Climate outputs are spatially interpolated into resolution and corrected using a trend-preserving bias-correction approach based on reanalysis dataset WFD. WFD were also the climate forcing to calibrate and validate of the SWAT hydrological model. There were multiple sources of uncertainties in climate change impact assessment in this study. Considering the challenge to address uncertainties for all sources, we only focus on the uncertainties constrained by GCMs and RCPs. Certain uncertainty sources were not investigated, such as the climate forcing, hydrological model structure and parameterization, and GCM structure.
Climate forcing is one of the major uncertainties in quantitative assessment of climate change impact (Müller Schmied et al., 2014). The complex terrain in the four river basins makes it difficult for WFD to reach very satisfactory agreement with station-based observation. The comparison of WFD with climate observations from meteorological stations showed reasonable agreement (Fig. S1 and Table S1), but there was both underestimation and overestimation in precipitation and temperature based on WFD. This could induce the uncertainty in the hydrological simulation, such as a difference in the ET simulation in SYR (Fig. S5). Furthermore, the validated SWAT is driven by downscaling climate data from GCMs for the baseline period and climate scenarios under 1.5 and 2.0∘C global warming, although the method used for estimating the projected changes in runoff could avoid systematic errors that the SWAT model would introduce in comparing the projection period with the baseline period. However, uncertainty in runoff simulation would spread to the runoff assessment.
Meanwhile, the application of SWAT in four river basins covering various climate and environmental conditions may result in uncertainty constrained by hydrological model structure and parameterization. Li et al. (2016) indicated that frozen soil meltwater accounted for about 20 % of river runoff during the flood season, while glacier meltwater contributed about 3 % in the SYR. There were a few cases which showed that SWAT could be used in snowmelt-dominated streamflow (Wang and Melesse, 2005; Tolston and Shoemaker, 2007; Grusson et al., 2015), and a few previous researches have indicated that the SWAT model did not adequately predict winter flows or snowmelt-dominated runoff in several watersheds (Peterson and Hamlett, 1998; Srivastava et al., 2006; Chanasyk et al., 2003; Benaman et al., 2005), which could be one reason for the low values of Ens for the SYR and the CBR in northern China with cold and dry winters. This also could induce the uncertainty in the river runoff simulation. Furthermore, the glacier meltwater process was not considered in SWAT-based simulations in this study, which would enlarge the uncertainty in runoff assessment.
Moreover, GCM selection would introduce uncertainty and influence the range of climate change impact assessment (Todd et al., 2011). The five GCMs used in this study captured 50 % to 90 % of the full range of future projections of 36 CMIP5 GCMs for temperature and 40 % to 90 % of the full range of future projections for precipitation in the four river basins (Fig. 1 in McSweeney and Jones, 2016). Furthermore, Liu et al. (2017) compared the changes in precipitation and temperature with five GCMs used in this study with those of another 19 CMIP5 GCMs. The results showed that the five GCMs covered the range of GCMs from CIMP5 well for global mean precipitation and temperature during 2020–2050 for RCP2.6 and RCP4.5. The information indicates the importance for reducing uncertainty associated with the choice of an applied GCM. At basin scale, prioritizing or weighting GCMs may be considered on the basis of detailed analyses of the ability of an individual GCM to represent a specific characteristic of the regional climate of interest (e.g., multi-annual or decadal variability).
The 2.0 ∘C warming scenario caused more substantial warming than the 1.5 ∘C warming scenario in all four studied basins. For the two basins located in northern China, the 0.5 ∘C global warming difference caused warming of 0.7 ∘C in the local ensemble mean temperature; however, in southern China, this difference caused warming of 0.6 ∘C. The 0.5 ∘C global warming difference will cause consistently wetter conditions, with projected precipitation amounts about 2 % greater for the four basins, although the projected changes in annual precipitation are minor in southern China compared with the increases in northern China.
The 2.0 ∘C warming caused a decrease of 8 % and 1 % in the simulated ensemble mean annual runoff in the SYR and the HHR compared with 1.5 ∘C warming, while it caused a 4 % increase in the CBR and the FJR. Climatic–hydrological interaction increases the complexity of changes in simulated annual runoff; however, the 0.5 ∘C global warming difference will coincide with a “wet-get-wetter” and “dry-get-drier” response in the two basins in northern China, and it will moderate the simulated annual runoff in the two basins in southern China. There is no shift in seasonal runoff pattern attributable to the effects of projected changes in climate under 1.5 and 2.0 ∘C warming; however, the monthly runoff percentage does change in the CBR and the HHR in some months.
The range of projected annual temperature is largest for the HHR and the SYR, with the uncertainties dominated mainly by the RCPs. Conversely, the ranges are smallest in the CBR and the FJR, with the uncertainties mainly constrained by the GCMs. Although the range in the projected change in annual precipitation is smaller in the two basins in southern China than in the two basins in northern China, the GCMs constitute the major source of the uncertainties in the projection of annual precipitation for the four river basins. Even under the limiting global warming thresholds of 1.5 and 2.0 ∘C, the uncertainties in the projected annual temperature at local or regional scale are dominated by either the GCMs or the RCPs; however, the uncertainties in local and regional projected annual precipitation are mainly constrained by GCM structure. The 0.5 ∘C global warming difference will generally reduce the uncertainties in the projected change in annual precipitation.
There is less uncertainty in the simulated change in runoff among all scenarios under 2.0 ∘C warming compared with 1.5 ∘C warming. This is consistent with the uncertainty in the projected annual precipitation. However, the uncertainties, dominated by the GCMs for the Chaobai River and constrained by the RCPs for the SYR and the FJR, limit confidence in the projected annual runoff for the four studied river basins.
The WATCH Forcing data (WFD) for the 20th century are currently not freely available; requests should be directed to enquiries@ceh.ac.uk. The climate model output datasets are from the Inter-Sectoral Impact Model Intercomparison Project (ISI-MIP) (https://doi.org/10.5880/PIK.2016.001; Hempel et al., 2013b). The DEM, land use, and soil data are currently not freely available; requests should be directed to westdc@lzb.ac.cn.
The supplement related to this article is available online at: https://doi.org/10.5194/hess-23-4219-2019-supplement.
HX and TJ developed the conception and design of the study. HX wrote the manuscript, ran hydrological modeling for the Shiyang River, and prepared all the figures and tables; LL processed climate data; YW ran hydrological modeling for the Fujiang River and SW ran hydrological modeling for the Huaihe River; YH and JM ran hydrological modeling for the Chaobai River; all the authors contributed to the writing and the interpretation of the results.
The authors declare that they have no conflict of interest.
We wish to thank the ISIMIP, which made the data of the five GCMs available.
This research has been supported by the National Key R&D Program of China (grant no. 2016YFE0102400) and the climatic change project of the China Meteorological Administration (grant no. CCSF201924).
This paper was edited by Alexander Gelfan and reviewed by David Post and three anonymous referees.
Abbaspour, K., Vejdani, M., and Haghighat, S.: SWAT-CUP calibration and uncertainty programs for SWAT, in: Proceedings of the MODSIM 2007 International Congress on Modelling and Simulation, Christchurch, New Zealand, 10–13 December 2007, edited by: Oxley, L. and Kulasiri, D., Modelling and Simulation Society of Australia and New Zealand, Christchurch, New Zealand, 74–80, 2007.
Arnold, J. G., Moriasi, D. N., Gassman, P. W., Abbaspour, K. C., White, M. J., Srinivasan, R., Santhi, C., Harmel, R. D., Van Griensven, A., Van Liew, M. W., Kannan, N., and Jha, M. K.: SWAT: model use, calibration and validation, T. ASABE, 55, 1491–1508, 2012.
Benaman, J., Shoemaker, C. A., and Haith, D. A.: Calibration and validation of Soil and Water Assessment Tool on an agricultural watershed in upstate New York, J. Hydrol. Eng., 10, 363–374, 2005.
Chanasyk, D. S., Mapfumo, E., and Willms, W.: Quantification and simulation of surface runoff from fescue grassland watersheds, Agr. Water Manage., 59, 137–153, 2003.
Chen, J., Xia, J., Zhao, C., Zhang, S., Fu, G., and Ning, L.: The mechanism and scenarios of how mean annual runoff varies with climate change in Asian monsoon areas, J. Hydrol., 517, 595–606, https://doi.org/10.1016/j.jhydrol.2014.05.075, 2014.
Chen, J., Gao, C., Zeng, X., Xiong, M., Wang, Y., Jing, C., Krysanova, V., Huang, J., Zhao, N., and Su, B.: Assessing changes of river discharge under global warming of 1.5 ∘C and 2 ∘C in the upper reaches of the Yangtze River Basin: Approach by using multiple-GCMs and hydrological models, Quatern. Int., 453, 63–67, https://doi.org/10.1016/j.quaint.2017.01.017, 2017.
Chen, X. and Zhou, T.: Uncertainty in crossing time of 2 ∘C warming threshold over China, Chin. Sci. Bull., 61, 451–1459, https://doi.org/10.1007/s11434-016-1166-z, 2016.
Compiling Committee for “Third National Assessment Report for Climate Change”: Third National Assessment Report for Climate Change, Science Press, Beijing, China, 2015.
Essou, R. C., Sabarly, F., Lucas-Picher, P., Brissette, F., and Poulin, A.: Can precipitation and temperature from meteorological reanalyses be used for hydrological modeling?, J. Hydrometeorol., 17, 1929–1950, https://doi.org/10.1175/JHM-D-15-0138.1, 2016.
FAO/IIASA/ISRIC/ISS-CAS/JRC: Harmonized World Soil Database (version 1.0). FAO, Rome, Italy and IIASA, Laxenburg, Austria, 2008.
Gao, Z., Long, D., Tang, G., Zeng, C., Huang, J., and Hong, Y.: Assessing the potential of satellite-based precipitation estimates for flood frequency analysis in ungauged or poorly gauged tributaries of China's Yangtze River basin, J. Hydrol., 550, 478–496, https://doi.org/10.1016/j.jhydrol.2017.05.025, 2017.
Gassman, P. W., Reyes, M. R., Green, C. H., and Arnold, J. G.: The soil and water assessment tool: historical development, applications and future research directions, T. ASABE, 50, 1211–1250, 2007.
Gosling, N., Zaherpour, J., Mount, N. J., Hattermann, F. F., Dankers, R., Arheimer, B., Breuer, L., Ding, J., Haddeland, I., Kumar, R., Kundu, D., Liu, J., Van Griensven, A., Veldkamp, T. I. E., Vetter, T., Wang, X., and Zhang, X. X.: A comparison of changes in river runoff from multiple global and catchment-scale hydrological models under global warming scenarios of 1 ∘C, 2 ∘C and 3 ∘C, Clim. Change, 141, 577–595, https://doi.org/10.1007/s10584-016-1773-3, 2017.
Green, C. and van Griensven, A.: Autocalibration in Hydrologic Modeling: Using SWAT2005 in Small-Scale Watersheds, Environ. Modell. Softw., 23, 422–434, https://doi.org/10.1016/ j.envsoft.2007.06.002, 2008.
Grusson, Y., Sun, X., Gascoin, S., Sauvage, S., Raghavan, S., Anctil, F., and Sachez-Perez, J. M.: Assessing the capability of the SWAT model to simulate snow, snow melt and streamflow dynamics over an alpine watershed, J. Hydrol., 531, 574–588, https://doi.org/10.1016/j.jhydrol.2015.10.070, 2015.
Haddeland, I., Heinke, J., Biemans, H., Eisner, S., Flörke, M., Hanasaki, N., Konzmann, M., Ludwig, F., Masaki, Y., Schewe, J., Stacke, T., Tessler, N. Z., Wada, Y., and Wisser, D.: Global water resource affected by human interventions and climate change, P. Natl. Acad. Sci. USA, 111, 3251–3256, https://doi.org/10.1073/pnas.1222475110, 2014.
Hao, Y., Ma, J., Chen, J., Wang, D., Wang, Y., and Xu, H.: Assessment of Changes in Water Balance Components under 1.5∘ and 2.0∘ Global Warming in Transitional Climate Basin by Multi-RCPs and Multi-GCMs Approach, Water, 10, 1863, https://doi.org/10.3390/w10121863, 2018.
Hattermann, F., Krysanova, V., Gosling, S. N., Danker, R., Daggupati, P., Donnelly, C., Flörke, M., Huang, S., Motovilov, Y., Buda, S., Yang, T., Müller, C., Leng, G., Tang, Q., Portmann, F. T., Hagemann, S., Gerten, D., Wada, Y., Masaki, Y., Alemayehu, T., Satoh, Y., and Samaniego, L.: Cross-scale intercomparison of climate change impacts simulated by regional and global hydrological models in eleven large river basins, Clim. Change, 141, 561–576, https://doi.org/10.1007/s10584-016-1829-4, 2017.
Hempel, S., Frieler, K., Warszawski, L., Schewe, J., and Piontek, F.: A trend-preserving bias correction – the ISI-MIP approach, Earth Syst. Dynam., 4, 219–236, https://doi.org/10.5194/esd-4-219-2013, 2013a.
Hempel, S., Frieler, K., Warszawski, L., Schewe, J., and Piontek, F: Bias corrected GCM input data for ISIMIP Fast Track, GFZ Data Services, https://doi.org/10.5880/PIK.2016.001, 2013b.
Huber, V., Schellnhuber, H. J., Arnell, N. W., Frieler, K., Friend, A. D., Gerten, D., Haddeland, I., Kabat, P., Lotze-Campen, H., Lucht, W., Parry, M., Piontek, F., Rosenzweig, C., Schewe, J., and Warszawski, L.: Climate impact research: beyond patchwork, Earth Syst. Dynam., 5, 399–408, https://doi.org/10.5194/esd-5-399-2014, 2014.
IPCC: Climate change 2013: the physical science basis. Contribution of working group I to the fifth assessment report of the IPCC, Cambridge University Press, New York, USA, 2013.
IPCC: Climate change 2014: impact, adaptation, and vulnerability. Part A: Global and sectoral aspects. Contribution of working group II to the fifth assessment report of the IPCC, Cambridge University Press, Cambridge, UK, 2014.
Li, Z., Qi, F., Wang, Q. J., Yong, S., Cheng, A., and Li, J.: Contribution from frozen soil meltwater to runoff in an in-land river basin under water scarcity by isotopic tracing in northwestern China, Global Planet. Change, 136, 41–51, https://doi.org/10.1016/j.gloplacha.2015.12.002, 2016.
Liu, L., Jiang, T., Xu, J., and Luo, Y.: Research on the hydrological processes using multi-GCMs and multi-scenarios, J. Hydral. Eng., 43, 1413–1421, 2012.
Liu, L., Xu, H., Wang, Y., and Jiang, T.: Impacts of 1.5 and 2 ∘C global warming on water availability and extreme hydrological events in Yiluo and Beijiang River catchments in China, Clim. Change, 145, 1–14, https://doi.org/10.1007/s10584-017-2072-3, 2017.
Liu, L., Jiang, T., Xu, H., and Wang, Y.: Potential threats from variations of hydrological parameters to the Yellow River and Pearl River Basins in China over the Next 30 Years,Water, 10, 883, https://doi.org/10.3390/w10070883, 2018.
Liu, M., Tian, H., Lu, C., Xu, X., Chen, G., and Ren, W.: Effects of multiple environment stresses on evapotranspiration and runoff over eastern China, J. Hydrol., 426–427, 39–54, https://doi.org/10.1016/j.jhydrol.2012.01.009, 2012.
Ma, Z., Kang, S., Zhang, L., Tong, L., and Su, X.: Analysis of impacts of climate variability and human activity on streamflow for a river basin in arid region of northwest China, J. Hydrol., 352, 239–249, https://doi.org/10.1016/j.jhydrol.2007.12.022, 2008.
McSweeney, C. F. and Jones, R. G.: How representative is the spread of climate projections from the 5 CMIP5 GCMs used in ISI-MIP?, Climate. Serv., 1, 24–29, https://doi.org/10.1016/j.cliser.2016.02.001, 2016.
Moriasi, D. N., Arnold, J. G., van Liew, M. W., Bingner, R., Harmel, R. D., and Veith, T. L.: Model evaluation guidelines for systematic quantification of accuracy in watershed simulations, T. ASABE, 50, 885–900, 2007.
Müller Schmied, H., Eisner, S., Franz, D., Wattenbach, M., Portmann, F. T., Flörke, M., and Döll, P.: Sensitivity of simulated global-scale freshwater fluxes and storages to input data, hydrological model structure, human water use and calibration, Hydrol. Earth Syst. Sci., 18, 3511–3538, https://doi.org/10.5194/hess-18-3511-2014, 2014.
Müller Schmied, H., Adam, L., Eisner, S., Fink, G., Flörke, M., Kim, H., Oki, T., Portmann, F. T., Reinecke, R., Riedel, C., Song, Q., Zhang, J., and Döll, P.: Variations of global and continental water balance components as impacted by climate forcing uncertainty and human water use, Hydrol. Earth Syst. Sci., 20, 2877–2898, https://doi.org/10.5194/hess-20-2877-2016, 2016.
Peterson, J. R. and Hamlet, J. M.: Hydrologic calibration of the SWAT model in a watershed containing fragipan soils, J. Am Water Resour. As., 34, 531–544, 1998.
Schellnhuber, H. J., Frieler, K., and Kabat, P.: The elephant, the blind, and the intersectoral intercomparison of climate impacts, P. Natl. Acad. Sci. USA, 111, 3225–3227, https://doi.org/10.1073/pnas.1321791111, 2014.
Schewe, J., Heinke, J., Gerten, D., Haddeland, I., Arnel, N. W., Clark, D. B., Dankers, R., Eisner, S., Fekete, B. M., Colón-González F. J., Gosling S. N., Kim, H., Liu, X., Masaki, Y., Portmann, D. T., Satoh, Y., Stacke, T., Tang, Q., Wada, Y., Wisser, D., Albrecht, T., Frieler, K., Piontek, F., Warszawski, L., and Kabat, P.: Multimodel assessment of water scarcity under climate change, P. Natl. Acad. Sci. USA, 111, 3245–3250, https://doi.org/10.1073/pnas.1222460110, 2014.
Schleussner, C.-F., Lissner, T. K., Fischer, E. M., Wohland, J., Perrette, M., Golly, A., Rogelj, J., Childers, K., Schewe, J., Frieler, K., Mengel, M., Hare, W., and Schaeffer, M.: Differential climate impacts for policy-relevant limits to global warming: the case of 1.5 ∘C and 2 ∘C, Earth Syst. Dynam., 7, 327–351, https://doi.org/10.5194/esd-7-327-2016, 2016.
Srivastava, P., McNair, J. N., and Johnson, T. E.: Comparison of process-based and artificial neural network approaches for streamflow modeling in an agricultural watershed, J. Am Water Resour. As., 42, 545–563, 2006.
Su, B., Huang, J., Zeng, X., Gao, C., and Jiang, T.: Impacts of climate change on streamflow in the upper Yangtze River basin, Clim. Change, 141, 533–546, https://doi.org/10.1007/s10584-016-1852-5, 2017.
Todd, M. C., Taylor, R. G., Osborn, T. J., Kingston, D. G., Arnell, N. W., and Gosling, S. N.: Uncertainty in climate change impacts on basin-scale freshwater resources – preface to the special issue: the QUEST-GSI methodology and synthesis of results, Hydrol. Earth Syst. Sci., 15, 1035–1046, https://doi.org/10.5194/hess-15-1035-2011, 2011.
Tolson, B. A. and Shoemaker, C. A.: Cannonsville reservoir watershed SWAT2000 model development, calibration, and validation, J. Hydrol., 337, 68–86, 2007.
UNFCCC: Decision 1/CP.21, The Paris Agreement, United Nations, 2015.
Wang, S., Xu, H., Liu, L., Wang, Y., and Song, A.: Projection of the Impacts of Global Warming of 1.5 and 2.0 ∘C on Runoff in the Upper-Middle Reaches of Huaihe River Basin, J. Nat. Resour., 33, 1966–1978, 2018 (in Chinese).
Wang, X. and Melesse, A. M.: Evaluation of the SWAT model's snowmelt hydrology in a northwestern Minnesota watershed, T. ASABE, 48, 1359–1376, 2005.
Warszawski, L., Frieler, K., Huber, V., Piontek, F., Serdeczny, O., and Schewe, J.: The Inter-Sectoral Impact Model Intercomparison project (ISI–MIP): project framework, P. Natl. Acad. Sci. USA, 111, 3228–3232, https://doi.org/10.1073/pnas.1312330110, 2014.
Weedon, G. P., Gomes, S., Viterbo, P., Österle, H., Adam, J. C., Bellouin, N., Boucher, O., and Best, M.: The WATCH forcing data 1958–2001: a meteorological forcing dataset for land surface- and hydrological, WATCH Technical Report No. 22, 1–41, available at: http://www.eu-watch.org (last access: 27 September 2019), 2010.
Xie, P., Wu, Z., Sang Y., Gu, H., Zhao, Y., and Singh, V. P.: Evaluation of the significance of abrupt changes in precipitation and runoff process in China, J. Hydrol., 560, 451–460, https://doi.org/10.1016/j.jhydrol.2018.02.036, 2018.
Xu, H., Taylor, R., Kingston, D., Jiang, T., Thompson, J., and Todd, M.: Hydrological modeling of River Xiangxi using SWAT2005: a comparison of model parameterizations using station and gridded meteorological observations, Quatern. Int., 226, 54–59, https://doi.org/10.1016/j.quaint.2009.11.037, 2010.
Xu, K., Milliman, J. D., and Xu, H.: Temporal trend of precipitation and runoff in major Chinese Rivers since 1951, Global Planet. Change, 73, 219–232, https://doi.org/10.1016/j.gloplacha.2010.07.002, 2010.
Xu, X., Yang, D., Yang, H., and Lei, H.: Attribution analysis based on the Budyko hypothesis for detecting the dominant cause of runoff decline in Haihe basin, J. Hydrol., 510, 530–540, https://doi.org/10.1016/j.jhydrol.2013.12.052, 2014.
Yang, Y. and Tian, F.: Abrupt change of runoff and its major driving factors in Haihe River Catchment, China, J. Hydrol., 374, 373–383, https://doi.org/10.1016/j.jhydrol.2009.06.040, 2009.
Zhang, W. and Villarini, G.: Heavy precipitation is highly sensitive to the magnitude of future warming, Clim. Change, 45, 249–257, https://doi.org/10.1007/s10584-017-2079-9, 2017.
Zhang, W., Pan, S., Cao, L., Cai, X., Zhang, K., Xu, Y., and Xu, W.: Changes in extreme climate events in eastern China during 1960–2013: A case study of the Huaihe River Basin, Quatern. Int., 380–381, 22–34, https://doi.org/10.1016/j.quaint.2014.12.038, 2015.
Zhu, Q. and Li, Y.: Environmental Restoration in the Shiyang River Basin, China: Conservation, reallocation and more efficient use of water, Aquat. Procedia., 2, 24–34, https://doi.org/10.1016/j.aqpro.2014.07.005, 2014.