the Creative Commons Attribution 4.0 License.
the Creative Commons Attribution 4.0 License.
 | 18 Oct 2019
Assessment of simulated soil moisture from WRF Noah, Noah-MP, and CLM land surface schemes for landslide hazard application
Qiang Dai
Dawei Han
Ningsheng Chen
Binru Zhao
This study assesses the usability of Weather Research and Forecasting (WRF) model simulated soil moisture for landslide monitoring in the Emilia Romagna region, northern Italy, during the 10-year period between 2006 and 2015. In particular, three advanced land surface model (LSM) schemes (i.e. Noah, Noah-MP, and CLM4) integrated with the WRF are used to provide detailed multi-layer soil moisture information. Through the temporal evaluation with the single-point in situ soil moisture observations, Noah-MP is the only scheme that is able to simulate the large soil drying phenomenon close to the observations during the dry season, and it also has the highest correlation coefficient and the lowest RMSE at most soil layers. It is also demonstrated that a single soil moisture sensor located in a plain area has a high correlation with a significant proportion of the study area (even in the mountainous region 141 km away, based on the WRF-simulated spatial soil moisture information). The evaluation of the WRF rainfall estimation shows there is no distinct difference among the three LSMs, and their performances are in line with a published study for the central USA. Each simulated soil moisture product from the three LSM schemes is then used to build a landslide prediction model, and within each model, 17 different exceedance probability levels from 1 % to 50 % are adopted to determine the optimal threshold scenario (in total there are 612 scenarios). Slope degree information is also used to separate the study region into different groups. The threshold evaluation performance is based on the landslide forecasting accuracy using 45 selected rainfall events between 2014 and 2015. Contingency tables, statistical indicators, and receiver operating characteristic analysis for different threshold scenarios are explored. The results have shown that, for landslide monitoring, Noah-MP at the surface soil layer with 30 % exceedance probability provides the best landslide monitoring performance, with its hit rate at 0.769 and its false alarm rate at 0.289.
- Article
(4364 KB) - Full-text XML
- BibTeX
- EndNote


Landslide is a recurring geological hazard during rainfall seasons, which causes massive destruction, loss of life, and economic damage worldwide (Klose et al., 2014). The accurate prediction and monitoring of the spatio-temporal occurrence of the landslide is key to preventing and reducing casualties and damage to properties and infrastructure. One of the most widely adopted methods for landslide prediction is based on rainfall threshold and relies on building the rainfall intensity–duration curve using the information from past landslide events (Chae et al., 2017). However, such a method is in many cases insufficient for landslide hazard assessment (Posner and Georgakakos, 2015), because in addition to rainfall, the initial soil moisture condition is one of the main triggering factors of the events (Glade et al., 2000; Crozier, 1999; Tsai and Chen, 2010; Hawke and McConchie, 2011; Bittelli et al., 2012; Segoni et al., 2018b; Valenzuela et al., 2018; Bogaard and Greco, 2018).
For landslide applications, one potential soil moisture estimation method is through satellite remote sensing technologies. Although such technologies have been improved significantly over the past decade, their retrieving accuracy is still largely affected by frozen soil conditions (Zhuo et al., 2015a) and dense vegetation coverages, particularly in mountainous regions (Temimi et al., 2010); furthermore, the acquired data only cover the top few centimetres of soil. Although the more recently launched satellites such as Sentinel-1 (1 km and 3 d resolution) has shown some promising performance of soil moisture estimation (Gao et al., 2017; Paloscia et al., 2013), its availability only covers the recent years (Geudtner et al., 2014). Those disadvantages restrict the full utilisation of satellite soil moisture products for landslide monitoring applications as discussed in our previous study (Zhuo et al., 2019). In Zhuo et al. (2019), it is discussed that both the temporal and spatial resolutions of the ESA CCI satellite soil moisture product (Dorigo et al., 2017) is too coarse for landslide applications, and its data are mostly only available after the year 2002. Moreover, the shallow depth soil moisture observation from the satellite hinders the accuracy of landslide predictions. Therefore, other alternative soil moisture estimation methods need to be explored.
One emerging area relies on modelling. Some studies have used modelled soil moisture data for landslide applications (Ponziani et al., 2012; Ciabatta et al., 2016; Zhao et al., 2019a, b). However, to our knowledge, there is a lack of existing studies using modelled soil moisture from state-of-the-art land surface models (LSMs) for landslide studies, such as the Noah LSM (Ek et al., 2003) and the Community Land Model (CLM) (Oleson et al., 2010). LSMs describe the interactions between the atmosphere and the land surface by simulating exchanges of momentum, heat, and water within the Earth system (Maheu et al., 2018). They are capable of simulating the most important subsurface hydrological processes (e.g. soil moisture) and can be integrated with the advanced numerical weather prediction (NWP) system like WRF (Weather Research and Forecasting) (Skamarock et al., 2008) for comprehensive soil moisture estimations (i.e. through the surface energy balance, the surface layer stability and the water balance equations) (Greve et al., 2013). NWP-based (i.e. with integrated LSM) soil moisture estimations have many advantages. For instance their spatial and temporal resolution can be set at different scales depending on the input datasets to fit various application requirements; their coverage is global, and the estimated soil moisture data cover multiple soil layers (from the shallow surface layer to deep root-zones); and a number of globally covered data products can provide the necessary boundary and initial conditions for running the models. Soil moisture estimated through such an approach has been widely recognised and demonstrated in many studies, which cover a broad range of applications from hydrological modelling (Srivastava et al., 2013a, 2015), drought studies (Zaitchik et al., 2013), and flood investigations (Leung and Qian, 2009), to regional weather prediction (Stéfanon et al., 2014). Therefore, NWP-based soil moisture datasets could provide valuable information for landslide applications. However, to our knowledge, relevant research has never been carried out.
The aim of this study is hence to evaluate the usefulness of NWP-modelled soil moisture for landslide monitoring. Here the advanced WRF model (version 3.8) is adopted, because it offers numerous physics options such as micro-physics, surface physics, atmospheric radiation physics, and planetary boundary layer physics (Srivastava et al., 2015), and it can be integrated with a number of LSM schemes, each varying in physical parameterisation complexities. So far there is limited literature comparing the soil moisture accuracy of different LSMs options in the WRF model. Therefore, in this study, we select three of the WRF's most advanced LSM schemes (i.e. Noah; Noah-Multiparameterization, here Noah-MP; and CLM4) to compare their soil moisture performance for landslide hazard assessment. Furthermore, since all three schemes can provide multi-layer soil moisture information, it is useful to include all those simulations for the comparison so that the optimal depth of soil moisture could be determined for the landslide monitoring application. In order to compare with the performance of our previous study on using the satellite soil moisture data (Zhuo et al., 2019), the same study area, Emilia Romagna, is used here. The study period covers 10 years from 2006 to 2015 to include a long-term record of landslide events. In addition, because slope angle is one of the major factors controlling the stability of the slope, it is hence used in this study to divide the study area into several slope groups, so that a more accurate landslide prediction model could be built.
The description of the study area and the datasets used are included in Sect. 2. Methodologies regarding the WRF model, the related LSM schemes and the adopted landslide threshold evaluation approach are provided in Sect. 3. Section 4 shows the WRF soil moisture evaluation results against the in situ observations, and the WRF rainfall evaluations over the whole study area. Section 5 covers the comparison results of the WRF-modelled soil moisture products for landslide applications. The discussions and conclusions of the study are included in Sects. 6 and 7, respectively.
2.1 Study area
The study area is in the Emilia Romagna region, northern Italy (Fig. 1). Its population density is high. The region has high mountainous areas in the S–SW, and wide plain areas towards the NE, with a large elevation difference (i.e. 0 to 2125 m) across 50 km distance from the north to the south (Rossi et al., 2010). The region has a mild Mediterranean climate with distinct wet and dry seasons (i.e. dry season between May and October, and wet season between November and April). The study area tends to be affected by landslide events easily, with approximately one-fifth of the mountainous zone covered by active or dormant landslide deposits (Bertolini et al., 2005). Rainfall is by far the primary triggering factor of landslides in the region, followed by snow melting: shallow landslides are mainly triggered by short but exceptionally intense rainfall, and long and moderate rainfall events over saturated conditions, while deep-seated landslides have a more complex response to rainfall and are mainly caused by moderate but exceptionally prolonged (even up to 6 months) periods of rainfall (Segoni et al., 2015). Due to the abundant data available in the region, several studies on regional scale landslide prediction and early warning have been published (Berti et al., 2012; Martelloni et al., 2012; Lagomarsino et al., 2013, 2015; Segoni et al., 2018a, b). Interested readers can refer to those studies for more information.
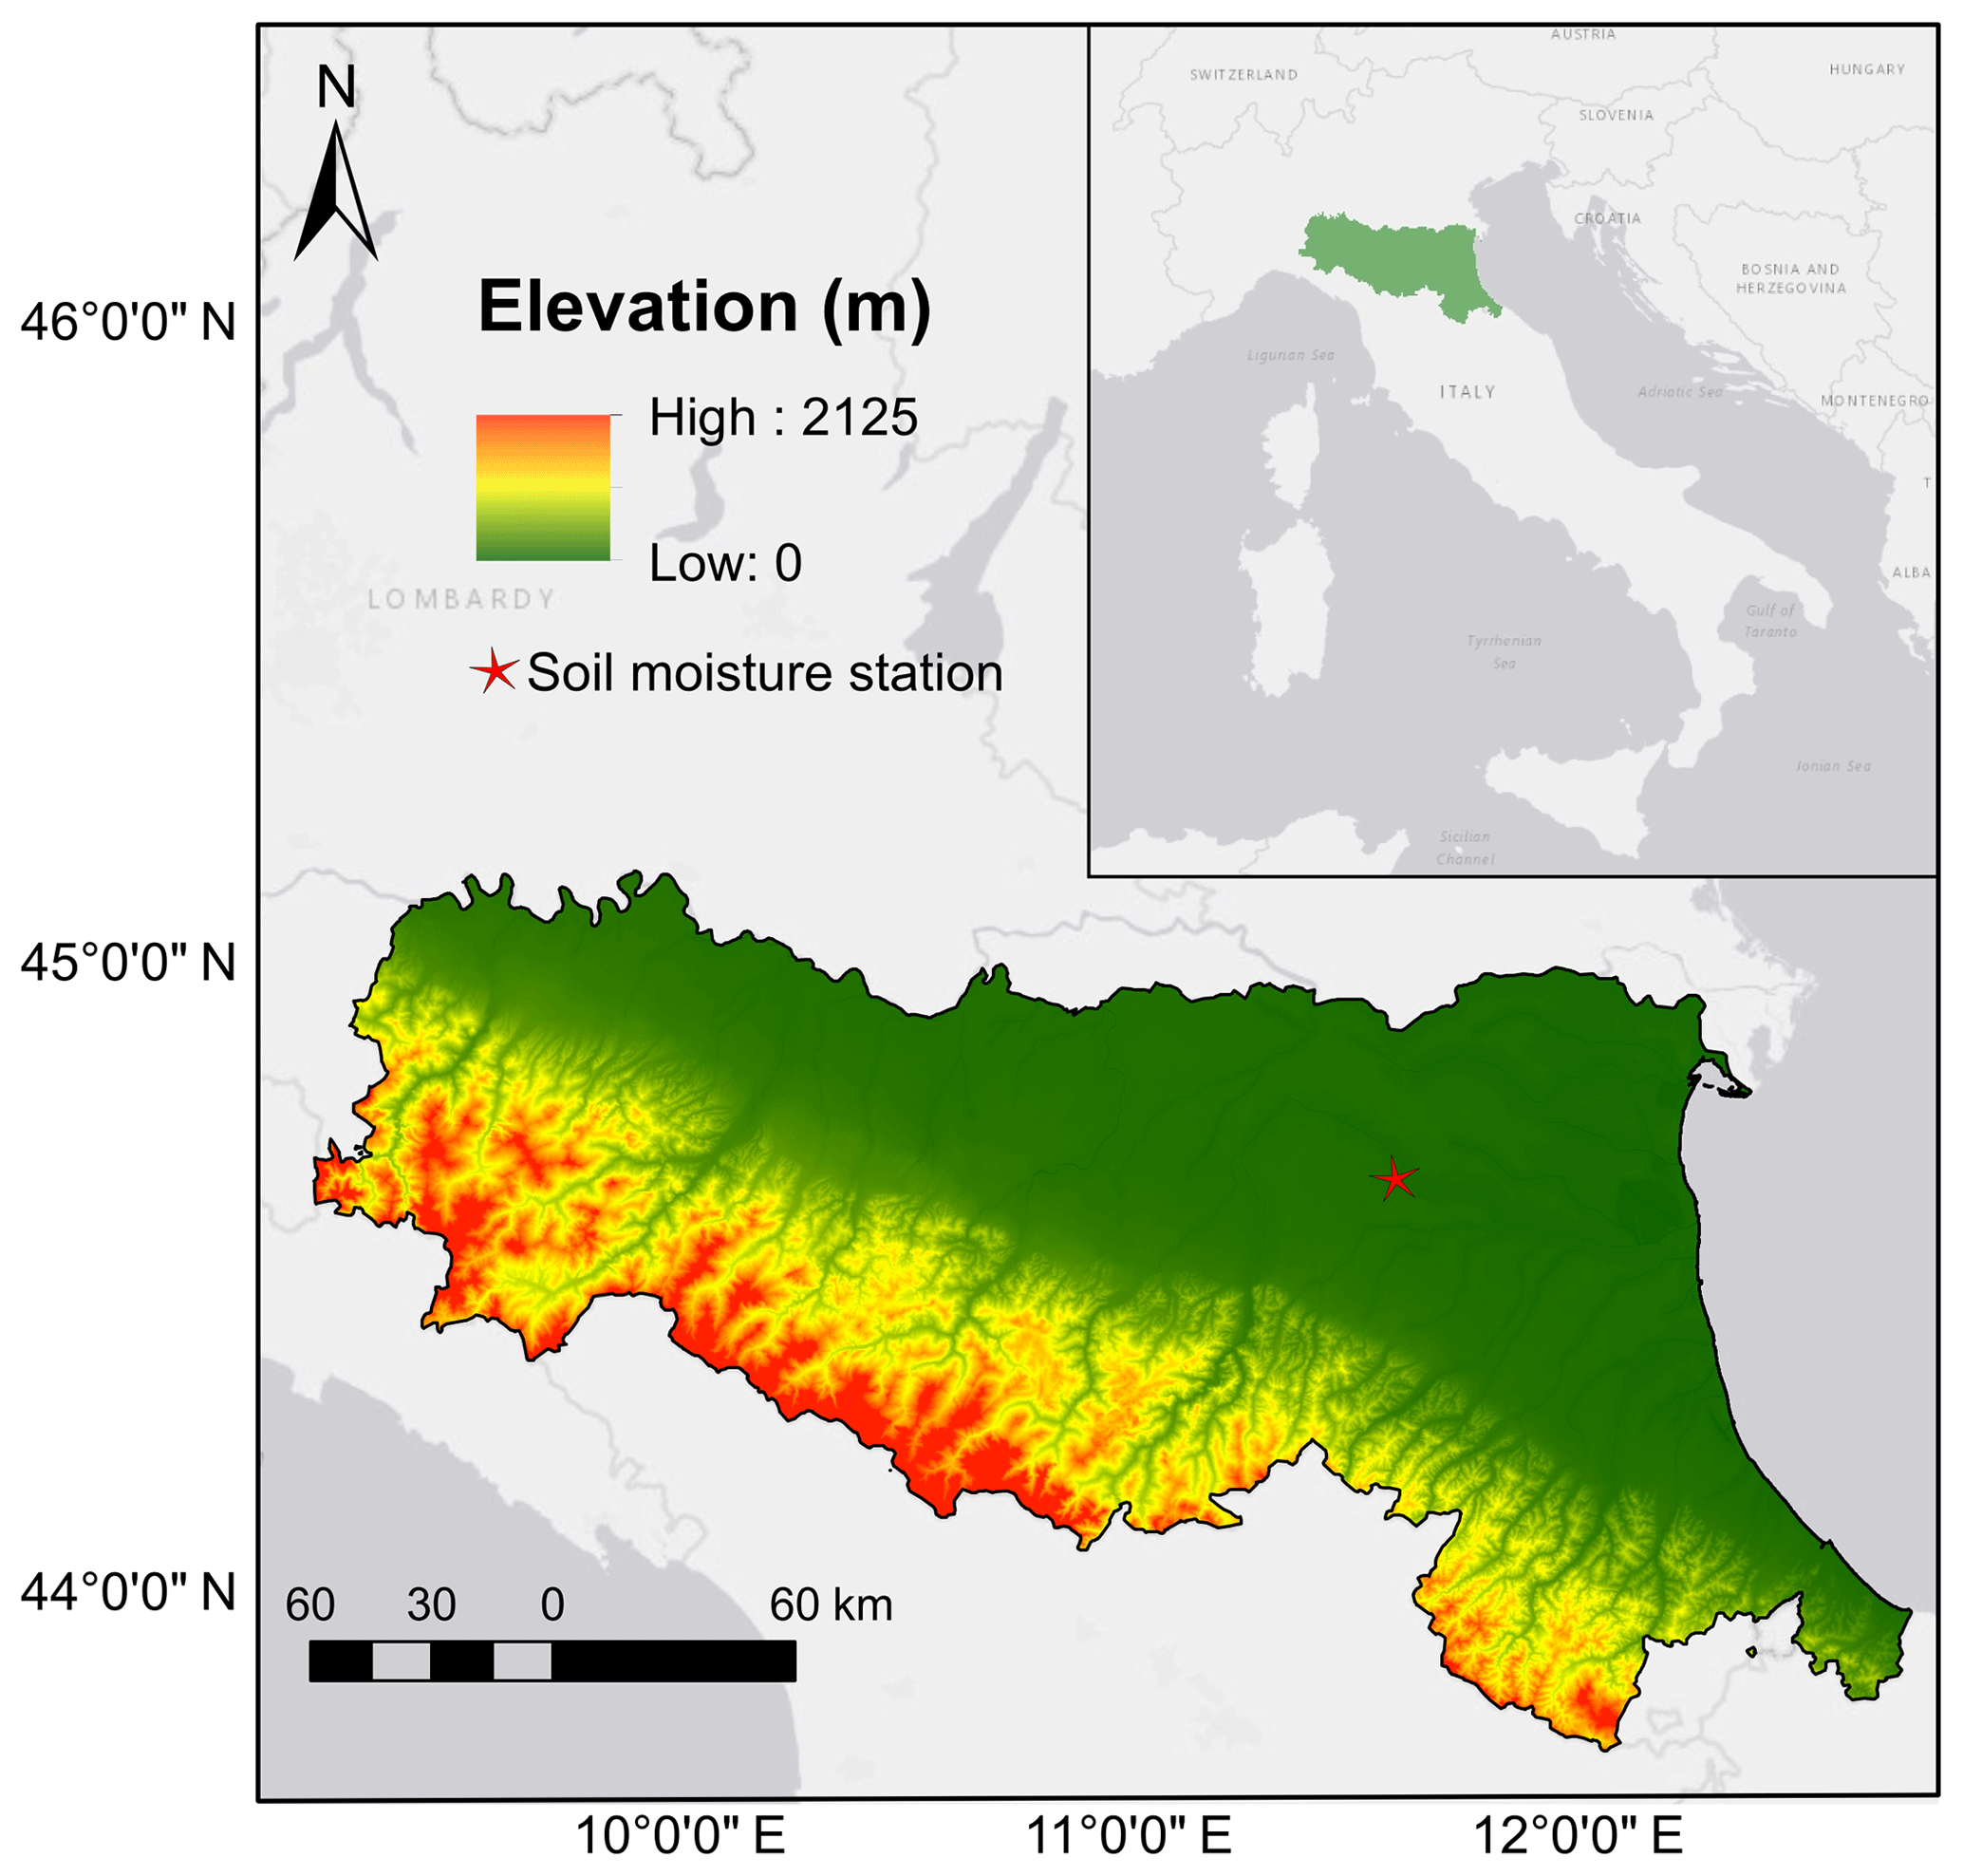
Figure 1Location of the Emilia Romagna Region with elevation map and in situ soil moisture station also shown. The copyright of the background map belongs to Esri (Light Gray Canvas Basemap).
2.2 Selection of the landslide events
The landslide catalogue is collected from the Emilia Romagna Geological Survey (Berti et al., 2012). The information included in the catalogue are location, date of occurrence, the uncertainty of the date of occurrence, landslide characteristics (dimensions, type, and material), triggering factors, damage, casualties, and references. Unfortunately, many pieces of information are missing from the records in many cases. In order to organise the data in a more systematic way so that only the relevant events are retained, a two-step event selection procedure is initially carried out based on (1) rainfall-induced events only; and (2) high spatial-temporal accuracy (exact date and coordinates). Finally, a revision of the information about the type of slope instabilities such as landslide, debris flow, and rockfall as well as the characteristics of the affected slope (natural or artificial) is also carried out using the selected records (Valenzuela et al., 2018). The catalogue period used in this study covers between 2006 and 2015, which is in accordance with the WRF model run. After filtering the data records, only one-fifth of them (i.e. 157 events) is retained. The retained events are shown as single circles in Fig. 2, with slope information (calculated through the digital elevation model – DEM – data) also presented in the background. It can be seen that the spatial distribution of the occurred landslide events is very heterogeneous, with nearly all of them occurring in the hilly regions.
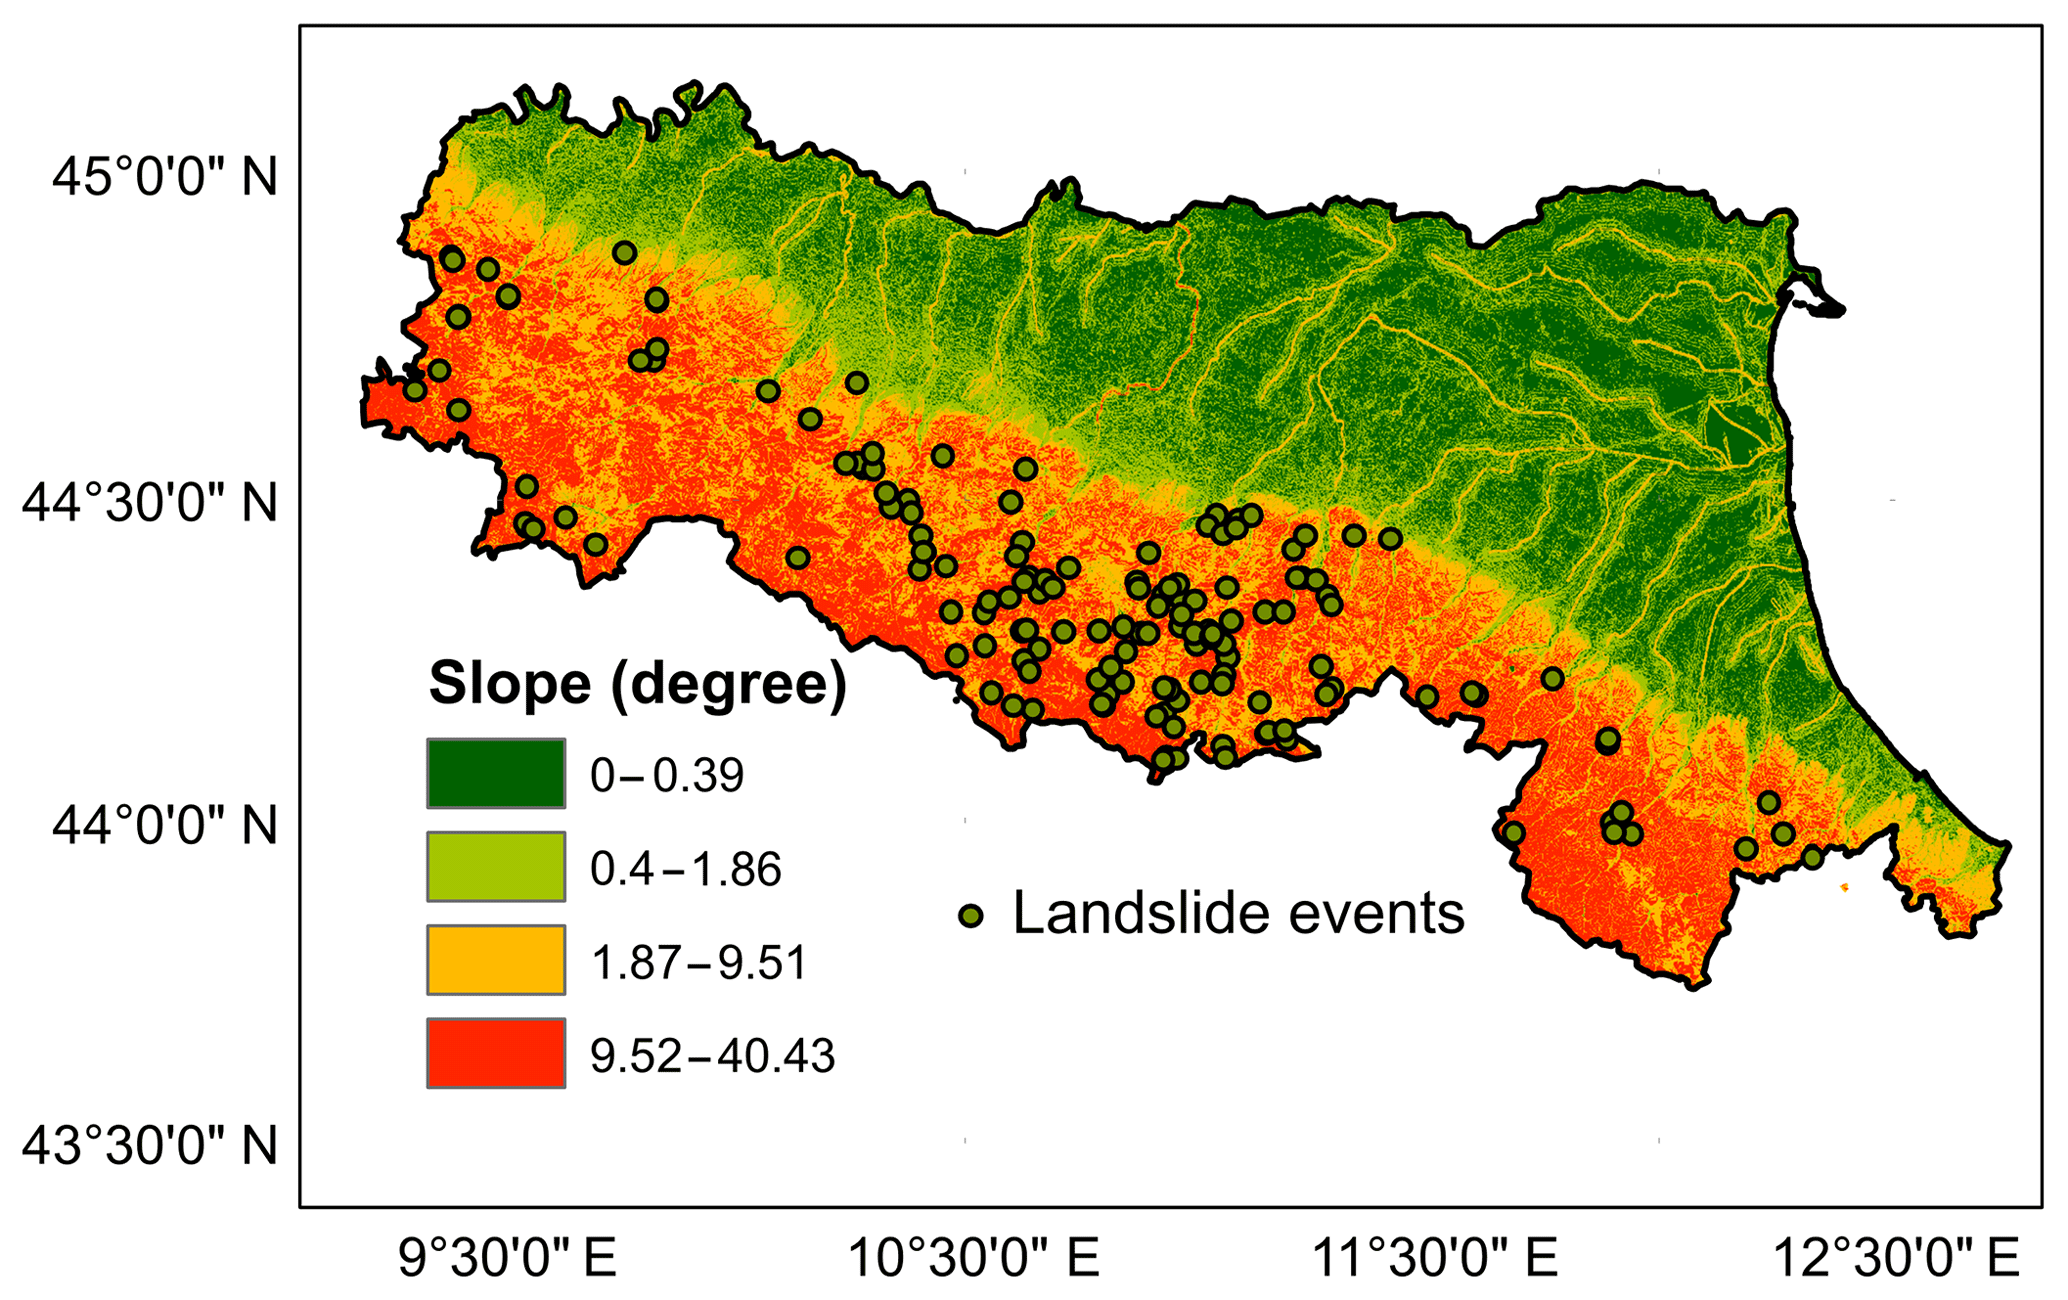
Figure 2Landslide events with slope angle map.
2.3 Datasets
There is a total of 19 soil moisture stations available within the study area; however, based on our collected data, only one of them (at the San Pietro Capofiume: latitude 44∘39′13.59′′, longitude 11∘37′21.6′′) provides long-term valid soil moisture retrievals (i.e. 2006 to 2017). We have checked the data from all the rest of the stations, they are either absent (or have very big data gaps) or do not cover the research period at all. Therefore, only the San Pietro Capofiume station is used for the WRF soil moisture temporal evaluation. The soil moisture is measured from 10 to 180 cm deep in the soil at five depths, by the time domain reflectometry (TDR) instrument. Data are recorded in the unit of volumetric water content (m3 m−3) and at a daily time step (Pistocchi et al., 2008). The data used in this study are from between 2006 and 2015. Rainfall data over the whole study area are collected from over 200 tipping-bucket rain gauges, which are used to assess the quality of the WRF model's rainfall estimations in the study area, as well as for rainfall event selection during the years 2014 and 2015.
To drive a NWP model like WRF for soil moisture simulations, several globally covered data products can be chosen for extracting the boundary and initial condition information; for instance, the European Centre for Medium-Range Weather Forecasts (ECMWF) reanalysis (ERA-Interim) and the National Centre for Environmental Prediction (NCEP) reanalysis are two of the most commonly used data products. It has been found by Srivastava et al. (2013b) that the ERA-Interim datasets can provide better boundary conditions than the NCEP datasets for WRF hydro-meteorological predictions in Europe, which is therefore adopted in this study to drive the WRF model. The spatial resolution of the ERA-Interim is approximately 80 km. The data are available from 1979 to present, containing 6-hourly gridded estimates of three-dimensional meteorological variables, and 3-hourly estimates of a large number of surface parameters and other two-dimensional fields. A comprehensive description of the ERA-Interim datasets can be found in Dee et al. (2011).
The Shuttle Radar Topography Mission (SRTM) 3 Arc-Second Global (∼90 m) DEM datasets are downloaded and used as the basis for the slope degree calculations. SRTM DEM data have been widely used for elevation-related studies worldwide due to their high-quality, near-global coverage and free availability (Berry et al., 2007).
3.1 WRF model and the three land surface model schemes
The WRF model is a next-generation, non-hydrostatic mesoscale NWP system designed for both atmospheric research and operational forecasting applications (Skamarock et al., 2005). The model is powerful enough in modelling a broad range of meteorological applications varying from tens of metres to thousands of kilometres. It has two dynamical solvers: the ARW (Advanced Research WRF) core and the NMM (Nonhydrostatic Mesoscale Model) core. The former has more complex dynamic and physics settings than the latter, which only has limited setting choices. Hence in this study WRF with ARW dynamic core (version 3.8) is used to perform all the soil moisture simulations.
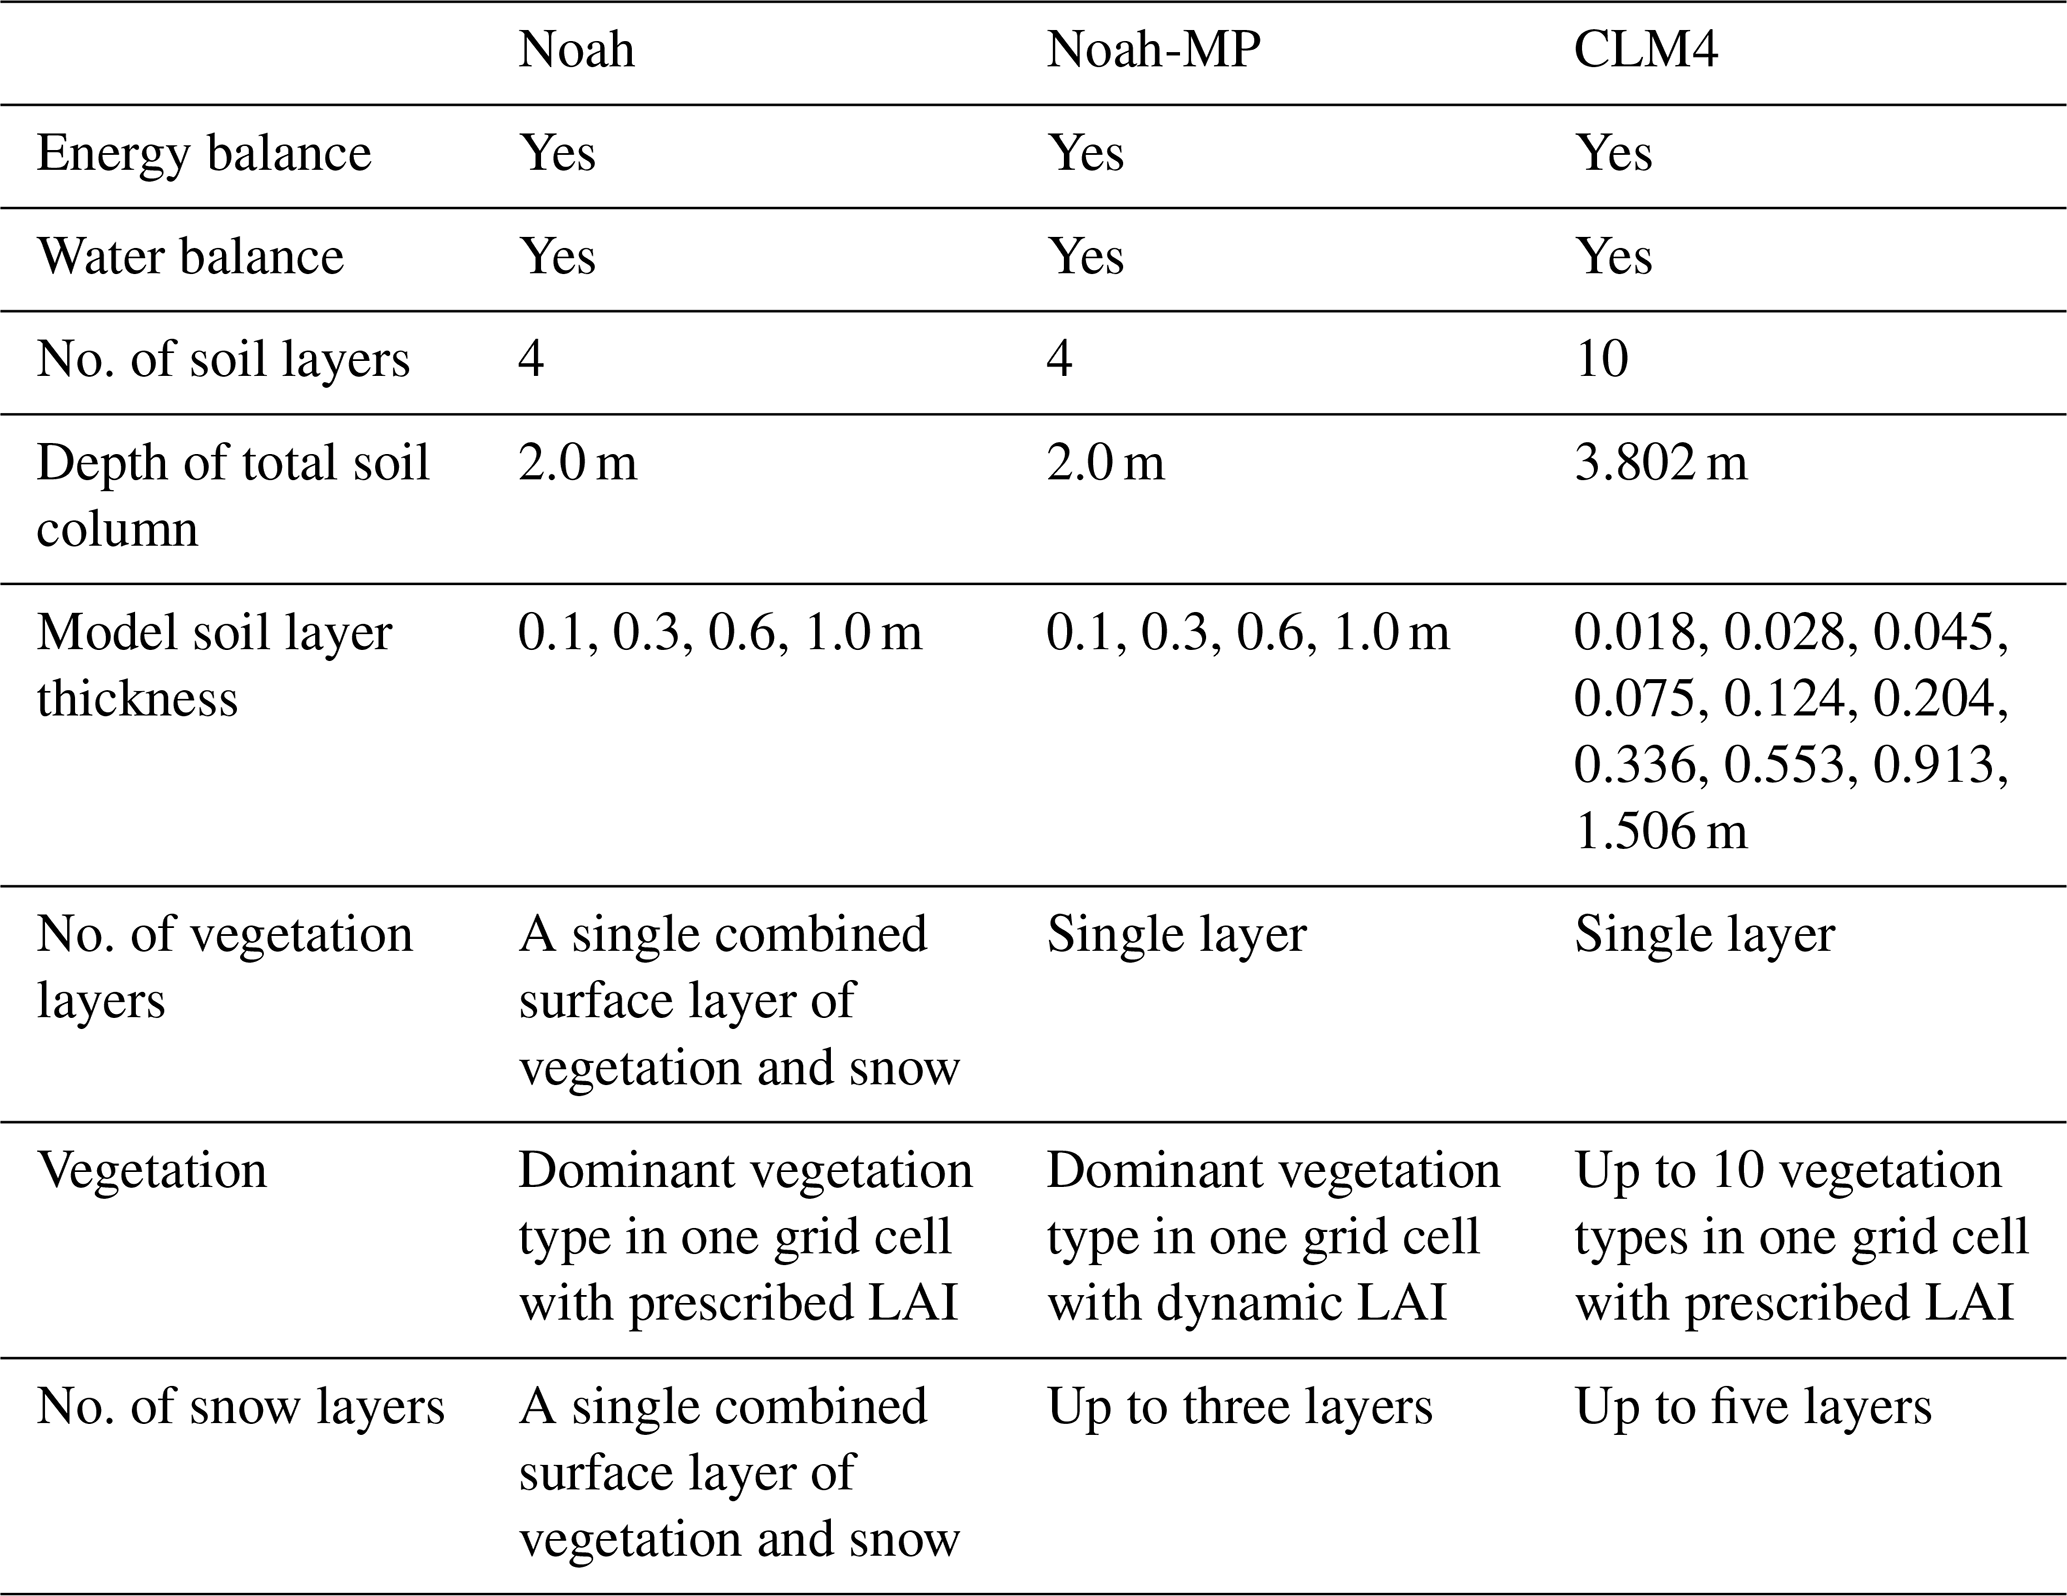
The main task of the LSM within the WRF is to integrate information generated through the surface layer scheme, the radiative forcing from the radiation scheme, the precipitation forcing from the microphysics and convective schemes, and the land surface conditions to simulate the water and energy fluxes (Ek et al., 2003). WRF provides several LSM options, three of which are selected in this study as mentioned in the introduction: Noah, Noah-MP, and CLM4. Table 1 gives a simple comparison of the three models. The detailed description of the models is written below in the order of increasing complexity regarding the way they deal with thermal and moisture fluxes in various layers of soil, and their vegetation, root, and canopy effects (Skamarock et al., 2008).
3.1.1 Noah
Noah is the most basic amongst the three selected LSMs. It is one of the “second generation” LSMs that relies on both soil and vegetation processes for water budgets and surface energy closures (Wei et al., 2010). The model is capable of modelling soil and land surface temperature, snow water equivalent, and the general water and energy fluxes. The model includes four soil layers that reach a total depth of 2 m in which soil moisture is calculated. Its bulk layer of canopy–snow–soil (i.e. a layer lacking the ability to simulate photosynthetically active radiation, here PAR; vegetation temperature; correlated energy; and water, heat and carbon fluxes), “leaky” bottom (i.e. drained water is removed immediately from the bottom of the soil column, which can result in much fewer memories of antecedent weather and climate fluctuations), and simple snow melt–thaw dynamics are seen as the model's demerits (Wharton et al., 2013). Noah calculates the soil moisture from the diffusive form of the Richard's equation for each of the soil layers (Greve et al., 2013), and the evapotranspiration from the Ball–Berry equation (considering both the water flow mechanism within soil column and vegetation, as well as the physiology of photosynthesis; Wharton et al., 2013).
3.1.2 Noah-MP
Noah-MP (Niu et al., 2011) is an improved version of the Noah LSM, in the aspect of better representations of terrestrial biophysical and hydrological processes. Major physical mechanism improvements directly relevant to soil water simulations include (1) the introduction of a more permeable frozen soil by separating permeable and impermeable fractions (Cai, 2015); (2) the addition of an unconfined aquifer immediately beneath the bottom of the soil column to allow the exchange of water between them (Liang et al., 2003); and (3) the adoption of a TOPMODEL (TOPography based hydrological MODEL)-based runoff scheme (Niu et al., 2005) and a simple SIMGM groundwater model (Niu et al., 2007), which are both important in improving the modelling of soil hydrology. Noah-MP is unique compared with the other LSMs, as it is capable of generating thousands of parameterisation schemes through the different combinations of “dynamic leaf, canopy stomatal resistance, runoff and groundwater, a soil moisture factor controlling stomatal resistance (the β factor), and six other processes” (Cai, 2015). The scheme options used in the study are the Ball–Berry scheme for canopy stomatal resistance, the Monin–Obukhov scheme for surface layer drag coefficient calculation, the Noah-based soil moisture factor for stomatal resistance, the TOPMODEL runoff with the SIMGM groundwater, the linear effect scheme for soil permeability, the two-stream method applied to vegetated fraction scheme for radiative transfer, the CLASS (Canadian Land Surface Scheme) scheme for ground surface albedo option, and the Jordan scheme (Jordan, 1991) for partitioning precipitation between snow and rain.
3.1.3 CLM4
CLM4 is developed by the National Center for Atmospheric Research (NCAR) to serve as the land component of its Community Earth System Model (formerly known as the Community Climate System Model) (Lawrence et al., 2012). It is a “third generation” model that incorporates the interactions of both nitrogen and carbon in the calculations of water and energy fluxes. Compared with its previous versions, CLM4 (Oleson et al., 2008) has multiple enhancements relevant to soil moisture computing. For instance, the model's soil moisture is estimated by adopting an improved one-dimensional Richards equation (Zeng and Decker, 2009); the new version allows the dynamic interchanges of soil water and groundwater through an improved definition of the soil column's lower boundary condition that is similar to that of the Noah-MP (Niu et al., 2007). Furthermore, the thermal and hydrologic properties of organic soil are included for the modelling which is based on the method developed in Lawrence and Slater (2008). The total ground column is extended to 42 m depth, consisting of 10 soil layers unevenly spaced between the top layer (0.0–1.8 cm) and the bottom layers (229.6–380.2 cm), and 5 bedrock layers to the bottom of the ground column (Lawrence et al., 2011). Soil moisture is estimated for each soil layer.
3.2 WRF model parameterisation
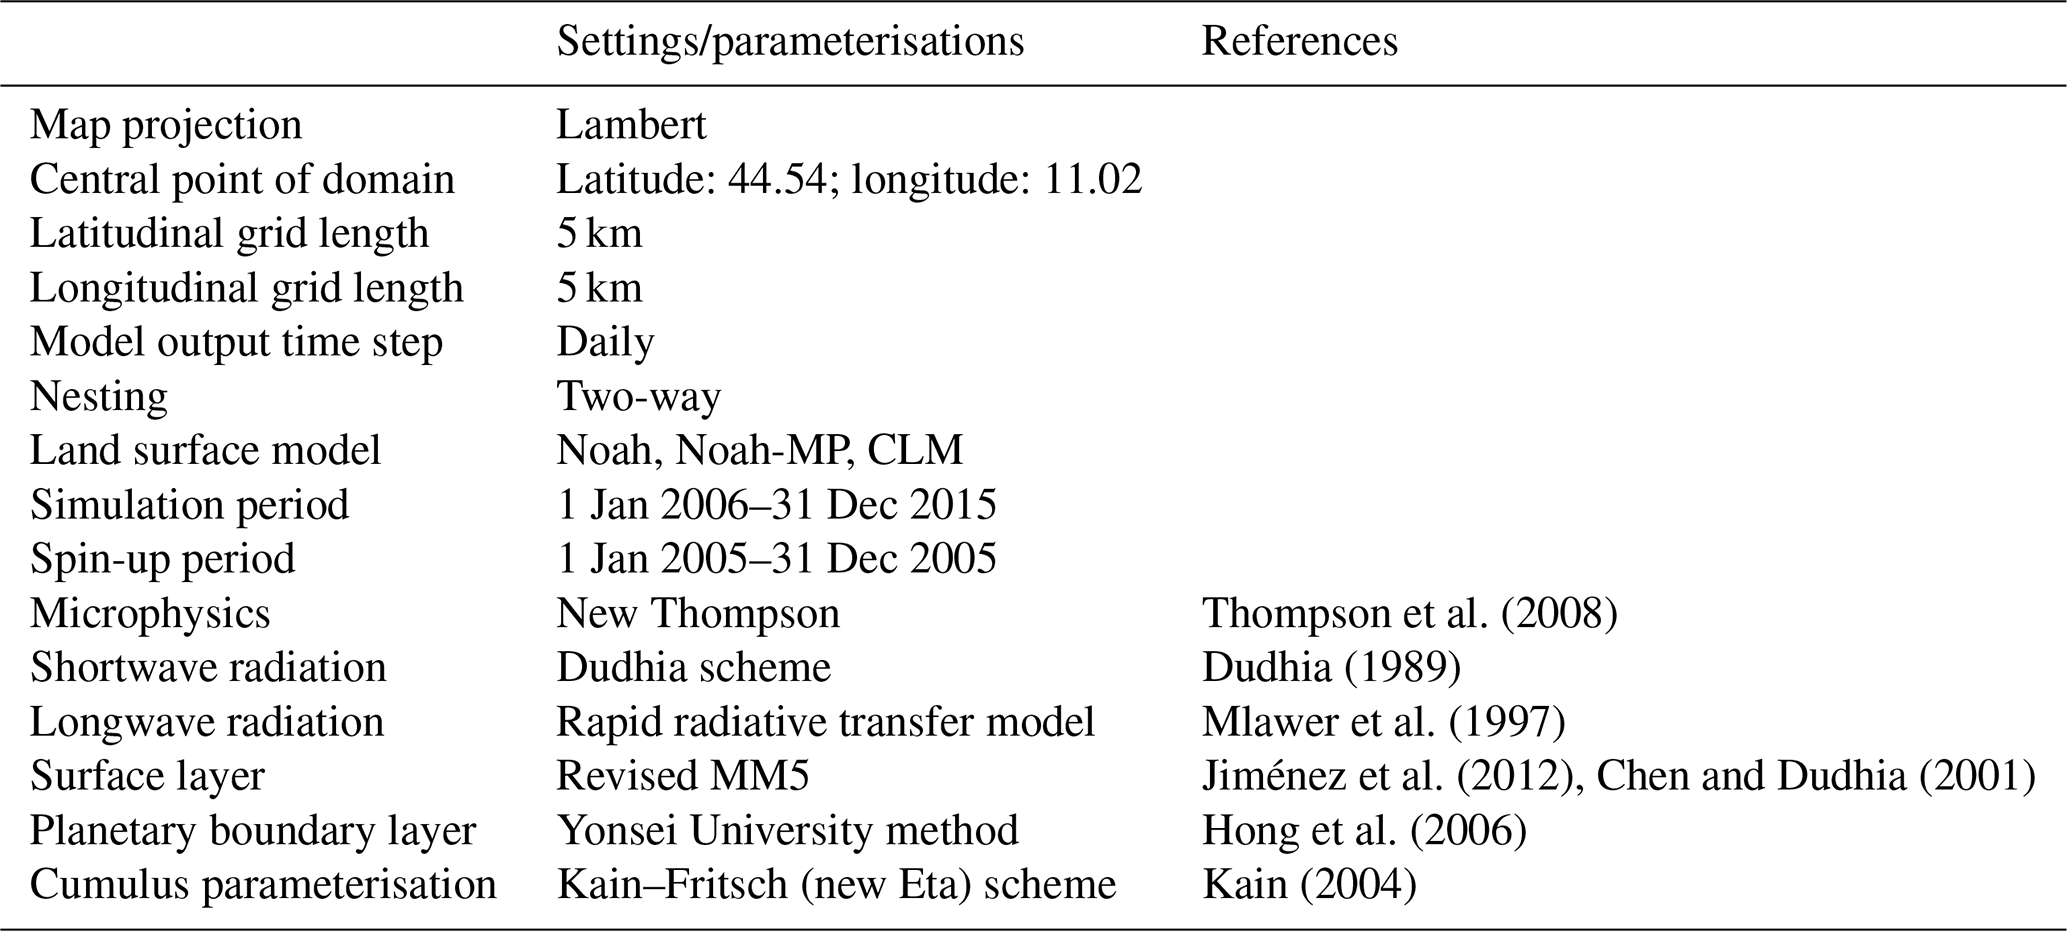
The WRF model is centred over the Emilia Romagna Region with three nested domains (D1–D3 with the horizontal grid sizes of 45, 15, and 5 km, respectively), of which the innermost domain (D3, with 88×52 grids – west–east and south–north, respectively) is used in this study. A two-way nesting scheme is adopted, allowing information from the child domain to be fed back to the parent domain. With atmospheric forcing, static inputs (e.g. soil and vegetation types), and parameters, the WRF model needs to be spun up to reach its equilibrium state before it can be used (Cai et al., 2014; Cai, 2015). In this study, WRF is spun up by running through the whole year of 2005. After the spin-up, the WRF model for each of the selected LSM schemes is executed at a daily time step from 1 January 2006 to 31 December 2015, using the ERA-Interim datasets.
The microphysics scheme plays a vital role in simulating accurate rainfall information which in turn is important for modelling the accurate soil moisture variations. WRF V3.8 is supporting 23 microphysics options ranging from simple to more sophisticated mixed-phase physical options. In this study, the WRF Single-Moment 6-class Microphysics Scheme is adopted, which considers ice, snow, and graupel processes and is suitable for high-resolution applications (Zaidi and Gisen, 2018). The physical options used in the WRF setup are Dudhia shortwave radiation (Dudhia, 1989) and Rapid Radiative Transfer Model (RRTM) longwave radiation (Mlawer et al., 1997). Cumulus parameterisation is based on the Kain–Fritsch scheme (Kain, 2004), which is capable of representing sub-grid-scale features of the updraft and rain processes, and such a capability is beneficial for real-time modelling (Gilliland and Rowe, 2007). The surface layer parameterisation is based on the Revised fifth-generation Pennsylvania State University–National Center for Atmospheric Research Mesoscale Model (MM5) Monin–Obukhov scheme (Jiménez et al., 2012). The Yonsei University scheme (Hong et al., 2006) is selected to calculate the planetary boundary layer. The parameterisation schemes used in the WRF modelling are shown in Table 2. The datasets for land use and soil texture are available in the pre-processing package of WRF. In this study, the land use categorisation is interpolated from the MODIS 21-category data classified by the International Geosphere Biosphere Programme (IGBP). The soil texture data are based on the Food and Agriculture Organization of the United Nations Global 5-minutes soil database.
3.3 Translation of observed and simulated soil moisture data to common soil layers
Since all soil moisture datasets have different soil depths, it is difficult for a direct comparison. The Noah and Noah-MP models include four soil layers, centred at 5, 25, 70, and 150 cm, respectively, whereas the CLM4 model has 10 soil layers, centred at 0.9, 3.2, 6.85, 12.85, 22.8, 39.2, 66.2, 110.65, 183.95, and 304.9 cm, respectively. Moreover, the in situ sensor measures soil moisture centred at 10, 25, 70, 135, and 180 cm. In order to make the datasets comparable at consistent soil depths, the simple linear interpolation approach described in Zhuo et al. (2015b) is applied in this study, and a benchmark of the soil layer centred at 10, 25, 70 and 150 cm is adopted.
3.4 Soil moisture thresholds build up and evaluations
To build and evaluate the soil moisture thresholds for landslide forecasting, all datasets have been grouped into two portions: 2006–2013 for the establishment of thresholds, and 2014–2015 for the evaluation. The determination of soil moisture thresholds is based on determining the most suitable soil moisture triggering level for landslides occurrence by trying a range of exceedance probabilities (percentiles). For example, a 10 % exceedance probability is calculated by determining the 10th percentile result of the soil moisture datasets that are related to the landslides that occurred. The exceedance probability method is commonly utilised in landslide early warning studies for calculating the rainfall-thresholds, which is therefore adopted here to examine its performance for soil moisture threshold calculations.
To carry out the threshold evaluation, 45 rainfall events (during 2014–2015) are selected for the purpose. The rainfall events are separated based on at least 1 d of dry period (i.e. a period without rainfall). The rainfall data from each rain gauge station are first combined using the Thiessen polygon method, and with visual analysis, the 45 events are then finally selected. The information about the selected rainfall events can be found in Sect. 5. The threshold evaluation is based on the statistical approach described in Gariano et al. (2015) and Zhuo et al. (2019), where the soil moisture threshold can be treated as a binary classifier of the soil moisture conditions that are likely or unlikely to cause landslide events. With this hypothesis, the likelihood of a landslide event can either be true (T) or false (F), and the threshold forecasting can either be positive (P) or negative (N). The combinations of those four conditions can lead to four statistical outcomes (Fig. 3a) that are true positive (TP), true negative (TN), false positive (FP), and false negative (FN) (Wilks, 2011). Using the four outcomes, two statistical scores can be determined.
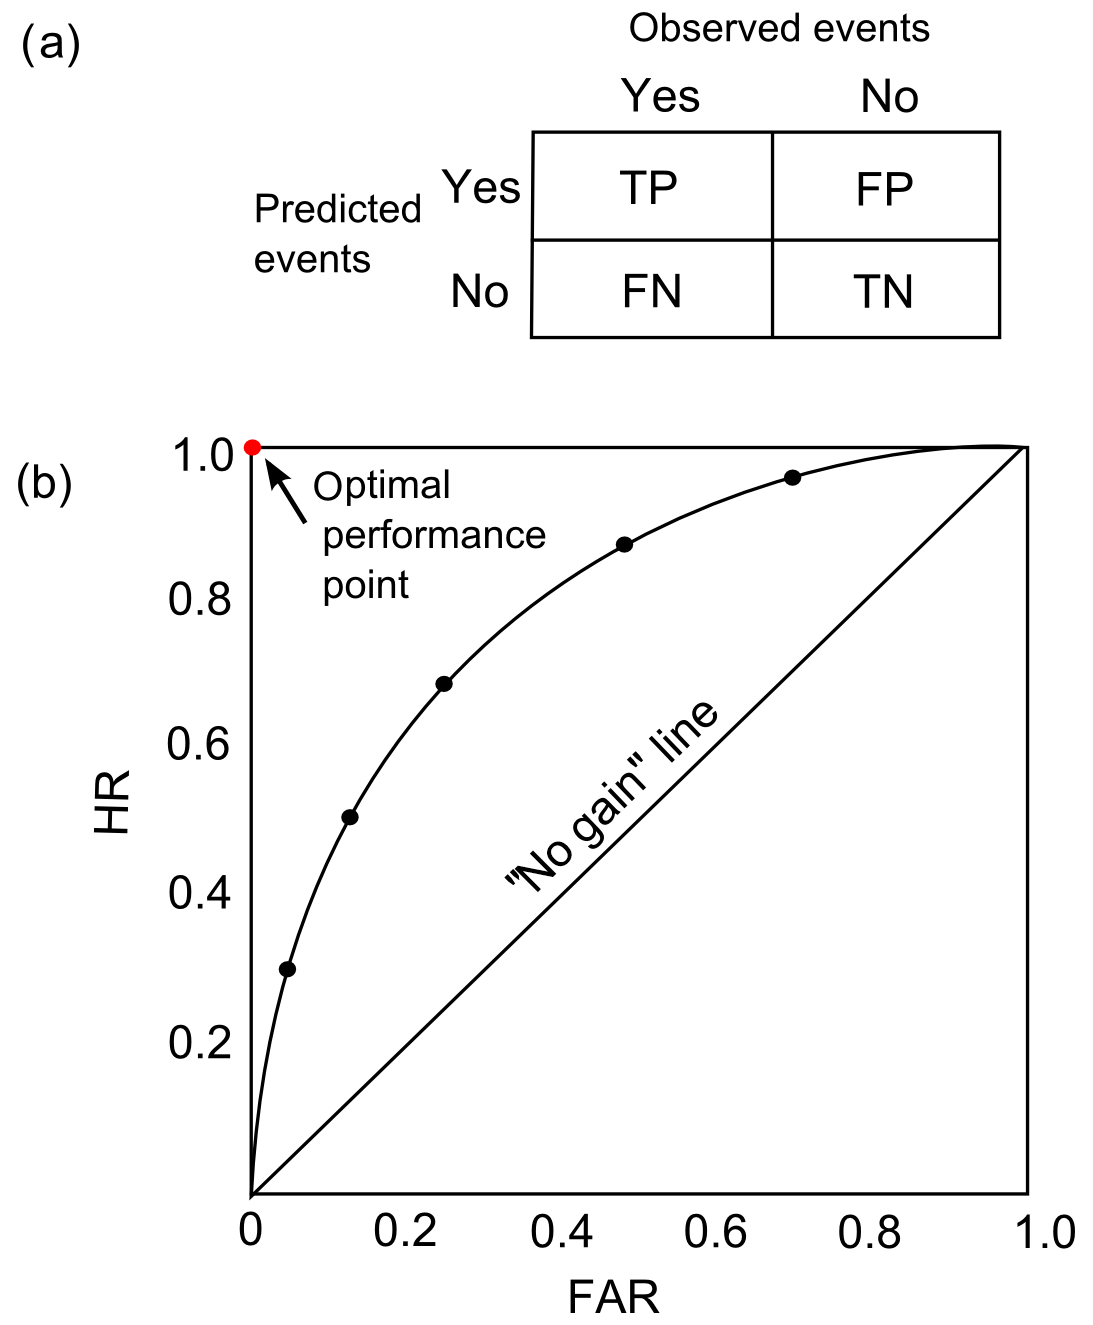
Figure 3(a) Contingency table illustrates the four possible outcomes of a binary classifier model: TP (true positive), TN (true negative), FP (false positive), and FN (false negative). (b) ROC (receiver operating characteristic) analysis with HR (hit rate) against FAR (false alarm rate). This figure is based on Gariano et al. (2015).
The hit rate (HR), which is the rate of the events that are correctly forecasted. Its formula is
in the range of 0 and 1, with the best result as 1.
The false alarm rate (FAR), which is the rate of false alarms when the event did not occur. Its formula is
in the range of 0 and 1, with the best result as 0.
For any soil moisture product, each threshold calculated is adopted to determine T, F, P, and N, respectively. Those values are finally integrated to find the overall scores of TP, FN, FP, TN, HR, and FAR. The threshold performance is then judged via the receiver operating characteristic (ROC) analysis (Hosmer and Lemeshow, 1989; Fawcett, 2006). As shown in Fig. 3b, the ROC curve is based on HR against FAR, and each point in the curve represents a threshold scenario (i.e. selected exceedance probabilities). The optimal result (the red point) can only be realised when the HR reaches 1 and the FAR reduces to 0. The closer the point is to the red point, the better the forecasting result is. To analyse and compare the forecasting performance numerically, the Euclidean distances (d) for each scenario to the optimal point are computed.
In this study, the evaluation is based on the daily mean soil moisture. The reason for not using the antecedent soil moisture condition plus rainfall data on the day is because the purpose of this study is to explore the relationship between different WRF-simulated soil moisture and landslides only. In general, soil moisture is a predisposing factor for slope instability, while rainfall is the triggering factor. The same rainfall may trigger or may not a landslide depending on the soil moisture content at the time of the rainfall event. The mean soil moisture on the day of the landslide implicitly account for both the initial soil moisture and the effective rainfall absorbed by the ground, and can be a robust indicator of the hydrological condition of the slope.
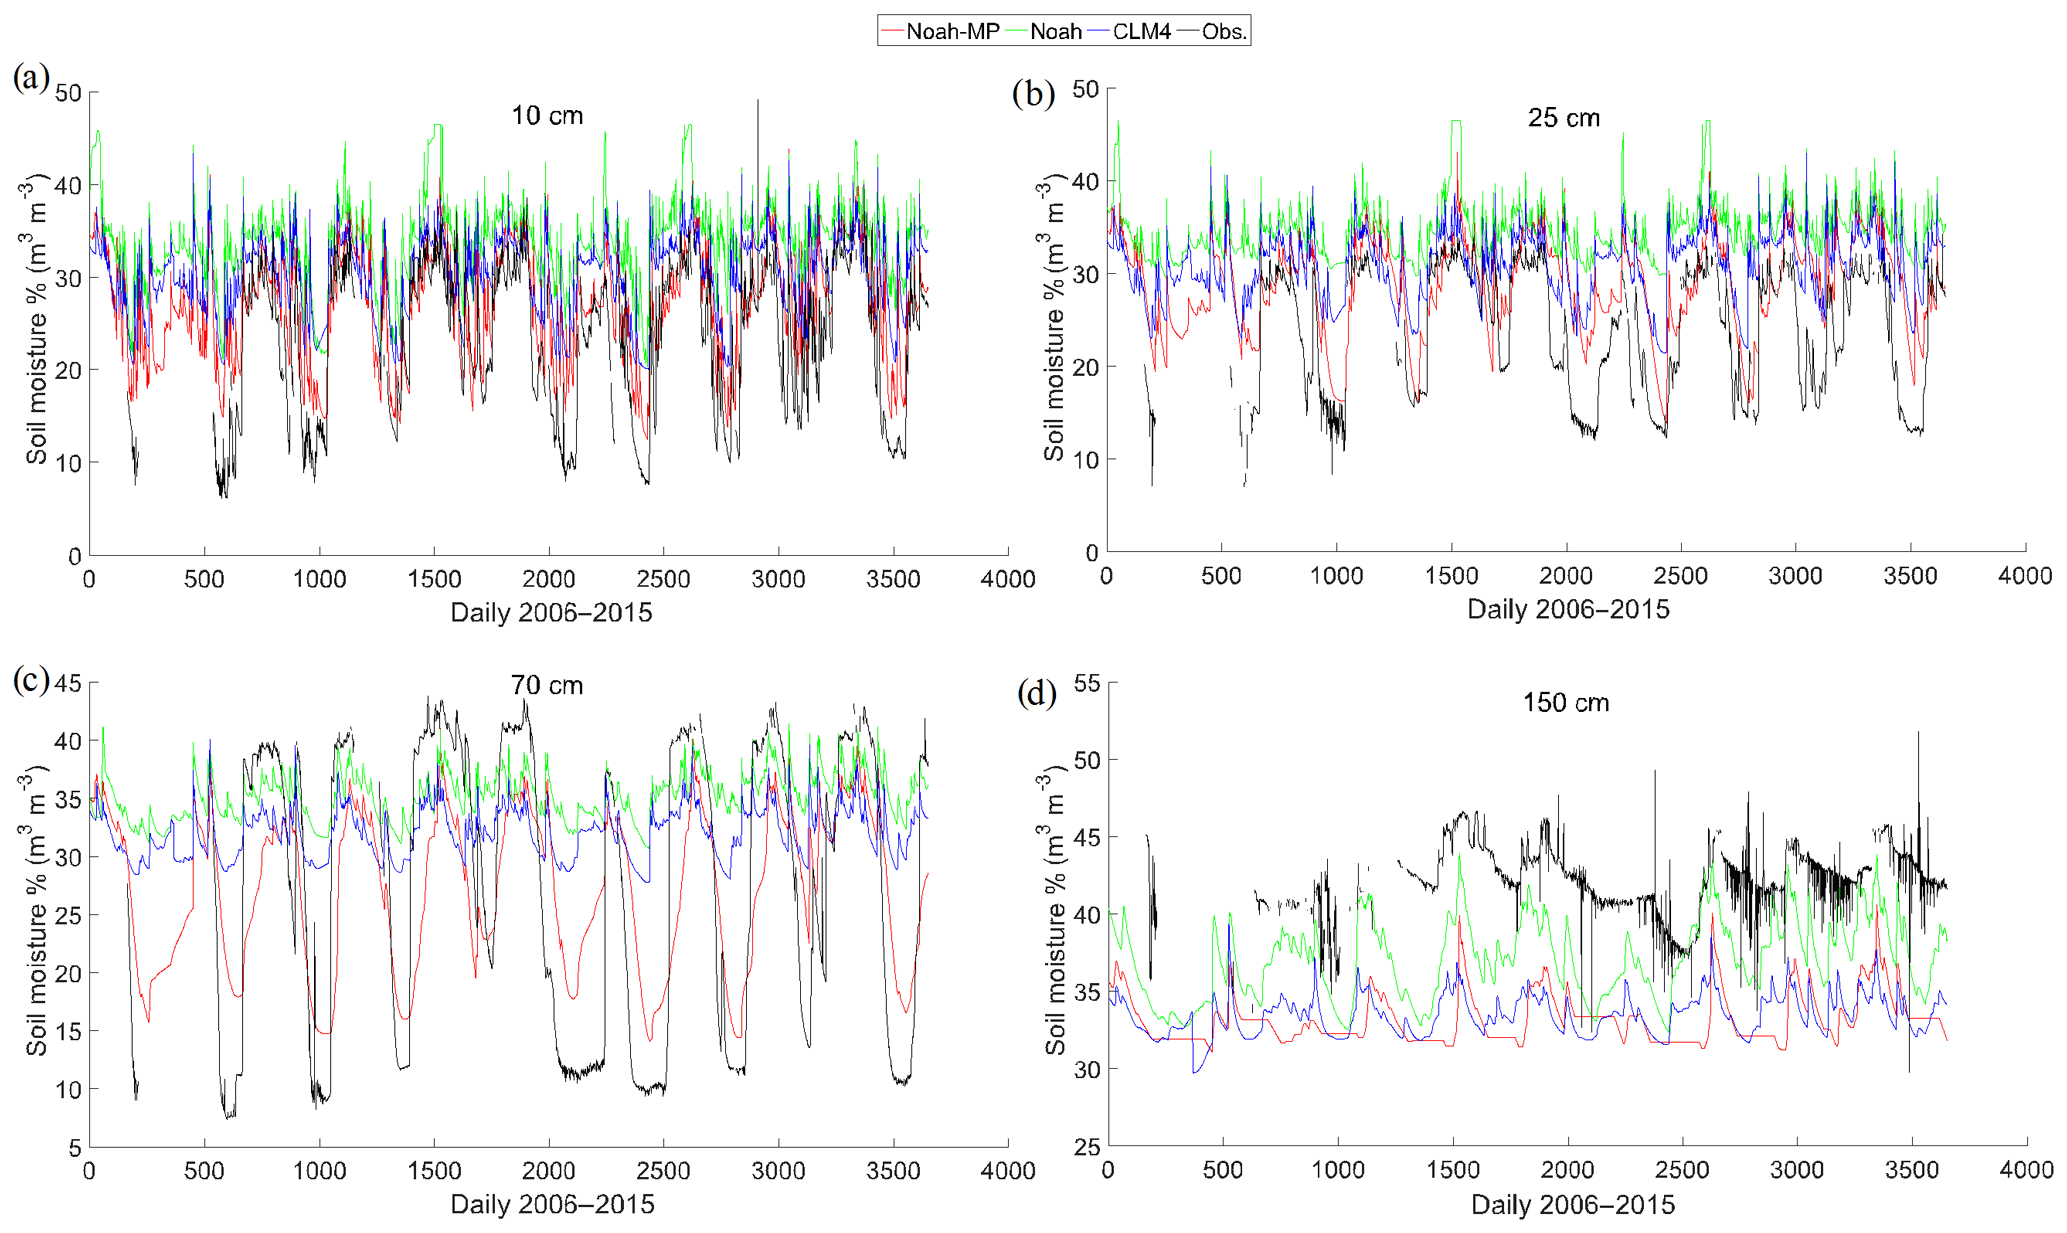
Figure 4Soil moisture temporal variations of WRF simulations and in situ observations for four soil layers at (a) 10 cm, (b) 25 cm, (c) 70 cm, and (d) 150 cm.
4.1 Soil moisture temporal comparisons
Although there is only one soil moisture sensor that provides long-term soil moisture data in the study region, it is still useful to compare it with the WRF-estimated soil moisture. In this study, we carry out a temporal comparison between all three WRF soil moisture products with the in situ observations (at a single soil moisture measuring point in the plain area). The comparison is implemented over the period from 2006 to 2015, and the WRF grid closest to the in situ sensor location is chosen. Figure 4 shows the comparison results at the four soil depths. The statistical performance (correlation coefficient r and root mean square error RMSE) of the three LSM schemes is summarised in Table 3. Based on the statistical results, Noah-MP surpasses other schemes at most soil layers, except for Layer 2, where CLM4 shows stronger correlation, and Layer 4, where Noah gives smaller RMSE error. For Noah-MP, the best correlation is observed at the surface layer (0.809), followed by the third (0.738), second (0.683) and fourth (0.498) layers; based on RMSE, the best performance is again observed at the surface layer and followed by the second, third and fourth layers in sequence (as 0.060, 0.070, 0.088, and 0.092 m3 m−3, respectively). From the temporal plots, it can be seen that at all four soil layers, all three LSM schemes can produce the soil moisture's seasonal cycle, with most upward and downward trends successfully represented. However, both the Noah and the CLM4 overestimate the variability at the upper two soil layers during almost the whole study period, and the situation is the worst for the Noah. Comparatively, the Noah-MP can better capture the wet soil moisture conditions, especially at the surface layer; it is the only model of the three that is able to simulate the large soil drying phenomenon close to the observations during the dry season, except for some extremely dry days. Towards 70 cm depth, although Noah-MP is still able to capture most of the soil moisture variabilities during the drying period, it significantly underestimates soil moisture values for most wet days. Similar underestimation results can be observed for CLM4 and Noah during the wet season at 70 cm; furthermore, both schemes are again not capable of reproducing the extremely drying phenomenon and overestimate soil moisture for most of the dry season days. It is surprising to see that at the deep soil layer (150 cm), all soil moisture products are underestimated. In particular, the outputs from the CLM4 and the Noah-MP only show small fluctuations. However, the soil moisture measurements from the in situ sensor also get our attention as they show strange fluctuations with numerous sudden drops and rise situations observed. The strange phenomenon is not expected at such a deep soil layer (although groundwater capillary forces can increase the soil moisture, its rate is normally very slow). One possible reason we suspect is sensor failure in the deep zone. Therefore, the assessment result for the deep soil layer should be considered unreliable. Overall for the Noah-MP, in addition to producing the highest correlation coefficient and the lowest RMSE, its simulated soil moisture variations are the closest to the observations. The better performance of the Noah-MP over the other two models agrees with the results found in Cai et al. (2014) (note: the paper uses stand-alone models, which are not coupled with WRF). Also, as has been discussed in Yang et al. (2011), the Noah-MP presents a clear improvement over the Noah in simulating soil moisture globally. However, it should be noted that the evaluation results are only based on one soil moisture sensor located at the plain part of the study area.
Table 3Statistical summary of the WRF performance in simulating soil moisture for different soil layers, based on comparison with the single-point in situ observations. Note: the bold values show the best performance within each of the soil layers.
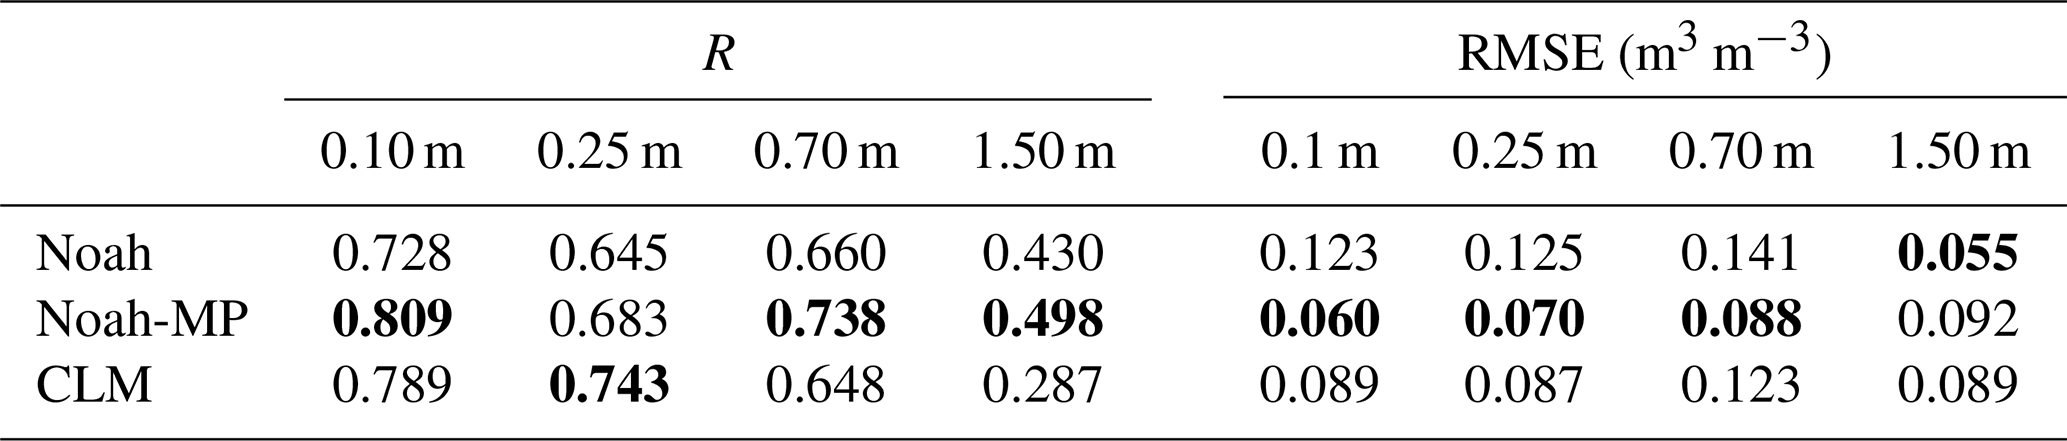
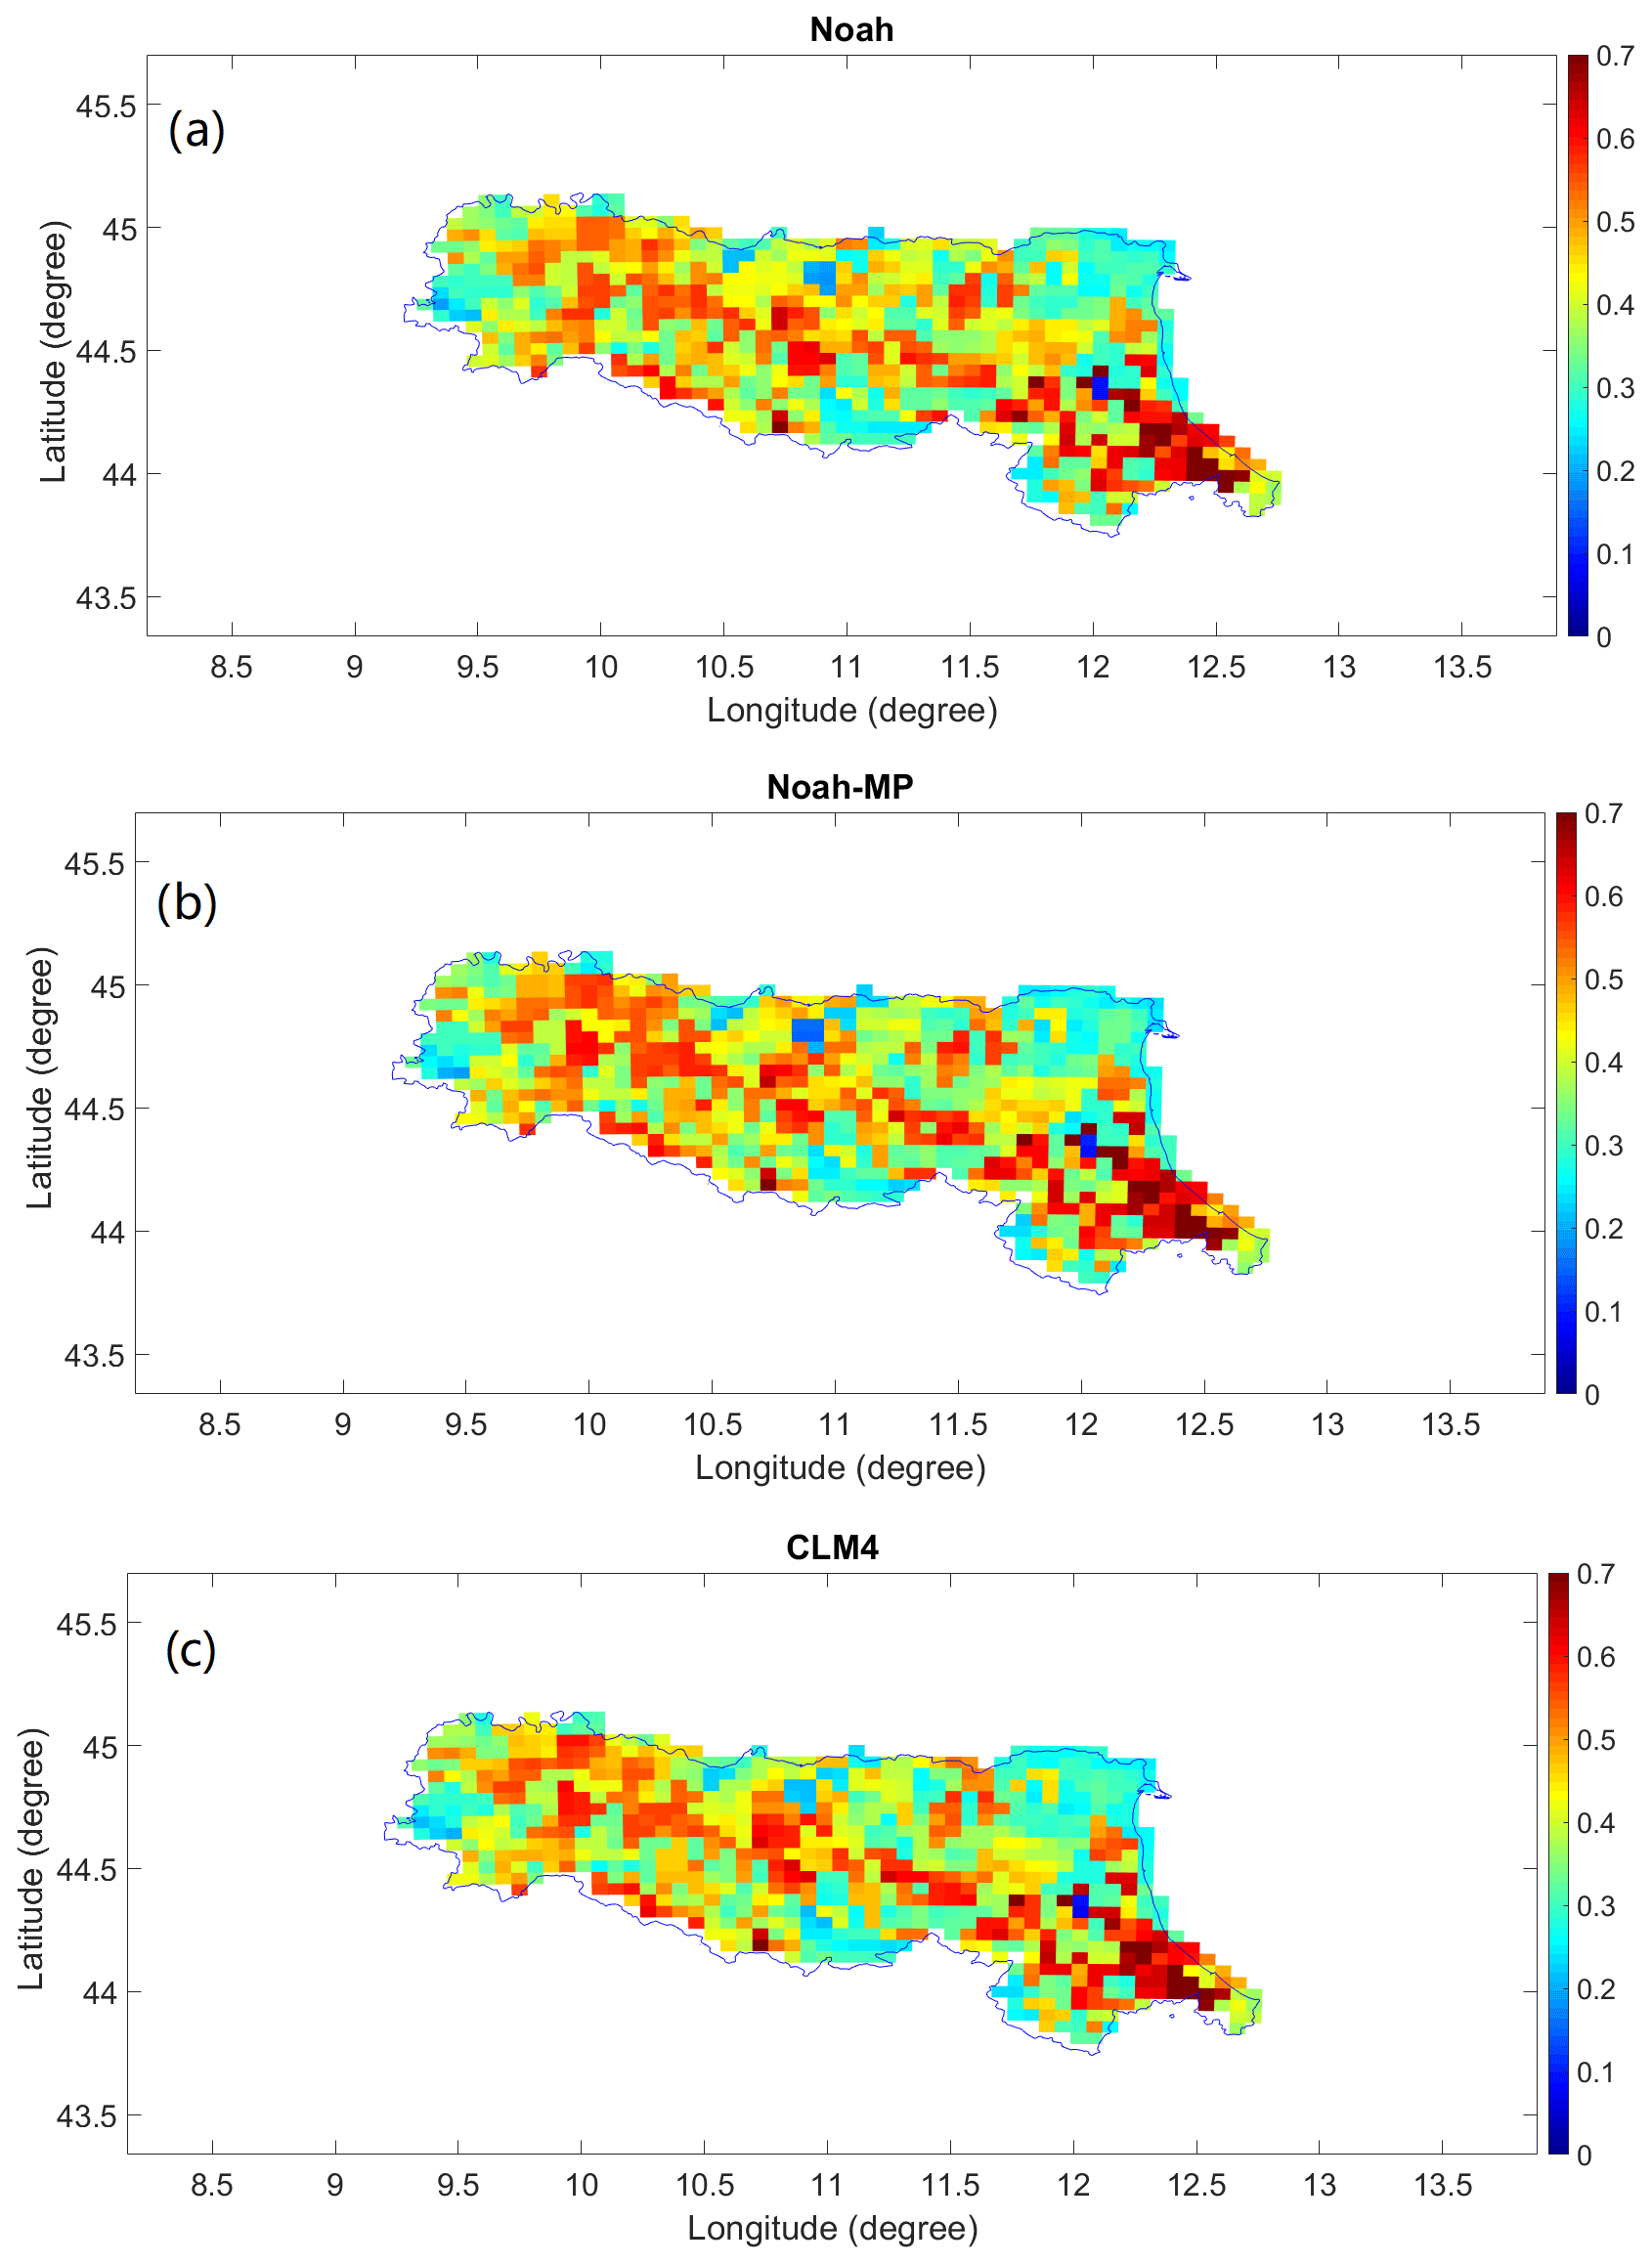
Figure 5Rainfall evaluation: spatial distribution of the correlation coefficient R of (a) Noah, (b) Noah-MP, and (c) CLM4.
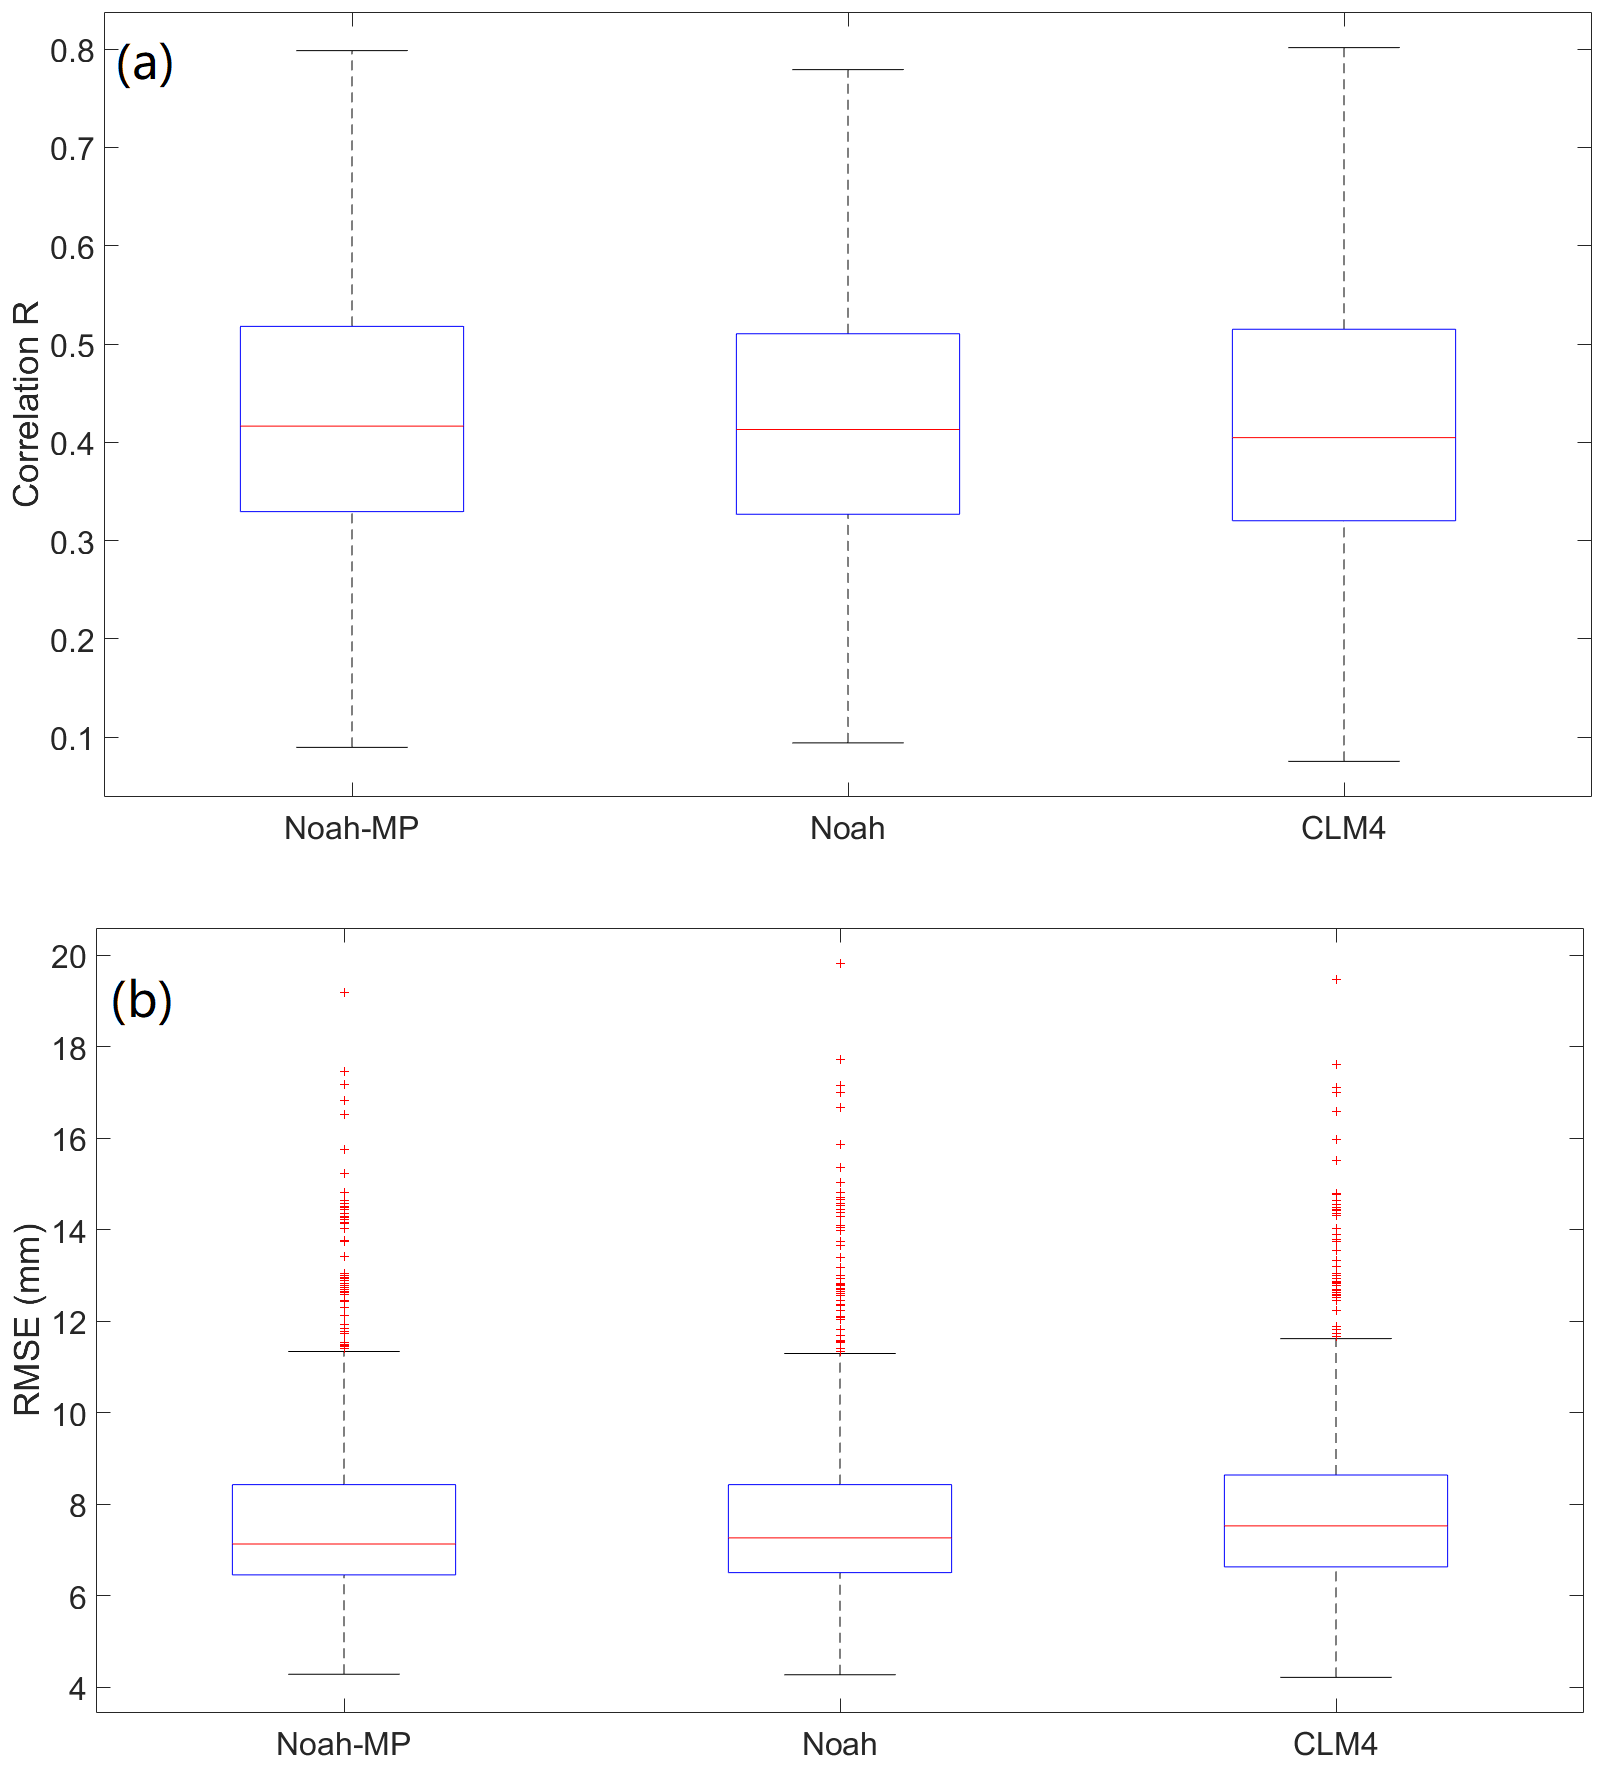
Figure 6Boxplots of rainfall evaluation results of (a) R and (b) RMSE: minimum; maximum; 0.25, 0.50, and 0.75 percentiles; and outliers (red cross).
4.2 Rainfall evaluations
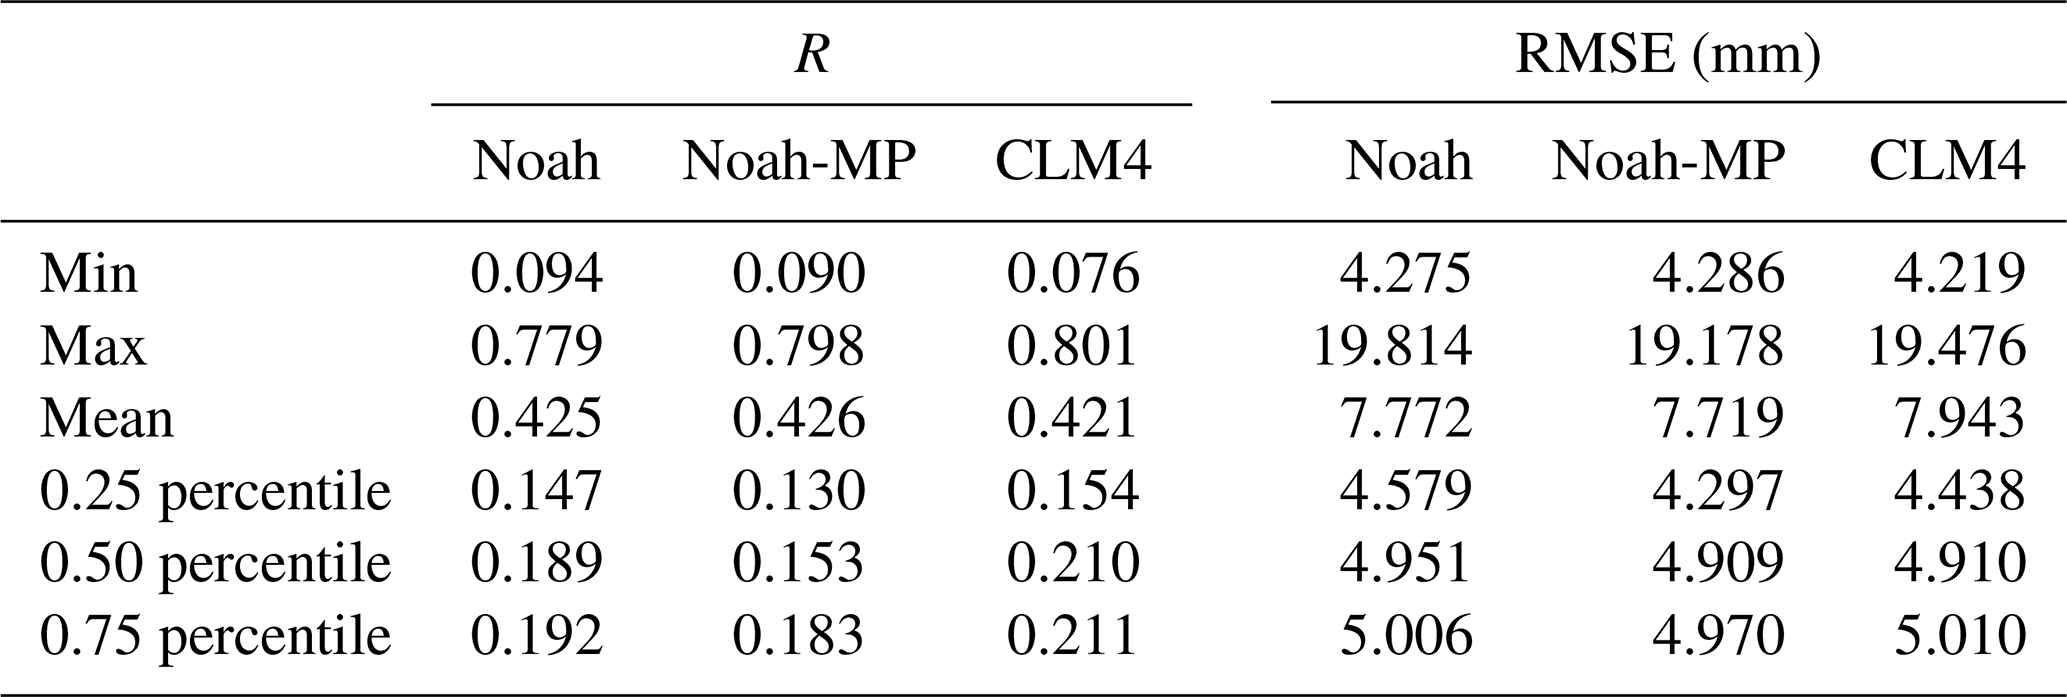
Since soil moisture is related to rainfall, it is useful to carry out the evaluations of WRF rainfall estimations against the observations in the study area. The spatial plot of R for the three LSMs is shown in Fig. 5. It can be seen that the performances of the three models are very close to each other, with only small differences over the whole study region. In general, the performance is the best in the southeast region, with R reaching above 0.70. The poorest performance is observed in the northeast region and some parts of the mountain zone. Based on the spatial distribution of R, there is no clear correlation between the WRF rainfall performance and the topography of the region. The boxplot for the R performance is illustrated in Fig. 6a. It can be seen again that the performances of the three models are very similar. Generally, R ranges between around 0.10 and 0.80, and with the majority of the region performs around 0.40. RMSE performance is also calculated. Similar to the results of R, it has been found that the RMSE spatial distributions are very similar among the three models. Therefore, the RMSE spatial distribution map is not included in this paper. The boxplot of the RMSE is shown in Fig. 6b. Generally, the RMSE ranges between around 4 and 12 mm, with some outliers between around 12 and 20 mm. The majority of the region performs at around 7 mm RMSE. The statistical calculations are summarised in Table 4. Based on the results of R and RMSE, the WRF rainfall estimation performance in Emilia is similar to the one found in central USA (Van Den Broeke et al., 2018).
Table 4Statistical summary of the WRF performance in simulating rainfall for the whole study region, based on comparison with the in situ rainfall network.
As introduced at the beginning of the paper, previous works (as discussed in the introduction section) have demonstrated that in complex geomorphologic settings (e.g. in Emilia Romagna), a rainfall threshold approach is too simple, and more hydrologically driven approaches need to be established. This section is to assess whether the spatial distribution of soil moisture can provide useful information for landslide monitoring at the regional scale. Particularly, all three soil moisture products simulated through the WRF model are used to derive threshold models, and the corresponding landslide prediction performances are then compared statistically. Here the threshold is defined as the crucial soil moisture condition above which landslides are likely to happen.
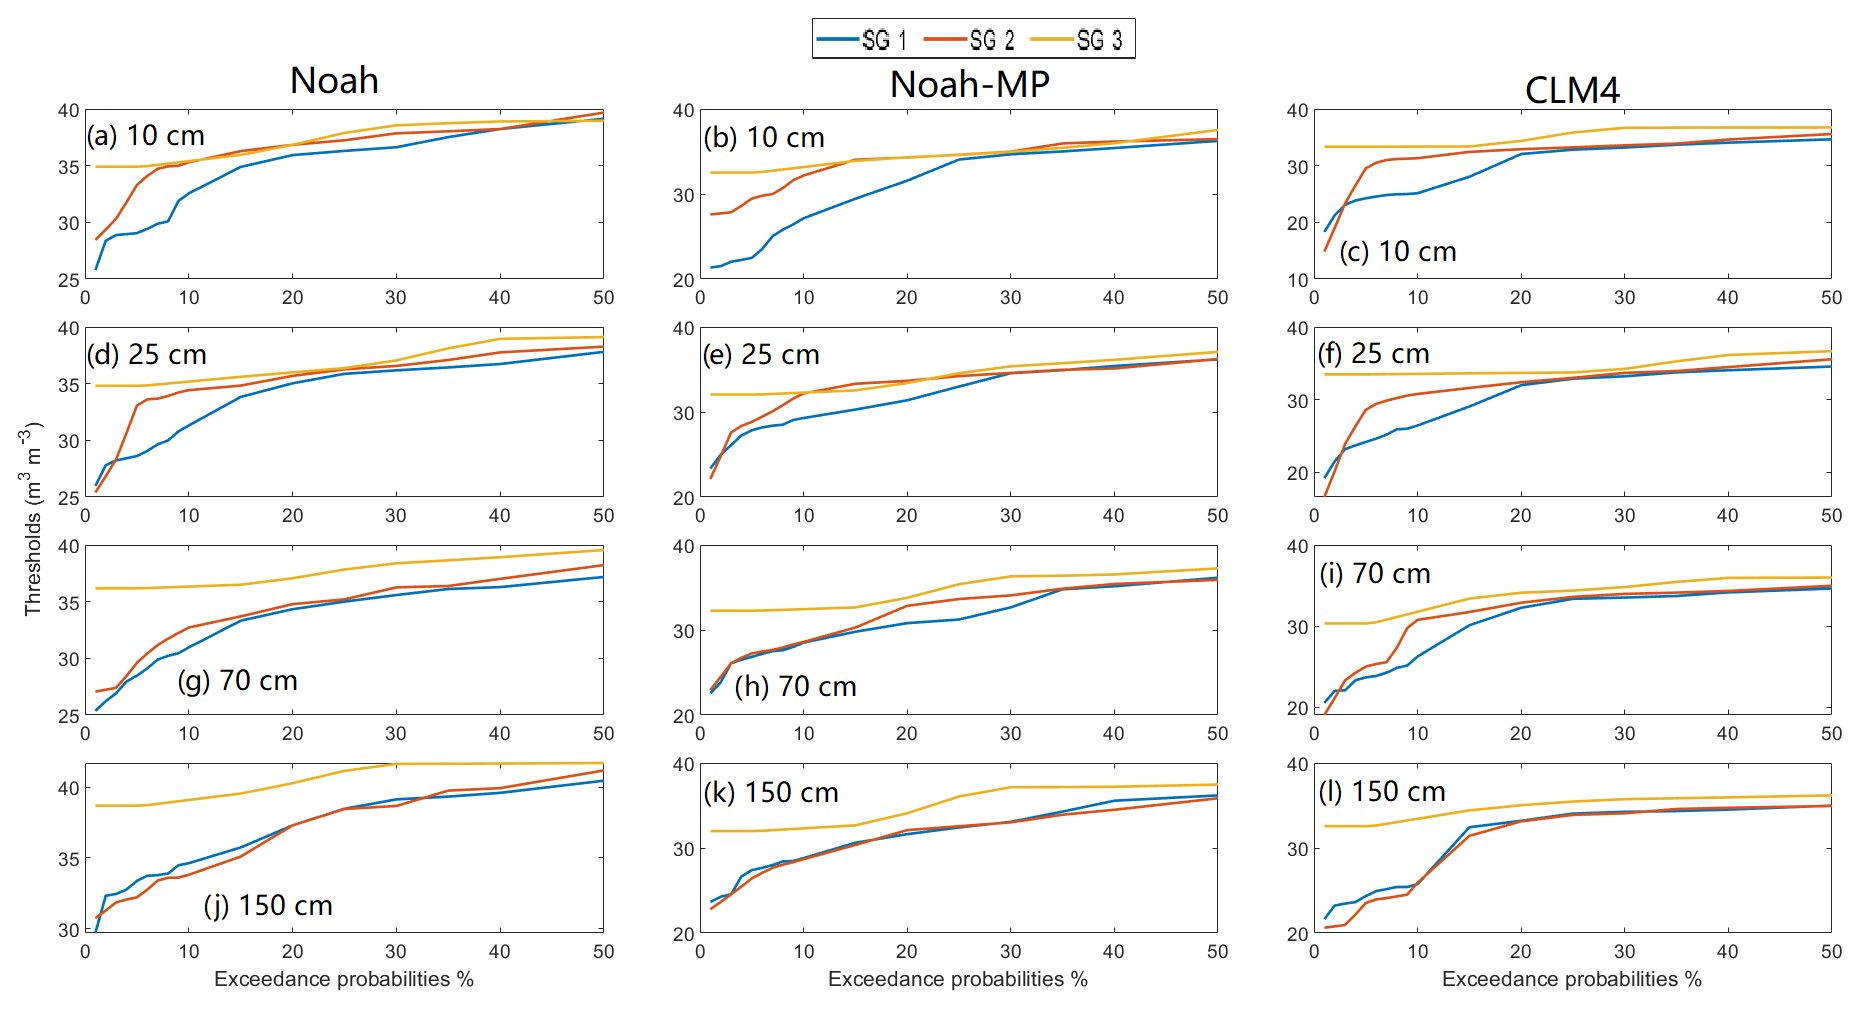
Figure 7Threshold plots. For Noah (a, d, g, j), Noah-MP (b, e, h, k), and CLM4 (c, f, i, l) land surface schemes under three slope angle groups (SGs), with SG 1 = 0.4–1.86∘, SG 2 = 1.87–9.61∘, SG 3 = 9.52–40.43∘.
Among different factors for controlling the stability of slope, the slope angle is one of the most critical ones. From the slope angle map in Fig. 2, it can be seen the region has a clear spatial pattern of high and low slope areas, with the majority of the high-slope areas (which can be as steep as around 40∘) located in the mountainous southern part and the river valleys. Based on the event data analysed, the landslides that happened during the study period are mainly located in the high-slope region, with a particularly high concentration around the central southern part. The spatial distribution of the landslide events is also in line with the overall geological characteristics of the region, i.e. the southern part mainly constitutes the outcrop of sandstone rocks that make up the steep slopes and are covered by a thin layer of permeable sandy soil, which are highly unstable. Therefore, instead of only using one soil moisture threshold for the whole study area, it is useful to divide the region into several slope groups so that within each group a threshold model is built. To derive soil moisture threshold individually under different slope conditions, all data have been divided into three groups based on the slope angle (0.4–1.86; 1.87–9.61; 9.52–40.43; since no landslide events are recorded under the 0–0.39 group, the group is not considered here). As a result, all groups have equal coverage areas. There are different ways to group the slopes. In this study, in order to have equal coverage areas, we have identified these class-break values.
In order to find the optimal threshold so that there are few overestimations (i.e. threshold is overestimated) and false alarms (i.e. threshold is underestimated), we test out 17 different exceedance probabilities from 1 % to 50 %. For each LSM scheme, the total number of threshold models is 204, which is the result of different combinations of slope groups, soil layers, and exceedance probability conditions. The calculated thresholds for all LSM schemes under three slope groups are plotted in Fig. 7. Overall there is a clear trend between the slope angle and the soil moisture threshold, i.e. the threshold becomes smaller for steeper areas. The correlation is more evident at the upper three soil layers (i.e. the top 1 m depth of soil), with only a few exceptions for Noah and CLM4 at the 1 % and the 2 % exceedance probabilities. At the deep soil layer centred at 150 cm, the soil moisture threshold difference between slope group (SG) 2 and 3 becomes very small for all three LSM schemes. This could be partially because at the deep soil layer, the change of soil moisture is much smaller than at the surface layer, and therefore the soil moisture values for SG 2 and 3 could be too similar to differentiate. However, for gentler slopes (SG 1), the higher soil moisture triggering level always applies even down to the deepest soil layer for all three LSM schemes. In this study, the results show that wetter soil is more likely to trigger landslides on gentler slopes than on steeper slopes.
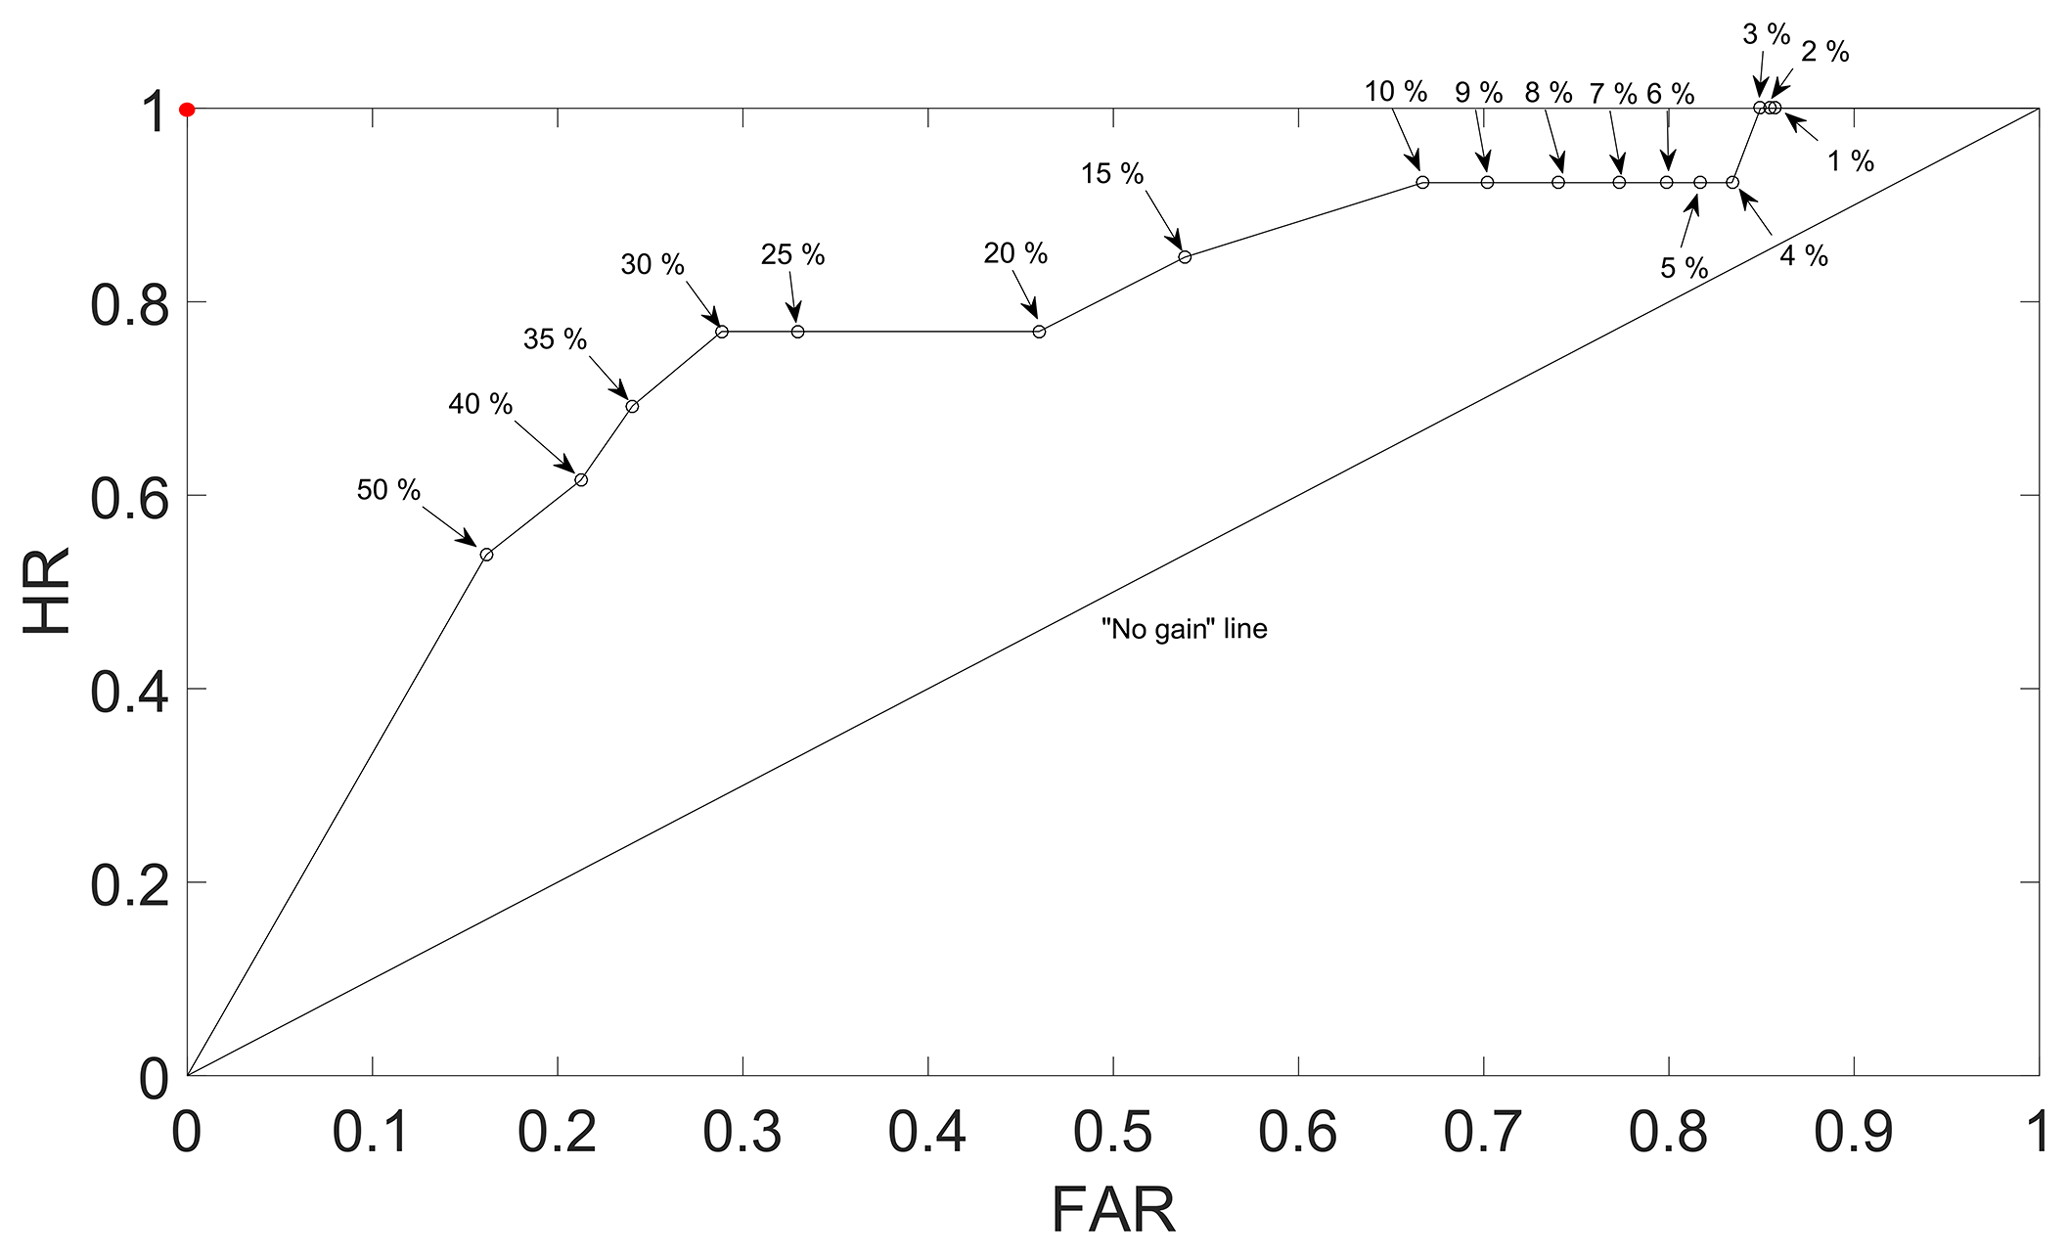
Figure 9ROC curve for the calculated thresholds using different exceedance probability levels (for Noah-MP at the surface layer). The “no gain” line and the optimal performance point (the red point) are also presented.
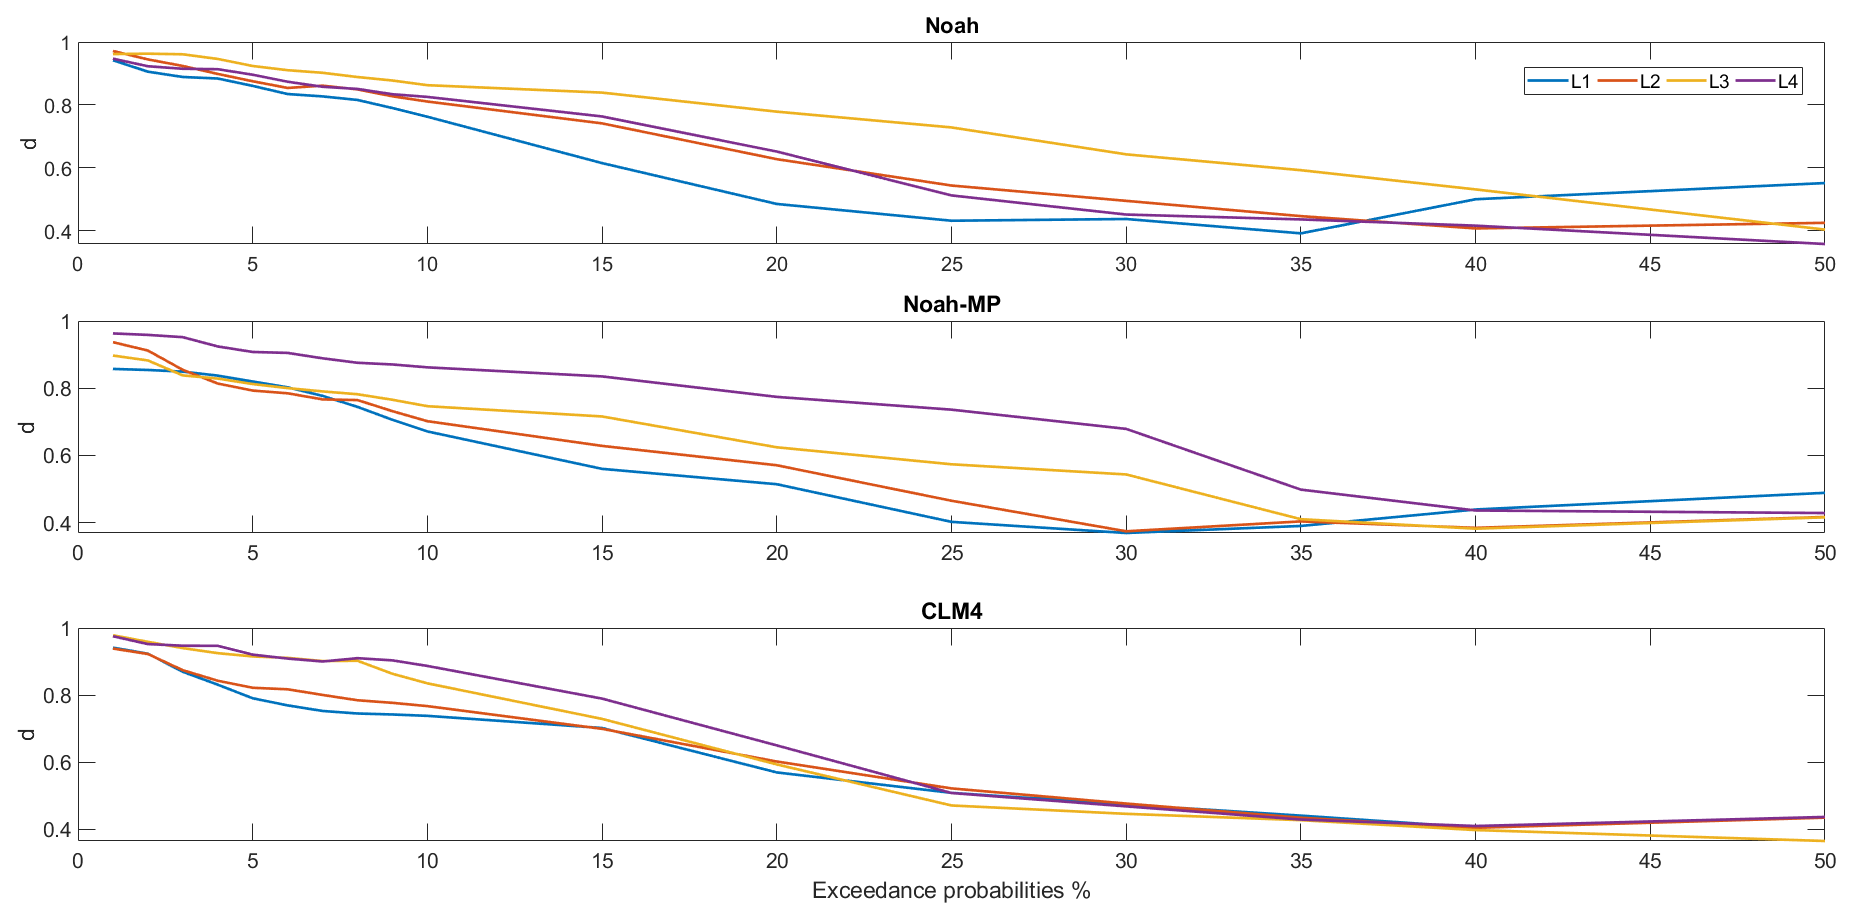
All the threshold models are then evaluated under the 45 selected rainfall events (Table 5) using the ROC analysis. Each threshold determined for each of the slope class during the calibration is used for the evaluation. The period of the selected rainfall events is between 1 and 18 d, and the average rainfall intensity ranges from 5.05 to 24.69 mm d−1. The resultant Euclidean distances (d) between each scenario of exceedance probability and the optimal point for ROC analysis are listed in Table 6 for all three WRF LSM schemes at the tested exceedance probabilities. The best performance (i.e. lowest d) in each column (i.e. each soil layer of an LSM scheme) is highlighted. In addition, the d results are also plotted in Fig. 8 to give a better view of the overall trend amongst different soil layers and LSM schemes. From the figure, for all three LSM schemes at all four soil layers, there is an overall downward and then stabilised trend. Overall for Noah, the simulated surface layer soil moisture provides better landslide monitoring performance than the rest of the soil layers from 1 % to 35 % exceedance probabilities; the scheme's worst performance is observed at the third soil layer, centred at 70 cm. The values of d for Noah's second and fourth layer are quite close to each other. For Noah-MP, the simulated surface layer soil moisture gives the best performance amongst all four soil layers for most cases between the 1 % and 35 % exceedance probability range; the scheme's worst performance is observed at the fourth layer. Unlike Noah, all four soil layers from the Noah-MP scheme provide a distinct performance amongst them (i.e. larger d difference). For CLM4, the performance for the surface layer is quite similar to the second layer's, and the differences between the four layers are small. From the Table 6, it can be seen that for Noah the most suitable exceedance probabilities (i.e. the highlighted numbers) range between 35 % and 50 %; for Noah-MP they are between 30 % and 50 %, and for CLM4 it stays at 40 % for all four soil layers. For both Noah and Noah-MP, the best performance is observed at the surface layer (d=0.392 and d=0.369, respectively). For CLM4, the best performances show no distinct pattern amongst soil layers (i.e. the best performance is found at the soil Layer 3, followed by Layers 2, 1, and 4). Of all the LSM schemes and soil layers, the best performance is found for Noah-MP at the surface layer with 30 % exceedance probability (d=0.369). Based on the d results, WRF-modelled soil moisture provides better landslide prediction performance than the satellite ESA-CCI soil moisture products as shown in our previous study (Zhuo et al., 2019), i.e. d=0.51). The ROC curve for the Noah-MP scheme at the surface layer is shown in Fig. 9. In the curve, each point represents a scenario with a selected exceedance probability level. It is clear that with various exceedance probabilities, FAR can be decreased without sacrificing the HR score (e.g. 4 % to 10 % exceedance probabilities). At the optimal point at the 30 % exceedance probability, the best results for HR and FAR are observed as 0.769 and 0.289, respectively.
In this study, the best landslide prediction performance for Noah and Noah-MP follows a regular trend: the deeper the soil layer, the poorer the landslide monitoring performance. There are several potential reasons for such an outcome. First, the simulated soil moisture accuracy at the shallower layers is better than that in the deeper zones. Second, although the wetness conditions at the sliding surface are important, the soil moisture above it is also important (i.e. the loading should be heavier with more water in the upper soil layer). Third, the landslides occurring in the region are mainly in the top shallow soil layer. Fourth, the WRF-modelled soil moisture is not accurate enough in assessing the landslide events in the study region. In order to find out the exact reasons, comprehensive studies with more detailed landslide event datasets are needed in the future.
For the WRF soil moisture evaluation, clearly the evaluation work based on a single soil moisture sensor located in a plain area is not sufficient to derive conclusions about the model's performance over the whole study region. Therefore, the results here are preliminary. However, in this study, by introducing the WRF spatial soil moisture information into the landslide prediction model, the performance has indeed been improved in comparison with our previous study using the satellite remote sensing soil moisture data (Zhuo et al., 2019). A similar concept has been carried out by Segoni et al. (2018b), who implemented the soil moisture information simulated from a hydrological model into a regional landslide early warning system with clear improvements in performance with regard to false alarms or missed alarms (i.e. when a hazard occurred but no early warning was provided). Although the results shown in this study are preliminary and confined to the study area, the improved landslide prediction performance is already obtained. Therefore, it is hoped that with more globally available and dense soil moisture network data and further refinements of the method, the results could be improved further.
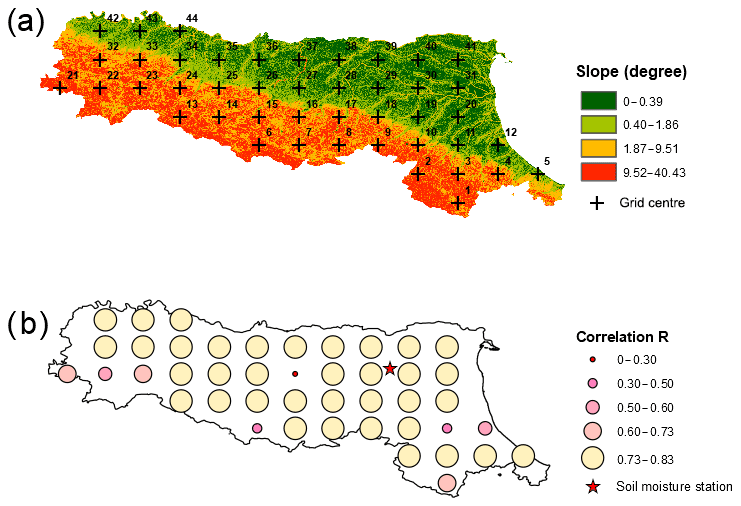
Figure 10The cross-validation of spatially distributed WRF soil moisture against the in situ soil moisture observation at the single-point soil moisture sensor in a plain area: (a) grid numbers shown on the slope map, (b) correlation spatial performance.
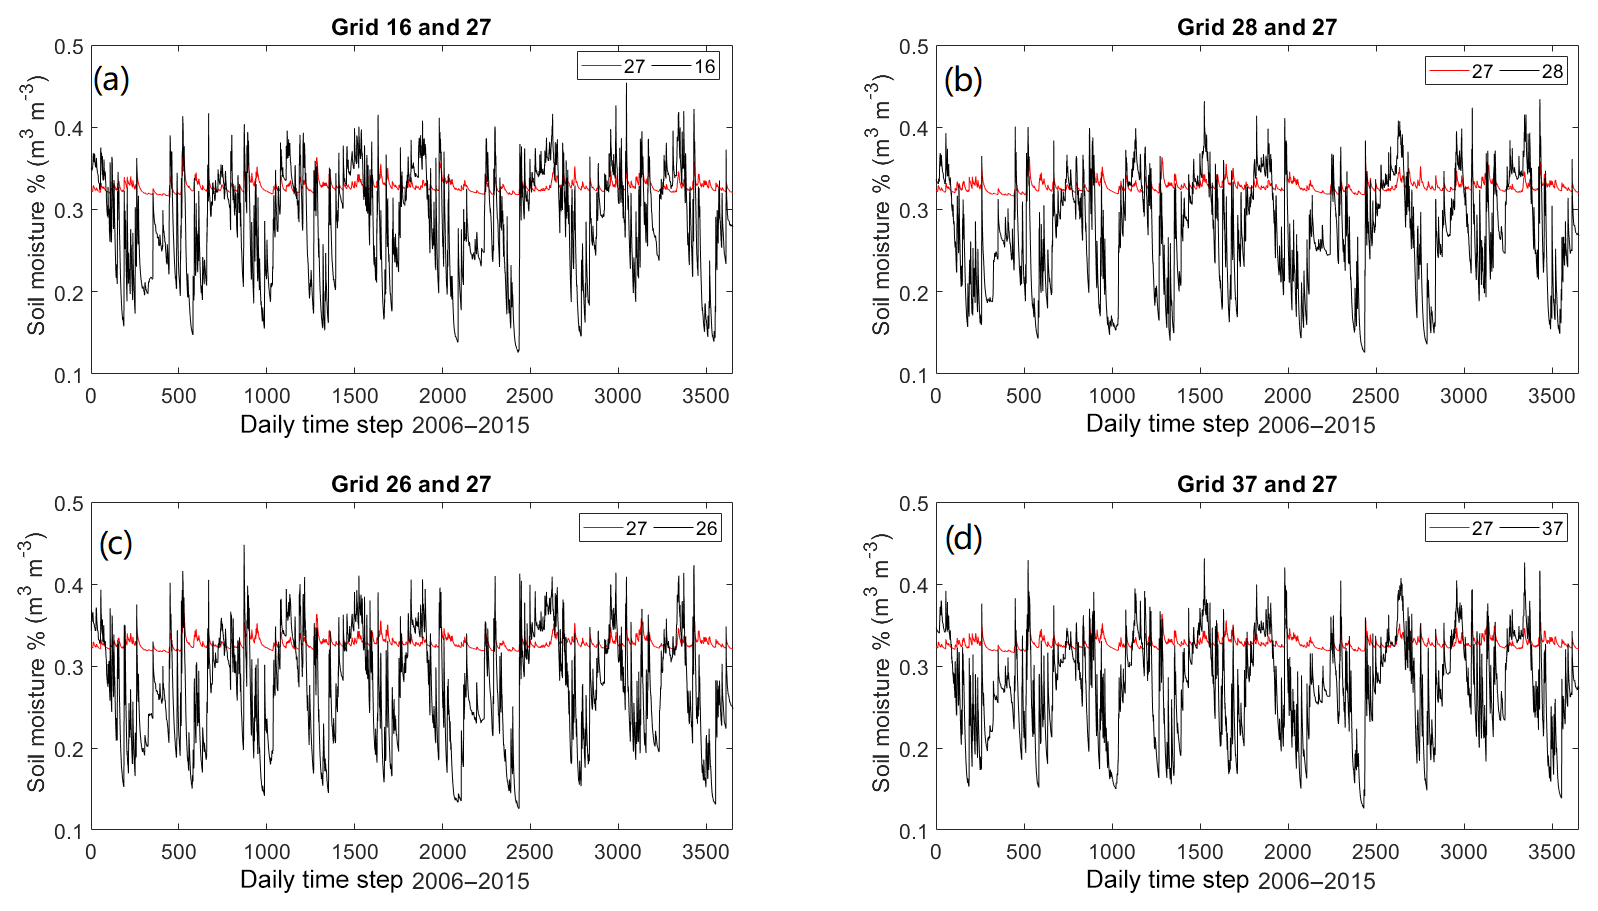
In addition, ideally, it will be useful if there is a dense soil moisture sensing network covering the whole study area. In reality, that is not practical, so we have to rely on the spatial soil moisture information by other means. So far, the soil moisture data with the best spatial and temporal resolution is from the WRF model. One question that arises is how representative a single soil moisture sensor can be for the whole study area. We have carried out the correlation study of a single sensor with the whole study region (using the Noah-MP top-layer soil moisture data). As seen in Fig. 10a, the study region is divided into 44 equally spaced grids (30 km apart), with the grid centres marked as black crosses. The initial assumption is that the soil moisture sensor can only represent its adjacent area, but the result was a surprise (Fig. 10b). Based on the outcome, a single-point sensor can represent a significant proportion of the region. Admittedly, there are some areas where the correlations are poor, in particular Grid 27, which has been compared with its surrounding four grids as shown in Fig. 11. It can be seen the soil moisture variation at Grid 27 is totally different in comparison with that of the four surrounding grids. The unique soil moisture variation pattern observed in Grid 27 may be caused by different land use and soil type in that area, but clearly further studies are needed to find out the exact reasons. The aforementioned work has prompted us to carry out a future study on the optimal soil moisture sensor network design for landside applications. Although there are numerous studies on the rain gauge network design by the research community, the soil moisture sensor network design has been largely ignored by the community. Hence, this study has paved a foundation for such research.
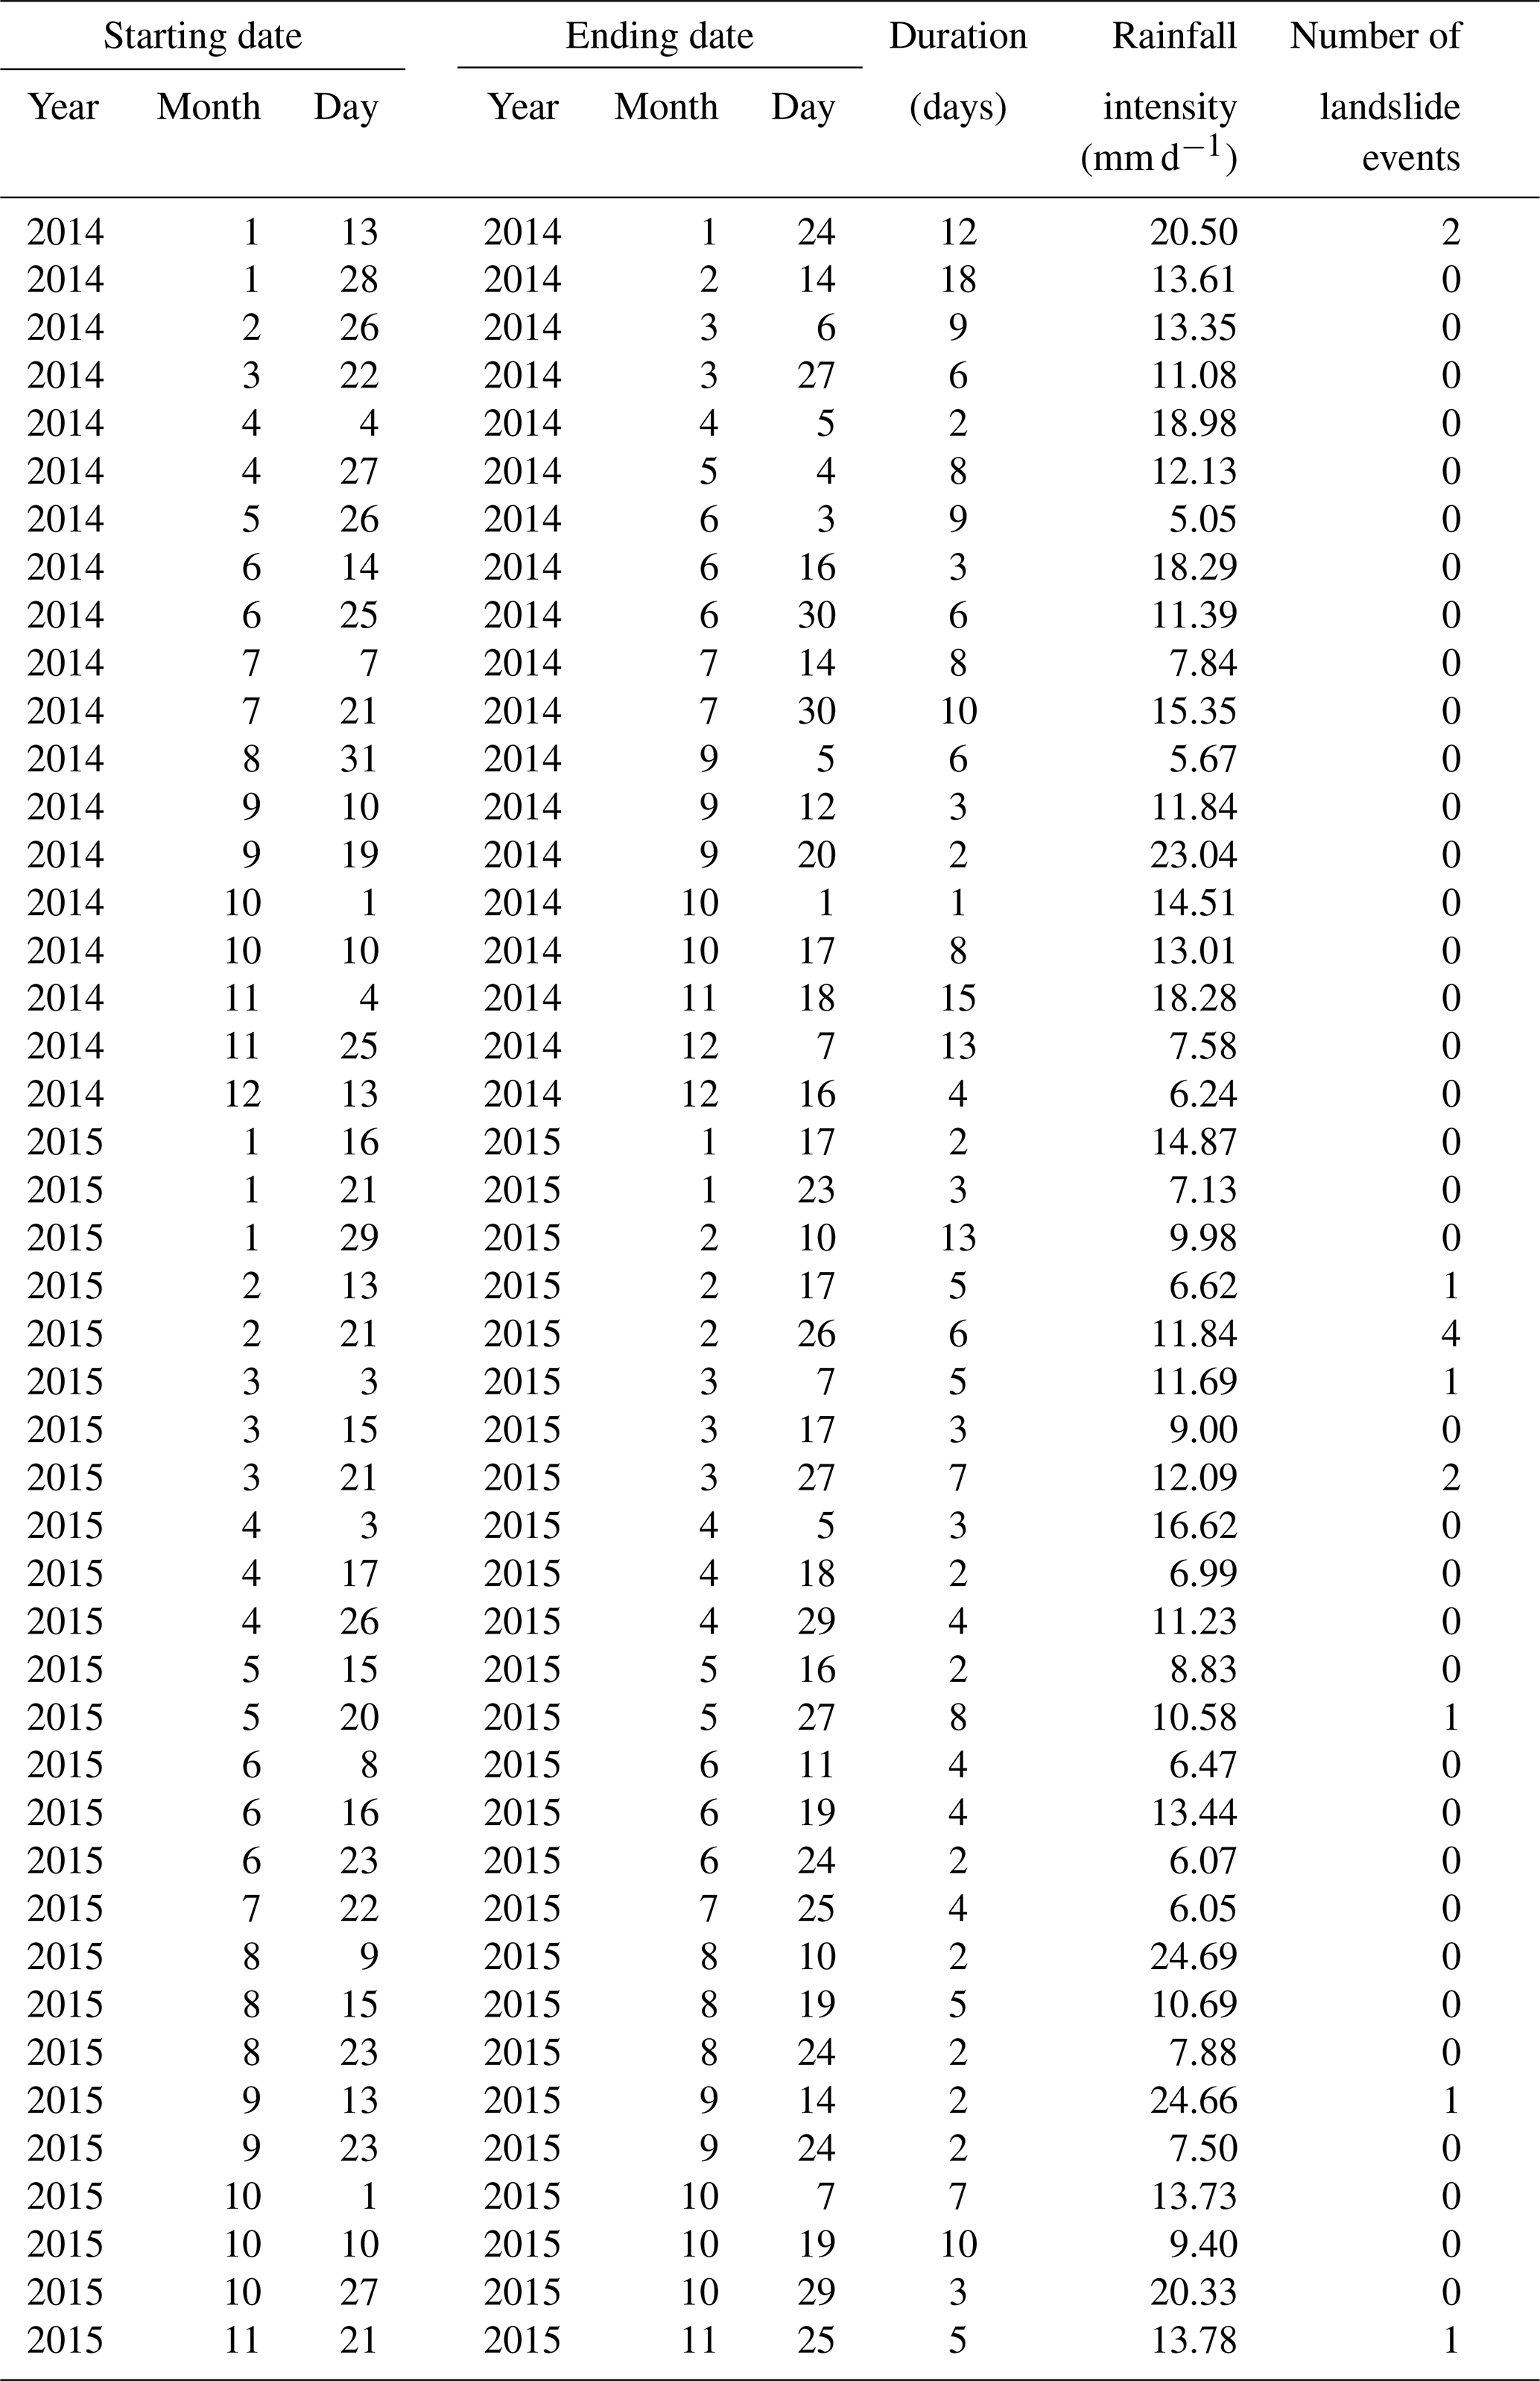
Table 6Results of Euclidean distances (d) between individual points and the optimal point for ROC analysis are listed. The best performance (i.e. lowest d) for each column (i.e. each soil layer of an LSM scheme) is highlighted. The optimal performance of all is highlighted in bold. EP: exceedance probability.

For the WRF rainfall evaluations, the results are not good. Rainfall is one of the main drivers of soil moisture change, and it is logical to think soil moisture and rainfall are highly linked. However, since rainfall is high-frequency data while soil moisture is low-frequency data, they behave differently. The results illustrate that for landslide study, it is better to use the WRF soil moisture data than its rainfall data. Clearly more studies are needed to confirm this assumption.
Here, WRF is modelled based on the ERA-Interim datasets; however, it has been found in Albergel et al. (2018) that the performance of the ERA5 has surpassed the ERA-Interim. Therefore, the ERA5 datasets will be tested in our future studies. Model-based soil moisture estimations could be affected by error accumulation issues, especially in the real-time forecasting mode. A potential solution is to use data assimilation methodologies to correct such errors by assimilating soil moisture information from other data sources. Since in situ soil moisture sensors are only sparsely available in limited regions, soil moisture measured via satellite remote sensing technologies could provide useful alternatives. Another issue is with the landslide record data, as most of them are based on human experiences (e.g. newspapers and victims) and thus a lot of incidences could be unreported. Therefore, the conclusion made here could be biased. Other ways of expanding the current landslide catalogue can depend on automatic landslide detection methods based on remote sensing images (Nichol and Wong, 2005; Chen et al., 2018), internet new sources (as all landslides with a relevant impact on society will be reported on internet new sources), and automatic web data mining methods (Battistini et al., 2013; Goswami et al., 2018).
In this study, the usability of WRF-modelled soil moisture for landslide monitoring has been evaluated in the Emilia Romagna region based on the research duration between 2006 and 2015. Specifically, the four-layer soil moisture information simulated through the WRF's three most advanced LSM schemes (i.e. Noah, Noah-MP, and CLM4) is compared for the purpose. Through the temporal comparison with the in situ soil moisture observations, it has been found that all three LSM schemes at all four soil layers can produce the general soil moisture's seasonal cycle. However, only Noah-MP is able to simulate the large soil drying phenomenon close to the observations during the drying season, and it also has the highest correlation coefficient and the lowest RMSE at most soil layers amongst the three LSM schemes. However, it should be noted, the soil moisture evaluation is only based on a single-point-based soil moisture sensor that is available in the plain region of the study area. Therefore, the WRF soil moisture performance over the whole study region, in particular at the mountainous zone, cannot be evaluated in this study. Since soil moisture is related to rainfall, we have carried out the WRF rainfall assessments, based on the comparison with the dense rainfall network in the region. The results have shown that there is no distinct difference between the three LSM schemes. The WRF rainfall performance is found to be similar to a study carried out in the central USA (Van Den Broeke et al., 2018). A landslide prediction model based on soil moisture and slope angle condition is built up, and 17 various exceedance probably levels between 1 % and 50 % are adopted to find the optimal threshold scenario. Through the ROC analysis of 612 threshold models, the best performance is obtained by the Noah-MP at the surface soil layer with 30 % exceedance probability.
In summary, this study provides an overview of the soil moisture performance of three WRF LSM schemes for landslide hazard assessment. Based on the results, we demonstrate that the surface soil moisture (centred at 10 cm) simulated through the Noah-MP LSM scheme is useful in predicting landslide occurrences in the Emilia Romagna region. With the hit rate of 0.769 and the false alarm rate of 0.289 obtained in this study, such soil moisture information has the potential to provide landslide predictions through the use of rainfall data. Further study on the soil moisture representation of a single soil moisture sensor over a large region has also been carried out. The results demonstrate that although there is a significant elevation difference in the region, a single soil moisture sensor has a high correlation with a significant proportion of the study area. Although there is still a small proportion of areas where the correlation is poor, this has prompted us to carry out a future study on the optimal design of soil moisture sensor network for landslide study.
One must bear in mind that although the results demonstrated in this study are only valid for the selected region, the methodology could be generalised to derive site-specific calibrations in other sites using the proposed approach. In order to make a general conclusion, more research is needed using the methodology described in this paper. Particularly, a considerable number of catchments with a broad spectrum of climate and environmental conditions and dense soil moisture sensor networks will need to be investigated.
The in situ soil moisture and rainfall data can be downloaded from http://www.smr.arpa.emr.it/dext3r/ (DEXT3R, 2019); the Landslide inventory data were kindly provided by Dr Matteo Berti, University of Bologna.
LZ carried out the modelling of WRF, evaluated its soil moisture performance in landslide prediction, and prepared the paper with contributions from all co-authors. QD and BZ processed the in situ rain gauge datasets (>200 rain gauge stations). DH and NC provided guidance on the paper's main research direction and are the funding holders of this project in the UK and China, respectively.
The authors declare that they have no conflict of interest.
This research has been supported by the National Natural Science Foundation of China (NSFC, grant no. 41871299), Resilient Economy and Society by Integrated SysTems modelling (RESIST) project, through the Newton Fund via Natural Environment Research Council (NERC) and Economic and Social Research Council (ESRC) (grant no. NE/N012143/1), and NSFC (grant no. 4151101234).
This paper was edited by Roberto Greco and reviewed by two anonymous referees.
Albergel, C., Dutra, E., Munier, S., Calvet, J.-C., Munoz-Sabater, J., de Rosnay, P., and Balsamo, G.: ERA-5 and ERA-Interim driven ISBA land surface model simulations: which one performs better?, Hydrol. Earth Syst. Sci., 22, 3515–3532, https://doi.org/10.5194/hess-22-3515-2018, 2018.
Battistini, A., Segoni, S., Manzo, G., Catani, F., and Casagli, N. J. A. G.: Web data mining for automatic inventory of geohazards at national scale, Appl. Geogr., 43, 147–158, 2013.
Berry, P., Garlick, J., and Smith, R.: Near-global validation of the SRTM DEM using satellite radar altimetry, Remote Sens. Environ., 106, 17–27, 2007.
Berti, M., Martina, M., Franceschini, S., Pignone, S., Simoni, A., and Pizziolo, M.: Probabilistic rainfall thresholds for landslide occurrence using a Bayesian approach, J. Geophys. Res.-Ea. Surf., 117, F04006, https://doi.org/10.1029/2012JF002367, 2012.
Bertolini, G., Guida, M., and Pizziolo, M. J. L.: Landslides in Emilia-Romagna region (Italy): strategies for hazard assessment and risk management, Landslides, 2, 302–312, 2005.
Bittelli, M., Valentino, R., Salvatorelli, F., and Pisa, P. R.: Monitoring soil-water and displacement conditions leading to landslide occurrence in partially saturated clays, Geomorphology, 173, 161–173, 2012.
Bogaard, T. and Greco, R.: Invited perspectives: Hydrological perspectives on precipitation intensity-duration thresholds for landslide initiation: proposing hydro-meteorological thresholds, Nat. Hazards Earth Syst. Sci., 18, 31–39, https://doi.org/10.5194/nhess-18-31-2018, 2018.
Cai, X.: Hydrological assessment and biogeochemical advancement of the Noah-MP land surface model, Doctor of Philosophy, Geological Sciences, The University of Texas at Austin, Austin, Texas, 164 pp., 2015.
Cai, X., Yang, Z. L., Xia, Y., Huang, M., Wei, H., Leung, L. R., and Ek, M. B.: Assessment of simulated water balance from Noah, Noah-MP, CLM, and VIC over CONUS using the NLDAS test bed, J. Geophys. Res.-Atmos., 119, 13751–13770, 2014.
Chae, B.-G., Park, H.-J., Catani, F., Simoni, A., and Berti, M.: Landslide prediction, monitoring and early warning: a concise review of state-of-the-art, Geosci. J., 21, 1033–1070, 2017.
Chen, F. and Dudhia, J.: Coupling an advanced land surface-hydrology model with the Penn State-NCAR MM5 modeling system. Part I: Model implementation and sensitivity, Mon. Weather Rev., 129, 569–585, 2001.
Chen, Z., Zhang, Y., Ouyang, C., Zhang, F., and Ma, J. J. S.: Automated landslides detection for mountain cities using multi-temporal remote sensing imagery, Sensors, 821, 1–18, https://doi.org/10.3390/s18030821, 2018.
Ciabatta, L., Camici, S., Brocca, L., Ponziani, F., Stelluti, M., Berni, N., and Moramarco, T. J. J. O. H.: Assessing the impact of climate-change scenarios on landslide occurrence in Umbria Region, Italy, J. Hydrol., 541, 285–295, 2016.
Crozier, M. J.: Prediction of rainfall-triggered landslides: A test of the antecedent water status model, Earth Surf. Proc. Land., 24, 825–833, 1999.
Dee, D. P., Uppala, S. M., Simmons, A., Berrisford, P., Poli, P., Kobayashi, S., Andrae, U., Balmaseda, M., Balsamo, G., and Bauer, D. P.: The ERA-Interim reanalysis: Configuration and performance of the data assimilation system, Q. J. Roy. Meteorol. Soc., 137, 553–597, 2011.
DEXT3R: Emilia-Romagna data, available at: http://www.smr.arpa.emr.it/dext3r/, last access: 15 October 2019.
Dorigo, W., Wagner, W., Albergel, C., Albrecht, F., Balsamo, G., Brocca, L., Chung, D., Ertl, M., Forkel, M., and Gruber, A.: ESA CCI Soil Moisture for improved Earth system understanding: State-of-the art and future directions, Remote Sensing of Environment, 203, 185-215, 2017.
Dudhia, J.: Numerical study of convection observed during the winter monsoon experiment using a mesoscale two-dimensional model, J. Atmos. Sci., 46, 3077–3107, 1989.
Ek, M., Mitchell, K., Lin, Y., Rogers, E., Grunmann, P., Koren, V., Gayno, G., and Tarpley, J.: Implementation of Noah land surface model advances in the National Centers for Environmental Prediction operational mesoscale Eta model, J. Geophys. Res.-Atmos., 108, 8851, https://doi.org/10.1029/2002JD003296, 2003.
Fawcett, T.: An introduction to ROC analysis, Pattern Recog. Lett., 27, 861–874, 2006.
Gao, Q., Zribi, M., Escorihuela, M., and Baghdadi, N. J. S.: Synergetic use of Sentinel-1 and Sentinel-2 data for soil moisture mapping at 100 m resolution, Sensors, 17, 1966, https://doi.org/10.3390/s17091966, 2017.
Gariano, S. L., Brunetti, M. T., Iovine, G., Melillo, M., Peruccacci, S., Terranova, O., Vennari, C., and Guzzetti, F.: Calibration and validation of rainfall thresholds for shallow landslide forecasting in Sicily, southern Italy, Geomorphology, 228, 653–665, 2015.
Geudtner, D., Torres, R., Snoeij, P., Davidson, M., and Rommen, B.: Sentinel-1 system capabilities and applications, in: 2014 IEEE Geoscience and Remote Sensing Symposium, 13–18 July 2014, Quebec City, QC, Canada, 1457–1460, 2014.
Gilliland, E. K. and Rowe, C. M.: A comparison of cumulus parameterization schemes in the WRF model, in: Proceedings of the 87th AMS Annual Meeting & 21th Conference on Hydrology, 15–18 January 2007, San Antonio, Texas, USA, 2007,
Glade, T., Crozier, M., and Smith, P.: Applying probability determination to refine landslide-triggering rainfall thresholds using an empirical “Antecedent Daily Rainfall Model”, Pure Appl. Geophys., 157, 1059–1079, 2000.
Goswami, S., Chakraborty, S., Ghosh, S., Chakrabarti, A., and Chakraborty, B. J. A. S. E. J.: A review on application of data mining techniques to combat natural disasters, Ain Shams Eng. J., 9, 365–378, 2018.
Greve, P., Warrach-Sagi, K., and Wulfmeyer, V.: Evaluating soil water content in a WRF-Noah downscaling experiment, J. Appl. Meteorol. Clim., 52, 2312–2327, 2013.
Hawke, R. and McConchie, J.: In situ measurement of soil moisture and pore-water pressures in an `incipient' landslide: Lake Tutira, New Zealand, J. Environ. Manage., 92, 266–274, 2011.
Hong, S.-Y., Noh, Y., and Dudhia, J.: A new vertical diffusion package with an explicit treatment of entrainment processes, Mon. Weather Rev., 134, 2318–2341, 2006.
Hosmer, D. and Lemeshow, S.: Applied logistic regression, John Wiley & Sons, New York, 1989.
Jiménez, P. A., Dudhia, J., González-Rouco, J. F., Navarro, J., Montávez, J. P., and García-Bustamante, E.: A revised scheme for the WRF surface layer formulation, Mon. Weather Rev., 140, 898–918, 2012.
Jordan, R.: A one-dimensional temperature model for a snow cover: Technical documentation for SNTHERM 89, US Army Cold Regions Research and Engineering Laboratory Special Report 91-16, 49 pp., 1991.
Kain, J. S.: The Kain–Fritsch convective parameterization: An update, J. Appl. Meteorol., 43, 170–181, https://doi.org/10.1175/1520-0450(2004)043<0170:TKCPAU>2.0.CO;2, 2004.
Klose, M., Highland, L., Damm, B., and Terhorst, B.: Estimation of Direct Landslide Costs in Industrialized Countries: Challenges, Concepts, and Case Study, in: Landslide Science for a Safer Geoenvironment, World Landslide Forum 3, Beijing, China, 661–667, 2014.
Lagomarsino, D., Segoni, S., Fanti, R., and Catani, F. J. L.: Updating and tuning a regional-scale landslide early warning system, Landslides, 10, 91–97, 2013.
Lagomarsino, D., Segoni, S., Rosi, A., Rossi, G., Battistini, A., Catani, F., and Casagli, N.: Quantitative comparison between two different methodologies to define rainfall thresholds for landslide forecasting, Nat. Hazards Earth Syst. Sci., 15, 2413–2423, https://doi.org/10.5194/nhess-15-2413-2015, 2015.
Lawrence, D. M. and Slater, A. G.: Incorporating organic soil into a global climate model, Clim. Dynam., 30, 145–160, 2008.
Lawrence, D. M., Oleson, K. W., Flanner, M. G., Thornton, P. E., Swenson, S. C., Lawrence, P. J., Zeng, X., Yang, Z. L., Levis, S., and Sakaguchi, K.: Parameterization improvements and functional and structural advances in version 4 of the Community Land Model, J. Adv. Model. Earth Syst., 3, 27, https://doi.org/10.1029/2011MS000045, 2011.
Lawrence, D. M., Oleson, K. W., Flanner, M. G., Fletcher, C. G., Lawrence, P. J., Levis, S., Swenson, S. C., and Bonan, G. B.: The CCSM4 land simulation, 1850–2005: Assessment of surface climate and new capabilities, J. Climate, 25, 2240–2260, 2012.
Leung, L. R. and Qian, Y.: Atmospheric rivers induced heavy precipitation and flooding in the western US simulated by the WRF regional climate model, Geophys. Res. Lett., 36, L03820, https://doi.org/10.1029/2008GL036445, 2009.
Liang, X., Xie, Z., and Huang, M.: A new parameterization for surface and groundwater interactions and its impact on water budgets with the variable infiltration capacity (VIC) land surface model, J. Geophys. Res.-Atmos., 108, 8613, https://doi.org/10.1029/2002JD003090, 2003.
Maheu, A., Anctil, F., Gaborit, É., Fortin, V., Nadeau, D. F., and Therrien, R.: A field evaluation of soil moisture modelling with the Soil, Vegetation, and Snow (SVS) land surface model using evapotranspiration observations as forcing data, J. Hydrol., 558, 532–545, 2018.
Martelloni, G., Segoni, S., Fanti, R., and Catani, F. J. L.: Rainfall thresholds for the forecasting of landslide occurrence at regional scale, 9, 485-495, 2012.
Mlawer, E. J., Taubman, S. J., Brown, P. D., Iacono, M. J., and Clough, S. A.: Radiative transfer for inhomogeneous atmospheres: RRTM, a validated correlated-k model for the longwave, J. Geophys. Res.- Atmos., 102, 16663–16682, 1997.
Nichol, J. and Wong, M. J. I. J. O. R. S.: Satellite remote sensing for detailed landslide inventories using change detection and image fusion, Int. J. Remote Sens., 26, 1913–1926, 2005.
Niu, G. Y., Yang, Z. L., Dickinson, R. E., and Gulden, L. E.: A simple TOPMODEL-based runoff parameterization (SIMTOP) for use in global climate models, J. Geophys. Res.-Atmos., 110, D21106, https://doi.org/10.1029/2005JD006111, 2005.
Niu, G. Y., Yang, Z. L., Dickinson, R. E., Gulden, L. E., and Su, H.: Development of a simple groundwater model for use in climate models and evaluation with Gravity Recovery and Climate Experiment data, J. Geophys. Res.-Atmos., 112, D07103, https://doi.org/10.1029/2006JD007522, 2007.
Niu, G. Y., Yang, Z. L., Mitchell, K. E., Chen, F., Ek, M. B., Barlage, M., Kumar, A., Manning, K., Niyogi, D., and Rosero, E.: The community Noah land surface model with multiparameterization options (Noah-MP): 1. Model description and evaluation with local-scale measurements, J. Geophys. Res.-Atmos., 116, D12109, https://doi.org/10.1029/2010JD015139, 2011.
Oleson, K. W., Niu, G. Y., Yang, Z. L., Lawrence, D., Thornton, P., Lawrence, P., Stöckli, R., Dickinson, R., Bonan, G., and Levis, S.: Improvements to the Community Land Model and their impact on the hydrological cycle, J. Geophys. Res.-Biogeo., 113, G01021, https://doi.org/10.1029/2007JG000563, 2008.
Oleson, K. W., Lawrence, D. M., Gordon, B., Flanner, M. G., Kluzek, E., Peter, J., Levis, S., Swenson, S. C., Thornton, E., and Feddema, J.: Technical description of version 4.0 of the Community Land Model (CLM), NCAR Tech. Note NCAR/TN‐478+STR, National Center for Atmospheric Research, Boulder, Colorado, 257 pp., 2010.
Paloscia, S., Pettinato, S., Santi, E., Notarnicola, C., Pasolli, L., and Reppucci, A. J. R. S. O. E.: Soil moisture mapping using Sentinel-1 images: Algorithm and preliminary validation, Remote Sens. Environ., 134, 234—48, 2013.
Pistocchi, A., Bouraoui, F., and Bittelli, M.: A simplified parameterization of the monthly topsoil water budget, Water Resour. Res., 44, W12440, https://doi.org/10.1029/2007WR006603, 2008.
Ponziani, F., Pandolfo, C., Stelluti, M., Berni, N., Brocca, L., and Moramarco, T. J. L.: Assessment of rainfall thresholds and soil moisture modeling for operational hydrogeological risk prevention in the Umbria region (central Italy), Landslides, 9, 229–237, 2012.
Posner, A. J. and Georgakakos, K. P.: Soil moisture and precipitation thresholds for real-time landslide prediction in El Salvador, Landslides, 12, 1179–1196, 2015.
Rossi, M., Witt, A., Guzzetti, F., Malamud, B. D., and Peruccacci, S.: Analysis of historical landslide time series in the Emilia‐Romagna region, northern Italy, Earth Surf. Proc. Landf., 35, 1123–1137, 2010.
Segoni, S., Lagomarsino, D., Fanti, R., Moretti, S., and Casagli, N.: Integration of rainfall thresholds and susceptibility maps in the Emilia Romagna (Italy) regional-scale landslide warning system, Landslides, 12, 773–785, 2015.
Segoni, S., Rosi, A., Fanti, R., Gallucci, A., Monni, A., and Casagli, N.: A Regional-Scale Landslide Warning System Based on 20 Years of Operational Experience, Water, 10, 1297, https://doi.org/10.3390/w10101297, 2018a.
Segoni, S., Rosi, A., Lagomarsino, D., Fanti, R., and Casagli, N.: Brief communication: Using averaged soil moisture estimates to improve the performances of a regional-scale landslide early warning system, Nat. Hazards Earth Syst. Sci., 18, 807–812, https://doi.org/10.5194/nhess-18-807-2018, 2018b.
Skamarock, W. C., Klemp, J. B., Dudhia, J., Gill, D. O., Barker, D. M., Wang, W., and Powers, J. G.: A description of the advanced research WRF version 2, National Center For Atmospheric Research, Boulder, Colorado, USA, 2005.
Skamarock, W. C., Klemp, J., Dudhia, J., Gill, D., Barker, D., Duda, M., Huang, X., Wang, W., and Powers, J.: A description of the advanced research WRF Version 3, NCAR technical note, Mesoscale and Microscale Meteorology Division, National Center for Atmospheric Research, Boulder, Colorado, USA, 2008.
Srivastava, P. K., Han, D., Rico-Ramirez, M. A., Al-Shrafany, D., and Islam, T.: Data fusion techniques for improving soil moisture deficit using SMOS satellite and WRF-NOAH land surface model, Water Resour. Manage., 27, 5069–5087, 2013a.
Srivastava, P. K., Han, D., Rico Ramirez, M. A., and Islam, T.: Comparative assessment of evapotranspiration derived from NCEP and ECMWF global datasets through Weather Research and Forecasting model, Atmos. Sci. Lett., 14, 118–125, 2013b.
Srivastava, P. K., Han, D., Rico-Ramirez, M. A., O'Neill, P., Islam, T., Gupta, M., and Dai, Q.: Performance evaluation of WRF-Noah Land surface model estimated soil moisture for hydrological application: Synergistic evaluation using SMOS retrieved soil moisture, J. Hydrol., 529, 200–212, 2015.
Stéfanon, M., Drobinski, P., D'Andrea, F., Lebeaupin-Brossier, C., and Bastin, S.: Soil moisture-temperature feedbacks at meso-scale during summer heat waves over Western Europe, Clim. Dynam., 42, 1309–1324, 2014.
Temimi, M., Leconte, R., Chaouch, N., Sukumal, P., Khanbilvardi, R., and Brissette, F.: A combination of remote sensing data and topographic attributes for the spatial and temporal monitoring of soil wetness, J. Hydrol., 388, 28–40, 2010.
Thompson, G., Field, P. R., Rasmussen, R. M., and Hall, W. D.: Explicit forecasts of winter precipitation using an improved bulk microphysics scheme. Part II: Implementation of a new snow parameterization, Mon. Weather Rev., 136, 5095–5115, 2008.
Tsai, T.-L. and Chen, H.-F.: Effects of degree of saturation on shallow landslides triggered by rainfall, Environ. Earth Sci., 59, 1285–1295, 2010.
Valenzuela, P., Domínguez-Cuesta, M. J., García, M. A. M., and Jiménez-Sánchez, M.: Rainfall thresholds for the triggering of landslides considering previous soil moisture conditions (Asturias, NW Spain), Landslides, 15, 273–282, 2018.
Van Den Broeke, M. S., Kalin, A., Alavez, J. A. T., Oglesby, R., Hu, Q. J. T., and climatology, a.: A warm-season comparison of WRF coupled to the CLM4.0, Noah-MP, and Bucket hydrology land surface schemes over the central USA, Theor. Appl. Climatol., 134, 801–816, 2018.
Wei, J., Dirmeyer, P. A., Guo, Z., Zhang, L., and Misra, V.: How much do different land models matter for climate simulation? Part I: Climatology and variability, J. Climate, 23, 3120–3134, 2010.
Wharton, S., Simpson, M., Osuna, J., Newman, J., and Biraud, S.: Assessment of Land Surface Model Performance in WRF for Simulating Wind at Heights Relevant to the Wind Energy Community, Lawrence Livermore National Lab (LLNL), Livermore, CA , USA, 2013.
Wilks, D.: Statistical Methods in the Atmospheric Sciences, 3rd Edn., Academic Press, Oxford, UK, 2011.
Yang, Z. L., Niu, G. Y., Mitchell, K. E., Chen, F., Ek, M. B., Barlage, M., Longuevergne, L., Manning, K., Niyogi, D., and Tewari, M.: The community Noah land surface model with multiparameterization options (Noah-MP): 2. Evaluation over global river basins, J. Geophys. Res.-Atmos., 116, D12110, https://doi.org/10.1029/2010JD015140, 2011.
Zaidi, S. M. and Gisen, J. I. A.: Evaluation of Weather Research and Forecasting (WRF) Microphysics single moment class-3 and class-6 in Precipitation Forecast, in: MATEC Web of Conferences, 03007, https://doi.org/10.1051/matecconf/201815003007, 2018.
Zaitchik, B. F., Santanello, J. A., Kumar, S. V., and Peters-Lidard, C. D.: Representation of soil moisture feedbacks during drought in NASA unified WRF (NU-WRF), J. Hydrometeorol., 14, 360–367, 2013.
Zeng, X. and Decker, M.: Improving the numerical solution of soil moisture-based Richards equation for land models with a deep or shallow water table, J. Hydrometeorol., 10, 308–319, 2009.
Zhao, B., Dai, Q., Han, D., Dai, H., Mao, J., and Zhuo, L.: Antecedent wetness and rainfall information in landslide threshold definition, Hydrol. Earth Syst. Sci. Discuss., https://doi.org/10.5194/hess-2019-150, 2019a.
Zhao, B., Dai, Q., Han, D., Dai, H., Mao, J., and Zhuo, L. J. J. O. H.: Probabilistic thresholds for landslides warning by integrating soil moisture conditions with rainfall thresholds, J. Hydrol., 574, 276–287, 2019b.
Zhuo, L., Dai, Q., and Han, D.: Evaluation of SMOS soil moisture retrievals over the central United States for hydro-meteorological application, Phys. Chem. Earth Pt. A/B/C, 83, 146–155, 2015a.
Zhuo, L., Han, D., Dai, Q., Islam, T., and Srivastava, P. K.: Appraisal of NLDAS-2 multi-model simulated soil moistures for hydrological modelling, Water Resour. Mange., 29, 3503–3517, 2015b.
Zhuo, L., Dai, Q., Han, D., Chen, N., Zhao, B., and Berti, M.: Evaluation of remotely sensed soil moisture for landslide hazard assessment, IEEE J. Select. Top. Appl. Earth Obs. Rem. Sens., 12, 162–173, 2019.