the Creative Commons Attribution 4.0 License.
the Creative Commons Attribution 4.0 License.
 | 25 Sep 2019
Global-scale human pressure evolution imprints on sustainability of river systems
Francesco Laio
Alberto Montanari
Human pressures on river systems pose a major threat to the sustainable development of human societies in the twenty-first century. Previous studies showed that a large part of global river systems was already exposed to relevant anthropogenic pressures at the beginning of this century. A relevant question that has never been explained in the literature so far is whether these pressures are increasing in time, therefore representing a potential future challenge to the sustainability of river systems. This paper proposes an index we call “Differential Human Pressure on Rivers” (DHPR) to quantify the annual evolution of human pressure on river systems. DHPR identifies a per-year percentage increment (or decrement) of normalized human pressures on river systems (i.e., ratio of annual values to long-term average). This index, based on annual nightlights and stationary discharge data, is estimated for 2195 major river basins over a period of 22 years, from 1992 to 2013. The results show that normalized annual human pressure on river systems increased globally, as indicated by an average DHPR value of 1.9 % per year, whereby the greatest increase occurred in the northern tropical and equatorial areas. The evaluation of DHPR over this 22-year period allows the identification of hot-spot areas, therefore offering guidance on where the development and implementation of mitigation strategies and plans are most needed (i.e., where human pressure is strongly increasing).
- Article
(1789 KB) - Full-text XML
-
Supplement
(2478 KB) - BibTeX
- EndNote


The detrimental effects of anthropogenic activities on river systems have been reported extensively (Barnett et al., 2008; Haddeland et al., 2014; Padowski et al., 2015; Steffen et al., 2015; UNWWAP, 2015; Veldkamp et al., 2017). Increasing anthropogenic activities, demographic expansion and the improvement of living standards are threatening sustainability at a global level. The development of human activities and associated human pressure on river systems often results in the emergence of threats to water security, from both human and river biodiversity perspectives (Vörösmarty et al., 2000c, 2010; Falkenmark, 2013; Wada and Bierkens, 2014; World Economic Forum, 2015; Kummu et al., 2016; Mekonnen and Hoekstra, 2016). There is an urgent need to manage and guide this development by strategies that consider how human pressure on river systems can be sustainable in the long term.
Human–water interactions controlling human pressure on river systems should be analyzed at a detailed level, based on local knowledge of the spatial distribution of river discharge, human population and associated interrelationships (Kummu et al., 2011; Meybeck et al., 2013). In order to compare, identify and prioritize areas of high human pressure across the globe, estimates of human pressures should be assessed at global scale. Understanding the spatial and temporal patterns in human pressure on river systems is fundamental for the development and implementation of targeted strategies.
A first high-resolution global-scale assessment of human pressure on river systems (Vörösmarty et al., 2010) showed severe water threat levels for nearly 4.8 billion people. In that study, the most threatened areas were located across the United States, Europe, central Asia, India, eastern China and the Middle East. While that analysis showed the relevance and extent of the problem and the need to take action, it is now important to understand how this issue developed and how it is likely to progress in time. Only when the historic development and the key factors that triggered it are understood can reality-based targets be established and sound strategies be developed. In this context, recent efforts focusing on the terrestrial system provided updated estimates of the global human footprint (Sanderson et al., 2002) monitoring changes from 1993 to 2009 (Venter et al., 2016a, b).
Powerful tools are now available to carry out this analysis. Earth system modeling and remote sensing observations have produced global datasets that provide unprecedented possibilities to analyze and identify human pressures on river systems, as well as their progress in time. There is information on human presence and activity (EC-JRC, 2015; CIESIN, 2018; NOAA, 2017), river and watershed delineation (Lehner et al., 2008; Fekete et al., 2001), river discharge (Fekete et al., 2002), and water-related threats (Vörösmarty et al., 2010) that can be analyzed independently or combined to provide insight on human–water interactions.
We propose a methodology for analyzing and mapping the historic evolution of human pressure on rivers. Given a river site and its contributing area, human pressure on river systems is defined as the ratio between the cumulative human presence and activity across the contributing area and the natural discharge generated within the same contributing area. We estimate human presence and activity, which is mainly linked to population density and level of development, by analyzing nightlights, retrieved from satellite images monitoring nocturnal luminosities. Natural discharge values, which epitomize surface hydrological processes within a river basin, are computed from runoff data. Nightlights and river runoff are selected as the key variables to calculate human pressure on river systems because of the availability of valuable global-scale and spatially explicit data that allows the analysis over time. More specifically, we compute human pressure on river systems on an annual basis, where human presence and activity varies across years, while natural discharge is assumed to be stationary during the study period. We therefore take the catchment as the spatial entity whereon human pressure on river systems is evaluated and then measure its annual evolution by defining the Differential Human Pressure on Rivers (DHPR) index. DHPR is computed as the annual time derivative of human pressure on river systems and identifies a per-year percentage increment (or decrement) of normalized human pressures (i.e., ratio of annual values to long-term average). Global-scale DHPR values are estimated for the period 1992–2013 for 2195 major river basins. DHPR can be used to identify hot-spot areas of change where there is a marked and consistent increase of human pressure on river systems over time. This is valuable information on which a robust planning strategy can be based, targeting actions to address water threats in key areas and bearing important implications for a sustainable development of human societies close to river systems in the near future. To prove the validity of our methodology, the relationship between human pressure on river systems and existing datasets, i.e., water threats (Vörösmarty et al., 2010) and the terrestrial human footprint (Venter et al., 2016a), is investigated. Global values of human pressure are contrasted with the corresponding water threat and human footprint values.
The paper is organized as follows. In Sect. 2 we describe the data and the methodology developed for the estimation of global-scale DHPR values, including also the correlation analysis with alternative datasets. The main outcomes are reported in Sect. 3. Results are then discussed in Sect. 4, including also some concluding remarks.
2.1 Global-scale river network and runoff data
The Simulated Topological Network STN-30 (Vörösmarty et al., 2000a, b; Fekete et al., 2001) was the digital river network used in this work. The STN-30 river network originates from a 0.5∘ flow direction grid (i.e., nearly 55 km at the Equator) and offers many different river attributes, such as drainage area, river length, distance to river outlet and river basin delineation. We compute average annual natural river discharge as derived from the Global Composite Runoff Fields dataset (Fekete et al., 2002), which provides long-term mean annual runoff data along the STN-30 river network. Natural river discharge was derived from a routing scheme based on flow direction paths along the STN-30 as follows (see Figs. 1b and S1c in the Supplement):
where Qi (km3 yr−1) is the long-term mean annual discharge in any grid cell i; Rj (km yr−1) and Aj (km2) are the long-term mean annual specific runoff (i.e., per unit area) (Fekete et al., 2002) and the area of grid cells j, respectively. The identifier Ni is coincident with the number of upstream grid cells j.
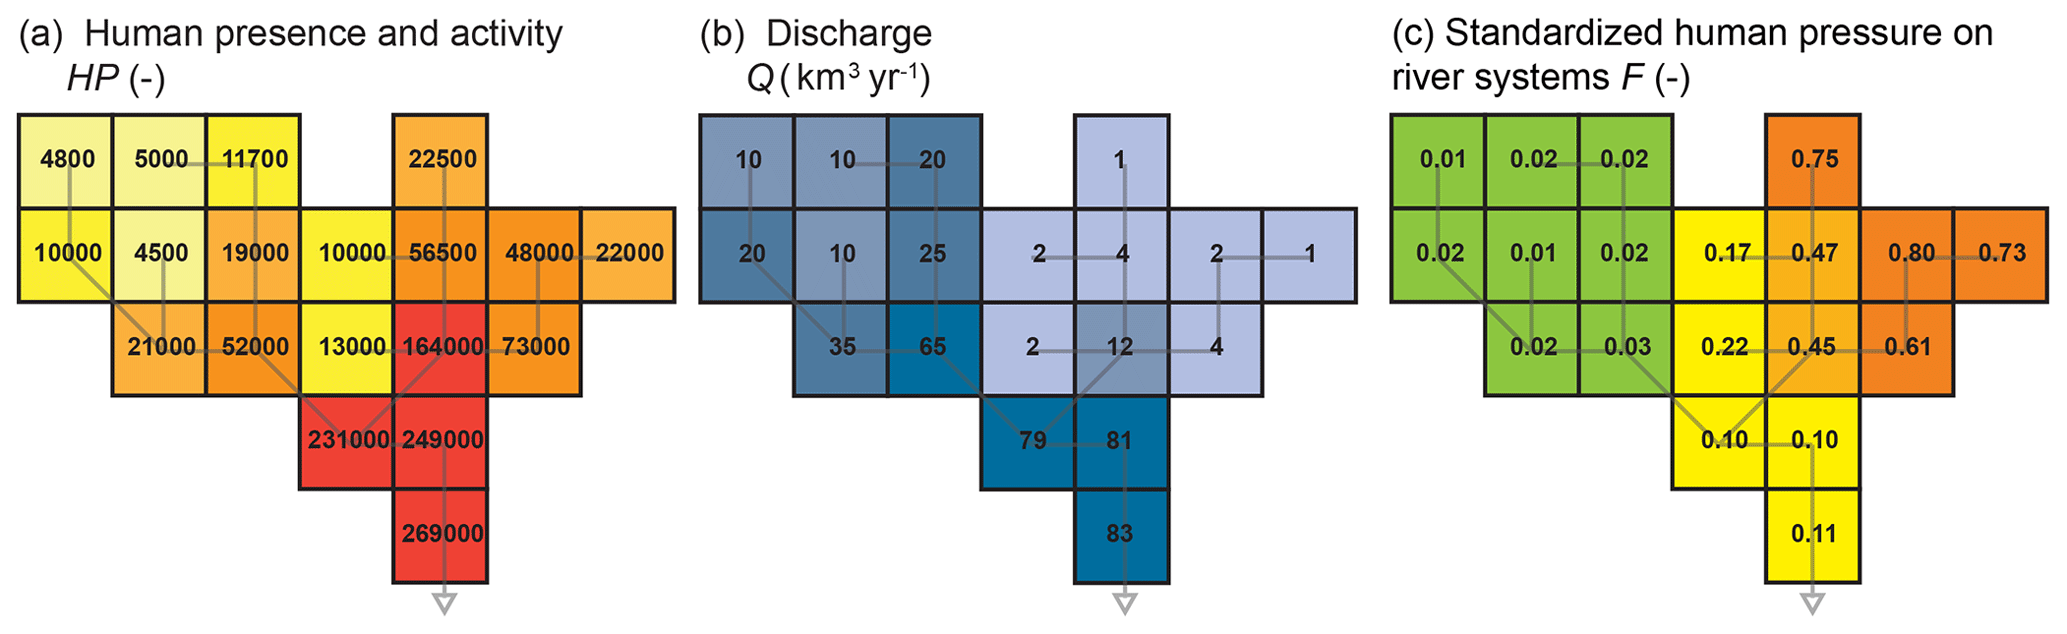
Figure 1Estimation of human pressure on river systems by explicitly considering the topological nature of river basins. Schematic illustration of (a) cumulative human presence and activity, HP (–), calculated as routed nightlight values for each grid cell at 0.5∘ resolution, obtained from downstream propagation following flow direction paths (grey line; see Eq. 3), (b) natural river discharge, Q (km3 yr−1), obtained from downstream propagation following flow direction paths (grey line; see Eq. 1), (c) standardized human pressure on river systems, F(t) (–), for each grid cell (see Eqs. 2 and 4, where min(fk)=50 km−3 yr and max(fk)=30 000 km−3 yr).
2.2 Global-scale data on human presence and activity
There are several possibilities for the estimation of human presence and activity at high spatial resolution globally. Traditional datasets that provide gridded data on population densities and/or gross domestic product (GDP) estimates could be employed. The Gridded Population of the World, developed by the Center for International Earth Science Information Network at Columbia University, and the Global Human Settlement Layer, provided by the European Commission, Joint Research Centre, are the most acknowledged datasets on population densities. The Gridded Population of the World dataset provides population counts and densities for the years 2000, 2005, 2010, 2015 and 2020 (extrapolated from 2010 population data) at 0.0083∘ resolution (i.e., nearly 1 km at the Equator) for the entire globe. However, constant population densities are provided within each census unit, thus resulting in a significant limitation for the proposed analysis. Differently, the Global Human Settlement Layer dataset provides a spatial variability within censuses at either 1 km or 250 m spatial resolution. However, this dataset offers a temporal evolution of population densities for the years 1975, 1990, 2000 and 2015 estimated from an exponential growth model that uses limited ground-based data. Concerning GDP estimates, a temporal sequence of gridded datasets at the global scale is not available to date. Yearly country-based GDP values are usually provided, even though some developing countries may present low-quality statistical data.
An alternative dataset is represented by nightlights, which overcomes some major limitations of the aforementioned ones. Nightlights are used in this work as a proxy for human presence and activity, being the best available option to analyze and map the evolution of global-scale human pressure on river systems both in space and time. Nightlights are satellite data derived from the United States Air Force Defense Meteorological Satellite Program (DMSP). The satellites are equipped with Operational Linescan System (OLS) sensors, and the information collected is freely provided by the National Oceanic and Atmospheric Administration's National Geophysical Data Center (NOAA, 2017). Stable light composites, available as raster products, are employed here. They monitor the global distribution of nocturnal luminosities associated with anthropogenic activities. More specifically, nightlights provide combined information on human presence and economic activities, as high luminosity can refer to either highly populated or major capital investment areas. Nightlights have been extensively employed as a proxy for human presence and activity for several purposes such as population (Elvidge et al., 1997; Small, 2004), urban (Cauwels et al., 2014) and poverty mapping (Elvidge et al., 2009a; Jean et al., 2016), flood risk (Ceola et al., 2014; Mard et al., 2018), economic analysis (Chen and Nordhaus, 2011), and light pollution (Bennie et al., 2014).
Nightlight values are expressed as digital numbers (DNs) that range from 0 (pitch dark areas) to 63 (brightest areas), and they are produced on a yearly basis from 1992 to 2013 (i.e., each pixel shows an average luminosity within a year). Nightlights are provided at 0.00833∘ spatial resolution and cover areas within 75∘ N and 65∘ S, 180∘ W and 180∘ E. Six different satellites collected nightlight data during the observation period, with overlapping satellites during some years (from 1997 to 2007). In the case of multiple satellites operating simultaneously, an average value between the two simultaneous satellites was computed in order to obtain unique yearly nightlight values. Since nightlight products are not calibrated on board, a well-established intercalibration procedure was performed (Ceola et al., 2014, 2015; Chen and Nordhaus, 2011; Elvidge et al., 2009b), before computing human pressure on river systems.
2.3 Historic evolution of global-scale human pressure on river systems: computational steps
The Differential Human Pressure on Rivers (DHPR) index was derived from the analysis of the historic evolution of annual values of human pressure on river systems. The computational steps explicitly incorporate catchment topology and use a routing scheme based on flow directions to evaluate the downstream accumulation of human presence and activity and natural river runoff.
Given a river site and its contributing upstream area, annual values of human pressure on river systems fi(t) (km−3 yr) were defined as the ratio between the cumulative human presence and activity across the contributing area HPi(t) (–) and the long-term average natural river discharge generated within the same area Qi (km3 yr−1); see Eq. (1). Namely,
where i identifies a generic river network grid cell and t represents the study year, from 1992 to 2013. The term “cell” below always refers to 0.5∘ by 0.5∘ grid cell, as defined by the STN-30 river network employed here (Vörösmarty et al., 2000a, b; Fekete et al., 2001). Overall, data from 20 770 grid cells for 2195 river basins were used. The cumulative human presence and activity HPi(t) (–) in any grid cell i was calculated from contributing upstream cells as routed nightlight values (see Figs. 1a and S1a and b):
where NLj(t) represents summed nightlight values in grid cells j for year t (i.e., the value of pixels for nightlights at 0.00833∘ resolution were summed to 0.5∘ by 0.5∘ grid cells) and Ni is the number of upstream cells j. Grid cells with null nightlight data throughout the whole study period were discarded.
In order to estimate the historic evolution of human pressure on river systems across the entire globe, annual values of fi(t) were first standardized to a dimensionless 0–1 scale Fi(t) as follows (see Fig. 1c):
where k identifies a generic grid cell where fk is either the absolute minimum or maximum value of fi(t) across all considered grid cells and years. The long-term average of standardized human pressure on river systems was then computed as the mean of annual values from 1992 to 2013. Standardization was essential to test the reliability of the proposed methodology. Indeed, standardized human pressure values were contrasted with existing well-acknowledged datasets, i.e., water threats (Vörösmarty et al., 2010) and the terrestrial human footprint (Venter et al., 2016a), by performing a regression analysis (see Sect. 2.4). The historic evolution of standardized human pressure values was assessed by performing the following linear regression:
where DHPRi (yr−1) is the Differential Human Pressure on Rivers index in grid cell i, a0 is the intercept, and ϵ(t) represents regression residuals. DHPR represents the relative change rate (i.e., a percentage increment or decrement) of normalized human pressure values, defined as the ratio between annual and long-term average standardized values of human pressure. We employed normalized human pressure values to easily compare relative change rates at the global scale. Positive (or negative) DHPR values correspond to increasing (or decreasing) trends of human pressure on river systems in the study period. Null DHPR values identify a time-invariant behavior (i.e., significant changes in time are not detected). For example, a value of DHPR equal to 4 % per year represents the condition for which normalized human pressure on river systems increases on average every year of 4 % with respect to its initial condition (i.e., in 1992). Thus in the 22-year study period, there is an 88 % relative increment of values. Without any normalization, change rates of human pressure would have been proportional to standardized values Fi(t), which clearly depend on the contributing area, nightlight values and river discharge data. By computing a relative increment (or decrement) of human pressure on river systems, the DHPR index is expected to be a valuable tool, particularly for scarcely illuminated regions. P values from Student's t test and coefficients of determination R2 were computed for each river basin to test the statistical significance of the linear regression given by Eq. (5).
2.4 Correlation analysis between estimates of human pressure on river systems and existing global-scale datasets
In order to test the reliability of the proposed approach, we compared our estimates of human pressure on river systems with well-acknowledged datasets based on different methodologies. Two alternative datasets were used for this comparison: (i) water threats to human water security and river biodiversity (Vörösmarty et al., 2010) and (ii) human footprint (Sanderson et al., 2002; Venter et al., 2016a, b).
Water threat values, defined by Vörösmarty et al. (2010), identify either human water security or river biodiversity threats and represent the level of endangerment of river systems. Estimates of water threats derive from a routing scheme based on a combination of 23 drivers normalized by the natural river discharge. Global-scale water threat data are provided as a map on the status of river systems at a given location and at a particular point in time, around the year 2000, with a 0.5∘ resolution. For our correlation analysis we used gridded water threat data, freely available at http://www.riverthreat.net/index.html (last access: 8 March 2017). Although human water security and river biodiversity threats are strongly correlated, in this paper we opted to examine both threats.
Human footprint estimates, developed by Sanderson et al. (2002), provide a measure of human pressure on the environment. Human footprint considers the entire terrestrial realm and not only river systems. Human footprint values on land areas are derived from eight different proxy variables for human pressure. Normalized cumulative values identify the percentage of relative human influence within a region. Global-scale gridded data of human footprint are available for years 1993 and 2009 at 0.00833∘ resolution (https://doi.org/10.5061/dryad.052q5; see also Venter et al., 2016b). For our correlation analysis, we used data from both years and averaged the value of pixels for human footprint at 0.00833 to 0.5∘ by 0.5∘ grid cells.
Standardized values of human pressure on river systems Fi(t) computed in any grid cell i were contrasted with water threat and human footprint data. This relationship was investigated by performing the following log-linear regression analysis:
where Xi(t) identifies either water threat or human footprint values in grid cell i, mX represents the slope of the log-linear regression line, bX is the intercept and ϵX represents regression residuals. Water threat values were contrasted with standardized human pressure estimates for year 2000, while human footprint data were compared against 1993 and 2009 estimates. We computed P values from Student's t test and the coefficient of determination R2 to check the statistical significance of the regression analysis. A statistically significant correlation in space between our estimates of human pressure on rivers and previous metrics warrants the use of the proposed variable as a valuable alternative. In addition, given the availability of time series, it allows the quantification of changes in time.
2.5 Regionalization of the Differential Human Pressure on Rivers index
The Differential Human Pressure on Rivers (DHPR) index describes the historic evolution of human pressure on river systems driven by the heterogeneity of anthropogenic activities and hydrological and climatic regimes. DHPR values computed for the considered 2195 river basins were analyzed by considering aggregated spatial regions delineated by river basins (Millennium Ecosystem Assessment, 2005) with similar annual average runoff and temperature. The regions considered were hydrobelts and hydroregions (Meybeck et al., 2013), which incorporate key hydraulic and climatic features driving natural river discharges. Hydrobelts (8 in total, i.e., boreal, northern midlatitude, northern dry, northern subtropical, equatorial, southern subtropical, southern dry, southern midlatitude) are classified by maximizing the differences among belts and minimizing the variability within belts; hydroregions (26 in total) are hydrobelts decomposed on a continental basis.
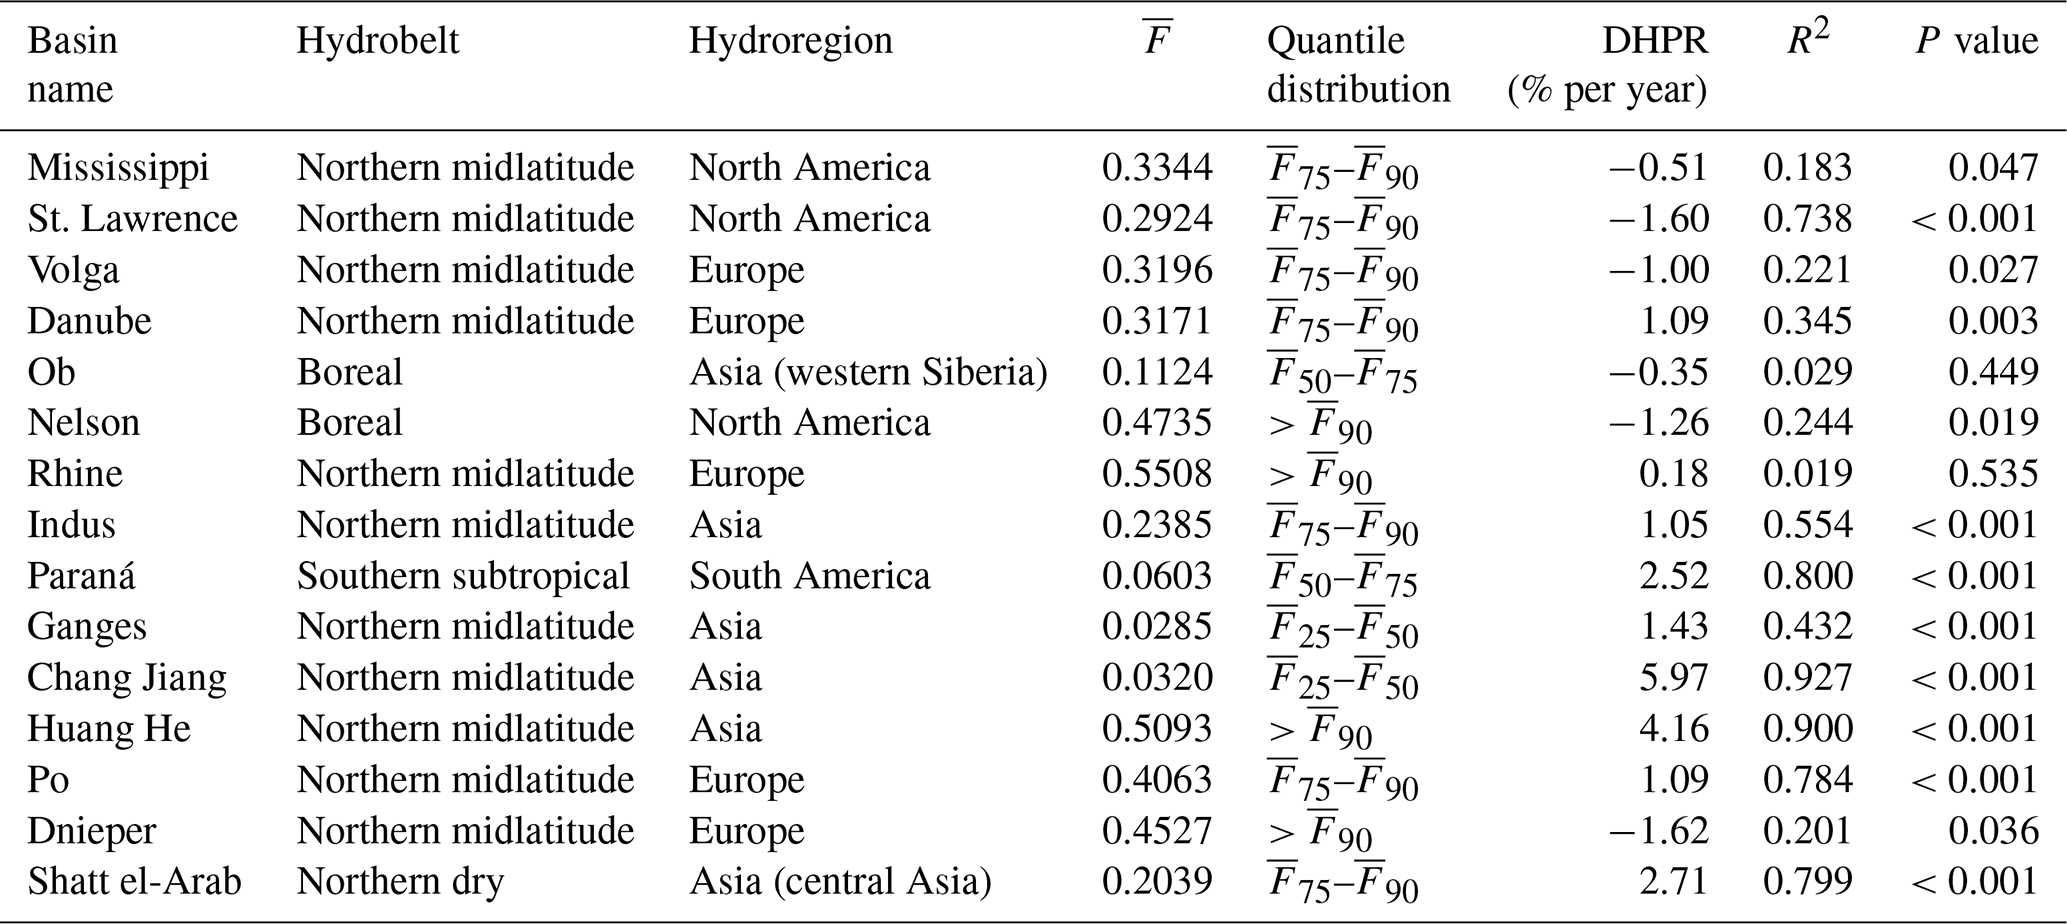
Annual values of standardized human pressure on river systems F(t) and the long-term average were calculated for 20 770 grid cells distributed across 2195 river basins over the period 1992–2013 and then grouped by region. The regions considered (i.e., hydrobelts and hydroregions; Meybeck et al., 2013) are shown in Fig. 2. Globally, long-term average standardized human pressures presented a considerable heterogeneous spatial pattern (Fig. 2), which is to be expected due to the intrinsic variations in the considered drivers (Fig. S1). Standardized human pressure values, ranging from 0 to 1, depend on the spatial extent of the contributing area, the level of human presence and activity, as derived from nightlights, and natural discharge values. As a result, large human pressures are typical of river basins with low natural discharges and high human presence and activity. Conversely, low human pressures are generally found across river basins with little human presence and activity and high river discharge. Accordingly, high values were found in the northern midlatitudes and subtropical regions (i.e., eastern United States, Europe, India and eastern China), whereas low scores were typical of boreal (i.e., northern Russia) and equatorial (i.e., central Brazil and central Africa) areas. Estimates of standardized human pressure could be analyzed by ranking river basins as a decreasing function of either discharge or human presence and activity. When examining the first 15 basins, ranked from largest to smallest natural river discharge (see Table A1), we found values lower than the 90th percentile (). In particular, 11 out of 15 river basins showed , and 13 out of 15 with . This result was expected, since for larger discharges and assuming equal levels of human presence and activity, lower estimates of standardized human pressure can be found. Aggregation proved that the boreal, northern midlatitude and equatorial hydrobelts were equally represented, with 4 river basins each in the first 15. High natural discharges are indeed typical of these three hydrobelts. When ranking river basins as a decreasing function of human presence and activity (see Table A2), we found that 11 out of the first 15 basins were located within the northern midlatitude belt, which is known to be the most populated hydrobelt across the globe. Estimates of human presence and activity within a river basin provide embedded and combined information about the extension of the contributing area, the total population and the economic activity in that area. This estimate is not directly proportional to the river basin area. Indeed, Amazon, the river basin with the largest drainage area in the world, is not among the 15 largest river basins based on human presence and activity. Large estimates of human presence and activity do not necessarily correspond to high levels of standardized human pressure, but overall 13 out of 15 river basins showed .
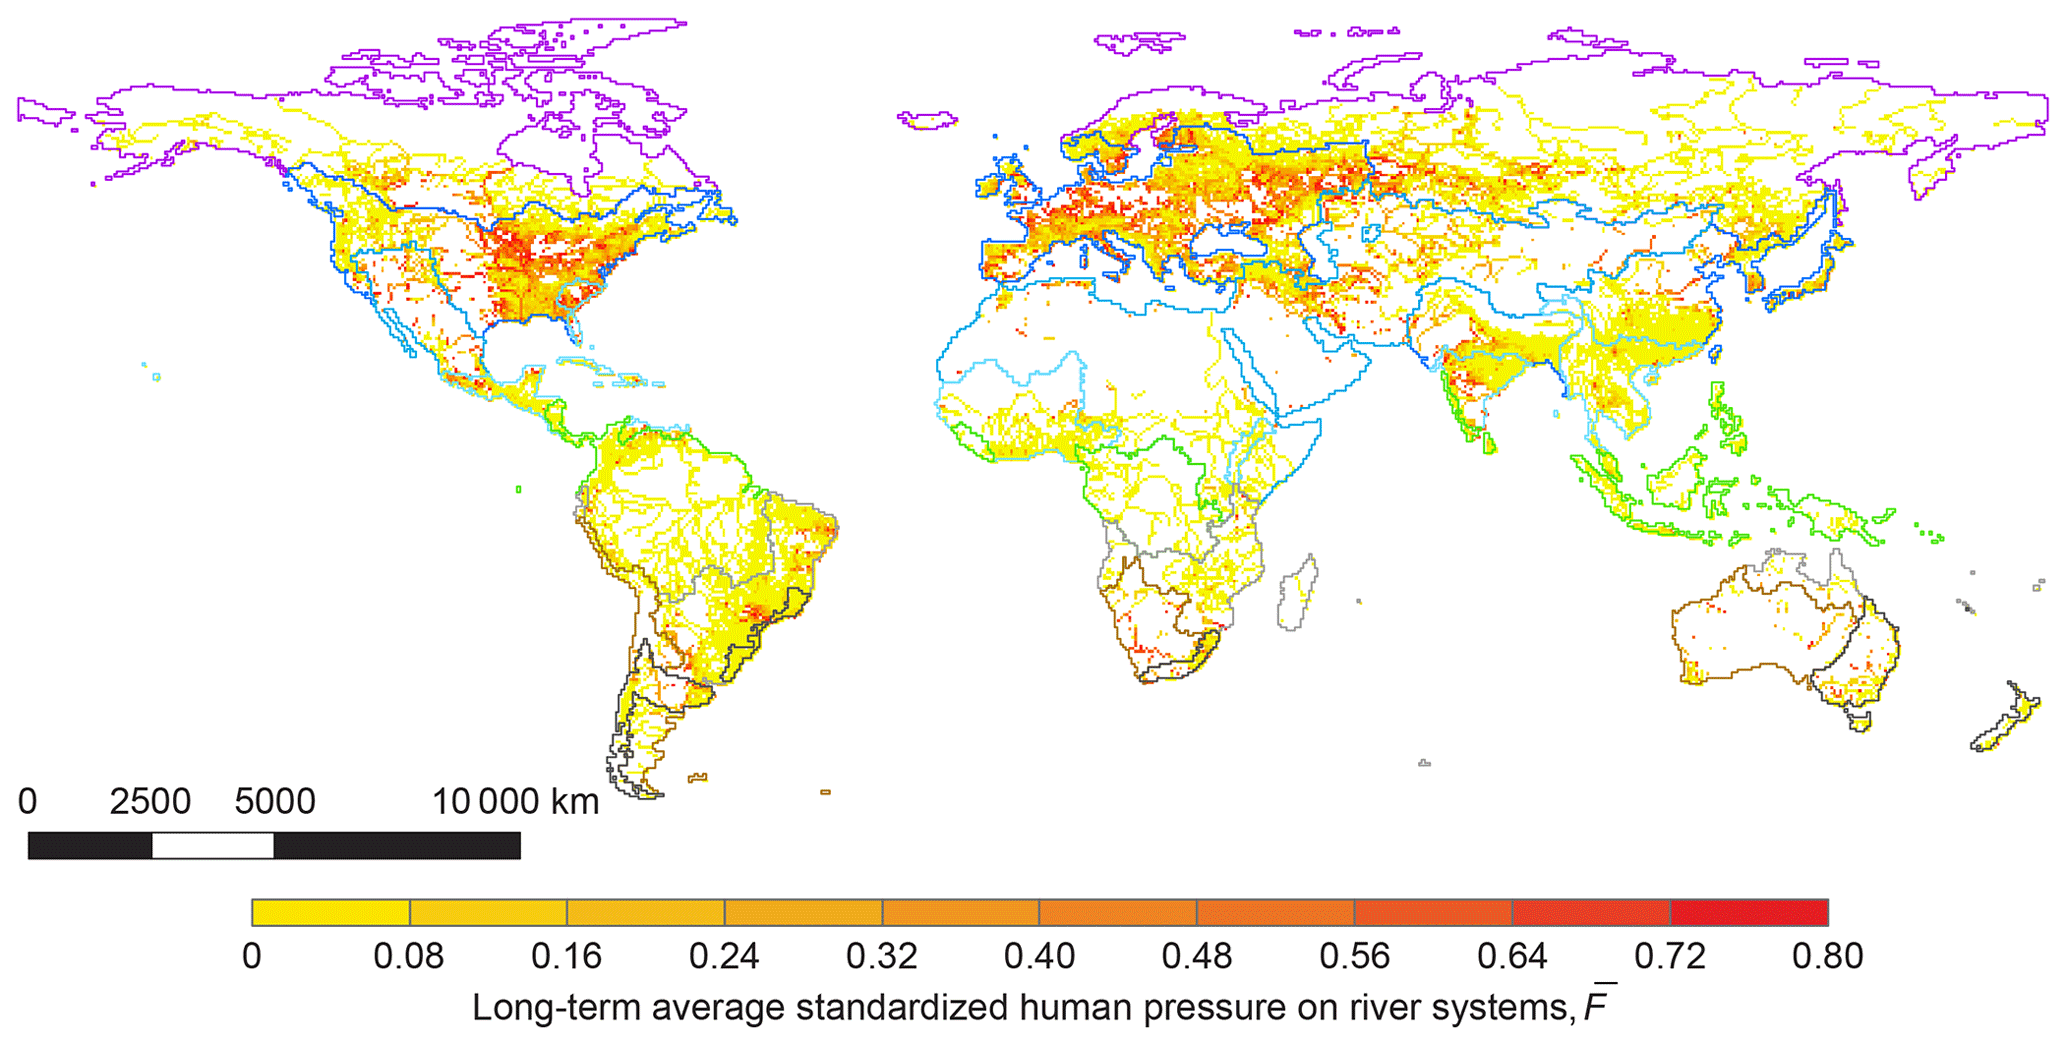
Figure 2Global distribution of long-term average standardized human pressure on river systems, . Colors differentiate grid cells (20 770 in total) according to levels of . Hydrobelt boundaries (Meybeck et al., 2013) are also shown (i.e., boreal in purple, northern midlatitude in dark blue, northern dry in cobalt, northern subtropical in light blue, equatorial in green, southern subtropical in grey, southern dry in brown, southern midlatitude belt in black).
To test the reliability and consistency of the proposed methodology, standardized values of human pressure on river systems F(t) were contrasted with well-acknowledged and consolidated datasets mapping human pressure on terrestrial (Sanderson et al., 2002; Venter et al., 2016a) and freshwater (Vörösmarty et al., 2010) systems. Overall, a consistent worldwide behavior emerged, supported by statistically significant relationships among indices (Table S1 in the Supplement). High scores for standardized human pressure on river systems correlate well with high values of both water threat and human footprint, clearly implying severe endangerment levels. A better correlation was found with water threats, rather than human footprint values. This was expected, since human footprint considers the entire terrestrial realm and does not exclusively focus on river systems. Global and regional results presented a fair data scatter, which reduced when focusing at smaller spatial scales. Our approach based on nightlight and river discharge data cannot explain and totally embed the geographical heterogeneity and the variability of human–water interactions. However, it represents a first step forward in mapping the historic development of human pressure and, by focusing on river systems, complements recent outcomes on the terrestrial environment (i.e., human footprint; Venter et al., 2016a, b).
In order to identify priorities and hot-spot regions of change, and thus produce consistent and reliable blueprints to manage human pressure on river systems, it is fundamental to analyze its historic evolution and identify areas where human pressure is increasing. The Differential Human Pressure on Rivers (DHPR) index was calculated at the outlet of the considered 2195 river basins over the period 1992–2013. The global analysis of DHPR revealed positive change rates (Fig. 3), with values within −0.4 %–3.7 % per year (lower and upper quartiles, mean = 1.9 % per year; see Fig. 4). Results at the basin scale showed an heterogeneous spatial distribution of change rates, confirming and complementing recent country-based outcomes (Worldbank, 2017a; Ceola et al., 2014, 2015). Overall, markedly positive DHPR values were found across river basins with low to moderate standardized human pressure on river systems, whereas regions with high standardized human pressure showed either slightly negative or negligible changes in time. Table 1 reports DHPR estimates for 15 major river basins across the globe. Values for all the considered river basins are provided in Table S2.
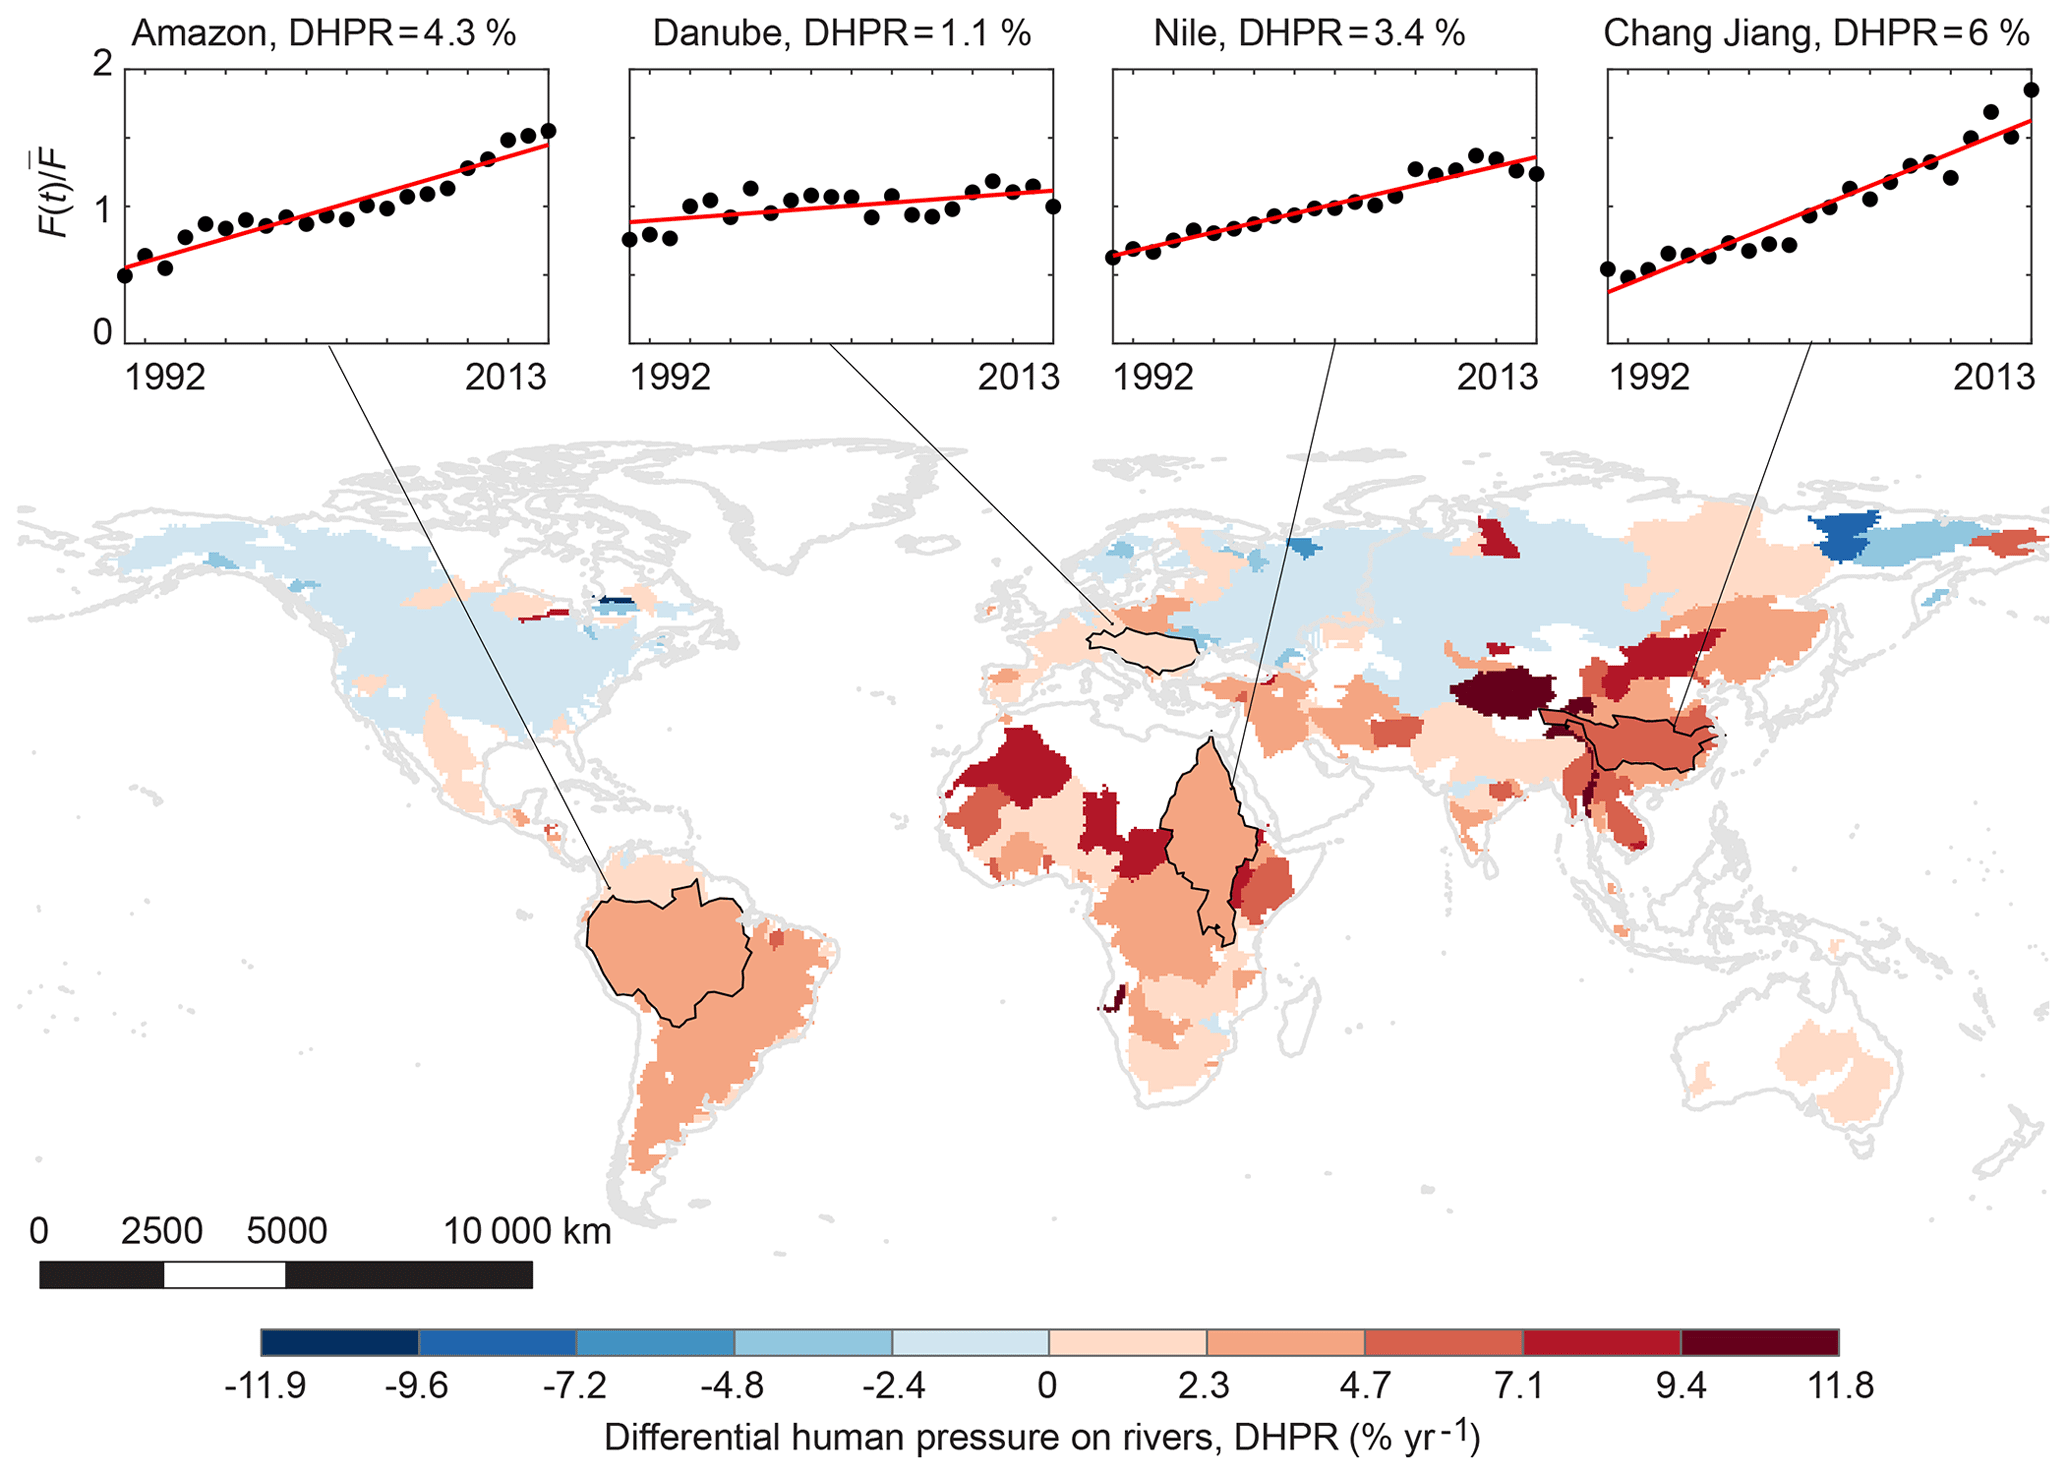
Figure 3Global distribution of the Differential Human Pressure on Rivers index, DHPR. The map shows the relative change rate (i.e., per-year percentage increment or decrement) of normalized human pressure values, defined as the ratio between annual and long-term average standardized human pressure on river systems, . Colors differentiate basins (2195 in total) according to levels of DHPR. Insets show the historic evolution of normalized human pressure on river systems for Amazon, Danube, Nile and Chang Jiang river basins, where data are depicted as black dots and the red lines represent Eq. (5).
Table 1Estimates of the Differential Human Pressure on Rivers index, DHPR, for 15 major river basins. Basin name, contributing area (106 km2), hydrobelt, hydroregion, DHPR values (% per year), coefficient of determination R2, and P values for Student's t test are reported.
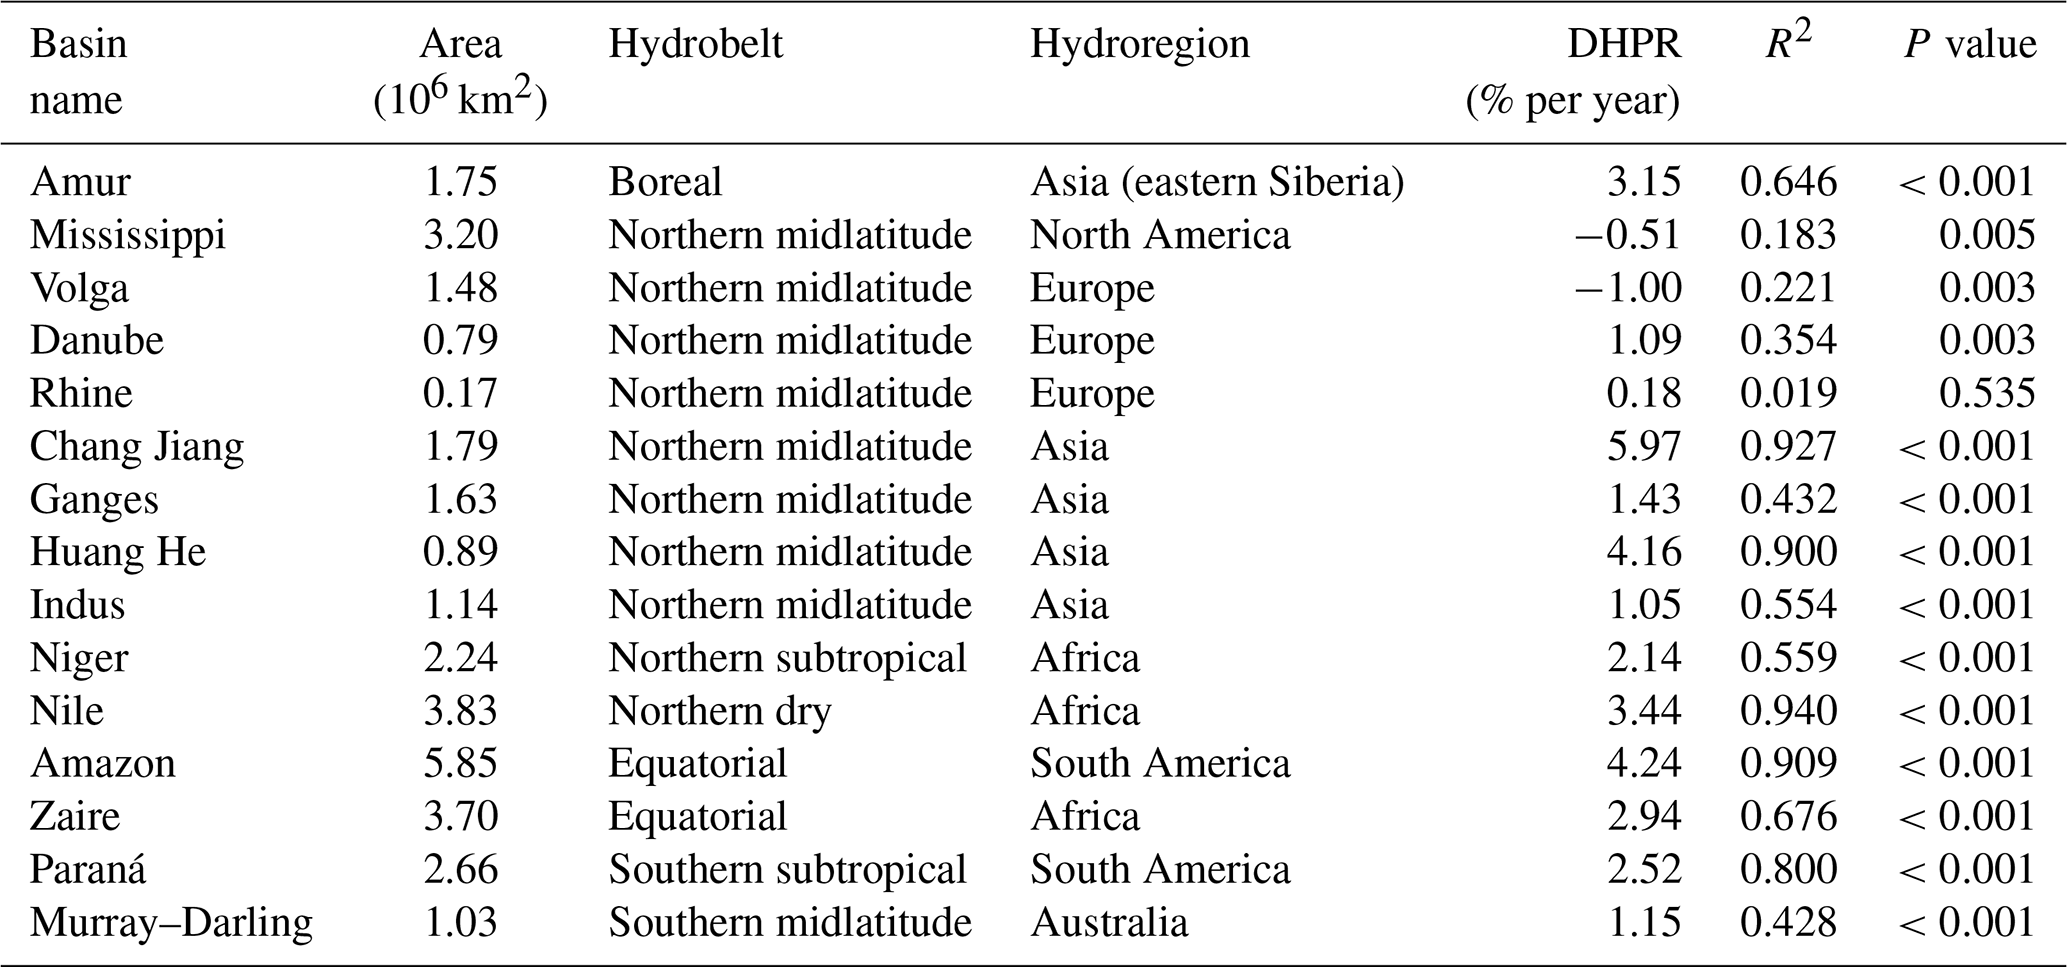
Individual catchment-scale results were aggregated at the regional level. Grouping results by hydrobelt and hydroregion (Meybeck et al., 2013) was a meaningful way to perform this spatial aggregation. In fact, hydrobelts and hydroregions incorporate key hydrologic and climatic features driving average discharge regimes (Figs. 4 and S2). The boreal belt identifies areas with average annual temperatures below 0 ∘C (Meybeck et al., 2013). Within this belt, we found river basins characterized by high natural discharges and a limited human presence and activity, resulting in low values of standardized human pressure. River basins in the boreal belt showed negative DHPR scores, with lowest values across Canada, Europe and eastern Siberia. Northern latitude belts (midlatitude, dry and subtropical) are known to be the most populated areas across the globe. Basins within northern latitude belts presented a wide range of natural discharges, showing fairly high values of standardized human pressure. When looking at the historic evolution of standardized human pressure on river systems, the northern midlatitude belt (i.e., corresponding to the most developed countries in the Northern Hemisphere) showed DHPR values almost symmetrically distributed around zero, with positive change rates across Europe and Asia and negative trends across the United States. The highest DHPR estimates were found in river basins located within the northern dry, northern subtropical and equatorial belts, in particular across Africa and Asia. River basins located across southern latitude belts (subtropical, dry and midlatitudes) typically presented positive DHPR values, with slightly smaller change rates compared to northern dry, subtropical and equatorial belts.
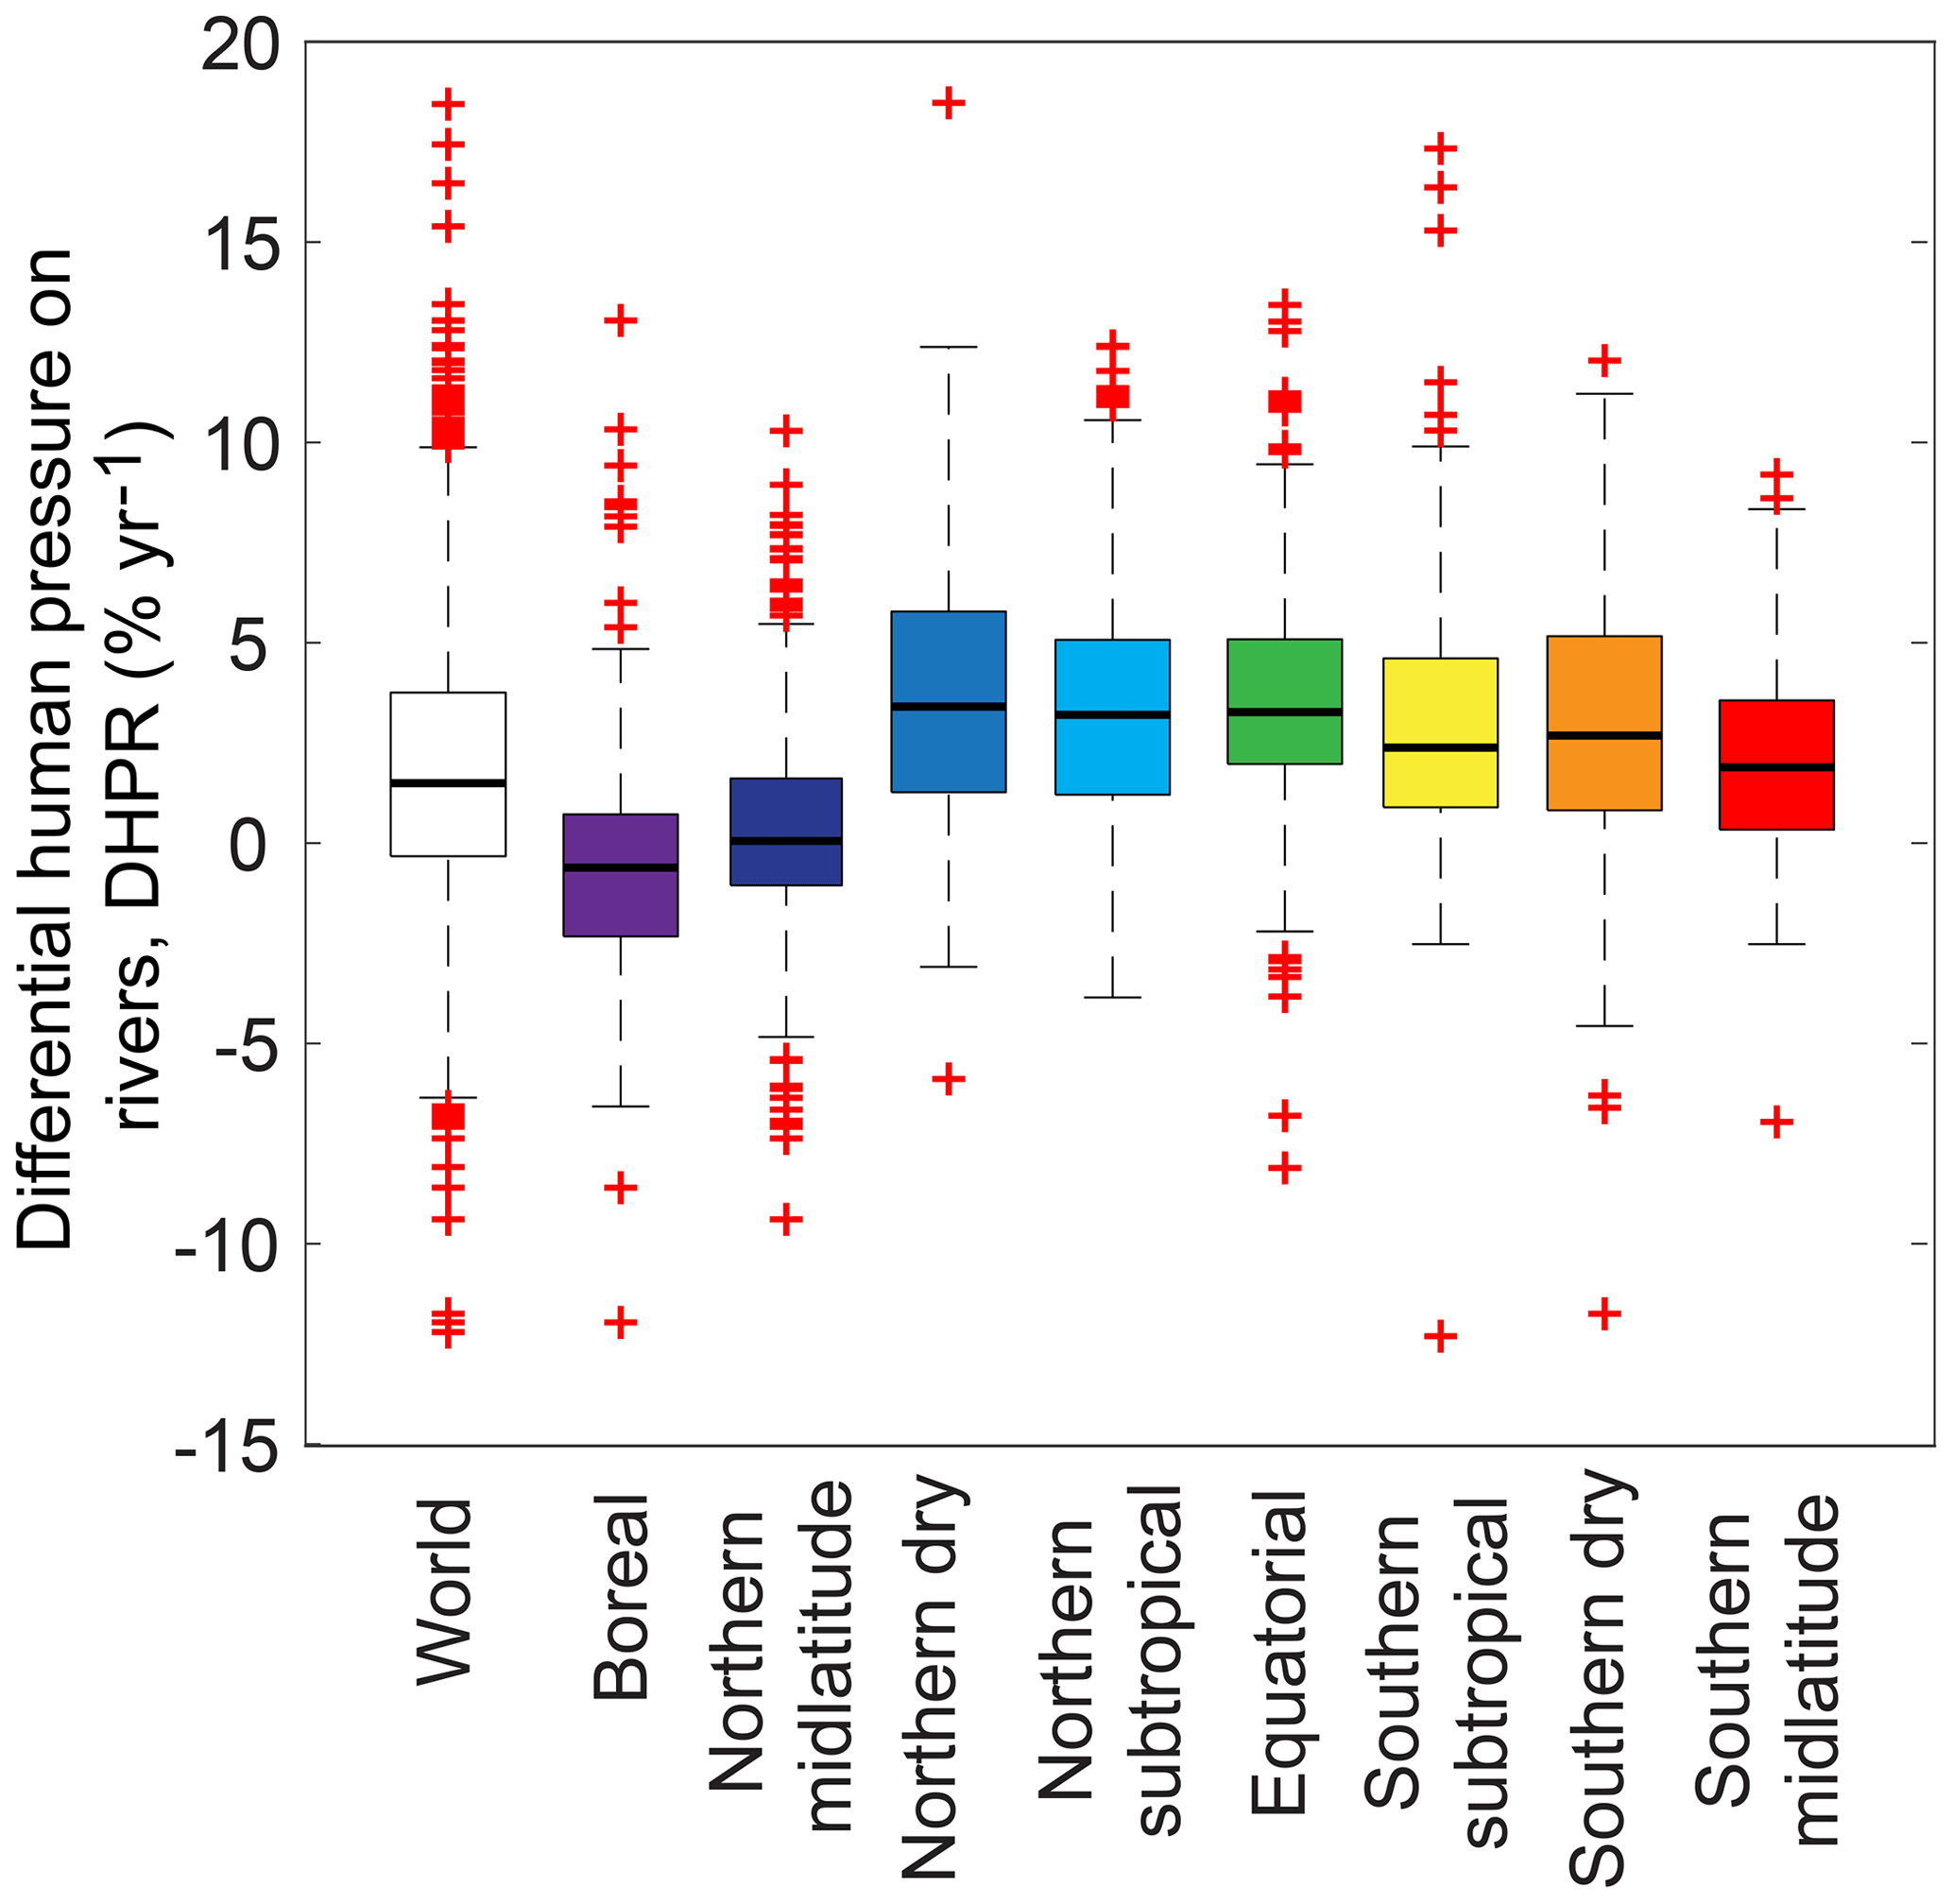
Figure 4Regional patterns of the Differential Human Pressure on Rivers index, DHPR. Box plot statistics for DHPR grouped by hydrobelt (Meybeck et al., 2013): world (2195 basins), boreal (170 basins), northern midlatitude (800 basins), northern dry (133 basins), northern subtropical (319 basins), equatorial (354 basins), southern subtropical (141 basins), southern dry (84 basins), southern midlatitude (194 basins). Box plots include the median (thick black line), interquartile range (colored boxes) and whiskers (confidence interval of ±2.7σ).
DHPR identifies critical zones where increasing trends in human pressure on river systems may undermine human security and sustainable development in the near future. Hot-spot areas of change are represented by river basins located within the northern subtropical and equatorial belts across Africa and Asia, showing markedly positive change rates in the 1992 to 2013 period (Figs. 3, 4 and S2). Future climate change scenarios and demographic projections will impact on future DHPR values. For instance, when considering African basins across the northern subtropical and equatorial belts, markedly positive DHPR scores are likely to be expected, with population and socioeconomic level predictions (Worldbank, 2017b) playing a major role compared to changes in natural river discharge (Roudier et al., 2014). Indeed, the highest population growth rates are predicted to be in Africa, where more than half of the global population increase (i.e., nearly 83 million people by year) will settle by 2050 (Worldbank, 2017b).
Human development and riverine ecosystems intimately depend on the geographic and temporal distribution of natural river discharge (Rodriguez-Iturbe and Rinaldo, 2001; UNWWAP, 2015; Pekel et al., 2016), whose global-scale pattern is primarily controlled by hydrogeomorphologic and climatic drivers. Current human pressures on river systems are likely to be affected by future population increases and climate change (IPCC, 2013; Worldbank, 2017b). As a consequence, managing the development of human societies and protecting fluvial ecosystems will be a significant challenge (Hoekstra and Wiedmann, 2014). The Differential Human Pressure on Rivers (DHPR) index proposed here is a simple tool that analyzes for the first time the temporal evolution of human pressure on river systems. DHPR identifies hot-spot areas of change, offering guidance on where to implement mitigation strategies. On account of its simplicity and the availability of spatially and temporally explicit data for its calculation, DHPR is a valuable alternative and a step forward to well-acknowledged and consolidated datasets mapping human pressure on terrestrial (Sanderson et al., 2002; Venter et al., 2016a) and freshwater (Vörösmarty et al., 2010) systems (see Table S1).
We acknowledge that the proposed index presents some limitations. Our approach defines human pressure on rivers as a basin-scale cumulative effect of residing population and its economic activities on the natural river discharge at the basin outlet. In other words, we focus on (1) how many people live and act on a river basin (namely, the sum of nightlights) and (2) in which way this anthropogenic effect is diluted with river discharge. Local aspects such as dams and water withdrawals for civil, industrial and irrigation purposes are not taken into account. Therefore, nightlights and river discharge are considered the sole controlling and the best representative drivers of human pressure on rivers. Nightlights have been proven to be an effective tool monitoring human presence and activity, although they feature several potential weaknesses (Sutton, 2003; Elvidge et al., 2010). The low resolution of nightlight sensors may cause zero values of nightlights in populated areas. The limited radiometric range may result in saturated nightlight values in urban areas (i.e., saturation effect) or in larger lit areas (i.e., blooming effect). To dampen these effects, estimates of human pressure on river systems were first standardized and then normalized. In addition, light pollution abatement strategies (Royal Astronomical Society of Canada, 2017; International Dark-Sky Association, 2017), employed to reduce the artificial sky brightness and preserve world's ecosystems (de Freitas et al., 2017), can cast some doubt on nightlight values and on their evolution in time. However, these uncertainties, which should be treated with caution when analyzing small areas, are barely detectable at the basin scale employed here.
Natural river discharge, as computed from Eq. (1), is defined as a function of hydrological and geomorphological variables within a river basin. One major limitation of the proposed methodology is that the variability of natural river discharges within and between years is not considered. Since the scope of the present study is to analyze and map the annual evolution of human pressure on river systems at global level, intra-annual variability is not of interest. Concerning interannual variability, future studies, focused on local-scale problems and smaller areas, are planned to embed discharge variability between years and thus account for hydrological changes. Furthermore, the proposed approach relies on an ideal case where groundwater fluxes and anthropogenic factors (i.e., water intakes, transboundary water management and environmental flow requirements), which may potentially affect human pressure on river systems, are not taken into account. If considered, environmental flow requirements would reduce the natural river discharge (i.e., on an annual basis, 80 % of natural discharge is allocated as environmental flow; Mekonnen and Hoekstra, 2016). Consequently, human pressure on river systems based on environmental flow requirements would result in higher absolute values, but change rates, expressed by DHPR, would be equal to change rates of human pressure based on natural discharges. Similarly, one could account for groundwater fluxes. If considered, groundwater would potentially enhance water availability, thus resulting in lower absolute values of human pressure. However, this issue, which involves a sustainable use of groundwater resources, is beyond the scope of the proposed analysis.
Our approach, estimating the historic evolution of human pressure on river systems, explicitly considers the connectivity and the structure of the river network and provides simplified information about interactions among hydrological, geomorphological and human variables within a river basin. DHPR estimates allow a spatially and temporally explicit analysis of human–water interactions at the global scale. Our study identifies critical zones where the change rate of human pressure may undermine human security and sustainable development in the near future. The simplicity of the proposed methodology for assessing human pressure on river systems and the ease with which it can be used to reconstruct historic series makes it a powerful tool to be used independently or to be incorporated into a planning framework, targeting actions to address water threats in key areas.
Nightlight data used for this article are available at NOAA Earth Observation Group (http://ngdc.noaa.gov/eog/dmsp/downloadV4composites.html, NOAA, 2017). Water threat data were downloaded from http://www.riverthreat.net/index.html (Vörösmarty et al., 2010). Human footprint data are available at https://doi.org/10.5061/dryad.052q5 (Venter et al., 2016c). Data on human pressure on river systems are derived from elaborations through a non-open-source code developed by the authors. More information can be gathered upon e-mail request to serena.ceola@unibo.it.
Table A1Estimates of long-term average standardized human pressure on river systems . River basins are ranked as a decreasing function of natural river discharge, Q. The first 15 river basins are examined. Basin name, hydrobelt, hydroregion, and quantile distribution, DHPR values (% per year), coefficient of determination R2, and P values for Student's t test are reported.
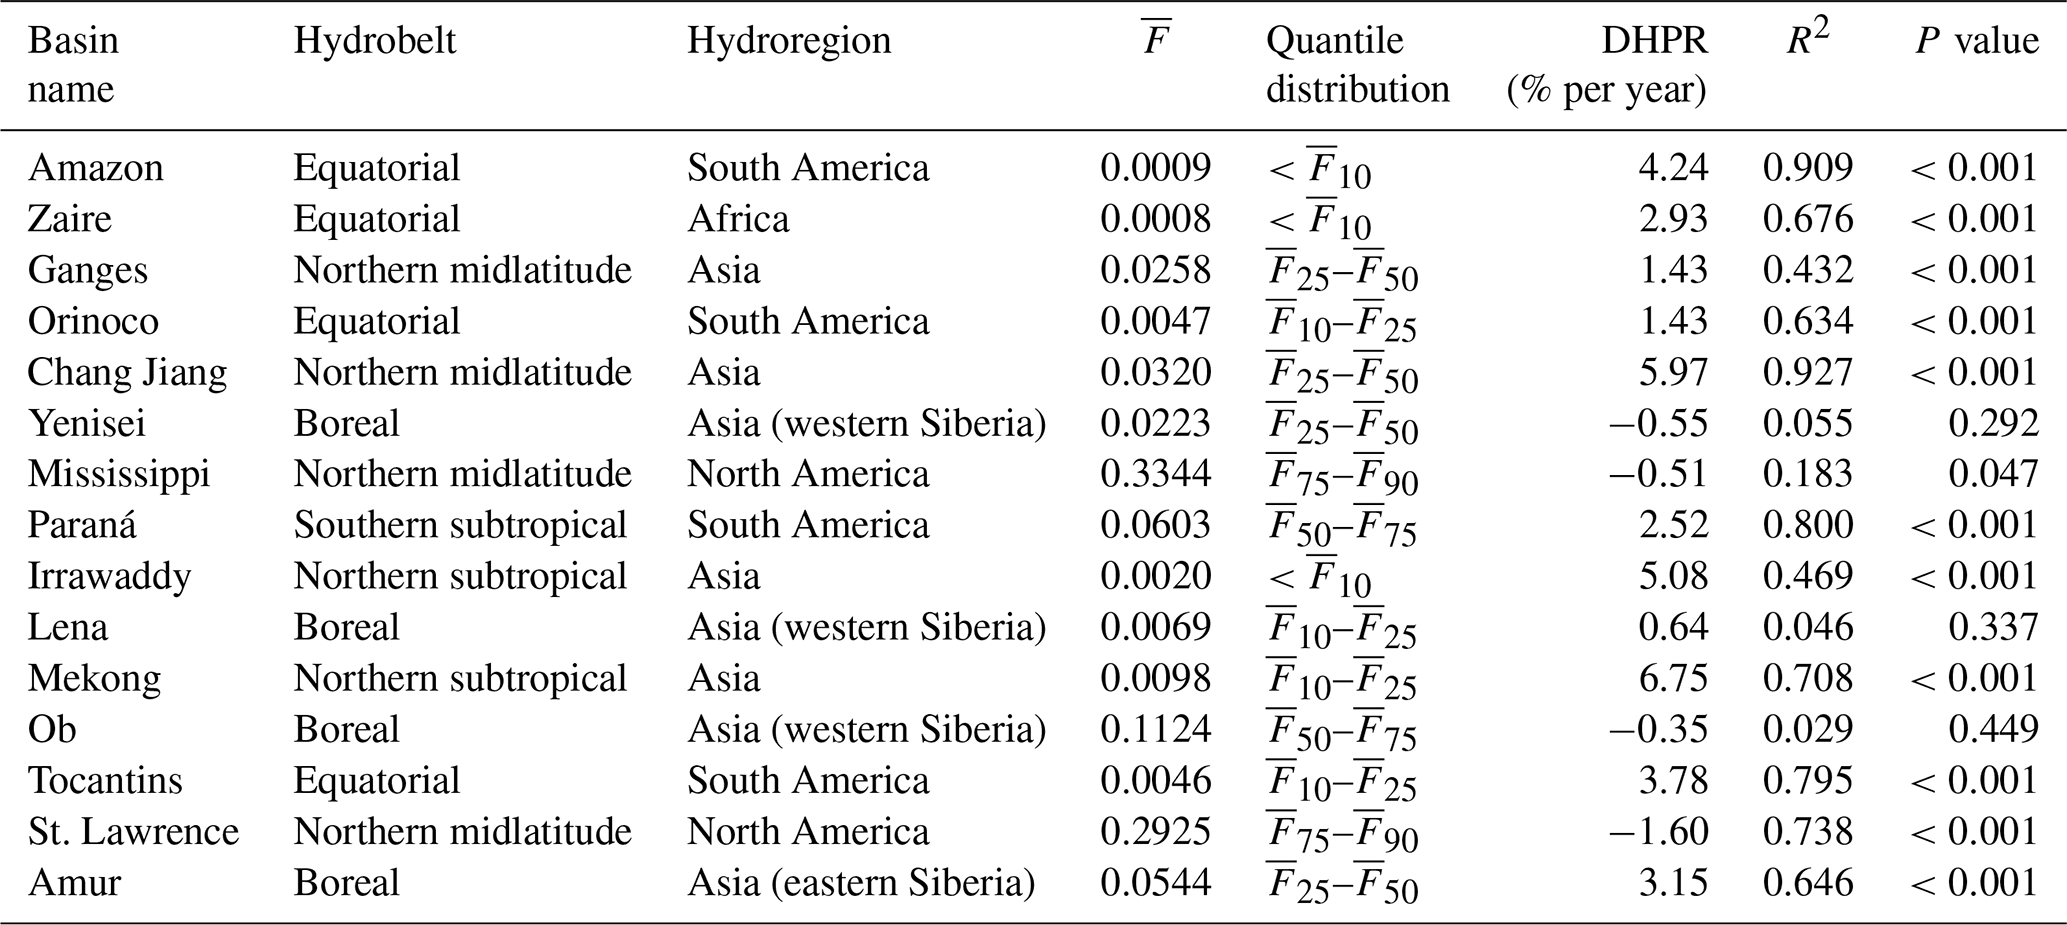
Table A2Estimates of long-term average standardized human pressure on river systems . River basins are ranked as a decreasing function of human presence and activity, HP. The first 15 river basins are examined. Basin name, hydrobelt, hydroregion, and quantile distribution, DHPR values (% per year), coefficient of determination R2, and P values for Student's t test are reported.
The supplement related to this article is available online at: https://doi.org/10.5194/hess-23-3933-2019-supplement.
SC, FL and AM designed the research. SC carried out the research, developed the model code and performed the simulations. SC prepared the manuscript with contributions from all co-authors.
The authors declare that they have no conflict of interest.
The authors gratefully thank Irene Soligno for modeling tool support.
This research has been supported by the European Research Council (project CWASI, grant no. 647473).
This paper was edited by Hubert H. G. Savenije and reviewed by Wouter Berghuijs and one anonymous referee.
Barnett, T., Pierce, D., Hidalgo, H., Bonfils, C., Santer, B., Das, T., Bala, G., Wood, A., Nozawa, T., Mirin, A., Cayan, D., and Dettinger, M.: Human-induced changes in the hydrology of the western United States, Science, 319, 1080–1083, https://doi.org/10.1126/science.1152538, 2008. a
Bennie, J., Davies, T., Duffy, J., Inger, R., and Gaston, K.: Contrasting trends in light pollution across Europe based on satellite observed night time lights, Scient. Rep., 4, 3789, https://doi.org/10.1038/srep03789, 2014. a
Cauwels, P., Pestalozzi, N., and Sornette, D.: Dynamics and spatial distribution of global nighttime lights, EPJ Data Sci., 3, 2, https://doi.org/10.1140/epjds19, 2014. a
Ceola, S., Laio, F., and Montanari, A.: Satellite nighttime lights reveal increasing human exposure to floods worldwide, Geophys. Res. Lett., 41, 7184–7190, https://doi.org/10.1002/2014GL061859, 2014. a, b, c
Ceola, S., Laio, F., and Montanari, A.: Human-impacted waters: New perspectives from global high-resolution monitoring, Water Resour. Res., 51, 7064–7079, https://doi.org/10.1002/2015WR017482, 2015. a, b
Chen, X. and Nordhaus, W.: Using luminosity data as a proxy for economic statistics, P. Natl. Acad. Sci. USA, 108, 8589–8594, https://doi.org/10.1073/pnas.1017031108, 2011. a, b
CIESIN: Gridded Population of the World, Version 11 (GPWv4): Population Density, Center for International Earth Science Information Network – CIESIN – Columbia University, NASA Socioeconomic Data and Applications Center (SEDAC), Palisades, NY, https://doi.org/10.7927/H4NP22DQl, 2018. a
de Freitas, J., Bennie, J., Mantovani, W., and Gaston, K.: Exposure of tropical ecosystems to artificial light at night: Brazil as a case study, PLoS ONE, 12, e0171655, https://doi.org/10.1371/journal.pone.0171655, 2017. a
EC-JRC: GHS population grid, derived from GPW4, multitemporal (1975, 1990, 2000, 2015), European Commission, Joint Research Centre – JRC, Columbia University, Center for International Earth Science Information Network – CIESIN, available at: http://data.europa.eu/89h/jrc-ghsl-ghs-pop-gpw4-globe-r2015a (last access: 10 September 2018), 2015. a
Elvidge, C. D., Baugh, K., Kihn, E., Kroehl, H., and Davis, E.: Mapping city lights with nighttime data from the DMSP operational linescan system, Photogram. Eng. Remote Sens., 63, 727–734, 1997. a
Elvidge, C. D., Sutton, P., Ghosh, T., Tuttle, B., Baugh, K., Bhaduri, B., and Bright, E.: A global poverty map derived from satellite data, Comput. Geosci., 35, 1652–1660, https://doi.org/10.1016/j.cageo.2009.01.009, 2009a. a
Elvidge, C. D., Ziskin, D., Baugh, K., Tuttle, B., Ghosh, T., Pack, D., Erwin, E., and Zhizhin, M.: A Fifteen Year Record of Global Natural Gas Flaring Derived from Satellite Data, Energies, 2, 595–622, https://doi.org/10.3390/en20300595, 2009b. a
Elvidge, C. D., Keith, D. M., Tuttle, B. T., and Baugh, K. E.: Spectral Identification of Lighting Type and Character, Sensors, 10, 3961–3988, https://doi.org/10.3390/s100403961, 2010. a
Falkenmark, M.: Growing water scarcity in agriculture: future challenge to global water security, Philos. T. Roy. Soc. A, 371, 20120410, https://doi.org/10.1098/rsta.2012.0410, 2013. a
Fekete, B., Vörösmarty, C., and Lammers, R.: Scaling gridded river networks for macroscale hydrology: Development, analysis, and control of error, Water Resour. Res., 37, 1955–1967, https://doi.org/10.1029/2001WR900024, 2001. a, b, c
Fekete, B., Vörösmarty, C., and Grabs, W.: Global composite runoff fields on observed river discharge and simulated water balances, Water System Analysis Group, University of New Hampshire, and Global Runoff Data Centre, Federal Institute of Hydrology, BfG, Koblenz, Germany, 2002. a, b, c
Haddeland, I., Heinke, J., Biemans, H., Eisner, S., Floerke, M., Hanasaki, N., Konzmann, M., Ludwig, F., Masaki, Y., Schewe, J., Stacke, T., Tessler, Z., Wada, Y., and Wisser, D.: Global water resources affected by human interventions and climate change, P. Natl. Acad. Sci. USA, 111, 3251–3256, https://doi.org/10.1073/pnas.1222475110, 2014. a
Hoekstra, A. and Wiedmann, T.: Humanity's unsustainable environmental footprint, Science, 344, 1114–1117, https://doi.org/10.1126/science.1248365, 2014. a
International Dark-Sky Association: International Dark-Sky Association, available at: http://www.darksky.org/resources (last access: 8 March 2017), 2017. a
IPCC: Climate Change 2013: The Physical Science Basis, in: Contribution of Working Group I to the Fifth Assessment Report of the Intergovernmental Panel on Climate Change, Cambridge University Press, Cambridge, UK and New York, NY, USA, 2013. a
Jean, N., Burke, M., Xie, M., Davis, W., Lobell, D., and Ermon, S.: Combining satellite imagery and machine learning to predict poverty, Science, 353, 790–794, https://doi.org/10.1126/science.aaf7894, 2016. a
Kummu, M., de Moel, H., Ward, P., and Varis, O.: How close do we live to water? A global analysis of population distance to freshwater bodies, PLoS ONE, 6, e20578, https://doi.org/10.1371/journal.pone.0020578, 2011. a
Kummu, M., Guillaume, J., de Moel, H., Eisner, S., Floerke, M., Porkka, M., Siebert, S., Veldkamp, T., and Ward, P.: The world's road to water scarcity: shortage and stress in the 20th century and pathways towards sustainability, Scient. Rep., 6, 38495, https://doi.org/10.1038/srep38495, 2016. a
Lehner, B., Verdin, K., and Jarvis, A.: New global hydrography derived from spaceborne elevation data, Eos Trans. AGU, 89, 93–94, https://doi.org/10.1029/2008EO100001, 2008. a
Mard, J., Di Baldassarre, G., and Mazzoleni, M.: Nighttime light data reveal how flood protection shapes human proximity to rivers, Sci. Adv., 4, eaar5779, https://doi.org/10.1126/sciadv.aar5779, 2018. a
Mekonnen, M. M. and Hoekstra, A. Y.: Four billion people facing severe water scarcity, Sci. Adv., 2, e1500323, https://doi.org/10.1126/sciadv.1500323, 2016. a, b
Meybeck, M., Kummu, M., and Duerr, H.: Global hydrobelts and hydroregions: improved reporting scale for water-related issues?, Hydrol. Earth Syst. Sci., 17, 1093–1111, https://doi.org/10.5194/hess-17-1093-2013, 2013. a, b, c, d, e, f, g
Millennium Ecosystem Assessment: Ecosystems and Human Well-beings: Synthesis, Island Press, Washington, D.C., 2005. a
NOAA: Version 4 DMSP-OLS Nighttime Lights Time Series, NOAA – Earth Observation Group, available at: http://ngdc.noaa.gov/eog/dmsp/downloadV4composites.html, last access: 6 March 2017. a, b, c
Padowski, J. C., Gorelick, S. M., Thompson, B. H., Rozelle, S., and Fendorf, S.: Assessment of human-natural system characteristics influencing global freshwater supply vulnerability, Environ. Res. Lett., 10, 104014, https://doi.org/10.1088/1748-9326/10/10/104014, 2015. a
Pekel, J., Cottam, A., Gorelick, N., and Belward, A.: High-resolution mapping of global surface water and its long-term changes, Nature, 540, 418–422, https://doi.org/10.1038/nature20584, 2016. a
Rodriguez-Iturbe, I. and Rinaldo, A.: Fractal river basins: chance and self-organization, Cambridge University Press, Cambridge, 2001. a
Roudier, P., Ducharne, A., and Feyen, L.: Climate change impacts on runoff in West Africa: a review, Hydrol. Earth Syst. Sci., 18, 2789–2801, https://doi.org/10.5194/hess-18-2789-2014, 2014. a
Royal Astronomical Society of Canada: Light-pollution abatement, available at: http://rasc.ca/lpa, last access: 8 March 2017. a
Sanderson, E., Jaiteh, M., Levy, M., Redford, K., Wannebo, A., and Woolmer, G.: The human footprint and the last of the wild, Bioscience, 52, 891–904, https://doi.org/10.1641/0006-3568(2002)052[0891:THFATL]2.0.CO;2, 2002. a, b, c, d, e
Small, C.: Global Population Distribution and Urban Land Use in Geophysical Parameter Space, Earth Interact., 8, 2004. a
Steffen, W., Richardson, K., Rockstrom, J., Cornell, S., Fetzer, I., Bennett, E., Biggs, R., Carpenter, S., de Vries, W., de Wit, C., Folke, C., Gerten, D., Heinke, J., Mace, G., Persson, L., Ramanathan, V., Reyers, B., and Sorlin, S.: Planetary boundaries: Guiding human development on a changing planet, Science, 347, 1259855, https://doi.org/10.1126/science.1259855, 2015. a
Sutton, P.: A scale-adjusted measure of “Urban sprawl” using nighttime satellite imagery, Remote Sens. Environ., 86, 353–369, https://doi.org/10.1016/S0034-4257(03)00078-6, 2003. a
UNWWAP: The United Nations World Water Development Report 2015: Water for a Sustainable World, UNESCO, Paris, 2015. a, b
Veldkamp, T., Wada, Y., Aerts, J., Doll, P., Gosling, S., Liu, J., Masaki, Y., Oki, T., Ostberg, S., Pokhrel, Y., Satoh, Y., Kim, H., and Ward, P.: Water scarcity hotspots travel downstream due to human interventions in the 20th and 21st century, Nat. Commun., 8, 15697, https://doi.org/10.1038/ncomms15697, 2017. a
Venter, O., Sanderson, E., Magrach, A., Allan, J., Beher, J., Jones, K., Possingham, H., Laurance, W., Wood, P., Fekete, B., Levy, M., and Watson, J.: Sixteen years of change in the global terrestrial human footprint and implications for biodiversity conservation, Nat. Commun., 7, 12558, https://doi.org/10.1038/ncomms12558, 2016a. a, b, c, d, e, f, g
Venter, O., Sanderson, E., Magrach, A., Allan, J., Beher, J., Jones, K., Possingham, H., Laurance, W., Wood, P., Fekete, B., Levy, M., and Watson, J.: Global terrestrial Human Footprint maps for 1993 and 2009, Scient. Data, 3, 160067, https://doi.org/10.1038/sdata.2016.67, 2016b. a, b, c, d
Venter, O., Sanderson, E. W., Magrach, A., Allan, J. R., Beher, J., Jones, K. R., Possingham, H. P., Laurance, W. F., Wood, P., Fekete, B. M., Levy, M. A., and Watson, J. E. M.: Data from: Global terrestrial Human Footprint maps for 1993 and 2009, v2, Dryad, Dataset, https://doi.org/10.5061/dryad.052q5, 2016c. a
Vörösmarty, C., Fekete, B., Meybeck, M., and Lammers, R.: Geomorphometric attributes of the global system of rivers at 30-minute spatial resolution, J. Hydrol., 237, 17–39, https://doi.org/10.1016/S0022-1694(00)00282-1, 2000a. a, b
Vörösmarty, C., Fekete, B., Meybeck, M., and Lammers, R.: Global system of rivers: Its role in organizing continental land mass and defining land-to-ocean linkages, Global Biogeochem. Cy., 14, 599–621, https://doi.org/10.1029/1999GB900092, 2000b. a, b
Vörösmarty, C., Green, P., Salisbury, J., and Lammers, R.: Global water resources: Vulnerability from climate change and population growth, Science, 289, 284–288, https://doi.org/10.1126/science.289.5477.284, 2000c. a
Vörösmarty, C., McIntyre, P., Gessner, M., Dudgeon, D., Prusevich, A., Green, P., Glidden, S., Bunn, S., Sullivan, C., Liermann, C., and Davies, P.: Global threats to human water security and river biodiversity, Nature, 467, 555–561, https://doi.org/10.1038/nature09440, 2010. a, b, c, d, e, f, g, h, i, j
Wada, Y. and Bierkens, M.: Sustainability of global water use: past reconstruction and future projections, Environ. Res. Lett., 9, 104003, https://doi.org/10.1088/1748-9326/9/10/104003, 2014. a
Worldbank: World Bank Open Data, available at: http://data.worldbank.org/, last access: 12 September 2017a. a
Worldbank: World Population Prospect 2017, Sustainable Development Goals, available at: https://esa.un.org/unpd/wpp, last access: 12 September 2017b. a, b, c
World Economic Forum: Global Risks 2015, 10th Edn., World Economic Forum, Geneva, Switzerland, 2015. a