the Creative Commons Attribution 4.0 License.
the Creative Commons Attribution 4.0 License.
 | 04 Sep 2019
Assessing inter-annual and seasonal patterns of DOC and DOM quality across a complex alpine watershed underlain by discontinuous permafrost in Yukon, Canada
Nadine J. Shatilla
Sean K. Carey
High-latitude environments store approximately half of the global organic carbon pool in peatlands, organic soils and permafrost, while large Arctic rivers convey an estimated 18–50 Tg C a−1 to the Arctic Ocean. Warming trends associated with climate change affect dissolved organic carbon (DOC) export from terrestrial to riverine environments. However, there is limited consensus as to whether exports will increase or decrease due to complex interactions between climate, soils, vegetation, and associated production, mobilization and transport processes. A large body of research has focused on large river system DOC and dissolved organic matter (DOM) lability and observed trends conserved across years, whereas investigation at smaller watershed scales show that thermokarst and fire have a transient impact on hydrologically mediated solute transport. This study, located in the Wolf Creek Research Basin situated ∼20 km south of Whitehorse, YT, Canada, utilizes a nested design to assess seasonal and annual patterns of DOC and DOM composition across diverse landscape types (headwater, wetland and lake) and watershed scales. Peak DOC concentration and export occurred during freshet, as is the case in most northern watersheds; however, peaks were lower than a decade ago at the headwater site Granger Creek. DOM composition was most variable during freshet with high A254 and SUVA254 and low FI and BIX. DOM composition was relatively insensitive to flow variation during summer and fall. The influence of increasing watershed scale and downstream mixing of landscape contributions was an overall dampening of DOC concentrations and optical indices with increasing groundwater contribution. Forecasted vegetation shifts, enhanced permafrost and seasonal thaw, earlier snowmelt, increased rainfall and other projected climate-driven changes will alter DOM sources and transport pathways. The results from this study support a projected shift from predominantly organic soils (high aromaticity and less fresh) to decomposing vegetation (more fresh and lower aromaticity). These changes may also facilitate flow and transport via deeper flow pathways and enhance groundwater contributions to runoff.
- Article
(3961 KB) - Full-text XML
-
Supplement
(419 KB) - BibTeX
- EndNote


High latitudes, particularly the northwestern regions of North America, are experiencing some of the most rapid documented warming on the planet (Serreze and Francis, 2006; DeBeer et al., 2016). This warming has intensified the Arctic freshwater cycle (Bring et al., 2016) and resulted in landscape disturbance and change that alters biogeochemical cycles (Vonk et al., 2015; Wrona et al., 2016). Carbon storage and cycling have been the focus of considerable attention, as soils and sediments in the northern high latitudes are estimated to store approximately 1300 Pg (∼40 %) of the global belowground organic carbon pool (Hugelius et al., 2014) and deliver ∼10 % of the total freshwater input to global oceans (Gordeev et al., 1996; Opsahl et al., 1999; Shiklomanov, 2000). The mobilization and delivery of this terrestrial organic carbon has been identified as critical to the global carbon cycle given initial estimates that Arctic rivers convey 18–26 Tg C a−1 to the Arctic Ocean (Dixon et al., 1994; Dittmar and Kattner, 2003). More recent studies estimate between 25 and 50 Tg C a−1 is exported (Raymond et al., 2007; McGuire et al., 2009; Johnston et al., 2018).
Changes in DOC export associated with warming are largely related to the analysis of data from large rivers, and the links to altered catchment characteristics and processes vary across study areas (McClelland et al., 2007). Regionally, Tank et al. (2016) reported a 39 % increase in DOC flux estimates between 1978 and 2012, while Striegl et al. (2005) documented an increase in flux along with a 40 % decline in the flow-weighted DOC concentration between 1978–1980 and 2001–2003 for the Yukon River. In a more recent analysis of the Yukon River, Toohey et al. (2016) suggested that there was no trend in DOC export from 2001 to 2014, whereas Ca, Mg, Na and SO4 as well as P fluxes have increased significantly over the last 30 years. These increases are attributed to deeper flow paths as permafrost degrades, increased weathering and increased sulfate oxidation (Toohey et al., 2016). Typically, DOC flux estimates are derived from limited spot water quality sampling and rely on a relationship between water yield and DOC concentration to calculate loads (Raymond et al., 2007; McClelland et al., 2007; Manizza et al., 2009; Holmes et al., 2012; Tank et al., 2016). While the influence of changing mean annual temperature on DOC production and transport across 49 northern watersheds was summarized by Laudon et al. (2012), northern landscapes are also susceptible to fire and thermokarst. These disturbances have a transient influence on hydrologically mediated DOC transport that confounds spatial and temporal patterns of DOC flux from non-permafrost terrigenous sources to the river–ocean continuum (Larouche et al., 2015; Littlefair et al., 2017; Burd et al., 2018).
In northern and permafrost landscapes, the link between hydrological and biogeochemical cycles and the role of frozen ground and organic matter has been well documented in process-based studies (e.g. Maclean et al., 1999; Carey, 2003; O'Donnell and Jones, 2006; Petrone et al., 2006; Carey et al., 2013a; Koch et al., 2013; Olefeldt and Roulet, 2014; Burd et al., 2018). While wetlands have been highlighted as a source of DOC, particularly in Scandinavian catchments, in permafrost environments the presence of thermally mediated flow paths are critical. DOC export is often greatest during snowmelt freshet when DOC is mobilized from organic-rich layers such that peak concentrations and high spring flows result in a large annual “flush” (Boyer et al., 2000; Carey, 2003; Finlay et al., 2006). This behaviour is often observed in western Canada but is not ubiquitous (Li Yung Lung et al., 2018). Depending on the soil profile, as flow paths descend in response to soil thaw, DOC mobilization typically declines and flow in mineral layers provides more opportunity for immobilization and adsorption (MacLean et al., 1999; review by Kalbitz et al., 2000; Carey, 2003; Kawahigashi et al., 2004, 2006; Frey and Smith, 2005). In some environments, an increase in the late fall DOC flux has been ascribed to freezing processes in the soil column (Johnson et al., 2018). How this temporal relationship varies across scales is less certain as few studies provide nested datasets; however, analysis by Tiwari et al. (2014, 2017) and synthesis by Creed et al. (2015) suggest downstream mixing and deeper subsurface sources of DOC mask process drivers, including in-stream transformation as scale increases. In addition, the role of photodegradation and oxidation of DOC to CO2 in large Arctic rivers has received considerable attention (Cory et al., 2014; Ward and Cory, 2016).
The lability (i.e. biodegradability) of dissolved organic matter (DOM) is a key regulator of ecosystem function and is primarily linked to molecular structure and environmental factors such as temperature, vegetation, oxygen availability and microbial activity (Schmidt et al., 2011). DOC is the mass of C in the DOM pool for which the lability, aromaticity and origins can in part be characterized using optical techniques. DOM exported from large Arctic rivers during spring freshet has previously been reported as highly labile (Raymond et al., 2007; Holmes et al., 2008; Spencer et al., 2008) with more refractory DOM during recession periods (Holmes et al., 2008; Wickland et al., 2012). DOM quality is expected to shift in response to permafrost thaw, thermokarst, vegetation shifts, wildfire and increasing precipitation during summer months associated with climate warming (Davidson and Janssens, 2006; Frey and McClelland, 2009; Schuur et al., 2015). Spectral indices and multidimensional analysis of large optical datasets from northern landscapes have resulted in important insights into how DOM quality varies seasonally (e.g. Striegl et al., 2005; Neff et al., 2006; Finlay et al., 2006; Spencer et al., 2008, 2009; Prokushkin et al., 2011; Mutschlecner et al., 2018), and is linked to source material, landscape characteristics (Kawahigashi et al., 2004; Harms et al., 2016) and disturbance (Balcarczyk et al., 2009; Abbott et al., 2015; Littlefair et al., 2017; Burd et al., 2018).
While information from large rivers is critical for estimates of DOM loading to the Arctic Ocean, research at headwater scales that identifies controls on DOC production and transport is relatively scarce and often points to multiple process mechanisms (Maclean et al., 1999; Temnerud and Bishop, 2005; Larouche et al., 2015). Furthermore, much of our understanding of DOC is biased towards lowland ecosystems, with relatively scarce information from northern alpine systems (Laudon et al., 2012). The goal of this paper is to enhance our understanding of the coupled dynamics of hydrology and DOC export and composition (using optical properties of DOM) in a well-studied, discontinuous permafrost alpine catchment in subarctic Yukon, Canada. We collected samples over 2 consecutive years from freshet to late fall from two headwater catchments, a lake, a wetland and the outlet of a mesoscale catchment in a nested design to explore seasonal and annual variability in DOC concentrations and DOM composition. Impacts of increasing catchment scale and differing landscape types on DOM optical indices were also assessed.
The specific questions addressed in this work were as follows:
-
How do the DOC concentration and DOM composition vary over multiple seasons across a diverse mountain watershed?
-
What are the factors that drive this variability across scales?
This study provides important insights into how season and scale influence the sources and transport of DOM in a cold alpine setting.
2.1 Study area
Several headwater streams, a wetland and a high-elevation lake outlet were studied within the Wolf Creek Research Basin (WCRB, 61∘310′ N, 135∘310′ W) located ∼20 km south of Whitehorse in Yukon Territory, Canada (Fig. 1). WCRB is a long-term research watershed located at the edge of the Coast Mountains; the watershed spans an elevation ranging from 712 to 2080 m a.s.l. and has a drainage area of ∼179 km2. WCRB straddles three ecological zones: at lower elevations boreal forest (predominantly white spruce (Picea glauca var. porsildii)) covers ∼28 % of the watershed; at intermediate elevations shrub taiga comprises ∼47 %; and at elevations above ∼1500 m, alpine tundra and bare rock surfaces predominate. WCRB has a relatively dry subarctic climate (Koppen classification Dfc) with 30-year climate normals (1981–2010) reported for Whitehorse Airport (706 m). The average airport air temperature is −0.1∘C and precipitation is 262.3 mm, with 161 mm falling as rain. However, considering that WCRB covers a large elevation gradient, colder temperatures and considerably larger volumes of precipitation have been reported for high-elevation sub-watersheds (Pomeroy et al., 1999; Carey et al., 2013b; Rasouli et al., 2019). The geological setting of WCRB is sedimentary sandstone, siltstone, limestone and conglomerate. Atop bedrock, thick stony till and glacial drift cover most of the basin. Soils in the top metre are generally sandy to silty, and at higher elevations (taiga and lower tundra ecozones) a veneer of surface organic soils with variable thickness predominate. Permafrost underlies much of the basin (∼43 %), particularly at higher elevations and on north-facing slopes in the taiga and alpine ecozones (Lewkowicz and Ednie, 2004).
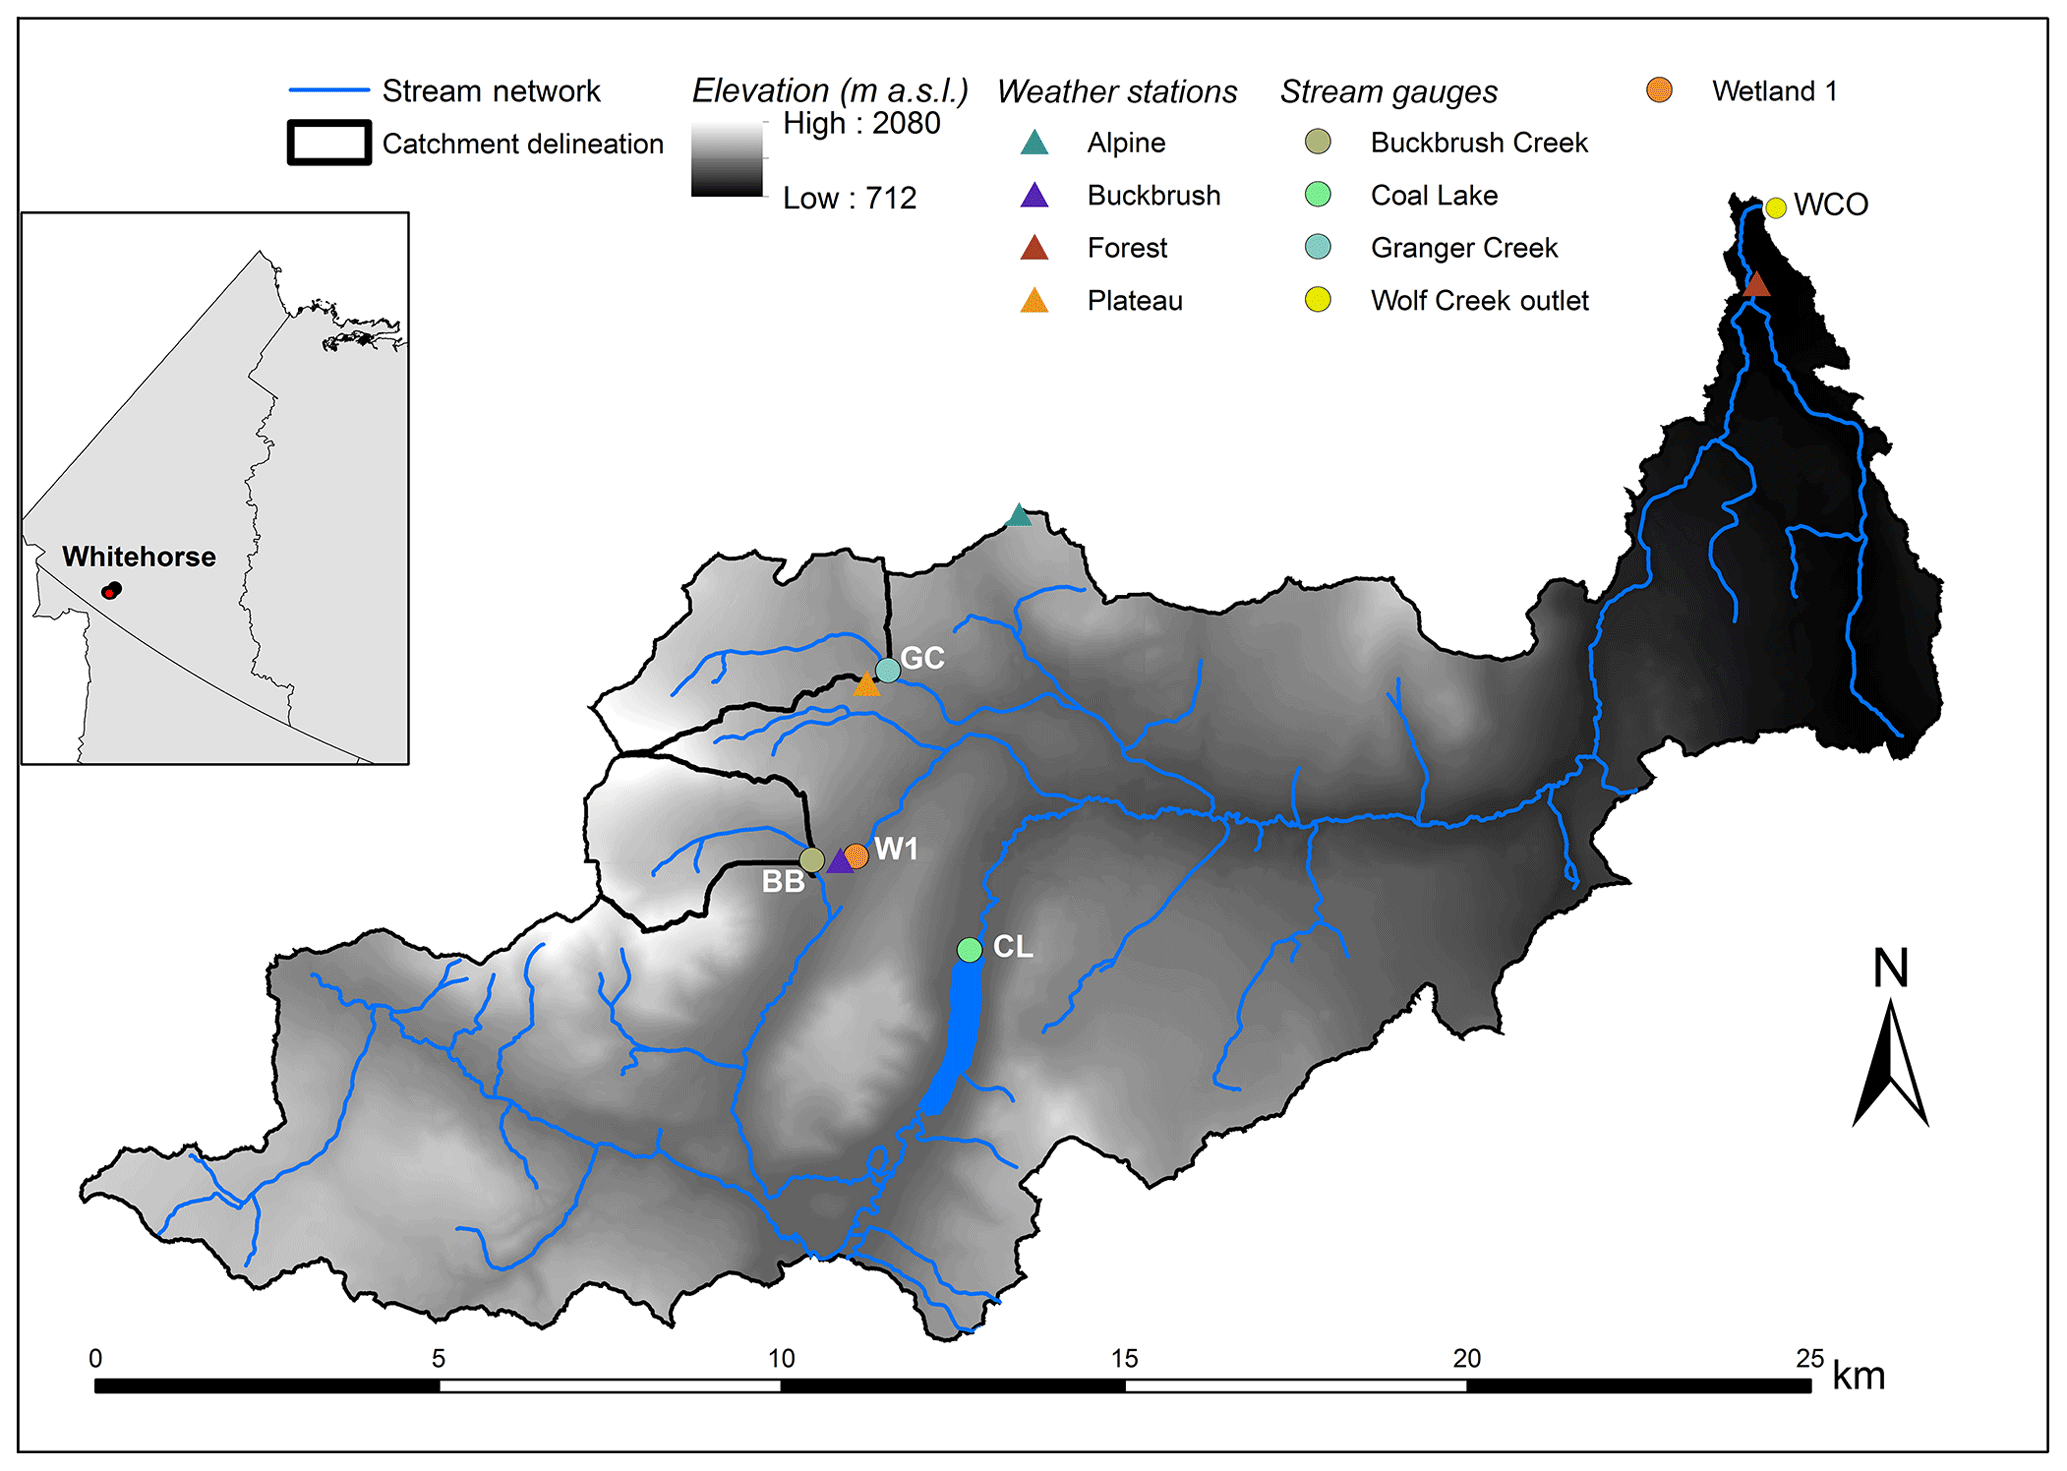
Figure 1Map of Wolf Creek Research Basin (WCRB) with Buckbrush Creek (BB) and Granger Creek (GC) catchments delineated. All stream gauges (BB, GC, CL, W1 and WCO) are indicated using circles; weather stations within WCRB are shown as triangles.
Much of this study focussed on the headwater catchment of Granger Creek (GC), which drains an area of 7.6 km2 and ranges in elevation from 1355 to 2080 m a.s.l. (McCartney et al., 2006; Carey et al., 2013a) (Fig. 1). GC is above the treeline (∼1200 m) and is dominated by willow (Salix Sp.) and birch (Betula Sp.) shrubs at lower elevations with dwarf shrubs, lichen and bare rock above 1500 m. South-facing slopes have a thin organic layer atop sandy soils, whereas north slopes have thicker organic layers (10–30 cm) and are underlain with discontinuous permafrost. A wide riparian zone (50 to 100 m) with a consistently high water table in the lower reaches of GC lies between the slopes. Buckbrush Creek (BB; 60∘31′18.01′′ N, 135∘12′17.27′′ W), another headwater catchment, drains an area of 5.75 km2 and is located approximately 2 km west of GC (Fig. 1). BB ranges in elevation from 1324 to 2080 m a.s.l. and has similar physiographic characteristics to GC. However, Buckbrush Creek is less incised than GC, and the riparian zone shows evidence of multiple overbank channels during high-flow events.
The Wetland 1 (W1; 60∘31′18.72′′ N, 135∘11′34.71′′ W) site is located at the edge of a wetland complex located downstream of BB with an indeterminate drainage area. The vegetation is dominantly sedges, with ponded water covering 200 m2. Coal Lake (CL; 60∘30′36.65′′ N, 135∘9′44.47′′ W) is a long-term hydrometric station located approximately at the mid-point of the watershed at the outlet of an ∼1 km2 lake (Rasouli et al., 2019). A large wetland complex is located upstream of CL, which is surrounded by steep slopes and vegetation that transitions from boreal forest at lake level to alpine tundra at the top of surrounding slopes.
2.2 Field measurements
Discharge was measured using rating curves developed for each study season at all sites except the WCRB outlet (WCO) and CL, which have retained a stable curve for the past several years (discharge measurements at the WCRB outlet exist from 1992). Stilling wells at each site were instrumented with Solinst Leveloggers and compensated with adjacent Solinst Barologgers measuring stage/pressure every 15 min to provide continuous flow records. Manual flows were taken frequently using a SonTek Flowtracker during high and low flows with salt-dilution gauging during periods when the channels were beneath ice. Bushnell game cameras and in-person observations were used to document when the headwater streams and outlet were ice-free in spring to validate the use of pressure transducer measurements.
WCRB has three long-term weather stations (Alpine, Buckbrush and Forest) to characterize the climate in each ecozone. All radiation components as well as the air temperature, wind speed, vapour pressure and total precipitation are measured year-round at each site at a 30 min resolution with some gaps due to power loss (Rasouli et al., 2019). The rainfall data reported in this study are from a tipping-bucket rain gauge located at the nearby Buckbrush weather station and have been compared with an Alter-shielded Geonor total precipitation gauge for accuracy. A fourth meteorological tower (Plateau) in the GC watershed has been operating since 2015. Monthly snow courses are completed in each ecozone to determine snow water equivalent (SWE), and on-site continuous measurements from a SR50 sensor at Plateau along with snow pillow measurements from Buckbrush (Rasouli et al., 2019 provide instrumentation details) supplement these and provide information on melt rates.
2.3 Surface water sample collection and preparation
Surface water samples were collected from April 2015 to December 2016, with the bulk of collection between April and September of each year with most samples collected at GC and frequent sampling at BB and WCO. Only a few samples were taken at W1 in 2015 and 2016. For DOC, samples were field-filtered with single use plastic syringes submersed in the sample water immediately prior to sampling. Water was displaced through a 0.45 µm VWR polyethersulfone syringe filter and collected in a 60 mL opaque amber HDPE bottle. Duplicates were taken approximately every 10 samples. All samples were kept cool and out of direct light before being shipped for analysis. DOM water samples were filtered in situ and stored cool in 40 mL glass amber vials. In situ filtration with a syringe kept the time between sample collection and filtration to a minimum, particularly during freshet when logistical constraints meant that researchers remained in the catchment for up to 2 weeks at a time before returning to Whitehorse.
2.4 DOC and DOM fluorescence analysis
Water samples were sent to the Biogeochemical Analysis Service Laboratory (University of Alberta) for analysis on a Shimadzu TOC-5000(A) total organic carbon analyzer for DOC concentration following the US EPA protocol 415.1. The reportable detection limit provided by BASL for these samples was 0.1 mg L−1. In total, 330 surface water samples were collected from 2015 to 2016, as outlined in Table 1. Of the 330 DOC samples, ∼215 were analyzed for DOM quality using fluorescence spectroscopy. Seven additional samples from CL in 2017 were analyzed for DOC concentration and DOM quality.
Table 1Summary statistics for DOC, SUVA, BIX and FI at all sites during the 2015–2016 period. Seasons are separated into spring (15 April–15 June), summer (16 June–15 August) and fall/winter (F/W; 16 August–14 April).
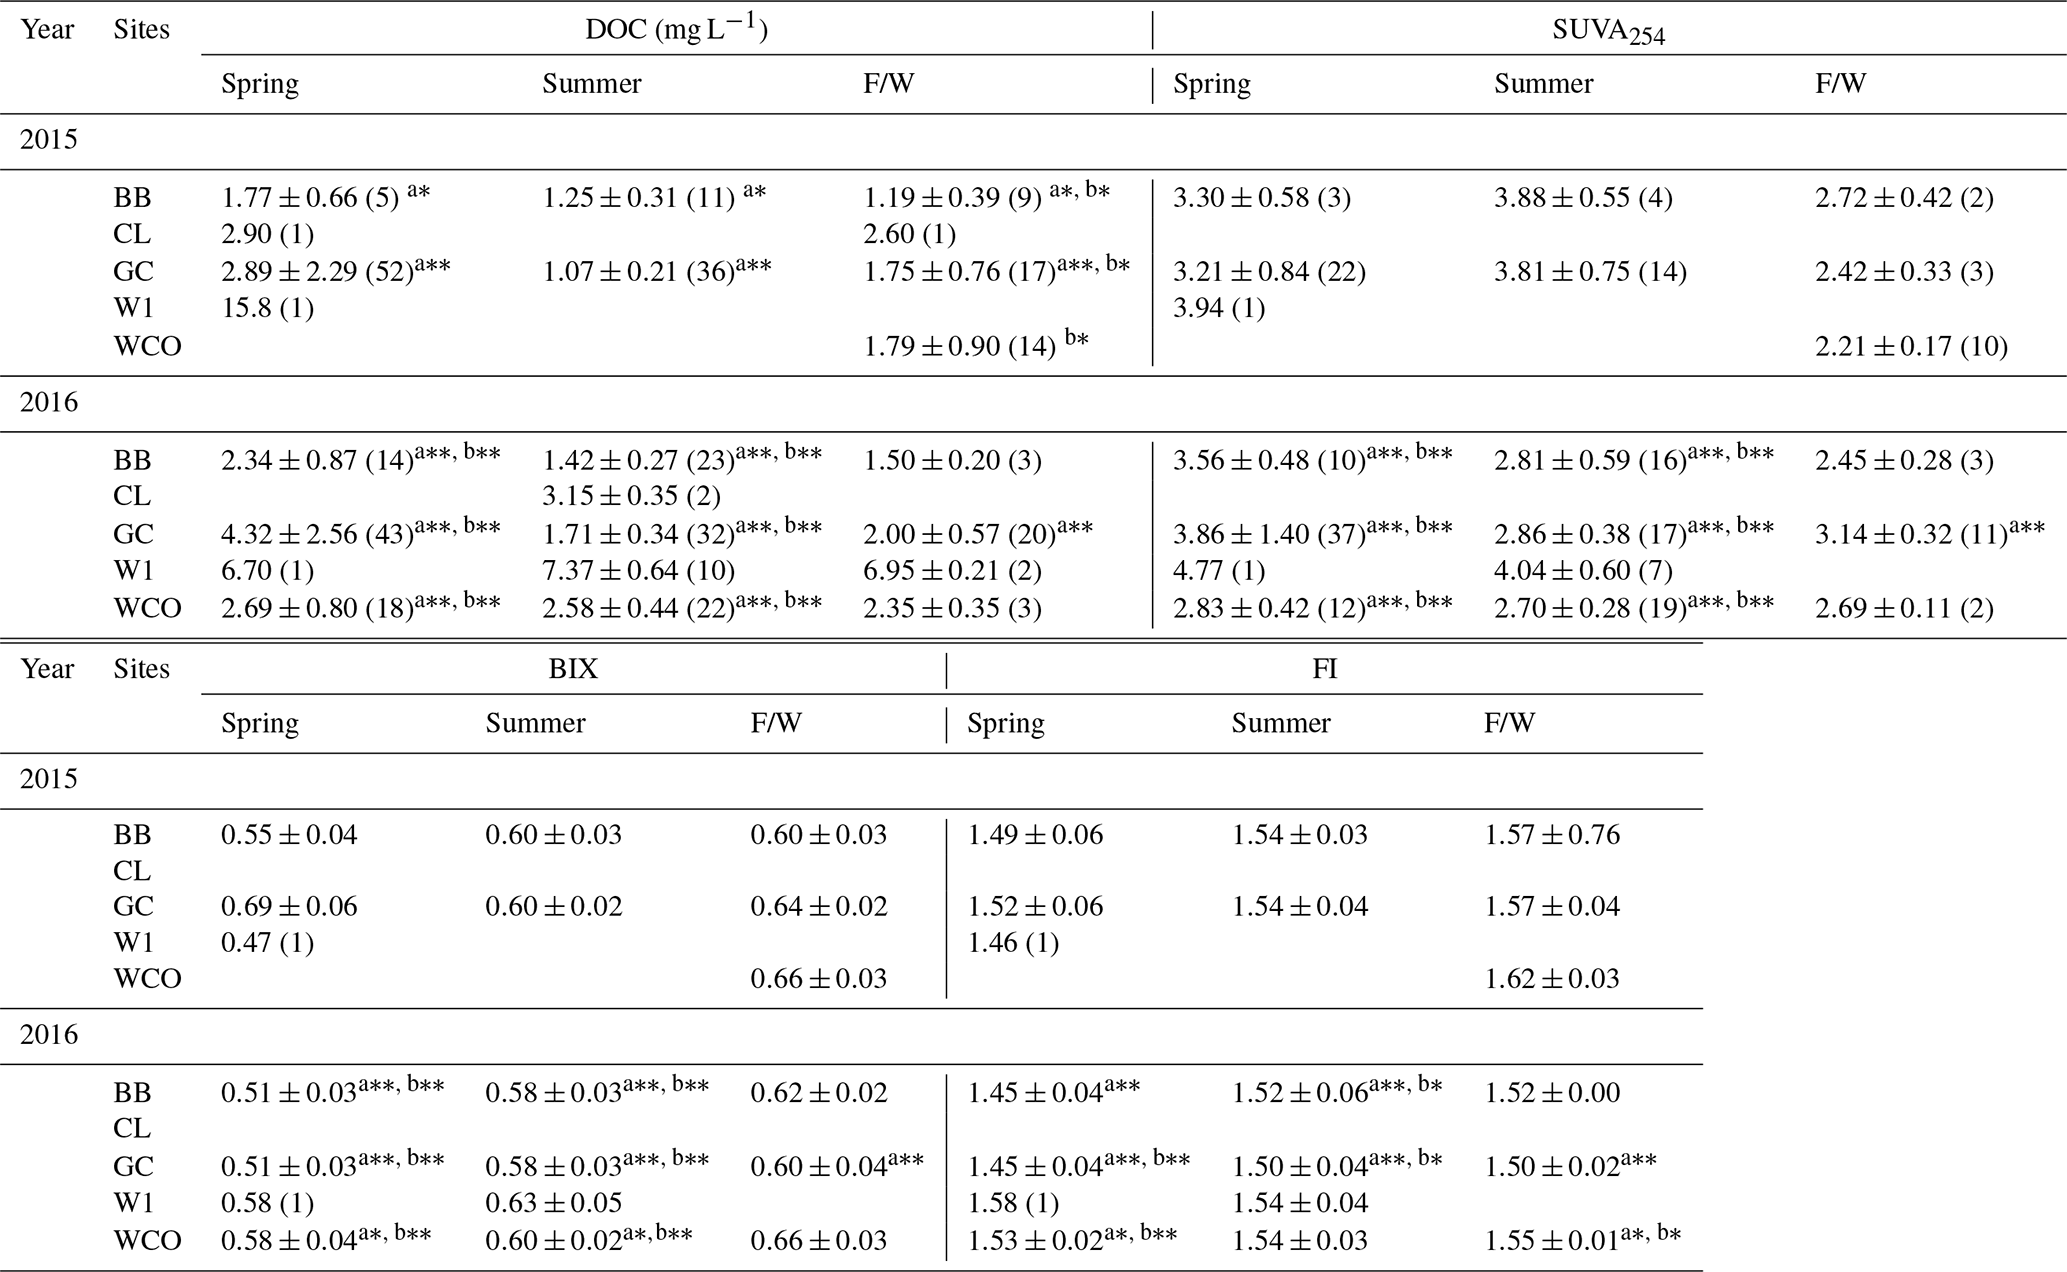
a Significant differences from non-parametric Kruskal–Wallis tests across seasons for the same site. b Significant differences across sites during the same season in the same year . * p<0.05, and p<0.001.
Fluorescence excitation emission matrices (EEMs) were obtained from 0.45 µm PES-filtered water samples using a Yvon Jobin Aqualog benchtop spectrofluorometer (HORIBA Scientific, Edison, NJ, USA). Fluorescence spectra were recorded at an excitation range of 240–600 nm in steps of 5 nm with an emission range of 212–620 nm, in steps of 3 nm. The integrated Raman spectrum was checked before each run and compared to prior values to ensure consistent lamp intensity. A sealed quinone sulfate sample and blank pair were also run prior to each batch of samples and compared to prior values to ensure consistency. Fluorescence spectra were normalized to the area under the Raman scatter peak (peak excitation wavelength 397 nm) of a sealed Milli-Q water sample prior to all sample runs. A lab blank of distilled water was also appended to each sample run, and every four sample runs a sample was repeated. Scatter from the Raman Milli-Q sample was subtracted from each sample fluorescence spectrum. The correction and normalization of samples to the Raman standard resulted in normalized intensity spectra being expressed in Raman units (R.U., nm−1).
Blank subtraction, Rayleigh scatter and inner filter effects were corrected using Aqualog® software. Subsequent EEM corrections and smoothing were carried out using the DrEEM toolbox (Murphy et al., 2013) in MATLAB (Mathworks Inc., Massachusetts, USA). Results were considered comparable to each other as all data were collected from a single instrument and the Raman standard emission intensity was verified for each data run.
Optical data obtained from Aqualog® runs were used to calculate optical indices. SUVA254 (L mg C−1 m−1) is calculated as UV absorbance at 254 nm (m−1) divided by DOC concentration (mg L−1) (Weishaar et al., 2003) with a unit correction based on the cuvette path length. SUVA254 is commonly reported along with DOC concentration and is positively related to aromaticity in bulk DOM (Weishaar et al., 2003) with higher values indicative of a strong terrestrial signal (Jaffé et al., 2008). Typically, SUVA values greater than 4.5 L mg C−1 m−1 denote high absorption at 254 nm due to colloids or iron (Weishaar et al., 2003; Hudson et al., 2007). Interference due to iron within WCRB was largely ruled out by Herod et al. (2016), who reported low iron concentrations at WCO (see Supplement). Research in northern peatlands has associated peat soil leachates with relatively lower SUVA254 values of 3.0 L mg C−1 m−1 (Olefeldt et al., 2013). Allochthonous, terrestrial DOM is associated with increased aromaticity and a higher SUVA254 value, whereas lower SUVA values are related to modified terrestrial DOM. The biological index (BIX) is the ratio of emission intensities at 380∕430 nm at an excitation wavelength of 310 nm (Huguet et al., 2009). Higher BIX values indicate greater autotrophic productivity (Huguet et al., 2009) or greater relative freshness of bulk DOM (Wilson and Xenopoulos, 2009), whereas lower values indicate older, more terrestrial DOM. The fluorescence index (FI) is calculated as the ratio of fluorescence emission intensities at 470∕520 nm at an excitation wavelength of 370 nm (Cory and McKnight, 2005). FI is used to differentiate between DOM derived from microbial sources (1.7–2.0) or higher terrestrial plant sources (1.3–1.4) with intermediary values indicative of mixing (McKnight et al., 2001; Jaffé et al., 2008; Fellman et al., 2010). Typical values reported for inland rivers are between 1.3 and 1.8 (Brooks and Lemon, 2007).
In addition to the DOM quality indices reported and discussed throughout this paper, absorbance at 254 nm (A254), the freshness index (Parlanti et al., 2000) and the modified humification index (HIX; Ohno, 2002) were also calculated and compared with the other indices. BIX and the freshness index were highly correlated (r2=0.99, p<0.001) for all sites, years and seasons. A254 and DOC concentrations also showed high correlation (r2 = 0.95–7, p<0.001). Due to the similarity in the temporal trends of DOM indices, HIX was not reported independently of the parameters mentioned above. HIX is calculated by summing the peak area under emission intensities from 435 to 480 nm divided by that of 300 to 345 nm at an excitation of 254 nm (Zsolnay et al., 1999). Higher HIX values are related to an increased degree of humification (Huguet et al., 2009; Fellman et al., 2010).
2.5 DOC load calculations
DOC fluxes for GC were estimated using the R package “RiverLoad” (Nava et al., 2019). RiverLoad provided several methods of generating estimates of the DOC flux; for this paper, “method1” (time-weighted Q and C) was chosen as the most appropriate. Briefly, method1 considers the mean concentration and mean flow of each sample to obtain a load value and is biased towards underestimating load in some situations (see Nava et al., 2019, Sect. 2.1.1, for full details and the equation). Daily discharge data and DOC concentrations (maximum of one measurement per day) for 2002, 2003, 2006 and 2008 were obtained from Carey et al. (2013a). DOC concentrations (maximum of two per day) and discharge at a 15 min resolution for 2015 and 2016 are outlined in Sect. 3.2 and 3.3. Any gaps in the discharge data were filled by time-weighted interpolation; however, there were no gaps greater than 3 d during springs flows for any year (2002, 2003, 2006, 2008, 2015 or 2016).
2.6 Statistical analysis
General descriptive statistics including the mean and standard deviation were calculated for DOC, SUVA254 and the fluorescence indices and compiled in Table 1. To better assess differences between landscape units (e.g. headwaters, wetland, lake and catchment outlet), principal component analysis (PCA) was performed using DOC concentrations and optical indices (i.e. FI, BIX, Freshness, HI and SUVA254). These variables were scaled and then standardized into a covariance matrix to avoid larger magnitudes exerting greater influence than smaller magnitudes. The PCA was performed using R software version 3.4.0 (R Core Team, 2017) in RStudio with the princomp() R function, and ggplot2 (Wickham, 2016), GGally (Schloerke et al., 2018), ggpubr (Kassambara, 2018), lubridate (Grolemund and Wickham, 2011), magrittr (Bache and Wickham, 2014), dplyr (Wickham et al., 2018), tidyr (Wickham and Henry, 2018) and ggfortify (Tang et al., 2016) R packages for calculating descriptive statistics, correlations, data manipulation and visualization.
3.1 Climate
For 2015 and 2016, the average annual air temperature as recorded at the Whitehorse airport weather station was 1.4 and 2.4 ∘C respectively, which is warmer than the 30-year normal (1980–2010). May average monthly temperatures in both years were well above the normal, with an average air temperature of 11.8 ∘C in May 2015 compared with a normal of 7.3 ∘C. Average annual air temperatures measured at the Buckbrush weather station (mid-basin) were −0.6 and −0.0 ∘C respectively for the 2 years (Fig. 2). Persistent inversions in winter result in warmer temperatures at higher elevations from December through to February. Accurate measurements of total precipitation have not been recorded at Whitehorse airport for several years, limiting long-term context, but rainfall values from a nearby (∼3 km) station were used for 2015–2016 as well as rainfall from the Buckbrush weather stations (Fig. 2).
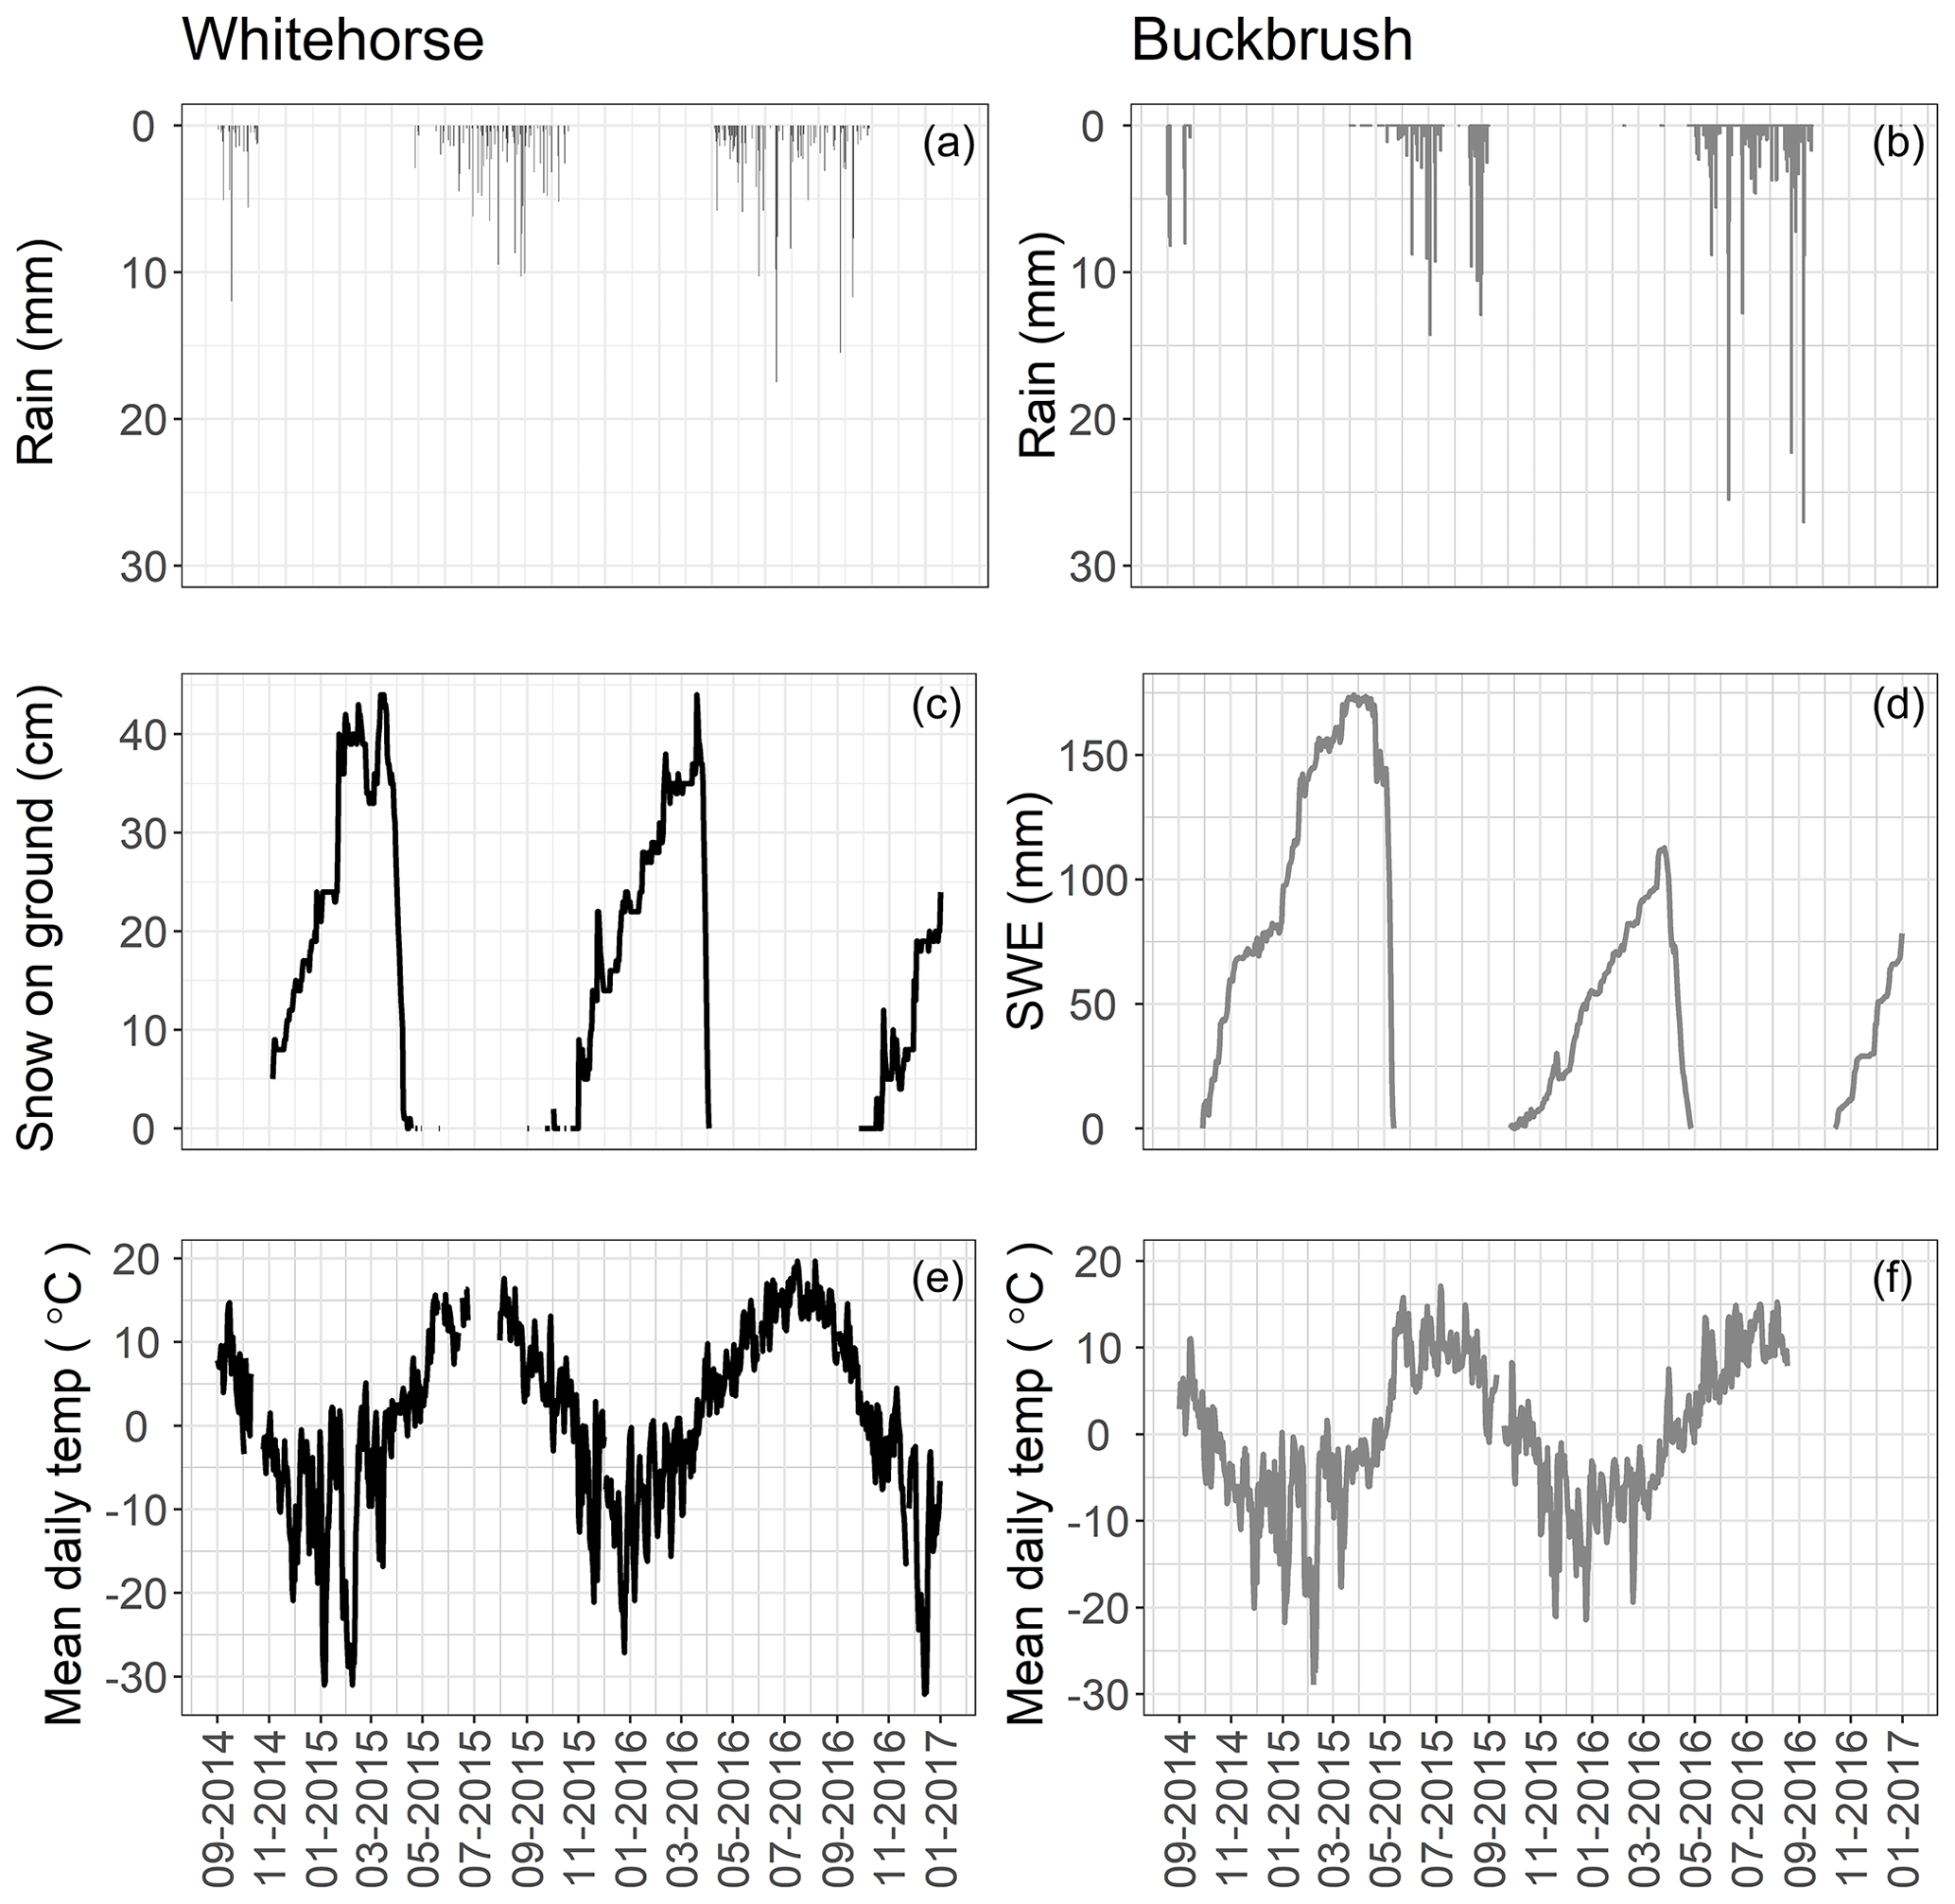
Figure 2Climate variables from Whitehorse Auto (rainfall; 60∘43′59.000′′ N, 135∘05′52.000′′ W, 707 m a.s.l.), Whitehorse Airport (snow on ground and mean daily temp; 60∘42′34.200′′ N, 135∘04′07.800′′ W) and Buckbrush weather stations (a, c, e). Rain is measured (in mm) from Whitehorse Auto (climate ID: 2101310) located 3 km from Whitehorse Airport, whereas snow on ground (in cm) and mean daily air temperature (∘C) are measured from the Environment Canada Airport weather station (YXY, climate ID: 2101300) (MSC, 2017) located ∼14 km northwest of Forest station at 706 m a.s.l. (b, d, f). Rainfall daily totals (in mm) were derived from hourly measurements, and snow water equivalent values (SWE; in mm) were based on 3 h measurements from a snow pillow beside Buckbrush weather station. Daily average air temperature (∘C) was derived from 30 min measurements.
3.2 Discharge
The 2015 and 2016 hydrographs for GC and the Wolf Creek outlet (WCO) exhibited patterns typical of northern watersheds but were distinct in that both years showed a late-season increase (Fig. 3), which is rare in the GC catchment and WCO historical record (Carey et al., 2013a, b; Rasouli et al., 2019). Summer flows were also greater than typically observed. For GC, while there was an early measurable stream response on 9 May 2015, freshet began on 14 May 2015 when flows increased from ∼0.02 m3 s−1 to daily flows averaging ∼0.5 m3 s−1 over 9 d. Peak 2015 daily discharge was 0.67 m3 s−1 on 22 May, whereafter flows began to decline to summer levels ∼0.2 m3 s−1. In response to ∼125 mm of rain between 17 August and 11 September, flows increased to ∼0.46 m3 s−1 on 14 September before gradually declining. Discharge at BB for 2015 and 2016 was of a slightly lower magnitude than at GC with delayed flow response to both freshet and summer rainfall. Data loss resulted in incomplete discharge data for both years at BB. Manual measurements are shown in Fig. 3 to supplement continuous measurements. Discharge at WCO followed a similar pattern to GC, rising from a winter baseflow of ∼0.4–0.5 m3 s−1 on 3 May to a peak freshet of 2.68 m3 s−1 on 24 May. As for GC, flows increased in September prior to the removal of the transducer on 1 October. Flows in 2016 were distinct at both GC and WCO when compared with 2015 and the historical record, exhibiting a more pronounced response to snowmelt than 2015 which occurred much earlier in the year in comparison to the 25-year record (Fig. 3). There was no distinct snowmelt freshet event in 2016; instead, a gradual increase in flows was punctuated with hydrograph rises that corresponded to both snowmelt and summer rainfall events. Flows were of the same general magnitude as those in 2015, and once again large late-season rainfalls (∼115 mm between 17 August and 10 September) resulted in high September flows, with peak discharge at WCO recorded at 3.9 m3 s−1 on 13 September. Flows declined again until the transducers were removed on 17 October, although they were very high compared with mid-season flows.

Figure 3Historical flow at WCO with 2015–2016 flows superimposed. The grey area represents the inter-quartile range of 1993–2013 data. The solid line represents 2015, and the dashed line represents 2016. The day of year (DOY) is shown along the x axis.
3.3 Dissolved organic carbon (DOC) concentrations
Sampling in 2015 was largely confined to GC and BB with more extensive sampling at other sites in 2016. For GC, similar patterns were observed in both years with over-winter and pre-freshet DOC concentrations below 1 mg L−1; these concentrations rose to ∼10 mg L−1 on the rising limb of the first snowmelt flush, followed by a rapid decline to levels between 1 and 2 mg L−1 throughout the summer, before a slight rise in the fall. Seasonal statistics for DOC are presented in Table 1. In 2015, the single freshet event corresponded to a rise in DOC; however, the rise and fall in the DOC concentration occurred during the rising limb of the freshet hydrograph between 7 and 29 May. The maximum DOC concentration of 9.8 mg L−1 on 15 May corresponded to a 13.8 mm rainfall event atop a sporadic snowpack with largely frozen soils. After June, DOC concentrations continued to decline with slight increases corresponding to rainfall events. Towards the end of the measurement period in 2015, DOC concentrations rose to a maximum of 3.6 mg L−1 with increasing discharge in response to sustained precipitation. Over-winter values in December and January declined to ∼1 mg L−1. This pattern of DOC behaviour was remarkably similar to that at the adjacent BB catchment which had more limited sampling. In 2016, the spring rise in DOC at GC and BB corresponded to the period immediately after the first small snowmelt pulse but prior to the bulk of the freshet signal (Fig. 3). Concentrations again rose to ∼11 mg L−1 with a steep recession to summer levels when rainstorms would occasionally increase concentrations above 2 mg L−1. As in 2015, a wet late season with a large hydrograph increase resulted in increased DOC concentrations near 3 mg L−1, although concentrations were much lower than for corresponding freshet flows.
Sampling at WCO began in late fall 2015 with DOC concentrations of ∼2 mg L−1 and remained near this level through April 2016. Concentrations increased during the early phases of open water freshet, although they only rose to ∼5 mg L−1 on 26 April and then declined to summer levels of between 2 and 3 mg L−1, with some variability related to rainfall events. While sampling was limited, there did not appear to be a notable increase at WCO during the wet fall in 2016. At W1, DOC was ∼16 mg L−1 on the first sampling date of 27 April, whereas post-freshet samples in June through September had concentrations between 7 and 9 mg L−1. Concurrent DOC and fluorescence samples were only collected from CL post-freshet during the summer and fall of 2017.
3.4 DOC loads
Export estimates for the 6 years of available data from GC ranged from 0.29 to 1.48 g C m−2 during spring (15 April to 14 June), from 0.08 to 0.31 g C m−2 during summer (15 June to 14 August) and from 0.28 to 0.20 g C m−2 during fall in 2015 and 2016 respectively (Table 2). No estimates were made for fall in 2002, 2003, 2006 or 2008 due to a lack of concentration data. Spring DOC export was lowest during 2003 (0.42 g C m−2) and 2016 (0.29 g C m−2), which were the 2 years characterized by a staggered snowmelt that led to relatively low discharge during peak DOC concentrations (Fig. 4a, b, c; Fig. 4 in Carey et al., 2013a). Total export during summer was relatively consistent across 2002, 2003, 2006 and 2015 with respective values of 0.12, 0.19, 0.14 and 0.08 g C m−2, whereas it was appreciably higher in 2008 and 2016 with values of 0.31 and 0.28 g C m−2 respectively. Fall DOC export estimates for 2015 and 2016 were 0.28 and 0.20 g C m−2 respectively. DOC export estimates for WCO in 2016 were 0.06 g C m−2 in spring, 0.09 g C m−2 in summer and 0.09 g C m−2 in fall (Table 2).
Table 2Load estimates for GC and WCO for 6 years by individual season, spring and summer, and all relevant seasons combined (spring, summer and fall).
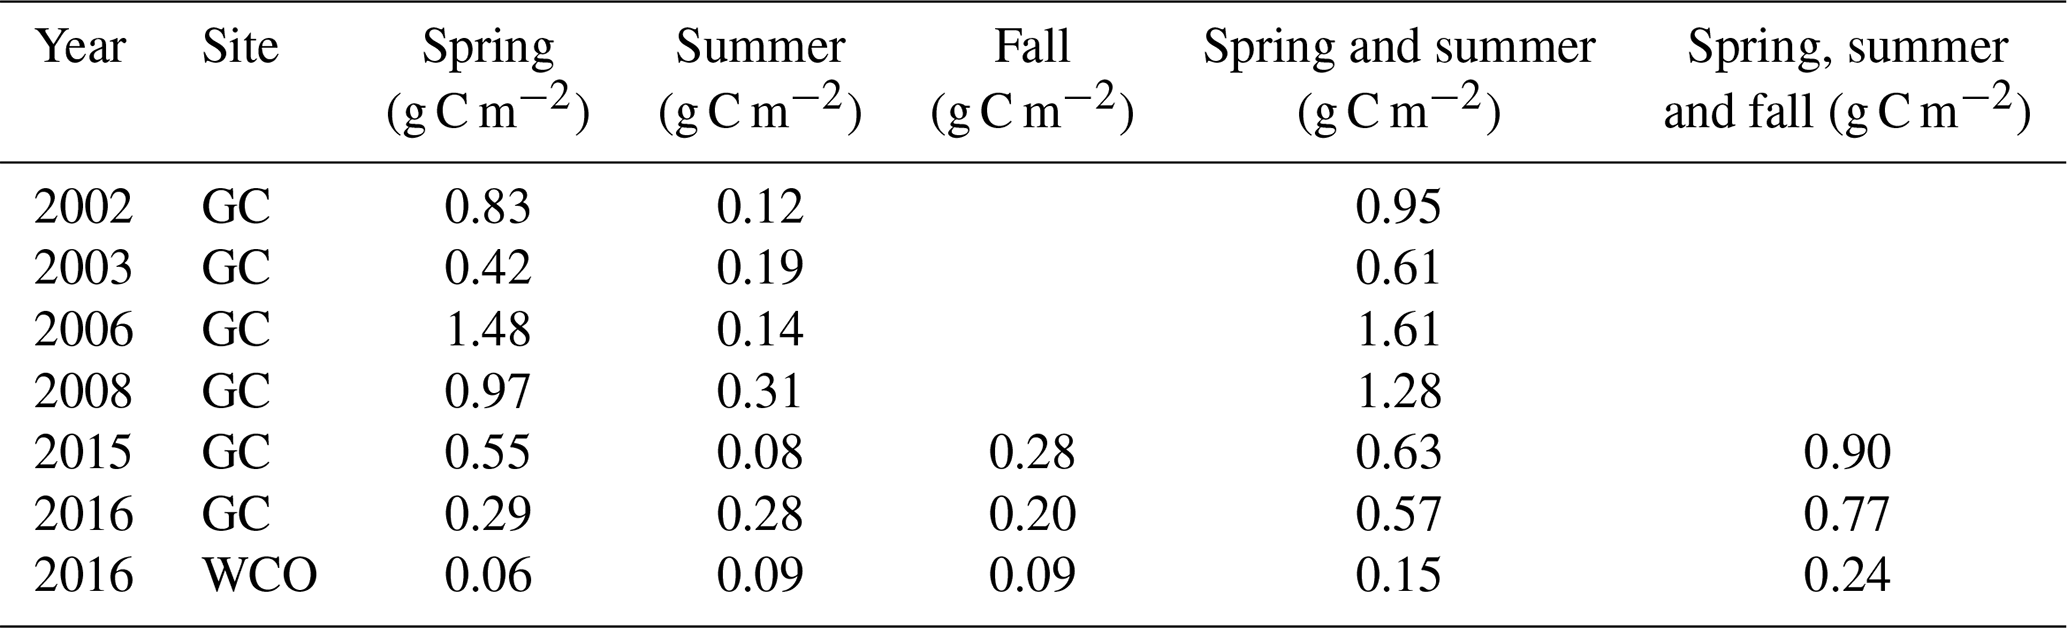
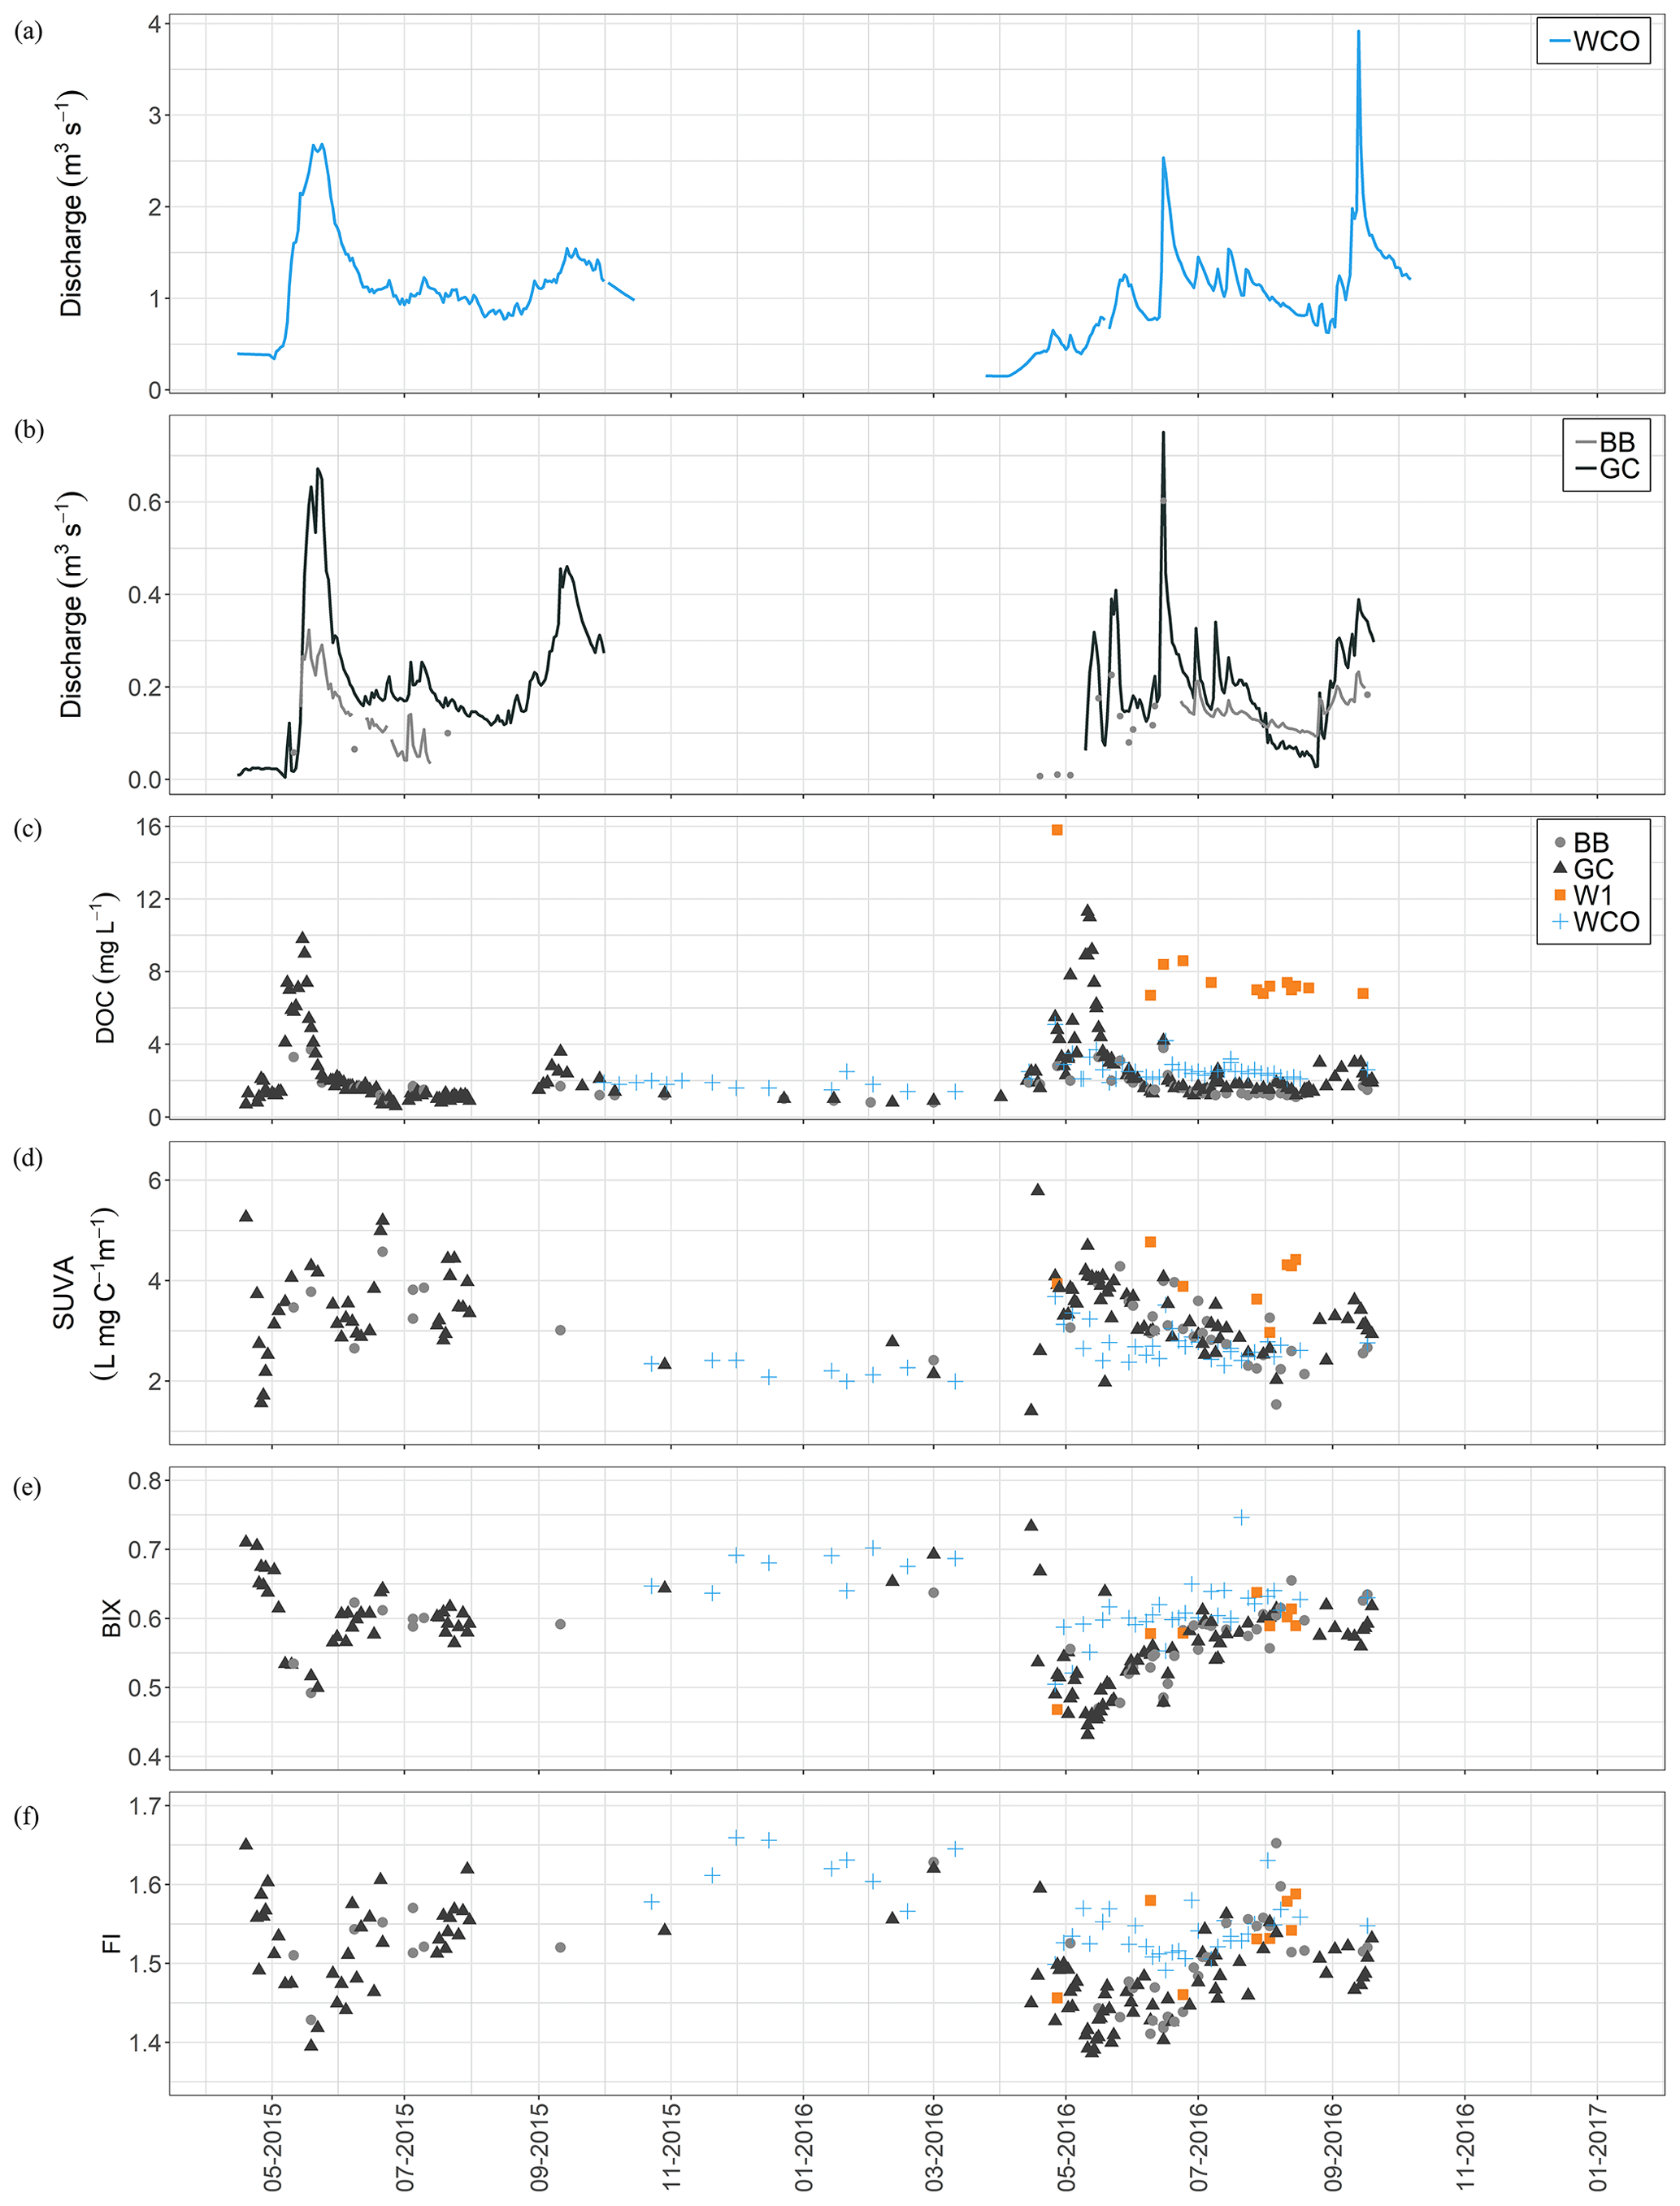
Figure 4Flow, DOC and optical indices for WCRB study sites. (a) Daily discharge data from WCO are shown from April 2015 to October 2016. (b) Daily discharge data from GC (dark grey) and BB (light grey). (c) DOC concentrations (in mg L−1) from grab samples over the study period showing BB (light grey, circle), GC (dark grey, triangle), W1 (orange, square) and WCO (light blue, +).
3.5 Optical indices
While a large number of optical indices exist in the literature (see Hansen et al., 2016), in this work we report the widely utilized SUVA254, biological index (BIX) and fluorescence index (FI) to help infer the source and composition of DOM (Table 1).
For GC, SUVA254 exhibited considerable variability compared with DOC concentrations. In 2015, SUVA254 rapidly declined from >5 to ∼1 L mg C−1 m−1 between 19 and 26 April in response to a loss of channel ice; it then rose to reach a local maximum of ∼4.1 L mg C−1 m−1 on 10 May, which corresponds to the annual peak in stream discharge. SUVA254 then declined again on the receding freshet limb and increased markedly in June in response to 18 mm of rain (11 to 18 June), whereupon it ranged between 2.8 and 4.5 L mg C−1 m−1. Limited under-ice sampling suggests that SUVA254 remained relatively consistent between 2 and 3 L mg C−1 m−1 before falling to 1 L mg C−1 m−1 prior to the onset of freshet. At the onset of freshet the values rose dramatically to 5.2 L mg C−1 m−1 before gradually declining through August with considerable variability. Following the wet fall in 2016, SUVA254 began to rise to values >3 L mg C−1 m−1. Patterns of SUVA254 for BB were similar to those for GC in both years. SUVA254 started low in spring 2015 at the headwater catchments before rising slightly in summer, whereas the opposite occurred in 2016. For WCO, samples over the 2015–2016 winter declined slightly from 2.5 to 2 L mg C−1 m−1, increased during freshet to ∼3.7 L mg C−1 m−1 and then gradually declined to ∼2.5 L mg C−1 m−1 with some increases associated with rising discharge. SUVA254 at W1 was higher on average than at other sites, although limited sampling makes the presence of any temporal pattern uncertain.
BIX tended to be inversely related to discharge (and DOC concentration) during freshet at the headwater sites (GC and BB; Fig. 4). For GC in 2015, BIX fell from just above 0.7 to 0.49 during peak freshet and then increased to between 0.55 and 0.65 during summer. Values increased over winter to a maximum of 0.71 prior to the 2016 freshet, where a steep decline to values <0.45 occurred during the early phase of runoff in May and then gradually returned to values between 0.55 and 0.65 with declines associated with rainfall-driven spikes in the hydrograph. The late-season increase in discharge did not strongly influence BIX at GC. BIX exhibited similar patterns between 2015 and 2016 at the headwater sites: minimum values during spring in both years followed by an increase that plateaued in summer 2015 but continued to rise slightly during the 2016 summer. BIX for WCO increased over winter before also declining during early melt in 2016; it then rose to values ∼0.65 with some large increases (as opposed to decreases at GC) during storm events. Timing of declines with respect to rainfall events was slightly offset between the headwater sites and the outlet WCO. At W1, BIX values increased slightly throughout the sampling period in 2016 (Fig. 4).
FI at GC and BB exhibited patterns similar to BIX but the inverse of that seen for SUVA254 (Fig. 4). In 2015, FI declined from 1.65 to 1.4 as DOC rose on the rising freshet limb and then declined to values between 1.5 and 1.6 during summer. In 2016, FI values again declined from 1.6 to 1.0 during freshet and were lower on average than those seen for 2015; however, FI values also gradually increased throughout summer in 2016 with a small decline during the wet late summer. For WCO, winter FI ranged between 1.55 and 1.65 and more gradually declined during freshet to ∼1.5, before increasing slightly with more limited variability throughout the summer. A small decline during the wet period in late September was observed. Over the 2 study years at GC, BB and WCO, mean FI was lowest during spring, and higher in summer (2015, 2016) than in fall 2016. For W1, FI was low at 1.45 on the first sampling date in spring 2016 when DOC was high, and then increased with some variability; however, FI values were higher on average at W1 than those at GC and BB.
3.6 Principal component analysis
A principal component analysis (PCA) using 216 samples from across WCRB over 3 years was completed to explore landscape and seasonal climate controls on DOC concentration and quality (Fig. 4). DOC concentrations and fluorescence indices at BB (2015–2017), CL (2017), GC (2015–2017), W1 (2016–2017) and WCO (2015–2017) were introduced into the PCA to gain insight into how landscape type influences DOM quality at WCO (Table S1). The first principal component (PC1) explained 56.8 % of the variance in the data and was selected based on scree-plot analysis, a drop in the proportion of variance explained and the Kaiser criterion (Kaiser and Rice, 1974). The remaining principal components (PCs) explained much less of the variance than PC1 (Table S3). PC1 predominantly represents the relationship between DOM quality and concentration and is positively and negatively correlated with all DOM fluorescence indices except for HIX. PC2 explained 15.8 % of the variance and was most closely related to a single variable (HIX) with little relationship to the other analytes (Fig. 4). Further PCs were not explored (see Supplement for more details).
BB and GC plotted similarly and are shown together (Fig. 5) to highlight differences between the landscape types rather than between the two headwater sites. DOC concentrations and SUVA254, BIX/freshness and HIX most strongly distinguish the samples in the PCA. Spring samples from the headwaters and wetland mostly plot to the right along PC1 due to high DOC concentrations and SUVA254 measured during that time period. Headwater samples span almost the entire PC1 axis due to the high variability in spring-time DOC and streamflow. Fall/winter samples are predominantly located left of the zero-line (Fig. 5) for all sites. All CL samples cluster together. Some separation of the DOC concentrations and the DOM indices is shown due to high DOC, BIX and/or SUVA254 values (Fig. 6).

Figure 5Biplot from PCA. PC1 is shown on the x axis, and PC2 is shown along the y axis. X indicates the point of the loadings with the applicable index written nearby. Samples are grouped by season: triangles represent spring (15 April–15 June), squares indicate summer (16 June–15 August) and circles represent fall/winter (16 August–14 April). Samples are also grouped by landscape type: bright blue represents mesoscale outlet (WCO), dark blue represents lake (CL), orange represents Wetland 1 (W1) and grey represents headwaters (light grey – BB and dark grey – GC).
4.1 DOC quantity and timing in streams
The most distinct feature of organic carbon export in some northern watersheds is the sudden increase in the DOC concentration on the rising limb of the freshet hydrograph as the baseflow-driven system switches to near-surface flow paths in organic-rich soils (Striegl et al., 2005; Raymond et al., 2007; Holmes et al., 2012). This is particularly well resolved in headwater catchments where there is limited mixing of signals and sources (Ågren et al., 2007). For GC, DOC concentrations have now been observed over freshet for 6 years (Fig. 7). There is a considerable variability in the freshet timing and volume as some years show a single, rapid event (e.g. 2015) while others have a staggered response in relation to multiple spring warming events (e.g. 2003, 2016). Regardless of freshet timing and volume, DOC concentrations always rise in response to the first onset of flows and are insensitive to the volume of water exported during freshet. While there are notable contrasts in both 2015 and 2016 freshets, in both cases, the initial DOC response to flows is similar (Fig. 4), and agrees with those reported in earlier years (Carey et al., 2013a). The implication of these historical and recent observations is that while DOC exported during spring is hydrologically mediated via the transport pathways, DOC concentrations are not related to flow volumes at the headwater scale. Although investigation into headwaters is relatively rare (Bishop et al., 2008), studies have reported greater variation in DOC at the headwater scale than in large rivers (Sedell and Dahm, 1990; Wolock et al., 1997; Temnerud and Bishop, 2005; Temnerud et al., 2010; Creed et al., 2015). Relatively small amounts of water are sufficient to extinguish the available pool of organic matter (OM) responsible for the DOC peak concentration in the spring at this headwater catchment. For GC, estimates of DOC export between 15 April and 14 June over the 6 years range between 0.29 and 1.48 g C m−2 with 2015 and 2016 on the lower end (Table 2).

Figure 6Regressions of principal components to DOC concentrations and DOM indices. Regression of PC1 to DOC concentrations implies some non-linear behaviour. Samples are grouped by season: triangles represent spring (15 April–15 June), squares represent summer (16 June–15 August) and circles represent fall/winter (16 August–14 April). Samples are also grouped by landscape type: bright blue refers to mesoscale outlet (WCO), dark blue represents lake (CL), orange represents Wetland 1 (W1) and grey represents headwaters (light grey – BB and dark grey – GC).
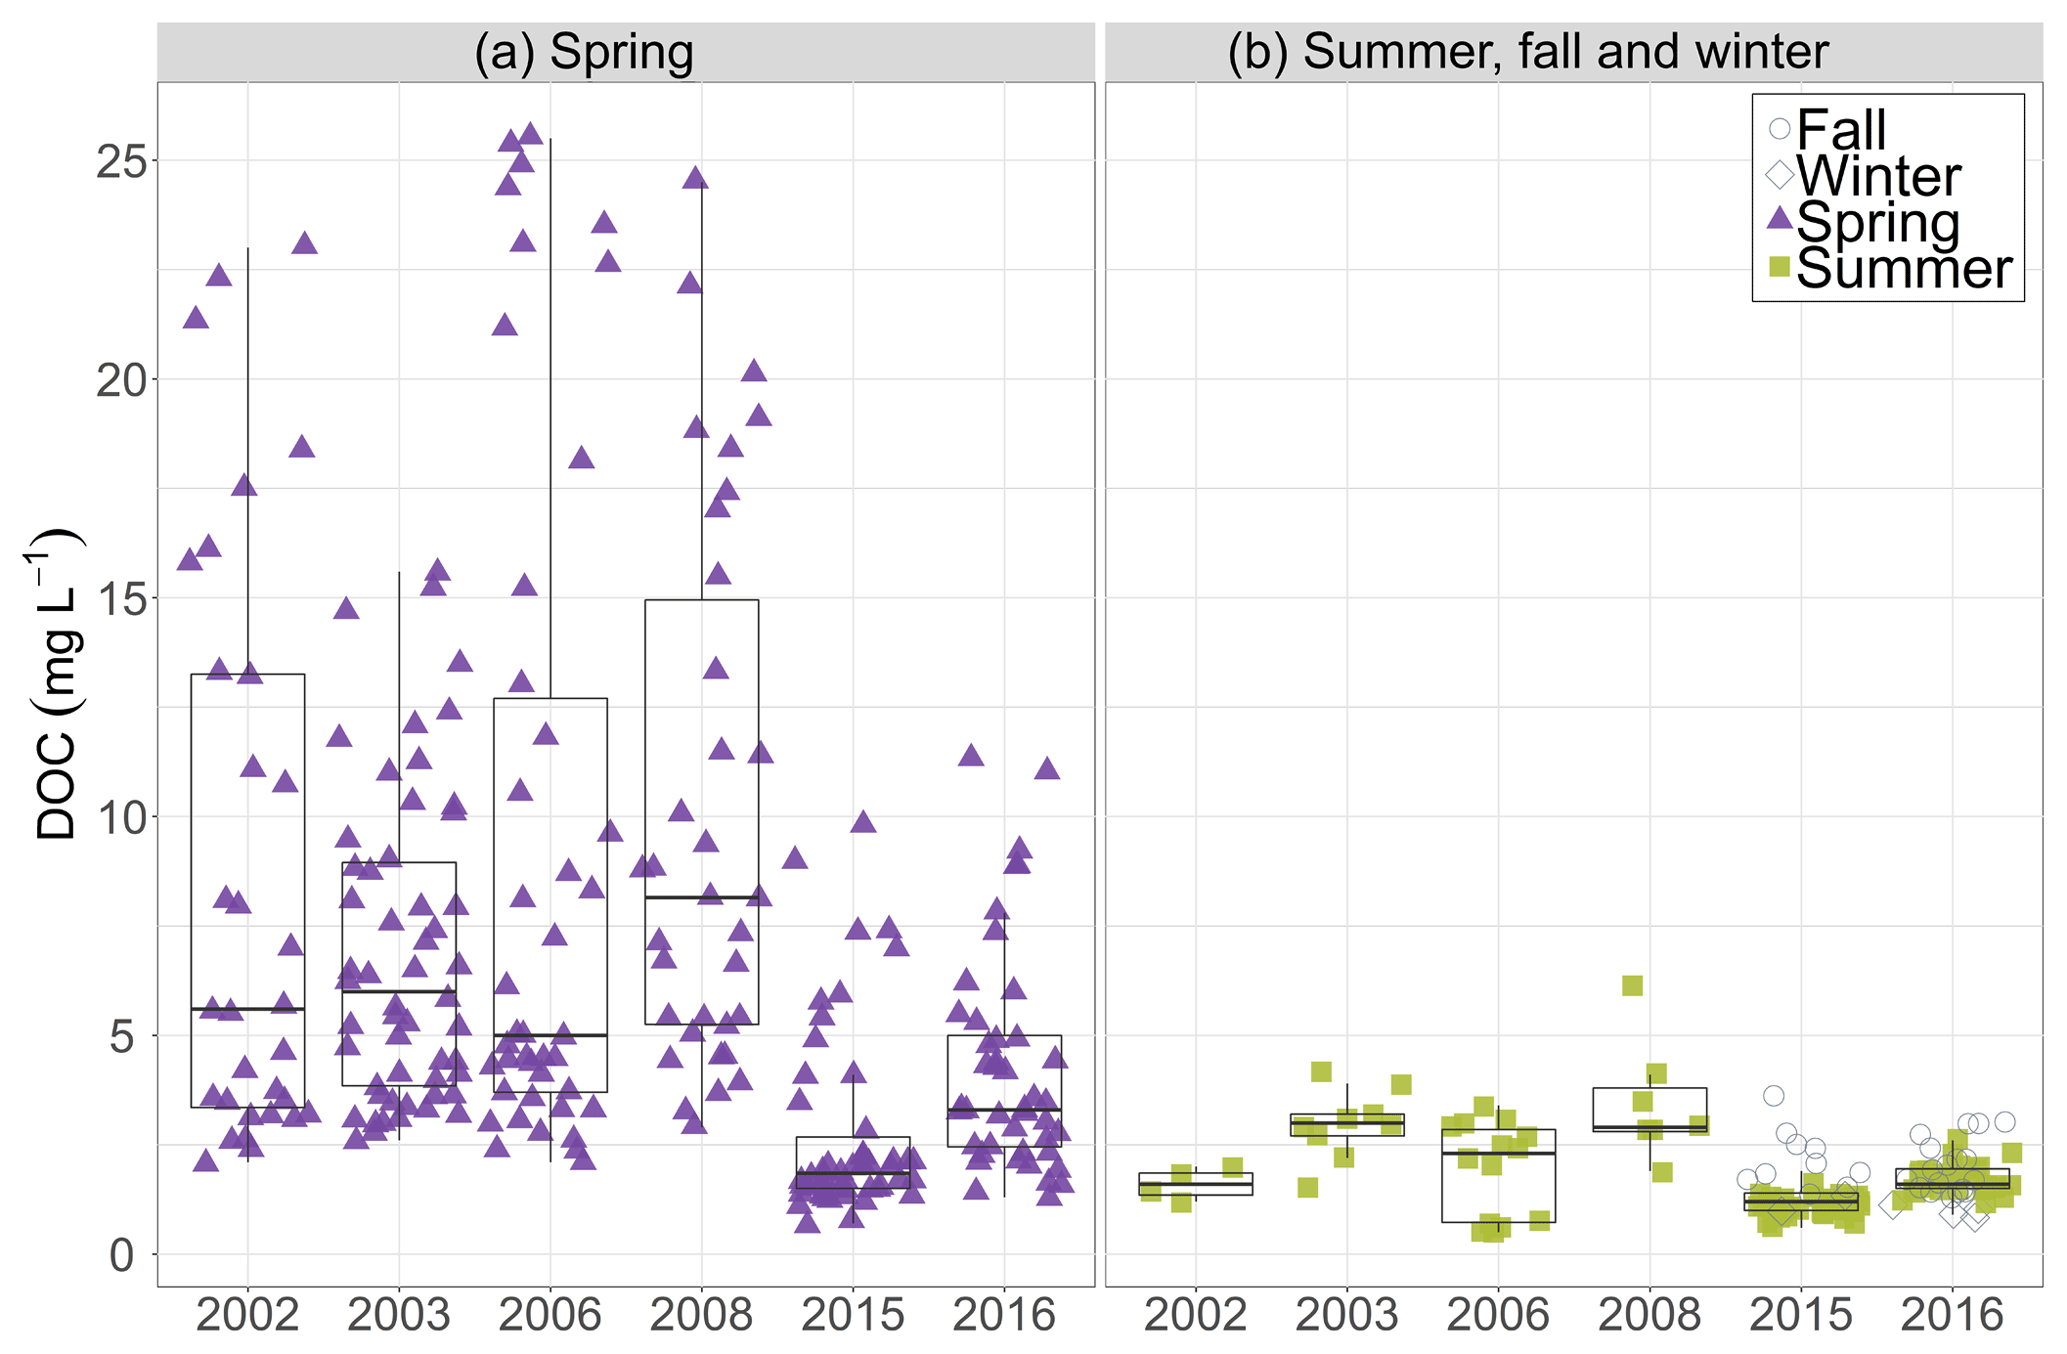
Figure 7DOC concentration (in mg L−1) is displayed on the y axis with panel (a) showing the DOC concentrations measured in 2002, 2003, 2006, 2008, 2015 and 2016 during spring (April 15 to June 14). Panel (b) displays DOC concentrations for the same years during summer (16 June to 15 August), fall (16 August to 15 October) and winter (16 October to 14 April). Season is additionally indicated by shape and colour (purple/filled triangle – spring; light green/filled square – summer; open circle – fall; open diamond – winter).
In the years that had multiple spring warming events (2003 and 2016), loads were typically smaller as DOC concentrations had declined ahead of larger runoff volumes. For WCO, the pattern of DOC concentrations during freshet was similar to GC, although it was dampened by lower values during freshet over a longer period from mixing of various landscapes that integrate three distinct ecosystems and a small lake over a large elevation range. From an export perspective, springtime area-normalized loads were much smaller at WCO, suggesting that headwater ecosystems such as GC are where the bulk of the DOC is sourced during freshet.
Following freshet, DOC concentrations were remarkably consistent across the sampling sites. The headwater GC and BB values were ∼1.5 mg L−1 whereas those at WCO were typically 2–3 mg L−1, suggesting that additional sources such as wetlands and Coal Lake contributed slightly to downstream increases in the DOC concentration during the summer months. There were small increases in the DOC concentrations associated with rainfall events in summer. A notable feature of both 2015 and 2016 was the substantial late season rains that generated flows outside the typical range at both GC and WCO (Fig. 3). Despite these large flows, DOC concentrations did not rise to the levels observed during freshet, and the effect on the DOC export varied between years (Table 2). In 2015, freshet was typical of prior observations with a large increase in both discharge and DOC concentrations with 1.9 times the DOC exported compared with fall. While DOC concentrations peaked in spring at both GC and WCO in 2016, export remained similar across all seasons. In both years, DOC export was consistent or approached half of the spring export suggesting either alternate runoff pathways/flow generation mechanisms or a reduced source of soluble OM in soils available for transport. Considering water tables were very high during this period, we presume that the available pool of OM in shallow organic layers was more depleted than in spring, yielding less terrestrially derived, aromatic DOM (Mutschlecner et al., 2018).
Unlike results elsewhere (Petrone et al., 2006, 2007; Raymond et al., 2007; Striegl et al., 2007; Balcarczyk et al., 2009; Prokushkin et al., 2011; Holmes et al., 2012), there is no robust relationship between discharge and DOC over multiple years or within single years, suggesting that for this environment and at the headwater scale, discharge is a poor predictor of DOC export on an annual basis in the GC catchment (Table S2). However, on a seasonal basis, the relationship between DOC and discharge was at times stronger during summer, fall and winter when concentrations and discharge were relatively low (Table S2, Fig. 8).

Figure 8Concentration–discharge (C–Q) plots of the DOC concentration, SUVA, FI and HIX for GC (2015–2016) and WCO (2016). Panels (a), (b), (c) and (d) show the DOC concentration, SUVA254, FI and HIX optical indices in relation to discharge for 2015 and 2016 at Granger Creek (GC). Panels (e), (f), (g) and (h) show the same sets of concentration–discharge relationships for 2016 at Wolf Creek outlet (WCO). Season is indicated by shape and colour (purple/filled triangle – spring; green/filled square – summer; open circle – fall; open diamond – winter). The y axis values differ for each plot.
The lack of robust relationships between flow and DOC concentration over time is not surprising given the complex interaction of transport pathways and available organic carbon as the season progresses (Table S2). The highly dynamic nature of freshet complicates C–Q patterns when concentration and export is greatest (see Sect. 4.3), whereas later in the year as thaw increases and subsurface pathways contribute more, weaker (yet more significant) relations exist. We caution the use of regression equations relating DOC and flow to predict DOC loads, at least on an annual basis. However, for larger streams such as WCO, this approach may be more tractable due to mixing of sources and process integration (Buffam et al., 2007; Creed et al., 2015; Peralta-Tapia et al., 2015a).
A curious result was a notable decline in freshet DOC concentrations between the 4 years in the 2000s (Carey et al., 2013a) and the 2015–2016 study years (Fig. 7). In each of the early years, peak DOC concentrations ranged between 17 and 27 mg L−1 (0.42 to 1.48 g C m−2 exported) with overall higher concentrations during freshet, whereas the maximum DOC values for GC were 9.5 and 11.3 mg L−1 (0.55 and 0.29 g C m−2 exported) in 2015 and 2016 respectively. The reason for this decline is uncertain, although it is not related to freshet conditions as flows and climate during freshet were similar among certain years. We have also largely ruled out instrumentation or sampling as a source of this difference as mid-season values were unchanged. Using 23 years of data from the Krycklan research catchment in central Sweden, Tiwari et al. (2018) suggest that peak DOC concentrations are most closely related to warm fall temperatures, cold winter conditions and shallow snowpacks. In addition, Ågren et al. (2010) used 15 years of data from boreal catchments also located in the Krycklan research catchment to show that the high export of DOC in the snow-free season led to decreased export in the subsequent year. For 6 years of data at GC catchment, winter (November–March) temperatures show a weak relationship with DOC export, in that warmer winters tend to have lower DOC export during the following spring, which is supported by Scandinavian research (Ågren et al., 2010; Haei et al., 2010). However, there was no relation between snow depth and peak DOC concentration for the 6 years (data not shown; snow data available in Rasouli et al., 2019). A final possibility may be that the increased summer and fall wetness which has occurred in recent years is reducing decomposition, as outlined by Balcarcyzk et al. (2009).
4.2 DOM indices in streams
Optical indices are closely aligned with seasonal hydrological patterns in northern rivers across scales (Neff et al., 2006; Striegl et al., 2007; Spencer et al., 2008; Holmes et al., 2012). An expanding knowledge base linking optical indices with OM sources and biodegradability (Balcarczyk et al., 2009; Kellerman et al., 2018) and catchment processes exists with observations from both temperate and northern study sites. A number of widely used indices (reviewed in Hansen et al., 2016) facilitate comparison among sites, such as the comparison of chemometric components via the ever-expanding library OpenFluor (http://www.openfluor.org, last access: August 2019). We applied the commonly used drEEM toolkit (Murphy et al., 2013) to our dataset, although we were unable to validate the model using a split-half approach to the dataset. However, the overall relationship between chromophoric or coloured dissolved organic matter (CDOM) and DOC is robust in WCRB (Fig. S1), as observed in other rivers (Stedmon et al., 2011; Spencer et al., 2012; Frey et al., 2016), with a strong relationship between A254 and DOC (r2 = 0.97, p<0.001).
The predominant signals in the DOM indices observed in WCRB streams correspond well with those reported in the literature for northern and permafrost basins (Walker et al., 2013; Cory et al., 2014), and support conceptual models of coupled runoff generation and DOM transport (Mu et al., 2017). At the onset of freshet and the rise in DOC, SUVA254 rises while both BIX and FI decline to annual minima. This freshet response is attributed to the mobilization of DOM derived from leaf litter and older terrestrial precursor material with high molecular weight and aromatic DOM (Wickland et al., 2012). This pattern is particularly clear at GC, where BIX and FI are closely correlated with each other and negatively correlated with SUVA254. At this time, near-surface pathways across frozen ground are the only mechanism to rapidly transport OM and water to the stream. Once DOC declines, SUVA254 decreases and FI and BIX begin to increase. A number of mechanisms can be attributed to these changes: an increase in microbial DOM as thaw depths increase and soil temperatures warm, and the increased ability of mineral soils to adsorb DOM with high organic weight and large aromatic structures along flow pathways (Ussiri and Johnson, 2004). The gradual change in the three fluorescence indices as summer progresses suggests a continual decline in high molecular weight, older DOM (lower SUVA254) and a greater proportion of recently produced DOM. During the unusually wet fall periods, rising water tables and the activation of near-surface and overland flow pathways resulted in increases in SUVA and declines in BIX and FI, although not to the same magnitude as spring when flows were of similar volume. The smaller influence of wet fall periods on changing DOM composition can be explained in part by a much wider range of flow pathways across deeply thawed soils and also considerable adsorption sites for DOM. In addition, sources of leaf decomposition compounds located in upper soil horizons leached in spring have less time to replenish prior to leaf-fall. As with the DOC concentration, the important implication is that seasonality, not flow magnitude, has a greater influence on the quality of DOM. By early November, temperatures throughout the WCRB are below freezing and a long winter recession occurs. Limited over-winter sampling at WCO and GC show SUVA254 values declining to their lowest values prior to freshet with a corresponding maximum in BIX and FI. This pattern corresponds to those reported elsewhere in the Yukon River basin and other watersheds in Alaska (Striegl et al., 2007; O'Donnell et al., 2010; Mutschlecner et al., 2018).
4.3 Patterns across space and time
Understanding the integration of biogeochemical signals across temporal and spatial scales is a fundamental challenge in diverse catchments such as the WCRB. The link between catchment processes and spatial scale to control coupled hydrological–biogeochemical processes has garnered considerable attention (Ågren et al., 2007; Buffam et al., 2007; Creed et al., 2015; Tiwari et al., 2017). While flow paths at the headwater catchments (GC and BB) are well documented (Quinton and Carey, 2008; Carey et al., 2013a), the dominant hydrological pathways at the scale of WCRB shift from the supra- and intra-permafrost pathways to a more groundwater-driven pathway. In addition, a ∼1 km2 lake in the centre of the basin has an important storage and mixing effect. The impact of these changes on the pattern of DOM indices at WCO is complex and not easily resolved back to component landscape types.
From the PCA, a host of controls act to influence DOC and fluorescence indices throughout WCRB (Figs. 5, 6). As scale increases, DOC concentrations increase during summer and low flows are more muted during freshet at the outlet compared with headwater streams in accordance with the river continuum concept (Creed et al., 2015). WCO was found to have lower SUVA254 values and greater BIX and FI compared with both headwater and wetland systems. The lower SUVA254 at WCO corresponds to an increasing dominance of groundwater or greater baseflow along with deeper subsurface pathways due to a lesser extent of frozen ground (Walvoord and Striegl, 2007; O'Donnell et al., 2010). In contrast, higher FI and BIX likely reflect the influence of these deeper flow pathways and any processes and production that occur in Coal Lake, which sits at the approximate mid-point of WCRB. Most FI values at the headwater catchments are between 1.4 and 1.6, reflecting terrestrial plants as the dominant source of DOM. By contrast, values in excess of 1.6 at WCO, particularly during winter and low flow periods, suggest some microbial DOM sources. The high values of BIX in winter at WCO support some moderate autotrophic production, although certainly not at the levels of many aquatic ecosystems (Kellerman et al., 2018).
Changes in DOC export as a result of climate change in permafrost regions are uncertain for aquatic ecosystems and in the overall carbon balance of northern regions (Striegl et al., 2005, 2007; Raymond et al., 2007; Frey and McClelland, 2009; Guo et al., 2012; Laudon et al., 2013; Kicklighter et al., 2013; Abbott et al., 2015; Johnston et al., 2018). The DOC concentration, optical properties and associated biodegradability change with source, residence time and processing, all of which vary with thaw depth (review by Kalbitz et al., 2000; Wickland et al., 2007). At the scale of WCRB and its sub-catchments, results from other research in permafrost regions not experiencing rapid thermokarst that suggest a gradual increase in biodegradability (Spencer et al., 2008; Mann et al., 2015) are not necessarily discernable. However, changes in the DOC concentrations and export are likely due to mineralization and adsorption within the soil profile as thaw increases and active layers expand (Striegl et al., 2007; Mu et al., 2017) with a warming climate. While most conceptual models have focussed on the implications of thaw and thermokarst on DOM (Mu et al., 2017), in this study we had the opportunity to evaluate the influence of increased late summer and fall precipitation, which is a notable feature in fall across much of subarctic Canada (Spence and Rausch, 2005; Spence et al., 2015; DeBeer et al., 2016). Despite late-season wetness and flow conditions similar to freshet in both years, which are anomalous in the WCRB record (Fig. 5), the change in the DOC concentration and DOM indices were small compared with changes observed during snowmelt. Large late-season rain events on deeply thawed soils did not transport the same volume of DOM as freshet despite high water tables due to a depleted DOM source and increased adsorption potential. FI and BIX were typically higher at the outlet than the headwater and wetland sites, which is attributed to lake influences and greater autotrophic production with increasing stream order.
While there was an increase in concentrations and a shift to heavier, more aromatic DOM during fall, values were still closer to those experienced during summer baseflow.
The implication is that changes in precipitation, particularly in summer, will have a limited influence on changing DOC export and quality compared with changes that result from emergent flow pathways, thermokarst or factors that influence values during freshet. From DOC concentrations that have been measured intermittently over the course of 15 years, we report a recent decline in freshet DOC concentrations at a headwater catchment, which is difficult to reconcile with permafrost thaw (which has not been observed or documented). Possible explanations are warmer winters and winter soils (Haei et al., 2010; Tiwari et al., 2017), or that the increase in fall wetness results in a decline in spring DOC concentrations through a second, albeit smaller, flushing event (similar to Ågren et al., 2010b).
This study reports patterns of DOC concentration and DOM quality derived from optical indices over several years in a subarctic alpine watershed where hydrological processes have been studied for approximately 2 decades. We show that DOC concentration and optical indices have a strong temporal variability associated with seasonality, and that A254 and CDOM were reliable proxies for DOC concentrations. Observations from nested watersheds with drainage areas of ∼6 to 179 km2 indicate that mixing and complex process interactions dampen variability in downstream responses and result in a gradual shift in DOM characteristics. Despite considerable fluctuations among years, DOC concentrations and export are consistently highest during freshet in spite of differences in the timing and magnitude of hydrological response during 6 years of coupled DOC and discharge measurements.
Optical indices also showed the largest variation during freshet and were relatively insensitive to flow volumes despite large differences in freshet between 2015 and 2016. At the headwater scale, DOM is less responsive to rainfall events in summer when the water table descends into deeper mineral soil layers.
Mobilization and transport mechanisms operating at the headwater scale are linked to stream hydrochemistry, while material inputs from different landscape types cause mixing and dilute DOM signals at increasing watershed scales.
Recent years have shown an increase in late fall streamflow that is uncommon in the long-term hydrometric record which is more often observed across northern watersheds. The DOC flux in recent years falls at the low end of the range reported a decade ago.
Other factors that have the capacity to influence the availability, movement and export of DOC and DOM are forecasted to change with rapid warming in this environment (DeBeer et al., 2016). Factors at play are a longer growing season, a shift in vegetation community composition and spatial extent, warmer winters, increased baseflow with greater groundwater input, earlier freshet or disruption of the typical northern hydrograph and an altered precipitation regime. Ultimately, the watershed scale and the arrangement of landscape types will play important roles in determining how DOC flux and DOM lability change under a warming climate, and altered precipitation, disturbance and vegetation regimes.
Streamflow datasets used for this study are available on the GWF/CCRN database (http://ccrnetwork.ca/outputs/data/, CCRN, 2019) as per the outlined data policy. For DOC/fluorescence, please contact the corresponding author as a data repository is currently being developed.
The supplement related to this article is available online at: https://doi.org/10.5194/hess-23-3571-2019-supplement.
Data (2015–2017) used for reporting and analysis were collected by NJS. SKC was the principal investigator (PI) on this CCRN project. Both authors were involved in the interpretation of the data and statistics. NJS prepared the paper, with contributions from SKC.
The authors declare that they have no conflict of interest.
This article is part of the special issue “Understanding and predicting Earth system and hydrological change in cold regions”. It is not associated with a conference.
Financial support for this project was provided by the Changing Cold Regions Network (CCRN) through the Natural Sciences and Engineering Research Council of Canada (NSERC). The authors would like to thank Renée Lemmond, Heather Bonn, Dave Barrett, Mike Treberg, Tyler Williams and Crystal Beaudry for help in the field from 2013 to 2017. We also thank Claire Oswald for help with preliminary Aqualog sample runs and analysis, Sean Leipe for verifying WCRB geospatial data to create an updated site map, and Supriya Singh for providing Spencer Creek DOC and optical data for filter method validation. Comments from two anonymous reviewers greatly improved the clarity and quality of the paper.
This research has been supported by the NSERC/CCRN (grant no. 433923-2012).
This paper was edited by Chris DeBeer and reviewed by two anonymous referees.
Abbott, B. W., Jones, J. B., Godsey, S. E., Larouche, J. R., and Bowden, W. B.: Patterns and persistence of hydrologic carbon and nutrient export from collapsing upland permafrost, J. Geophys. Res.-Biogeo., 12, 3725–3740, 2015.
Ågren, A., Buffam, I., Jansson, M., and Laudon, H.: Importance of seasonality and small streams for the landscape regulation of dissolved organic carbon export. J. Geophys. Res.-Biogeo., 112, G03003, https://doi.org/10.1029/2006JG000381, 2007.
Ågren, A., Haei, M., Kohler, S. J., Bishop, K., and Laudon, H.: Regulation of stream water dissolved organic carbon (DOC) concentrations during snowmelt: The role of discharge, winter climate and memory effects, J. Geophys. Res.-Biogeo., 7, 2901–2913, https://doi.org/10.5194/bg-7-2901-2010, 2010.
Bache, S. M. and Wickham, H.: magrittr: A Forward-Pipe Operator for R. R package version 1.5, available at: https://CRAN.R-project.org/package=magrittr (last access: 1 February 2019), 2014.
Balcarczyk, K. L., Jones, J. B., Jaffé, R., and Maie, N.: Stream dissolved organic matter bioavailability and composition in watersheds underlain with discontinuous permafrost, Biogeochemistry, 94, 255–270, 2009.
Bishop, K., Buffam, I., Erlandsson, M., Fölster, J., Laudon, H., Seibert, J., and Temnerud, J.: Aqua Incognita: the unknown headwaters, Hydrol. Process., 22, 1239–1242, 2008.
Boyer, E. W., Hornberger, G. M., Bencala, K. E., and McKnight, D. M.: Effects of asynchronous snowmelt on flushing of dissolved organic carbon: a mixing model approach, Hydrol. Process., 14, 3291–3308, 2000.
Bring, A., Fedorova, I., Dibike, Y., Hinzman, L., Mård, J., Mernild, S. H., Prowse, T., Semenova, O., and Woo, M. K.: Arctic terrestrial hydrology: A synthesis of processes, regional effects, and research challenges, J. Geophys. Res.-Biogeo., 121, 621–649, 2016.
Brooks, P. D. and Lemon, M. M.: Spatial variability in dissolved organic matter and inorganic nitrogen concentrations in a semiarid stream, San Pedro River, Arizona, J. Geophys. Res.-Biogeo., 112, G03S05, https://doi.org/10.1029/2006JG000262, 2007.
Buffam, I., Laudon, H., Temnerud, J., Mörth, C. M., and Bishop, K.: Landscape-scale variability of acidity and dissolved organic carbon during spring flood in a boreal stream network, J. Geophys. Res.-Biogeo., 112, G01022, https://doi.org/10.1029/2006JG000218, 2007.
Burd, K., Tank, S. E., Dion, N., Quinton, W. L., Spence, C., Tanentzap, A. J., and Olefeldt, D.: Seasonal shifts in export of DOC and nutrients from burned and unburned peatland-rich catchments, Northwest Territories, Canada, Hydrol. Earth Syst. Sci., 22, 4455–4472, https://doi.org/10.5194/hess-22-4455-2018, 2018.
Carey, S. K.: Dissolved organic carbon fluxes in a discontinuous permafrost subarctic alpine catchment, Permafrost Periglac., 14, 161–171, 2003.
Carey, S. K., Boucher, J. L., and Duarte, C. M.: Inferring groundwater contributions and pathways to streamflow during snowmelt over multiple years in a discontinuous permafrost subarctic environment (Yukon, Canada), Hydrogeol. J., 21, 67–77, 2013a.
Carey, S. K., Tetzlaff, D., Buttle, J., Laudon, H., McDonnell, J., McGuire, K., Seibert, J., Soulsby, C., and Shanley, J.: Use of color maps and wavelet coherence to discern seasonal and interannual climate influences on streamflow variability in northern catchments, Water Resour. Res., 49, 6194–6207, 2013b.
CCRN – Changing Cold Regions Network: Programmes Data, available at: http://ccrnetwork.ca/outputs/data/, last access: 19 January 2019.
Cory, R. M. and McKnight, D. M.: Fluorescence spectroscopy reveals ubiquitous presence of oxidized and reduced quinones in dissolved organic matter, Environ. Sci. Technol., 39, 8142–8149, 2005.
Cory, R. M., Ward, C. P., Crump, B. C., and Kling, G. W.: Sunlight controls water column processing of carbon in arctic fresh waters, Science, 345, 925–928, 2014.
Creed, I. F., McKnight, D. M., Pellerin, B. A., Green, M. B., Bergamaschi, B. A., Aiken, G. R., Burns, D. A., Findlay, S. E. G., Shanley, J. B., Striegl, R. G., Aulenbach, B. T., Clow, D. W., Laudon, H., McGlynn, B. L., McGuire, K. J., Smith, R. A., and Stackpoole, S. M.: The river as a chemostat: fresh perspectives on dissolved organic matter flowing down the river continuum, Can. J. Fish. Aquat. Sci., 72, 1272–1285, 2015.
Davidson, E. A. and Janssens, I. A.: Temperature sensitivity of soil carbon decomposition and feedbacks to climate change, Nature, 440, 165–173, 2006.
DeBeer, C. M., Wheater, H. S., Carey, S. K., and Chun, K. P.: Recent climatic, cryospheric, and hydrological changes over the interior of western Canada: a review and synthesis, Hydrol. Earth Syst. Sci., 20, 1573–1598, https://doi.org/10.5194/hess-20-1573-2016, 2016.
Dittmar, T. and Kattner, G.: The biogeochemistry of the river and shelf ecosystem of the Arctic Ocean: a review, Mar. Chem., 83, 103–120, 2003.
Dixon, R. K., Solomon, A. M., Brown, S., Houghton, R. A., Trexier, M. C., and Wisniewski, J.: Carbon pools and flux of global forest ecosystems, Science, 263, 185–190, 1994.
Fellman, J. B., Hood, E., and Spencer, R. G.: Fluorescence spectroscopy opens new windows into dissolved organic matter dynamics in freshwater ecosystems: A review, Limnol. Oceanogr., 55, 2452–2462, 2010.
Finlay, J., Neff, J., Zimov, S., Davydova, A., and Davydov, S.: Snowmelt dominance of dissolved organic carbon in high-latitude watersheds: Implications for characterization and flux of river DOC, Geophys. Res. Lett., 33, 10, 2006.
Finlay, J. C., Hood, J. M., Limm, M. P., Power, M. E., Schade, J. D., and Welter, J. R.: Light-mediated thresholds in stream-water nutrient composition in a river network, Ecology, 92, 140–150, https://doi.org/10.1890/09-2243.1, 2011.
Frey, K. E. and Smith, L. C.: Amplified carbon release from vast West Siberian peatlands by 2100, Geophys. Res. Lett., 32, L09401, https://doi.org/10.1029/2004GL022025, 2005.
Frey, K. E. and McClelland, J. W.: Impacts of permafrost degradation on arctic river biogeochemistry, Hydrol. Process., 23, 169–182, https://doi.org/10.1002/hyp.7196, 2009.
Frey, K. E., Sobczak, W. V., Mann, P. J., and Holmes, R. M.: Optical properties and bioavailability of dissolved organic matter along a flow-path continuum from soil pore waters to the Kolyma River mainstem, East Siberia, Biogeosciences, 13, 2279–2290, https://doi.org/10.5194/bg-13-2279-2016, 2016.
Gordeev, V. V., Martin, J. M., Sidorov, I. S., and Sidorova, M. V.: A reassessment of the Eurasian river input of water, sediment, major elements, and nutrients to the Arctic Ocean, Am. J. Sci., 296, 664–691, 1996.
Grolemund, G. and Wickham, H.: Dates and Times Made Easy with lubridate, J. Stat. Soft., 40, 1–25, 2011.
Guo, L., Cai, Y., Belzile, C., and Macdonald, R. W.: Sources and export fluxes of inorganic and organic carbon and nutrient species from the seasonally ice-covered Yukon River, Biogeochemistry, 107, 187–206, https://doi.org/10.1007/s10533-010-9545-z, 2012.
Haei, M., Öquist, M. G., Buffam, I., Ågren, A., Blomkvist, P., Bishop, K., Ottosson Löfvenius, M., and Laudon, H.: Cold winter soils enhance dissolved organic carbon concentrations in soil and stream water, Geophys. Res. Lett., 37, L08501, https://doi.org/10.1029/2010GL042821, 2010.
Hansen, A. M., Kraus, T. E., Pellerin, B. A., Fleck, J. A., Downing, B. D., and Bergamaschi, B. A.: Optical properties of dissolved organic matter (DOM): Effects of biological and photolytic degradation, Limnol. Oceanogr., 61, 1015–1032, 2016.
Harms, T. K., Edmonds, J. W., Genet, H., Creed, I. F., Aldred, D., Balser, A., and Jones, J. B.: Catchment influence on nitrate and dissolved organic matter in Alaskan streams across a latitudinal gradient, J. Geophys. Res.-Biogeo., 121, 350–369, 2016.
Herod, M. N., Li, T., Pellerin, A., Kieser, W. E., and Clark, I. D.: The seasonal fluctuations and accumulation of iodine-129 in relation to the hydrogeochemistry of the Wolf Creek Research Basin, a discontinuous permafrost watershed, Sci. Total Environ., 569, 1212–1223, 2016.
Holmes, R. M., McClelland, J. W., Raymond, P. A., Frazer, B. B., Peterson, B. J., and Stieglitz, M.: Lability of DOC transported by Alaskan rivers to the Arctic Ocean, Geophys. Res. Lett., 35, L03402, https://doi.org/10.1029/2007GL032837, 2008.
Holmes, R. M., McClelland, J. W., Peterson, B. J., Tank, S. E., Bulygina, E., Eglinton, T. I., Gordeev, V. V., Gurtovaya, T. Y., Raymond, P. A., Repeta, D. J., Staples, R., Striegl, R. G., Zhulidov, V., and Zimov, S. A.: Seasonal and annual fluxes of nutrients and organic matter from large rivers to the Arctic Ocean and surrounding seas, Estuaries Coasts, 35, 369–382, https://doi.org/10.1007/ s12237-011-9386-6, 2012.
Hudson, N., Baker, A., and Reynolds, D.: Fluorescence analysis of dissolved organic matter in natural, waste and polluted waters – a review, Riv. Res. Appl., 23, 631–649, https://doi.org/10.1002/rra.1005, 2007.
Hugelius, G., Strauss, J., Zubrzycki, S., Harden, J. W., Schuur, E. A. G., Ping, C.-L., Schirrmeister, L., Grosse, G., Michaelson, G. J., Koven, C. D., O'Donnell, J. A., Elberling, B., Mishra, U., Camill, P., Yu, Z., Palmtag, J., and Kuhry, P.: Estimated stocks of circumpolar permafrost carbon with quantified uncertainty ranges and identified data gaps, Biogeosciences, 11, 6573–6593, https://doi.org/10.5194/bg-11-6573-2014, 2014.
Huguet, A., Roux-De Balmann, H., and Parlanti, E.: Fluorescence spectroscopy applied to the optimisation of a desalting step by electrodialysis for the characterisation of marine organic matter, J. Membrane Biol., 326, 186–196, 2009.
Jaffé, R., McKnight, D., Maie, N., Cory, R., McDowell, W. H., and Campbell, J. L.: Spatial and temporal variations in DOM composition in ecosystems: The importance of long-term monitoring of optical properties, J. Geophys. Res.-Biogeo., 113, G04032, https://doi.org/10.1029/2008JG000683, 2008.
Johnston, S. E., Shorina, N., Bulygina, E., Vorobjeva, T., Chupakova, A., Klimov, S. I., Kellerman, A. M., Guillemette, F., Shiklomanov, A., Podgorski, D. C., and Spencer, R. G.: Flux and seasonality of dissolved organic matter from the Northern Dvina (Severnaya Dvina) River, Russia, J. Geophys. Res.-Biogeo., 123, 1041–1056, 2018.
Kaiser, H. F. and Rice, J.: Little jiffy, mark IV, Educ. Psychol. Meas., 34, 111–117, 1974.
Kalbitz, K., Solinger, S., Park, J. H., Michalzik, B., and Mtzner, E.: Controls on the dynamics of dissolved organic matter in soils: a review, Soil Sci., 165, 277–304, 2000.
Kassambara, A.: ggpubr: “ggplot2” Based Publication Ready Plots, R package version 0.1.7, available at: https://CRAN.R-project.org/package=ggpubr (last access: August 2019), 2018.
Kawahigashi, M., Kaiser, K., Kalbitz, K., Rodionov, A., and Guggenberger, G.: Dissolved organic matter in small streams along a gradient from discontinuous to continuous permafrost, Global Change Biol., 10, 1576–1586, 2004.
Kawahigashi, M., Kaiser, K., Rodionov, A., and Guggenberger, G.: Sorption of dissolved organic matter by mineral soils of the Siberian forest tundra, Global Change Biol., 12, 1868–1877, 2006.
Kellerman, A. M., Guillemette, F., Podgorski, D. C., Aiken, G. R., Butler, K. D., and Spencer, R. G.: Unifying concepts linking dissolved organic matter composition to persistence in aquatic ecosystems, Environ. Sci. Technol., 52, 2538–2548, 2018.
Kicklighter, D. W., Hayes, D. J., McClelland, J. W., Peterson, B. J., McGuire, A. D., and Melillo, J. M.: Insights and issues with simulating terrestrial DOC loading of Arctic river networks, Ecol. Appl., 23, 1817–1836, https://doi.org/10.1890/11-1050.1, 2013.
Koch, J. C., Runkel, R. L., Striegl, R., and McKnight, D. M.: Hydrologic controls on the transport and cycling of carbon and nitrogen in a boreal catchment underlain by continuous permafrost, J. Geophys. Res.-Biogeo., 118, 698–712, 2013.
Larouche, J. R., Abbott, B. W., Bowden, W. B., and Jones, J. B.: The role of watershed characteristics, permafrost thaw, and wildfire on dissolved organic carbon biodegradability and water chemistry in Arctic headwater streams, J. Geophys. Res.-Biogeo., 12, 4221–4233, 2015.
Laudon, H., Buttle, J., Carey, S. K., McDonnell, J., McGuire, K., Seibert, J., Shanley, J., Soulsby, C., and Tetzlaff, D.: Cross-regional prediction of long-term trajectory of stream water DOC response to climate change, Geophys. Res. Lett., 39, L18404, https://doi.org/10.1029/2012GL053033, 2012.
Laudon, H., Tetzlaff, D., Soulsby, C., Carey, S., Seibert, J., Buttle, J., Shanley, J., McDonnell, J. J., and McGuire, K.: Change in winter climate will affect dissolved organic carbon and water fluxes in mid-to-high latitude catchments, Hydrol. Process., 27, 700–709, 2013.
Lewkowicz, A. G. and Ednie, M.: Probability mapping of mountain permafrost using the BTS method, Wolf Creek, Yukon Territory, Canada, Permafrost Periglac., 15, 67–80, 2004.
Li Yung Lung, J. Y. S., Tank, S. E., Spence, C., Yang, D., Bonsal, B., McClelland, J. W., and Holmes, R.: Seasonal and Geographic Variation in Dissolved Organic Biogeochemistry of Rivers Draining to the Arctic Ocean and Hudson Bay, J. Geophys. Res.-Biogeo., 123, 3371–3386, 2018.
Littlefair, C. A., Tank, S. E., and Kokelj, S. V.: Retrogressive thaw slumps temper dissolved organic carbon delivery to streams of the Peel Plateau, NWT, Canada, J. Geophys. Res.-Biogeo., 14, 5487–5505, 2017.
MacLean, R., Oswood, M. W., Irons, J. G., and McDowell, W. H.: The effect of permafrost on stream biogeochemistry: a case study of two streams in the Alaskan (USA) taiga, Biogeochemistry, 47, 239–267, 1999.
Manizza, M., Follows, M. J., Dutkiewicz, S., McClelland, J. W., Menemenlis, D., Hill, C. N., Townsend-Small, A., and Peterson, B. J.: Modeling transport and fate of riverine dissolved organic carbon in the Arctic Ocean, Global Biogeochem. Cy., 23, GB4006, https://doi.org/10.1029/2008GB003396, 2009.
Mann, P. J., Eglinton, T. I., McIntyre, C. P., Zimov, N., Davydova, A., Vonk, J. E., Holmes, R. M., and Spencer, R. G. M.: Utilization of ancient permafrost carbon in headwaters of Arctic fluvial networks, Nat. Commun., 6, 7856, https://doi.org/10.1038/ncomms8856, 2015.
McCartney, S. E., Carey, S. K., and Pomeroy, J. W.: Intra-basin variability of snowmelt water balance calculations in a subarctic catchment, Hydrol. Process., 20, 1001–1016, https://doi.org/10.1002/hyp.6125, 2006.
McClelland, J. W., Stieglitz, M., Pan, F., Holmes, R. M., and Peterson, B. J.: Recent changes in nitrate and dissolved organic carbon export from the upper Kuparuk River, North Slope, Alaska, J. Geophys. Res.-Biogeo., 112, GB4006, https://doi.org/10.1029/2008GB003396, 2007.
McGuire, A. D., Anderson, L. G., Christensen, T. R., Dallimore, S., Guo, L., Hayes, D. J., Heimann, M., Loreenson, T. D., MacDonald, R. W., and Roulet, N.: Sensitivity of the carbon cycle in the Arctic to climate change, Ecol. Monogr., 79, 523–555, 2009.
McKnight, D. M., Boyer, E. W., Westerhoff, P. K., Doran, P. T., Kulbe, T., and Andersen, D. T.: Spectrofluorometric characterization of dissolved organic matter for indication of precursor organic material and aromaticity, Limnol. Oceanogr., 46, 38–48, https://doi.org/10.4319/lo.2001.46.1.0038, 2001.
MSC – Meteorological Service of Canada: National climate data archive of Canada, Environment Canada, Dorval, QB, 2017.
Mu, C. C., Abbott, B. W., Zhao, Q., Su, H., Wang, S. F., Wu, Q. B., Zhang, T. J., and Wu, X. D.: Permafrost collapse shifts alpine tundra to a carbon source but reduces N2O and CH4 release on the northern Qinghai-Tibetan Plateau, Geophys. Res. Lett., 44, 8945–8952, 2017.
Murphy, K. R., Stedmon, C. A., Graeber, D., and Bro, R.: Fluorescence spectroscopy and multi-way techniques PARAFAC, Anal. Methods, 5, 6557–6566, 2013.
Mutschlecner, A. E., Guerard, J. J., Jones, J. B., and Harms, T. K.: Regional and intra-annual stability of dissolved organic matter composition and biolability in high-latitude Alaskan rivers, Limnol. Oceanogr., 63, 1605–1621, https://doi.org/10.1002/lno.10795, 2018.
Nava, V., Patelli, M., Rotiroti, M., and Leoni, B.: An R package for estimating river compound load using different methods, Environ. Model. Softw., 117, 108, https://doi.org/10.1016/j.envsoft.2019.03.012, 2019.
Neff, J. C., Finlay, J. C., Zimov, S. A., Davydov, S. P., Carrasco, J. J., Schuur, E. A. G., and Davydova, A. I.: Seasonal changes in the age and structure of dissolved organic carbon in Siberian rivers and streams, Geophys. Res. Lett., 33, L23401, https://doi.org/10.1029/2006GL028222, 2006.
O'Donnell, J. A. and Jones, J. B.: Nitrogen retention in the riparian zone of catchments underlain by discontinuous permafrost, Freshwater Biol., 51, 854–864, 2006.
O'Donnell, J. A., Aiken, G. R., Kane, E. S., and Jones, J. B.: Source water controls on the character and origin of dissolved organic matter in streams of the Yukon River basin, Alaska, J. Geophys. Res.-Biogeo., 115, G03025, https://doi.org/10.1029/2009JG001153, 2010.
Ohno, T.: Fluorescence inner-filtering correction for determining the humification index of dissolved organic matter, Environ. Sci. Technol., 36, 742–746, 2002.
Olefeldt, D. and Roulet, N. T.: Permafrost conditions in peatlands regulate magnitude, timing, and chemical composition of catchment dissolved organic carbon export, Global Change Biol., 20, 3122–3136, 2014.
Olefeldt, D., Roulet, N., Giesler, R., and Persson, A.: Total waterborne carbon export and DOC composition from ten nested subarctic peatland catchments–importance of peatland cover, groundwater influence, and inter-annual variability of precipitation patterns, Hydrol. Process., 27, 2280–2294, 2013.
Opsahl, S., Benner, R., and Amon, R. W.: Major flux of terrigenous dissolved organic matter through the Artic Ocean, Limnol. Oceanogr., 44, 2017–2023, 1999.
Parlanti, E., Wörz, K., Geoffroy, L., and Lamotte, M.: Dissolved organic matter fluorescence spectroscopy as a tool to estimate biological activity in a coastal zone submitted to anthropogenic inputs, Org. Geochem., 31, 1765–1781, 2000.
Peralta-Tapia, A., Sponseller, R. A., Ågren, A., Tetzlaff, D., Soulsby, C., and Laudon, H.: Scale-dependent groundwater contributions influence patterns of winter baseflow stream chemistry in boreal catchments, J. Geophys. Res.-Biogeo., 120, 847–858, 2015.
Petrone, K., Buffam, I., and Laudon, H.: Hydrologic and biotic control of nitrogen export during snowmelt: a combined conservative and reactive tracer approach, Water Resour. Res., 43, W06420, https://doi.org/10.1029/2006WR005286, 2007.
Petrone, K. C., Jones, J. B., Hinzman, L. D., and Boone, R. D.: Seasonal export of carbon, nitrogen, and major solutes from Alaskan catchments with discontinuous permafrost, J. Geophys. Res., 111, G02020, https://doi.org/10.1029/2005JG000055, 2006.
Pomeroy, J. W., Hedstrom, N., and Parviainen, J.: The snow mass balance of Wolf Creek, Yukon: effects of snow sublimation and redistribution, Wolf Creek Research Basin: Hydrology, Ecology, Environment, edited by: Pomeroy, J. W. and Granger, R. J., National Water Research Institute, 15–30, available at: http://www.ccrnetwork.ca/news-events/news/2017/wolf-creek-25-years.php (last access: August 2019), 1999.
Prokushkin, A. S., Pokrovsky, O. S., Shirokova, L. S., Korets, M. A., Viers, J., Prokushkin, S. G., Amon, R. M. W., Guggenberger, G., and McDowell, W. H.: Sources and the flux pattern of dissolved carbon in rivers of the Yenisey basin draining the Central Siberian Plateau, Environ. Res. Lett., 6, 045212, https://doi.org/10.1088/1748-9326/6/4/045212, 2011.
Quinton, W. L. and Carey, S. K.: Towards an energy-based runoff generation theory for tundra landscapes, Hydrol. Process., 22, 4649–4653, 2008.
Rasouli, K., Pomeroy, J. W., Janowicz, J. R., Williams, T. J., and Carey, S. K.: A long-term hydrometeorological dataset (1993–2014) of a northern mountain basin: Wolf Creek Research Basin, Yukon Territory, Canada, Earth Syst. Sci. Data, 11, 89–100, https://doi.org/10.5194/essd-11-89-2019, 2019.
Raymond, P. A., McClelland, J. W., Holmes, R. M., Zhulidov, A. V., Mull, K., Peterson, B. J., Striegl, R. G., Aiken, G. R., and Gurtovaya, T. Y.: Flux and age of dissolved organic carbon exported to the Arctic Ocean: A carbon isotopic study of the five largest arctic rivers, Global Biogeochem. Cy., 21, GB4011, https://doi.org/10.1029/2007GB002934, 2007.
R Core Team: R: A language and environment for statistical computing, R Foundation for Statistical Computing, Vienna, Austria, available at: https://www.R-project.org/ (last access: 1 February 2019), 2017.
Schloerke, B., Crowley, J., Cook, D., Briatte, F., Marbach, M., Thoen, E., Elberg, A., and Larmarange, J.: GGally: Extension to “ggplot2”, R package version 1.4.0, available at: https://CRAN.R-project.org/package=GGally (last access: 1 February 2019), 2018.
Schmidt, B. H., Kalbitz, K., Braun, S., Fuß, R., McDowell, W. H., and Matzner, E.: Microbial immobilization and mineralization of dissolved organic nitrogen from forest floors, Soil Biol. Biochem., 43, 1742–1745, 2011.
Schuur, E. A. G., McGuire, A. D., Schädel, C., Grosse, G., Harden, J. W., Hayes, D. J., Hugelius, G., Koven, C. D., Kuhry, P., Lawrence, D. M., Natali, S. M., Olefeldt, D., Romanovsky, V. E., Schaefer, K., Turetsky, M. R., Treat, C. C., and Vonk, J. E.: Climate change and the permafrost carbon feedback, Nature, 520, 171–179, https://doi.org/10.1038/nature14338, 2015.
Sedell, J. R. and Dahm, C. N.: Spatial and temporal scales of dissolved organic carbon in streams and rivers, Organic acids in aquatic ecosystems, edited by: Perdue, E. M. and Gjessing, E. T., John Wiley & Sons Ltd, Berlin, Germany, 261–279, 1990.
Serreze, M. C. and Francis, J. A.: The Arctic amplification debate, Clim. Change, 76, 241–264, 2006.
Shiklomanov, I. A.: Appraisal and assessment of world water resources, Water Int., 25, 11–32, https://doi.org/10.1080/02508060008686794, 2000.
Spence, C. and Rausch, J.: Autumn synoptic conditions and rainfall in the subarctic Canadian Shield of the Northwest Territories, Canada, Int. J. Climatol., 25, 1493–1506, 2005.
Spence, C., Kokelj, S. V., Kokelj, S. A., McCluskie, M., and Hedstrom, N.: Evidence of a change in water chemistry in Canada's subarctic associated with enhanced winter streamflow, J. Geophys. Res.-Biogeo., 120, 113–127, 2015.
Spencer, R. G., Aiken, G. R., Butler, K. D., Dornblaser, M. M., Striegl, R. G., and Hernes, P. J.: Utilizing chromophoric dissolved organic matter measurements to derive export and reactivity of dissolved organic carbon exported to the Arctic Ocean: A case study of the Yukon River, Alaska, Geophys. Res. Lett., 36, https://doi.org/10.3389/feart.2015.00063, 2009.
Spencer, R. G., Butler, K. D., and Aiken, G. R.: Dissolved organic carbon and chromophoric dissolved organic matter properties of rivers in the USA, J. Geophys. Res.-Biogeo., 117, G03001, https://doi.org/10.1029/2011JG001928, 2012.
Spencer, R. G. M., Aiken, G. R., Wickland, K. P., Striegl, R. G., and Hernes, P. J.: Seasonal and spatial variability in dissolved organic matter quantity and composition from the Yukon River basin, Alaska: Yukon River basin DOM dynamics, Global Biogeochem. Cy., 22, GB4002, https://doi.org/10.1029/2008GB003231, 2008.
Stedmon, C. A., Amon, R. M. W., Rinehart, A. J., and Walker, S. A.: The supply and characteristics of colored dissolved organic matter (CDOM) in the Arctic Ocean: Pan Arctic trends and differences, Mar. Chem., 124, 108–118, 2011.
Striegl, R. G., Aiken, G. R., Dornblaser, M. M., Raymond, P. A., and Wickland, K. P.: A decrease in discharge-normalized DOC export by the Yukon River during summer through autumn, Geophys. Res. Lett., 32, L21413, https://doi.org/10.1029/2005GL024413, 2005.
Striegl, R. G., Dornblaser, M. M., Aiken, G. R., Wickland, K. P., and Raymond, P. A.: Carbon export and cycling by the Yukon, Tanana, and Porcupine Rivers, Alaska, 2001–2005, Water Resour. Res., 43, W02411, https://doi.org/10.1029/2006WR005201, 2007.
Tang, Y., Horikoshi, M., and Li, W.: ggfortify: Unified Interface to Visualize Statistical Result of Popular R Packages, The R Journal 8.2, 478–489, available at: https://CRAN.R-project.org/package=ggfortify (last access: 1 February 2019), 2016.
Tank, S. E., Striegl, R. G., McClelland, J. W., and Kokelj, S. V.: Multi-decadal increases in dissolved organic carbon and alkalinity flux from the Mackenzie drainage basin to the Arctic Ocean, Environ. Res. Lett., 11, 054015, https://doi.org/10.1088/1748-9326/11/5/054015, 2016.
Tarnocai, C., Canadell, J. G., Schuur, E. A. G., Kuhry, P., Mazhitova, G., and Zimov, S.: Soil organic carbon pools in the northern circumpolar permafrost region, Global Biogeochem. Cy., 23, GB2023, https://doi.org/10.1029/2008GB003327, 2009.
Temnerud, J. and Bishop, K.: Spatial variation of streamwater chemistry in two Swedish boreal catchments: Implications for environmental assessment, Environ. Sci. Technol., 39, 1463–1469, 2005.
Temnerud, J., Fölster, J., Buffam, I., Laudon, H., Erlandsson, M., and Bishop, K.: Can the distribution of headwater stream chemistry be predicted from downstream observations?, Hydrol. Process., 24, 2269–2276, 2010.
Tiwari, T., Laudon, H., Beven, K., and Ågren, A. M.: Downstream changes in DOC: Inferring contributions in the face of model uncertainties, Water Resour. Res., 50, 514–525, 2014.
Tiwari, T., Buffam, I., Sponseller, R. A., and Laudon, H.: Inferring scale-dependent processes influencing stream water biogeochemistry from headwater to sea, Limnol. Oceanogr., 62, S58–S70, https://doi.org/10.1002/lno.10738, 2017.
Tiwari, T., Sponseller, R. A., and Laudon, H.: Extreme Climate Effects on Dissolved Organic Carbon Concentrations During Snowmelt, J. Geophys. Res.-Biogeo., 123, 1277–1288, 2018.
Toohey, R. C., Herman-Mercer, N. M., Schuster, P. F., Mutter, E. A., and Koch, J. C.: Multidecadal increases in the Yukon River Basin of chemical fluxes as indicators of changing flowpaths, groundwater, and permafrost, Geophys. Res. Lett., 43, https://doi.org/10.1002/2016GL070817, 2016.
Ussiri, D. A. and Johnson, C. E.: Sorption of organic carbon fractions by Spodosol mineral horizons, Soil Sci. Soc. Am. J., 68, 253–262, 2004.
Vonk, J. E., Tank, S. E., Bowden, W. B., Laurion, I., Vincent, W. F., Alekseychik, P., Amyot, M., Billet, M. F., Canario, J., Cory, R. M., Deshpande, B. N., Helbig, M., Jammet, M., Karlsson, J., Larouche, MacMillan, G., Rautio, M., Walther Anthony, K. M., and Wickland, K. P.: Reviews and syntheses: Effects of permafrost thaw on Arctic aquatic ecosystems, J. Geophys. Res.-Biogeo., 12, 7129–7167, https://doi.org/10.5194/bg-12-7129-2015, 2015.
Walker, S. A., Amon, R. M., and Stedmon, C. A.: Variations in high-latitude riverine fluorescent dissolved organic matter: A comparison of large Arctic rivers, J. Geophys. Res.-Biogeo., 118, 1689–1702, 2013.
Walvoord, M. A. and Striegl, R. G.: Increased groundwater to stream discharge from permafrost thawing in the Yukon River basin: Potential impacts on lateral export of carbon and nitrogen, Geophys. Res. Lett., 34, L12402, https://doi.org/10.1029/2007GL030216, 2007.
Ward, C. P. and Cory, R. M.: Complete and partial photo-oxidation of dissolved organic matter draining permafrost soils, Environ. Sci. Technol., 50, 3545–3553, 2016.
Weishaar, J. L., Aiken, G. R., Bergamaschi, B. A., Fram, M. S., Fujii, R., and Mopper, K.: Evaluation of specific ultraviolet absorbance as an indicator of the chemical composition and reactivity of dissolved organic carbon, Environ. Sci. Technol., 37, 4702–4708, https://doi.org/10.1021/es030360x, 2003.
Wickham, H.: ggplot2: Elegant Graphics for Data Analysis, R package version 3.1.0.9000, available at: http://ggplot2.org (last access: 1 February 2019), 2016.
Wickham, H. and Henry, L.: tidyr: Easily Tidy Data with “spread()” and “gather()” Functions, R package version 0.8.1, available at: https://CRAN.R-project.org/package=tidyr (last access: 1 February 2019), 2018.
Wickham, H., François, R., Henry, L., and Müller, K.: dplyr: A Grammar of Data Manipulation, R package version 0.7.6, available at: https://CRAN.R-project.org/package=dplyr (last access: 1 February 2019), 2018.
Wickland, K. P., Neff, J. C., and Aiken, G. R.: Dissolved organic carbon in Alaskan boreal forest: sources, chemical characteristics, and biodegradability, Ecosystems, 10, 1323–1340, https://doi.org/10.1007/s10021-007-9101-4, 2007.
Wickland, K. P., Aiken, G. R., Butler, K., Dornblaser, M. M., Spencer, R. G. M., and Striegl, R. G.: Biodegradability of dissolved organic carbon in the Yukon River and its tributaries: Seasonality and importance of inorganic nitrogen, Global Biogeochem. Cy, 26, GB0E03, https://doi.org/10.1029/2012GB004342, 2012.
Wilson, H. F. and Xenopoulos, M. A.: Effects of agricultural land use on the composition of fluvial dissolved organic matter, Nat. Geosci., 2, 37–41, 2009.
Wolock, D. M., Fan, J., and Lawrence, G. B.: Effects of basin size on low-flow stream chemistry and subsurface contact time in the Neversink River watershed, New York, Hydrol. Process., 11, 1273–1286, 1997.
Wrona, F. J., Johansson, M., Culp, J. M., Jenkins, A., Mård, J., Myers-Smith, I. H., Prowse, D. T., Vincent, W. F., and Wookey, P. A.: Transitions in Arctic ecosystems: Ecological implications of a changing hydrological regime, J. Geophys. Res.-Biogeo., 121, 650–674, 2016.
Zsolnay, A., Baigar, E., Jimenez, M., Steinweg, B., and Saccomandi, F.: Differentiating with fluorescence spectroscopy the sources of dissolved organic matter in soils subjected to drying, Chemosphere, 38, 45–50, 1999.