the Creative Commons Attribution 4.0 License.
the Creative Commons Attribution 4.0 License.
 | 03 Sep 2019
Mapping the suitability of groundwater-dependent vegetation in a semi-arid Mediterranean area
Inês Gomes Marques
João Nascimento
Rita M. Cardoso
Filipe Miguéns
Maria Teresa Condesso de Melo
Pedro M. M. Soares
Célia M. Gouveia
Cathy Kurz Besson
Mapping the suitability of groundwater-dependent vegetation in semi-arid Mediterranean areas is fundamental for the sustainable management of groundwater resources and groundwater-dependent ecosystems (GDEs) under the risks of climate change scenarios. For the present study the distribution of deep-rooted woody species in southern Portugal was modeled using climatic, hydrological and topographic environmental variables. To do so, Quercus suber, Quercus ilex and Pinus pinea were used as proxy species to represent the groundwater-dependent vegetation (GDV). Model fitting was performed between the proxy species Kernel density and the selected environmental predictors using (1) a simple linear model and (2) a geographically weighted regression (GWR) to account for autocorrelation of the spatial data and residuals. When comparing the results of both models, the GWR modeling results showed improved goodness of fit as opposed to the simple linear model. Climatic indices were the main drivers of GDV density, followed by a much lower influence by groundwater depth, drainage density and slope. Groundwater depth did not appear to be as pertinent in the model as initially expected, accounting only for about 7 % of the total variation compared to 88 % for climate drivers.
The relative proportion of model predictor coefficients was used as weighting factors for multicriteria analysis to create a suitability map for the GDV in southern Portugal showing where the vegetation most likely relies on groundwater to cope with aridity. A validation of the resulting map was performed using independent data of the normalized difference water index (NDWI), a satellite-derived vegetation index. June, July and August of 2005 NDWI anomalies, for the years 1999–2009, were calculated to assess the response of active woody species in the region after an extreme drought. The results from the NDWI anomalies provided an overall good agreement with the suitability to host GDV. The model was considered to be reliable for predicting the distribution of the studied vegetation.
The methodology developed to map GDVs will allow for the prediction of the evolution of the distribution of GDV according to climate change and aid stakeholder decision-making concerning priority areas of water resource management.
- Article
(12918 KB) - Full-text XML
- BibTeX
- EndNote


Mediterranean forests, woodlands and shrublands, mostly growing under restricted water availability, are one of the terrestrial biomes with a higher volume of groundwater being used by vegetation (Evaristo and McDonnell, 2017). Future predictions of decreased precipitation (Giorgi and Lionello, 2008; Nadezhdina et al., 2015), decreased runoff (Mourato et al., 2015) and aquifer recharge (Ertürk et al., 2014; Stigter et al., 2014) in the Mediterranean region threaten the sustainability of groundwater reservoirs and the corresponding dependent ecosystems. Therefore, sustainable management of groundwater resources and the groundwater-dependent ecosystems (GDEs) is of crucial importance.
A widely used classification of the GDEs was proposed by Eamus et al. (2006). This classification distinguishes three types: (1) aquifer and cave ecosystems, which include all subterranean waters, (2) ecosystems reliant on emerging groundwater (e.g., estuarine systems and wetlands; riverine systems), and (3) ecosystems reliant on resident groundwater (e.g., systems where plants remain physiologically active during extended drought periods without a visible water source). Mapping GDEs constitutes a first and fundamental step to their active management. Several approaches have been proposed, from local field surveys measuring plant transpiration of stable isotopes (Antunes et al., 2018) up to larger spatial scales involving remote-sensing techniques (e.g., normalized difference vegetation index – NDVI; Barron et al., 2014; Eamus et al., 2015; Howard and Merrifield, 2010), remote-sensing combined with ground-based observations (Lv et al., 2013), a geographic information system (GIS; Pérez Hoyos et al.,, 2016a) combining field surveys (Condesso de Melo et al., 2015) or even statistical approaches (Pérez Hoyos et al., 2016b).
Despite a wide-ranging body of literature reviewing the GDE's topics (Doody et al., 2017; Dresel et al., 2010; Münch and Conrad, 2007), most regional-scale studies do not include Mediterranean regions. Moreover, studies on ecosystems relying on resident groundwater frequently only focused on riparian environments (Lowry and Loheide, 2010; O'Grady et al., 2006), with few examples in Mediterranean areas (del Castillo et al., 2016; Fernandes, 2013; Hernández-Santana et al., 2008; Mendes et al., 2016). There is a clear knowledge gap on the identification of phreatophyte species reliant on resident groundwater and their associated vegetation (Robinson, 1958) in the Mediterranean region and the management actions that should be taken to decrease the adverse effects of climate change.
In the driest regions of the Mediterranean Basin, the persistent lack of water during the entire summer periods gave an adaptive advantage to the vegetation that could either avoid or escape drought by reaching deeper-stored water up to the point of entirely relying on groundwater (Chaves et al., 2003; Canadell et al., 1996; Miller et al., 2010). This drought-avoiding strategy is often associated with the development of a dimorphic root system in woody species (Dinis, 2014; David et al., 2013) or with hydraulic lift and/or hydraulic redistribution mechanisms (Orellana et al., 2012). Those mechanisms provide the ability to move water from deep soil layers, where water content is higher, to more shallow layers where water content is lower (Horton and Hart, 1998; Neumann and Cardon, 2012). Hydraulic lift and redistribution have been reported for several woody species of the Mediterranean Basin (David et al., 2007; Filella and Peñuelas, 2004) and noticeably for cork oak (Quercus suber L.; David et al., 2013; Kurz-Besson et al., 2006; Mendes et al., 2016). Mediterranean cork oak woodlands (montados) are agro-silvo-pastoral systems considered to be semi-natural ecosystems of the southwestern Mediterranean Basin (Joffre et al., 1999) that have already been referenced as a groundwater-dependent terrestrial ecosystem (Mendes et al., 2016). Montados must be continually maintained through human management by thinning and understory use through grazing, plowing and shrub clearing (Huntsinger and Bartolome, 1992), to maintain good productivity, biodiversity and ecosystems services (Bugalho et al., 2009). In the ecosystems of this geographical area, the dominant tree species are the cork oak (Quercus suber L.) and the Portuguese holm oak (Quercus ilex subs rotundifolia Lam. (Pinto-Correia et al., 2011). Additionally, stone pine (Pinus pinea L.) has become a commonly co-occurrent species in the last decades (Coelho and Campos, 2009). The use of groundwater has been frequently reported for both the Pinus (Antunes et al., 2018; Filella and Peñuelas, 2004; Grossiord et al., 2016; Peñuelas and Filella, 2003) and Quercus genre (Barbeta and Peñuelas, 2017; Kurz-Besson et al., 2006, 2014; Otieno et al., 2006). Furthermore, the contribution of groundwater to tree physiology has been shown to be of a greater magnitude for Quercus sp. compared with Pinus sp. (del Castillo et al., 2016; Evaristo and McDonnell, 2017).
Q. suber and Q. ilex have been associated with high resilience and adaptability to hydric and thermic stress and with recurrent droughts in the southern Mediterranean Basin (Barbero et al., 1992). In Italy and Portugal, during summer droughts, Q. ilex used a mixture of rainwater and groundwater and was able to take water from very dry soils (David et al., 2007; Valentini et al., 1992). An increasing contribution of groundwater in the summer has also been shown for this species (Barbeta et al., 2015). Similarly, Q. suber showed a seasonal shift in water sources, from shallow soil water in the spring to the beginning of the dry period followed by a progressive higher use of deeper water sources throughout the drought period (Otieno et al., 2006). In addition, the species roots are known to reach depths as deep as 13 m in southern Portugal (David et al., 2004). P. pinea has been recently included in the facultative phreatophyte species (Antunes et al., 2018). This species shows a very similar root system (Montero et al., 2004) compared to cork oak (David et al., 2013), with large sinker roots reaching 5 m depth (Canadell et al., 1996). Given the information available on water use strategies by the phreatophyte arboreous species of the cork oak woodlands, Q. ilex, Q. suber and P. pinea were considered to be proxies for arboreous vegetation that belongs to the GDE relying on resident groundwater (hereafter designed as groundwater-dependent vegetation – GDV).
GDV of the Mediterranean Basin is often neglected in research. Still, little is known about the GDV distribution, but research has already been done on the effects of climate change in specific species distribution, such as that for Q. suber, in the Mediterranean Basin (Duque-Lazo et al., 2018; Paulo et al., 2015). While the increase in atmospheric CO2 and the rising temperature can boost tree growth (Barbeta and Peñuelas, 2017; Bussotti et al., 2013; Sardans and Peñuelas, 2004), water stress can have a counteracting effect on the growth of both Quercus ilex (López et al., 1997; Sabaté et al., 2002) and P. pinaster (Kurz-Besson et al., 2016). Therefore, it is of crucial importance to identify geographical areas where subsurface GDV is present and characterize the environmental conditions this vegetation type is thriving in. This would contribute to the understanding of how to manage these species under unfavorable future climatic conditions.
The aim of this study was to address the mentioned gaps by creating a suitability map of the arboreous phreatophyte species in southern Portugal, traducing their potential dependency on groundwater. We used an integrated multidisciplinary methodology combining a geospatial modeling approach based on the geographically weighted regression (GWR) and a GIS multicriteria analysis approach, both relying on forest inventory, edaphoclimatic conditions and topographic information. We expected this new integrated procedure to grant a more reliable estimation of the vegetation dependency on groundwater sources at the regional scale.
The mapping methodology was based on the occurrence of known subsurface phreatophyte species and well-known environmental conditions affecting water resource availability. Several environmental predictors were selected according to their expected impact on water use and storage and then used in GWR to model the density of Q. suber, Q. ilex and P. pinea occurrence in the Alentejo region (NUTSII) of southern Portugal. To our knowledge, very few applications of GWR have been used to model species distribution, and only recently its use has spread in ecological research (Hu et al., 2017; Li et al., 2016; Mazziotta et al., 2016). The coefficients obtained from the model equation for each predictor and expressed as the proportion of the total sum of absolute coefficients were used as weights to build the suitability map with GIS multifactor analysis, after reclassifying each relevant environmental driver. The resulting map was validated using the remote-sensed vegetation index, the normalized difference water index (NDWI).
Based on former knowledge gathered from field surveys conducted in the region (Antunes et al., 2018; Condesso de Melo et al., 2015; Kurz-Besson et al., 2006, 2014; Otieno et al., 2006; David et al., 2013; Pinto et al., 2013) on environmental conditions and the species ecophysiological needs, we hypothesized that (1) groundwater depth together with climatic conditions play one of the most important environmental roles in GDV's distribution and (2) groundwater depth between 1.5 and 15 m associated with xeric conditions should favor a higher density of GDV and thus a larger use of groundwater by the vegetation.
2.1 Study area
The administrative region of Alentejo (NUTSII; Fig. 1) covers an area of 31 604.9 km2, between 37.22 and 39.39∘ N in latitude and between 6.55 and 9.00∘ W in longitude. This study area is characterized by a Mediterranean temperate mesothermic climate with hot and dry summers, defined as Csa in the Köppen classification (APA, 2016; ARH Alentejo, 2012a, b). It is characterized by a subhumid climate, which has recently quickly drifted to semi-arid conditions (Ministério da Agricultura do Mar do Ambiente e do Ordenamento do Território, 2013). A large proportion of the area (above 40 %) is covered by forestry systems (Autoridade Florestal Nacional and Ministério da Agricultura do Desenvolvimento Rural e das Pescas, 2010), providing a high economical value to the region and the country (de Sarmento and Dores, 2013).
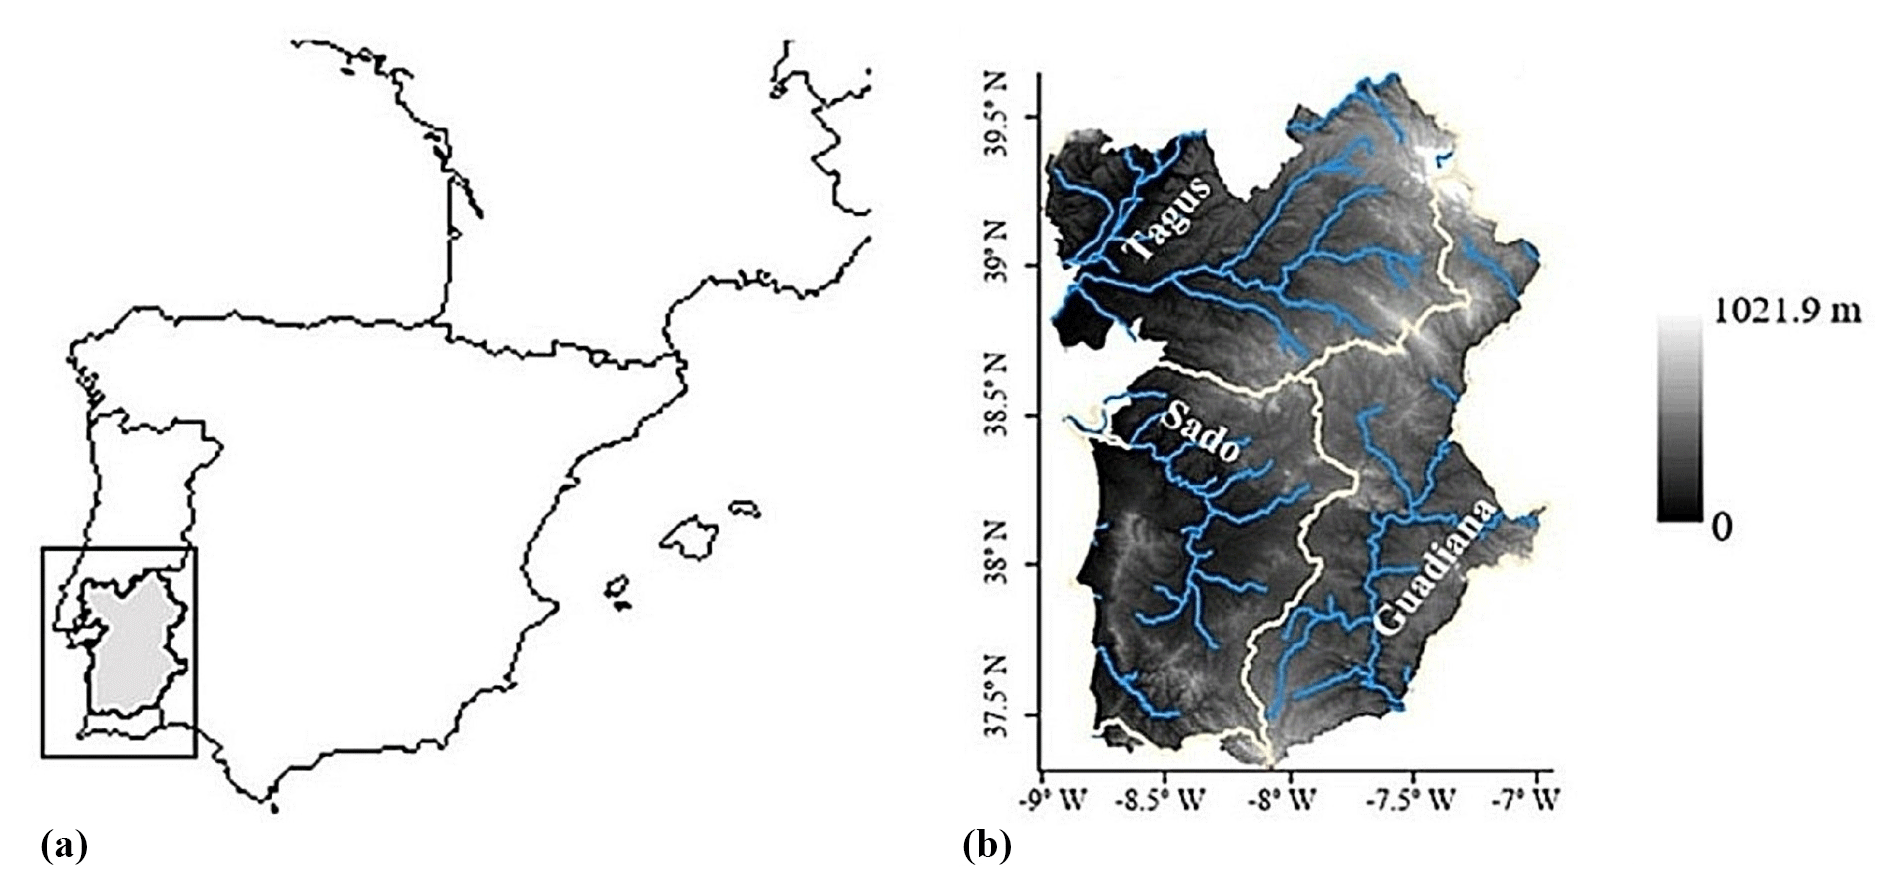
Figure 1Study area. On the left is the location of Alentejo in the Iberian Peninsula; on the right is the elevation characterization of the study area with the main river courses from Tagus, Sado and Guadiana basins (white lines). Names of the main rivers are indicated at to their location on the map.
2.2 Kernel density estimation of GDV
Presence datasets of Quercus suber, Quercus ilex and Pinus pinea of the last Portuguese forest inventory completed in 2010 (ICNF, 2013) were used to calculate Kernel density (commonly called a heat map) as a proxy for GDV suitability. The inventory registered the occurrence of each species on a 500 m mesh grid resolution, corresponding to a maximum occurrence of four counts per square kilometer. Only data points with one of the three proxy species selected as primary and secondary occupation were used. The resulting Kernel density was weighted according to tree cover percentage and was calculated using a quartic biweight distribution shape, a search radius of 10 km, and an output resolution of 0.018∘, corresponding to a cell size of 1 km. This variable was computed using QGIS version 2.14.12 (QGIS Development Team, 2017).
2.3 Environmental variables
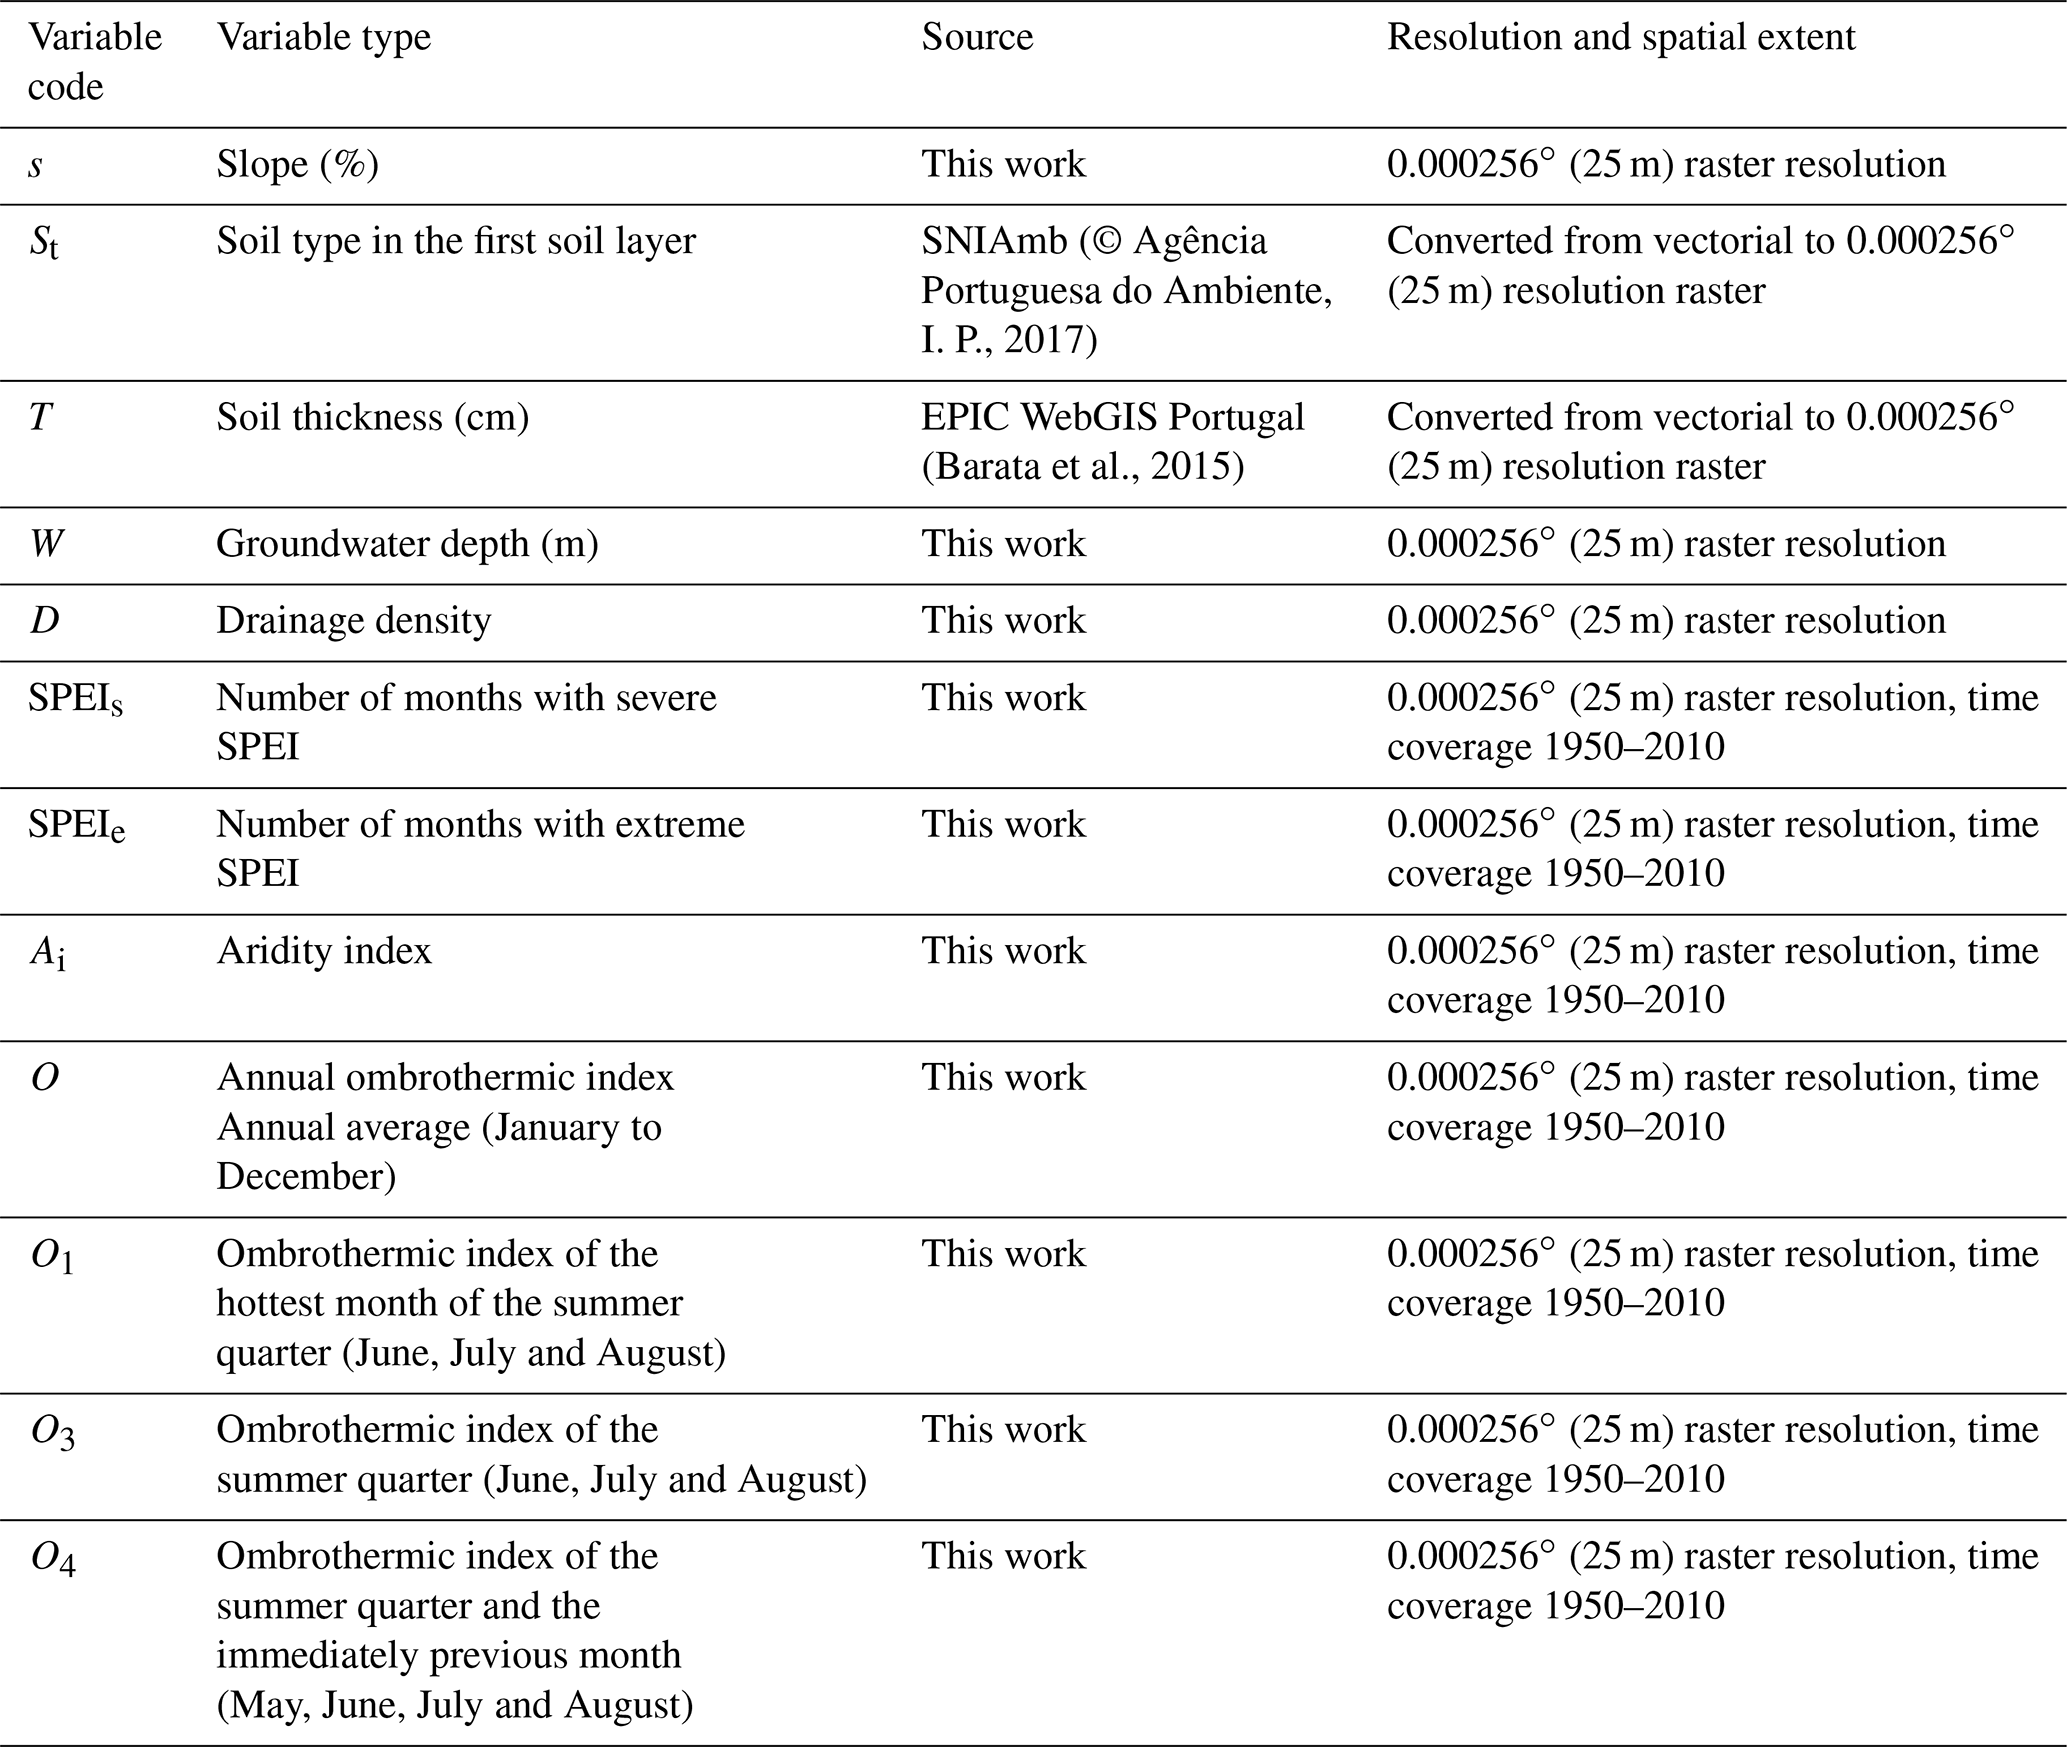
Species distribution is mostly affected by limiting factors controlling ecophysiological responses, disturbances and resources (Guisan and Thuiller, 2005). To characterize the study area in terms of GDV's suitability, environmental variables expected to affect GDV's density were selected according to their constraint on groundwater uptake and soil water storage. Within possible abiotic variables, landscape topography, geology, groundwater availability and regional climate were considered. The 12 selected variables for modeling purposes, retrieved from different data sources, are listed in Table 1. The software used in spatial analysis was ArcGIS® software version 10.4.1 by Esri and R program software version 3.4.2 (R Development Core Team, 2016).
Table 1Environmental variables for the characterization of the suitability of GDV in the study area.
2.3.1 Slope and soil characteristics
The NASA and METI ASTER GDEM product was retrieved from the online data pool, courtesy of the NASA Land Processes Distributed Active Archive Center (LP DAAC), USGS Earth Resources Observation and Science (EROS) Center, Sioux Falls, South Dakota (https://lpdaac.usgs.gov/data_access/data_pool, last access: 15 June 2017). The Spatial Analyst toolbox was used to calculate the slope from the digital elevation model. The slope was used as a proxy for the identification of shallow soil water interaction with vegetation.
The map of soil type was obtained from the Portuguese National Information System for the Environment – SNIAmb (© Agência Portuguesa do Ambiente, 2017, https://sniamb.apambiente.pt/?language=pt-pt, last access: August 2019) – and uniformized to the World Reference Base with the Harmonized World Soil Database v 1.2 (FAO et al., 2009). The vector map was converted to raster using the conversion toolbox. To reduce the analysis complexity involving the several soil types present in the map, soil types were regrouped into three classes according to their capacity to store or drain water (Table A1). The classification was based on the characteristics of each soil unit (available water storage capacity, drainage and topsoil texture) from the Harmonized World Soil Database v 1.2 (FAO et al., 2009). In the presence of dominant soil with low drainage capacity, a high clay fraction in the top soil and a high available water content, lower scores were given in association with decreased suitability for GDV by favoring non-GDV species. Otherwise, when soil characteristics suggested water storage at deeper soil depths and lower water content, drainage and sandy topsoil texture, higher scores were given.
Effective soil thickness (Table 1) was also considered for representing the maximum soil depth explored by the vegetation roots. It constrains the expansion and growth of the root system as well as the available amount of water that can be absorbed by roots.
2.3.2 Groundwater availability
Root access to water resources is one of the most limiting factors for GDV's growth and survival, especially during the dry season. The map of depth to the water table was interpolated from piezometric observations from the Portuguese National Information System on Water Resources (SNIRH) public database (http://snirh.apambiente.pt, last access: 31 March 2017) and the Study of Groundwater Resources of Alentejo (ERHSA; Chambel et al., 2007). Data points of large-diameter wells and piezometers were retrieved for the Alentejo region (Fig. 2) and sorted into undifferentiated, karst or porous geological types to model groundwater depth. In the studied area, piezometers are exclusively dedicated small-diameter boreholes for piezometric observations in areas with high abstraction volumes for public water supply. Large-diameter wells in this region usually have a low yield and are mainly devoted to private use and irrigation. Due to the large heterogeneity of geological media, groundwater depth was calculated separately for each sub-basin. A total of 3158 data points corresponding to large wells and piezometers were used, with uneven measurements between 1979 and 2017. For each piezometer an average depth was calculated from the available observations and used as a single value. In areas with an undifferentiated geological type, piezometric level and elevation were highly correlated (>0.9); thus a linear regression was applied to interpolate data. Ordinary kriging was preferred for the interpolation of karst and porous aquifers, combining large wells and piezometric data points. The ordinary kriging was calculated using a semi-variogram in which the sill, range and nugget were optimized to create the best fit of the model to the data. To build a surface layer of the depth to the water table, the interpolated surface of the groundwater level was subtracted from the digital elevation model. The Geostatistical Analyst toolbox was used for this task.
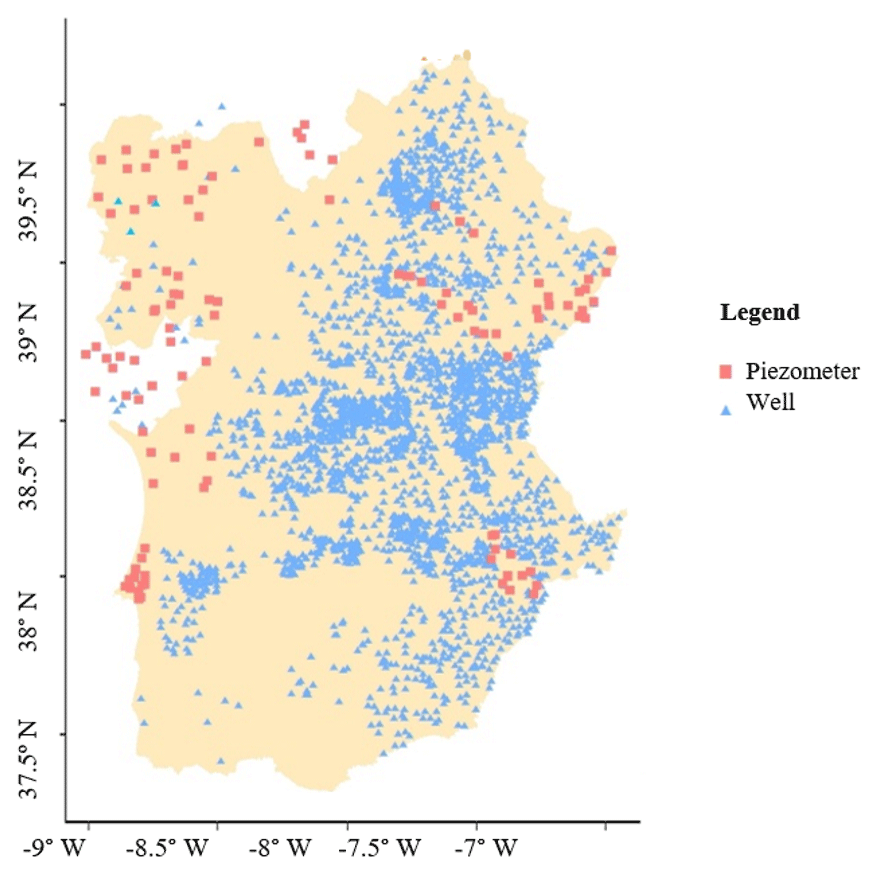
Figure 2Large well and piezometer data points used for groundwater depth calculation. Squares represent piezometers data points, and triangles represent large well data points.
Drainage density is a measure of how well the basin is drained by stream channels. It is defined as the total length of channels per unit area. Drainage density was calculated for a 10 km grid size for the Alentejo region by the division of the 10 km square area (A) in square kilometers by the total stream length (L) in kilometers, as in Eq. (1):
2.3.3 Regional climate
Temperature and precipitation datasets were obtained from the E-OBS (http://eca.knmi.nl/download/ensembles/ensembles.php, last access: 31 March 2017) public database (Haylock et al., 2008). The standardized precipitation evapotranspiration index (SPEI), aridity index (Ai) and ombrothermic indices were computed from long-term (1951–2010) monthly temperature and precipitation observations. The computation of potential evapotranspiration (PET) was performed according to Thornthwaite (1948) and was calculated using the SPEI package (Beguería and Vicente-Serrano, 2013) in the R program.
The SPEI, a multi-scalar drought index (Vicente-Serrano et al., 2010), was calculated over a 6-month interval to characterize drought severity in the area of study using the SPEI package (Beguería and Vicente-Serrano, 2013) for the R program. The SPEI is based on the normalization of the water balance calculated as the difference between cumulative precipitation and PET for a given period at monthly intervals. Normalized values of the SPEI typically range between −3 and 3. Drought events were considered to be severe when SPEI values were between −1.5 and −1.99 and extreme with values below −2 (Mckee et al., 1993). Severe and extreme SPEI predictors were computed as the number of months with severe or extreme drought, counted along the 60 years of the climate time series.
While the SPEI used in this study identifies geographical areas affected with more frequent extreme droughts, the aridity index distinguishes arid geographical areas prone to annual negative water balance (with low Ai value) from more mesic areas showing a positive annual water balance (with high Ai value). Ai gives information related to evapotranspiration processes and the rainfall deficit for potential vegetative growth. It was calculated following Eq. (2) according to Middleton et al. (1992), where PET is the average annual potential evapotranspiration and P is the average annual precipitation, both given in millimeters for the 60-year period of the climate time series. Drylands are defined by their degree of aridity in four classes: hyperarid (Ai<0.05), arid (), semi-arid () and dry subhumid (; Middleton et al., 1992):
Ombrothermic indices were used to better characterize the bioclimatology of the study region (Rivas-Martínez et al., 2011) by evaluating soil water availability for plants during the driest months of the year. Four ombrothermic indices were calculated according to a specific section of the year stated in Table 1, and following Eq. (2), where Pp s the positive annual precipitation (accumulated monthly precipitation when the average monthly mean temperature is higher than 0 ∘C) and Tp is the positive annual temperature (total in tenths of degrees centigrade of the average monthly temperatures higher than 0∘). The ombrothermic index presenting values below 2 for the analyzed months can be considered to be Mediterranean bioclimatically. For non-Mediterranean areas, there is no dry period in which, for at least 2 consecutive months, the precipitation is less than or equal to twice the temperature:
2.4 Selection of model predictors
The full set of environmental variables was evaluated as potential predictors for the suitability of GDV (based on the Kernel density of the proxy species). A preliminary selection was carried out, first by computing Pearson's correlation coefficients between environmental variables and second by performing a principal components analysis (PCA) to detect multicollinearity. Covariates were discarded for modeling according to a sequential procedure. Whenever pairs of variables presented a correlation value above 0.4, the variable with the highest explained variance on the first axis of the PCA was selected. In addition, selected variables had to show the lowest possible correlation values between them. Variables showing low correlations and explaining a higher cumulative proportion of variability with the lowest number of the PCA axis were later selected as predictors for modeling. PCA was performed using the GeoDa software (Anselin et al., 2006), and Pearson's correlation coefficients were computed with the Spatial Analyst tool.
2.5 Model development
When fitting a linear regression model based on the selected variables, the normal distribution and stationarity of the response variable and residuals must be assured.
The Kernel density of the proxy GDV species, Q. suber, Q. ilex and P. pinea, showed a skewed normal distribution. Therefore, a square-root transformation of the data was applied on the response variable before model fitting. To be able to compare the resulting model coefficients and use them as weighting factors of the multicriteria analysis to build the suitability map, the predictor variables were normalized using the z-score function. This allows us to create standardized scores for each variable by subtracting the mean of all data points from each individual data point and then dividing those points by the standard deviation of all points so that the mean of each z predictor is zero and the deviation is 1.
Spatial autocorrelation and non-stationarity are common when using linear regression on spatial data. To overcome these issues, the GWR was used. This extension of the ordinary least-squares (OLS) linear regression considers the spatial non-stationarity in variable relationships and allows the use of spatially varying coefficients while minimizing spatial autocorrelation (Stewart Fotheringham et al., 1996). In this study, simple linear regression and GWR were both applied to the dataset, and their performances were compared. Models were fitted on a 5 % random subsample of the entire dataset (reaching a total of 6214 selected data points) due to computational restrictions and to a decrease in the spatial autocorrelation effect (Kühn, 2007). Bertrand et al. (2016) applied a similar methodology by using only 10 % of the available points, with a ∼10 km distance between points in the selected sub-sample. In spite of the subsampling, the minimum and maximum distance between two random data points were, respectively, 3.6 and 16.7 km, providing a good representation of local heterogeneity, as shown in Figs. 5 and 6. An additional analysis showing an excellent agreement between the two datasets is presented in Fig. A1.
Initially the model was constructed containing all selected predictors through the PCA and Pearson's correlation analysis. Afterwards, predictors were sequentially discarded to ascertain the model presenting lower second-order Akaike information criteria (AICc) and higher quasi-global R2 values chosen to predict the suitability of GDV.
Adaptive Kernel bandwidths for the GWR model fitting were used due to the spatial irregularity of the random subsample. A local search radius was obtained by minimizing the cross-validation score (Bivand et al., 2008), thus minimizing the error of the local regressions. To analyze the performance of the GWR model alone, the local and global adjusted R2 values were considered. To compare between the GWR model and the simple linear model, the distribution of the model residuals was used to identify clustered values as well as the AICc. The spatial autocorrelation of the models residuals was evaluated with the Moran's I test (Moran, 1950) calculated from the Spatial Statistics tool and also graphically. GWR model was fitted using the spgwr package from the R program (Bivand and Yu, 2017).
2.6 Suitability map building
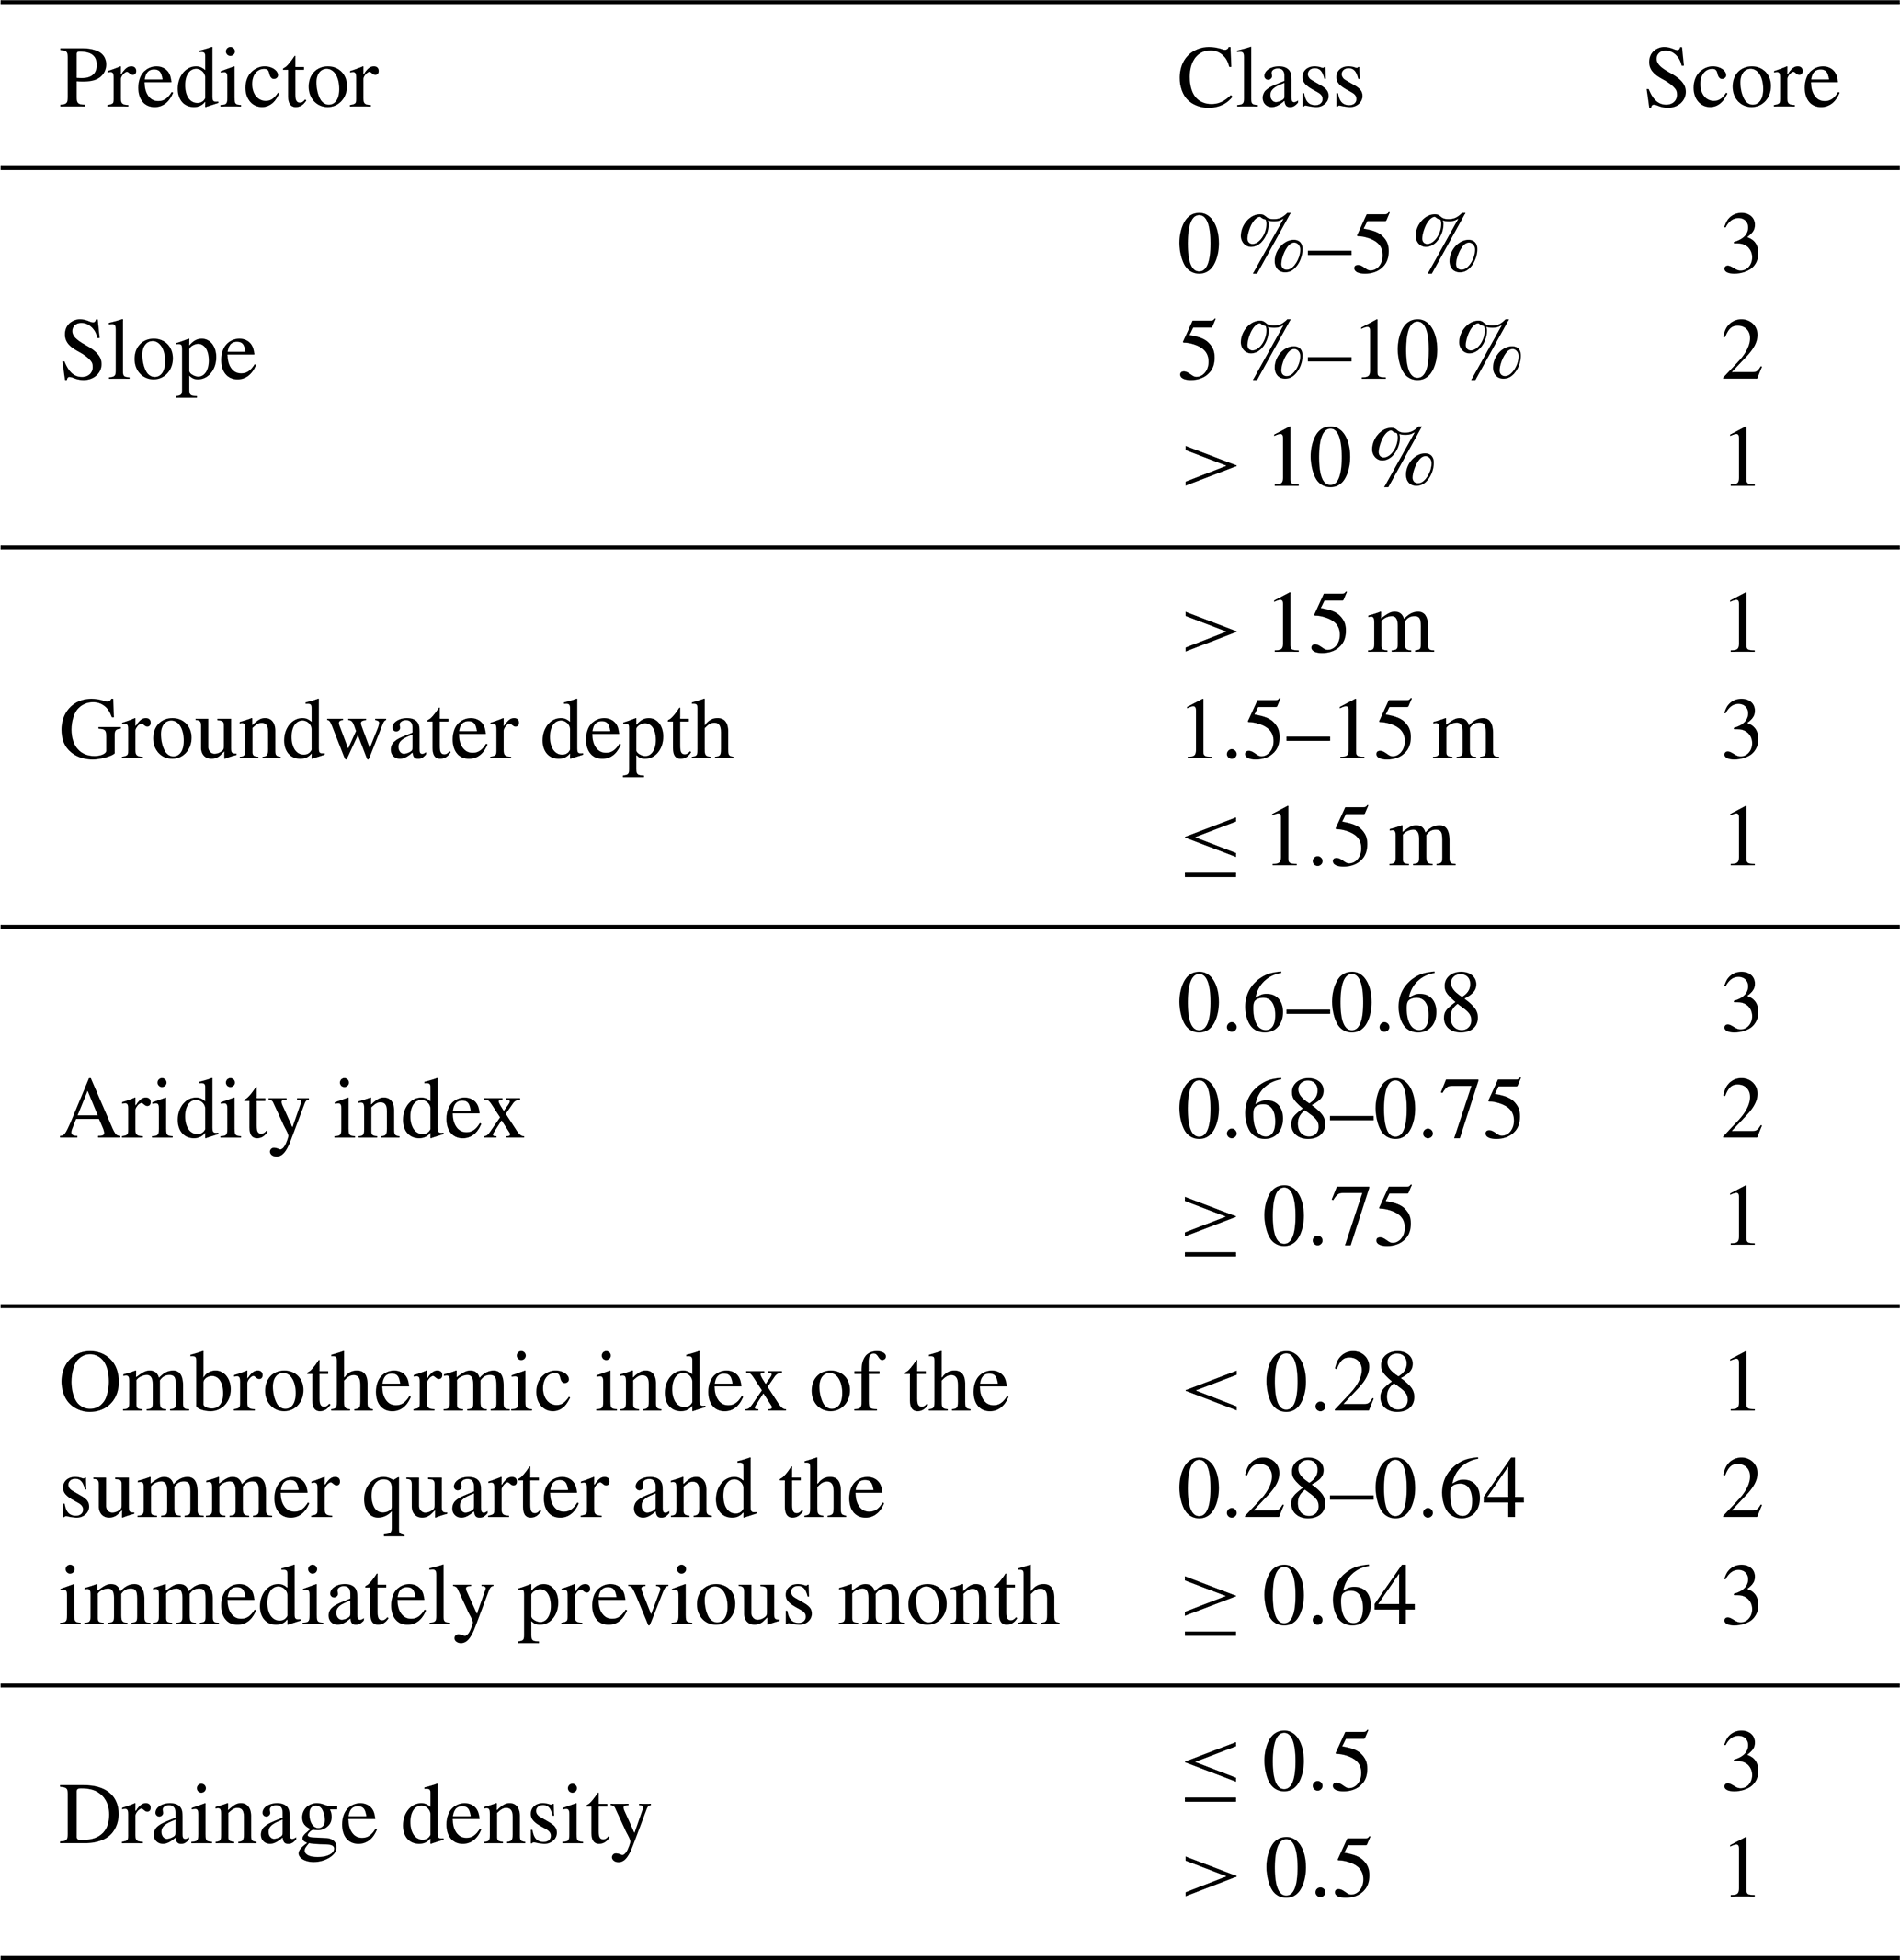
To create the suitability map all predictor layers included in the GWR model were classified, similarly to Condesso de Melo et al. (2015) and Aksoy et al. (2017). The likelihood of an interaction between the vegetation and groundwater resources was scored from 1 to 3 for each predictor. Scores were assigned after bibliographic review and expert opinion. The higher the score, the higher the likelihood, with 1 corresponding to a weak likelihood and 3 indicating a very high likelihood.
Groundwater depth was divided in two classes according to the accessibility to shallow soil water above 1.5 m and the maximum rooting depth for Mediterranean woody species reaching 13 m, reported by Canadell et al. (1996). Throughout the paper water between 0 and 1.5 m depth was designated as shallow soil water, while water below 1.5 m depth was considered to be groundwater. The depth class between 0 and 1.5 m was based on the riparian vegetation in semi-arid Mediterranean areas, which is mainly composed of shrub communities (Salinas et al., 2000) and presents a mean rooting depth of 1.5 m (Silva and Rego, 2004). The most common tree-species rooting depth in riparian ecosystems is normally similar to the depth of fine sediment not reaching gravel substrates (Singer et al., 2012) and not reaching levels as deep as deep-rooted species. The minimum score was given to areas where groundwater depth was too shallow (below 1.5 m) to belong to emerging groundwater-dependent vegetation. Areas with a steep slope were considered to have superficial runoff and less recharge and influence tree density negatively (Costa et al., 2008). Those areas were treated as less suitable to GDV. Values of the ombrothermic index of the summer quarter and the immediately previous month (O4) were split into three classes according to Jenks natural breaks, with higher suitability corresponding to higher aridity. The higher values of Ai corresponding to lower aridity had a score of 1 because a higher humid environment would decrease the necessity of the arboreous species to use deep water sources. Accordingly, an increase in aridity (lower values of Ai) has already been shown to increase tree decline (Waroux and Lambin, 2012), and thus lower Ai values corresponded to a score of 3, leaving the score 2 to intermediate values of Ai. Drainage density scoring was based on the drainage capability of the water through the hydrographical network of the river. A low drainage density (below 0.5) implies a high loss of water through runoff along the hydrographic network. This water lost for shallow soil horizons would be less available to the vegetation, thus favoring a higher use of water from deep groundwater reservoirs (Rodrigues et al., 2011).
A direct compilation of the predictor layers could have been performed for the multicriteria analysis. However, some predictors might have a stronger influence on GDV's distribution and density than others. Therefore, there was a need to define weighting factors for each layer of the final GIS multicriteria analysis. Yet, due to the intricate relations between all environmental predictors and their effects on the GDV, experts and stakeholders suggested very different scoring for a same layer. Instead the relative proportion of each predictor was used locally, according to the GWR model (Eq. 4), as weighting factors. The final GIS multicriteria analysis was performed using the Spatial Analyst tool by applying local model equations obtained for each of the 6214 coordinates of the Alentejo map (Eq. 4),
with SGDV representing the suitability to groundwater-dependent vegetation, brackets representing the reclassified GIS X layer corresponding to the scoring, and coefx indicating the relative proportion for the predictor x calculated as the ratio between the modulus of the local coefficient x and the sum of the modulus of all local coefficients.
According to this equation, lower values indicate a lower occurrence of groundwater use, representing a lower GDV suitability, while higher values correspond to a higher use of groundwater, representing higher GDV suitability. To allow for an easier interpretation, the data on suitability to GDV were subsequently classified based on their distribution value, according to Jenks natural breaks. This resulted in five suitability classes: “Very poor”, “Poor”, “Moderate”, “Good” and “Very Good”.
2.7 Map evaluation
Satellite-derived remote-sensing products have been widely used to follow the impact of drought on land cover and the vegetation dynamics (AghaKouchak et al., 2015). Vegetation indices offer excellent tools to assess and monitor plant changes and water stress (Asrar, 1989). The NDWI (Gao, 1996) is a satellite-derived index that aims to estimate fuel moisture content (Maki et al., 2004) and leaf water content at canopy level, being widely used for drought monitoring (Anderson et al., 2010; Gu et al., 2007; Ceccato et al., 2002a). This index was chosen to be more sensitive to canopy water content and a good proxy for water stress status in plants. Moreover, the NDWI has been shown to be best related to the greenness of cork oak woodland's canopy, expressed by the fraction of intercepted photosynthetically active radiation (Cerasoli et al., 2016).
In order to validate the GDV suitability map obtained in our study, we calculated anomalies of the NDWI (Gao, 1996) between an extremely dry year (2005) and the median value of the surrounding 10-year period (1999–2009). The NDWI is computed using the near-infrared (NIR) and the shortwave infrared (SWIR) reflectance, which makes it sensitive to changes in liquid water content and in vegetation canopies (Gao, 1996; Ceccato et al., 2002a, b). The index computation (Eq. 5) was further adapted by Gond et al. (2004) to SPOT-VEGETATION instrument datasets, using NIR (0.84 µm) and mid-infrared (MIR) (1.64 µm) channels, as described by Hagolle et al. (2005):
Following Eq. (5), NDWI data were computed using B3 and MIR data acquired from the VEGETATION instrument aboard SPOT 4 and SPOT 5 satellites. Extraction and corrections procedures applied to optimize NDWI series are fully described in Gouveia et al. (2012).
The NDWI anomaly was computed as the difference between NDWI observed in June, July and August of 2005 and the median NDWI for the considered month for the period 1999 to 2009. June was selected to provide the best signal from a still fully active canopy of woody species while the herbaceous layer had usually already finished its annual cycle and dried out. The hydrological year of 2004–2005 was characterized by an extreme drought event over the Iberian Peninsula, where less than 40 % of the normal precipitation was registered in the southern area (Gouveia et al., 2009). Thus, in June 2005 the vegetation of the Alentejo region was already coping with an extreme long-term drought, which was well captured by the anomaly of the NDWI (negative values), as formerly shown by Gouveia et al. (2012).
2.8 Sensitivity analysis
Sensitivity analyses are conducted to identify model inputs that cause significant impact and/or uncertainty in the output. They can be used to identify key variables that should be the focus of attention to increase mode robustness in future research or to remove redundant inputs from the model equation because they do not have significant impact on the model output. Based on bootstrapping simulations (Tian et al., 2014), a sensitivity analysis was conducted on the GWR model by perturbing one input predictor at a time while keeping the rest of the equation unperturbed. To simulate perturbations, 10 000 values were randomly selected within the natural range of each input variable observed in the Alentejo region. Those random values were then used to run 10 000 simulations of the local equation of the GWR model for each of the 6214 coordinates of the geographical area. Local outputs corresponding to the predicted GDV density were then calculated for each perturbed input variable (Ai, O4, W, D and s). The range of output values was calculated to reflect the sensibility of the model for the perturbed input variable. The overall sensibility of the model to all input variables was estimated as the absolute difference between the minimum output value and the sum of maximum output values of all predictors, thus representing the maximum possible output range observed after perturbing all predictors.
3.1 Kernel density
Within the studied region of Portugal, the phreatophyte species Quercus suber, Quercus ilex and Pinus pinea were not distributed uniformly throughout the territory. Areas with higher Kernel density (or higher distribution likelihood) were mostly spread between the northern part of Alentejo region and the western part close to the coast, with values ranging between 900 and 1200 occurrences in a 10 km search radius (Fig. 3). Two clusters of high density also appeared below the Tagus river. The remaining study area presented mean density values, with very low densities in the area of the river Tagus and in the center–south.
Table 2Effect of variable removal in the performance of GWR model linking the Kernel density of Quercus suber, Quercus ilex and Pinus pinea (SGDV) to predictors of the aridity index (Ai), ombrothermic index of the summer quarter and the immediately previous month (O4), slope (s), drainage density (D), groundwater depth (W), and soil type (St). The model with all predictors is highlighted in grey, and the final model used in this study is in bold.
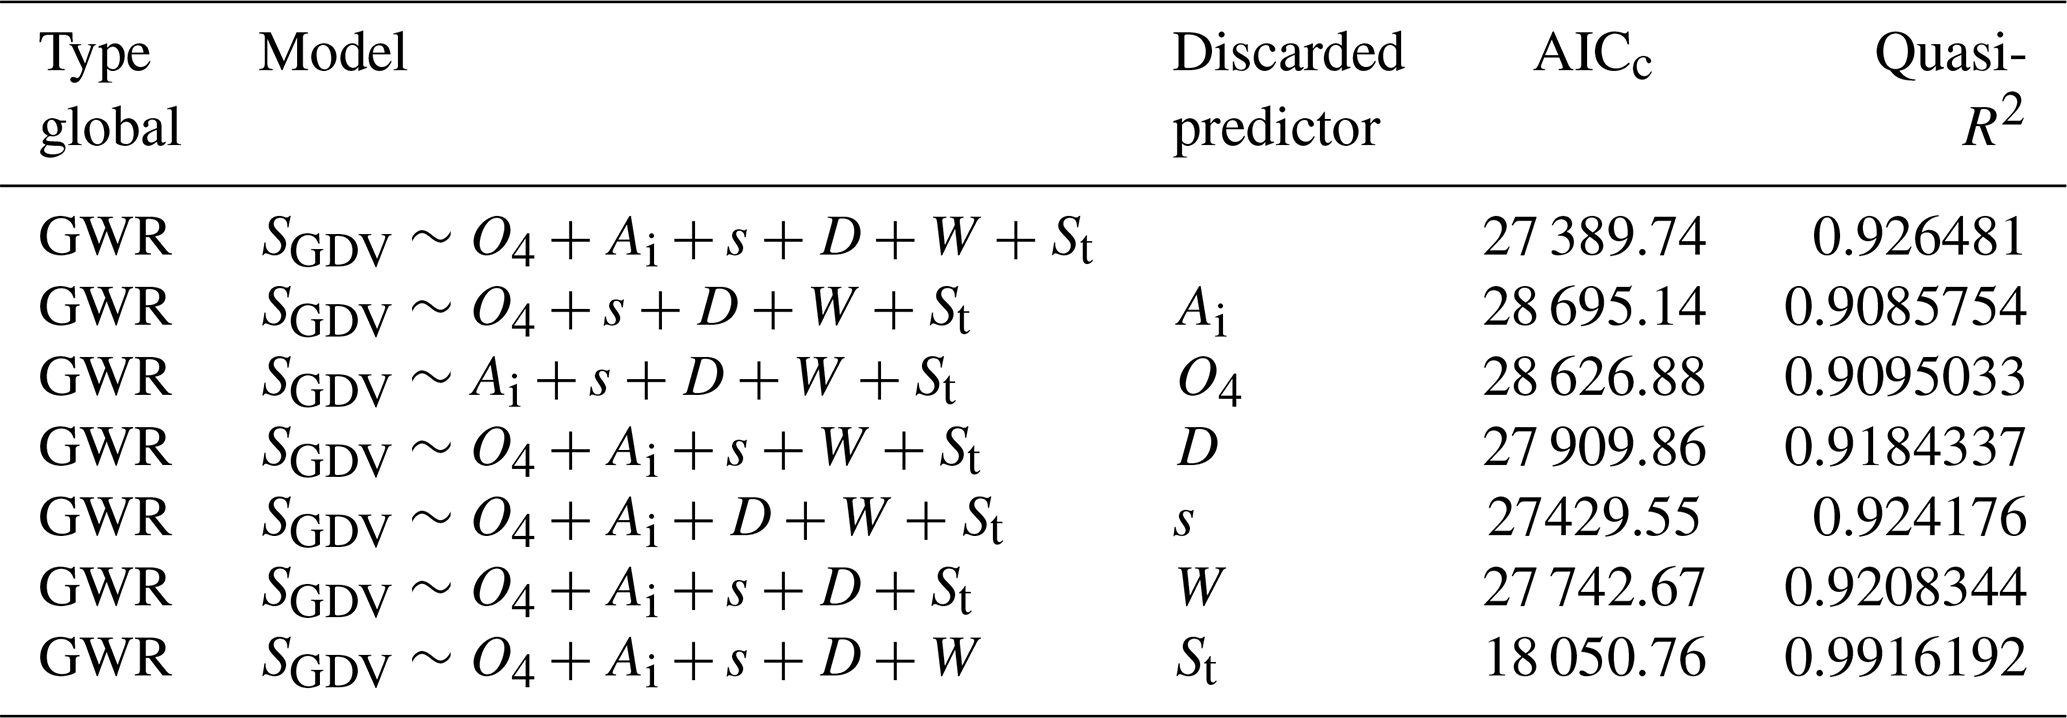
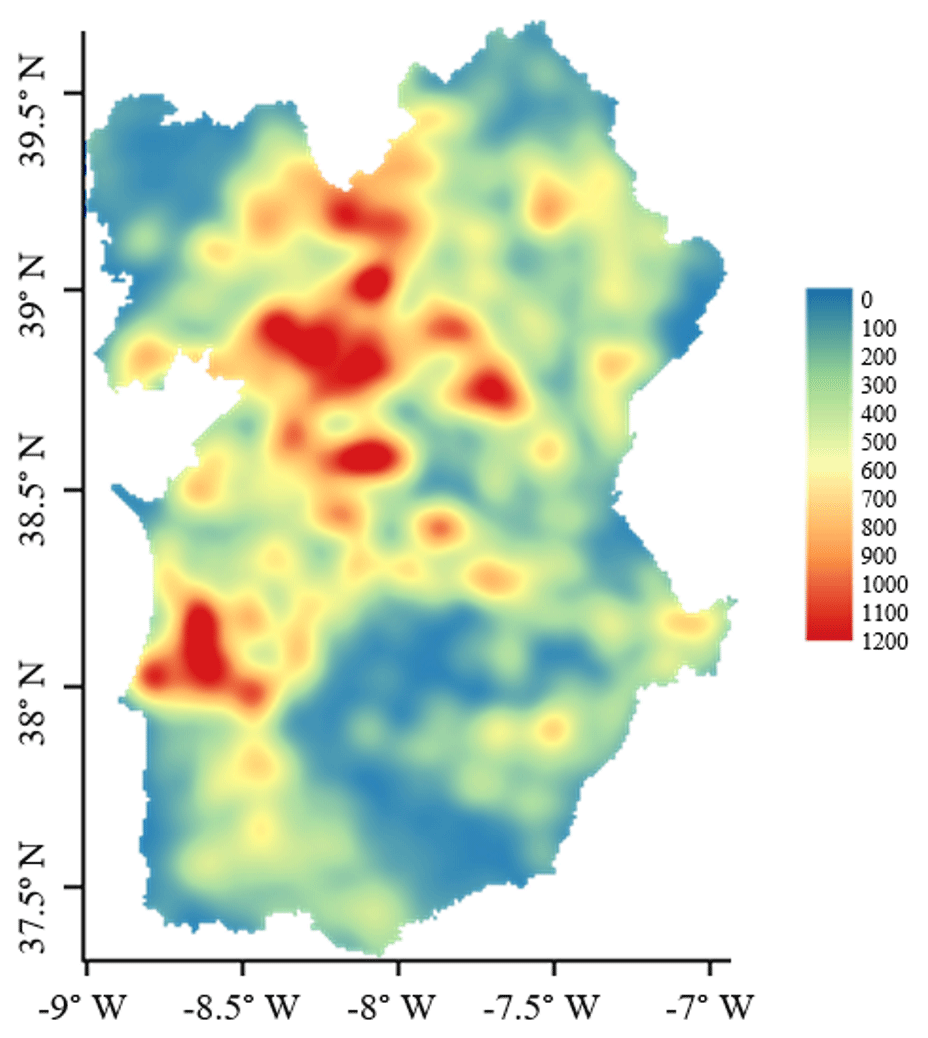
Figure 3Map of Kernel density weighted by cover percentage of Q. suber, Q. ilex and P. pinea. The scale unit represents the number of occurrences per 10 km search radius (∼314 km2).
3.2 Environmental conditions
The exploratory analysis of the variables performed through the PCA and the Pearson's correlation matrix confirmed the presence of multicollinearity. From the initial variables (Table 1), thickness (T), number of months with severe and extreme SPEIs (respectively, SPEIs and SPEIe), annual ombrothermic index (O), ombrothermic index of the hottest month of the summer quarter (O1), and ombrothermic index of the summer quarter (O3) were discarded, while the variable slope (s), drainage density (D), soil type (St), groundwater depth (W), Ai and O4 were maintained for analysis (Fig. A2 and Table A2). A sequential removal of one predictor from the initial modeling including six variables was performed (Table 2), after which the model was reduced to five variables. Therefore, out of the initial 12 variables considered (Fig. 4) to explain the variation of the Kernel density of GDV in Alentejo, the following variables were endorsed: Ai, O4, W, D and s.

Figure 4Map of environmental layers used in model fitting. (a) Aridity index, (b) ombrothermic index of the summer quarter and the immediately previous month, (c) groundwater depth, (d) drainage density, and (e) slope.
In most parts of the Alentejo region, the slope was below 10 % (Fig. 4e) and coastal areas presented the lowest values and variability. The highest values of groundwater depth (Fig. 4c), reaching a maximum of 255 m, were found in the Atlantic margin of the study area, mainly in Tagus and Sado river basins. Several other small and confined areas in Alentejo also showed high values, corresponding to aquifers of porous or karst geological types. Most of the remaining study area showed groundwater depths ranging between 1.5 and 15 m. Figure 4a and b indicate the southeast of Alentejo as the driest area, given by minimum values of Ai (0.618) and much higher potential evapotranspiration than precipitation. Besides this, O4 presented a maximum value (1.166) for this region (meaning that soil water availability was not compensated by the precipitation of the previous May–June–July–August months). This is also supported by the higher drainage density in the southeast, which indicates a lower prevalence of shallow soil water due to higher stream length by area.
Combining all variables, it was possible to distinguish two subregions with distinct conditions: the southeast of Alentejo and the Atlantic margin. The latter is mainly distinguished by its low-slope areas, shallower groundwater and more humid climatic conditions than the southeast of Alentejo.
3.3 Regression models
The best model to describe the GDV distribution was found through a sequential discard of each variable (Table 2) and corresponded to the model with a distinct lower AICc (18050.76) than the second-lowest AICc (27389.74) and showed an important increase in quasi-global R2 values (from 0.926 for the second-best model to 0.992 for the best one). The best model fit was obtained with Ai, O4, W, D and s. This final model was then applied to the GIS layers to map the suitability of GDV in Alentejo, according to Eq. (6):
The local adjusted R2 of the GWR model was highly variable throughout the study area, ranging from 0 to 0.99 (Fig. 5), however the local R2 values below 0.5 corresponded to only 0.3 % of the data. The lower R2 values were distributed throughout the Alentejo area, with no distinct pattern. The overall fit of the GWR model was high (Table 3). The adjusted regression coefficient indicated that 99 % of the variation in the data was explained by the GWR model, while only 2 % was explained by the simple linear model (Table 3). Accordingly, GWR had a substantially lower AICc when compared with the simple linear model, indicating a much better fit.
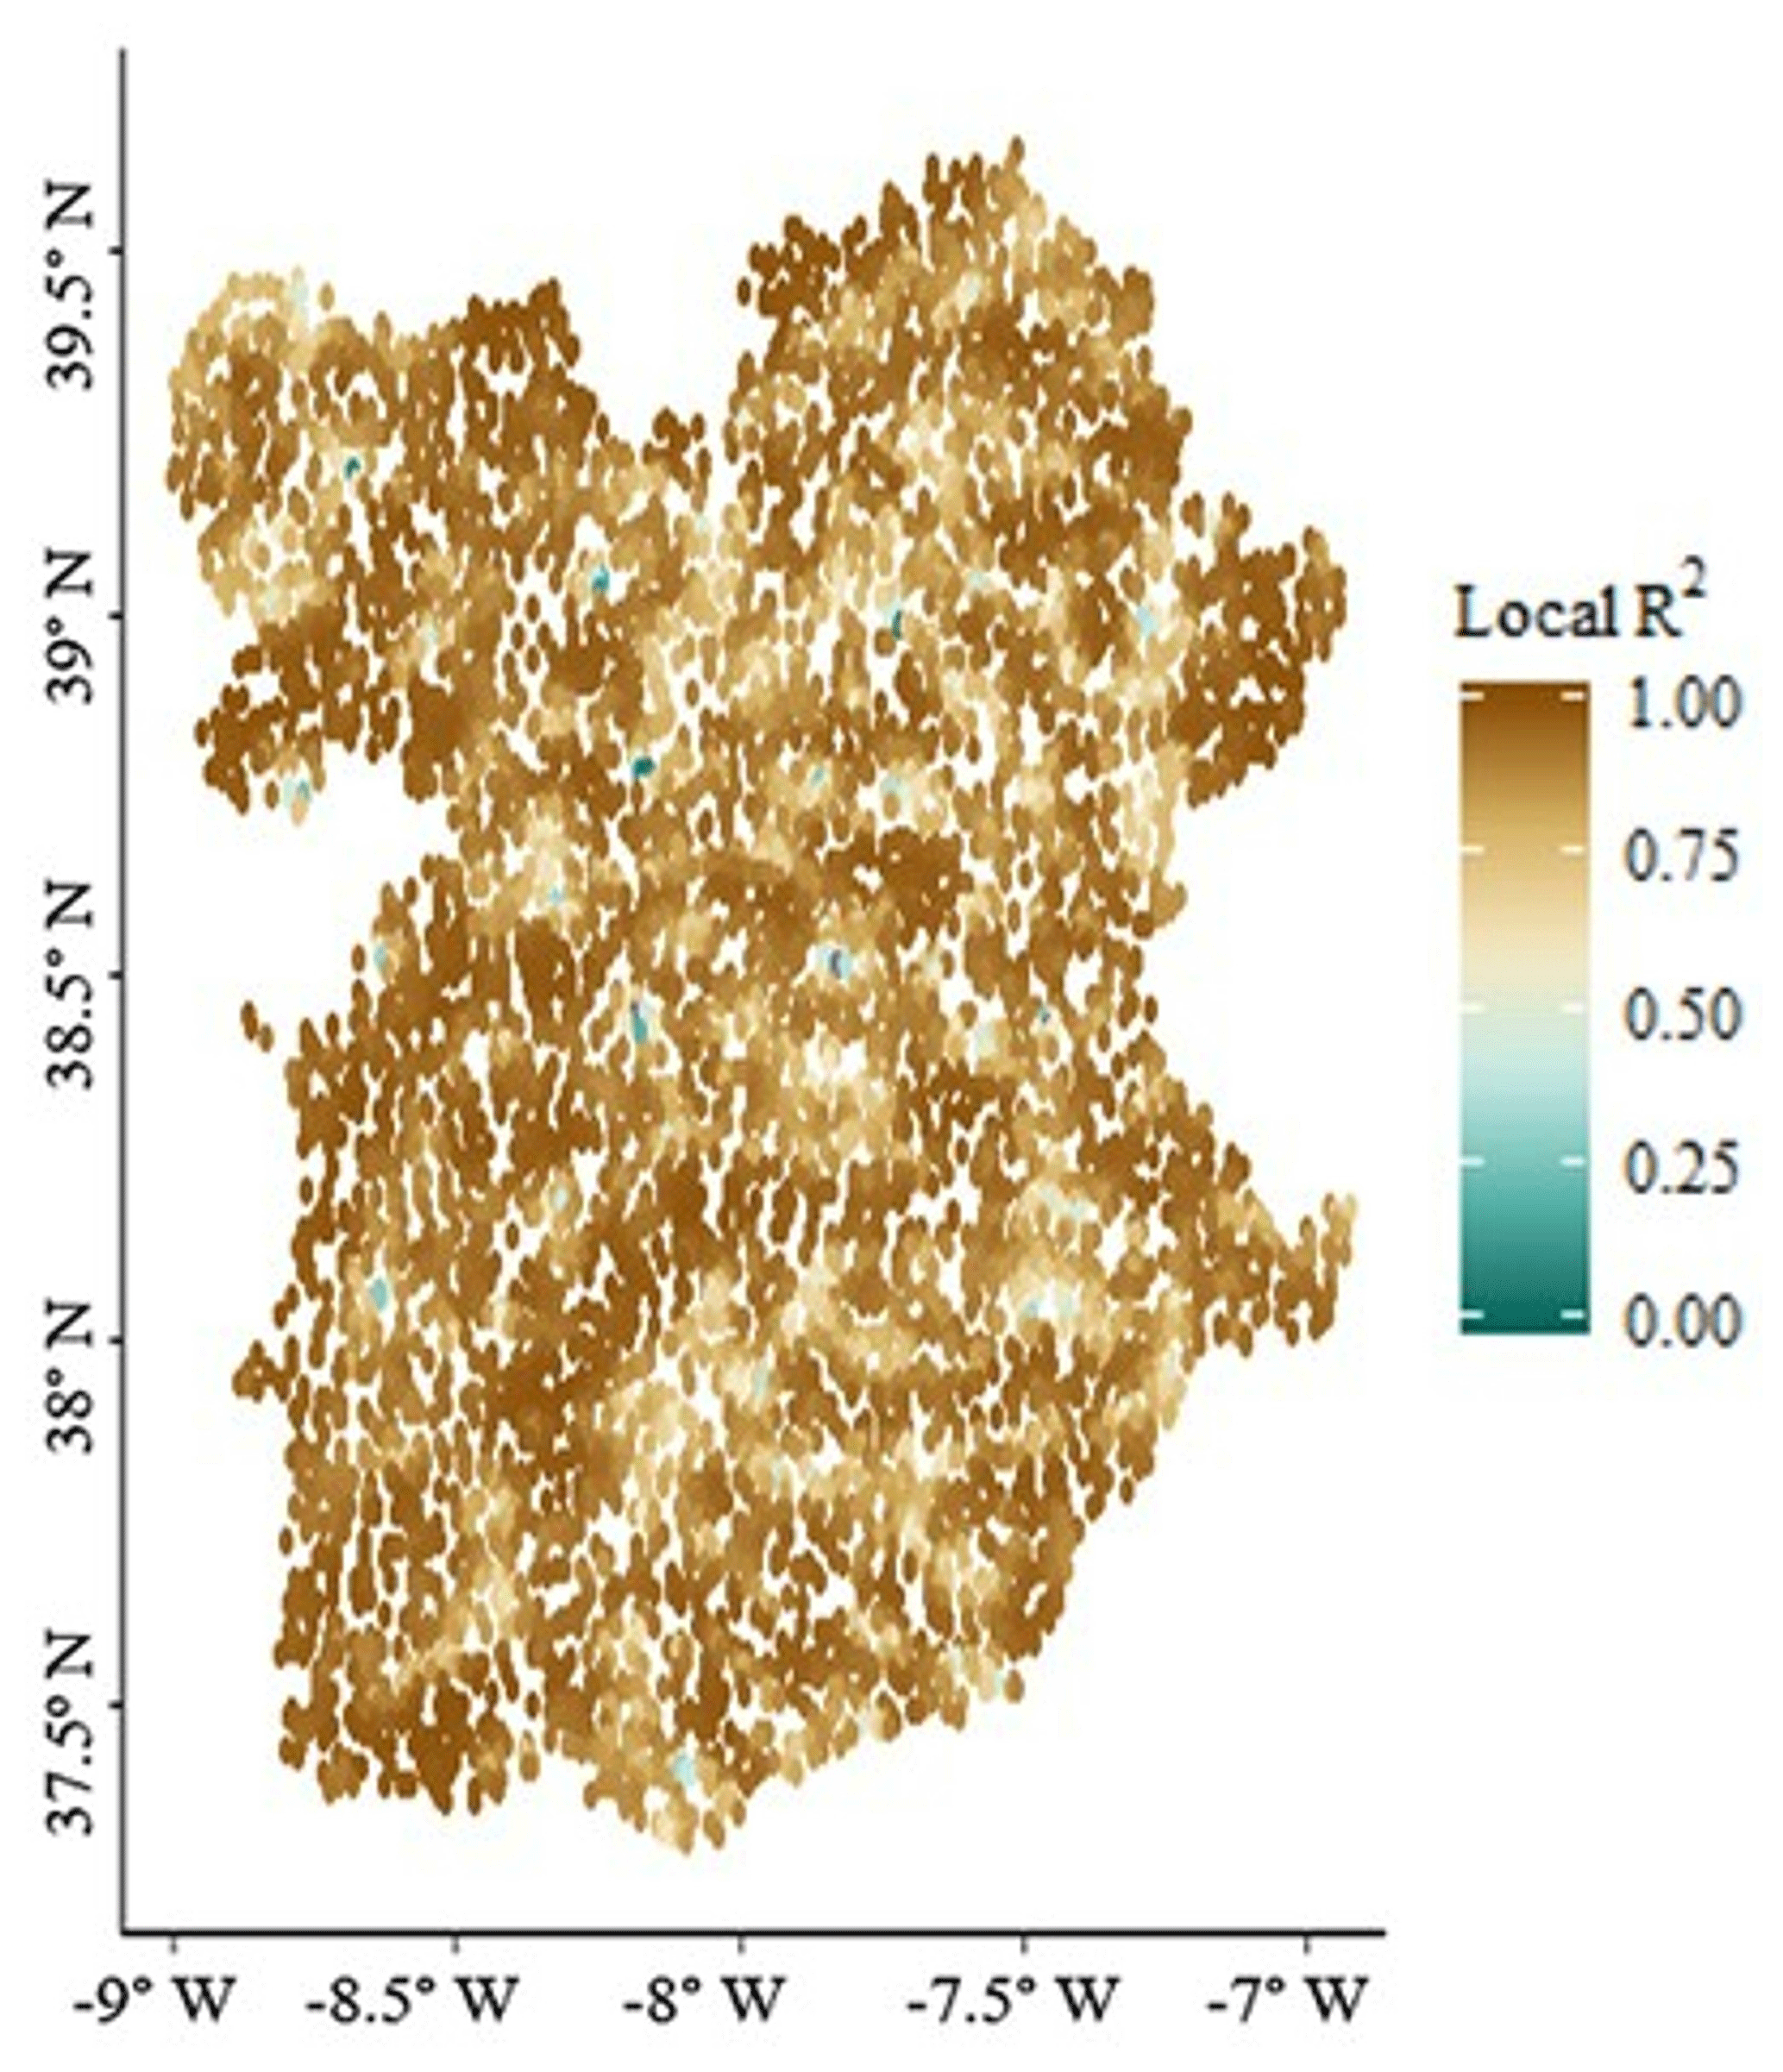
Figure 5Spatial distribution of local R2 from the fitting of the geographically weighted regression.
The spatial autocorrelation given by the Moran index (Griffith, 2009; Moran, 1950) retrieved from the geospatial distribution of residual values was significant for both the GWR and the linear models, indicating that observations are geospatially dependent on each other to a certain level. However, this dependence was substantially lower for the GWR model than for the linear model (z score of 50.24 and 147.56 respectively). In the GWR model (Fig. 6a) the positive and negative residual values were much more randomly scattered throughout the study region than in the linear model (Fig. 6b), highlighting a much better performance of the GWR, which minimized residual autocorrelation. Indeed, in the linear model (Fig. 6b), positive residuals were condensed in the right side of Tagus and Sado river basins, while negative values were mainly present on the left side of the Tagus river and in the center–south of Alentejo.
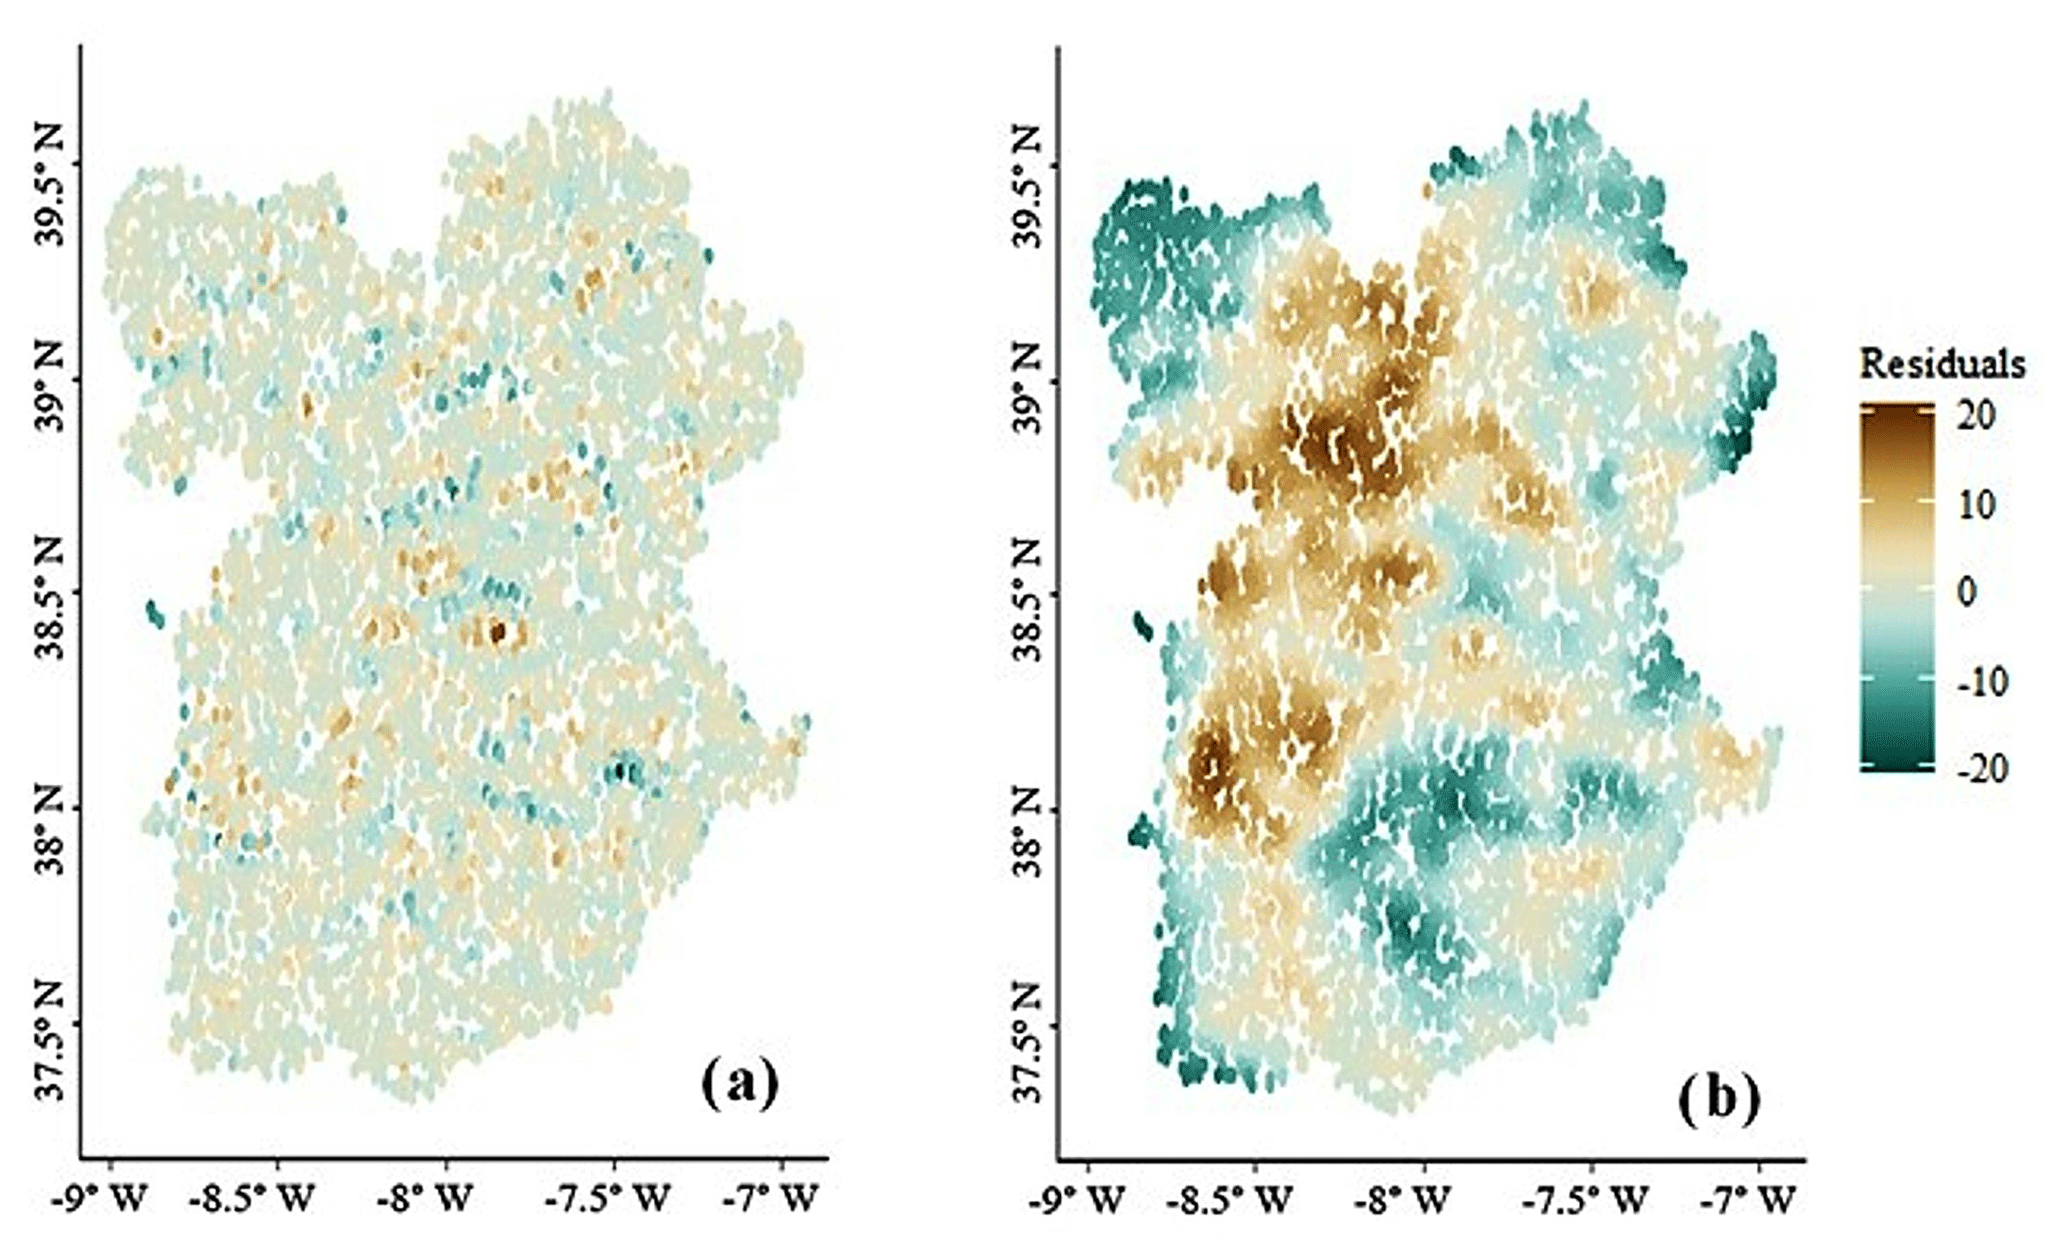
Figure 6Spatial distribution of model residuals from the fitting of the geographically weighted regression (a) and simple linear model (b).
The spatial distribution of the coefficients of GWR predictors is presented in Fig. 7. They were later used for the computation of the GDV suitability score for each data point (Eq. 6). The coefficient variability was 3 times higher for the Ai when compared to O4 (Fig. 8a), reaching 66 % and 22 %, respectively. For W, D and s, the coefficient variation was much lower, representing only about 6.2 %, 3.8 % and 1.2 % of the total variation observed in the coefficients, respectively. The remaining variables showed a median close to 0, and the O4 was the second, with higher variability, followed by the W. The coefficient median values were, respectively, −3.40, 0.29, −0.015, −0.018 and 0.022 for Ai, O4, W, D and s variables.
Table 3Comparison of adjusted R2 values and second-order Akaike information criterion (AICc) between the simple linear regression and the GWR model.
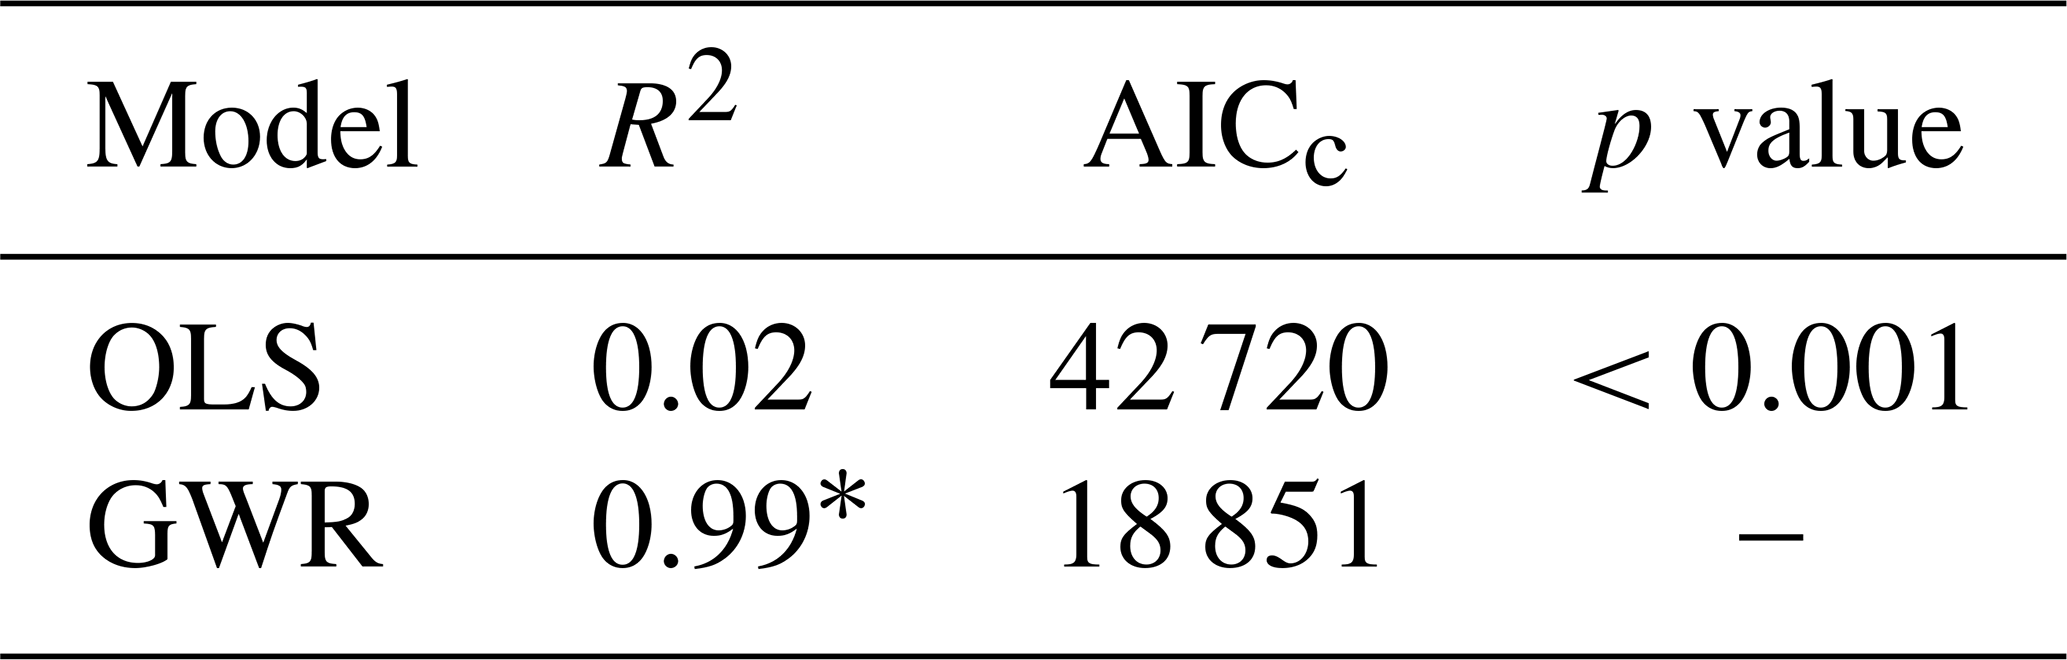
* Quasi-global R2.
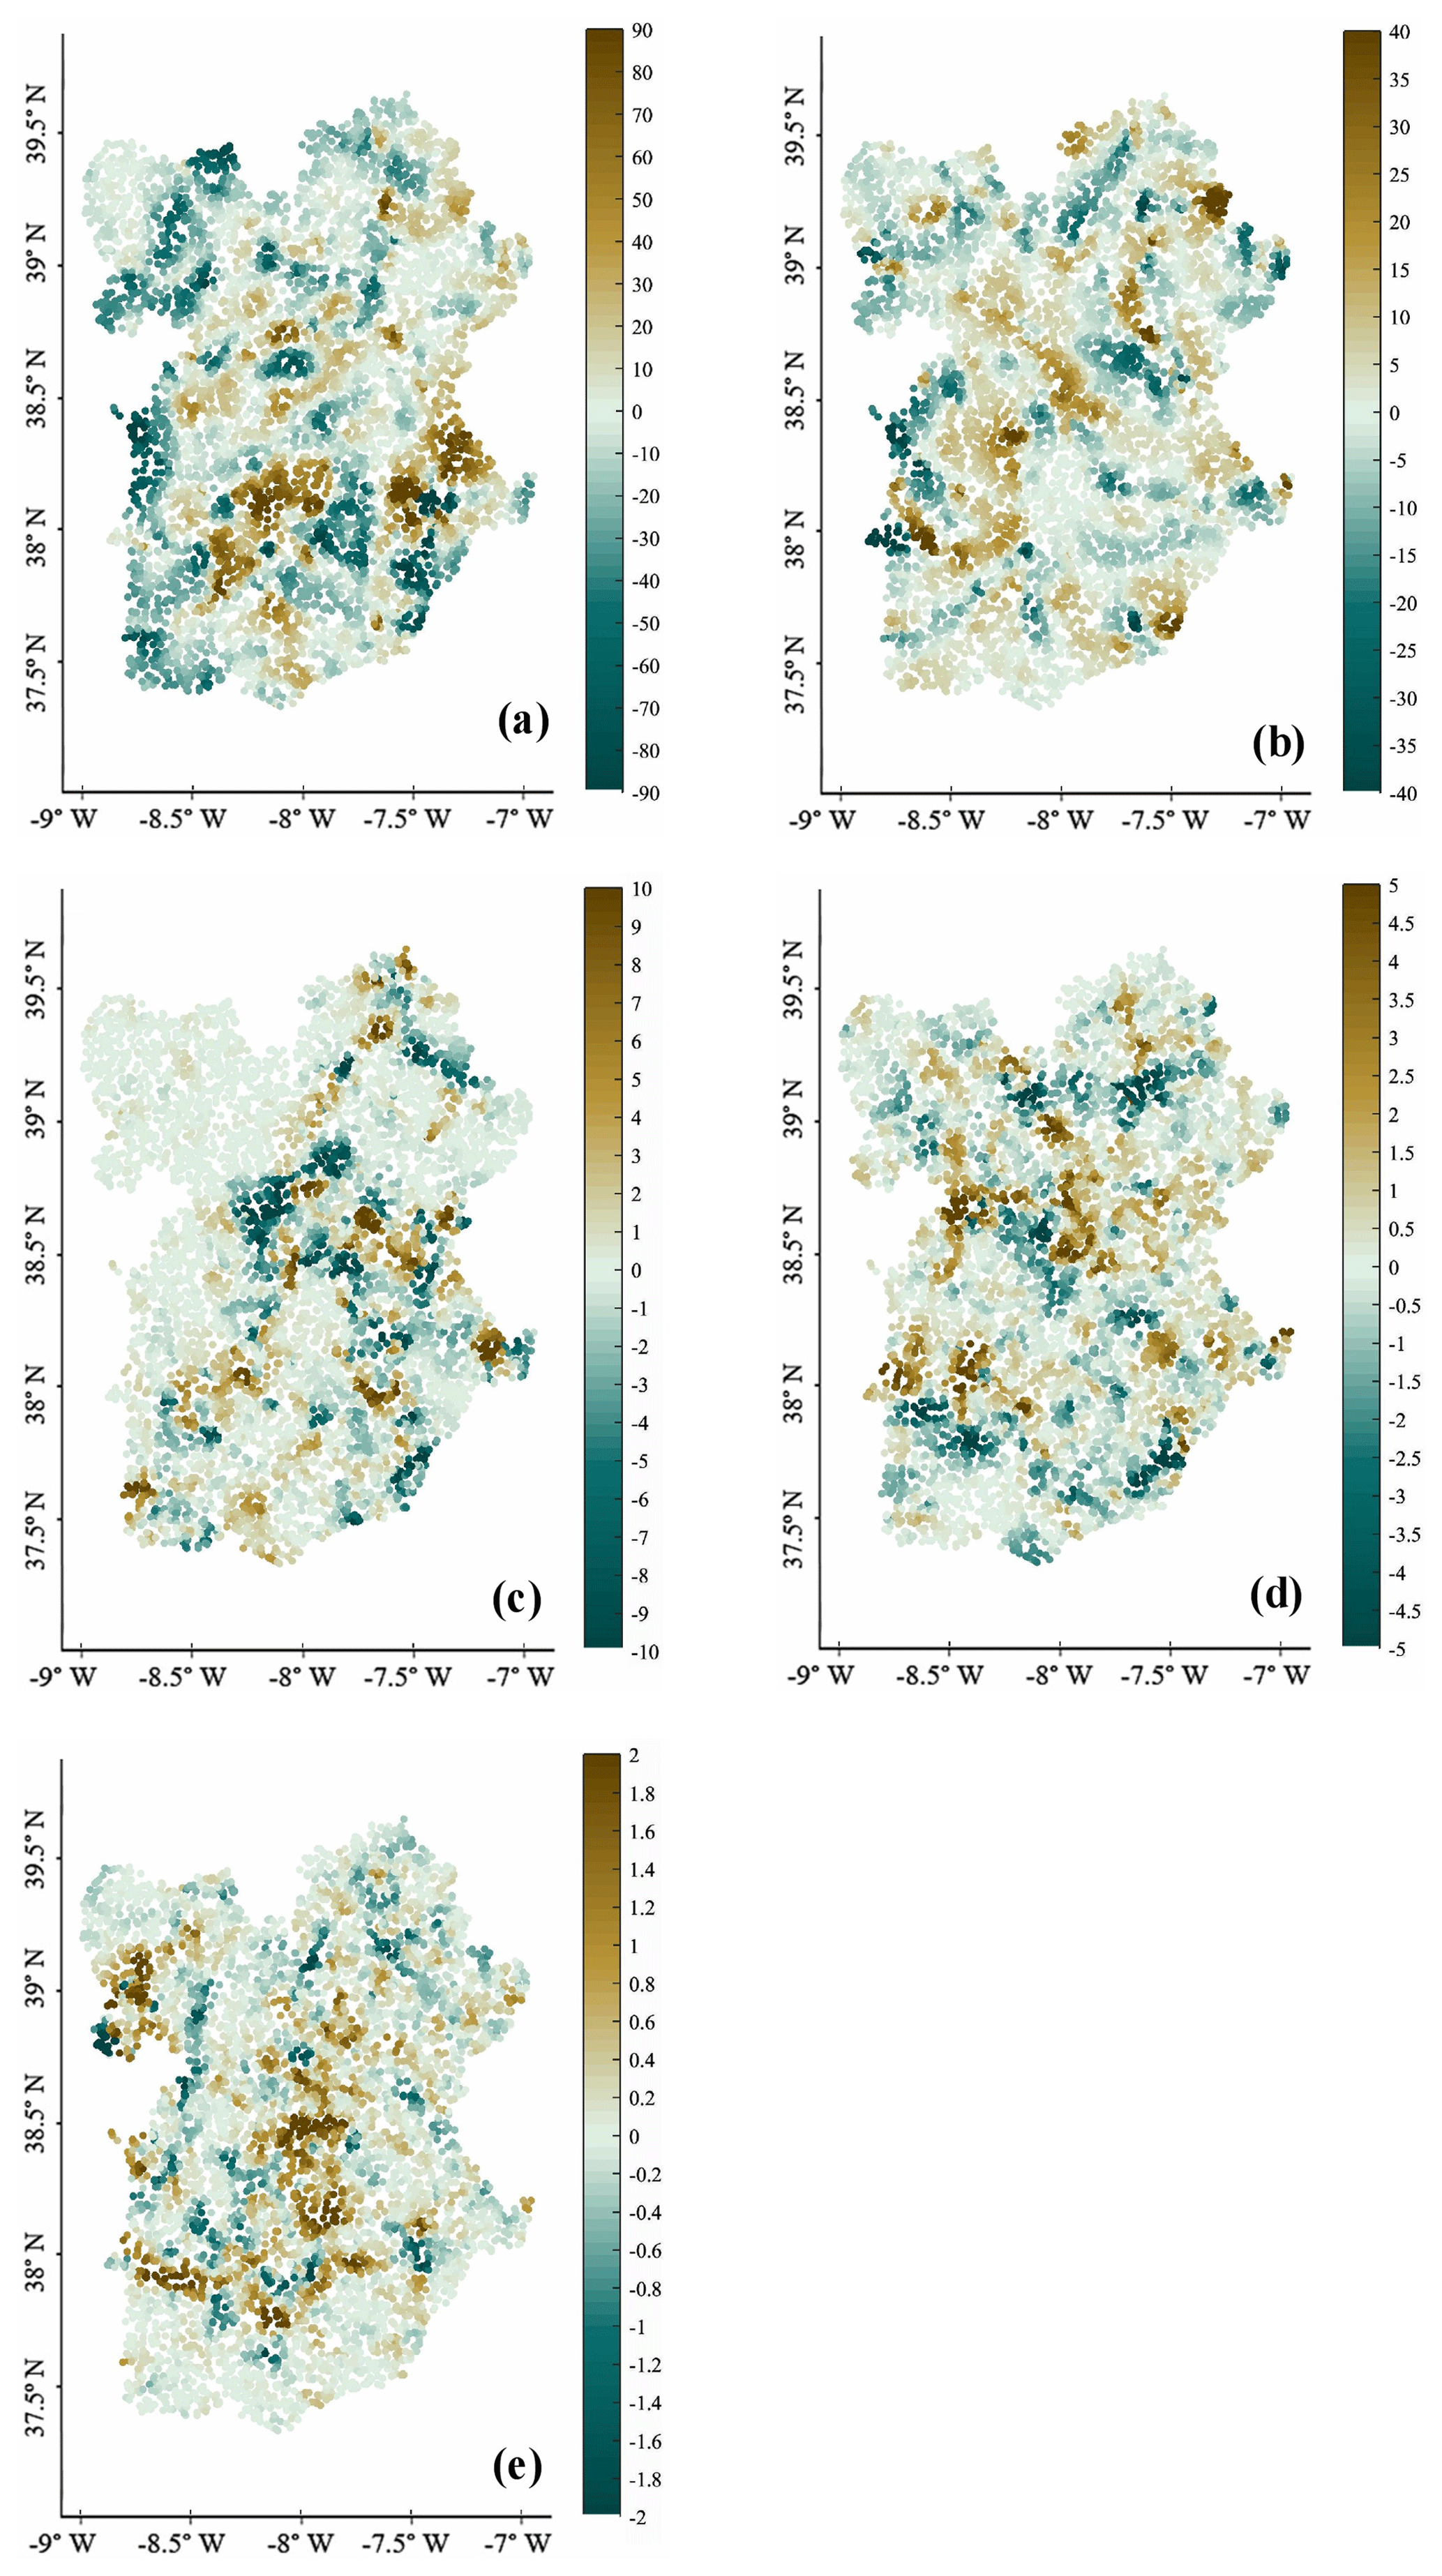
Figure 7Map of local model coefficients for each variable. (a) Aridity index, (b) ombrothermic index of the summer quarter and the immediately previous month, (c) groundwater depth, (d) drainage density, and (e) slope.
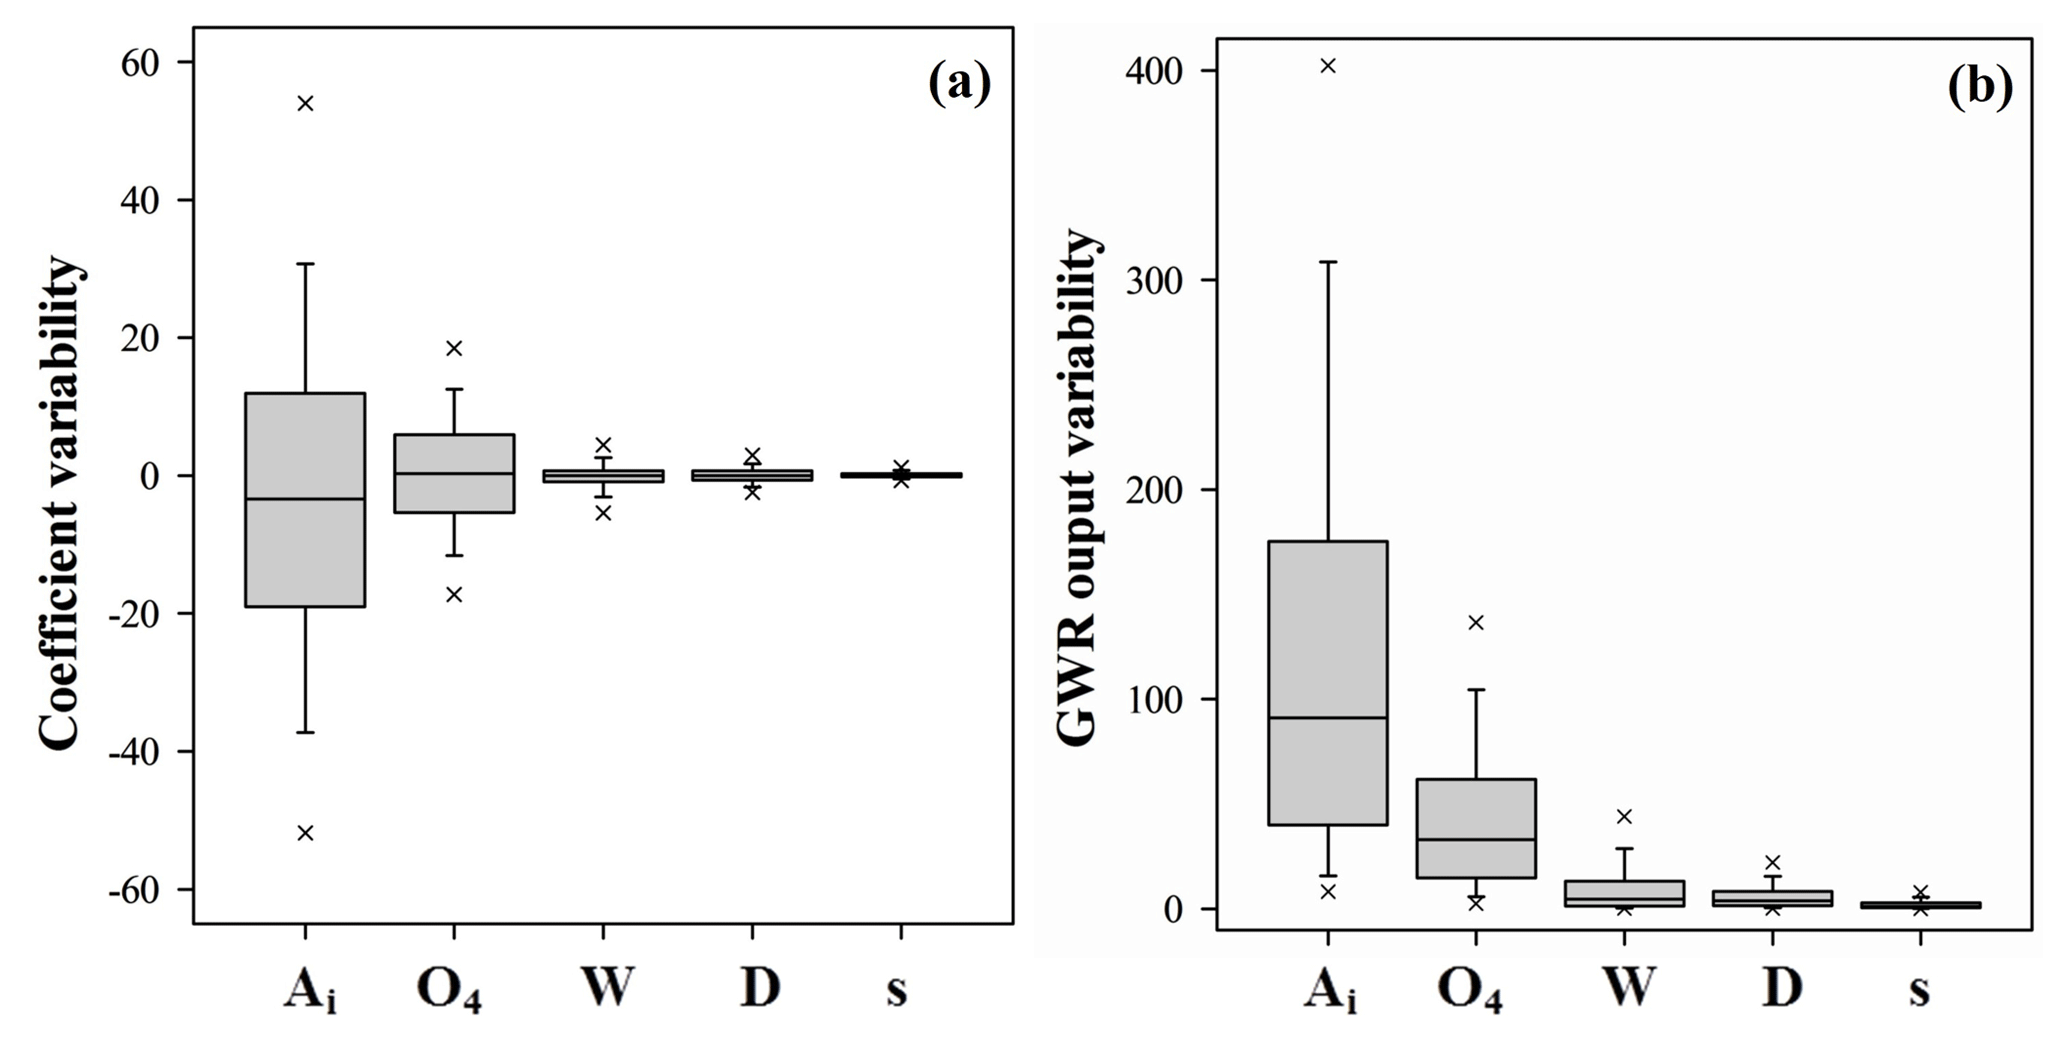
Figure 8Box plot of GWR model coefficient values for each predictor (a), and box plot of the GWR model outputs, corresponding to GDV's density after each of the predictors was disturbed for the sensitivity analysis (b). Ai stands for aridity index, O4 for the ombrothermic index of the hottest month of the summer quarter and the immediately previous month, W for the groundwater depth, D for the drainage density, and s for the slope. Error bars represent the 25th and 75th percentile, while crosses indicate the 95th percentile.
The distributions of negative coefficients were similar for Ai and the O4 variables (Fig. 7a and b), with lower values in the southern coastal area and in the Tagus river watershed. The highest absolute values were mostly found for Ai in the southern area of the Alentejo region and in smaller patches in the northern region. In the central and eastern areas of Alentejo, a higher weight of the groundwater depth coefficient could be found (Fig. 7c), approximately matching a higher influence of slope (Fig. 7e). The groundwater depth seemed to have almost no influence on GDV density in the Tagus river watershed, being expressed by coefficients that were mostly zero around the riverbed (Fig. 7c). The coefficient distribution of D and O4 shows some similarities, mostly in the center and southeast of Alentejo (Fig. 7d). Extreme values of O4 coefficients were mostly concentrated in the eastern part of the Tagus watershed and in the southern coastal area included in the Sado watershed. Slope coefficient values showed the lowest amplitude throughout the study area (Fig. 7e), with prevailing high positive values gathered mainly in the center of the study area and in the Tagus river watershed (northwest of the study center).
3.4 GDV suitability map
The classification of the five endorsed environmental predictors is presented in Table 4, and their respective maps are presented in Fig. B1. The rivers Tagus and Sado had an overall large impact on GDV's suitability for each predictor, with the exception of W. This is due to a higher water availability reflected by the values of O4 and D and lower slopes due to the alluvial plains of the Tagus river (Fig. B1b, d and e). Moreover, those regions presented higher humidity conditions (through analysis of the Ai in Fig. B1a) and groundwater depths outside the optimum range (Fig. B1c), therefore being less suitable for GDV. Optimal conditions for groundwater access were mainly gathered in the interior of the study region (Fig. B1c), with the exception of some confined aquifers in the northeast and southeast of the study region. Favorable slopes for GDV were mostly highlighted in the Tagus river basin area, where a good likelihood of interaction between GDV and groundwater could be identified (Fig. B1e).
Table 4Classification scores for each predictor. A score of 3 was given to highly suitable areas, and a score of 1 was given to less suitable areas for GDV.
The final map illustrating the suitability to GDV is shown in Fig. 9. The largest classified area (8787 km2) presented a very poor suitability to GDV, corresponding to approximately a quarter of the total study area (29 %). This percentage was followed closely by the moderate suitability to GDV, which occupied 26 % (8000 km2). Overall, the two less suitable classes (very poor and poor) represented 47 % of the study area, whilst the two best ones and the moderate class (very good, good and moderate) represented 53 %. Consequently, most of the study area showed moderate to high suitability to GDV. The very good and good suitability classes cover an arch from the most southern and northeastern area of the Alentejo region, passing through the Sado and southern Guadiana river basins and close to the coastal line at 38∘ N. Most of the center of the study area showed moderate to very good suitability to GDV, while the areas corresponding to the alluvial deposits of the Tagus river showed poor to very poor suitability.
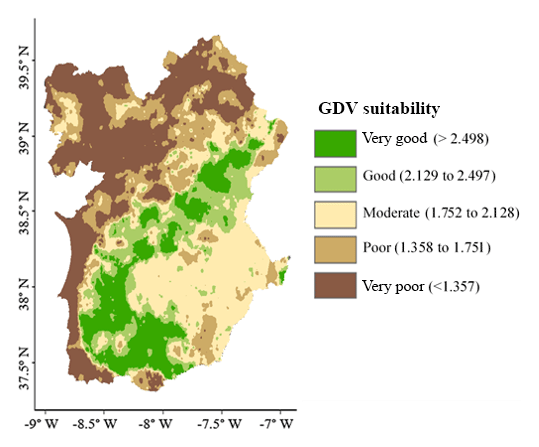
Figure 9Suitability map for groundwater-dependent vegetation.
The suitability to GDV in the Alentejo region was mainly driven by Ai, given that the highest coefficient variability was associated with the Ai predictor in the GWR model equation. Consequently a similar distribution pattern can be observed between the suitability map and the aridity index predictor (Figs. 4a and 9). Areas with good or very good suitability mostly matched areas of Ai with a score of 3, corresponding to aridity index values above 0.75 (Fig. B1a). On the other hand, the lowest suitability classes showed a good agreement with the lowest scores given to W (Fig. B1c), mostly in the coastal area and in the Tagus river basin.
3.5 Map evaluation
To evaluate the suitability map developed in the present study, the results were compared with the NDWI anomaly considering the month of June of the dry year of 2005 in the Alentejo area (Fig. 10). Both maps (Figs. 9 and 10) showed similar patterns, with higher presence of GDV satisfactorily matching areas with the lowest NDWI anomaly. From June to September in an extremely dry year, non-GDV plants can be expected to experience severe drought stress as in any regular summer period. Thus, those plants should show almost zero anomaly. In contrast, GDV plants coping well with usual summer drought can be expected to suffer an unusual stress under an extremely dry year, even having access to groundwater (Kurz-Besson et al., 2006, 2014; Otieno et al., 2006; David et al., 2013), with a negative impact of groundwater drawdown (Antunes et al., 2018). Therefore, GDV plants should show negative NDWI anomalies.

Figure 10Spatial patterns of NDWI anomaly values considering the months of June, July and August of the extremely dry year of 2005, in reference to the same months of the period 1999–2009, in the Alentejo region. Dark brown colors (corresponding to extreme negative NDWI anomaly values) indicate the vegetation that experienced the highest loss of water in leaves in summer 2005 compared to the reference period 1999–2009, while light brown colors show NDWI anomaly values very close to the usual vegetation moisture condition of the considered month.
The NDWI anomaly was mostly negative over the Alentejo territory, indicating a lower leaf water content in June and July 2005 than usual. The loss of water attributed to the extreme drought mostly matched geographical areas with the highest GDV suitability (Fig. 9). Water loss was less pronounced in the central area of the Alentejo region between the Guadiana and Sado river basins, where the vegetation is less dense (Fig. 3). Areas with NDWI anomaly values of zero (indicating no NDWI change) were mostly distributed on the coastal area of the Atlantic ocean or close to riverbeds, namely in the Tagus and Sado floodplains, matching areas of very poor suitability for GDV in Fig. 9.
Despite an overall good agreement, the adequation between the density, suitability and NDWI maps was not perfect. Indeed, some patches showing a high vegetation occurrence and density and large NDWI anomalies also matched an area of very poor suitability for GDV.
3.6 Sensitivity analysis
The sensitivity of the model in response to the perturbation of each input variable (Ai, O4, W, D and s) is presented in Fig. 11a to e. The overall sensitivity of the model is further presented in Fig. 11f. For any input variable, the model sensitivity (Fig. 11a to e) was higher where absolute values of local coefficients were also higher (Fig. 7a to e). The maximum impact on GDV's density, corresponding to the maximum output range observed after perturbation (Fig. 8b), was observed when perturbing the Ai, accounting for 66 % of the total variability. The second-highest impact was observed after perturbing the O4, corresponding to 22 %. The variability in the model outputs observed after perturbing the remaining variables W, D and s accounted for 7 %, 4 % and 1 % of the total accumulated variability, respectively (Fig. 8b). The highest variability in the GWR model output was mostly observed in the central part of the southern half of the Alentejo region as well as close to the main channels of the Guadiana and Tagus rivers (Fig. 11f). Furthermore, areas with higher model sensitivity (Fig. 11f) significantly matched higher model performance expressed by R2 (Fig. 5), assessed with a Kruskal–Wallis test (p<0.0001).

Figure 11Sensitivity analysis performed on the GWR model by perturbing one of the predictors while keeping the rest of the model equation constant. Graphics present the output range of GDV's density when the aridity index (a), the ombrothermic index (b), the groundwater depth (c), the drainage density (d) or the slope variable (e) was perturbed. The maximum possible range combining all predictors (f). The 95th percentile was used for the maximum value of the color bar for a better statistical representation of the spatial variability.
4.1 Modeling approach
The geographically weighted regression model has been used before in ecological studies (Li et al., 2016; Mazziotta et al., 2016) but never for the mapping of GDV, to our knowledge. This approach considerably improved the goodness of fit when compared with the linear model, with a coefficient of regression (R2) increasing from 0.02 to 0.99 at the global level and an obvious reduction of residual clustering. Despite those improvements, it has not been possible to completely eliminate the residual autocorrelation after fitting the GWR model.
Kernel density for the study area provided a strong indication of the presence and abundance of the tree species considered to be a GDV proxy for modeling. The Mediterranean cork woodlands dominate about 76 % of the Alentejo region (while only 7 % is covered by stone pine). In those systems, tree density is known to be a trade-off between climate drivers (Joffre et al., 1999; Gouveia and Freitas, 2008) and the need for space for pasture or cereal cultivation in the understory (Acácio and Holmgreen, 2014). In our study, the anthropologic management of agroforestry systems in the Alentejo region has not been taken into account. According to a recent study of Cabon et al. (2018) where thinning played an important role in Q. ilex density in a Mediterranean climate site, anthropologic management could, at least partially, explain the non-randomness of the residual distribution after GWR model fitting as well as the mismatches between the GDV and the NDWI evaluation maps.
Another explanation of the reminiscent autocorrelation after GWR fitting could be the lack of groundwater-dependent species in the model. For example, Pinus pinaster Aiton was excluded due to its more humid distribution in Portugal and due to conflicting conclusions taken from previous studies to pinpoint the species as a potential groundwater user (Bourke, 2004; Kurz-Besson et al., 2016). In addition, olive trees were also excluded, although the use of groundwater by an olive orchard has been recently proved (Ferreira et al., 2018), however with a weak contribution of groundwater to the daily root flow and thus with no significant impact of groundwater on the species physiological conditions.
Methods previously used by Doody et al. (2017) and Condesso de Melo et al. (2015) to map specific vegetation relied solely on expert opinion, e.g., the Delphi panel, to define weighting factors of environmental information for GIS multicriteria analysis. In our study, the GWR modeling approach was used to assess weighting factors for each environmental predictor in the study area to build a suitability map for the GDV in southern Portugal. This allowed an empirical determination of the local relevance of each environmental predictor in GDV distribution, thus avoiding the inevitable subjectivity of Delphi panels.
Also, by combining the GWR and GIS approaches, we believe that the final suitability map provides a more reliable indication of the higher likelihood for groundwater dependency and a safer appraisal of the relative contribution of groundwater by facultative deep-rooted phreatophytes species in the Alentejo region.
Modeling of the entire study area at a regional level did not provide satisfactory results. Therefore, we developed a general model varying locally according to local predictor coefficients. The local influence of each predictor was highly variable throughout the study area, especially for climatic predictors reflecting water availability and stress conditions. The application of the GWR model not only allowed for a localized approach, by decreasing the residual error and autocorrelation over the entire studied region, but also provided insights on how GDV's density can be explained by the main environmental drivers locally.
The GWR model appeared to be highly sensitive to coefficient fitting corresponding to a good model fit, as expected in a spatially varying model. As such, high coefficients are highly reliable in the GWR model in our study. Yet, the high spatial variability of local coefficients might reflect a weak physical meaning of the GWR model that challenges its direct application in other regions, even under similar climate conditions. Predictor coefficients showed a similar behavior in the spatial distribution of the coefficients. This was noticeable for the aridity index and the groundwater depth in the Tagus and Sado river basins. Groundwater depth had no influence on GDV's density in these areas, and similarly, the coefficient of the aridity index showed a negative effect of increased humidity on GDV's density. In addition, a cluster of low drainage density values matched these areas. Due to the lower variability and impact of the drainage density and slope on the GDV's density, these variables might not impact significantly this vegetation density in future climatic scenarios.
4.2 Suitability to groundwater-dependent vegetation
According to our results, more than half of the study area appeared to be suitable for GDV. However, one-fourth of the studied area showed lower suitability to GDV. The lower suitability to this vegetation in the more northern and western part of the studied area included the coastal area and the Tagus river basin. Those are the moist humid areas of the study area, where GDV is unlikely to rely on groundwater during the drought season because rainfall water stored in shallow soil horizons is mostly available.
The proxy species (cork oak, holm oak and stone pine) can grow perfectly under subhumid Mediterranean climate conditions without relying as much on groundwater to survive as in more xeric semi-arid areas (Abad Vinas et al., 2016). As facultative phreatophyte species, their presence and abundance is only an indication of a possible use of groundwater. The study provided by Pinto et al. (2013) showed that cork oak, for example, can perfectly thrive where very shallow groundwater is available while suffering drought stress where groundwater source is lower but still extracted by trees. Also, former studies have shown that in the extremely dry year of 2005, cork oak experienced a severe drought stress, close to the cavitation threshold, although its main water source was groundwater (David et al., 2013; Kurz-Besson et al., 2006, 2014). These findings can explain that part of the maximum density (Fig. 4) matches the area of very poor suitability for GDV (Fig. 9). Elsewhere, the better agreement between the two maps reflects the dominance of the aridity index on the vegetation's occurrence. Groundwater depth appeared to have a lower influence on GDV density than climate drivers, as reflected by the relative low magnitude of the W coefficient and outputs of our model outcomes. This surprisingly disagrees with our initial hypothesis because groundwater represents a notable proportion of the transpired water of deep-rooting phreatophytes, reaching up to 86 % of absorbed water during drought periods and representing about 30.5 % of the annual water absorbed by trees (David et al., 2013; Kurz-Besson et al., 2014). Nonetheless, this disagreement should be regarded cautiously due to the poor quality of piezometric data used and the complexity required for modeling the water table depths. Besides this, the linear relationship between water depth and topography applied to areas of undifferentiated geological type can be weakened by a complex nonlinear interaction between topography, aridity and subsurface conductivity (Condon and Maxell, 2015). Moreover, the high variability in geological media, topography and vegetation cover at the regional scale did not allow us to account for small changes in groundwater depth (<15 m), which has a huge impact on GDV suitability (Canadell et al., 1996; Stone and Kalisz, 1991). Indeed, a high spatial resolution of the hydrological database is essential in rigorously characterizing the spatial dynamics of groundwater depth between hydrographic basins (Lorenzo-Lacruz et al., 2017). Unfortunately, such resolution was not available for our study area.
The aridity and ombrothermic indices were the most important predictors of GDV density in the Alentejo region, according to our model outcomes. Our results agree with previous findings linking tree cover density and rooting depth to climate drivers such as aridity at a global scale (Zomer et al., 2009; Schenk and Jackson, 2002) and specifically for the Mediterranean oak woodland (Gouveia and Freitas, 2008; Joffre et al., 1999). Through previous studies showing the similarities in vegetation strategies to cope with water scarcity in the Mediterranean Basin (Vicente-Serrano et al., 2013) or the relationship between rooting depth and water table depth increasing with aridity at a global scale (Fan et al., 2017), we can admit that the most relevant climate drivers identified here are similarly important for mapping GDV in other semi-arid regions. In this study, the most important environmental variables that define GDV's density in a semi-arid region were identified, helping to fill the gap of knowledge for modeling this type of vegetation. However, the coefficients to be applied when modeling each variable need to be calculated locally due to their high spatial variability.
Temporal piezometric data would further help discriminate areas of optimal suitability to GDV, either during the wet or the dry seasons, because the seasonal trends in groundwater depth are essential under Mediterranean conditions. Investigative efforts should be invested to fill the gap either by improving the Portuguese piezometric monitoring network or by assimilating observations with remote-sensing products focused on soil moisture or groundwater monitoring. This has already been performed on a large regional scale such as that for GRACE satellite surveys, based on changes of Earth's gravitational field. So far, these technologies are not applicable to Portugal's scale, since the coarse spatial resolution of GRACE data only allows the monitoring of large reservoirs (Xiao et al., 2015).
4.3 Validation of the results
The understory of woodlands and the herbaceous layer of grasslands areas in southern Portugal usually end their annual life cycles in June (Paço et al., 2009), while the canopy of woody species is still fully active with maximum transpiration rates and photosynthetic activities (Kurz-Besson et al., 2014; David et al., 2007; Awada et al., 2003). This is an ideal period of the year to spot differential response of the canopy of woody species to extreme droughts events using satellite-derived vegetation indices (Gouveia et al., 2012).
The spatial patterns of the NDWI anomaly in June 2005 seem to indicate that the woody canopy showed a strong loss of canopy water in the areas where tree density and GDV suitability were higher (Figs. 3, 9 and 10). This occurred although trees minimized the loss of water in leaves with a strong stomatal limitation in response to drought (Kurz-Besson et al., 2014; Grant et al., 2010). In the most arid area of the region were holm oak is dominant but tree density is much lower, the NDWI anomaly was generally less negative, thus showing a lower water stress or higher canopy water content. Holm oak (Quercus ilex spp. rotundifolia) is well known as the most resilient species to dry and hot conditions in Portugal, due to its capacity to use groundwater, associated with a higher water use efficiency (David et al., 2007). Furthermore, the dynamics of the NDWI anomaly over the summer period (Figs. 10a–c) pointed out that the lower water stress status on the map is progressively spreading from the most arid areas to the milder ones from June to August 2005 despite the intensification of drought conditions. This endorses the idea that trees manage to cope with drought by relying on deeper water sources in response to drought, replenishing leaf water content despite the progression and intensification of drought conditions. Former studies support this statement by showing that groundwater uptake and hydraulic lift progressively took place after the onset of drought by promoting the formation of new roots reaching deeper soil layers and water sources, typically from July onwards, for cork oak in the Alentejo region (Kurz-Besson et al., 2006, 2014). Root elongation following a declining water table has also been reported in a review on the effect of groundwater fluctuations on phreatophyte vegetation (Naumburg et al., 2005).
Our results and the dynamics of NDWI over summer 2005 tend to corroborate the studies of Schenk and Jackson (2002) and Fan et al. (2017) by suggesting a larger and longer dependency of GDV on groundwater with higher aridity. Further investigation needs to be carried out across aridity gradients in Portugal and the Iberian Peninsula to fully validate this statement, though.
Overall, the map of suitability to GDV showed good agreement with the NDWI validation maps. The main areas showing good GDV suitability and highest NDWI anomalies are mostly matching in both maps. The good agreement between our GDV suitability maps and NDWI dynamic maps opens up the possibility of applying and extending the methodology to larger geographical areas such as the Iberian Peninsula and to the simulation of the impact of climate changes on the distribution of groundwater-dependent species in the Mediterranean Basin.
Simulations of future climate conditions based on RCP4.5 and RCP8.5 emission scenarios (Soares et al., 2015, 2017) predict a significant decrease in precipitation for the Guadiana basin and overall decrease for the southern region of Portugal by 2100. Agroforestry systems relying on groundwater resources, such as cork oak woodlands, may show a decrease in productivity and ecosystem services or even face sustainability failure. Many studies carried out on oak woodlands in Italy and Spain identified drought as the main driving factor of tree dieback and as the main climate warning threatening oak stand sustainability in the Mediterranean Basin (Gentilesca et al., 2017). An increase in aridity and drought frequency for the Mediterranean (Spinoni et al., 2017) will most probably induce a geographical shift of GDV vegetation toward milder and wetter climates (Lloret et al., 2004; Gonzalez, 2001).
4.4 Key limitations
The GWR modeling approach used to estimate weighting factors is mostly stochastic. Consequently, the large spatial variability and symmetrical fluctuations around zero (Fig. 8b) denote a weak physical meaning of the estimated coefficients, at least at the resolution chosen for the study. Also, the local nature of the regression coefficients makes the model difficult to directly apply in other regions, even with similar climate conditions, unless the methodology is properly fitted to local conditions and predictors.
With the methodology applied in this study, weighting factors can be easily evaluated solely from local and regional observations of the studied area. Nonetheless, the computation of model coefficients or expert opinion to assess weighting factors requires recurrent amendments, associated with updated environmental data, species distribution and revised expert knowledge (Doody et al., 2017).
The evolution of groundwater depth in response to climate change is difficult to model on a large scale based on piezometric observations because it requires excellent knowledge of the components and dynamics of water catchments. Therefore, a reliable estimation of the impact of climate change on GDV suitability in southern Portugal could only be performed in small-scale studies. However, the GWR model appeared to be much more sensitive to climate drivers than the other predictors, given that 88 % of the model output variability was covered by climate indices Ai and O4. Nevertheless, changes in climate conditions only represent part of the water resources shortage issue in the future. Global-scale changes in human populations and economic progress also control water demand and supply, especially in arid and semi-arid regions (Vörösmarty et al., 2000). A decrease in useful water resources for human supply can induce an even higher pressure on groundwater resources (Döll, 2009), aggravating the water table drawdown caused by climate change (Ertürk et al., 2014). Therefore, additional updates of the model should include human consumption of groundwater resources, identifying areas of higher population density or intensive farming. Future model updates should also account for the interaction of deep-rooted species with the surrounding understory species. In particular, shrubs surviving the drought period, which can benefit from the redistribution of groundwater by deep-rooted species (Dawson, 1993; Zou et al., 2005), should be accounted for.
Our results show a highly dominant contribution of water scarcity of the last 30 years (Aridity and Ombrothermic indices) to the density and suitability of deep-rooted groundwater-dependent species in southern Portugal. Therefore, in geographical regions of the world with similar semi-arid climate conditions (Csa according to Köppen–Geigen classification, Peel et al., 2007) and similar physiological responses of the groundwater-dependent vegetation (Vicente-Serrano et al., 2013), the use of the aridity and ombrothermic indices could be used as the first approximation to model and map the deep-rooted phreatophyte species and the evolution of their distribution in response to climate changes. The contribution of groundwater depth was lower than initially expected; however, it might be underestimated due to the poor quality of the piezometric network, especially in the central area of the studied region.
The current pressure applied by human consumption of water sources has reinforced the concern on the future of economic activities dependent on groundwater resources. To address this issue, several countries have developed national strategies for the adaptation of water sources for agriculture and forests against climate change, including Portugal (FAO, 2007). In addition, local drought management as a long-term adaptation strategy has been one of the proposals by Iglesias et al. (2007) to reduce the climate change impact on groundwater resources in the Mediterranean. The preservation of Mediterranean agroforestry systems, such as cork oak woodlands and the recently associated P. pinea species, is of great importance due to their high socioeconomic value and their supply of valuable ecosystem services (Bugalho et al., 2011). Management policies in the long-term should account for groundwater resources monitoring, accompanied by defensive measures to ensure that agroforestry system sustainability and economical income from these Mediterranean ecosystems are not greatly and irreversibly threatened.
Our present study, and novel methodology, provides an important tool to help in delineating priority areas of action for species and groundwater management, at the regional level, to avoid the decline of productivity and cover density of the agroforestry systems of southern Portugal. This is important for guaranteeing the sustainability of the economical income for stakeholders linked to the agroforestry sector in that area. Furthermore, mapping vulnerable areas at a small scale (e.g., by hydrological basin), where reliable groundwater depth information is available, should provide further insights for stakeholders to promote local actions to mitigate climate change's impact on GDV.
Based on the methodology applied in this work, future predictions on GDV suitability, according to the RCP4.5 and RCP8.5 emission scenarios, will be shortly introduced, providing guidelines for future management of these ecosystems in the allocation of water resources.
Original and processed data are available upon request. Interactive maps will be soon accessible on WebGIS at the following URL: https://smart.campus.ciencias.ulisboa.pt/portal/ (last access: August 2019).
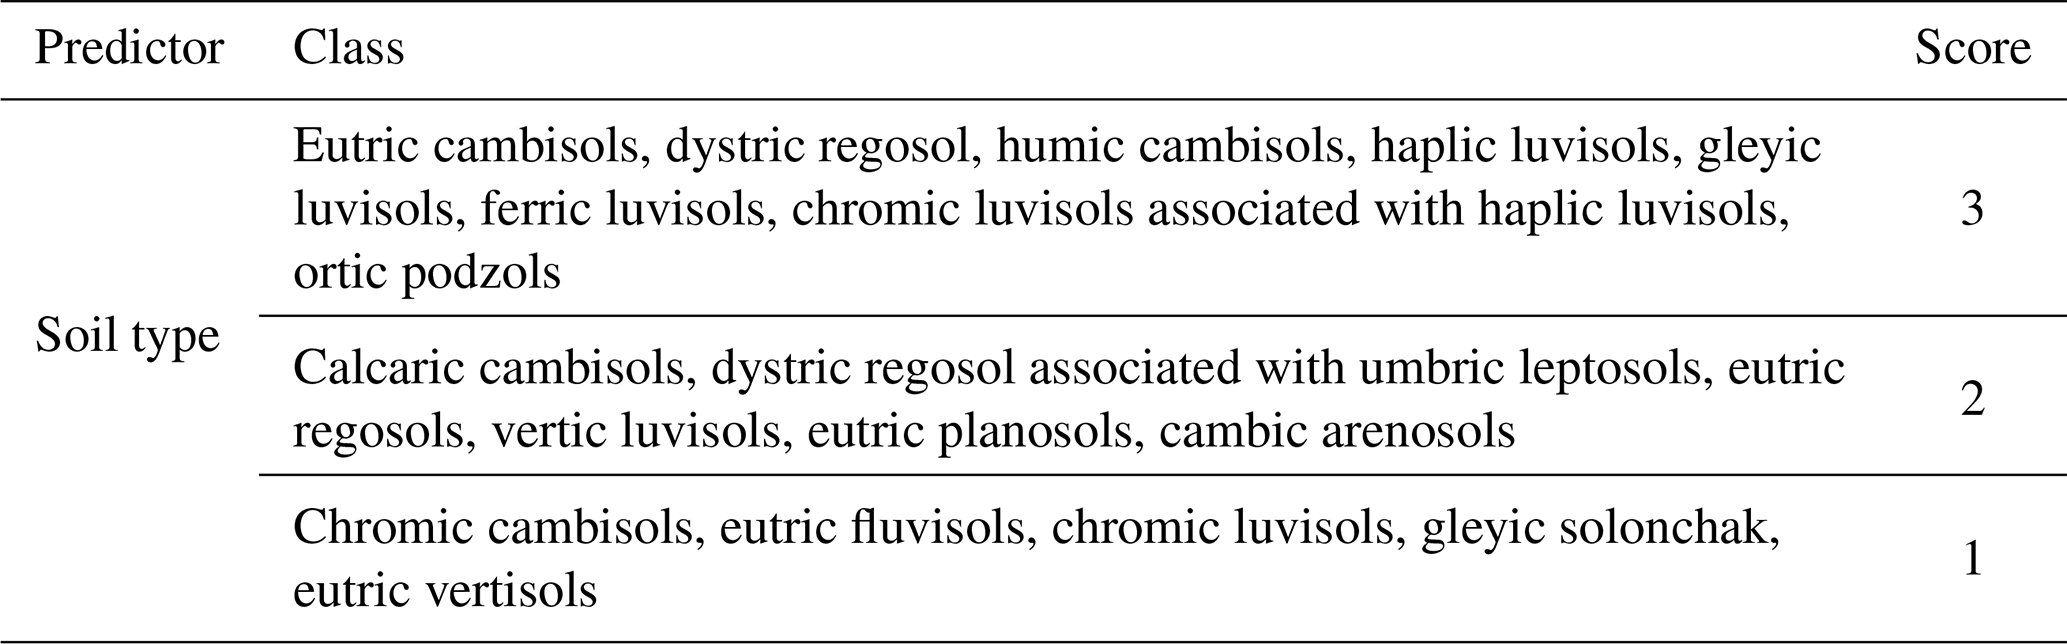
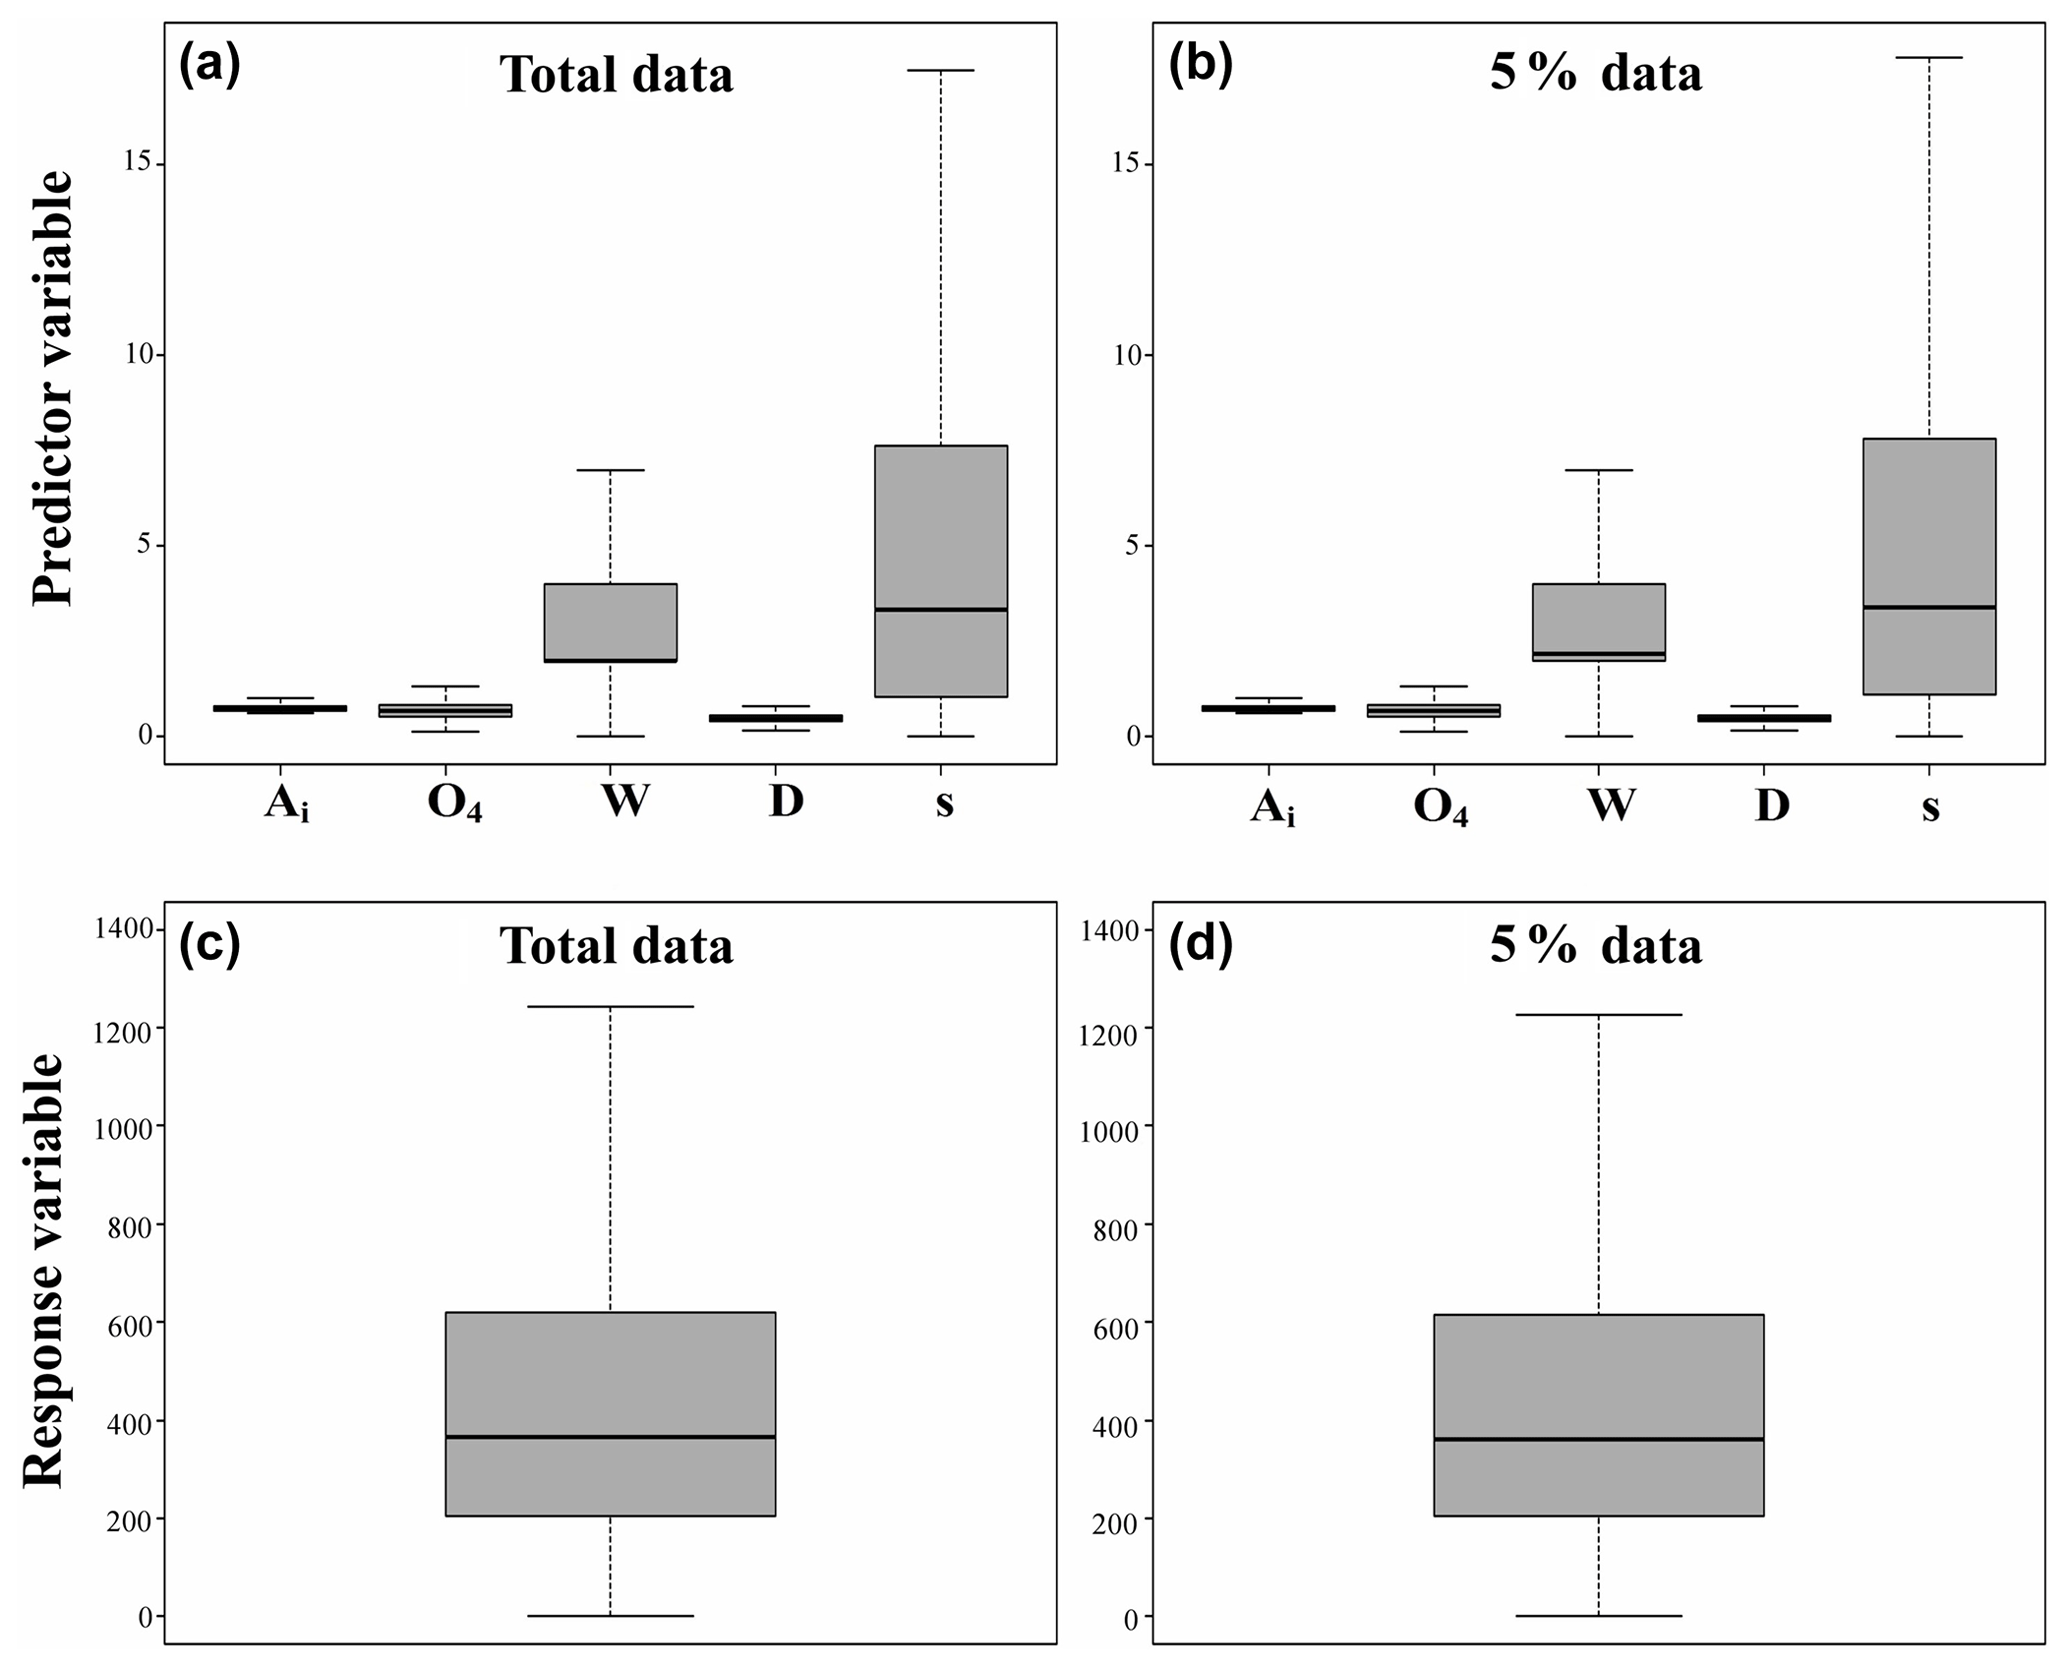
Figure A1Box plot of the main predictors for the final geographically weighted regression model fitting (a, b) and the response variable (c, d) for the total data (a, c) and for the 5 % subsample (b, d).
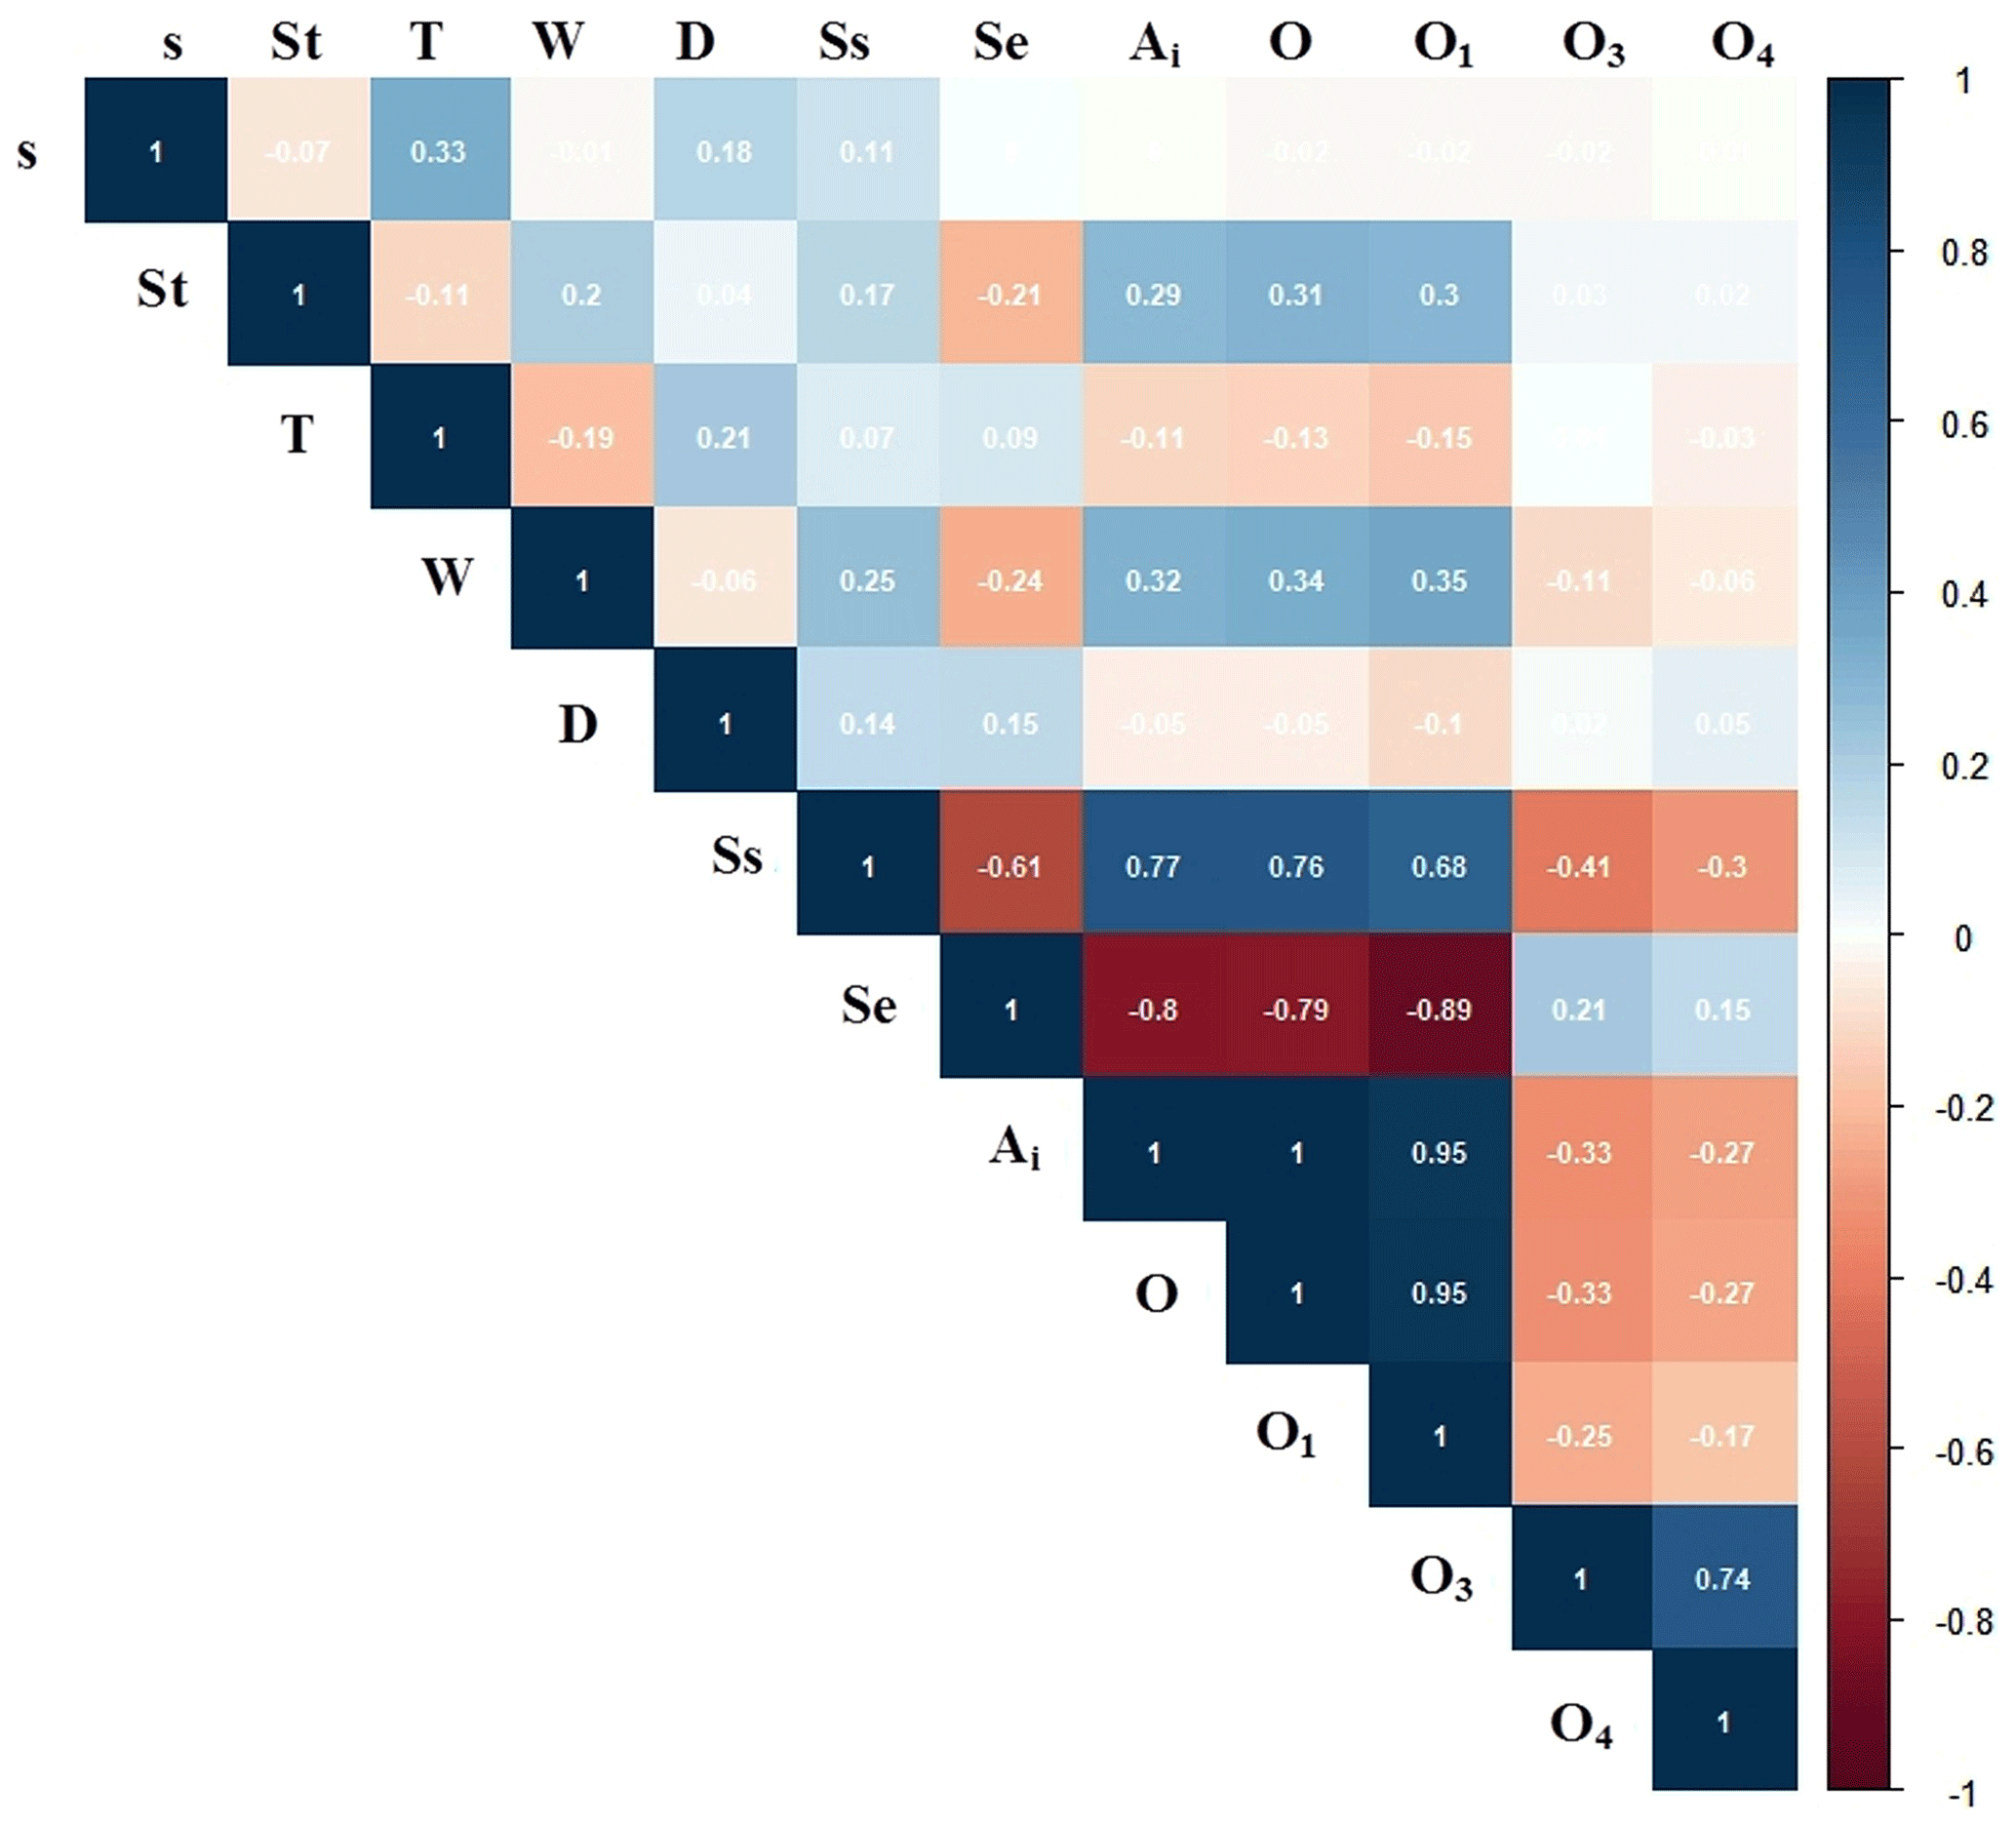
Figure A2Correlation plot between all environmental variables expected to affect the presence of the groundwater-dependent vegetation. O1, O3 and O4 are ombrothermic indices of, respectively, the hottest month of the summer quarter, the summer quarter, and the summer quarter and the immediately previous month; O is the annual ombrothermic index, SPEIe and SPEIs are, respectively, the number of months with extreme and severe standardized precipitation evapotranspiration index; Ai is aridity index; W is groundwater depth; D is the drainage density; T is thickness; and St refers to soil type.
Table A2Correlations between predictor variables and principal component axis. The most important predictors for each axis (when squared correlation is above 0.3) are showed in bold. The cumulative proportion of variance explained by each principal component axis is shown at the bottom of the table. s is slope; Ai is aridity index; O, O1, O3 and O4 are ombrothermic indices of, respectively, the year, the hottest month of the summer quarter, the summer quarter, and the summer quarter and the immediately previous month; SPEIs and SPEIe are, respectively, the number of months with severe and extreme standardized precipitation evapotranspiration index; W is groundwater depth; D is the drainage density; St refers to soil type; and T is thickness.
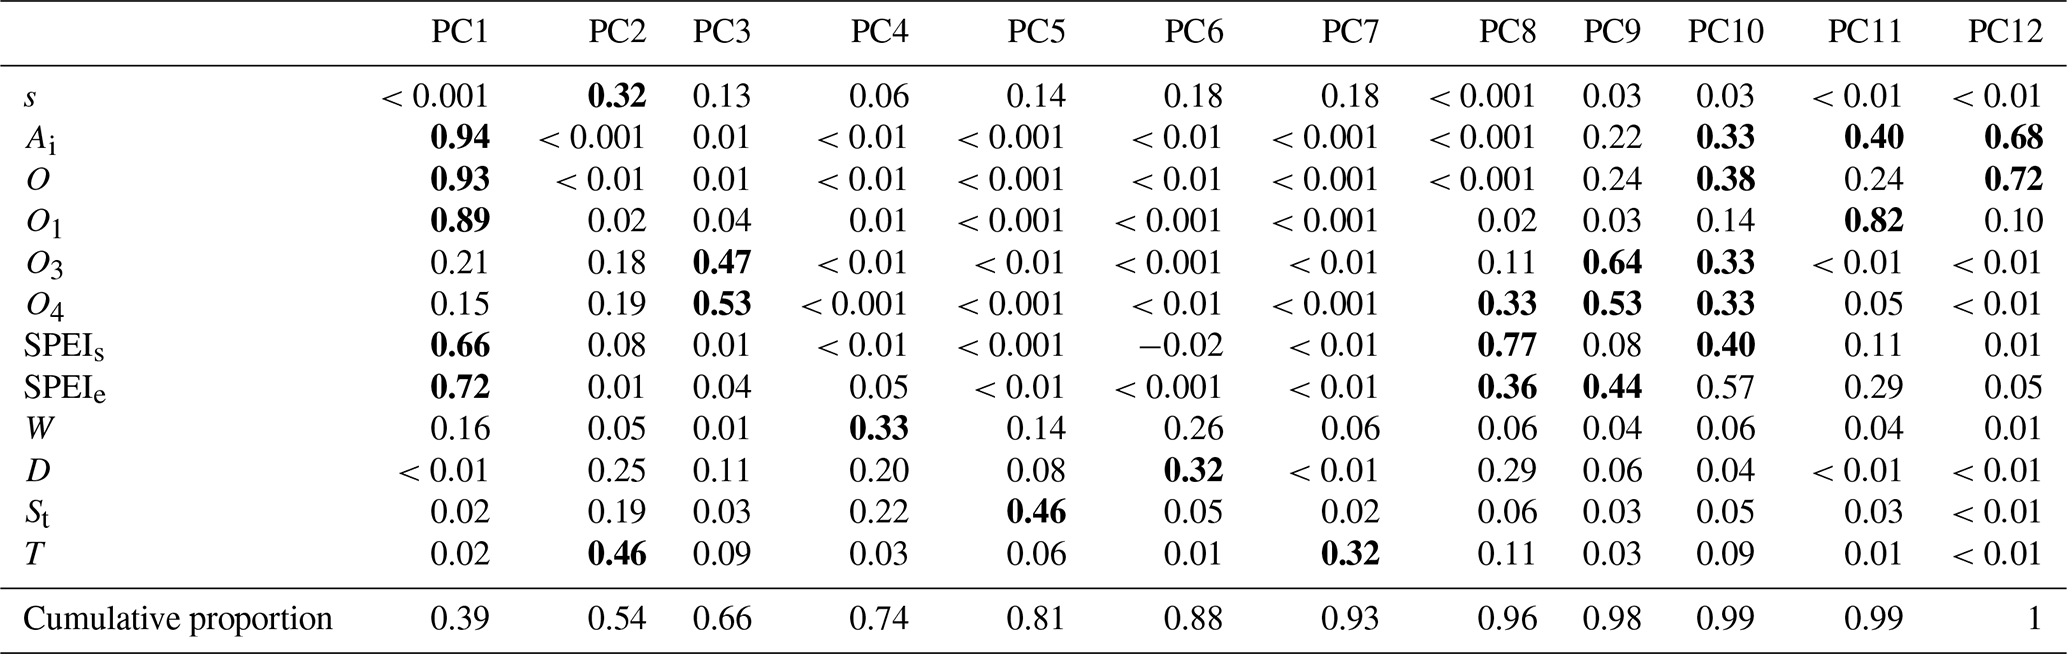
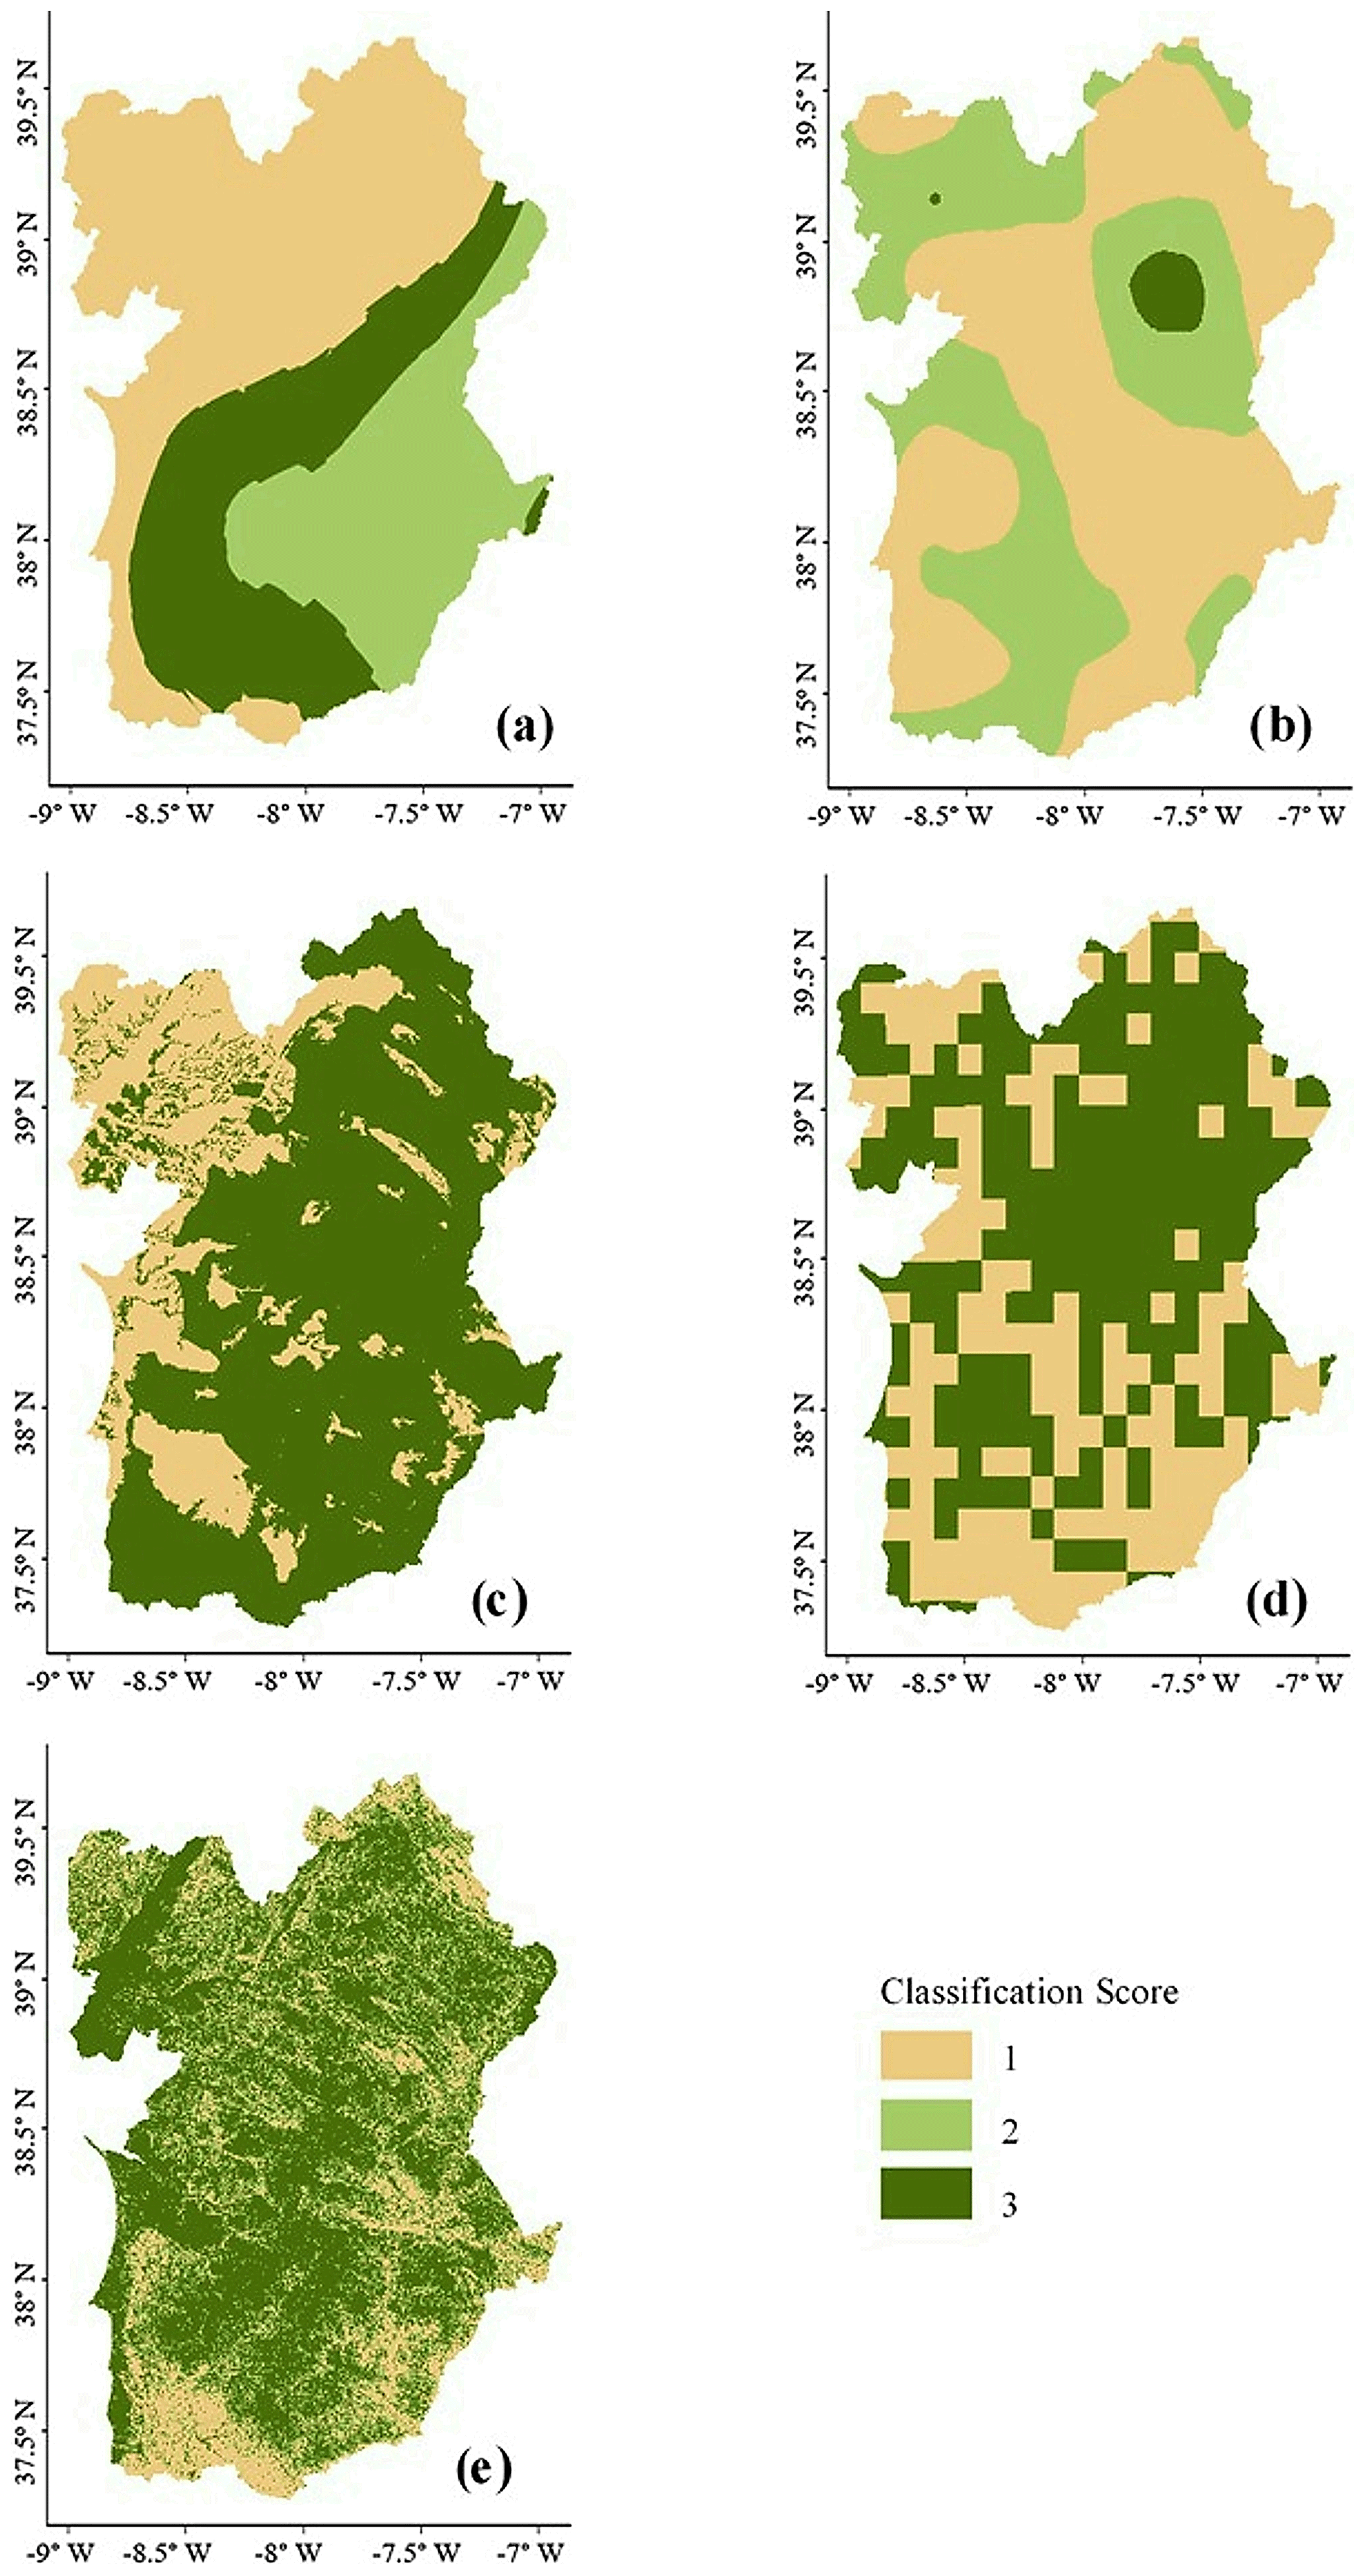
Figure B1Predictor maps after score reclassification. (a) Aridity index, (b) ombrothermic index of the summer quarter and the immediately previous month, (c) groundwater depth, (d) drainage density, and (e) slope.
IGM gathered and processed GIS information, built the models and most of the resulting maps, and prepared the paper. JN, FM and MCM provided GIS hydrological datasets and were responsible for the mapping of groundwater depth. RC and PS provided meteorological data and supervised the computation of climate indices and the modeling approach. CG provided and processed NDWI datasets. CKB processed GIS information of forest inventories and performed the sensitivity analysis. She supervised data processing and the writing of the paper, and gathered contributions from all co-authors. Each co-author was involved in the interpretation of the results and revisions of the paper.
The authors declare that they have no conflict of interest.
The authors acknowledge the E-OBS dataset from the EU-FP6 project ENSEMBLES (http://ensembles-eu.metoffice.com, last access: 31 March 2017) and the data providers in the ECA & D project (http://www.ecad.eu, last access: 31 March 2017). The authors also wish to acknowledge the ASTER GDEM data product, courtesy of the NASA Land Processes Distributed Active Archive Center (LP DAAC), USGS Earth Resources Observation and Science (EROS) Center, Sioux Falls, South Dakota (https://lpdaac.usgs.gov/data_access/data_pool, last access: 15 June 2017). We are grateful to ICNF for sharing the inventory database performed in 2010 in continental Portugal. We also thank Cristina Catita, Ana Russo and Patrícia Páscoa for the advice and helpful comments as well as Ana Bastos for the elaboration of the satellite datasets of the vegetation index NDWI and Miguel Nogueira for the insights on model sensitivity analysis. We are very grateful to Eric Font for the useful insights on soil properties. Inês Gomes Marques and research activities were supported by the Portuguese National Foundation for Science and Technology (FCT) through the PIEZAGRO project (PTDC/AAG-REC/7046/2014). This publication was also supported by FCT – project UID/GEO/50019/2019 – Instituto Dom Luiz. The authors further thank the reviewers and editor for helpful comments and suggestions on an earlier version of the paper.
This research has been supported by the Portuguese National Foundation for Science and Technology (FCT; grant no. PTDC/AAG-REC/7046/2014).
This paper was edited by Miriam Coenders-Gerrits and reviewed by three anonymous referees.
Abad Vinas, R., Caudullo, G., Oliveira, S., and de Rigo, R.: Pinus pinaster in Europe: distribution, habitat, usage and threats, in: European Atlas of Forest Tree Species, edited by: San-Miguel-Ayanz, J., de Rigo, M. A., Caudullo, G., and Durant Houston, T., EU, Luxembourg, 2016.
Acácio, V. and Holmgreen, M.: Pathways for resilience in Mediterranean cork oak land use systems, Ann. Forest Sci., 71, 5–13, https://doi.org/10.1007/s13595-012-0197-0, 2014.
AghaKouchak, A., Farahmand, A., Melton, F. S., Teixeira, J., Anderson, M. C., Wardlow, B. D., and Hain C. R.: Remote sensing of drought: Progress, challenges and opportunities, Rev. Geophys., 53, 452–480, https://doi.org/10.1002/2014RG000456, 2015.
Aksoy, E., Louwagie, G., Gardi, C., Gregor, M., Schröder, C., and Löhnertz, M.: Assessing soil biodiversity potentials in Europe, Sci. Total Environ., 589, 236–249, https://doi.org/10.1016/j.scitotenv.2017.02.173, 2017.
Anderson, L. O., Malhi, Y., Aragão, L. E. O. C., Ladle, R., Arai, E., Barbier, N., and Phillips, O.: Remote sensing detection of droughts in Amazonian forest canopies, New Phytol., 187, 733–750, https://doi.org/10.1111/j.1469-8137.2010.03355.x, 2010.
Anselin, L., Ibnu, S., and Youngihn, K.: GeoDa: An Introduction to Spatial Data Analysis, Geogr. Anal., 38, 5–22, 2006.
Antunes, C., Chozas, S., West, J., Zunzunegui, M., Barradas, M. C. D., Vieira, S., and Máguas, C.: Groundwater drawdown drives ecophysiolog-ical adjustments of woody vegetation in a semi-arid coastal ecosystem, Global Change Biol., https://doi.org/10.1111/gcb.14403, in press, 2018.
APA: Plano de Gestão da Região Hidrográfica do Tejo. Parte 2 – Caracterização e Diagnóstico da Região Hidrográfica do Tejo e Ribeiras do Oeste (RH5), available at: https://apambiente.pt/_zdata/Politicas/Agua/PlaneamentoeGestao/PGRH/2016-2021/PTRH5A/PGRH5A_Parte2.pdf (last access: August 2019), 2016.
ARH Alentejo: Plano de Gestão das Bacias Hidrográficas integradas na RH7 – Parte 2, Ministério da Agricultura, Mar, Ambiente e Ordenamento do Território, Alentejo, Portugal, available at: https://sniambgeoviewer.apambiente.pt/Geodocs/geoportaldocs/Planos/PGRH7/VolumeI_Relatorio-CParte2-CTomo1-CP2_T1A_RH7_VF.pdf (last access: August 2019), 2012a.
ARH Alentejo: Planos de Gestão das Bacias Hidrográficas integradas na RH6 – Parte 2, Ambiente e Ordenamento do Território, Alentejo, Portugal, available at: https://sniambgeoviewer.apambiente.pt/Geodocs/geoportaldocs/Planos/PGRH6/RT_Especifico_CE-CRTE_RH6_T1A.pdf (last access: August 2019), 2012b.
Asrar, G. (Ed.): Estimation of plant-canopy attributes from spectral reflectance measurements, in: Theory and Applications of Optical Remote Sensing, John Wiley, New York, 252–296, 1989.
Autoridade Florestal Nacional and Ministério da Agricultura do Desenvolvimento Rural e das Pescas: 6∘ Inventário Florestal Nacional, Instituto da Conservação da Natureza e das Florestas, Lisboa, 2010.
Awada, T., Radoglou, K., Fotelli, M. N., and Constantinidou, H. I. A.: Ecophysiology of seedlings of three Mediterranean pine species in contrasting light regimes, Tree Physiol., 23, 33–41, 2003.
Barata, L. T., Saavedra, A., Cortez, N., and Varennes, A.: Cartografia da espessura efectiva dos solos de Portugal Continental, LEAF/ISA/ULisboa, available at: http://epic-webgis-portugal.isa.utl.pt/ (last access: 5 November 2017), 2015.
Barbero, M., Loisel, R., and Quézel, P.: Biogeography, ecology and history of Mediterranean Quercus ilex ecosystems, in: Quercus ilex L. ecosystems: function, dynamics and management, edited by: Romane, F. and Terradas, J., Springer Netherlands, Dordrecht, 19–34, 1992.
Barbeta, A. and Peñuelas, J.: Increasing carbon discrimination rates and depth of water uptake favor the growth of Mediterranean evergreen trees in the ecotone with temperate deciduous forests, Global Change Biol., 23, 5054–5068, https://doi.org/10.1111/gcb.13770, 2017.
Barbeta, A., Mejía-Chang, M., Ogaya, R., Voltas, J., Dawson, T. E., and Peñuelas, J.: The combined effects of a long-term experimental drought and an extreme drought on the use of plant-water sources in a Mediterranean forest, Global Change Biol., 21, 1213–1225, https://doi.org/10.1111/gcb.12785, 2015.
Barron, O. V., Emelyanova, I., Van Niel, T. G., Pollock, D., and Hodgson, G.: Mapping groundwater-dependent ecosystems using remote sensing measures of vegetation and moisture dynamics, Hydrol. Process., 28, 372–385, https://doi.org/10.1002/hyp.9609, 2014.
Beguería, S. and Vicente-Serrano, S. M.: SPEI: Calculation of the Standardized Precipitation-Evapotranspiration Index, R package version 1.6, available at: https://cran.r-project.org/web/packages/SPEI/index.html (last access: 29 July 2019), 2013.
Bertrand, R., Riofrío-Dillon, G., Lenoir, J., Drapier, J., de Ruffray, P., Gégout, J. C., and Loreau, M.: Ecological constraints increase the climatic debt in forests, Nat. Commun., 7, 12643, https://doi.org/10.1038/ncomms12643, 2016.
Bivand, R. S. and Yu, D.: spgwr: Geographically Weighted Regression, available at: https://cran.r-project.org/package=spgwr (last access: 18 January 2019), 2017.
Bivand, R. S., Pebesma, E. J., and Gómez-Rubio, V.: Applied Spatial Data Analysis with R, edited by: Gentleman, G. P. R. and Hornik, K., Springer, New York, 2008.
Bourke, L.: Growth trends and water use efficiency of Pinus pinaster Ait. in response to historical climate and groundwater trends on the Gnangara Mound, Western Australia, available at: http://ro.ecu.edu.au/theses_hons/141 (last access: 29 January 2018), 2004.
Bugalho, M. N., Plieninger, T., and Aronson, J.: Open woodlands: a diversity of uses (and overuses), in Cork oak woodlands on the edge, edited by: Aronson, J., Pereira, J. S., and Pausas, J. G., Island Press, Washington, D.C., 33–48, 2009.
Bugalho, M. N., Caldeira, M. C., Pereira, J. S., Aronson, J., and Pausas, G.: Mediterranean cork oak savannas require human use to sustain biodiversity and ecosystem services, Front. Ecol. Environ., 9, 278–286, https://doi.org/10.1890/100084, 2011.
Bussotti, F., Ferrini, F., Pollastrini, M., and Fini, A.: The challenge of Mediterranean sclerophyllous vegetation under climate change: From acclimation to adaptation, Environ. Exp. Bot., 103, 80–98, https://doi.org/10.1016/j.envexpbot.2013.09.013, 2013.
Cabon, A., Mouillot, F., Lempereur, M., Ourcival, J.-M., Simioni, G., and Limousin, J.-M.: Thinning increases tree growth by delaying drought-induced growth cessation in a Mediterranean evergreen oak coppice, Forest Ecol. Manage., 409, 333–342, https://doi.org/10.1016/j.foreco.2017.11.030, 2018.
Canadell, J., Jackson, R., Ehleringer, J., Mooney, H. A., Sala, O. E., and Schulze, E.-D.: Maximum rooting depth of vegetation types at the global scale, Oecologia, 108, 583–595, https://doi.org/10.1007/BF00329030, 1996.
Ceccato, P., Gobron, N., Flasse, S., Pinty, B., and Tarantola, S.: Designing a spectral index to estimate vegetation water content from remote sensing data: Part 1. Theoretical approach, Remote Sens. Environ., 82, 188–197, 2002a.
Ceccato, P., Flasse, S., and Gregoire, J.: Designing a spectral index to estimate vegetation water content from remote sensing data: Part 2. Validation and applications, Remote Sens. Environ., 82, 198–207, 2002b.
Cerasoli, S., Silva, F. C., and Silva, J. M. N.: Temporal dynamics of spectral bioindicators evidence biological and ecological differences among functional types in a cork oak open woodland, Int. J. Biometeorol., 60, 813–825, https://doi.org/10.1007/s00484-015-1075-x, 2016.
Chambel, A., Duque, J., and Nascimento, J.: Regional Study of Hard Rock Aquifers in Alentejo, South Portugal: Methodology and Results, in: IAH-Selected Papers on Hydrogeology Series, 1st Edn., edited by: Jirí Krásný, J. and Sharp, J. M., CRC Press, Taylor & Francis Group, London, 9, 73–93, https://doi.org/10.1201/9780203945650, 2007.
Chaves, M. M., Maroco, J. P., and Pereira, J. S.: Understanding plant responses to drought – from genes to the whole plant, Funct. Plant Biol., 30, 239–264, 2003.
Coelho, I. S. and Campos, P.: Mixed Cork Oak-Stone Pine Woodlands in the Alentejo Region of Portugal, in: Cork Oak Woodlands on the Edge – Ecology, Adaptive Management, and Restoration, edited by: Aronson, J., Pereira, J. S., Uli, J., and Pausas, G., Island Press, Washington, 153–159, 2009.
Condesso de Melo, M. T., Nascimento, J., Silva, A. C., Mendes, M. P., Buxo, A., and Ribeiro, L.: Desenvolvimento de uma metodologia e preparação do respetivo guia metodológico para a identificação e caracterização, a nível nacional, dos ecossistemas terrestres dependentes das águas subterrâneas (ETDAS), Relatório de projeto realizado para a Agência Portuguesa do Ambiente (APA), Lisboa, 2015.
Condon, L. E. and Maxell, R. M.: Water resources research, Water Resour. Res., 51, 6602–6621, https://doi.org/10.1002/2014WR016259, 2015.
Costa, A., Madeira, M., and Oliveira, C.: The relationship between cork oak growth patterns and soil, slope and drainage in a cork oak woodland in Southern Portugal, Forest Ecol. Manage., 255, 1525–1535, https://doi.org/10.1016/j.foreco.2007.11.008, 2008.
David, T. S., Ferreira, M. I., Cohen, S., Pereira, J. S., and David, J. S.: Constraints on transpiration from an evergreen oak tree in southern Portugal, Agr. Forest Meteorol., 122, 193–205, https://doi.org/10.1016/j.agrformet.2003.09.014, 2004.
David, T. S., Henriques, M. O., Kurz-Besson, C., Nunes, J., Valente, F., Vaz, M., Pereira, J. S., Siegwolf, R., Chaves, M. M., Gazarini, L. C., and David, J. S.: Water-use strategies in two co-occurring Mediterranean evergreen oaks: surviving the summer drought, Tree Physiol., 27, 793–803, https://doi.org/10.1093/treephys/27.6.793, 2007.
David, T. S., Pinto, C. A., Nadezhdina, N., Kurz-Besson, C., Henriques, M. O., Quilhó, T., Cermak, J., Chaves, M. M., Pereira, J. S., and David, J. S.: Root functioning, tree water use and hydraulic redistribution in Quercus suber trees: A modeling approach based on root sap flow, Forest Ecol. Manage., 307, 136–146, https://doi.org/10.1016/j.foreco.2013.07.012, 2013.
Dawson, T. E.: Hydraulic lift and water use by plants: implications for water balance, performance and plant-plant interactions, Oecology, 95, 565–574, 1993.
del Castillo, J., Comas, C., Voltas, J., and Ferrio, J. P.: Dynamics of competition over water in a mixed oak-pine Mediterranean forest: Spatio-temporal and physiological components, Forest Ecol. Manage., 382, 214–224, https://doi.org/10.1016/j.foreco.2016.10.025, 2016.
de Sarmento, E. M. and Dores, V.: The performance of the forestry sector and its relevance for the portuguese economy, Rev. Port. Estud. Reg., 34, 35–50, 2013.
Dinis, C. O.: Cork oak (Quercus suber L.) root system: a structural-functional 3D approach, PhD Thesis, Universidade de Évora Évora, Portugal, 2014.
Döll, P.: Vulnerability to the impact of climate change on renewable groundwater resources: a global- scale assessment, Environ. Res. Lett., 4, 35006–35012, https://doi.org/10.1088/1748-9326/4/3/035006, 2009.
Doody, T. M., Barron, O. V., Dowsley, K., Emelyanova, I., Fawcett, J., Overton, I. C., Pritchard, J. L., Van Dijk, A. I. J. M., and Warren, G.: Continental mapping of groundwater dependent ecosystems: A methodological framework to integrate diverse data and expert opinion, J. Hydrol. Reg. Stud., 10, 61–81, https://doi.org/10.1016/j.ejrh.2017.01.003, 2017.
Dresel, P. E., Clark, R., Cheng, X., Reid, M., Terry, A., Fawcett, J., and Cochrane, D.: Mapping Terrestrial Groundwater Dependent Ecosystems: Method Development and Example Output, Victoria Department of Primary Industries, Melbourne, VIC, 66 pp., 2010.
Duque-Lazo, J., Navarro-Cerrillo, R. M., and Ruíz-Gómez, F. J.: Assessment of the future stability of cork oak (Quercus suber L.) afforestation under climate change scenarios in Southwest Spain, Forest Ecol. Manage., 409, 444–456, https://doi.org/10.1016/j.foreco.2017.11.042, 2018.
Eamus, D., Froend, R., Loomes, R., Hose, G., and Murray, B.: A functional methodology for determining the groundwater regime needed to maintain the health of groundwater-dependent vegetation, Aust. J. Bot., 54, 97–114, https://doi.org/10.1071/BT05031, 2006.
Eamus, D., Zolfaghar, S., Villalobos-Vega, R., Cleverly, J., and Huete, A.: Groundwater-dependent ecosystems: Recent insights from satellite and field-based studies, Hydrol. Earth Syst. Sci., 19, 4229–4256, https://doi.org/10.5194/hess-19-4229-2015, 2015.
Ertürk, A., Ekdal, A., Gürel, M., Karakaya, N., Guzel, C., and Gönenç, E.: Evaluating the impact of climate change on groundwater resources in a small Mediterranean watershed, Sci. Total Environ., 499, 437–447, https://doi.org/10.1016/j.scitotenv.2014.07.001, 2014.
Evaristo, J. and McDonnell, J. J.: Prevalence and magnitude of groundwater use by vegetation: a global stable isotope meta-analysis, Sci. Rep., 7, 44110, https://doi.org/10.1038/srep44110, 2017.
Fan, Y., Macho, G. M., Jobbágy, E. G., Jackson, R. B., and Otero-Casal, C.: Hydrologic regulation of plant rooting depth, P. Natl Acad. Sci. USA, 114, 10572–10577, https://doi.org/10.1073/pnas.1712381114, 2017.
FAO: Adaptation to climate change in agriculture, forestry and fisheries: Perspective, framework and priorities, FAO, Rome, 2007.
FAO, IIASA, ISRIC, ISS-CAS, and JRC: Harmonized World Soil Database (version 1.1), Laxenburg, Austria, 2009.
Fernandes, N. P.: Ecossistemas Dependentes de Água Subterrânea no Algarve – Contributo para a sua Identificação e Caracterização, University of Algarve, Faro, 2013.
Ferreira, M. I., Green, S., Conceição, N., and Fernández, J.-E.: Assessing hydraulic redistribution with the compensated average gradient heat-pulse method on rain-fed olive trees, Plant Soil, 425, 21–41, https://doi.org/10.1007/s11104-018-3585-x, 2018.
Filella, I. and Peñuelas, J.: Indications of hydraulic lift by Pinus halepensis and its effects on the water relations of neighbour shrubs, Biol. Plant., 47, 209–214, https://doi.org/10.1023/B:BIOP.0000022253.08474.fd, 2004.
Gao, B. C.: NDWI – A normalized difference water index for remote sensing of vegetation liquid water from space, Remote Sens. Environ., 58, 257–266, 1996.
Gentilesca, T., Camarero, J. J., Colangelo, M., Nolè, A., and Ripullone, F.: Drought-induced oak decline in the western Mediterranean region: an overview on current evidences, mechanisms and management options to improve forest resilience, iForest, 10, 796–806, https://doi.org/10.3832/ifor2317-010, 2017.
Giorgi, F. and Lionello, P.: Climate change projections for the Mediterranean region, Global Planet. Change, 63, 90–104, https://doi.org/10.1016/j.gloplacha.2007.09.005, 2008.
Gond, V., Bartholome, E., Ouattara, F., Nonguierma, A., and Bado, L.: Surveillance et cartographie des plans d'eau et des zones humides et inondables en regions arides avec l'instrument VEGETATION embarqué sur SPOT-4, Int. J. Remote Sens., 25, 987–1004, 2004.
Gonzalez, P.: Desertification and a shift of forest species in the West African Sahel, Clim. Res., 17, 217–228, 2001.
Gouveia, A. and Freitas, H.: Intraspecific competition and water use efficiency in Quercus suber: evidence of an optimum tree density?, Trees, 22, 521–530, 2008.
Gouveia, C., Trigo, R. M., and DaCamara, C. C.: Drought and vegetation stress monitoring in Portugal using satellite data, Nat. Hazards Earth Syst. Sci., 9, 185–195, https://doi.org/10.5194/nhess-9-185-2009, 2009.
Gouveia, C. M., Bastos, A., Trigo, R. M., and DaCamara, C. C.: Drought impacts on vegetation in the pre- and post-fire events over Iberian Peninsula, Nat. Hazards Earth Syst. Sci., 12, 3123–3137, https://doi.org/10.5194/nhess-12-3123-2012, 2012.
Grant, O. M., Tronina, L., Ramalho, J. C., Besson, C. K., Lobo-do-Vale, R., Pereira, J. S., Jones, H. G., and Chaves, M. M.: The impact of drought on leaf physiology of Quercus suber L. trees: comparison of an extreme drought event with chronic rainfall reduction, J. Exp. Bot., 61, 4361–4371, https://doi.org/10.1093/jxb/erq239, 2010.
Griffith, D. A. (Ed.): Spatial Autocorrelation, Elsevier Inc, Texas, 2009.
Grossiord, C., Sevanto, S., Dawson, T. E., Adams, H. D., Collins, A. D., Dickman, L. T., Newman, B. D., Stockton, E. A., and Mcdowell, N. G.: Warming combined with more extreme precipitation regimes modifies the water sources used by trees, New Phytol., 213, 584–596, https://doi.org/10.1111/nph.14192, 2016.
Gu, Y., Brown, J. F., Verdin, J. P., and Wardlow, B.: A five-year analysis of MODIS NDVI and NDWI for grassland drought assessment over the central Great Plains of the United States, Geophys. Res. Lett., 34, L06407, https://doi.org/10.1029/2006GL029127, 2007.
Guisan, A. and Thuiller, W.: Predicting species distribution: Offering more than simple habitat models, Ecol. Lett., 8, 993–1009, https://doi.org/10.1111/j.1461-0248.2005.00792.x, 2005.
Hagolle, O., Lobo, A., Maisongrande, P., Duchemin, B., and De Pereira, A.: Quality assessment and improvement of SPOT/VEGETATION level temporally composited products of remotely sensed imagery by combination of VEGETATION 1 and 2 images, Remote Sens. Environ., 94, 172–186, 2005.
Haylock, M. R., Hofstra, N., Klein Tank, A. M. G., Klok, E. J., Jones, P. D., and New, M.: A European daily high-resolution gridded data set of surface temperature and precipitation for 1950–2006, J. Geophys. Res.-Atmos., 113, D20119, https://doi.org/10.1029/2008JD010201, 2008.
Hernández-Santana, V., David, T. S., and Martínez-Fernández, J.: Environmental and plant-based controls of water use in a Mediterranean oak stand, Forest Ecol. Manage., 255, 3707–3715, https://doi.org/10.1016/j.foreco.2008.03.004, 2008.
Horton, J. L. and Hart, S. C.: Hydraulic lift: a potentially important ecosystem process, Tree, 13, 232–235, https://doi.org/10.1016/S0169-5347(98)01328-7, 1998.
Howard, J. and Merrifield, M.: Mapping groundwater dependent ecosystems in California, PLoS One, 5, e11249, https://doi.org/10.1371/journal.pone.0011249, 2010.
Hu, X., Zhang, L., Ye, L., Lin, Y., and Qiu, R.: Locating spatial variation in the association between road network and forest biomass carbon accumulation, Ecol. Indic., 73, 214–223, https://doi.org/10.1016/j.ecolind.2016.09.042, 2017.
Huntsinger, L. and Bartolome, J. W.: Ecological dynamics of Quercus dominated woodlands in California and southern Spain: A state transition model, Vegetation, 99–100, 299–305, 1992.
ICNF: IFN6 – Áreas dos usos do solo e das espécies florestais de Portugal continental, Resultados preliminares, Lisboa, 2013.
Iglesias, A., Garrote, L., Flores, F., and Moneo, M.: Challenges to manage the risk of water scarcity and climate change in the Mediterranean, Water Resour. Manage., 21, 775–788, https://doi.org/10.1007/s11269-006-9111-6, 2007.
Joffre, R., Rambal, S., and Ratte, J. P.: The dehesa system of southern Spain and Portugal as a natural ecosystem mimic, Agrofor. Syst., 45, 57–79, https://doi.org/10.1023/a:1006259402496, 1999.
Kühn, I.: Incorporating spatial autocorrelation may invert observed patterns, Div. Dist., 13, 66–69, https://doi.org/10.1111/j.1472-4642.2006.00293.x, 2007.
Kurz-Besson, C., Otieno, D., Lobo Do Vale, R., Siegwolf, R., Schmidt, M., Herd, A., Nogueira, C., David, T. S., David, J. S., Tenhunen, J., Pereira, J. S., and Chaves, M.: Hydraulic lift in cork oak trees in a savannah-type Mediterranean ecosystem and its contribution to the local water balance, Plant Soil, 282, 361–378, https://doi.org/10.1007/s11104-006-0005-4, 2006.
Kurz-Besson, C., Lobo-do-Vale, R., Rodrigues, M. L., Almeida, P., Herd, A., Grant, O. M., David, T. S., Schmidt, M., Otieno, D., Keenan, T. F., Gouveia, C., Mériaux, C., Chaves, M. M., and Pereira, J. S.: Cork oak physiological responses to manipulated water availability in a Mediterranean woodland, Agr. Forest Meteorol., 184, 230–242, https://doi.org/10.1016/j.agrformet.2013.10.004, 2014.
Kurz-Besson, C., Lousada, J. L., Gaspar, M. J., Correia, I. E., David, T. S., Soares, P. M. M., Cardoso, R. M., Russo, A., Varino, F., Mériaux, C., Trigo, R. M., and Gouveia, C. M.: Effects of recent minimum temperature and water deficit increases on Pinus pinaster radial growth and wood density in southern Portugal, Front. Plant Sci., 7, 1170, https://doi.org/10.3389/fpls.2016.01170, 2016.
Li, Y., Jiao, Y., and Browder, J. A.: Modeling spatially-varying ecological relationships using geographically weighted generalized linear model: A simulation study based on longline seabird bycatch, Fish. Res., 181, 14–24, https://doi.org/10.1016/j.fishres.2016.03.024, 2016.
Lloret, F., Siscart, D., and Dalmases, C.: Canopy recovery after drought dieback in holm-oak Mediterranean forests of Catalonia (NE Spain), Global Change Biol., 10, 2092–2099, https://doi.org/10.1111/j.1365-2486.2004.00870.x, 2004.
López, B., Sabaté, S., Ruiz, I., and Gracia, C.: Effects of Elevated CO2 and Decreased Water Availability on Holm-Oak Seedlings in Controlled Environment Chambers, in: Impacts of Global Change on Tree Physiology and Forest Ecosystems: Proceedings of the International Conference on Impacts of Global Change on Tree Physiology and Forest Ecosystems, held 26–29 November 1996, Wageningen, the Netherlands, edited by: Mohren, G. M. J., Kramer, K., and Sabaté, S., Springer Netherlands, Dordrecht, 125–133, 1997.
Lorenzo-Lacruz, J., Garcia, C., and Morán-Tejeda, E.: Groundwater level responses to precipitation variability in Mediterranean insular aquifers, J. Hydrol., 552, 516–531, https://doi.org/10.1016/j.jhydrol.2017.07.011, 2017.
Lowry, C. S. and Loheide, S. P.: Groundwater-dependent vegetation: Quantifying the groundwater subsidy, Water Resour. Res., 46, W06202, https://doi.org/10.1029/2009WR008874, 2010.
Lv, J., Wang, X. S., Zhou, Y., Qian, K., Wan, L., Eamus, D., and Tao, Z.: Groundwater-dependent distribution of vegetation in Hailiutu River catchment, a semi-arid region in China, Ecohydrology, 6, 142–149, https://doi.org/10.1002/eco.1254, 2013.
Maki, M., Ishiahra, M., and Tamura, M.: Estimation of leaf water status to monitor the risk of forest fires by using remotely sensed data, Remote Sens. Environ., 90, 441–450, 2004.
Mazziotta, A., Heilmann-Clausen, J., Bruun, H. H., Fritz, Ö., Aude, E., and Tøttrup, A. P.: Restoring hydrology and old-growth structures in a former production forest: Modelling the long-term effects on biodiversity, Forest Ecol. Manage., 381, 125–133, https://doi.org/10.1016/j.foreco.2016.09.028, 2016.
Mckee, T. B., Doesken, N. J., and Kleist, J.: The relationship of drought frequency and duration to time scales, in: AMS 8th Conference on Applied Climatology, 17–22 January 1993, California, 179–184, 1993.
Mendes, M. P., Ribeiro, L., David, T. S., and Costa, A.: How dependent are cork oak (Quercus suber L.) woodlands on groundwater? A case study in southwestern Portugal, Forest Ecol. Manage., 378, 122–130, https://doi.org/10.1016/j.foreco.2016.07.024, 2016.
Middleton, N., Thomas, D. S. G., and Programme, U. N. E.: World atlas of desertification, UNEP, London, 1992.
Miller, G. R., Chen, X., Rubin, Y., Ma, S., and Baldocchi, D. D.: Groundwater uptake by woody vegetation in a semiarid oak savanna, Water Resour. Res., 46, W10503, https://doi.org/10.1029/2009WR008902, 2010.
Ministério da Agricultura do Mar do Ambiente e do Ordenamento do Território: Estratégia de Adaptação da Agricultura e das Florestas às Alterações Climáticas, Lisbon, 2013.
Montero, G., Ruiz-Peinado, R., Candela, J. A., Canellas, I., Gutierrez, M., Pavon, J., Alonso, A., Rio, M. D., Bachiller, A., and Calama, R.: El pino pinonero (Pinus pinea L.) en Andalucia, in: Ecologia, distribucion y selvicultura, edited by: Montero, G., Candela, J. A., and Rodriguez, A., Consejeria de Medio Ambiente, Junta de Andalucia, Sevilla, 2004.
Moran, P. A. P.: Notes on continuous stochastic phenomena, Biometrika, 37, 17–23, https://doi.org/10.1093/biomet/37.1-2.17, 1950.
Mourato, S., Moreira, M., and Corte-Real, J.: Water resources impact assessment under climate change scenarios in Mediterranean watersheds, Water Resour. Manage., 29, 2377–2391, https://doi.org/10.1007/s11269-015-0947-5, 2015.
Münch, Z. and Conrad, J.: Remote sensing and GIS based determination of groundwater dependent ecosystems in the Western Cape, South Africa, Hydrogeol. J., 15, 19–28, https://doi.org/10.1007/s10040-006-0125-1, 2007.
Nadezhdina, N., Ferreira, M. I., Conceição, N., Pacheco, C. A., Häusler, M., and David, T. S.: Water uptake and hydraulic redistribution under a seasonal climate: Long-term study in a rainfed olive orchard, Ecohydrology, 8, 387–397, https://doi.org/10.1002/eco.1545, 2015.
Naumburg, E., Mata-Gonzalez, R., Hunter, R., McLendon, T., and Martin, D.: Phreatophytic vegetation and groundwater fluctuations: a review of current research and application of ecosystem response modelling with an emphasis on Great Basin vegetation, Environ. Manage., 35, 726–740, 2005.
Neumann, R. B. and Cardon, Z. G.: The magnitude of hydraulic redistribution by plant roots: a review and synthesis of empirical and modeling studies, New Phytol., 194, 337–352, https://doi.org/10.1111/j.1469-8137.2012.04088.x, 2012.
O'Grady, A. P., Eamus, D., Cook, P. G., and Lamontagne, S.: Groundwater use by riparian vegetation in the wet–dry tropics of northern Australia, Aust. J. Bot., 54, 145–154, https://doi.org/10.1071/BT04164, 2006.
Orellana, F., Verma, P., Loheide, S. P., and Daly, E.: Monitoring and modeling water–vegetation interactions in groundwater-dependent ecosystems, Rev. Geophys., 50, RG3003, https://doi.org/10.1029/2011RG000383, 2012.
Otieno, D. O., Kurz-Besson, C., Liu, J., Schmidt, M. W. T., Do, R. V. L., David, T. S., Siegwolf, R., Pereira, J. S., and Tenhunen, J. D.: Seasonal variations in soil and plant water status in a Quercus suber L. stand: Roots as determinants of tree productivity and survival in the Mediterranean-type ecosystem, Plant Soil, 283, 119–135, https://doi.org/10.1007/s11104-004-7539-0, 2006.
Paço, T. A., David, T. S., Henriques, M. O.; Pereira, J. S., Valente, F., Banza, J., Pereira, F. L., Pinto, C., and David, J. S.: Evapotranspiration from a Mediterranean evergreen oak savannah: The role of trees and pasture, J. Hydrol., 369, 98–106, https://doi.org/10.1016/j.jhydrol.2009.02.011, 2009.
Paulo, J. A., Palma, J. H. N., Gomes, A. A., Faias, S. P., Tomé, J., and Tomé, M.: Predicting site index from climate and soil variables for cork oak (Quercus suber L.) stands in Portugal, New Forests, 46, 293–307, https://doi.org/10.1007/s11056-014-9462-4, 2015.
Peel, M. C., Finlayson, B. L., and McMahon, T. A.: Updated World Map of the Köppen–Geiger Climate Classification, Hydrol. Earth Syst. Sci., 11, 1633–1644, https://doi.org/10.5194/hess-11-1633-2007, 2007.
Peñuelas, J. and Filella, I.: Deuterium labelling of roots provides evidence of deep water access and hydraulic lift by Pinus nigra in a Mediterranean forest of NE Spain, Environ. Exp. Bot., 49, 201–208, https://doi.org/10.1016/S0098-8472(02)00070-9, 2003.
Pérez Hoyos, I., Krakauer, N., Khanbilvardi, R., and Armstrong, R.: A Review of advances in the identification and characterization of groundwater dependent ecosystems using geospatial technologies, Geosciences, 6, 17, https://doi.org/10.3390/geosciences6020017, 2016a.
Pérez Hoyos, I., Krakauer, N., and Khanbilvardi, R.: Estimating the probability of vegetation to be groundwater dependent based on the evaluation of tree models, Environments, 3, 9, https://doi.org/10.3390/environments3020009, 2016b.
Pinto, C., Nadezhdina, N., David, J. S., Kurz-Besson, C., Caldeira, M. C., Henriques, M. O., Monteiro, F., Pereira, J. S., David, and T. S.: Transpiration in Quercus suber trees under shallow water table conditions: the role of soil and groundwater, Hydrol. Process., 28, 6067–6079, https://doi.org/10.1002/hyp.10097, 2013.
Pinto-Correia, T., Ribeiro, N., and Sá-Sousa, P.: Introducing the montado, the cork and holm oak agroforestry system of Southern Portugal, Agrofor. Syst., 82, 99–104, https://doi.org/10.1007/s10457-011-9388-1, 2011.
QGIS Development Team: QGIS Geographic Information System, Open Source Geospatial Foundation Project, available at: http://qgis.osgeo.org (last access: 29 February 2016), 2017.
R Development Core Team: R: A language and environment for statistical computing, R Foundation for Statistical Computing, Vienna, Austria, 2016.
Rivas-Martínez, S., Rivas-Sáenz, S., and Penas-Merino, A.: Worldwide bioclimatic classification system, Global Geobot., 1, 1–638, https://doi.org/10.5616/gg110001, 2011.
Robinson, T. W.: Phreatophytes, United States Geol. Surv. Water-Supply Pap. 1423, US Geological Survey, Washington, 92 pp., 1958.
Rodrigues, C. M., Moreira, M., and Guimarães, R. C.: Apontamentos para as aulas de hidrologia, Universidade de Évora, Évora, Portugal, 2011.
Sabaté, S., Gracia, C. A., and Sánchez, A.: Likely effects of climate change on growth of Quercus ilex, Pinus halepensis, Pinus pinaster, Pinus sylvestris and Fagus sylvatica forests in the Mediterranean region, Forest Ecol. Manage., 162, 23–37, https://doi.org/10.1016/S0378-1127(02)00048-8, 2002.
Salinas, M. J., Blanca, G., and Romero, A. T.: Riparian vegetation and water chemistry in a basin under semiarid Mediterranean climate, Andarax River, Spain, Environ. Manage., 26, 539–552, 2000.
Sardans, J. and Peñuelas, J.: Increasing drought decreases phosphorus availability in an evergreen Mediterranean forest, Plant Soil, 267, 367–377, https://doi.org/10.1007/s11104-005-0172-8, 2004.
Schenk, H. J. and Jackson, R. B.: Rooting depths, lateral root spreads and belowground aboveground allometries of plants in water limited ecosystems, J. Ecol., 90, 480–494, https://doi.org/10.1046/j.1365-2745.2002.00682.x, 2002.
Silva, J. S. and Rego, F. C.: Root to shoot relationships in Mediterranean woody plants from Central Portugal, Biologia, 59, 109–115, 2004.
Singer, M. B., Stella, J. C., Dufour, S., Piégay, H., Wilson, R. J. S., and Johnstone, L.: Contrasting water-uptake and growth responses to drought in co-occurring riparian tree species, Ecohydrology, 6, 402–412, https://doi.org/10.1002/eco.1283, 2012.
Soares, P. M. M., Cardoso, R. M., Ferreira, J. J., and Miranda, P. M. A.: Climate change and the Portuguese precipitation: ENSEMBLES regional climate models results, Clim. Dynam., 45, 1771–1787, https://doi.org/10.1007/s00382-014-2432-x, 2015.
Soares, P. M. M., Cardoso, R. M., Lima, D. C. A., and Miranda, P. M. A.: Future precipitation in Portugal: high-resolution projections using WRF model and EURO-CORDEX multi-model ensembles, Clim. Dynam., 49, 2503–2530, https://doi.org/10.1007/s00382-016-3455-2, 2017.
Spinoni, J., Vogt, J. V., Naumann, G., Barbosa, P., and Dosio, A.: Will drought events become more frequent and severe in Europe?, Int. J. Climatol., 38, 1718–1736, https://doi.org/10.1002/joc.5291, 2017.
Stewart Fotheringham, A., Charlton, M., and Brunsdon, C.: The geography of parameter space: an investigation of spatial non-stationarity, Int. J. Geogr. Inf. Syst., 10, 605–627, https://doi.org/10.1080/02693799608902100, 1996.
Stigter, T. Y., Nunes, J. P., Pisani, B., Fakir, Y., Hugman, R., Li, Y., Tomé, S., Ribeiro, L., Samper, J., Oliveira, R., Monteiro, J. P., Silva, A., Tavares, P. C. F., Shapouri, M., Cancela da Fonseca, L., and El Himer, H.: Comparative assessment of climate change and its impacts on three coastal aquifers in the Mediterranean, Reg. Environ. Change, 14, 41–56, https://doi.org/10.1007/s10113-012-0377-3, 2014.
Stone, E. L. and Kalisz, P. J.: On the maximum extent of tree roots, Forest Ecol. Manage., 46, 59–102, https://doi.org/10.1016/0378-1127(91)90245-Q, 1991.
Thornthwaite, C. W.: An approach toward a rational classification of climate, Geogr. Rev., 38, 55–94, 1948.
Tian, W., Song, J., Li, Z., and de Wilde, P.: Bootstrap techniques for sensitivity analysis and model selection in building thermal performance, Appl. Energ., 135, 320–328, https://doi.org/10.1016/j.apenergy.2014.08.110, 2014.
Valentini, R., Scarascia, G. E., and Ehleringer, J. R.: Hydrogen and carbon isotope ratios of selected species of a Mediterranean macchia ecosystem, Funct. Ecol., 6, 627–631, 1992.
Vicente-Serrano, S. M., Beguería, S., and López-Moreno, J. I.: A multiscalar drought index sensitive to global warming: The standardized precipitation evapotranspiration index, J. Climate, 23, 1696–1718, https://doi.org/10.1175/2009JCLI2909.1, 2010.
Vicente-Serrano, S. M., Gouveia, C., Camarero, J. J., Begueria, S., Trigo, R., Lopez-Moreno, J. I., Azorin-Molina, C., Pasho, E., Lorenzo-Lacruz, J., Revuelto, J., Moran-Tejeda, E., and Sanchez-Lorenzo, A.: Response of vegetation to drought time-scales across global land biomes, P. Natl. Acad. Sci. USA, 110, 52–57, https://doi.org/10.1073/pnas.1207068110, 2013.
Vörösmarty, C. J., Green, P., Salisbury, J., and Lammers, R. B.: Global water resources: Vulnerability from climate change and population growth, Science, 289, 284–288, https://doi.org/10.1126/science.289.5477.284, 2000.
Waroux, Y. P. and Lambin, E. F.: Monitoring degradation in arid and semi-arid forests and woodlands: The case of the argan woodlands (Morocco), Appl. Geogr., 32, 777–786, https://doi.org/10.1016/j.apgeog.2011.08.005, 2012.
Xiao, R., He, X., Zhang, Y., Ferreira, V. G., and Chang, L.: Monitoring groundwater variations from satellite gravimetry and hydrological models: A comparison with in-situ measurements in the mid-atlantic region of the United States, Remote Sensing, 7, 686–703, https://doi.org/10.3390/rs70100686, 2015.
Zomer, R., Trabucco, A., Coe, R., and Place, F.: Trees on farm: analysis of global extent and geographical patterns of agroforestry, ICRAF Working Paper, World Agroforestry Centre, Nairobi, Kenya, https://doi.org/10.5716/WP16263.PDF, 2009.
Zou, C. B., Barnes, P. W., Archer, S., and Mcmurtry, C. R.: Soil moisture redistribution as a mechanism of facilitation in savanna tree–shrub clusters, Ecophysiology, 145, 32–40, https://doi.org/10.1007/s00442-005-0110-8, 2005.