the Creative Commons Attribution 4.0 License.
the Creative Commons Attribution 4.0 License.
 | 03 Jan 2019
Implications of water management representations for watershed hydrologic modeling in the Yakima River basin
Jiali Qiu
Qichun Yang
Maoyi Huang
Jennifer C. Adam
Keyvan Malek
Water management substantially alters natural regimes of streamflow through modifying retention time and water exchanges among different components of the terrestrial water cycle. Accurate simulation of water cycling in intensively managed watersheds, such as the Yakima River basin (YRB) in the Pacific Northwest of the US, faces challenges in reliably characterizing influences of management practices (e.g., reservoir operation and cropland irrigation) on the watershed hydrology. Using the Soil and Water Assessment Tool (SWAT) model, we evaluated streamflow simulations in the YRB based on different reservoir operation and irrigation schemes. Simulated streamflow with the reservoir operation scheme optimized by the RiverWare model better reproduced measured streamflow than the simulation using the default SWAT reservoir operation scheme. Scenarios with irrigation practices demonstrated higher water losses through evapotranspiration (ET) and matched benchmark data better than the scenario that only considered reservoir operations. Results of this study highlight the importance of reliably representing reservoir operations and irrigation management for credible modeling of watershed hydrology. The methods and findings presented here hold promise to enhance water resources assessment that can be applied to other intensively managed watersheds.
- Article
(4482 KB) - Full-text XML
-
Supplement
(424 KB) - BibTeX
- EndNote


Ever-intensifying human activities have profoundly affected terrestrial water cycling across the globe (Jackson et al., 2001), particularly at the watershed scale (Vörösmarty and Sahagian, 2000; Yang et al., 2014, 2015). Water management substantially alters natural regimes of streamflow through modifying retention time and water exchanges among different components of the terrestrial water cycle (Haddeland et al., 2007). Hydrologic consequences of management activities should be explicitly investigated for effective water resource management (Siebert et al., 2010), especially for watersheds striving to maintain sustainable water supply for multiple users. Accurate simulation of water cycling in intensively managed watersheds faces challenges in reliably characterizing influences of management practices (e.g., reservoir operations and cropland irrigation) on the hydrologic cycling (Wada et al., 2017). Explicit analyses of how model representations of water impoundments and withdrawals would affect hydrologic modeling are needed to advance knowledge of water cycling in managed watersheds.
Construction of dams and reservoirs has substantial influences on the magnitude and variability of downstream runoff (Lu and Siew, 2006; Vicente-Serrano et al., 2017). For example, reservoir operations reduced 9 %–25 % of summer runoff to the Pacific Ocean in the western US and Mexico (Haddeland et al., 2007). In heavily dammed regions, reductions of streamflow following dam construction even reached 100 % (Graf, 1999). Reservoir operations affect the temporal variability of streamflow at multiple temporal scales in different regions across the globe (Huang et al., 2015; Zajac et al., 2017). Regulated streamflow from reservoirs to downstream areas contributes to attenuating flood peaks and volumes, but it could increase baseflow in dry seasons (Batalla et al., 2004).
Reliable representation of reservoir operations in hydrological models is critical for credible simulation of water cycling (Coerver et al., 2018). To characterize impacts of reservoir operations on watershed hydrology, multiple methods have been developed to simulate reservoir releases. These models include mathematical tools which optimize water release for achieving management objectives, simulation models which consider physical processes of water cycling in reservoirs to allow users to evaluate impacts of different management alternatives on reservoir storage and releases, and a combination of these two types of models for reservoir planning and management (Branets et al., 2009; Dogrul et al., 2016; Yeh, 1985). Among these models, the RiverWare model and models developed based on RiverWare consider both management policies and physical processes (Zagona et al., 2001) and have proven their capability of simulating reservoir storage and downstream flows. However, how reservoir operations affect watershed hydrology is still not explicitly examined.
In addition to reservoir operations, cropland irrigation also affects watershed hydrology. Water withdrawal for irrigation has been widely adopted to increase crop production in arid and semi-arid regions. Water redistribution through irrigation enhances water and energy fluxes between soils and the atmosphere (Rost et al., 2008; Sacks et al., 2009) and results in elevated water loss through evapotranspiration (Hao et al., 2015; Malek et al., 2017; Polo et al., 2016) and depletion of water resources (Aeschbach-Hertig and Gleeson, 2012) in different regions of the world. To better simulate impacts of irrigation, numerical models have been developed to quantify water fluxes among soils, vegetation, and water bodies induced by irrigation (Leng et al., 2013; Santhi et al., 2005). Impacts of irrigation on watershed hydrology should be further evaluated to apply this tool for effective management of water resources in basins with competing demands for water.
The Soil and Water Assessment Tool (SWAT) has been widely used to simulate water cycle dynamics in response to management practices across the watershed and regional scales (Arnold et al., 1998). Previous studies indicated that the default SWAT reservoir operation scheme which simulates water release based on target storage may either overestimate reservoir storage in no-flood seasons (Lv et al., 2016) or underestimate water releases when actual reservoir storage is lower than the target storage (Wu and Chen, 2012). SWAT simulates water withdrawal for irrigation from different water sources (e.g., reservoirs, streams, and groundwater aquifers). Multiple efforts have employed SWAT to evaluate impacts of different irrigation practices on watershed hydrology (Ahmadzadeh et al., 2016; Chen et al., 2017; Maier and Dietrich, 2016) and emphasized the importance of balancing water supply and irrigation demands in hydrologic simulations. However, applicability of SWAT in watersheds with interacting reservoir operations and irrigation has not been well studied and thus deserves further investigation to inform effective water resource management.
The Yakima River basin (YRB) in the Pacific Northwest of the US has been regulated for regional hydropower, flood control, fishery, crop cultivation, and drinking water supply. Water supply for irrigation is one of the most important water resource management objectives in the YRB (USBR, 2018). The Yakima River reservoir system supplies water to 180 000 ha of cropland through the operation of five reservoirs which store ca. 30 % of the mean annual runoff of the basin (Vano et al., 2010). Reservoir operations and cropland irrigation in the YRB altered historical streamflow regimes, resulted in severe low flow, and elevated flow events. Since the 1990s, increasing demands for irrigation, municipal water consumption, and critical environmental flow for conserving wildlife habitats in the context of climate change have challenged water resource management in the basin. Thus, there is an urgent need to reliably simulate water cycling in the basin to provide a solid basis for policy formulation and management actions which strive to achieve a balance among water demands for different purposes (Poff et al., 2003).
In recognition of the challenges in modeling hydrology in heavily managed watersheds, this study investigated impacts of water management on streamflow modeling in the YRB. Using the YRB as a test bed, we evaluated streamflow simulations with different model representations of management activities. Objectives of this study are to (1) examine how different representations of reservoir operations influence watershed streamflow simulations and (2) assess impacts of cropland irrigation on watershed hydrology. Methods and findings derived from this study hold promise to provide valuable information for improving hydrologic modeling in intensively managed basins across the globe.
2.1 Study area
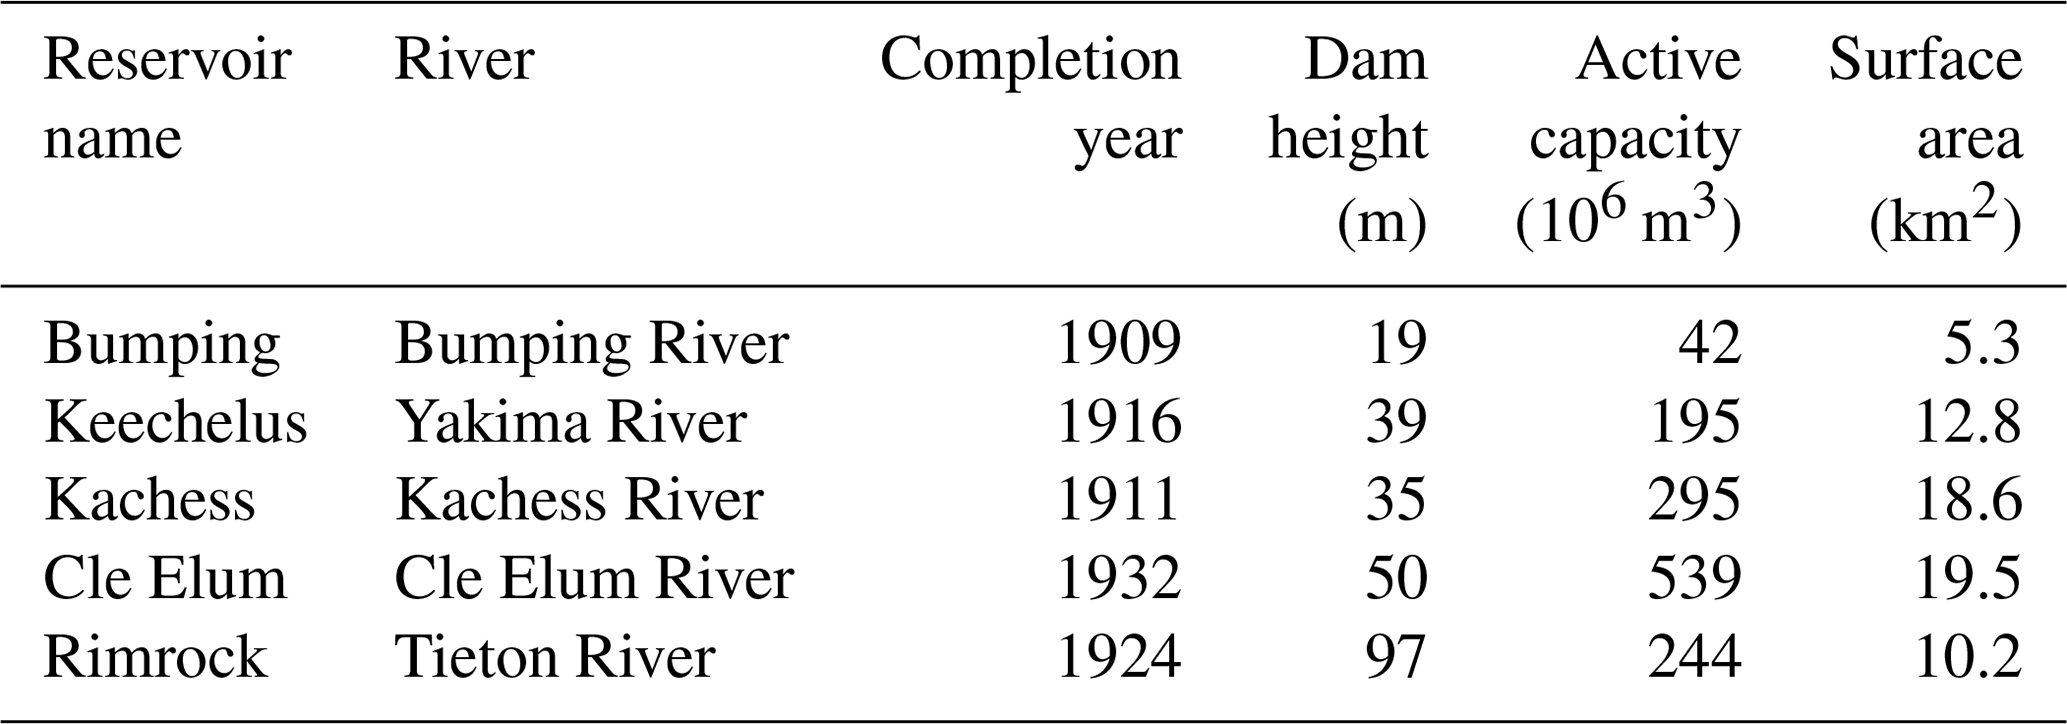
The Yakima River basin (Fig. 1) is located in central Washington, US (45.98–47.60∘ N, 121.53–119.20∘ W). The basin has a semi-arid climate with a Mediterranean precipitation pattern. Winters are cold, with a mean temperature of −2.1 ∘C. Annual average precipitation is ca. 675 mm, with an average snowfall of 550 mm, occurring mainly in December and January. Rangeland, forest, and cropland are the primary land uses in the basin and cover 36 %, 33 %, and 28 % of the study area (Vaccaro and Olsen, 2007), respectively. Dams were built throughout the basin for the irrigated agriculture. There are five big reservoirs in the YRB, including Keechelus, Kachess, Cle Elum, Bumping, and Rimrock (Fig. 1). Malek et al. (2016) reported that the YRB experienced major droughts in 20 % of the years between 1980 and 2010, and the frequency may double in the future. It is expected that the increasing competition for water from multiple users, especially for irrigation, fishery, and wildlife habitats, may escalate in the coming decades (Miles et al., 2000).
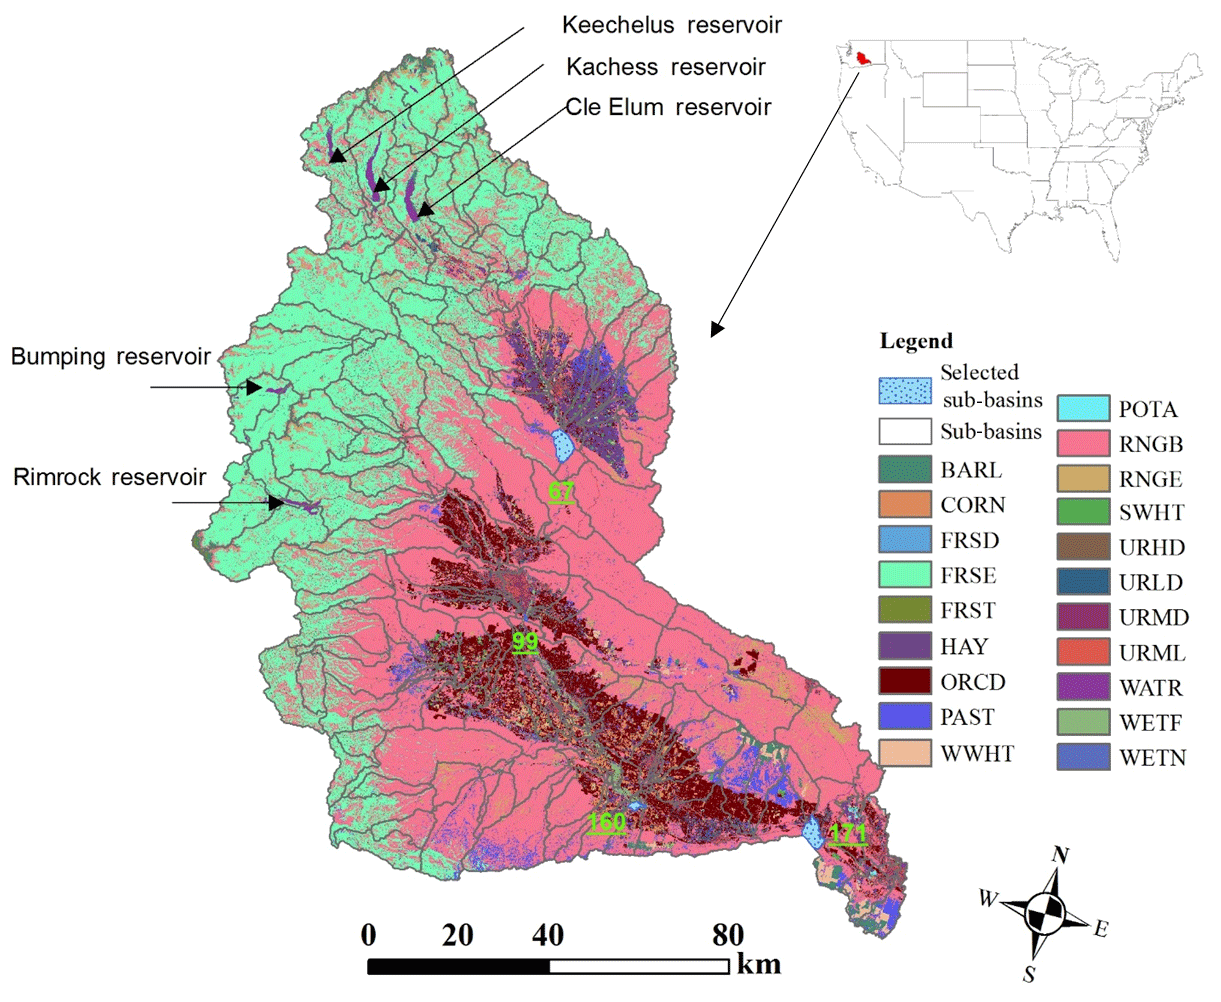
Figure 1Location and land use of the Yakima River basin (67, 99, 160, and 171 are sub-basins used for streamflow calibration and validation). BARL: spring barley; CORN: corn; FRSD: deciduous forest; FRSE: evergreen forest; FRST: mixed forest; HAY: hay; ORCD: orchard; PAST: pasture; POTA: potato; RNGB: range bush; RNGE: range grasses; SWHT: spring wheat; URHD: residential – high density; URLD: residential – low density; URMD: residential – medium density; WATER: water; WETF: wetland – forested; WETN: wetland – non-forested; WWHT: winter wheat).
2.2 Management schemes in SWAT and RiverWare model
2.2.1 Reservoir operation schemes
Settings of the five reservoirs, including locations, height, storage capacity, operating purpose, and surface area were compiled and added to SWAT input files (Table 1). We use three scenarios (R0, R1, and R2) to evaluate reservoir operation simulations in the YRB. Scenario R0 does not simulate reservoir operations, and we use it as a baseline scenario. Scenario R1 uses the SWAT model's built-in reservoir management schemes, which specify monthly target volumes for managed reservoirs (Neitsch et al., 2011). Under the R2 scenario, the SWAT model uses reservoir releases calculated by the RiverWare model as the outflow from these reservoirs to downstream reaches.
The SWAT model calculates water balance for a reservoir on a daily scale as follows:
where Vnet is the net volume changes of a reservoir on a given day (m3 water), Vstored is the water stored in a reservoir at the beginning of a day (m3 water), Vflowin is the water entering a reservoir in 1 day (m3 water), Vflowout is the amount of water release to downstream reaches of a reservoir (m3 water), Vpcp is the amount of water falling to a reservoir in 1 day (m3 water), Vevap is the water loss through evaporation from a reservoir (m3 water), and Vseep is the amount of water loss through seepage in a reservoir (m3 water).
Table 1Reservoir information of the YRB's five reservoirs (locations are marked in Fig. 1).
Under the R1 scenario, the target release approach calculates reservoir storage using the following equations:
where Vtarg is the target reservoir storage of a given day (m3 water), Vem is the volume of reservoir for filling the emergency spillway (m3 water ), mon is the month of the year, monfld,beg is the beginning month of a flood season, monfld,end is the ending month of the flood season, Vpr is the reservoir volume when the principal spillway is filled (m3 water), SW is average soil water content (mm) on a given day, and FC is field capacity (mm).
When the target volume is determined, the reservoir outflow (Vswat_flowout, m3 day−1) in the default SWAT for a given day is calculated as follows:
where Vstored is the volume of water stored in the reservoir on a given day, and NDtarg is the number of days required for the reservoir to reach the target storage.
Under the R2 scenario, outflow from a reservoir is calculated based on the estimated daily release provided by the RiverWare model as follows:
where VRiverWare_flowout is the volume of water flowing out of a reservoir in 1 day (m3), and qout is the outflow rate estimated by RiverWare (m3 s−1).
RiverWare simulates operations and scheduling of reservoir management objectives, including hydropower production, flood control, and irrigation (Zagona et al., 2001). RiverWare can model a variety of physical processes for reservoirs with computational time steps ranging from 1 h to 1 year. In RiverWare simulations, the solver is based on operating rules or operating policies that provide instructions for operation decisions such as reservoir releases (Zagona et al., 2001). The rules are strictly prioritized, with high-priority rules requiring that reservoir release should not be less than the minimum flow for downstream reaches, whereas a low-priority rule requires that reservoir storage should fit a seasonal guide-curve value. Conflicts are resolved by giving higher priority rules precedence. This model has been applied to the YRB to simulate outflow from the reservoirs (USBR, 2012).
2.2.2 Irrigation representation in the SWAT model
SWAT irrigation schemes consider multiple water sources including reservoirs, streams, shallow aquifers, and sources outside the watershed. Irrigation can be triggered by a water stress threshold (a fraction of potential plant growth). In SWAT, water stress is simulated as a function of actual and potential plant transpiration:
where wstr is the water stress, Et is the potential plant transpiration (mm day−1), Et,act is the actual amount of transpiration (mm day−1), and wactualup is the total plant water uptake (mm day−1). The plant water uptake is a function of the maximum plant transpiration, a water-use distribution parameter, the depth of the soil layer, and the depth of plant root. In the SWAT auto irrigation algorithm, irrigation is applied when the water stress factor falls below a predefined threshold. Irrigation will increase soil moisture to field capacity, if irrigation water sources could provide enough water. We conducted two additional simulations by assuming that irrigation water was withdrawn from reservoirs and streams (R2S1) or groundwater (R2S2), based on the simulations with RiverWare reservoir schemes (R2).
2.3 Model setup, sensitivity analyses, and simulations
We used a plethora of geospatial datasets to parameterize and drive hydrological simulations in the YRB (Table 2). Topography information was derived from U.S. Geological Survey (USGS) National Elevation Dataset (NED; https://lta.cr.usgs.gov/NED, last access: 1 May 2017) with a spatial resolution of 30 m. The U.S. Department of Agriculture (USDA) Cropland Data Layer (CDL; https://nassgeodata.gmu.edu/CropScape/, last access: 1 February 2017) with a spatial resolution of 30 m was used to obtain land covers including shrubland, forestland, grassland, developed land and barren land, cultivated land, and orchards in the YRB (Fig. 1). We derived daily climate data for the period of 1980–2012 from the North American Land Data Assimilation System (NLDAS; https://ldas.gsfc.nasa.gov/nldas/NLDAS2forcing.php, last access: 2 January 2016). In addition, we obtained nitrogen and phosphorus fertilizer application rates (USDA-ERS, 2018), tillage intensity rates (CTIC, 2017), and planting and harvesting dates (USDA, 2010) for crop management. When defining hydrologic response units (HRUs), we used thresholds of 20 %, 10 %, and 10 % for land use types, soil classes, and slop groups, respectively. The SWAT model divides the YRB into 181 sub-basins and 1950 HRUs. Streamflow simulations in four sub-basins (Fig. 1) with long-term observations were explicitly examined to evaluate how different schemes affected model performances. To evaluate SWAT evapotranspiration (ET) simulations, we compiled the annual Moderate Resolution Imaging Spectroradiometer (MODIS) ET data for the study area. The MODIS ET data were produced using the Penman–Monteith equation and remotely sensed land cover and leaf area index (LAI) information, with a spatial resolution of 1 km (Mu et al., 2011).
Table 2Dataset used in the SWAT simulations. n/a – not applicable.

We quantified parameter sensitivities with a global sensitivity method described by Abbaspour et al. (2017), which employs model runs driven by randomly sampled parameter sets, a multi-regression approach, and a T test to identify and rank sensitive parameters. A sensitivity analysis for SWAT simulations in the YRB is computationally expensive. For each scenario, we spent about 3 weeks to run SWAT 10 000 times (Zhang et al., 2009a, b) to understand parameter sensitivity and minimize the discrepancy between simulations and observations under different scenarios. We used the Nash–Sutcliffe efficiency coefficient (Ens; Nash and Sutcliffe, 1970) and correlation coefficient (R; Legates and McCabe, 1999) as the metrics for evaluating model performance.
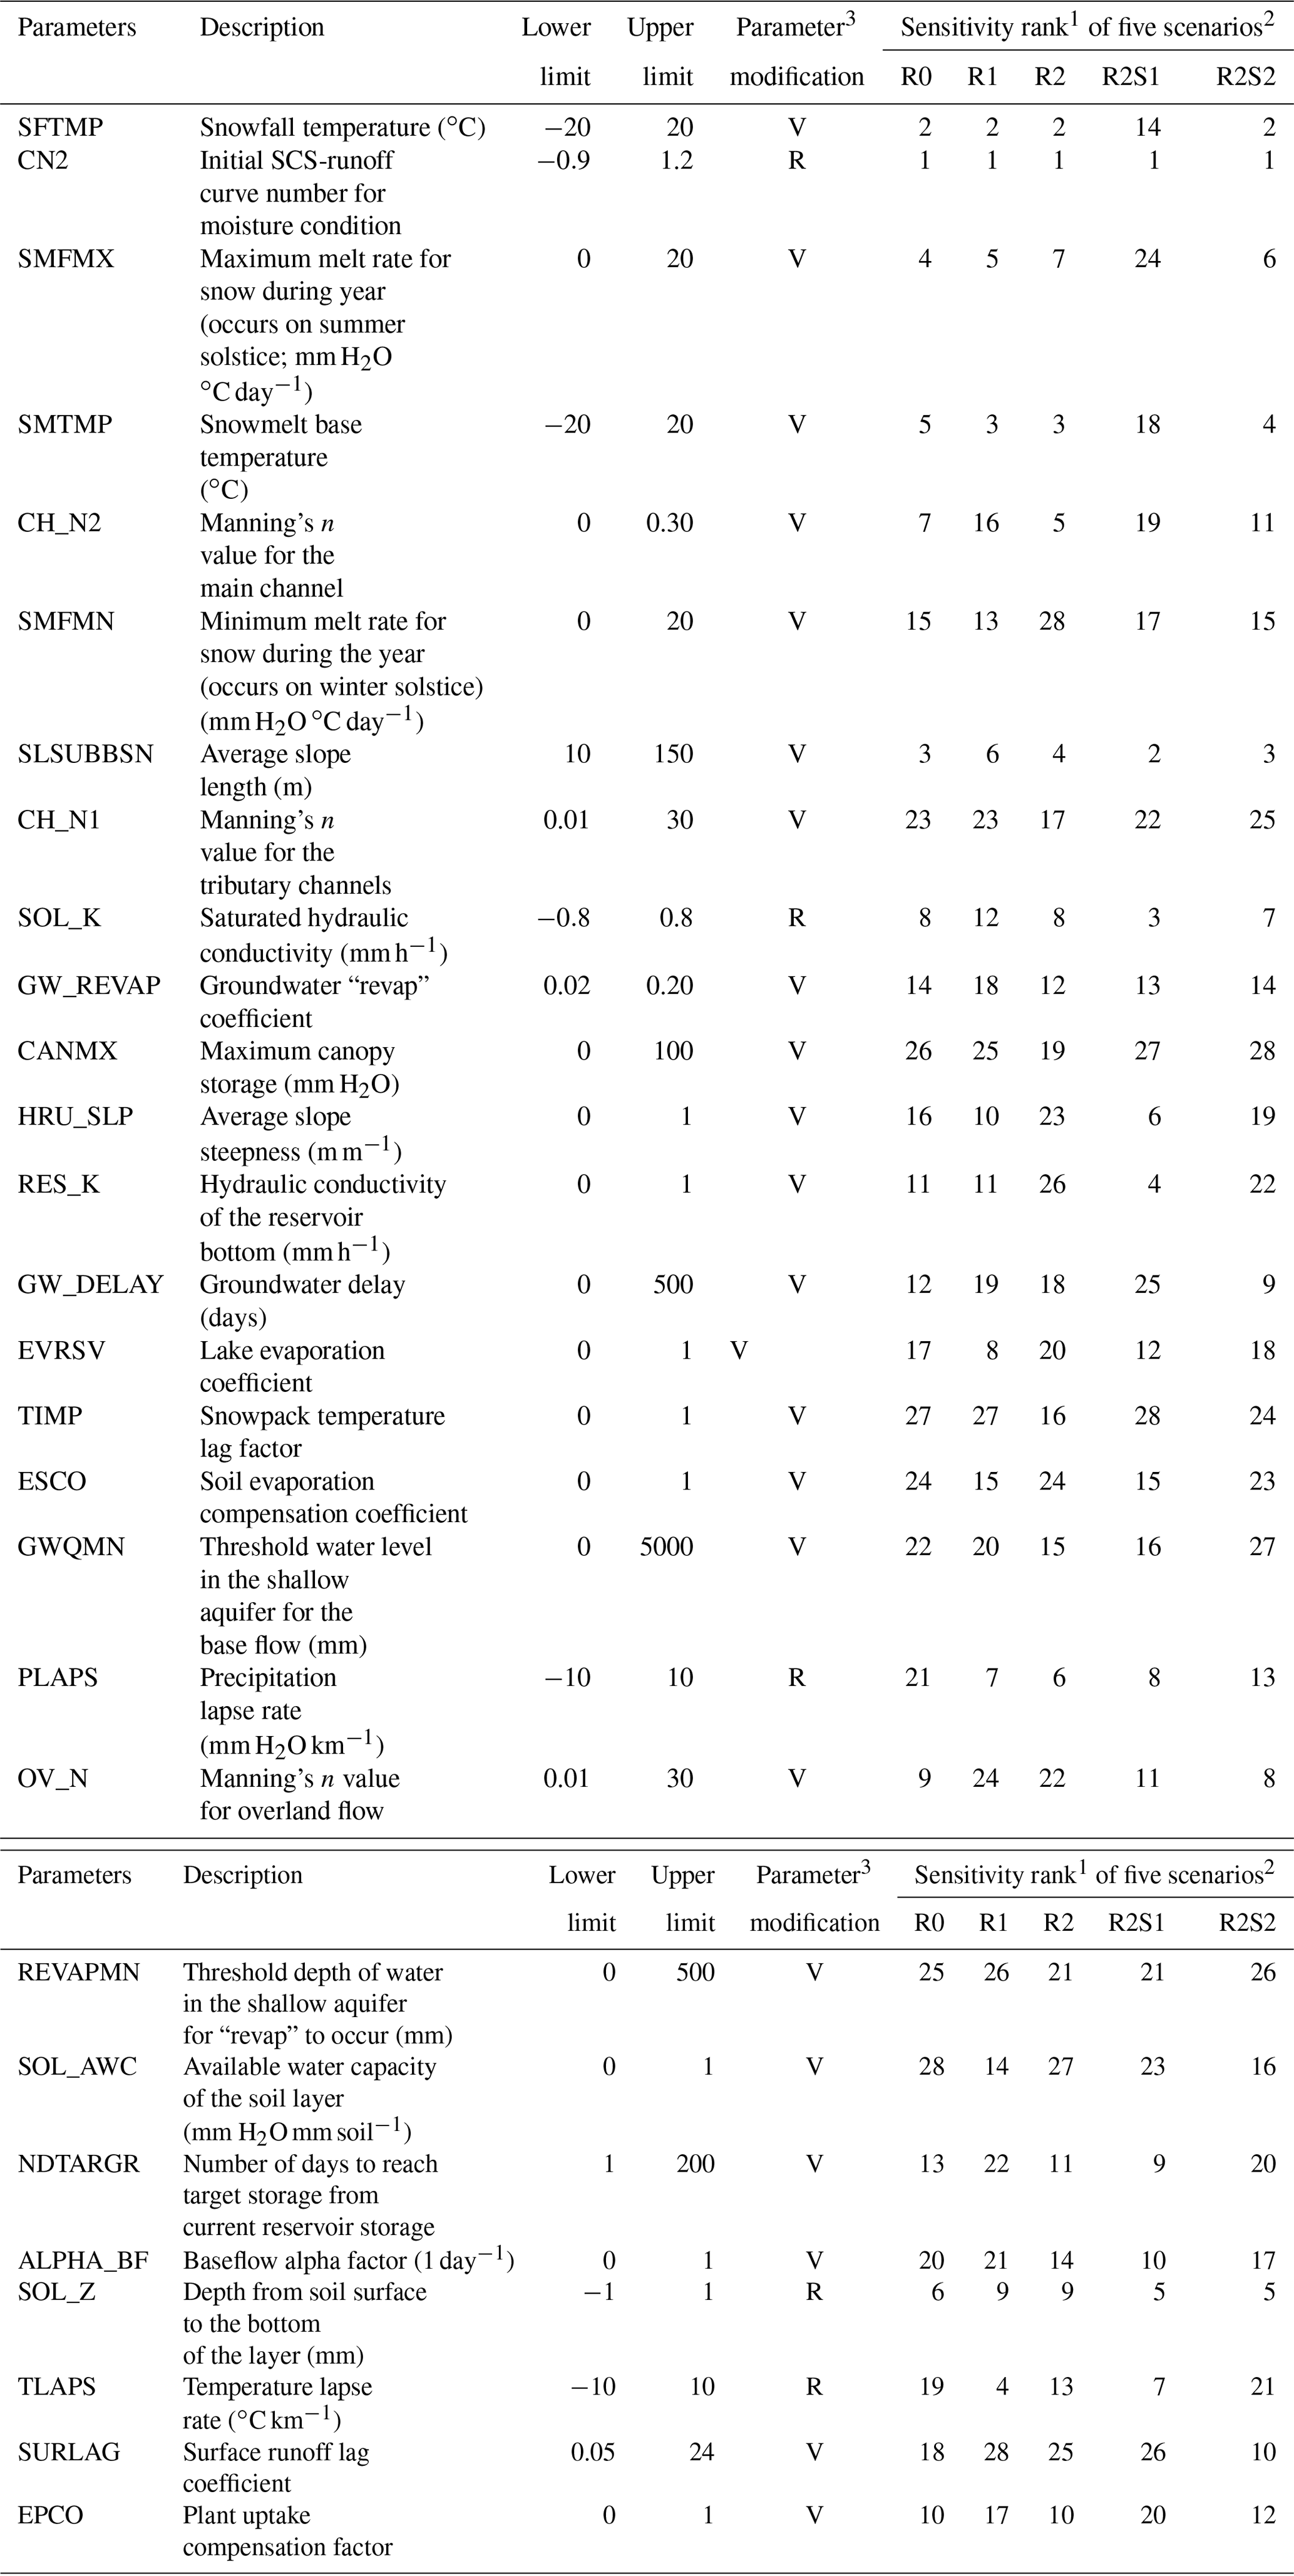
3.1 Parameter sensitivity under different scenarios
Table 3 shows the ranking of parameter sensitivity under different scenarios. In general, selected parameters demonstrated similar sensitives among all scenarios, particularly for the 10 most sensitive parameters, indicating snow melting (SMFMX, SFTMP, and SMTMP), soil water dynamics (CN2, SOL_k, and SOL_Z), and water routing (CH_N2 and SLSUBBSN), which are critical for water cycling in the basin (Tables 3 and S1 in the Supplement). For all scenarios, the most sensitive parameters are CN2 and the snow factors, including SFTMP, SMTMP, SMFMX, SMFMN, and TIMP, indicating that snowmelt is the key hydrological process in the YRB. SWAT uses the Soil Conservation Service Curve Number method (SCS-CN) to predict runoff. As a result, parameter CN2 affects the partition of water between the surface runoff and infiltration and has significant impacts on streamflow estimates. We also observed that sensitivities of several parameters were different among the five scenarios. Specifically, parameters relevant to reservoir operations or irrigation management, including the RES_K and NDTARGR, played important roles in simulations with reservoir operations. The differences could be attributed to the inclusion of reservoir operation and irrigation schemes and further suggest that significant impacts of the management activities on water cycling should be considered in hydrologic modeling. Note that although the inclusion of management activities altered the sensitivity of reservoir- and irrigation-related parameters, snow melting and soil water dynamics may still play the fundamental role in water cycling, as evidenced by the high sensitivity of CN2 and SFTMP.
3.2 Streamflow simulations under different reservoir operation scenarios (R0, R1, and R2)
Without considering impacts of reservoir operations and water withdrawals on water cycling, the R0 scenario demonstrated poor performance in streamflow simulations (Fig. 2, Table S2). Streamflow simulations in R1 and R2 were significantly improved when reservoir operation schemes were added to SWAT, which further confirmed the importance of considering reservoir operations in hydrologic modeling in the YRB. Note that reservoirs either increase or reduce streamflow, as reservoirs could increase water release in dry seasons or retain upstream water for flood control in wet seasons. In addition, streamflow simulated in the R2 scenario (average correlation coefficient of 0.59) showed a better agreement with measured flow than that of the R1 scenario (average correlation coefficient of 0.57). R2 exhibits better Ens in three of the four sub-basins than R1 (Table S2), indicating that reservoir outflow estimated by RiverWare more accurately simulated water releases than the default reservoir operation scheme in SWAT. The streamflow simulations in sub-basins 67 and 99 were more sensitive to the different reservoir schemes, as evidenced by greater improvements in the Ens and R values than those of the other two downstream sub-basins (Figs. 3 and 4).
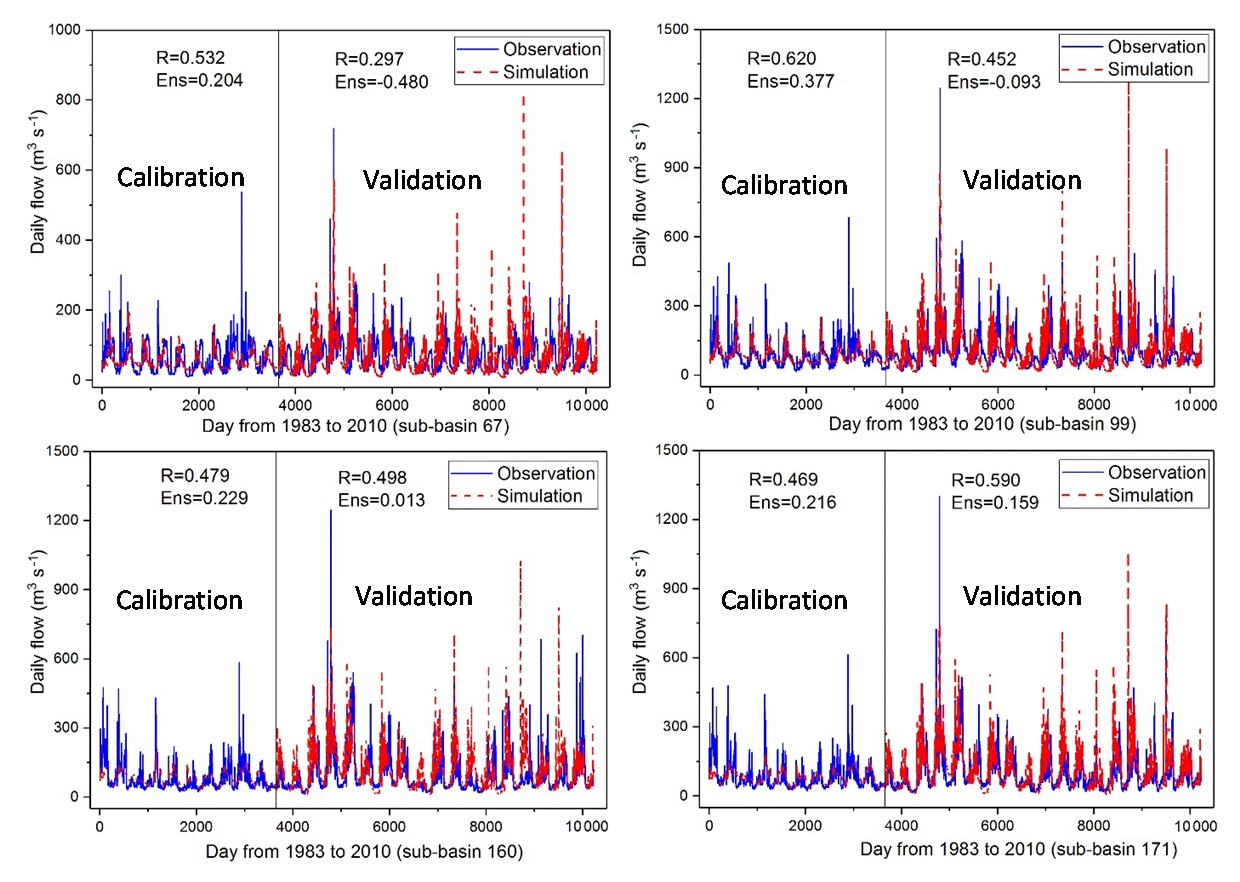
Figure 2Calibration and validation results in four sub-basins under the R0 scenario (baseline simulation does not consider management activities).
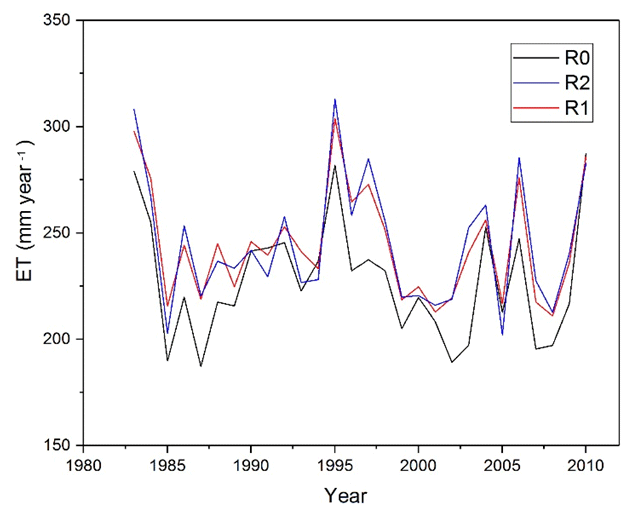
We also compared ET simulations of the YRB under the three scenarios (R0, R1, and R2). Specifically, ET estimates increased in May and June but decreased in winter for R1 and R2 simulations (Fig. S1 in the Supplement). In addition, annual ET increased by 7.83 % and 8.05 % for R1 and R2 simulations relative to the R0 simulation, respectively (Fig. 5). The changes could be attributed to increased evaporation from reservoirs.
3.3 Streamflow and ET simulations under the two irrigation operation scenarios (R2S1 and R2S2)
3.3.1 Streamflow and ET
Settings of scenario R2S1, which used reservoirs and streams as water sources for irrigation, are consistent with the actual irrigation practices in the YRB, where surface water is the primary irrigation water source (Fig. 6). For the R2S2 scenario, shallow groundwater was assumed to be the water source for irrigation (Fig. 7). Consequently, streamflow simulations under the scenario R2S1 matched observations better than those under R2S2. Compared with the R2 scenario, the simulated flow decreased by 24.87 % and 31.29 % in R2S1 and R2S2, respectively.
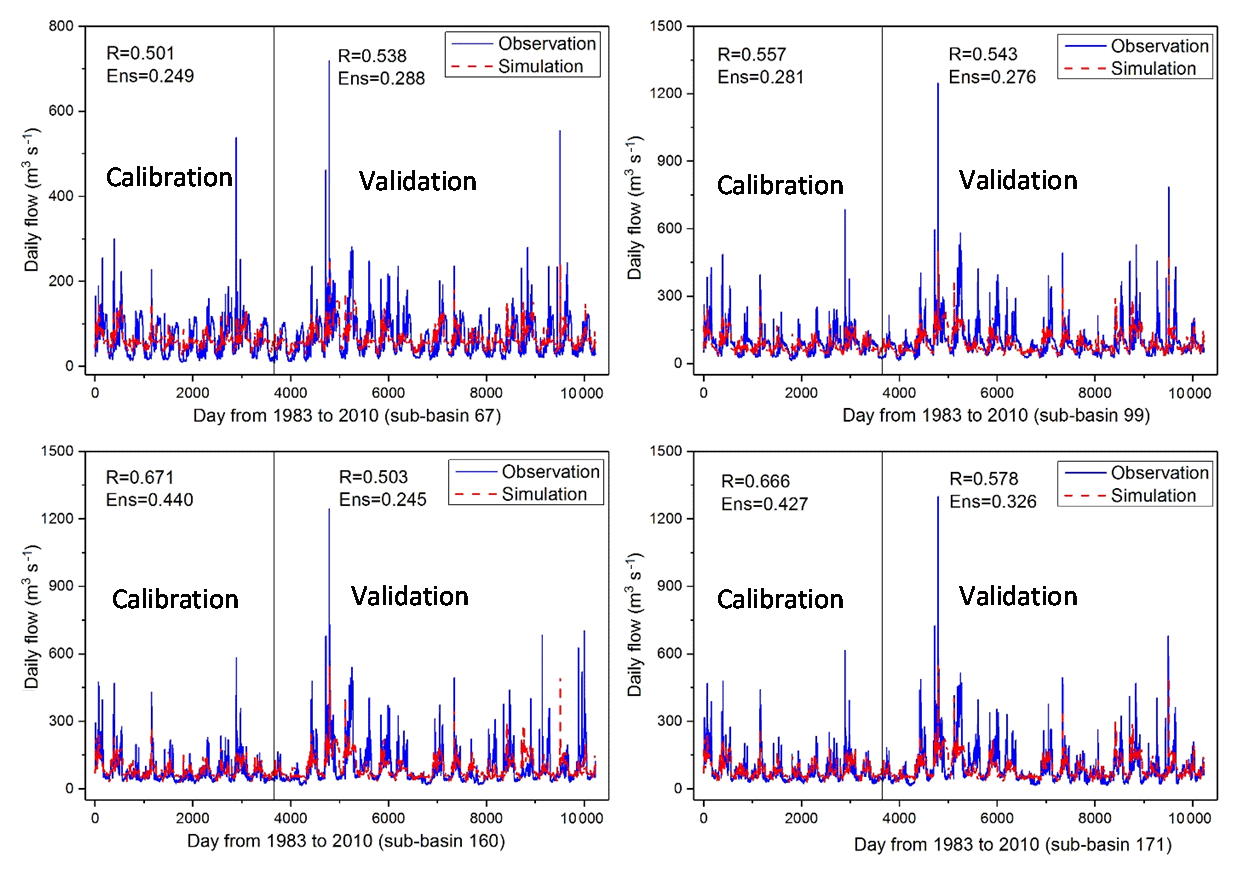
Figure 3Calibration and validation results under the R1 scenario (default SWAT schemes for reservoir operations).
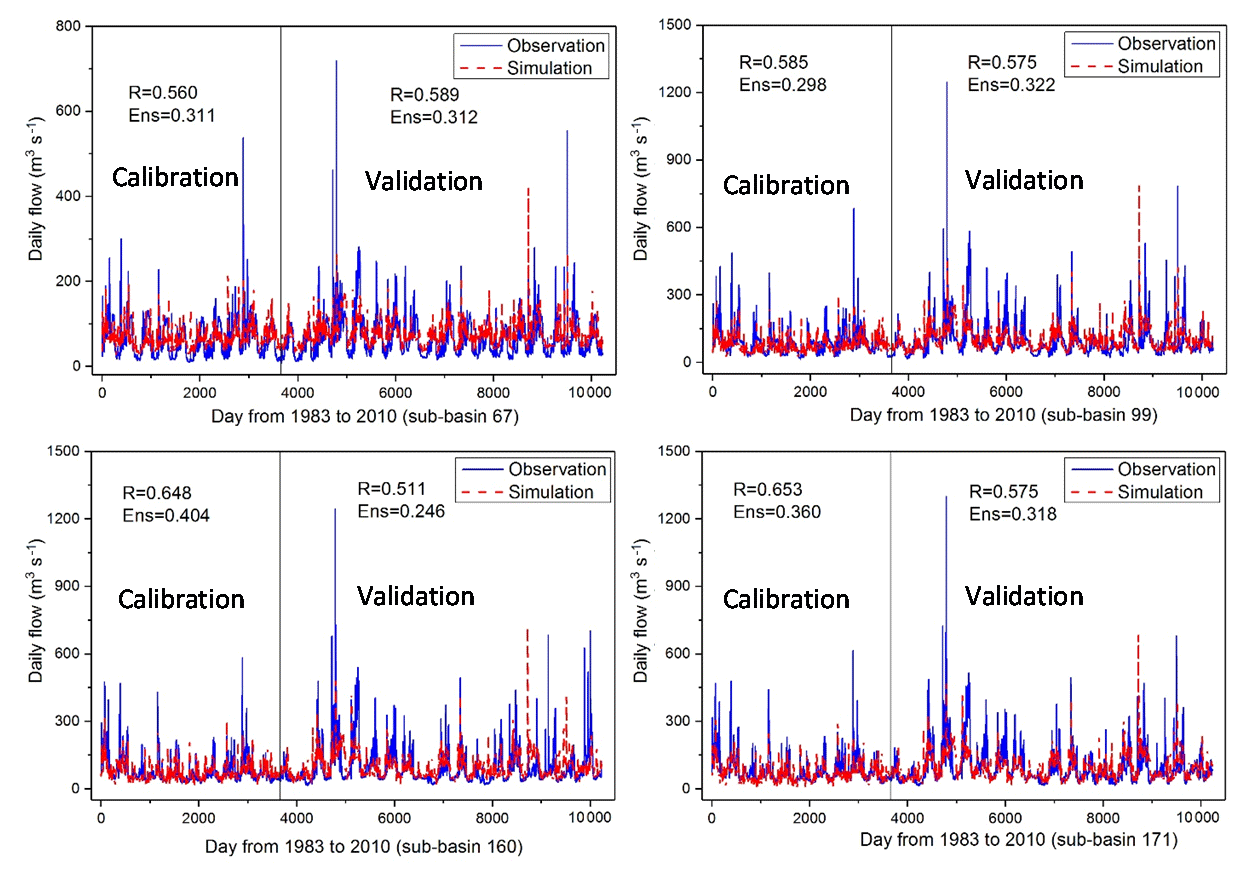
Figure 4Calibration and validation results under the R2 scenario (RiverWare for reservoir operations).
ET is an important component of terrestrial water cycling, and this variable is used in the calculation of irrigation demand in SWAT simulations. Figure 8 compares simulated monthly ET of the irrigation scenarios (R2S1 and R2S2) with the RiverWare reservoir operation scenario (R2) which did not consider irrigation. The mean monthly ET rates of the irrigation scenarios (R2S1 and R2S2) were significantly higher (85 % and 63 % for R2S1 and R2S2, respectively) than simulations without irrigation, particularly during March–July, when irrigation was applied to support crop growth.
We further compared the simulated annual ET in the R2S1 and R2 scenarios (Fig. 9). We observed low cropland ET in the R2 scenario relative to the R2S scenario. Specifically, when irrigation was included in our simulation, SWAT ET estimates increased by ca. 85 % at the annual scale. Monthly scale comparison showed that increases in ET mainly occurred in growing seasons (April to August, Fig. S2). The comparison demonstrated that inclusion of irrigation schemes achieved better estimates of water losses during irrigation and contributed to enhancing streamflow simulations (Fig. 6). In addition to magnitude, the irrigation scenario (R2S1) also simulated the interannual variability of ET well, as evidenced by the high coefficient of determination in the scatter plot against ET estimates based on remote sensing data (Fig. S3).
3.3.2 Irrigation water consumption
The mean annual irrigation depth for the irrigation scenarios of R2S1 and R2S2 was 480.66 and 228.46 mm yr−1, respectively. Under the R2S1 scenario, water for irrigation was provided by the five reservoirs in the corresponding sub-basins; in sub-basins without reservoirs, irrigation water was withdrawn from local streams. Average irrigation water was higher in the R2S1 scenario than that of R2S2. There are notable differences in irrigation depths for different crop species between the two irrigation scenarios. In general, the irrigation water consumption for all crops was higher in the R2S1 scenario than that of the R2S2 scenario.
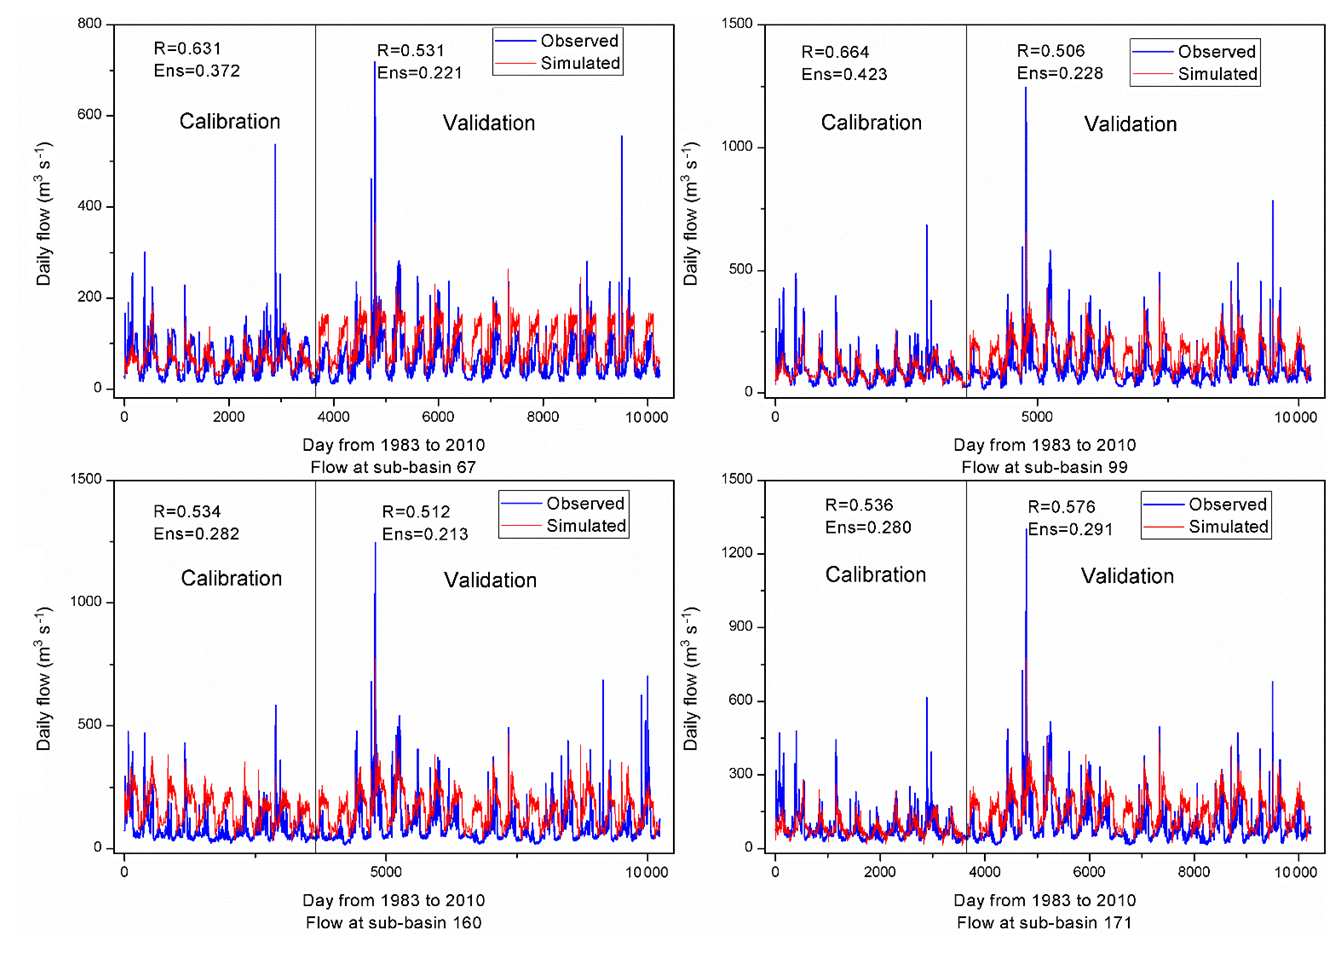
Figure 6Calibration and validation results under the R2S1 scenario (RiverWare for reservoir operation and surface water as the water source for irrigation).

Figure 7Calibration and validation results under the R2S2 scenario (RiverWare for reservoir operation and groundwater as the water source for irrigation).
3.4 Management impacts on watershed hydrology
As indicated by the improved Ens and R values, streamflow simulations under scenarios simulating both reservoir operations and irrigation schemes (R2S1 and R2S2) are more comparable with observations than those of the baseline scenario (R0), which does not consider water management activities in the simulation. Reservoirs have contributed to streamflow increases in dry periods and streamflow reductions in wet seasons by regulating water storage and release. Compared with the baseline scenario (R0), we found reductions in simulated streamflow in the scenarios that consider reservoir and irrigation operations, indicating that water withdrawal for irrigation tends to reduce streamflow as a result of enhanced water loss through ET.
ET in the composite scenarios (R2S1 and R2S2) was higher than the R0 scenario, which can be attributed to the elevated evaporation from reservoirs and irrigated cropland. Direct evaporation from reservoirs increased by 7 %–8 % over the study period (1980 to 2010), due to the improved simulation of reservoir surface areas in the R1 and R2 simulations relative to the R0 simulation. Irrigation practices led to more pronounced increases in ET in R2S1 and R2S2 simulations, as compared with those of R2 (Fig. 8). These results indicate that irrigation may have more pronounced impacts on ET through stimulating ET than reservoir operations in the study area.
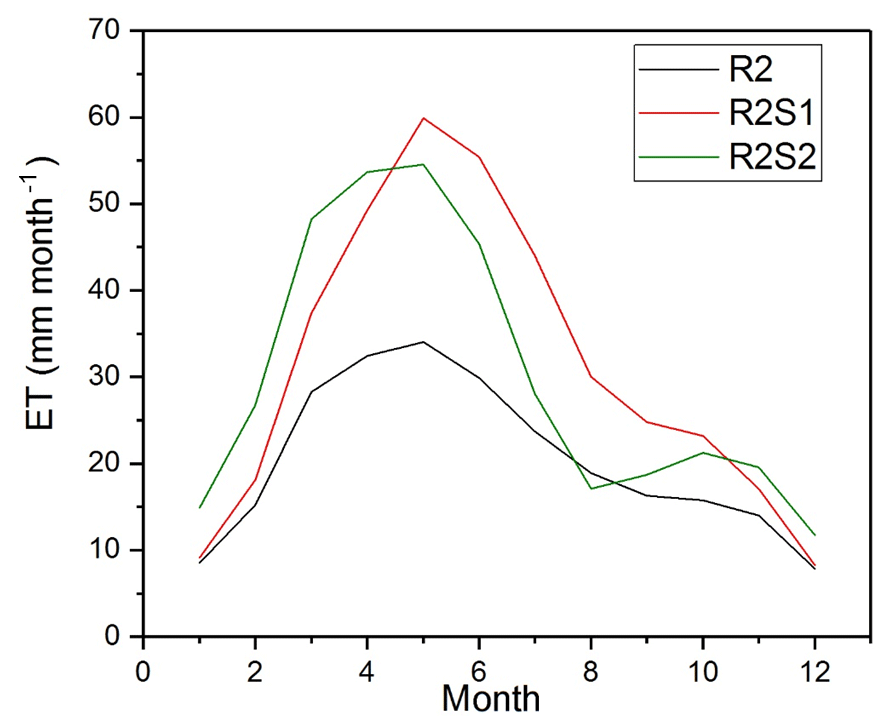
Figure 8Monthly ET simulated under the irrigation operation scenarios (R2S1 and R2S2) relative to the reservoir operation-only scenario (R2).

Figure 9Comparison of ET simulations for cropland during 2000–2009 under the R2 and R2S1 scenarios.
4.1 SWAT simulation of water cycling in response to management activities
In recent decades, water users of the YRB passed the Yakima River Basin Integrated Water Management Plan, which is a comprehensive agreement that advances water infrastructures and management (USBR, 2012). Enhanced hydrologic modeling provided by this study will provide valuable information for goals of the Integrated Plan, which requires accurate streamflow information for managing water resources to meet ecological objectives as well as for securing water supply for domestic uses.
Although previous investigations highlighted the importance of irrigation and reservoir management to water balance and availability (Hillman et al., 2012; Malek et al., 2014), joint impacts of these two water management practices on watershed hydrology have not been fully understood. In recognition of this challenge, we enhanced SWAT representations of the two critical water management activities, including reservoir operations and irrigation, to constrain uncertainties in hydrologic simulations. We achieved improved model performances through including the two activities in the SWAT modeling framework. The simulated streamflow was generally lower in simulations with management activities than the baseline simulation (R0). Without including reservoir management and irrigation, SWAT may overestimate streamflow due to the unreasonably estimated water loss through ET.
Water management activities have altered natural hydrological cycling and posed challenges to reliable simulation of watershed hydrology. The YRB is a typical watershed that is regulated to support agricultural production. Maintaining sustainable water supply in basins like the YRB calls for a sound understanding of hydrological impacts of management activities. Management schemes developed and evaluated in this study will be transferable and applicable to future SWAT and other watershed model applications for investigating the water cycling that is influenced by reservoir operations and water withdrawal for irrigation across broader spatial scales.
4.2 Water cycling under reservoir operation scenarios
Reservoir operations have both direct and indirect impacts on streamflow. Water release from reservoirs directly affects the magnitude and variability of streamflow in downstream reaches. Dam and water diversion operations determine the amount and timing of water discharge to downstream river channels. As a result, reservoir operations may either attenuate flood peaks in wet seasons or increase streamflow in dry years, in compliance with minimum instream flow policies (Yoder et al., 2017). In addition, multiple hydrological processes, such as vertical flow in surface or subsurface waters, water routing, evaporation, precipitation, and microclimate, are also responsive to reservoir operations (Lv et al., 2016). Our simulations suggested that reservoir operations altered both streamflow and ET in the YRB.
Most precipitation in the YRB occurs in winter as snowfall. Snowpack serves as a water reservoir for spring and summer streamflow. Consequently, streamflow is high in spring but low in summer. As shown in Table 1, most of the reservoirs were built to support cropland irrigation. The presence of reservoirs positively contributed to water availability in dry periods. Water storage management in reservoirs is one adaptation strategy particularly applicable to snowmelt-dominant watersheds like the YRB, which experiences water scarcity during the summer irrigation season (Yoder et al., 2017), and thus alters natural flow regimes. Without representing reservoir regulations, SWAT simulations failed to reasonably reconstruct temporal variability in streamflow (R0 scenario). Results of this study indicated that reservoir algorithms based on RiverWare (R2) were relatively more realistic compared with the default reservoir operation algorithms in SWAT (R1), as evidenced by the improved model performances. Enhanced model performances in the R1 and R2 scenarios further corroborated the significant impacts of reservoir operations on seasonal patterns of streamflow (Adam et al., 2007).
Compared with the baseline scenario (R0), R1 and R2 simulations showed that the ET rates increased considerably from April to September due to reservoir operation. Direct evaporation from reservoirs increased under the R1 and R2 scenarios because of improved estimates of reservoir surface areas. The consideration of such an impact on ET in the R1 and R2 scenarios also contributed to enhanced model performances relative to the baseline scenario (R0).
4.3 Impacts of irrigation on water cycling
Water withdrawal for irrigation has increased pressures on maintaining sustainable water resources in the YRB (Malek et al., 2017). Insufficient water supply for agricultural production, drinking water supply, and environmental flows have raised concerns on the local economy and ecosystem integrity (Hillman et al., 2012). Due to the significant impacts on soil moisture and plant growth, the amount and timing of irrigation influence ET losses and watershed hydrology (Maier and Dietrich, 2016). As a result, the irrigation impacts on streamflow should be evaluated to provide reliable estimates of streamflow in basins like the YRB, which helps balance the water supplies and demands for effective water resource management.
As reported in previous studies, most of the water for agricultural irrigation was provided by surface water, and one-third was from groundwater in the YRB (USBR, 2012). Under the R2S1 scenario, our assumption that irrigation water was from the reservoirs and streams generally agreed with the actual water uses for irrigation in the basin. The less satisfactory model performances in the R2S2 scenario may stem from the unrealistic assumption of water sources, irrigation efficiencies, and the return flow of irrigation. In addition, SWAT simulates streamflow based on water balance among multiple water pools, including shallow groundwater which is recharged by subsurface runoff (Shadkam et al., 2016). Under the R2S2 scenario, water withdrawal from the shallow renewable groundwater was used in our simulation. This simplification did not consider water withdrawal from deep nonrenewable aquifers. As a result, water availability based on shallow groundwater for irrigation and the groundwater recharge may have been unreasonably estimated and partially contributed to unsatisfactory model performances under this scenario (R2S2).
To better investigate hydrological consequences of water management, future studies should further constrain uncertainties in streamflow simulations by incorporating additional reservoir management and irrigation information. Including of observed reservoir release will help improve model representations water discharge from reservoirs. In addition, model representation of irrigation should be improved in the future. Note that model performances of the R2S1 scenario were not substantially improved relative to the R2 scenario. The irrigation operation scheme that used surface water as the single source may have introduced uncertainties to streamflow simulations, since groundwater is also an important water source for irrigation, particularly in dry years in the YRB. Future simulations need to incorporate explicit irrigation information about irrigated areas and the source, amount, and timing of groundwater withdrawals into hydrologic modeling to better simulate agricultural hydrology. We observed different seasonal patterns of ET under the five scenarios. How management activities affected water and energy exchanges between soil and the atmosphere should also be investigated in the future.
As most reservoirs were built for irrigation in the YRB, impacts of reservoirs should be assessed jointly with the accelerating development of irrigated agriculture in the basin. The presence of reservoirs positively contributed to water availability for irrigation, particularly for dry seasons. In general, the combination of reservoir operations and irrigation have reduced streamflow in the YRB when compared with the baseline scenario (R0). This is attributable to the large amounts of water loss through ET in irrigation and additional water storage in reservoirs.
4.4 Caveats in model selection
Among the multiple modeling scenarios, we found that linking RiverWare reservoir model with SWAT achieved better performance than those model structures that reply on simplified reservoir operations, as evidenced by the relatively higher correlation coefficient and the Ens. However, it is worth noting that these statistical metrics are calculated based on a limited set of hydrological variables (e.g., streamflow) but cannot guarantee that other hydrological processes are well represented (Zhang et al., 2013). Therefore, we further used MODIS-estimated ET and reported irrigation water demand data to justify the favorable performance of the combined SWAT-RiverWare watershed model configuration.
Our model evaluation process follows the widely accepted procedures for model calibration and evaluation (Moriasi et al., 2007; Arnold et al., 2012). We also would like to point out that the complexity difference between the SWAT-RiverWare and other watershed model configurations was not explicitly considered in model evaluation. Previous research notes that model complexity is an important factor in selecting the most robust model configuration that can fulfill a specific purpose. For example, Höge et al. (2018) reviewed existing methods and laid the foundation for a comprehensive framework for understanding the critical role of model complexity in model selection. The lack of reliable prior knowledge of the model structure and associated model parameters makes it difficult to directly consider model complexity here. However, the framework laid out by Höge et al. (2018) deserves further exploration in comparing the performance of different watershed model configurations in the future.
Reservoir operations and irrigation have substantial impacts on water cycling globally. Hydrologic simulation in the managed basins faces challenges in reliably characterizing water management activities. This study assessed the hydrological impacts of reservoir systems and irrigation practices through numerical model experiments with SWAT. Representing reservoir operations by coupling the RiverWare model and SWAT significantly improved streamflow simulations. We achieved reasonable model performances in the scenario using reservoirs and streams as the water sources for irrigation, since these assumptions are consistent with the actual irrigation practices in the basin. Model simulations suggested that reservoir operations and irrigation water withdrawal generally reduced streamflow by enhancing water loss through ET in the study area. Results of this study demonstrated the importance of incorporating water management activities into hydrologic modeling. Both SWAT and RiverWare are community models that have been widely tested and applied in diverse regions across the globe, as evidenced by the numerous peer-reviewed publications in the fields of reservoir operation and watershed modeling (https://www.card.iastate.edu/swat_articles/, last access: 6 January 2018). The knowledge discovered through our numerical experiments is expected to help understand how uncertainties in water cycling simulations resulted from water management representations in hydrological models. Methods and findings derived from this study are expected to help enhance future hydrologic modeling in managed watersheds with intensive reservoir and irrigation activities.
Sources of the geospatial and climate forcing data used to configure the SWAT model have been described in the “2 Materials and methods section”. The simulations of streamflow and evapotranspiration data are shown in the figures of the paper and are available through contacting the authors.
The supplement related to this article is available online at: https://doi.org/10.5194/hess-23-35-2019-supplement.
JQ and QY contributed equally to the paper. JQ, QY, XZ, and MH designed the study and conducted the watershed configuration and modeling efforts. JCA and KM contributed RiverWare reservoir outflow data. All authors contributed to result analysis and paper preparation.
The authors declare that they have no conflict of interest.
We greatly appreciate the valuable comments from four anonymous reviewers, which have much improved the quality of the paper.
This research was supported by the U.S. Department of Energy, Office of
Science, as part of research in Multi-Sector Dynamics, Earth and
Environmental Systems Modeling program. Jennifer C. Adam's and Keyvan Malek's contributions
were supported by the NSF EAR no. 1639458 and USDA no. 2017-67004-26131 awards.
Edited by: Alberto Guadagnini
Reviewed by: four anonymous referees
Abbaspour, K.: User manual for SWAT-CUP, SWAT calibration and uncertainty analysis programs, Swiss Federal Institute of Aquatic Science and Technology, Eawag, Duebendorf, Switzerland, 2007.
Abbaspour, K., Vaghefi, S., and Srinivasan, R.: A Guideline for Successful Calibration and Uncertainty Analysis for Soil and Water Assessment: A Review of Papers from the 2016 International SWAT Conference, Water, 10, 6, https://doi.org/10.3390/w10010006, 2017.
Adam, J. C., Haddeland, I., Su, F., and Lettenmaier, D. P.: Simulation of reservoir influences on annual and seasonal streamflow changes for the Lena, Yenisei, and Ob'rivers, J. Geophys. Res.-Atmos., 112, https://doi.org/10.1029/2007JD008525, 2007.
Aeschbach-Hertig, W. and Gleeson, T.: Regional strategies for the accelerating global problem of groundwater depletion, Nat. Geosci., 5, 853–861, 2012.
Ahmadzadeh, H., Morid, S., Delavar, M., and Srinivasan, R.: Using the SWAT model to assess the impacts of changing irrigation from surface to pressurized systems on water productivity and water saving in the Zarrineh Rud catchment, Agr. Water Manage., 175, 15–28, 2016.
Arnold, J. G., Srinivasan, R., Muttiah, R. S., and Willianms, J. R.: Large area dyrologic modeling and assessment part 1: model development, J. Am. Water Resour. Assoc., 34, 73–89, 1998.
Arnold, J. G., Moriasi, D. N., Gassman, P. W., Abbaspour, K. C., White, M. J., Srinivasan, R., Santhi, C., Harmel, R. D., Van Griensven, A., Van Liew, M. W., and Kannan, N.: SWAT: Model use, calibration, and validation, T. ASABE, 55, 1491–1508, 2012.
Batalla, R. J., Gomez, C. M., and Kondolf, G. M.: Reservoir-induced hydrological changes in the Ebro River basin (NE Spain), J. Hydrol., 290, 117–136, 2004.
Branets, L. V., Ghai, S. S., Lyons, S. L., and Wu, X.-H.: Challenges and technologies in reservoir modeling, Commun. Comput. Phys., 6, 1–23, 2009.
Chen, Y., Marek, G. W., Marek, T. H., Brauer, D. K., and Srinivasan, R.: Assessing the Efficacy of the SWAT Auto-Irrigation Function to Simulate Irrigation, Evapotranspiration, and Crop Response to Management Strategies of the Texas High Plains, Water, 9, 509, https://doi.org/10.3390/w9070509, 2017.
Coerver, H. M., Rutten, M. M., and van de Giesen, N. C.: Deduction of reservoir operating rules for application in global hydrological models, Hydrol. Earth Syst. Sci., 22, 831–851, https://doi.org/10.5194/hess-22-831-2018, 2018.
Conservation Technology Information Center (CTIC): Crop residue management survey, available at: http://www.ctic.org/resourcedisplay/255/, last access: 3 June 2017.
Dogrul, E. C., Kadir, T. N., Brush, C. F., and Chung, F. I.: Linking groundwater simulation and reservoir system analysis models: The case for California's Central Valley, Environ. Modell. Softw., 77, 168–182, 2016.
Graf, W. L.: Dam nation: A geographic census of American dams and their large-scale hydrologic impacts, Water Resour. Res., 35, 1305–1311, 1999.
Haddeland, I., Skaugen, T., and Lettenmaier, D. P.: Hydrologic effects of land and water management in North America and Asia: 1700–1992, Hydrol. Earth Syst. Sci., 11, 1035–1045, https://doi.org/10.5194/hess-11-1035-2007, 2007.
Hao, Z., Chen, S., Li, Z., Yu, Z., Shao, Q., Yuan, F., and Shi, F.: Quantitative assessment of the impacts of irrigation on surface water fluxes in the Tarim River, China, Hydrol. Res., 46, 996–1007, 2015.
Hillman, B., Douglas, E. M., and Terkla, D.: An analysis of the allocation of Yakima River water in terms of sustainability and economic efficiency, J. Environ. Manage., 103, 102–112, 2012.
Höge, M., Wöhling, T., and Nowak, W.: A primer for model selection: The decisive role of model complexity, Water Resour. Res., 54, 1688–1715, 2018.
Huang, F., Chen, Q., Li, F., Zhang, X., Chen, Y., Xia, Z., and Qiu, L.: Reservoir-Induced Changes in Flow Fluctuations at Monthly and Hourly Scales: Case Study of the Qingyi River, China, J. Hydrol. Eng., 20, 05015008, https://doi.org/10.1061/(ASCE)HE.1943-5584.0001233, 2015.
Jackson, R. B., Carpenter, S. R., Dahm, C. N., McKnight, D. M., Naiman, R. J., Postel, S. L., and Running, S. W.: Water in a changing world, Ecol. Appl., 11, 1027–1045, 2001.
Legates, D. R. and McCabe, G. J.: Evaluating the use of “goodness-of-fit” measures in hydrologic and hydroclimatic model validation, Water Resour. Res., 35, 233–241, 1999.
Leng, G., Huang, M., Tang, Q., Sacks, W. J., Lei, H., and Leung, L. R.: Modeling the effects of irrigation on land surface fluxes and states over the conterminous United States: Sensitivity to input data and model parameters, J. Geophys. Res.-Atmos., 118, 9789–9803, 2013.
Lu, X. X. and Siew, R. Y.: Water discharge and sediment flux changes over the past decades in the Lower Mekong River: possible impacts of the Chinese dams, Hydrol. Earth Syst. Sci., 10, 181–195, https://doi.org/10.5194/hess-10-181-2006, 2006.
Lv, M., Hao, Z., Lin, Z., Ma, Z., Lv, M., and Wang, J.: Reservoir operation with feedback in a coupled land surface and hydrologic model: a case study of the Huai River Basin, China, J. Am. Water Resour. As., 52, 168–183, 2016.
Maier, N. and Dietrich, J.: Using SWAT for strategic planning of basin scale irrigation control policies: a case study from a humid region in northern Germany, Water Resour. Manage., 30, 3285–3298, 2016.
Malek, K., Adam, J., Yoder, J., Brady, M., and Stockle, C.: Informing sustainable irrigation management strategies in response to implementation of Washington State's Yakima Basin Integrated Plan (YBIP), AGU Fall Meeting Abstracts, 2014.
Malek, K., Adam, J., Stockle, C., and Brady, M.: What are the downstream water availability consequences of switching to more efficient irrigation systems?, AGU Fall Meeting Abstracts, 2016.
Malek, K., Adam, J., Stockle, C., and Peters, T.: Climate change reduces water availability for agriculture by decreasing non-evaporative irrigation losses, J. Hydrol., 561, 444–460, 2017.
Miles, E. L., Snover, A. K., Hamlet, A. F., Callahan, B., and Fluharty, D.: Pacific Northwest regional assessment: the impacts of climate variability and climate change on the water resources of the Columbia River Basin, J. Am. Water Resour. Assoc., 36, 399–420, 2000.
Moriasi, D. N., Arnold, J. G., Van Liew, M. W., Bingner, R. L., Harmel, R. D., and Veith, T. L.: Model evaluation guidelines for systematic quantification of accuracy in watershed simulations, T. ASABE, 50, 885–900, 2007.
Mu, Q., Zhao, M., and Running, S. W.: Improvements to a MODIS global terrestrial evapotranspiration algorithm, Remote Sens. Environ., 115, 1781–1800, 2011.
Nash, J. E. and Sutcliffe, J. V.: River flow forecasting through conceptual models part I – A discussion of principles, J. Hydrol., 10, 282–290, 1970.
Neitsch, S. L., Arnold, J. G., Kiniry, J. R., and Williams, J. R.: Soil and water assessment tool theoretical documentation version 2009, Texas Water Resources Institute, 2011.
Poff, N. L., Allan, J. D., Palmer, M. A., Hart, D. D., Richter, B. D., Arthington, A. H., Rogers, K. H., Meyer, J. L., and Stanford, J. A.: River flows and water wars: emerging science for environmental decision making, Front. Ecol. Environ., 1, 298–306, 2003.
Polo, M. J., Rovira, A., García-Contreras, D., Contreras, E., Millares, A., Aguilar, C., and Losada, M. A.: Reservoir impacts downstream in highly regulated river basins: the Ebro delta and the Guadalquivir estuary in Spain, Proc. IAHS, 373, 45–49, https://doi.org/10.5194/piahs-373-45-2016, 2016.
Rost, S., Gerten, D., Bondeau, A., Lucht, W., Rohwer, J., and Schaphoff, S.: Agricultural green and blue water consumption and its influence on the global water system, Water Resour. Res., 44, https://doi.org/10.1029/2007WR006331, 2008.
Sacks, W. J., Cook, B. I., Buenning, N., Levis, S., and Helkowski, J. H.: Effects of global irrigation on the near-surface climate, Clim. Dynam., 33, 159–175, 2009.
Santhi, C., Muttiah, R., Arnold, J., and Srinivasan, R.: A GIS-based regional planning tool for irrigation demand assessment and savings using SWAT, T. ASAE, 48, 137–147, 2005.
Shadkam, S., Ludwig, F., van Oel, P., Kirmit, Ç., and Kabat, P.: Impacts of climate change and water resources development on the declining inflow into Iran's Urmia Lake, J. Great Lakes Res., 42, 942–952, 2016.
Siebert, S., Burke, J., Faures, J. M., Frenken, K., Hoogeveen, J., Döll, P., and Portmann, F. T.: Groundwater use for irrigation – a global inventory, Hydrol. Earth Syst. Sci., 14, 1863–1880, https://doi.org/10.5194/hess-14-1863-2010, 2010.
US Bureau of Reclaimation (USBR): Yakima River Basin Integrated Water Resource Management Plan, available at: https://www.usbr.gov/pn/programs/yrbwep/2011integratedplan/plan/framework.pdf, last access: 10 May 2018.
US Department of Agriculture (USDA): Usual Planting and Harvesting Dates for U.S. Field Crops, available at: http://usda.mannlib.cornell.edu/MannUsda/viewDocumentInfo.do?documentID=1251, last access: 11 June 2017.
US Department of Agriculture-Economic Research Services (USDA-ERS): Fertilizer Use and Price, available at: http://www.ers.usda.gov/data-products/fertilizer-use-and-price.aspx#.UmluAvmkqpA, last access: 2 January 2018.
Vaccaro, J. J. and Olsen, T. D.: Estimates of Ground-Water Recharge to the Yakima River Basin Aquifer System, Washington, for Predevelopment and Current Land-Use and Land-Cover Conditions, Geological Survey (US), 2328–0328, 2007.
Vano, J. A., Scott, M. J., Voisin, N., Stöckle, C. O., Hamlet, A. F., Mickelson, K. E., Elsner, M. M., and Lettenmaier, D. P.: Climate change impacts on water management and irrigated agriculture in the Yakima River Basin, Washington, USA, Climatic Change, 102, 287–317, 2010.
Vicente-Serrano, S., Zabalza-Martínez, J., Borràs, G., López-Moreno, J. I., Pla, E., Pascual, D., Savé, R., Biel, C., Funes, I., and Martín-Hernández, N.: Effect of reservoirs on streamflow and river regimes in a heavily regulated river basin of Northeast Spain, Catena, 149, 727–741, 2017.
Vörösmarty, C. J. and Sahagian, D.: Anthropogenic disturbance of the terrestrial water cycle, AIBS Bulletin, 50, 753–765, 2000.
Wada, Y., Bierkens, M. F. P., de Roo, A., Dirmeyer, P. A., Famiglietti, J. S., Hanasaki, N., Konar, M., Liu, J., Müller Schmied, H., Oki, T., Pokhrel, Y., Sivapalan, M., Troy, T. J., van Dijk, A. I. J. M., van Emmerik, T., Van Huijgevoort, M. H. J., Van Lanen, H. A. J., Vörösmarty, C. J., Wanders, N., and Wheater, H.: Huma–water interface in hydrological modelling: current status and future directions, Hydrol. Earth Syst. Sci., 21, 4169–4193, https://doi.org/10.5194/hess-21-4169-2017, 2017.
Wu, Y. and Chen, J.: An operation-based scheme for a multiyear and multipurpose reservoir to enhance macroscale hydrologic models, J. Hydrometeorol., 13, 270–283, 2012.
Yang, Q., Tian, H., Li, X., Tao, B., Ren, W., Chen, G., Lu, C., Yang, J., Pan, S., and Banger, K.: Spatiotemporal patterns of evapotranspiration along the North American east coast as influenced by multiple environmental changes, Ecohydrology, 8, 714–725, 2014.
Yang, Q., Tian, H., Friedrichs, M. A., Liu, M., Li, X., and Yang, J.: Hydrological responses to climate and land-use changes along the North American east coast: A 110-Year historical reconstruction, J. Am. Water Resour. Assoc., 51, 47–67, 2015.
Yeh, W. W. G.: Reservoir management and operations models: A state-of-the-art review, Water Resour. Res., 21, 1797–1818, 1985.
Yoder, J., Adam, J., Brady, M., Cook, J., Katz, S., Johnston, S., Malek, K., McMillan, J., and Yang, Q.: Benefit-Cost Analysis of Integrated Water Resource Management: Accounting for Interdependence in the Yakima Basin Integrated Plan, J. Am. Water Resour. Assoc., 53, 456–477, 2017.
Zagona, E. A., Fulp, T. J., Shane, R., Magee, T., and Goranflo, H. M.: RiverWare: A generalized tool for complex reservoir system modeling, J. Am. Water Resour. Assoc., 37, 913–929, 2001.
Zajac, Z., Revilla-Romero, B., Salamon, P., Burek, P., Hirpa, F. A., and Beck, H.: The impact of lake and reservoir parameterization on global streamflow simulation, J. Hydrol., 548, 552–568, 2017.
Zhang, X., Srinivasan, R., and Bosch, D.: Calibration and uncertainty analysis of the SWAT model using Genetic Algorithms and Bayesian Model Averaging, J. Hydrol., 374, 307–317, https://doi.org/10.1016/j.jhydrol.2009.06.023, 2009a.
Zhang, X., Srinivasan, R., Zhao, K., and Liew, M. V.: Evaluation of global optimization algorithms for parameter calibration of a computationally intensive hydrologic model, Hydrol. Process., 23, 430–441, 2009b.
Zhang, X., Beeson, P., Link, R., Manowitz, D., Izaurralde, R. C., Sadeghi, A., Thomson, A. M., Sahajpal, R., Srinivasan, R., and Arnold, J. G.: Efficient multi-objective calibration of a computationally intensive hydrologic model with parallel computing software in Python, Environ. Modell. Softw., 46, 208–218, 2013.