the Creative Commons Attribution 4.0 License.
the Creative Commons Attribution 4.0 License.
 | 19 Aug 2019
An evaluation of daily precipitation from a regional atmospheric reanalysis over Australia
Suwash Chandra Acharya
Rory Nathan
Quan J. Wang
Chun-Hsu Su
Nathan Eizenberg
An accurate representation of spatio-temporal characteristics of precipitation fields is fundamental for many hydro-meteorological analyses but is often limited by the paucity of gauges. Reanalysis models provide systematic methods of representing atmospheric processes to produce datasets of spatio-temporal precipitation estimates. The precipitation from the reanalysis datasets should, however, be evaluated thoroughly before use because it is inferred from physical parameterization. In this paper, we evaluated the precipitation dataset from the Bureau of Meteorology Atmospheric high-resolution Regional Reanalysis for Australia (BARRA) and compared it against (a) gauged point observations, (b) an interpolated gridded dataset based on gauged point observations (AWAP – Australian Water Availability Project), and (c) a global reanalysis dataset (ERA-Interim). We utilized a range of evaluation metrics such as continuous metrics (correlation, bias, variability, and modified Kling–Gupta efficiency), categorical metrics, and other statistics (wet-day frequency, transition probabilities, and quantiles) to ascertain the quality of the dataset. BARRA, in comparison with ERA-Interim, shows a better representation of rainfall of larger magnitude at both the point and grid scale of 5 km. BARRA also more closely reproduces the distribution of wet days and transition probabilities. The performance of BARRA varies spatially, with better performance in the temperate zone than in the arid and tropical zones. A point-to-grid evaluation based on correlation, bias, and modified Kling–Gupta efficiency (KGE′) indicates that ERA-Interim performs on par or better than BARRA. However, on a spatial scale, BARRA outperforms ERA-Interim in terms of the KGE′ score and the components of the KGE′ score. Our evaluation illustrates that BARRA, with richer spatial variations in climatology of daily precipitation, provides an improved representation of precipitation compared with the coarser ERA-Interim. It is a useful complement to existing precipitation datasets for Australia, especially in sparsely gauged regions.
- Article
(3396 KB) - Full-text XML
-
Supplement
(554 KB) - BibTeX
- EndNote


Availability of accurate precipitation datasets is an essential requirement for the modelling of natural processes, hydro-meteorological analyses and forecasting, and monitoring climatic variations and changes (Kirschbaum et al., 2017; Kucera et al., 2013; Robertson et al., 2013). Comprehensive knowledge of occurrence and distribution of precipitation is however hindered by the sparseness of the gauging network. Variations in the density and coverage of the gauging network make it difficult to capture information on the spatial and temporal variability of rainfall. This is particularly the case in areas covered by deserts, mountains, and oceans and in large areas with low population densities (Salio et al., 2015; Thiemig et al., 2012). This presents a challenge for the Australian continent, where the gauges are mostly located along the densely populated coastal regions. The station network is less dense in the central region, which represents the more arid part of the continent (Johnson et al., 2016).
The difficulties inherent in existing observation networks have prompted the development of various gridded datasets with a consistent spatial and temporal scale. One such precipitation dataset for Australia is the interpolated precipitation product from the Australian Water Availability Project (AWAP). Because of the uneven gauge network distribution, it is not consistent in terms of accuracy (Jones et al., 2009). Global and regional reanalysis datasets provide another source of precipitation data at a consistent spatial and temporal resolution. Such reanalysis datasets are generated using a numerical weather prediction (NWP) model and a data assimilation scheme to incorporate the available observations, thereby providing a consistent method of representation of the atmosphere at a regular interval over a larger spatial and temporal domain (Parker, 2016). A range of global reanalysis datasets such as National Centers for Environmental Prediction – Climate Forecast System Reanalysis (NCEP-CFSR; Saha et al., 2010), the European Centre for Medium-Range Weather Forecasts (ECMWF) ReAnalysis Interim (ERA-Interim; Dee et al., 2011), and the Japanese 55-year Reanalysis (JRA-55; Kobayashi et al., 2015) are readily available.
Global reanalysis datasets have been evaluated for various applications at global and regional scales. Of the global dataset exclusively based on reanalysis, ERA-Interim is generally considered to provide better performance compared with other reanalysis datasets (Beck et al., 2017, 2019). ERA-Interim has been found to reproduce the climatology of global monsoon precipitation (Lin et al., 2014), and in general it demonstrates high temporal and spatial correlations with interpolated observations (Donat et al., 2014). In a recent global evaluation of gridded precipitation datasets using gauge observations by Beck et al. (2017), the ERA-Interim and JRA-55 reanalysis datasets were found to reproduce long-term trends and temporal correlation more reliably than those achieved by satellite datasets. On the Australian continent, ERA-Interim reproduced the observed spatial patterns of long-term rainfall along with other climatic variables and showed an overall better performance compared with NCEP-NCAR (National Centers for Environmental Prediction – National Center for Atmospheric Research) reanalysis (Fu et al., 2016). An evaluation by Peña-Arancibia et al. (2013) of reanalysis datasets, satellite products, and an ensemble of these datasets in Australian and Asian regions showed that the ERA-Interim performed better than other individual datasets across a range of metrics for the Australian region.
The available global reanalysis datasets such as NCEP-CFSR, ERA-Interim, and JRA-55 cover the Australian region, but their horizontal resolutions are relatively coarse (≥80 km) and unsuitable for fine-scale application in hydro-meteorological analysis. The resolution of the global reanalysis can be enhanced by downscaling approaches such as dynamic downscaling (Soares et al., 2012) or statistical analysis using high-resolution surface observations (Vidal et al., 2010). Alternatively, the application of regional model-based data assimilation can provide a better representation of local climate features and extreme events (Bollmeyer et al., 2015). The regional reanalysis, unlike global reanalysis, allows the integration of abundant local surface observations at a finer scale (Bollmeyer et al., 2015; Isotta et al., 2015; Jakob et al., 2017). The studies have also been conducted to evaluate the additional benefit of high-resolution datasets obtained from regional reanalysis. Jermey and Renshaw (2016) found that the overall performance of 12 km regional reanalysis was significantly better than 80 km ERA-Interim especially for high thresholds of rainfall. Similarly, the performance of a regional analysis against ERA-Interim at the grid scale showed an improvement in representing high-threshold events (Isotta et al., 2015; Jermey and Renshaw, 2016; Roberts and Lean, 2008) and convective events (Roberts and Lean, 2008). In general, regional reanalyses based on boundary conditions from ERA-Interim are shown to improve the performance over ERA-Interim, though these studies are largely focussed on Europe.
The Bureau of Meteorology Atmospheric high-resolution Regional Reanalysis for Australia (BARRA) includes a 12 km modelling and assimilation system (BARRA-R; in this paper, we refer to BARRA-R as BARRA for convenience), which is the first 12 km regional reanalysis conducted over Australia, New Zealand, and south-eastern Asia (Su et al., 2019). BARRA is expected to provide an improved understanding of the past weather than previously possible, particularly for extreme events, and this should support better planning and management of climate-related risks in the future. BARRA makes use of local surface observations and locally derived wind vectors which are not available to global reanalysis models. However, precipitation observations are not assimilated in BARRA. Precipitation is modelled using a microphysics parameterization and a mass flux convection scheme. The modelled precipitation can be erroneous (Bukovsky and Karoly, 2007; Parker, 2016). Therefore, it is necessary to understand the nature of the uncertainty and inaccuracies involved and to use this understanding to correct for any systematic errors.
The criteria for evaluation of the reanalysis precipitation need to be rigorous and relevant to the intended purpose of use (Parker, 2016). The type of reference datasets (point or grid), the spatial and temporal scale, and the metrics used vary widely among the studies. In general, gridded precipitation products including reanalysis datasets, satellite precipitation estimates, and/or interpolated datasets are evaluated against benchmark datasets (Baez-Villanueva et al., 2018; Beck et al., 2017; Gebremichael, 2010; Isotta et al., 2015; de Leeuw et al., 2015; Peña-Arancibia et al., 2013; Zambrano-Bigiarini et al., 2017). Suitable benchmark datasets comprise point measurements (Baez-Villanueva et al., 2018; Chiaravalloti et al., 2018; Salio et al., 2015; Thiemig et al., 2012; Zambrano-Bigiarini et al., 2017) and/or high-quality gridded datasets (Chiaravalloti et al., 2018; Isotta et al., 2015; Peña-Arancibia et al., 2013). Catchment-scale representativeness of precipitation datasets is assessed by evaluating catchment average precipitation (e.g. Thiemig et al., 2012). Evaluation studies for hydrological applications focus on a daily timescale analysis (Baez-Villanueva et al., 2018; Thiemig et al., 2012; Zambrano-Bigiarini et al., 2017), though this has been extended to a sub-daily time interval for the purpose of hydrologic risk assessment (Chiaravalloti et al., 2018).
Given the complex statistical behaviour of precipitation, a range of evaluation metrics are available which have their own assumptions and limitations. Typical metrics include unconditional scores (e.g. correlation, bias, root-mean-square error, and mean absolute error), categorical metrics (e.g. probability of detection, false alarm ratio, and skill scores), and distributional statistics (Gebremichael, 2010). In addition, statistical properties like quantiles, wet-day frequency, and transition probabilities help to ascertain if the dataset under evaluation preserves the statistical properties related to sequencing. Any single metric cannot adequately represent the nature of all errors in the precipitation products. Therefore, it is essential to evaluate multiple metrics which describe different aspects of precipitation to identify the possible sources of mismatch between datasets (Baez-Villanueva et al., 2018).
This study is one of the first comprehensive explorations of the BARRA precipitation estimates. It aims to identify strengths and limitations of the BARRA precipitation to ascertain its efficacy for further hydrometeorological applications in the Australian region. The evaluation is performed against gauged measurements from two data sources: one is based on gauged point observations, and the other is a high-resolution gridded AWAP dataset derived from interpolating gauge measurements, which is widely accepted as being the best synthesis of gauged observations. There are inherent differences in gridded and point rainfall estimates due to the spatial averaging of point observations across each grid cell area. Since BARRA provides direct estimates of area-average rainfall, it is useful to compare these estimates with the best available point and areal precipitation estimates. In addition to observed and interpolated datasets, we also compare BARRA with corresponding areal rainfalls provided by the ERA-Interim global reanalysis. ERA-Interim was selected, as it is used to drive BARRA (Su et al., 2019), and thus this comparison reveals the extent to which the high-resolution regional reanalysis provides additional value over ERA-Interim in capturing finer-scale meteorology. ERA-Interim was also selected, as it has been found to be one of the best-performing reanalysis datasets (Peña-Arancibia et al., 2013).
Despite the availability of BARRA precipitation as hourly values, we select a daily timescale to match the temporal resolution of the best available gridded reference dataset (AWAP). In addition, the accuracy at a daily scale serves as a desirable first step towards further examination at finer timescales because any reliance on sub-daily estimates necessarily depends on their ability to correctly represent daily precipitation. The additional value of evaluation at a daily scale is that it assesses the potential of BARRA to provide estimates of daily rainfall in the sparsely gauged regions across Australia. We focus our evaluation on a range of metrics related to the suitability of rainfalls for hydrological applications and climate studies. We consider the depth, statistical distribution, wet-day frequency and transition probabilities at a daily level for evaluation. The purpose of this evaluation is thus to shed light on the suitability of BARRA for input to hydro-meteorological applications related to climate change studies, water resource management, and the analyses of floods and droughts.
The sub-hourly time series of recorded rainfall from continuous rainfall stations are obtained from the Bureau of Meteorology. Daily rainfall is generated by aggregating the sub-daily rainfall observations. The period of analysis was determined by the duration at which all the datasets used in the study are available, i.e. January 2010 to December 2015. The gauge stations used in the study are chosen based on the availability of information for the entire period over which BARRA data estimates are available. A total of 441 stations are selected, and their spatial distribution is shown in Fig. 1a.
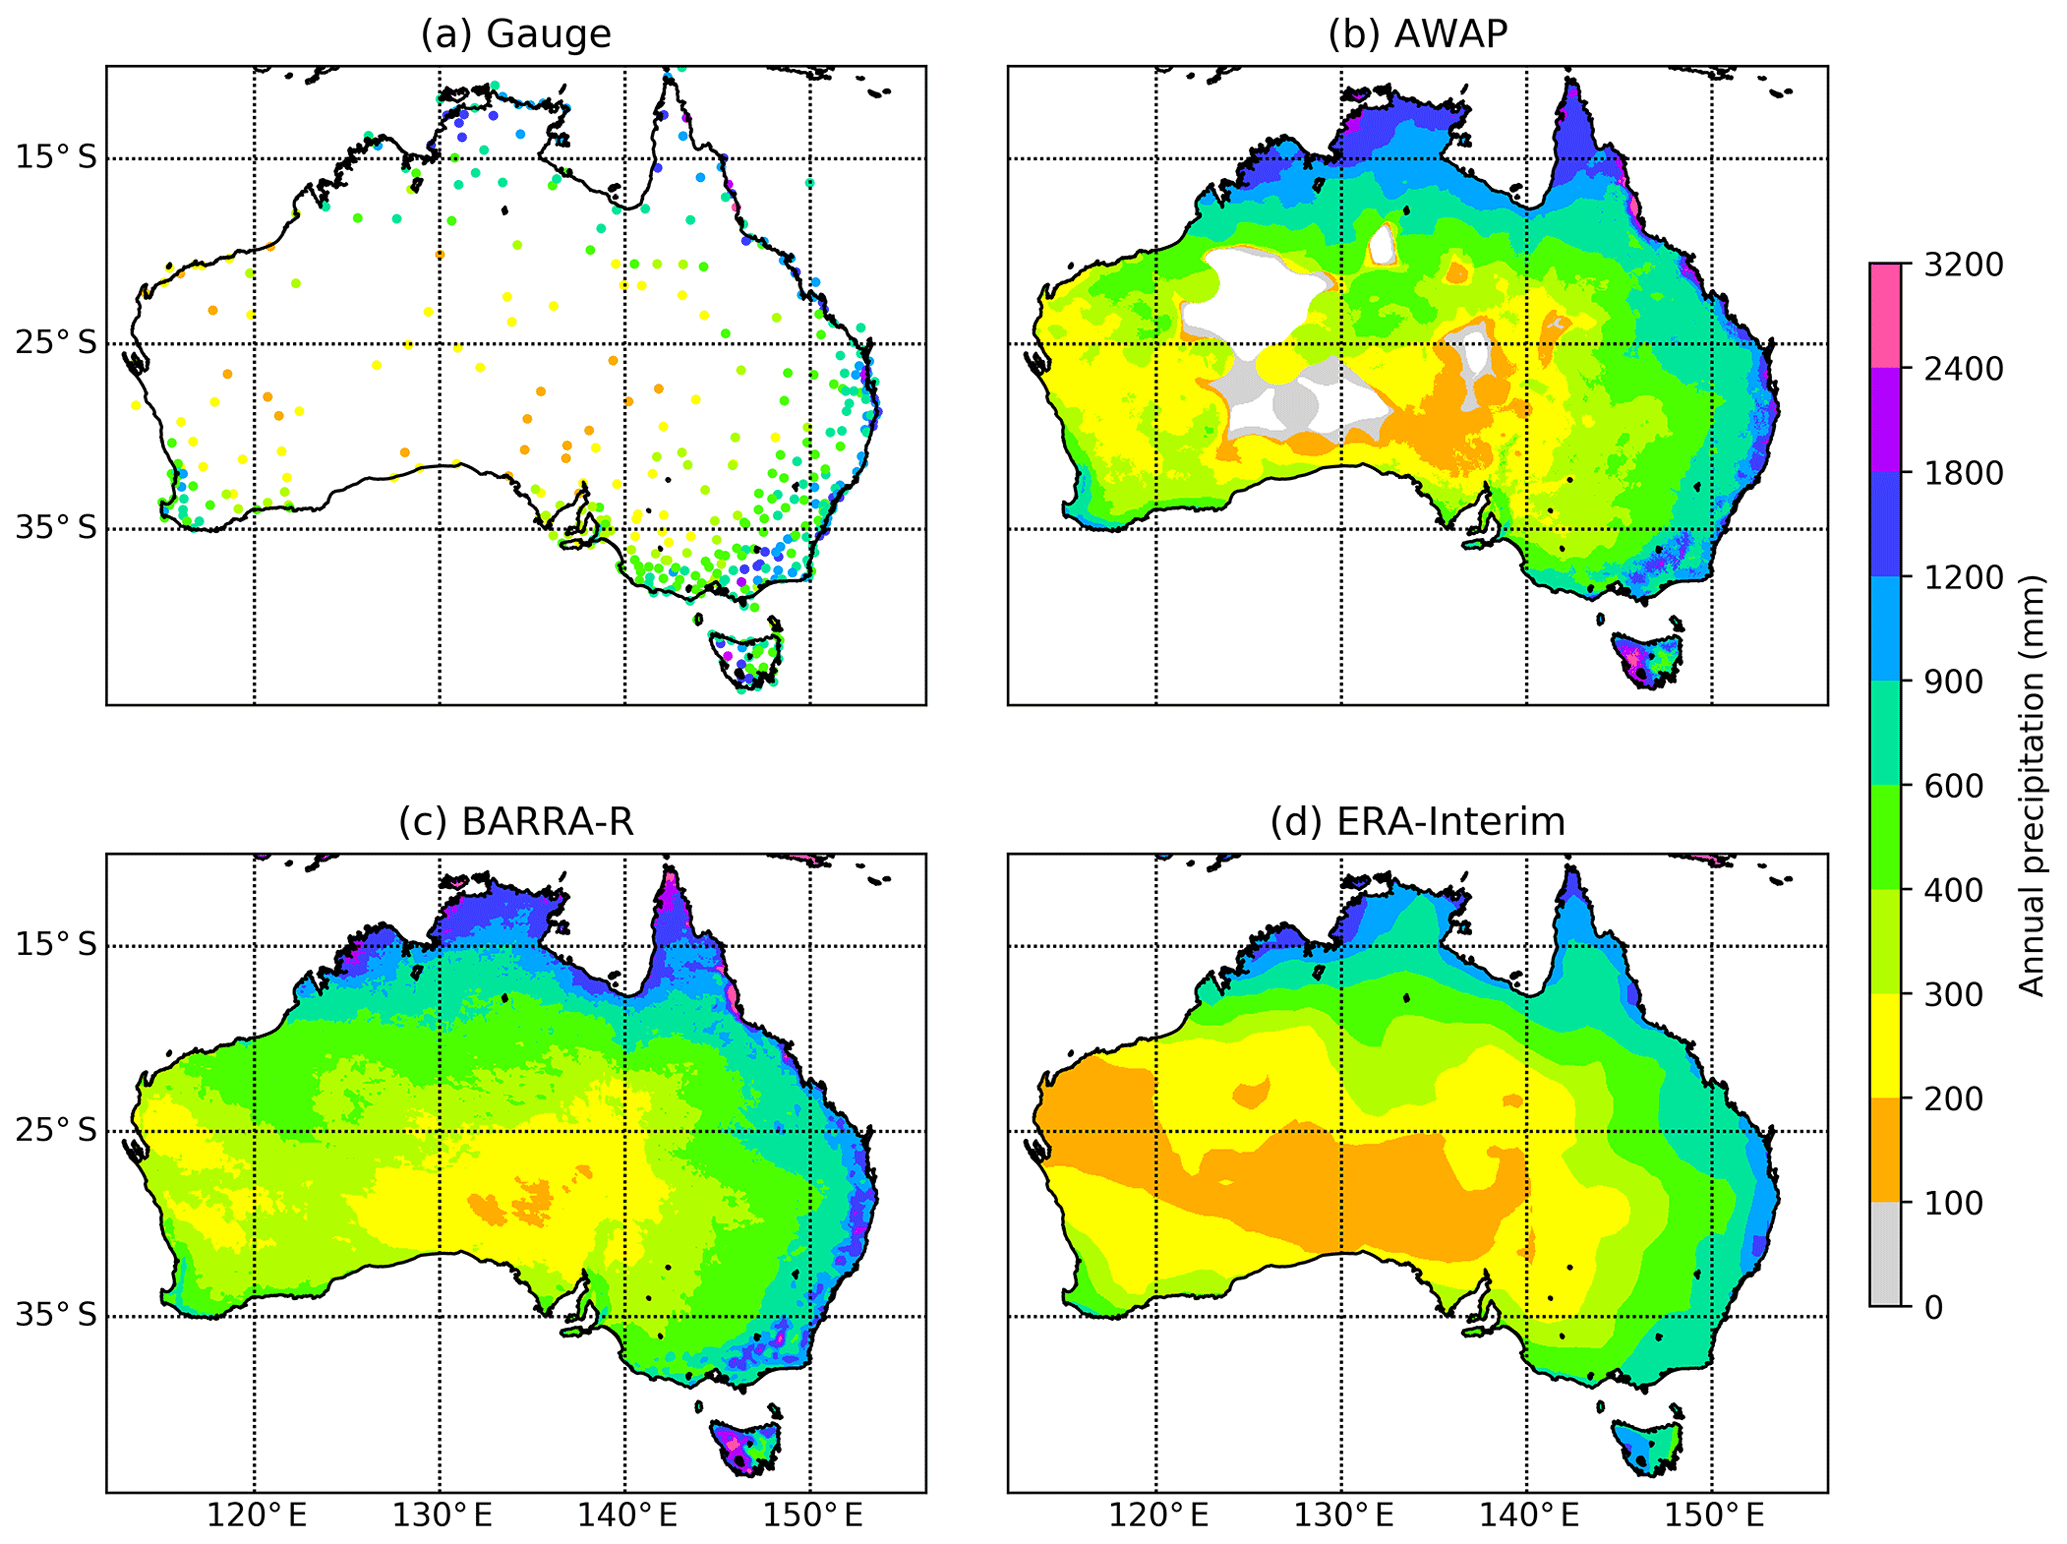
Figure 1Average annual precipitation over Australian region. (a) Gauge data, (b) AWAP, (c) BARRA, and (d) ERA-Interim. Missing values and ocean are masked in all datasets.
Table 1Overview of gridded precipitation datasets used in this study.

An overview of gridded datasets used in this study is presented in the Table 1. The Australian Water Availability Project (AWAP) provides a daily high-quality (around 5 km) gridded rainfall product, dating back to 1900 and based on an extensive network of rain gauges, as described by Jones et al. (2009). The AWAP product makes use of daily (09:00 to 09:00 local time) data from all available gauges across the whole of Australia. The gridded estimates are obtained using a weighting scheme that incorporates an optimized Barnes successive-correction algorithm and orographic corrections (Jones et al., 2009). AWAP uses land-based observations only and therefore does not provide information over the ocean.
The global reanalysis ERA-Interim of the European Centre for Medium-Range Weather Forecasts (ECMWF, https://www.ecmwf.int/, last access: 12 August 2019) covers the period from 1 January 1979 to present (Dee et al., 2011). The core component of the ERA-Interim data assimilation system is the 12 h 4D-variational (4D-Var) analysis scheme of the upper-air atmospheric state, which is on a spectral grid with triangular truncation of 255 waves (corresponding to approximately 80 km) and a hybrid vertical co-ordinate system with 60 vertical levels. The precipitation is estimated by the numerical model based on temperature and humidity information derived from assimilated observations originating from passive microwave and in-situ measurements. In this study, the sub-daily precipitation from ERA-Interim is converted to daily precipitation by accumulation to 24 h to be consistent with the gauged and AWAP data.
BARRA also uses 4D-Var but at the 36 km resolution and uses the Unified Model as its forecast model (Su et al., 2019). BARRA extends spatially over 65.0∘ S to 19.4∘ N, 65.0∘ to 196.9∘ E, at a spatial resolution of 0.11∘ (approximately 12 km) and with 70 levels up to 80 km into the atmosphere. The project aims to produce the dataset dating back to 1990; however, at present, only a 6-year period (2010–2015) is available. The model includes a comprehensive set of parametrizations, including a modified boundary layer scheme, mixed-phase cloud microphysics, a mass flux convection scheme, and a radiation scheme. The model parametrization in BARRA is mainly inherited from the UK Met Office (UKMO) Global Atmosphere (GA) 6.0 configurations as described in Walters et al. (2017). Surface and satellite rainfall observations are not assimilated, and the precipitation fields are determined using the assimilated large-scale variables and the physical parameterization of the model. At 12 km horizontal resolution, BARRA requires the convection scheme to model sub-grid-scale convection using an ensemble of cumulus clouds as a single entraining–detraining plume (Clark et al., 2016). The scheme prevents unstable growth of cloud structures on the grid and explicit vertical circulations and can only predict an area-average rainfall instead of a spectrum of rainfall rates. The analysis for BARRA is conducted 4 times a day, with a 6 h analysis window centred at time t0= 00:00, 06:00, 12:00 and 18:00 UTC. The forecast cycle is 12 h, which ranges from t0–3 h to t0+ 9 h (Su et al., 2019). The BARRA precipitation forecasts from t0+4 to t0+9 h are used to generate a daily time series for the study.
3.1 Reference datasets
The study is conducted over a period of 6 years, from January 2010 to December 2015, which represents the full period of available data at the commencement of the study. We undertake a point-to-grid and grid-to-grid evaluation of the reanalysis datasets against suitable reference datasets. The gauged data represent the best estimate of rainfall at a point, and AWAP data provide the best estimate of rainfall over a grid cell. Both estimates are, however, limited by the available gauging density. AWAP estimates are based on all available daily and continuous gauges, and the point data considered here are from selected sub-daily rainfall stations with maximum availability of data over the study period. The selected gauges are distributed unevenly across Australia and are spatially representative of the available gauging network. As the gridded datasets represent an areal average, it may be expected that there are differences between point and gridded estimates, as the latter account for some spatial averaging. While the gauged data and AWAP rainfall estimates represent the best available reference datasets based on measured data, both are imperfect representations of areal rainfalls. The AWAP estimates contain inaccuracies due to the interpolation method, and the point estimates provide only a coarse estimate of rainfall over a grid cell area. The ability of these point and gridded reference datasets to represent actual areal rainfalls is heavily dependent on the gauging density and local orography, and these factors influence the accuracy of the reference datasets to different degrees across Australia. Accordingly, we compare the BARRA and ERA-Interim estimates with both point gauged and AWAP areal data, where the evaluation of both offers different insights to the quality of model estimates.
Gridded rainfalls are compared with point rainfalls using a nearest-neighbour approach. The choice of interpolation scheme is especially important when comparing datasets of different spatial resolutions; bilinear interpolation is likely to smoothen the precipitation field, resulting in higher bias for larger rainfall (Accadia et al., 2003), whereas the nearest-neighbour method preserves the magnitude of the precipitation over the grid. At each location of point rainfall, the nearest-neighbour method assigns the precipitation amount from the nearest grid point. In grid-to-grid evaluation, both reanalysis datasets are interpolated to a common AWAP spatial scale using nearest-neighbour method. This means that, for each AWAP grid, the precipitation variable is obtained from the nearest grid of reanalysis datasets. Given the spatial inconsistency in the accuracy of AWAP dataset, the grid-to-grid evaluation is limited to grid points that are nearest to the gauge stations used in this study.
The performance of daily precipitation from the reanalysis data is assessed considering all days of the year and by seasons (summer – DJF; autumn – MAM; winter – JJA; spring – SON). In addition, evaluation is stratified across three broad climatic zones (arid, tropical, and temperate) as defined by the Köppen–Geiger classification (Peel et al., 2007). Most comparisons are undertaken using estimates from every day in the 6-year period, and thus the number of wet days varies with the different datasets and locations considered. However, it is recognized that reanalysis products tend to produce a high number of days with light drizzle, and therefore they overestimate the frequency of wet days. Thus, following Baez-Villanueva et al. (2018), Ebert et al. (2007), and Zambrano-Bigiarini et al. (2017), a threshold of 1 mm d−1 is used to classify a day as “wet” or “dry”.
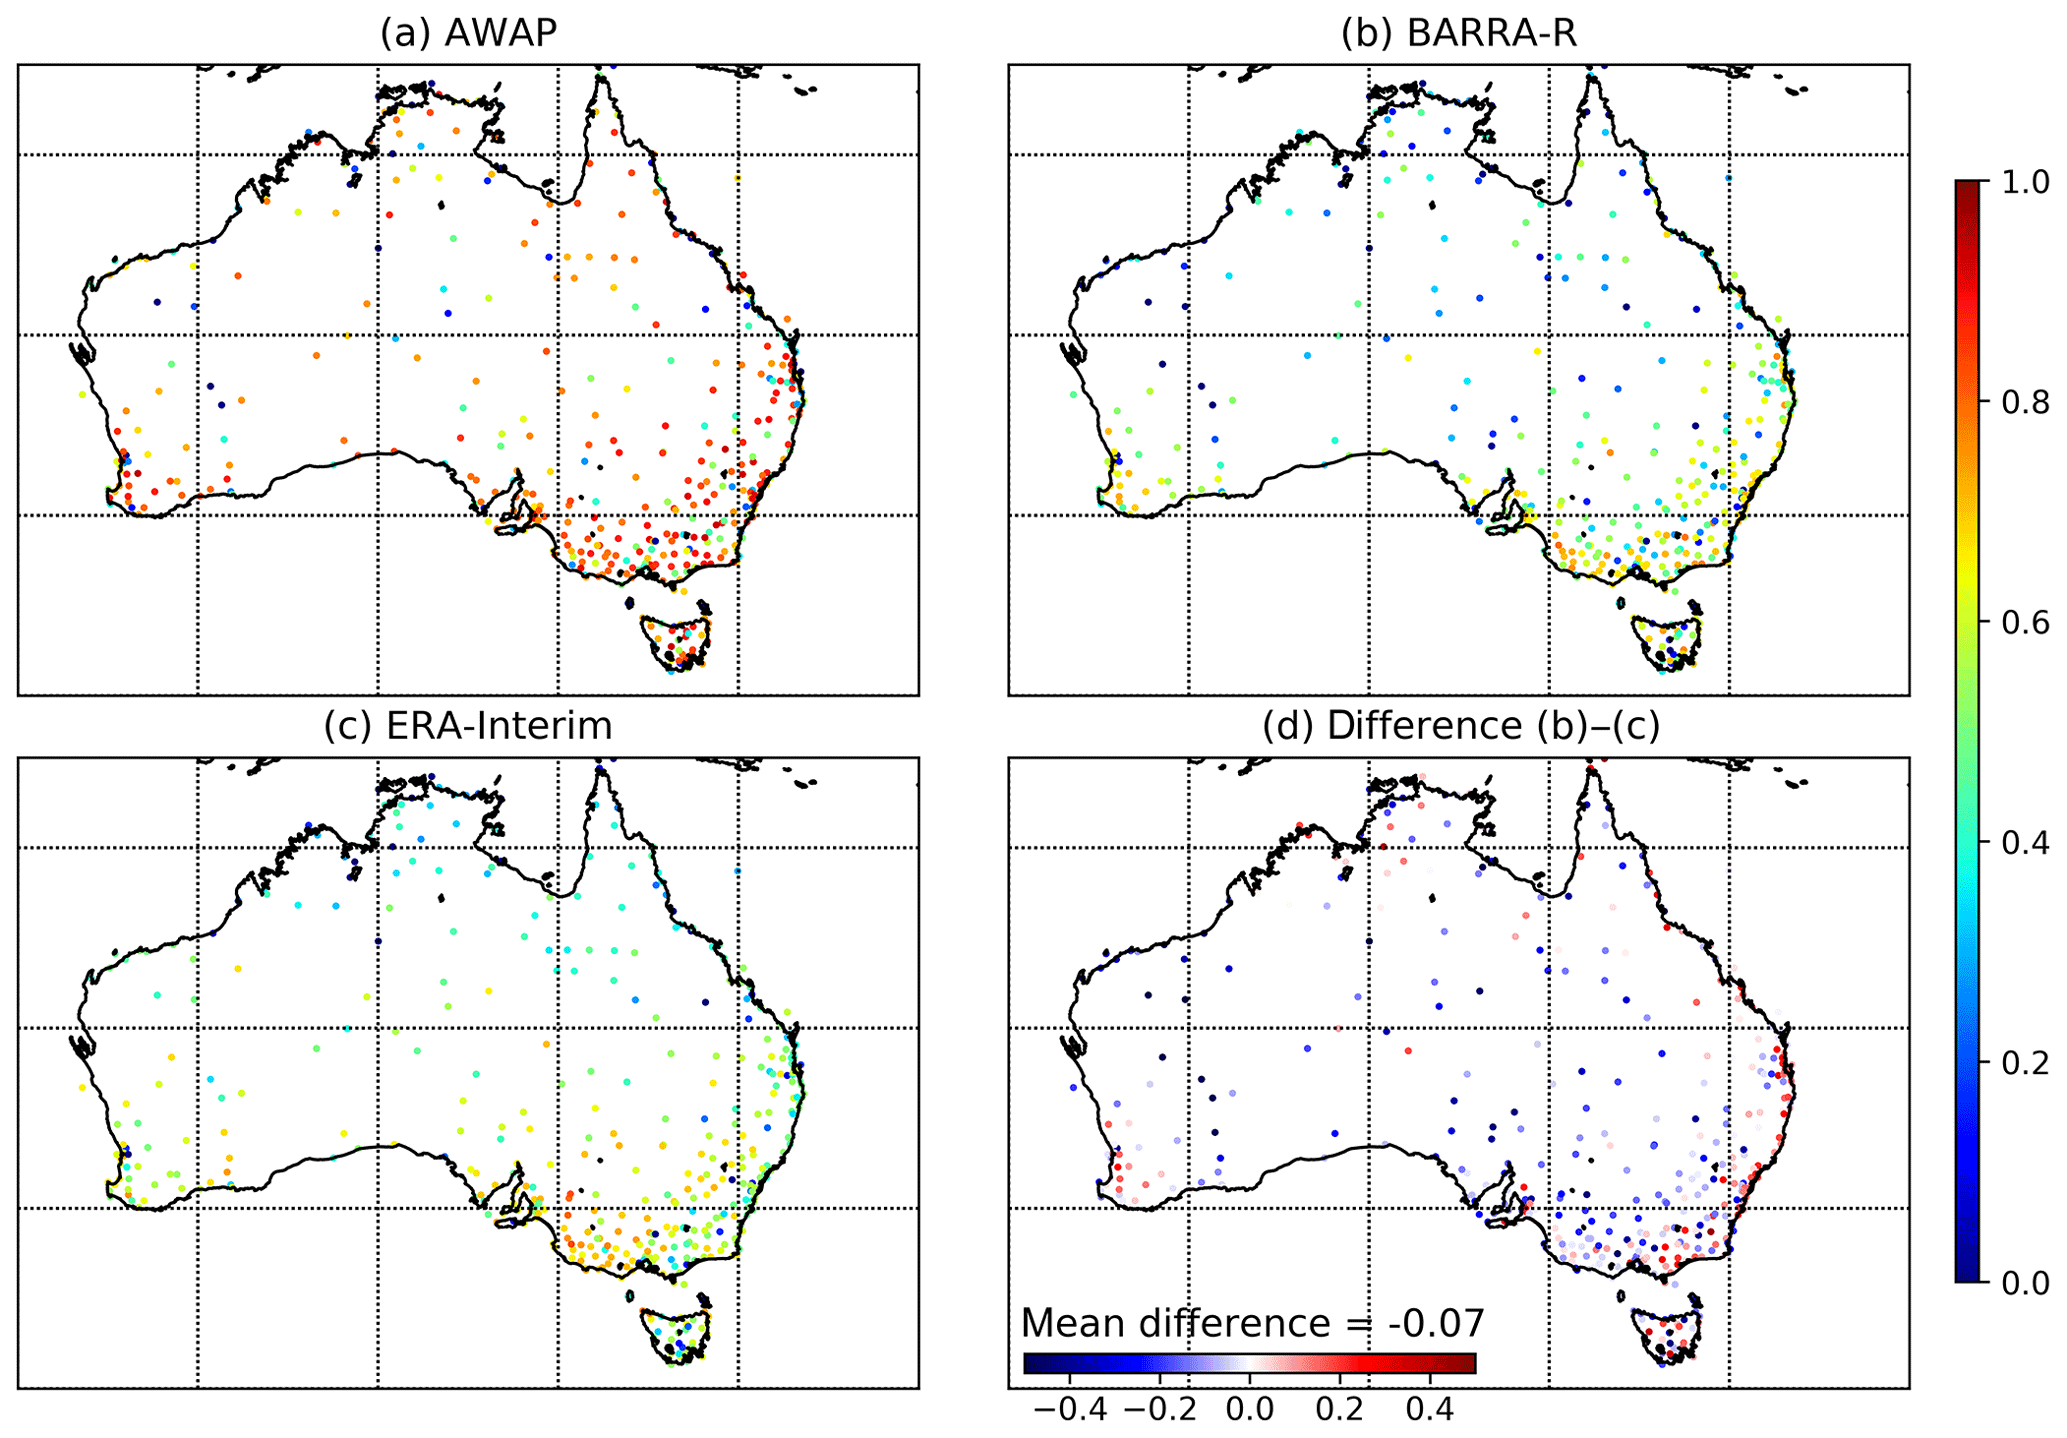
Figure 2Modified Kling–Gupta efficiency (KGE′) against gauge dataset at daily scale for (a) AWAP, (b) BARRA, and (c) ERA-Interim, and (d) difference of KGE′ between BARRA and ERA-Interim.
3.2 Performance indices
The evaluation of precipitation data generally involves an assessment of detection capabilities and biases in the form of continuous and categorical metrics. The continuous metrics used in this study are the modified Kling–Gupta efficiency (KGE′; Gupta et al., 2009; Kling et al., 2012) along with its three individual components: correlation (r), bias ratio (β), and variability ratio (γ). Baez-Villanueva et al. (2018) and Zambrano-Bigiarini et al. (2017) also suggested the use of KGE′ and its components for evaluating precipitation datasets, as it provides an overall assessment along with an error in the representation of magnitude and variability in the reference precipitation.
The four categorical indices adopted are the probability of detection (POD) or hit rate, false alarm ratio (FAR), critical success (or threat) index (CSI), and frequency bias (fBias). These are evaluated over five different rainfall intensity classes: no rain (< 1 mm), light rain (≥ 1 mm and < 5 mm), moderate rain (≥ 5 mm and < 20 mm), heavy rain (≥ 20 mm and < 40 mm), and violent rain (≥ 40 mm; Baez-Villanueva et al., 2018; Zambrano-Bigiarini et al., 2017). These standard continuous and categorical metrics are described in Table S2 in the Supplement.
3.3 Precipitation statistics
In this study, we evaluate the capacity of the reanalysis datasets to reproduce a range of precipitation statistics related to the frequency of wet days; transition probabilities between wet and dry days; and the distribution of rainfall amounts based on the 90 %, 95 %, and 99 % daily exceedance values.
The transition probabilities considered here are p01 and p11, which denote the probabilities of a dry day followed by a wet day and a wet day followed by a wet day, respectively. When considering that X0 and X1 are 2 consecutive days, and i and j are two states (0: dry; 1: wet), then the transition probability is expressed as
For a dry–wet day, ). For a wet–wet day, ).
4.1 Mean precipitation
Figure 1 shows the average annual precipitation over Australia for the period of 6 years (2010–2015) as estimated using the different datasets (gauged point rainfalls, AWAP, BARRA, and ERA-Interim). It is seen that there is a high spatial variability in the average precipitation over Australia. Regions of high rainfall (northern and eastern coasts along with western Tasmania) are similarly represented by all four datasets. ERA-Interim provides a coarser representation of the precipitation field, which expectedly fails to capture the higher spatial variability in the coastal regions and orographic precipitations in the Great Dividing Range and western Tasmania. By comparison, BARRA precipitation captures this variability in the AWAP precipitation. It should be noted, however, that the AWAP data provide a poor estimate of precipitation over central Australia, where there is a paucity of gauging information. BARRA, on the other hand, provides a high-resolution precipitation pattern over the ocean as well as the central Australian region where gauges are sparse.
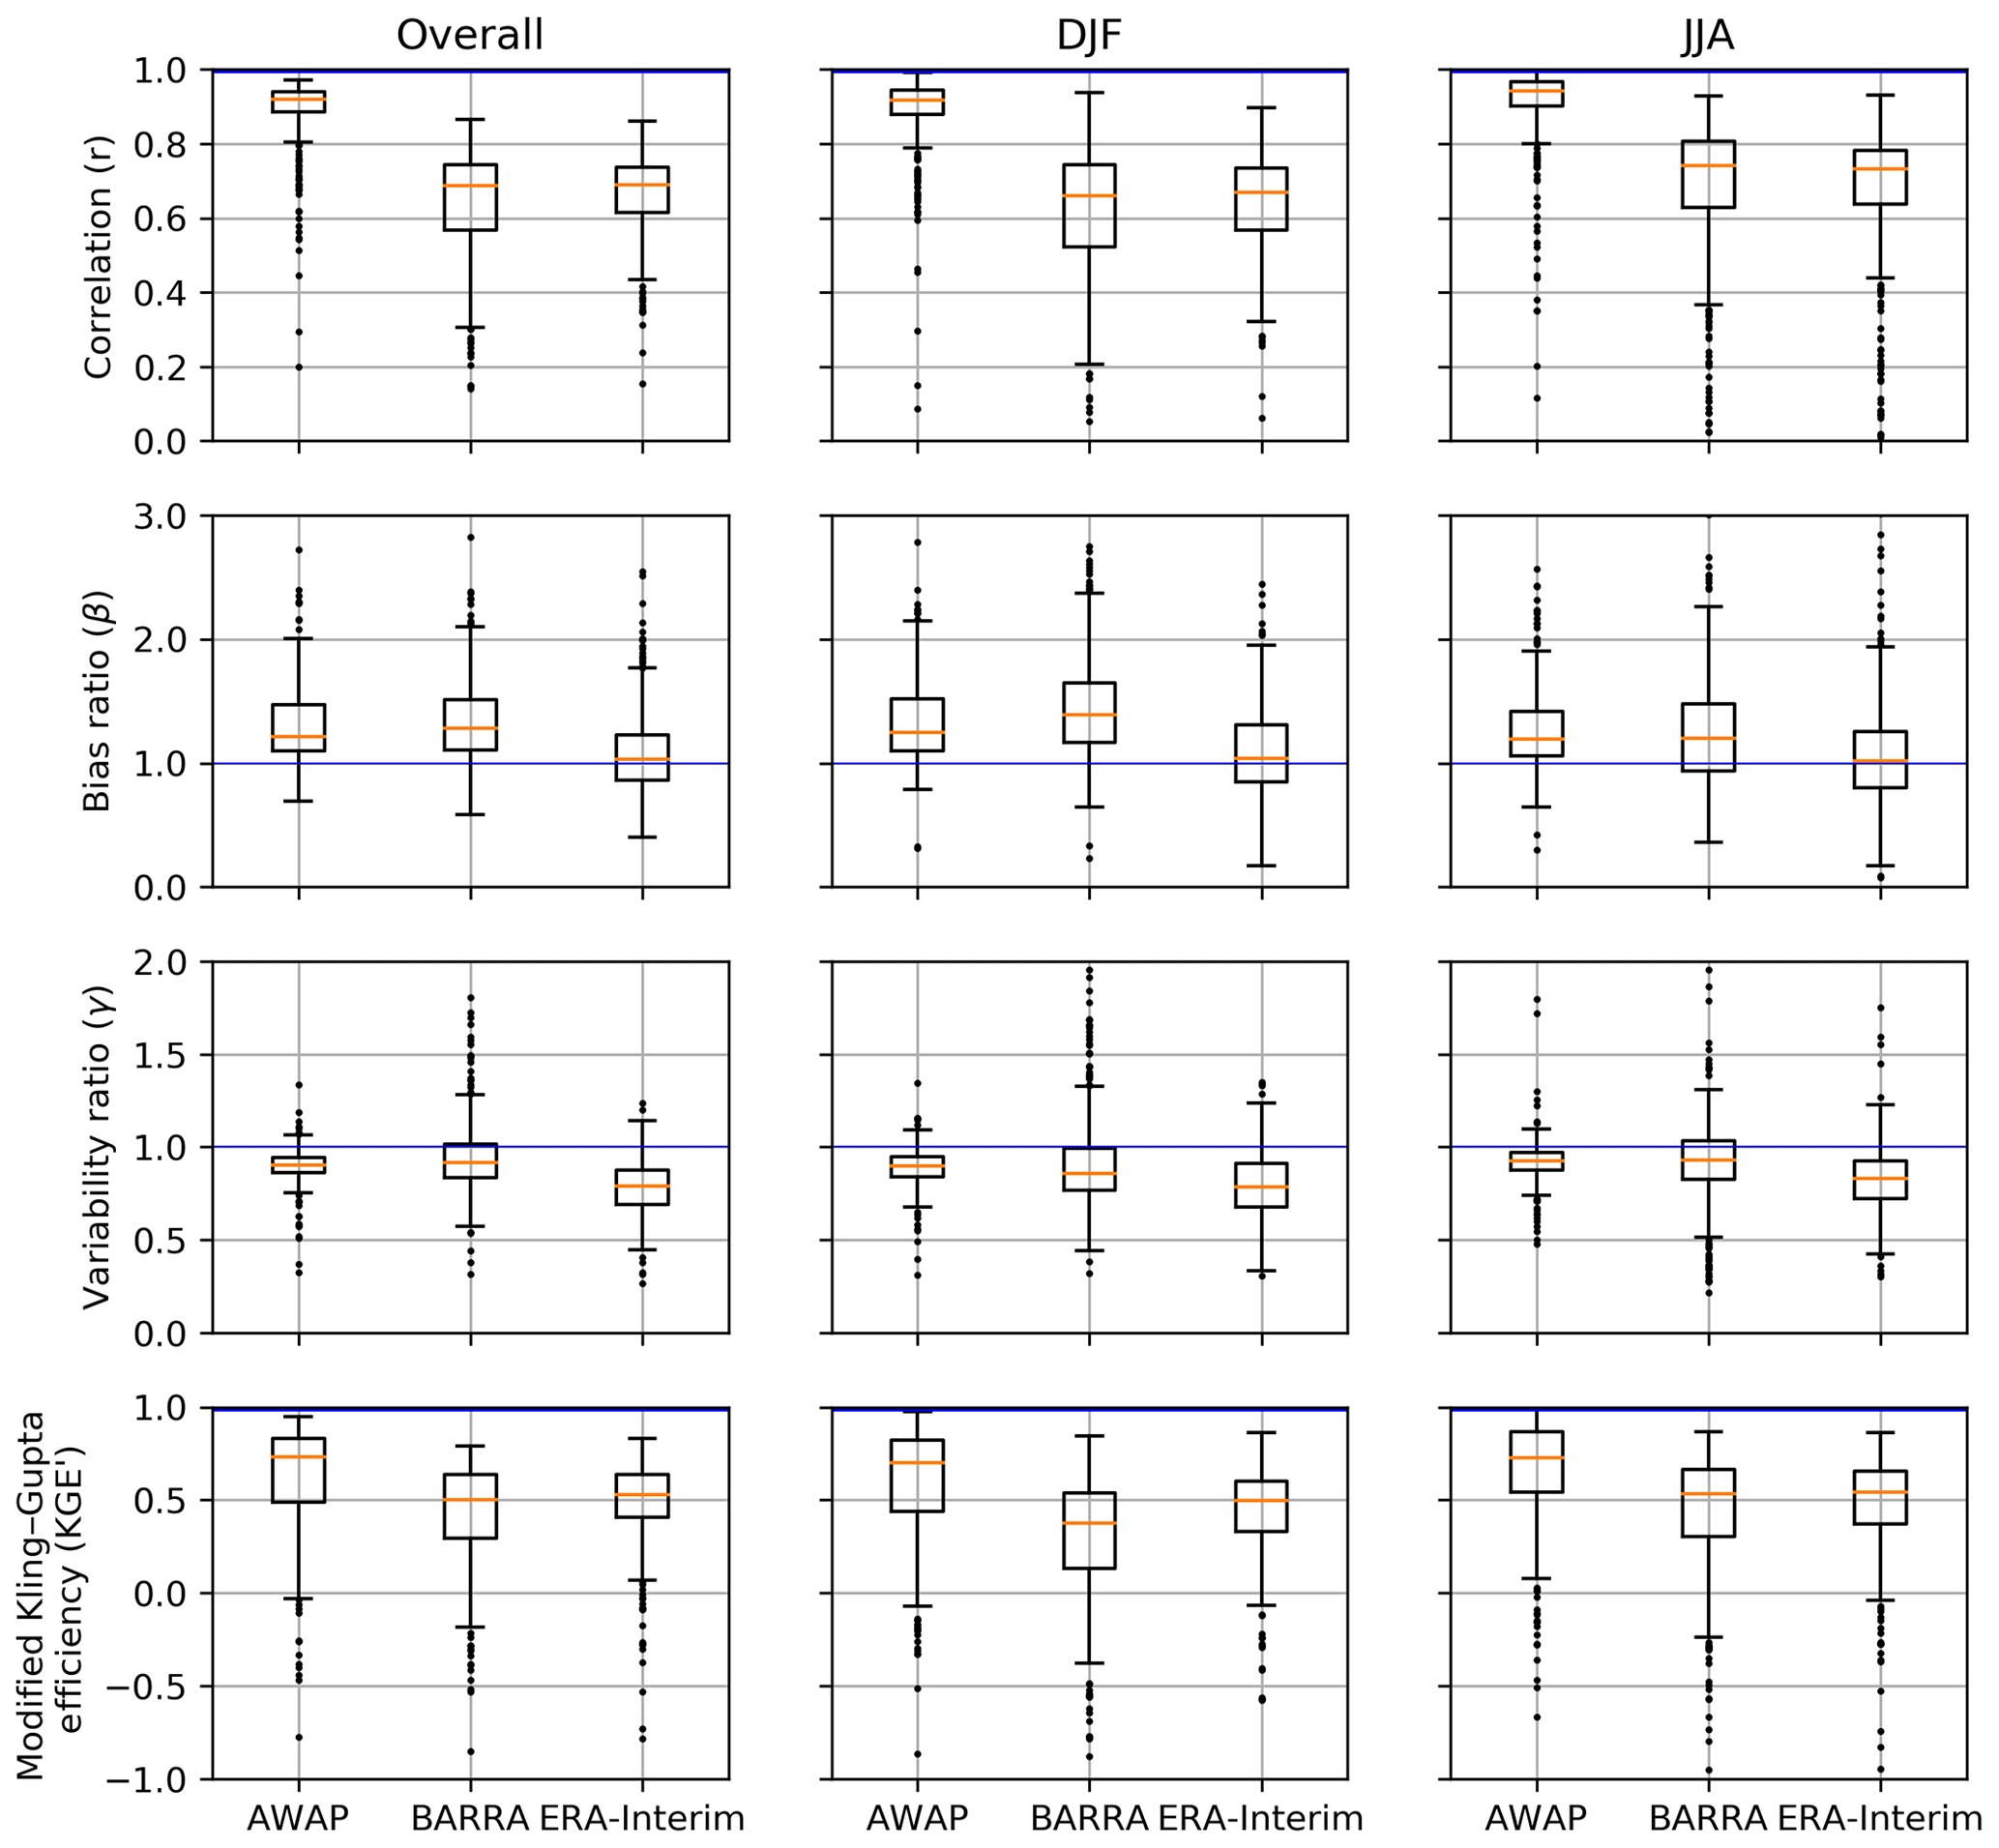
Figure 3Boxplot of correlation (r), bias ratio (β), variability ratio (γ), and modified Kling–Gupta efficiency (KGE′) between daily precipitation estimates from gridded datasets and observations at gauge locations. Columns represent overall data, summer (DJF), and winter (JJA). Each box extends from first to third quartile, medians are marked in each box, and whisker extends to furthest point or 1.5 times the interquartile range, whichever is closer. The blue horizontal line represents the best value.
4.2 Point-to-grid assessment
4.2.1 KGE′ and its components
The variation in KGE′ at the gauge locations is shown in Fig. 2. As expected, the higher performance of KGE′ is observed in the AWAP dataset, as this is derived by interpolating gauged data, which include the selected high-quality point rainfall gauges. The pattern of the KGE′ score looks similar among both reanalysis datasets. The performance, however, varies spatially, with a better score for the gauges located in the southern region in comparison to the central and northern region. A difference in the KGE′ score between BARRA and ERA-Interim (Fig. 2d) shows the difference between the performance of reanalysis datasets in various regions. In most of the locations, the difference is minimal, indicating the similar performance by both reanalysis datasets. ERA-Interim generally performs better in the central arid region, whereas BARRA exhibits better scores in the temperate region. The central arid region experiences very few rainy days, which is likely to be missed spatially by a sparse network of gauges. This could result in poor correlation metrics, as it is sensitive to outliers and subsequently yields a poor KGE′ score. BARRA precipitation is more erroneous in the tropics than in temperate regions, which may reflect the limitations of the convection parameterization adopted in BARRA. This spatially varying performance of BARRA is further discussed in Sect. 5.5.
Table 2Median values of KGE′ and its components grouped for broad Köppen–Geiger climate categories for Australia. The number in brackets indicates the number of stations in the climatic zones. Values in bold represent the best score in each group.
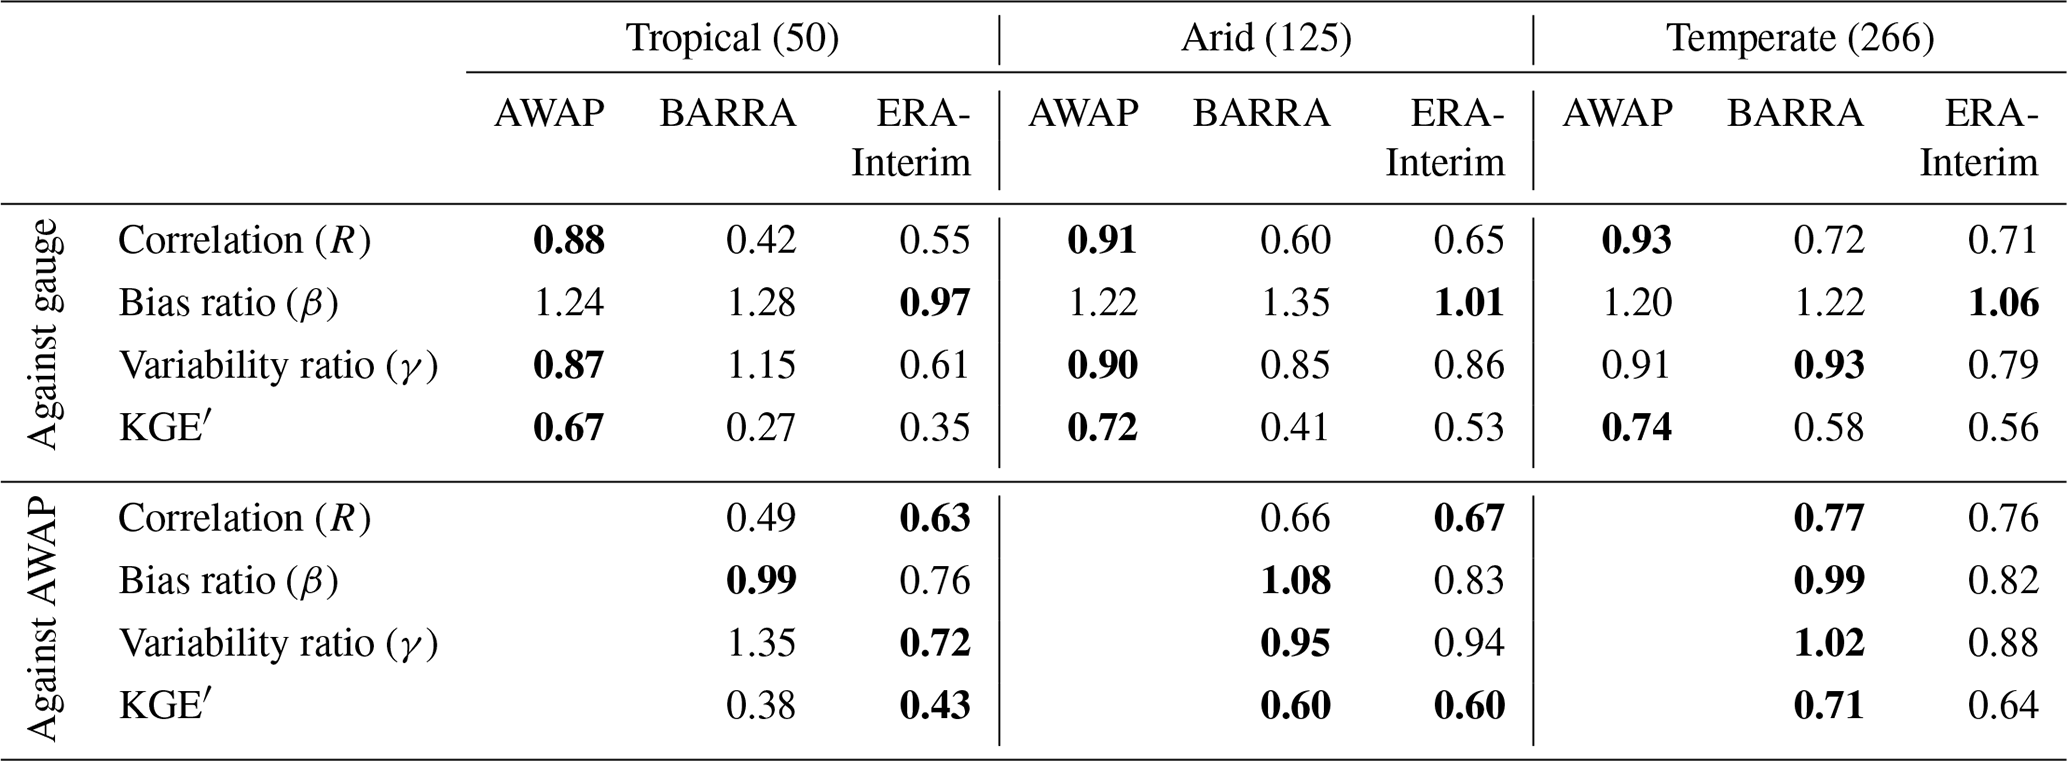
Figure 3 presents the summary of KGE′ and its components at a daily scale calculated with reference to gauge data for overall, summer, and winter seasons. In using all the data at a daily scale, the AWAP precipitation proved to be the best estimate at gauge location with the highest value of KGE′. In decomposing the overall performance of KGE′ into its components (linear correlation, r, bias ratio, β, and variability ratio, γ), AWAP achieves the best score for the correlation and variability terms. The AWAP estimates of point rainfall are higher than the gauged observations, and a similar degree of overestimation is exhibited by the BARRA dataset. The Barnes interpolation scheme used in AWAP slightly inflates the spatial coverage of light-intensity rainfall (Jones et al., 2009; King et al., 2013). In addition, the weight function assigned to gauged point rainfalls may result in wetter bias in the densely gauged (coastal) regions compared with other regions. Despite having a slightly lower correlation compared with ERA-Interim, the variability in the rainfall is better captured by the BARRA dataset. The overall KGE′ score is slightly better for ERA-Interim compared with BARRA dataset.
Evaluation of daily rainfall in different seasons reveals a mixed performance between the different reanalysis products. The performance during winter is better than in summer for both reanalysis datasets. This is likely due to the ability of NWP models to accurately simulate synoptic systems which represent the majority of wintertime rainfall. However, this difference is larger for BARRA than ERA-Interim. There is less discrepancy in the correlation between BARRA and ERA-Interim. However, the variation in correlation across stations is higher for the BARRA dataset. BARRA tends to overestimate the depth of rainfall, and the ERA-Interim underestimates variability component across all the seasons. The mean and variability for BARRA during winter (JJA) are closer to gauge estimates than in the summer (DJF) season. Based on KGE′ score, the performance of BARRA is lower than ERA-Interim during summer, whereas it is similar during the winter.
The summary of the KGE′ scores based on the climatic zone is presented in Table 2. As expected, the KGE′ scores are better for AWAP than for BARRA and ERA-Interim for all three climatic zones. The reanalyses match AWAP most closely for the temperate zone, followed by the arid zone, and performance is worst for the tropical zone. The KGE′ metric shows that BARRA performs better at the temperate zone, while ERA-Interim performs better at the tropical zone.
4.2.2 Wet day frequency and transition probabilities
Figure 4 shows the comparison of the wet-day frequency and transition probabilities (p01 – dry day followed by a wet day – and p11 – wet day followed by a wet day) at different gauge locations. Overall, BARRA shows a better correlation to the gauge estimates than ERA-Interim and is less biased except for dry–wet transition probability. As expected, the frequency of wet days and transition probabilities recorded at gauge locations are lower compared with all the gridded datasets. Wet day frequency in all gridded dataset exhibits positive bias, with a coarser dataset showing higher bias. The difference is higher for the gauge stations in the northern region. From the colour of scatter, it can be observed that the frequency of wet days is lower over central Australia and higher over the south-eastern coast and Tasmania. The level of agreement between ERA-Interim and gauge estimates of wet-day frequencies varies with the proportion of wet days. At the gauges where the frequency of the wet days is very low (< 0.2), the estimates from the ERA-Interim are closer to the gauge. However, for the remaining gauges with higher wet-day frequencies, the estimation is positively biased and highly scattered. The wet-day frequency varies spatially with the location of the station. The spatial pattern, however, is similar for all datasets. Transition probabilities are also dependent on the location of stations, with a similar overall trend for all datasets. The model estimates of transition probability p11 are greater than p01. Due to the tendency of NWP models to yield more frequent persistent light rainfalls, a high wet–wet frequency is observed. The variation in p01 and p11 in the northern region is greater than in the southern region. BARRA and AWAP both exhibit higher p01 values than gauges for all locations. The p01 for the northern region is estimated correctly by ERA-Interim; however, it exhibits more bias and spread for the southern region. In comparison to p01, p11 shows more scatter and bias. The general trend of overestimation of p11 is similar across all datasets, and the estimates are higher for the gauges located in the northern region compared with the southern region. The estimates of p11 are highly correlated for AWAP. The spatial pattern and correlation are similar for both reanalysis datasets, while BARRA exhibits less bias than ERA-Interim.

Figure 4Wet-day frequency estimates from gridded datasets (AWAP, BARRA, and ERA-Interim) and observations at gauge locations (a, b, c). Transition probabilities: dry–wet (p01: d, e, f) and wet–wet (p11: g, h, i). Colour of scatter indicates the location of the station.
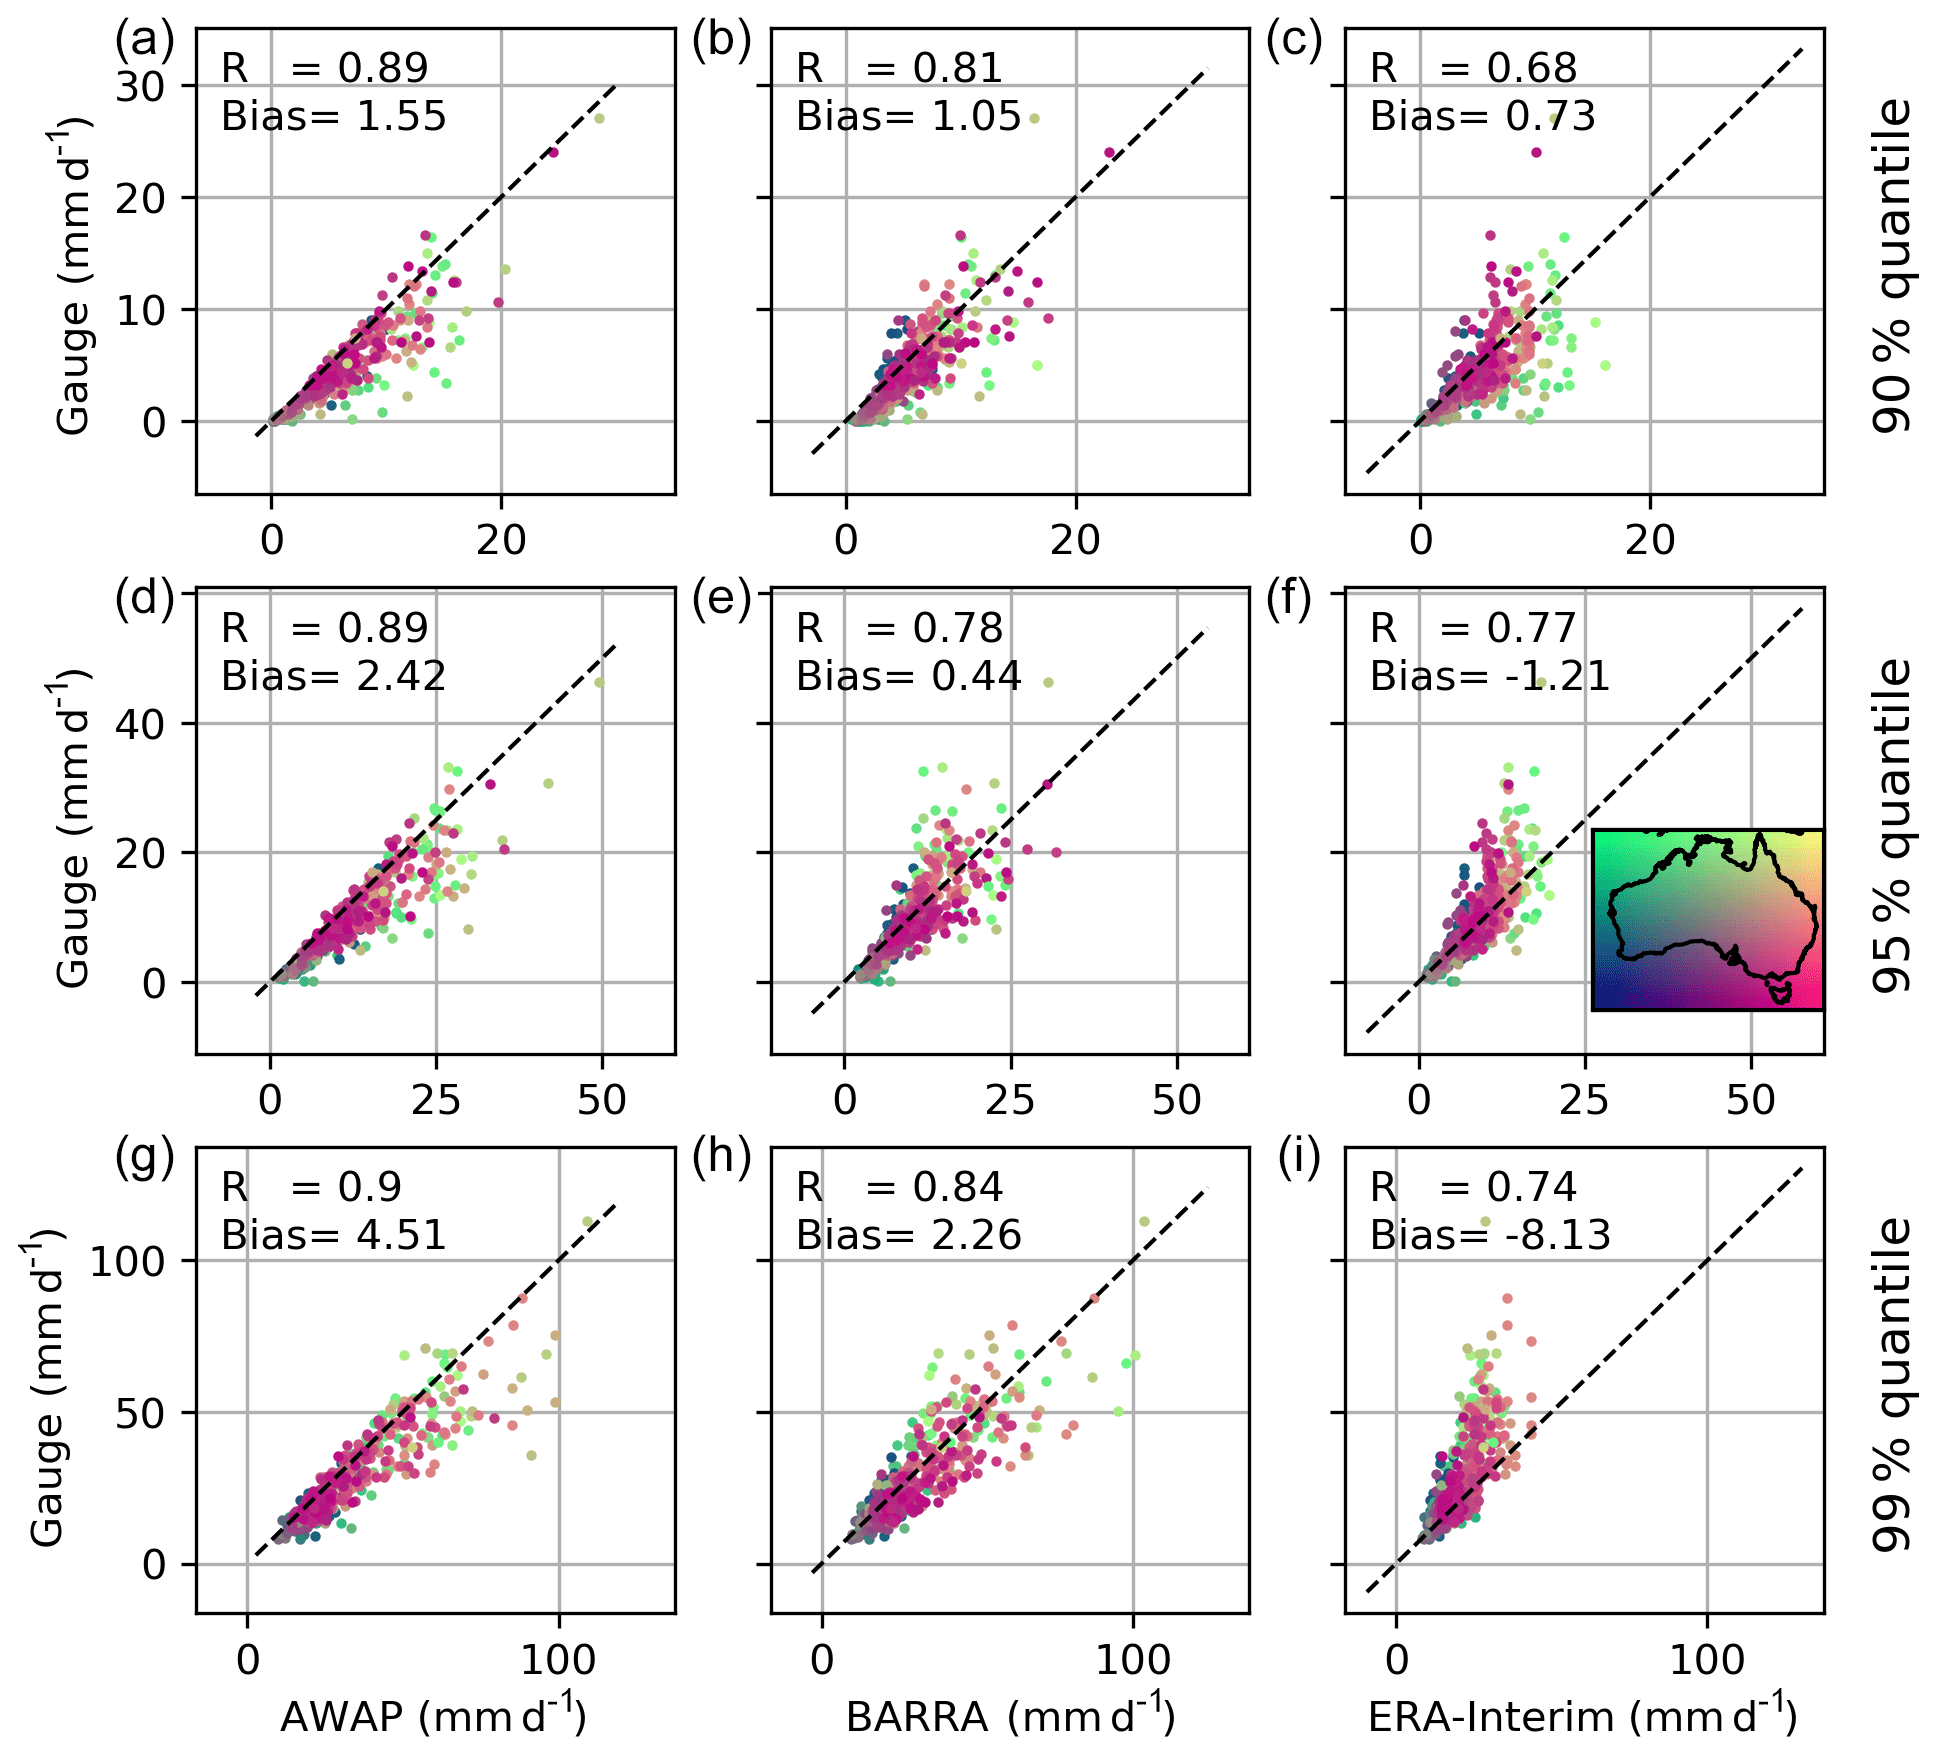
Figure 5Quantile estimates (mm d−1; 90 %, 95 %, and 99 % in a–c, d–f, and g–i, respectively) from gridded datasets (AWAP, BARRA, and ERA-Interim) and observations at gauge locations. The colour of the scatter indicates the location of the stations.
4.2.3 Quantiles
Figure 5 shows the comparison of quantiles obtained from the gridded datasets to the corresponding quantiles derived for the observed point rainfalls. Since all days were considered in computing the quantile (i.e. both wet and dry days were considered), the 99 % value represents “large” rainfalls that are exceeded on average only three or four times per year. On the other hand, the rainfall represented by the 90 % quantile (exceeded on average 36 times per year) corresponds to the more frequent wet-day rainfalls which depend upon the climatology of the station considered. The AWAP rainfalls corresponding to these quantiles are all higher than the point rainfall estimates. The quantile estimates in BARRA and ERA-Interim show very different patterns to those of the AWAP dataset. BARRA estimates for all quantiles (90 %, 95 %, and 99 %) exhibit no consistent bias with location. In contrast, ERA-Interim greatly underestimates the larger precipitation, where the degree of underestimation increases with an increasing quantile. The nature of the differences varies with location and quantile: for example, the ERA-Interim 90 % quantile estimates are biased low compared with the point rainfalls in the northern region, yet there is a tendency for all higher quantiles to be biased high. The ERA-Interim reanalysis appears to be unable to represent higher precipitation magnitudes, and the largest value plateaus at about 40 mm for the rarer quantiles.
4.2.4 Categorical metrics
Figure 6 shows the boxplot of four categorical performance indices computed between three gridded datasets with reference to gauged point rainfalls at a daily scale. The POD is highest for the AWAP dataset, and the POD values for the two reanalysis datasets are consistently lower and somewhat similar. For rainfall intensities greater than 20 mm and lower than 5 mm, BARRA shows higher detection of rainfalls, whereas for the rainfall intensity 5–20 mm, ERA-Interim shows slightly better detection skill. In contrast, the false alarm ratio (FAR) is higher for BARRA for the heavy rainfall classes (> 20 mm). For the low rainfall classes (< 20 mm), FAR is lower for BARRA. The CSI shows that the reanalysis data are not able to adequately represent the distribution of rainfalls greater than 1 mm d−1. AWAP, as expected, has a higher CSI for each of the rainfall classes. BARRA has a higher CSI for all rainfall classes than ERA-Interim, except for the moderate rainfall (5–20 mm d−1), where both reanalysis datasets have a similar CSI. The frequency bias shows the positive bias for AWAP and BARRA for all the rain days. ERA-Interim shows a negative bias for higher rainfall intensities (>20 mm).
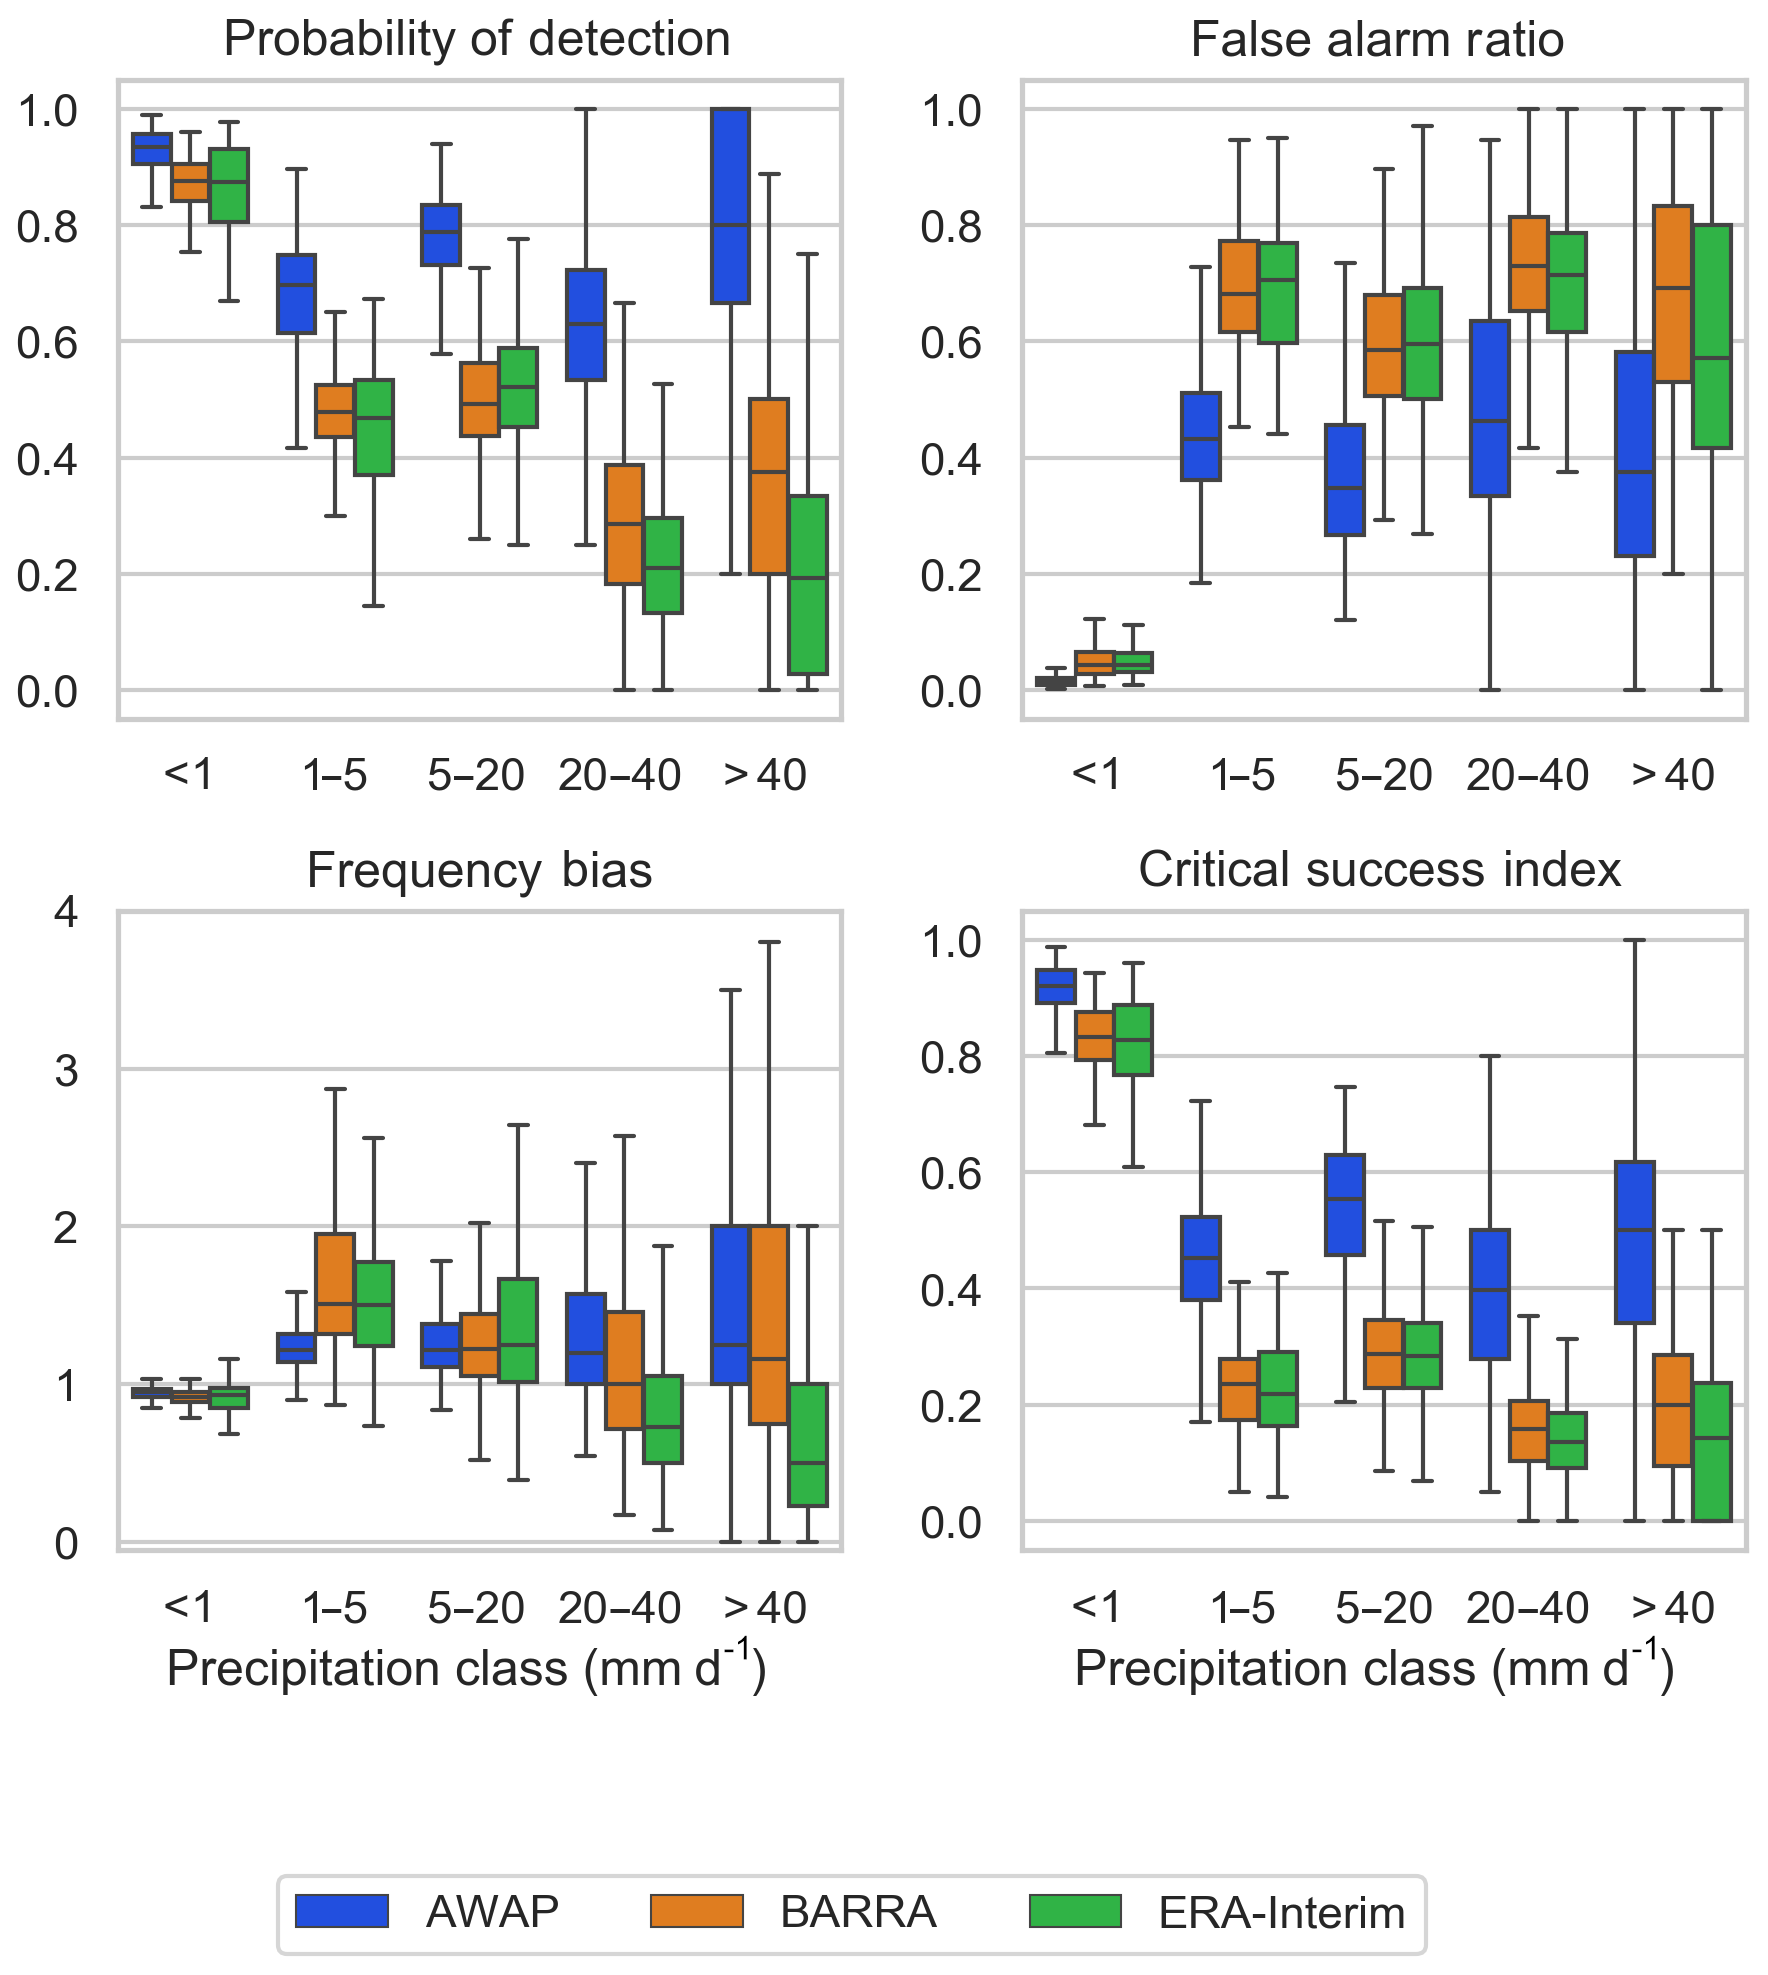
Figure 6Boxplot of categorical performance indices (probability of detection, false alarm ratio, frequency bias, and critical success index) calculated against gauge data for five classes of rainfall intensity. Each box extends from first to third quartile, medians are marked in each box, and whisker extends to furthest point or 1.5 times the interquartile range, whichever is closer.
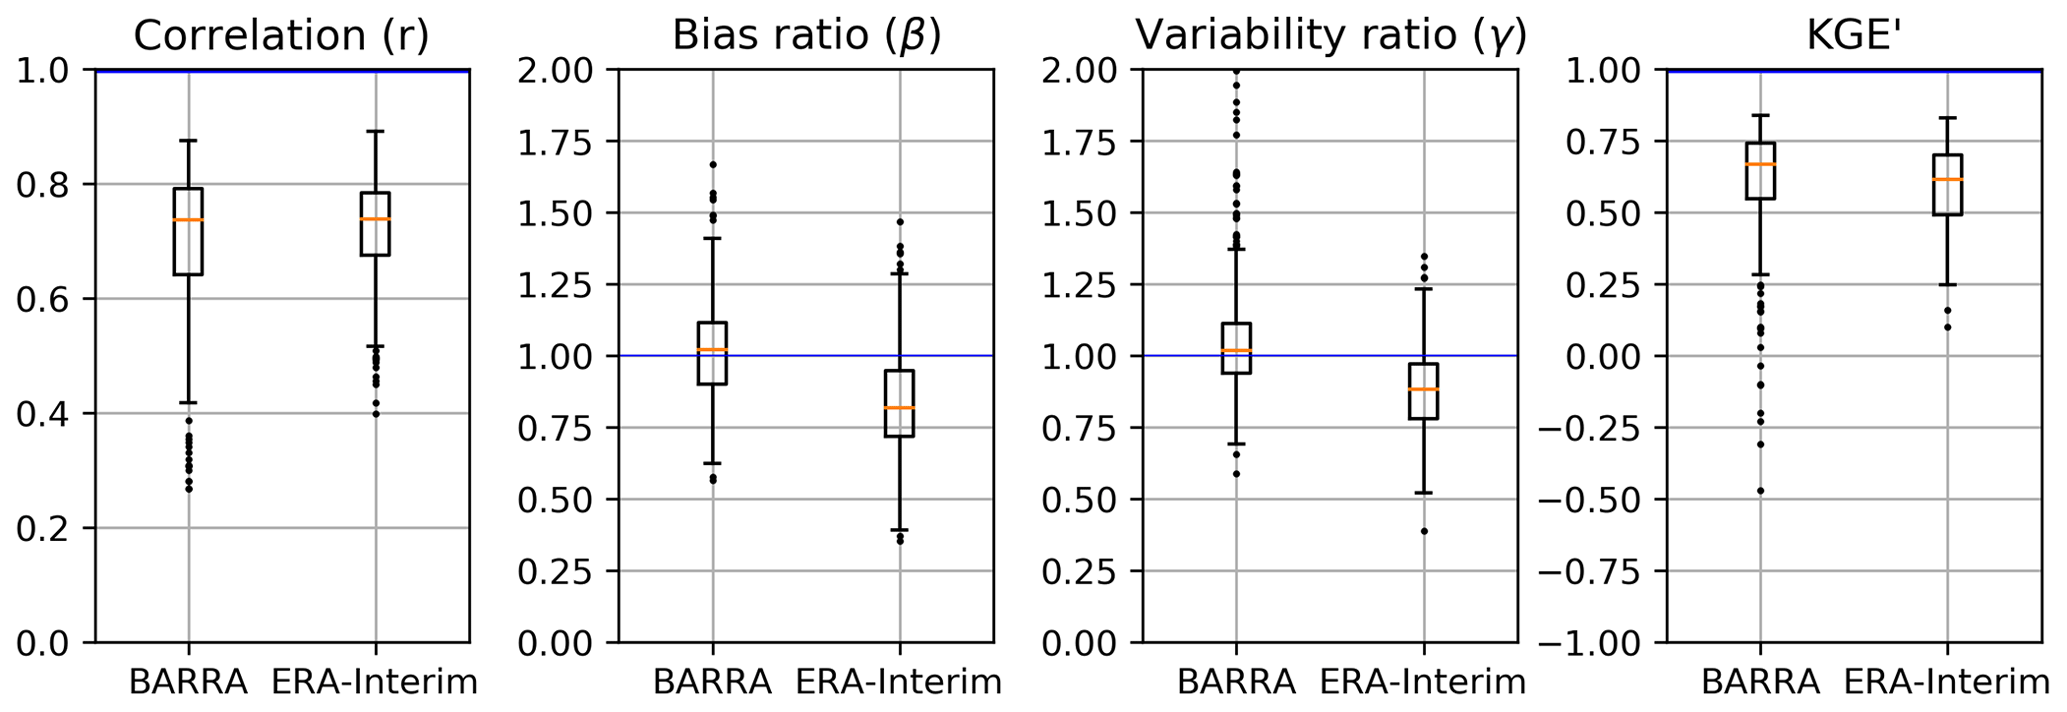
Figure 7Boxplot of correlation (r), bias ratio (β), variability ratio (γ), and modified Kling–Gupta efficiency (KGE′) against AWAP dataset. Each box extends from first to third quartile, medians are marked in each box, and whisker extends to furthest point or 1.5 times the interquartile range, whichever is closer.
4.3 Grid-to-grid analysis
4.3.1 KGE′ and its components
The boxplot of KGE′ and its components shown in Fig. 7 are computed between reanalysis datasets with reference to the AWAP dataset at a daily scale. Among the components, the correlation is similar for both reanalysis datasets, though BARRA exhibits a slightly wider range of correlations than ERA-Interim. However, the bias ratio (β) and variability ratio (γ) obtained from BARRA are closer to 1, which is appreciably better than the corresponding statistics for ERA-Interim. The difference in the overall KGE′ measured for the two datasets is not as pronounced compared with its components.
In Table 2, a summary of the KGE′ score is also presented with reference to the AWAP dataset. The reanalysis datasets show mixed performance depending on the climate zone and the metrics used. BARRA shows improved performance over ERA-Interim in the temperate zone, with a better correlation, bias ratio, variability ratio, and KGE′ statistics. The difference in correlation coefficients between the reanalysis datasets is higher for the tropical zone but similar for the arid and temperate zones. An assessment of correlation at grid scale is presented in Fig. S1 in the Supplement. It also shows a very high correlation in the southern region and a low correlation at the northern region, although a similar spatial pattern is observed for both reanalysis datasets. Further, the BARRA dataset exhibits a smaller bias than ERA-Interim across all climatic zones. The variability ratio, however, shows contrasting patterns for the two reanalysis datasets. ERA-Interim shows a marked underestimation in variability across all zones. On the other hand, BARRA closely represents the variability in arid and temperate zones, with overestimation in the tropics.
4.3.2 Wet day frequency and transition probabilities
The frequency of wet-day and transition probabilities obtained from reanalysis datasets at AWAP grid locations is shown in Fig. 8. Overall, the representation of wet-day frequency and transition probabilities follows a similar pattern to the point-to-grid assessment (Fig. 4). In comparing the gridded datasets with AWAP data as the benchmark, the estimates of wet-day frequency and transition probabilities from BARRA are closer than those of ERA-Interim. However, both reanalysis datasets show an improved correlation and reduced bias in grid-to-grid over point-to-grid evaluation. This is expected, as this bias is attributed to the spatial resolution of the data.

Figure 8Wet-day frequency estimates from reanalysis datasets (BARRA and ERA-Interim) and AWAP at gauge locations (a, b). Transition probabilities: dry–wet (p01: c, d) and wet–wet (p11: e, f). Colour of scatter indicates the location of the AWAP grid.
4.3.3 Quantiles
The comparison of quantiles in gridded datasets in Fig. 9 shows a similar pattern as observed in Fig. 5 for the gauged point rainfalls. Both reanalysis datasets represent the 90 % quantile reasonably well. However, the difference between the reanalysis products increases at higher quantiles. The degree of bias in ERA-Interim is considerably more pronounced compared with BARRA.
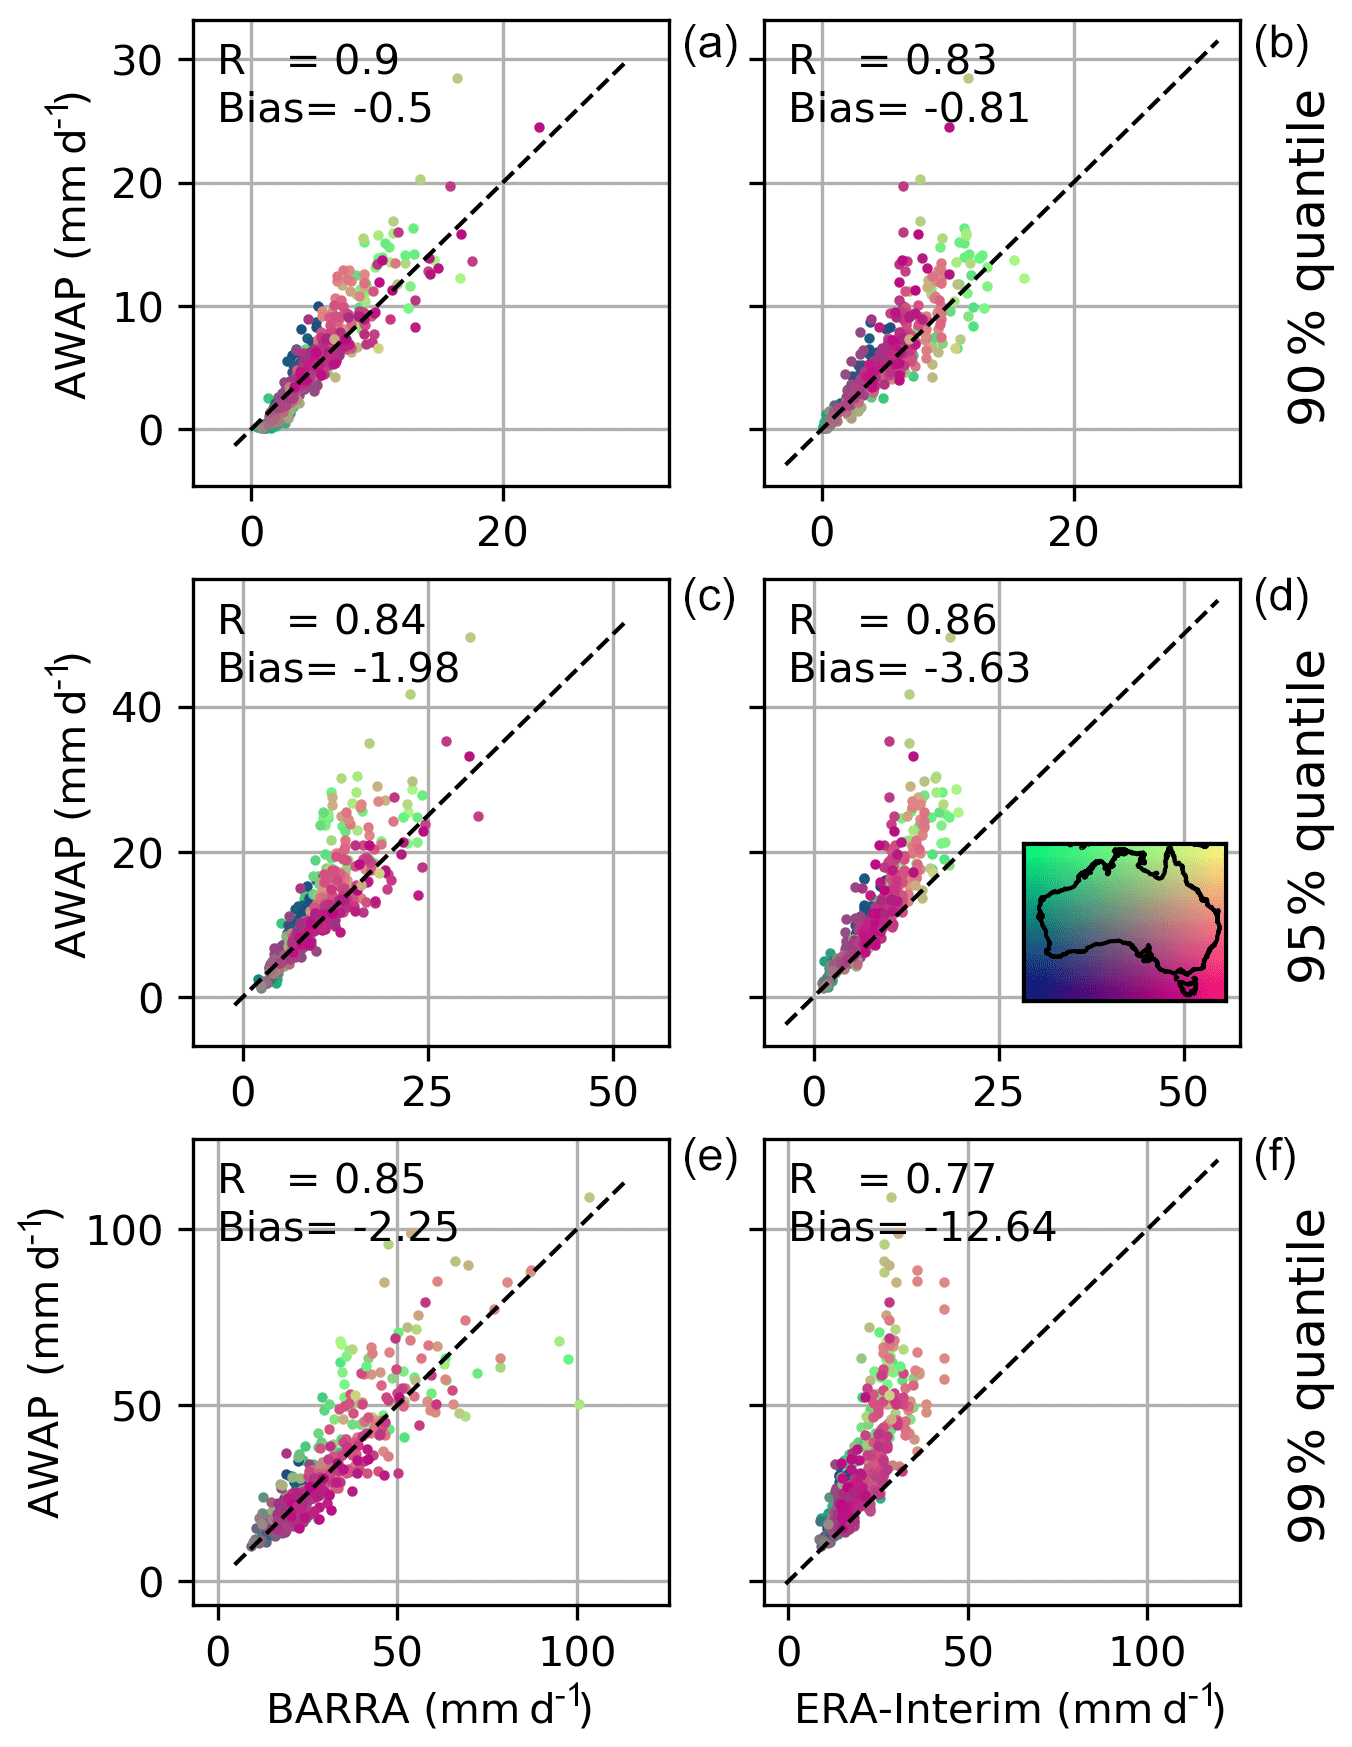
Figure 9Quantile estimates (mm d−1; 90 %, 95 % and 99 %, in a–b, c–d, and e–f, respectively) from reanalysis datasets (BARRA and ERA-Interim) and AWAP at gauge locations. The colour of the scatter indicates the location of the AWAP grid.
4.3.4 Categorical metrics
Figure 10 shows the boxplot of four categorical performance indices computed between reanalysis datasets with reference to the AWAP dataset at a daily scale. In general, the POD for both datasets is similar to point-to-grid comparison. For the larger precipitation intensities, the detection capacity of BARRA is higher, whereas for the smaller rainfall intensities, the detections from both datasets are close to each other. The FAR scores for BARRA estimates of higher rainfalls are slightly greater, indicating the larger occurrence of false alarms while detecting higher rainfall. For the low rainfall classes, BARRA exhibits slightly better FAR than ERA-Interim. The CSI score is higher for BARRA across all rainfall classes and indicates that BARRA is slightly more skilful than ERA-Interim. At larger rainfall class, the CSI is notably higher for BARRA, indicating its better performance in representing larger rainfall. The frequency bias shows that the BARRA precipitation tends to produce more events of light rainfall while missing out on some larger rainfalls. The bias in BARRA is, however, smaller in comparison with ERA-Interim, which shows a marked underestimation of larger rainfall events (> 20 mm).
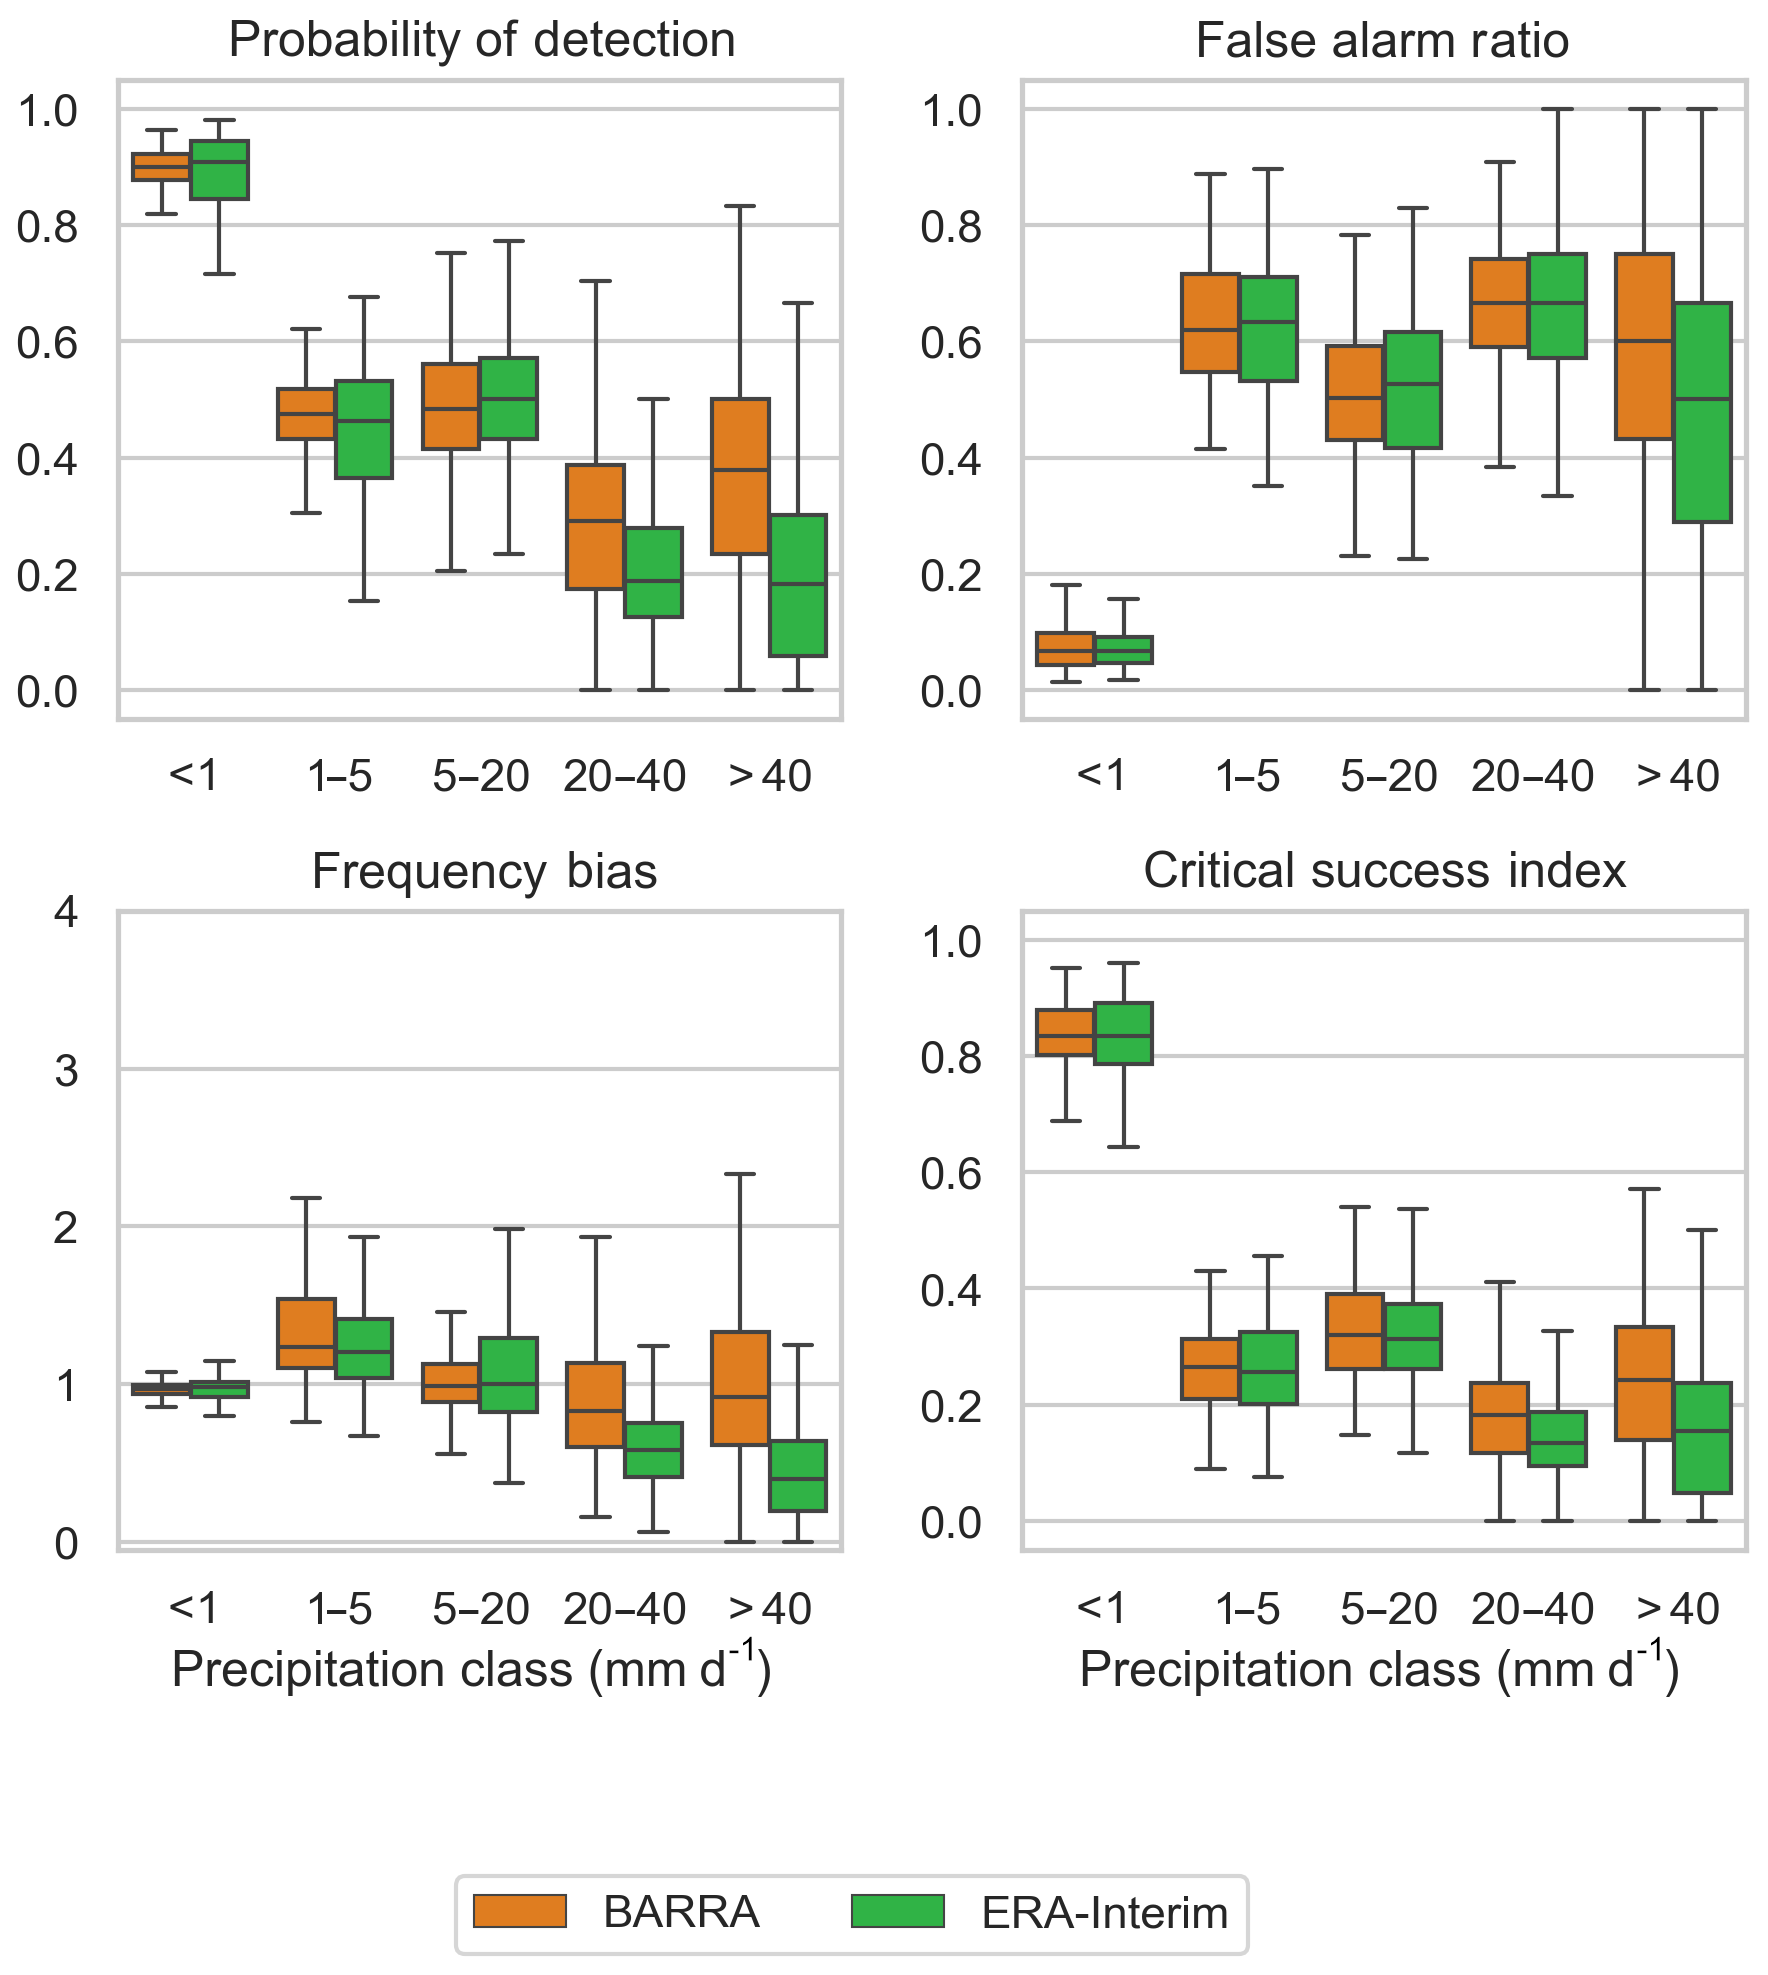
Figure 10Boxplot of categorical performance indices (probability of detection, false alarm ratio, frequency bias, and critical success index) calculated against AWAP data for five classes of rainfall intensity. Each box extends from first to third quartile, medians are marked in each box, and whisker extends to furthest point or 1.5 times the interquartile range, whichever is closer.
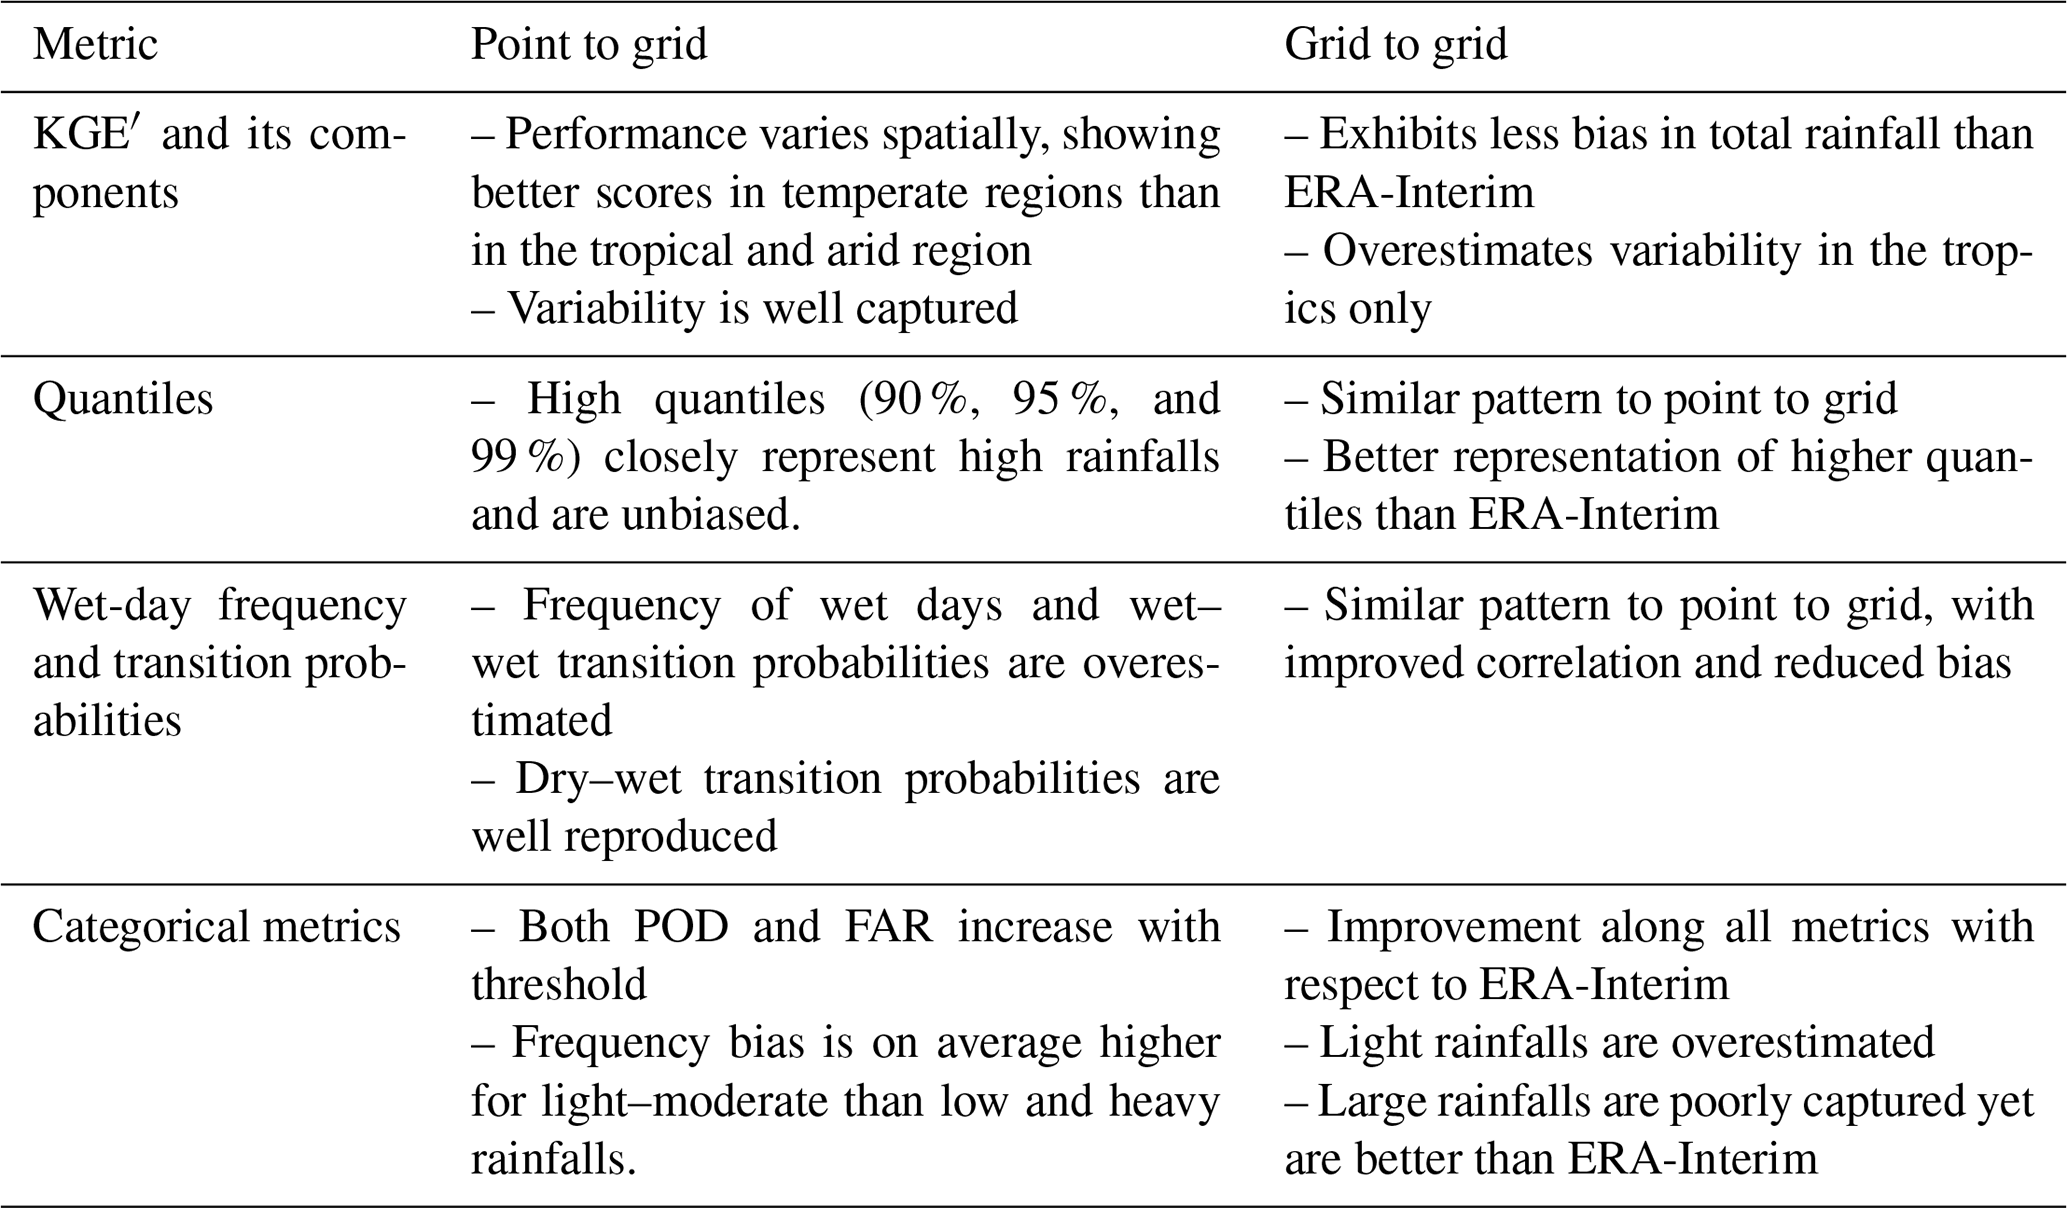
The evaluation of daily precipitation from BARRA and its comparison against existing datasets reveals a mixed performance under varying benchmark dataset and the metrics. The general observations on the performance of BARRA are summarized in Table 3, and the key insights from these results are discussed below.
5.1 Representation of spatial precipitation structure
The BARRA dataset exhibits similar spatial patterns of mean annual rainfall as the AWAP dataset in regions where gauge density is highest (Fig. 1). However, the reliability in the evaluation of BARRA in the central regions of Australia is confounded by the lack of gauges. The coarser resolution of ERA-Interim misses the small-scale variability; in contrast, the more realistic representation of complex topography in BARRA helps to capture fine-scale features such as orographic precipitation (Su et al., 2019). A good level of agreement in spatial patterns of rainfalls with AWAP and similarity with ERA-Interim estimates (over both land and ocean) at a coarser scale suggest that the BARRA dataset might provide useful information on the distribution of rainfall in regions where direct measurement of precipitation is not available.
5.2 Representation of average precipitation and variability
In general, a slight overestimation is observed in mean rainfall from high-resolution gridded data when compared with gauged point rainfall estimates (bias in mm d−1 for AWAP =0.48, BARRA =0.43). In AWAP, the wet bias observed at low rainfall is due to the Barnes interpolation analysis (Jones et al., 2009). In addition, the weight functions tend to spread rainfalls across the grid, which tends to induce a wet bias in coastal stations, since the density of stations near the coast is greater. When average AWAP precipitation is considered a benchmark for evaluation, BARRA (R=0.93, bias mm d−1) shows better agreement than ERA-Interim (R=0.84, bias mm d−1). In the locations with higher average precipitation, the ERA-Interim underestimates gauged point rainfalls. This can be attributed to the coarser resolution of ERA-Interim; 80 km scale areal averages are expected to be less than those observed for rainfall systems that are spatially localized and/or heterogeneous.
In addition, the temporal variability is represented well by BARRA, while this is underestimated by ERA-Interim (Figs. 3 and 7). As with the assessment of spatial variability, the reason for this underestimation is the coarser resolution of ERA-Interim. The variability ratio varies across climatic zones, with the largest difference in the tropical zone. BARRA greatly overestimates variability in the tropical region, whereas the opposite is true for ERA-Interim (Table 2). The discrepancy in the performance across climatic zones is further discussed in Sect. 5.5.
5.3 Representation of wet-day frequency and transition probabilities
All the gridded datasets exhibit higher frequencies of wet-day occurrence compared to gauge point rainfalls. This difference is consistent with the physical reasoning that the likelihood of rainfall occurring over an area is always higher than that over a point location. Moreover, an increase in the area produces a higher difference in the wet days, and this is consistent with the increasing levels of bias with grid cell size between AWAP, BARRA, and ERA-Interim (Fig. 4). In comparison with AWAP as a benchmark, BARRA closely represents the wet-day frequency and exhibits less uncertainty at higher estimates compared with ERA-Interim (Fig. 8).
The variation in transition probabilities p01 and p11 at a location can be attributed to the seasonal distribution of precipitation at that location. Most rainy days in the northern region occur during October–March, with very low or no rainfall for the rest of the season. Due to a distinct dry (and wet) season, the likelihood of a dry day following a dry day (and a wet day following a wet day) is higher. This results in larger p11 and smaller p01 estimates. In contrast, there is not a distinct wet and dry season in the south, and p01 is close to p11 for the southern region, mostly due to the light rainfall distributed over the longer period. The ability of the reanalysis datasets to represent transition probabilities also varies with location due to the climatology and varying precipitation mechanisms across locations. The spread in transition probabilities p01 is estimated well by all gridded datasets, whereas the p11 estimates are overestimated and more varied. As mentioned above, this difference is due to the tendency of NWP models to overestimate the persistence of light rainfalls (Kendon et al., 2012). Due to the likelihood of higher frequency of wet-days in gridded datasets, the transition probability p11 is higher in gridded datasets and exhibits higher variability for the tropical zone.
5.4 Over- or underestimation of large rainfall events
The comparison of quantiles (Figs. 5 and 9) demonstrates that the BARRA dataset is able to represent the higher quantiles more accurately than ERA-Interim. The BARRA estimates of quantiles show less bias, but variance increases with the magnitude of precipitation amount. This uncertainty could be due to displacement error as the precipitation becomes more localized with an increase in magnitude. ERA-Interim, on the other hand, greatly underestimates the higher quantiles. This could be attributed to its coarser resolution, resulting in the averaging of rainfall over a larger area. These results are consistent with published findings (Isotta et al., 2015; Jermey and Renshaw, 2016) that high-resolution regional reanalysis improves over ERA-Interim in the representation of large rainfall.
The categorical evaluation (Figs. 6 and 10) also illustrates the improved performance of the BARRA dataset over ERA-Interim during larger rainfall events. Because of the higher spatial resolution, BARRA provides a more accurate representation of larger rainfalls. Therefore, the probability of detection is higher for the larger rainfall classes. Despite exhibiting a higher hit rate, BARRA also shows higher false alarm ratios. The increased false alarm in BARRA is due to the higher number of large rainfall events reported by the BARRA dataset. With larger rainfall events, the false alarm is also likely to increase. Such a trend is usually observed in the assessment of reanalysis and satellite rainfall estimates (Zambrano-Bigiarini et al., 2017). The critical success index, the metric which penalizes both misses and false alarms, represents the overall skill of the data. The performance of BARRA lies between the skilful AWAP and less skilful ERA-Interim. The greater CSI for BARRA compared with ERA-Interim suggests that its improved hit rate outweighs the frequency of false alarms. The difference in the CSI between BARRA and ERA-Interim is greater for larger rainfall classes, with the former yielding a better score.
5.5 Superior performance over temperate than over tropical and arid
Most metrics suggest that the performance of BARRA is superior in the southern (temperate) region compared to the northern (tropical) region. The summary of KGE′ and its component across climatic zones (Table 2) and correlation statistics (Fig. S1) clearly shows the variation in performance over different climatic zones. The possible explanation for this may be the difference in the climatic systems driving the precipitation in those regions and the scheme used to generate precipitation (Su et al., 2019). Convective precipitation is dominant in tropical regions, and the parameterization scheme for sub-grid convection adopted in BARRA is limited in terms of resolving such precipitation. Therefore, a higher accuracy of BARRA can be expected at high latitudes where synoptic rainfall dominates than in low latitudes where convective rainfall is dominant (Ebert et al., 2007; Su et al., 2019). The limitation of NWP models in representing convective precipitation accurately has also been reported by Ebert et al. (2007) and de Leeuw et al. (2015). In addition, the network of surface observations used to develop BARRA is denser in the southern region compared to the northern region, and this difference in information content also contributes to discrepancies in performance between these regions.
5.6 Varying performance in point-to-grid and grid-to-grid evaluation
This study shows that the general pattern of performance between the reanalysis datasets is similar in the point-to-grid evaluation. However, the evaluation against the gridded AWAP estimates showed a markedly better performance by BARRA in terms of overall bias, variability, wet-day frequencies, transition probabilities, quantiles and categorical metrics. As expected, BARRA better represents areal rather than point rainfall, as it represents the average precipitation field over a grid cell.
The purpose of the current study is to document the performance of the BARRA dataset at a daily scale and to provide a comparative analysis of its strengths and limitations relative to other available datasets. The analysis includes point-to-grid and grid-to-grid evaluations at the gauge locations. A range of metrics representing correlation, daily precipitation statistics, and categorical performance are explored and compared on an annual as well as a seasonal basis.
The high-resolution nature of the BARRA dataset provides more detailed and accurate estimates of rainfall across the Australian region than the coarser ERA-Interim. BARRA precipitation exhibits good agreement with the average annual rainfall from AWAP as well as to the gauge dataset. The correlation statistics of the BARRA estimates are slightly lower than for the global reanalysis (ERA-Interim). However, the depth and variability in daily precipitation from AWAP are better reproduced by BARRA than by ERA-Interim. We can conclude that BARRA precipitation is representative at the spatial scale of AWAP, considering that AWAP data provide the best basis for comparison with the reanalysis datasets.
BARRA provides largely unbiased estimates of larger rainfall quantiles, whereas ERA-Interim is clearly underestimated. Categorical evaluation also shows a better correspondence of the larger events in BARRA compared to ERA-Interim. This has important implications for hydrological modelling, as simulations of runoff processes are heavily dependent on how realistically the precipitation field is represented both spatially and temporally. Information on large rainfalls is also important for many engineering investigations where the design loading conditions of interest are dependent on the characteristics of daily rainfall. The superior performance of BARRA in representing large rainfall strengthens a case for its use over ERA-Interim, where information about extremes is required.
BARRA closely reproduces the frequency of wet days and dry–wet transition probabilities. This evaluation broadly supports BARRA precipitation for its ability to reproduce precipitation statistics at a daily scale. BARRA precipitation could be useful for assessing variation in the spatial and temporal characteristics of precipitation in a consistent manner that is not influenced by differences in gauge density. In addition, it could potentially be used as a source of data in the central arid zone, where AWAP estimates are poor or not available. Considering the limitations in the availability of gauged datasets, BARRA could be considered to be a valuable reference dataset for hydro-climatic analysis across the whole of Australia, particularly where gauging density is low.
The core attraction of the BARRA dataset is the availability of sub-daily precipitation estimates. Such information is not available in the AWAP dataset, and the spatial resolution of the estimates is higher than the currently available global reanalysis and satellite datasets. Accordingly, future work will be directed towards an analysis of BARRA estimates of sub-daily precipitation to assess its ability to represent precipitation at finer timescales.
Codes used for the analysis are available in the Supplement.
The supplement related to this article is available online at: https://doi.org/10.5194/hess-23-3387-2019-supplement.
SCA designed the research and performed the analysis. All co-authors provided ideas and feedback following discussions. SCA prepared the paper, with contributions from all co-authors.
The authors declare that they have no conflict of interest.
We would like to thank colleagues at the Bureau of Meteorology (Peter Steinle, Robert Smalley, and Alex Evans) for discussions at various stages of research. We are also grateful to Dörte Jakob for commenting on early results and for providing feedback on drafts of the paper.
This research has been supported by Seqwater (grant no. CO034338) and the Australian Bureau of Meteorology Scholarship Program (grant no. TA38977).
This paper was edited by Giuliano Di Baldassarre and reviewed by Korbinian Breinl and one anonymous referee.
Accadia, C., Mariani, S., Casaioli, M., Lavagnini, A., and Speranza, A.: Sensitivity of Precipitation Forecast Skill Scores to Bilinear Interpolation and a Simple Nearest-Neighbor Average Method on High-Resolution Verification Grids, Weather Forecast., 18, 918–932, https://doi.org/10.1175/1520-0434(2003)018<0918:SOPFSS>2.0.CO;2, 2003.
Baez-Villanueva, O. M., Zambrano-Bigiarini, M., Ribbe, L., Nauditt, A., Giraldo-Osorio, J. D., and Thinh, N. X.: Temporal and spatial evaluation of satellite rainfall estimates over different regions in Latin-America, Atmos. Res., 213, 34–50, https://doi.org/10.1016/J.ATMOSRES.2018.05.011, 2018.
Beck, H. E., Vergopolan, N., Pan, M., Levizzani, V., van Dijk, A. I. J. M., Weedon, G. P., Brocca, L., Pappenberger, F., Huffman, G. J., and Wood, E. F.: Global-scale evaluation of 22 precipitation datasets using gauge observations and hydrological modeling, Hydrol. Earth Syst. Sci., 21, 6201–6217, https://doi.org/10.5194/hess-21-6201-2017, 2017.
Beck, H. E., Pan, M., Roy, T., Weedon, G. P., Pappenberger, F., van Dijk, A. I. J. M., Huffman, G. J., Adler, R. F., and Wood, E. F.: Daily evaluation of 26 precipitation datasets using Stage-IV gauge-radar data for the CONUS, Hydrol. Earth Syst. Sci., 23, 207–224, https://doi.org/10.5194/hess-23-207-2019, 2019.
Bollmeyer, C., Keller, J. D., Ohlwein, C., Wahl, S., Crewell, S., Friederichs, P., Hense, A., Keune, J., Kneifel, S., Pscheidt, I., Redl, S., and Steinke, S.: Towards a high-resolution regional reanalysis for the european CORDEX domain, Q. J. Roy. Meteor. Soc., 141, 1–15, https://doi.org/10.1002/qj.2486, 2015.
Bukovsky, M. S. and Karoly, D. J.: A Brief Evaluation of Precipitation from the North American Regional Reanalysis, J. Hydrometeorol., 8, 837–846, https://doi.org/10.1175/JHM595.1, 2007.
Chiaravalloti, F., Brocca, L., Procopio, A., Massari, C., and Gabriele, S.: Assessment of GPM and SM2RAIN-ASCAT rainfall products over complex terrain in southern Italy, Atmos. Res., 206, 64–74, https://doi.org/10.1016/j.atmosres.2018.02.019, 2018.
Clark, P., Roberts, N., Lean, H., Ballard, S. P., and Charlton-Perez, C.: Review: Convection-permitting models: a step change in rainfall forecasting, Meteor. App., 23, 165–181, https://doi.org/10.1002/met.1538, 2016.
Dee, D. P., Uppala, S. M., Simmons, A. J., Berrisford, P., Poli, P., Kobayashi, S., Andrae, U., Balmaseda, M. A., Balsamo, G., Bauer, P., Bechtold, P., Beljaars, A. C. M., van de Berg, L., Bidlot, J., Bormann, N., Delsol, C., Dragani, R., Fuentes, M., Geer, A. J., Haimberger, L., Healy, S. B., Hersbach, H., Hólm, E. V., Isaksen, L., Kållberg, P., Köhler, M., Matricardi, M., Mcnally, A. P., Monge-Sanz, B. M., Morcrette, J. J., Park, B. K., Peubey, C., de Rosnay, P., Tavolato, C., Thépaut, J. N., and Vitart, F.: The ERA-Interim reanalysis: Configuration and performance of the data assimilation system, Q. J. Roy. Meteor. Soc., 137, 553–597, https://doi.org/10.1002/qj.828, 2011.
de Leeuw, J., Methven, J., and Blackburn, M.: Evaluation of ERA-Interim reanalysis precipitation products using England and Wales observations, Q. J. Roy. Meteor. Soc., 141, 798–806, https://doi.org/10.1002/qj.2395, 2015.
Donat, M. G., Sillmann, J., Wild, S., Alexander, L. V., Lippmann, T., and Zwiers, F. W.: Consistency of Temperature and Precipitation Extremes across Various Global Gridded In Situ and Reanalysis Datasets, J. Climate, 27, 5019–5035, https://doi.org/10.1175/JCLI-D-13-00405.1, 2014.
Ebert, E. E., Janowiak, J. E., and Kidd, C.: Comparison of near-real-time precipitation estimates from satellite observations and numerical models, B. Am. Meteorol. Soc., 88, 47–64, https://doi.org/10.1175/BAMS-88-1-47, 2007.
Fu, G., Charles, S. P., Timbal, B., Jovanovic, B., and Ouyang, F.: Comparison of NCEP-NCAR and ERA-Interim over Australia, Int. J. Climatol., 36, 2345–2367, https://doi.org/10.1002/joc.4499, 2016.
Gebremichael, M.: Framework for satellite rainfall product evaluation, Geophys. Monogr. Ser., 191, 265–275, https://doi.org/10.1029/2010GM000974, 2010.
Gupta, H. V., Kling, H., Yilmaz, K. K., and Martinez, G. F.: Decomposition of the mean squared error and NSE performance criteria: Implications for improving hydrological modelling, J. Hydrol., 377, 80–91, https://doi.org/10.1016/j.jhydrol.2009.08.003, 2009.
Isotta, F. A., Vogel, R., and Frei, C.: Evaluation of European regional reanalyses and downscalings for precipitation in the Alpine region, Meteorol. Zeitschrift, 24, 15–37, https://doi.org/10.1127/metz/2014/0584, 2015.
Jakob, D., Su, C.-H., Eizenberg, N., Kociuba, G., Steinle, P., Fox-Hughes, P., and Bettio, L.: An atmospheric high-resolution regional reanalysis for Australia, B. Aus. Meteorol. Oceanog. Soc., 30, 16–23, 2017.
Jermey, P. M. and Renshaw, R. J.: Precipitation representation over a two-year period in regional reanalysis, Q. J. Roy. Meteor. Soc., 142, 1300–1310, https://doi.org/10.1002/qj.2733, 2016.
Johnson, F., Hutchinson, M. F., The, C., Beesley, C., and Green, J.: Topographic relationships for design rainfalls over Australia, J. Hydrol., 533, 439–451, https://doi.org/10.1016/j.jhydrol.2015.12.035, 2016.
Jones, D., Wang, W., and Fawcett, R.: High-quality spatial climate data-sets for Australia, Aust. Meteorol. Oceanogr. J., 58, 233–248, https://doi.org/10.22499/2.5804.003, 2009.
Kendon, E. J., Roberts, N. M., Senior, C. A., and Roberts, M. J.: Realism of Rainfall in a Very High-Resolution Regional Climate Model, J. Climate, 25, 5791–5806, https://doi.org/10.1175/JCLI-D-11-00562.1, 2012.
King, A. D., Alexander, L. V., and Donat, M. G.: The efficacy of using gridded data to examine extreme rainfall characteristics: A case study for Australia, Int. J. Climatol., 33, 2376–2387, https://doi.org/10.1002/joc.3588, 2013.
Kirschbaum, D. B., Huffman, G. J., Adler, R. F., Braun, S., Garrett, K., Jones, E., McNally, A., Skofronick-Jackson, G., Stocker, E., Wu, H., and Zaitchik, B. F.: NASA's Remotely Sensed Precipitation: A Reservoir for Applications Users, B. Am. Meteorol. Soc., 98, 1169–1184, https://doi.org/10.1175/BAMS-D-15-00296.1, 2017.
Kling, H., Fuchs, M., and Paulin, M.: Runoff conditions in the upper Danube basin under an ensemble of climate change scenarios, J. Hydrol., 424–425, 264–277, https://doi.org/10.1016/j.jhydrol.2012.01.011, 2012.
Kobayashi, S., Ota, Y., Harada, Y., Ebita, A., Moriya, M., Onoda, H., Onogi, K., Kamahori, H., Kobayashi, C., Endo, H., Miyaoka, K., and Takahashi, K.: The JRA-55 Reanalysis: General Specifications and Basic Characteristics, J. Meteorol. Soc. Jpn. Ser. II, 93, 5–48, https://doi.org/10.2151/jmsj.2015-001, 2015.
Kucera, P. A., Ebert, E. E., Turk, F. J., Levizzani, V., Kirschbaum, D., Tapiador, F. J., Loew, A., and Borsche, M.: Precipitation from space: Advancing earth system science, B. Am. Meteorol. Soc., 94, 365–375, https://doi.org/10.1175/BAMS-D-11-00171.1, 2013.
Lin, R., Zhou, T., and Qian, Y.: Evaluation of Global Monsoon Precipitation Changes based on Five Reanalysis Datasets, J. Climate, 27, 1271–1289, https://doi.org/10.1175/JCLI-D-13-00215.1, 2014.
Parker, W. S.: Reanalyses and Observations: What's the Difference?, B. Am. Meteorol. Soc., 97, 1565–1572, https://doi.org/10.1175/BAMS-D-14-00226.1, 2016.
Peel, M. C., Finlayson, B. L., and McMahon, T. A.: Updated world map of the Köppen-Geiger climate classification, Hydrol. Earth Syst. Sci., 11, 1633–1644, https://doi.org/10.5194/hess-11-1633-2007, 2007.
Peña-Arancibia, J. L., van Dijk, A. I. J. M., Renzullo, L. J., and Mulligan, M.: Evaluation of Precipitation Estimation Accuracy in Reanalyses, Satellite Products, and an Ensemble Method for Regions in Australia and South and East Asia, J. Hydrometeorol., 14, 1323–1333, https://doi.org/10.1175/JHM-D-12-0132.1, 2013.
Roberts, N. M. and Lean, H. W.: Scale-Selective Verification of Rainfall Accumulations from High-Resolution Forecasts of Convective Events, Mon. Weather Rev., 136, 78–97, https://doi.org/10.1175/2007MWR2123.1, 2008.
Robertson, D. E., Shrestha, D. L., and Wang, Q. J.: Post-processing rainfall forecasts from numerical weather prediction models for short-term streamflow forecasting, Hydrol. Earth Syst. Sci., 17, 3587–3603, https://doi.org/10.5194/hess-17-3587-2013, 2013.
Saha, S., Moorthi, S., Pan, H. L., Wu, X., Wang, J., Nadiga, S., Tripp, P., Kistler, R., Woollen, J., Behringer, D., Liu, H., Stokes, D., Grumbine, R., Gayno, G., Wang, J., Hou, Y. T., Chuang, H. Y., Juang, H. M. H., Sela, J., Iredell, M., Treadon, R., Kleist, D., Van Delst, P., Keyser, D., Derber, J., Ek, M., Meng, J., Wei, H., Yang, R., Lord, S., Van Den Dool, H., Kumar, A., Wang, W., Long, C., Chelliah, M., Xue, Y., Huang, B., Schemm, J. K., Ebisuzaki, W., Lin, R., Xie, P., Chen, M., Zhou, S., Higgins, W., Zou, C. Z., Liu, Q., Chen, Y., Han, Y., Cucurull, L., Reynolds, R. W., Rutledge, G., and Goldberg, M.: The NCEP climate forecast system reanalysis, B. Am. Meteorol. Soc., 91, 1015–1057, https://doi.org/10.1175/2010BAMS3001.1, 2010.
Salio, P., Hobouchian, M. P., García Skabar, Y., and Vila, D.: Evaluation of high-resolution satellite precipitation estimates over southern South America using a dense rain gauge network, Atmos. Res., 163, 146–161, https://doi.org/10.1016/j.atmosres.2014.11.017, 2015.
Soares, P. M. M., Cardoso, R. M., Miranda, P. M. A., de Medeiros, J., Belo-Pereira, M., and Espirito-Santo, F.: WRF high resolution dynamical downscaling of ERA-Interim for Portugal, Clim. Dynam., 39, 2497–2522, https://doi.org/10.1007/s00382-012-1315-2, 2012.
Su, C.-H., Eizenberg, N., Steinle, P., Jakob, D., Fox-Hughes, P., White, C. J., Rennie, S., Franklin, C., Dharssi, I., and Zhu, H.: BARRA v1.0: the Bureau of Meteorology Atmospheric high-resolution Regional Reanalysis for Australia, Geosci. Model Dev., 12, 2049–2068, https://doi.org/10.5194/gmd-12-2049-2019, 2019.
Thiemig, V., Rojas, R., Zambrano-Bigiarini, M., Levizzani, V., and De Roo, A.: Validation of Satellite-Based Precipitation Products over Sparsely Gauged African River Basins, J. Hydrometeorol., 13, 1760–1783, https://doi.org/10.1175/JHM-D-12-032.1, 2012.
Vidal, J. P., Martin, E., Franchistéguy, L., Baillon, M., and Soubeyroux, J. M.: A 50-year high-resolution atmospheric reanalysis over France with the Safran system, Int. J. Climatol., 30, 1627–1644, https://doi.org/10.1002/joc.2003, 2010.
Walters, D., Boutle, I., Brooks, M., Melvin, T., Stratton, R., Vosper, S., Wells, H., Williams, K., Wood, N., Allen, T., Bushell, A., Copsey, D., Earnshaw, P., Edwards, J., Gross, M., Hardiman, S., Harris, C., Heming, J., Klingaman, N., Levine, R., Manners, J., Martin, G., Milton, S., Mittermaier, M., Morcrette, C., Riddick, T., Roberts, M., Sanchez, C., Selwood, P., Stirling, A., Smith, C., Suri, D., Tennant, W., Vidale, P. L., Wilkinson, J., Willett, M., Woolnough, S., and Xavier, P.: The Met Office Unified Model Global Atmosphere 6.0/6.1 and JULES Global Land 6.0/6.1 configurations, Geosci. Model Dev., 10, 1487–1520, https://doi.org/10.5194/gmd-10-1487-2017, 2017.
Zambrano-Bigiarini, M., Nauditt, A., Birkel, C., Verbist, K., and Ribbe, L.: Temporal and spatial evaluation of satellite-based rainfall estimates across the complex topographical and climatic gradients of Chile, Hydrol. Earth Syst. Sci., 21, 1295–1320, https://doi.org/10.5194/hess-21-1295-2017, 2017.