the Creative Commons Attribution 4.0 License.
the Creative Commons Attribution 4.0 License.
 | 08 Aug 2019
Assessment of SWAT spatial and temporal transferability for a high-altitude glacierized catchment
Maria Andrianaki
Juna Shrestha
Florian Kobierska
Nikolaos P. Nikolaidis
Stefano M. Bernasconi
In this study, we investigated the application and the transferability of the Soil Water and Assessment Tool (SWAT) in a partly glacierized Alpine catchment characterized by extreme climatic conditions and steep terrain. The model was initially calibrated for the 10 km2 watershed of the Damma glacier Critical Zone Observatory (CZO) in central Switzerland using monitoring data for the period of 2009–2011 and then was evaluated for 2012–2013 in the same area. Model performance was found to be satisfactory against both the Nash–Sutcliffe criterion (NS) and a benchmark efficiency (BE). The transferability of the model was assessed by using the parameters calibrated on the small watershed and applying the model to the approximately 100 km2 catchment that drains into the hydropower reservoir of the Göscheneralpsee and includes the Damma glacier CZO. Model results were compared to the reservoir inflow data from 1997 to 2010 and it was found that the model predicted successfully snowmelt timing and autumn recession but could not accurately capture the peak flow for certain years. Runoff was slightly overestimated from late May to June, when it is dominated by snowmelt. Finally, we investigated the response of the greater catchment to climate change using three different climate change scenarios, and the results were compared to those of a previous study, where two different hydrological models, PREVAH and ALPINE3D, were used. The methodology presented here, where SWAT is calibrated for a small watershed and then applied for a bigger area with similar climatic conditions and geographical characteristics, could work even under extreme conditions like ours. However, greater attention should be given to the differences between glacier melt and snowmelt dynamics. In conclusion, this assessment test on the transferability of SWAT on different scales gave valuable information about the strengths and weaknesses of the model when it was applied under conditions different to those under which it was calibrated.
- Article
(1768 KB) - Full-text XML
- BibTeX
- EndNote


The use of calibrated watershed models enables researchers and stakeholders to assess the impact of environmental changes and, as many studies have pointed out, is of high importance in water management (e.g. Arnold et al., 1998; Abbaspour et al., 2007). Climate change simulations provide crucial information for the assessment of its impact on water resources, water quality, and aquatic ecosystems (Farinotti et al., 2012; Aili et al., 2019). However, watershed modelling in high-altitude Alpine areas is rather challenging due to the rough terrain, heterogeneous land cover, extreme climatic conditions and glacier dynamics (Viviroli and Weingartner, 2004; Farinotti et al., 2012; Rahman et al., 2013), with the main challenge being the lack of observed and sufficient quality data in ungauged watersheds (Sivapalan et al., 2003; Viviroli et al., 2009b; Bocchiola et al., 2011).
Modelling and predicting the runoff of ungauged watersheds are two of the big challenges that hydrologists face today (Sivapalan et al., 2003; Hrachowitz et al., 2013). A common approach to addressing this problem is to calibrate a hydrological model for a gauged watershed using observed data and then transfer the model to the ungauged watershed by transferring the model parameters (Merz and Blöschl, 2003; Sivapalan et al., 2003). A large number of methods have been suggested for transferring model parameters, which include regression techniques between the model parameters and catchment attributes (e.g. Parajka et al., 2005; Deckers et al., 2010; Zhang et al., 2018) and similarity approaches such as spatial proximity and physical similarity (e.g. Bárdossy, 2007; Wagener et al., 2007; Patil and Stieglitz, 2014). However, as Thirel et al. (2015) point out, it is essential to assess and evaluate the ability of the hydrological models to perform efficiently under conditions different from those in which they were developed or calibrated.
The Soil and Water Assessment Tool (SWAT) developed by the USDA Agricultural Research Service (ARS) is a public domain and open-source integrated model and has been used worldwide for various applications. As a semi-distributed model, it allows the spatial variation of the parameters by dividing the basin into a number of sub-basins (Arnold et al., 1998; Srinivasan et al., 1998). It is equipped with a snowmelt algorithm based on a simple temperature-index approach, which, although simple, has proven to be very effective in numerous studies (Hock, 2003), especially when net solar radiation is the dominant driving energy for snowmelt (Debele et al., 2010).
SWAT has been widely used in many studies for the simulation of runoff and nutrient cycling in agricultural and forested sites. Although there is an increasing interest in applying SWAT on snow-dominated (Grusson et al., 2015) and glacierized watersheds (Rahman et al., 2013; Garee et al., 2017; Omani et al., 2017), its transferability at spatial and temporal scales under the extreme conditions of these high-altitude environments has not been tested yet. In this study, we have a quite unique situation of a small well-gauged watershed, the Damma glacier watershed, which is part of the larger catchment feeding the Göscheneralpsee reservoir, for which we have hydrological data thanks to its use by the hydroelectric power plant. This way we were able to assess the spatial and temporal transferability and upscaling of SWAT by calibrating the model for the Damma glacier watershed and then transferring it to the greater area feeding the Göscheneralpsee reservoir. Subsequently, climate change simulations were conducted in order to assess the transferability of the model on a temporal scale. The assessment was conducted by comparing our findings with those of a previous study for the same area, which used two other hydrological models with different characteristics, PREVAH and ALPINE3D (Kobierska et al., 2013).
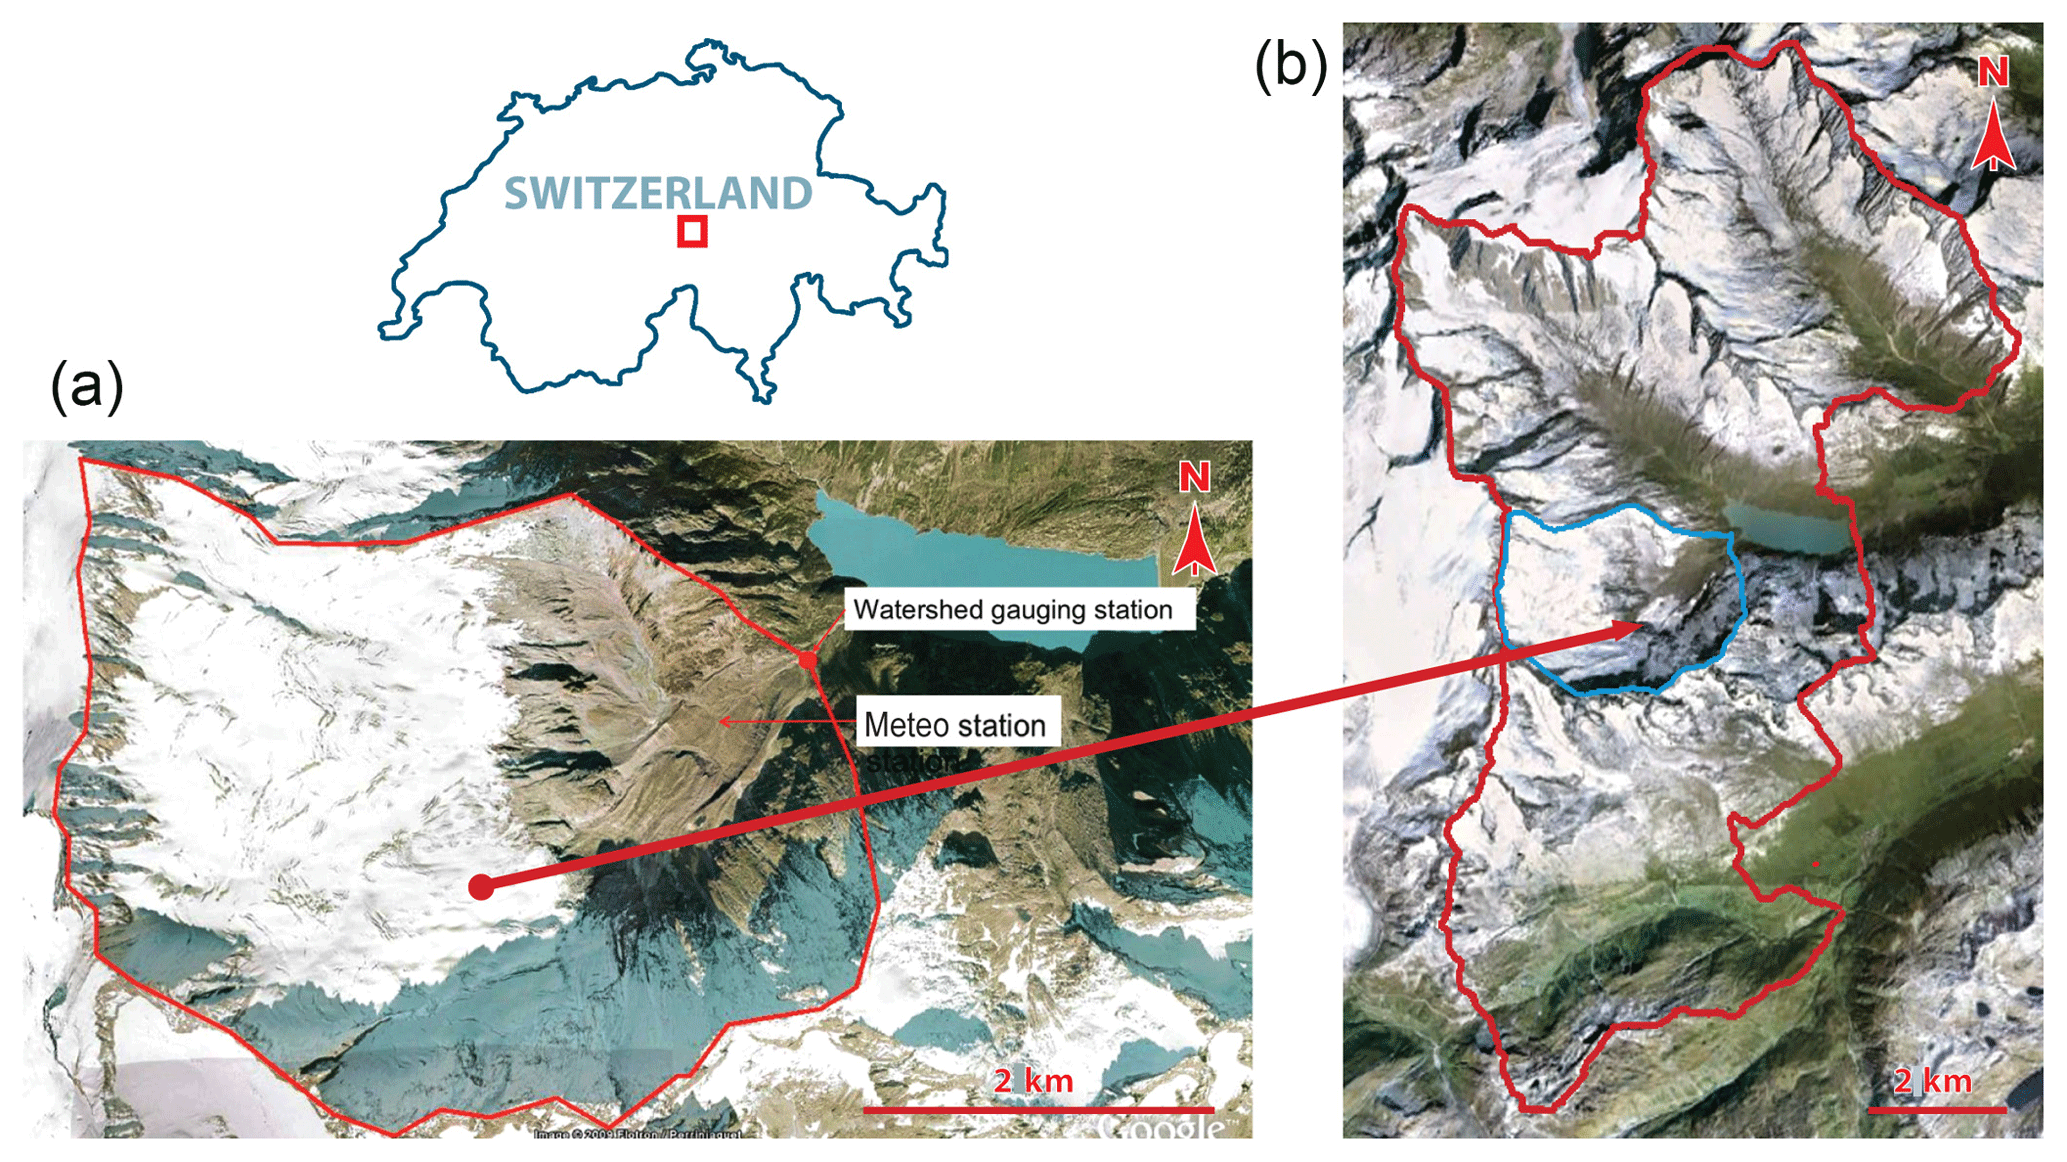
Figure 1Map showing the Damma glacier watershed on the left and the greater area that feeds the Göscheneralpsee on the right. Right image from © Google Earth, Image 2019 Maxar Technologies, Flotron/Ferrinjaquet.
The Damma glacier watershed (Fig. 1a) is situated in the central Swiss Alps in Switzerland and was one of the Critical Zone Observatories established within European project SoilTrEC (Banwart et al., 2011). It is located at an altitude between 1790 and 3200 m a.s.l. and has a total area of 10 km2 and a typical Alpine climate with an average yearly temperature of 1 ∘C and yearly precipitation of 2400 mm (Kobierska et al., 2013). Damma glacier covers 50 % of the watershed and due to climate change has retreated at an average rate of 10 m per year in the last 90 years. However, during 1920–1928 and 1970–1992 the recession was interrupted and the glacier grew, resulting in two moraines (Kobierska et al., 2011). After the retreat of the glacier a soil chronosequence is developed, which has a total length of 1 km (Bernasconi et al., 2008; Bernasconi et al., 2011; Kobierska et al., 2013). The bedrock is coarse-grained granite of the Aare massif and is composed of quartz, plagioclase, potassium feldspar, biotite and muscovite (Schaltegger, 1990). Our study site was extensively described in Bernasconi et al. (2011).
The Göscheneralpsee (Fig. 1b) is a hydropower reservoir of a volume of 75 million m3. A 100 km2 and 20 % glacier-covered catchment drains into the reservoir. It includes the watersheds of the Damma, Chelen and Tiefen glaciers and the Voralptal watershed. The Tiefen glacier and Voralptal watersheds do not drain directly into the reservoir, but their runoff is redirected through two tunnels. The site is described extensively in Kobierska et al. (2013).
3.1 SWAT model
In this study, we used SWAT 2012 coupled with the ArcView SWAT interface, a GIS-based graphical user interface (Di Luzio et al., 2002) that enables the delineation of the watershed, definition of sub-basins, and initial parameterization. It is a semi-distributed, time-continuous watershed simulator operating on a daily time step.
Each watershed is divided into sub-basins, for which slope, river features, and weather data are considered. Furthermore, the watershed is divided into hydrologic response units (HRUs), which are small surface units with distinctive soil–land-use combinations and necessary to capture spatially explicit processes. Each process is simulated for each HRU and then summed up for the sub-basin by a weighted average. Subsequently the amounts of water, sediment and nutrients that come out from each sub-basin enter the respective river.
A modified SCS curve number method is used to calculate the surface runoff for each HRU, based on land use, soil parameters, and weather conditions. The water is stored in four storage volumes: snow, soil moisture, shallow aquifer and deep aquifer. The processes considered within the soil profile are infiltration, evaporation, plant uptake, lateral flow, and percolation. The factors controlling snowmelt are the air and snowpack temperature, the melting rate and the area covered by snow. The updated snow cover model takes into account shading, drifting, topography and land cover to create a nonuniform snow cover (Neitsch et al., 2011). Furthermore, runoff from frozen soil can also be calculated by defining whether the temperature in the first soil layer is less than 0 ∘C. Even though the model still allows significant infiltration when the frozen soils are dry, the runoff of frozen soils is larger than that of other soils. A detailed description of the theory behind the model is found in Arnold et al. (1998) and Srinivasan et al. (1998).
Snow processes in high Alpine areas are strongly influenced by the terrain features (Ahl et al., 2008; Zhang et al., 2008). Fontaine et al. (2002) revealed the importance of improving SWAT algorithms to include in the model the influence of elevation and season on the dynamics of the snowpack. They found that the definition of elevation bands within the model sub-basins can significantly improve the performance of the model in watersheds at high altitudes and with large elevation gradients. With the improved snowmelting algorithm (Fontaine et al., 2002), streamflow in Alpine regions can be successfully simulated by SWAT (Rahman et al., 2013; Grusson et al., 2015; Omani et al., 2017).
3.2 Input data
The input data required by SWAT are topography, soil, land-use and meteorological data.
3.2.1 Topography
For the topography of both study areas a high-precision digital elevation model (DEM) with 2 m grid cells (swissALTI3D), produced by the Swiss Federal Office for Topography (https://shop.swisstopo.admin.ch/de/products/height_models/alti3D, last access: 30 May 2019), was used.
3.2.2 Soil and land-use map
In order to better describe the glacier forefield, detailed soil and land-use maps were created based on the observations, field and experimental data from the Biglink and SoilTrEC projects (Bernasconi et al., 2011; Dumig et al., 2011; Andrianaki et al., 2017). The soil map was created by adding new soil types to the SWAT database, while the land-use classes were based on existing types in the database. For the greater area feeding the Göscheneralpsee, the soil map used was produced and provided by the Swiss Federal Statistical Office at a scale of 1:200 000. For land use, we used the Corine land-cover dataset 2006 (version 16, 100 m resolution) produced by the European Environmental Agency (http://www.eea.europa.eu/data-and-maps/data/corine-land-cover-2006-raster-2, last access: 30 May 2019).
3.2.3 Climate data
Meteorological data from one local weather station and one station of the SwissMetNet network were used. The weather stations are located at the Damma glacier watershed (2025 m a.s.l.) and at Gütsch (2283 m a.s.l.). The meteorological data of weather station Gütsch were provided by MeteoSwiss. The selection of weather station Gütsch was based on the results of previous research that showed that it has the best correlation in comparison to other weather stations located in the area (Magnusson et al., 2011) with a long enough record for this study. The data from both stations consist of records of air temperature, precipitation, wind speed, relative humidity, and incoming short-wave radiation sub-hourly from 2007 to 2013 for Damma weather station and hourly from 1981 to 2010 for Gütsch. The lapse rates for temperature and precipitation, which are very important parameters in the SWAT model since they affect snowmelt and glacier melt, and the interpolation methods were based on the findings of Magnusson et al. (2011), who carried out non-prognostic hydrological simulations for the Damma glacier watershed. The precipitation and temperature lapse rate parameters of the model are PLAPS and TLAPS and were set to 5 mm km−1 and −5.84 ∘C km−1 respectively.
Climate change scenarios
The climate change predictions were provided by EU regional climate modelling initiative ENSEMBLES (van der Linden and Mitchell, 2009) and were based on the A1B emission scenario. The model chains produced by the ENSEMBLES project are a combination of a general circulation model (GCM) with a regional climate model (RCM). The delta-change method was used for the creation of the datasets (Bosshard et al., 2011). Temperature and precipitation predictions are calculated using daily temperature changes ΔT and precipitation scaling factors ΔP. Incoming short-wave irradiation, wind speed and relative humidity were left unchanged. Under the scenario when no action for the mitigation of climate change is taken, according to the A1B scenario it is predicted that by the end of the century in Switzerland, the mean temperature will have increased by 2.7–4.1 ∘C and the precipitation will have decreased by 18%–24% in the summer months (CH2011, 2011).
In this study, three climate scenarios with interpolated data for Gütsch weather station are used. These scenarios are the CNRM ARPEGE ALADIN scenario, the ETHZ HadCM3Q0 CLM scenario, which predicts the highest ΔT and ΔP in comparison to the other two, and the SHMI BCM RCA scenario, which predicts the lowest ΔT and ΔP, referred to as the CNRM, ETHZ and SHMI scenarios respectively. These three scenarios were chosen because they are the same used in the previous study of Kobierska et al. (2013). The following periods were selected.
-
Reference period T0: 1981–2010
-
T1: 2021–2050
-
T2: 2070–2099
The highest ΔT for the T1 period is predicted to be 1.5 ∘C in the mid-summer, 2.5 ∘C in late spring, and below 1.0 ∘C in early summer for the CNRM, ETHZ and SHMI respectively, and for the T2 period it is approximately 5 ∘C in the mid-summer, 4 ∘C along the whole summer and 3 ∘C in early summer. The biggest temperature increase is predicted at the end of the century when the strongest agreement between the different model chains is observed. Projected precipitation changes for the T1 period show a clear trend towards dryer summers, while for the rest of the year they are within the natural variability. The trend of dryer summers is most prominent for the T2 period. Furthermore, most model chains predict slightly higher precipitation in autumn.
3.2.4 Runoff data
Runoff of the Dammareuss stream that drains the Damma glacier watershed was measured every half an hour at a gauging station at the outlet of the watershed (Magnusson et al., 2011). The runoff of the total area that feeds the Göscheneralpsee is the inflow of the reservoir and the data from 1997 to 2010 were provided by the energy company responsible for the management of the reservoir.
3.2.5 Glacier extent
Data on the glacier extent for the present period but also for the two periods of the climate change scenarios were provided by Paul et al. (2007). They estimated the evolution of the Swiss glaciers by using hypsographic modelling, based on the shift of the equilibrium line altitude. However, SWAT is not a model that considers glacier flow dynamics, and therefore, in this study, the glaciers were incorporated into SWAT as the initial snow content in each sub-basin and for each elevation band.
The purpose of this study is to assess the transferability of SWAT in temporal and spatial scales at a high-altitude Alpine and glacierized site. This way one can test whether the model can be transferred and is capable for the simulation of runoff but also for further climate change studies on an ungauged glacierized watershed. Furthermore, this methodology tests its robustness under these extreme climatic and geographical conditions. For this reason, SWAT was initially calibrated for the small Damma watershed, which is well monitored through the CZO projects, and then it was upscaled and applied for the greater area that feeds the Göscheneralpsee reservoir and includes the Damma glacier watershed. The upscaling of the model was verified by comparing model results with the reservoir input flow data provided by the managing company.
Table 1The default and calibrated values of the most sensitive SWAT parameters.
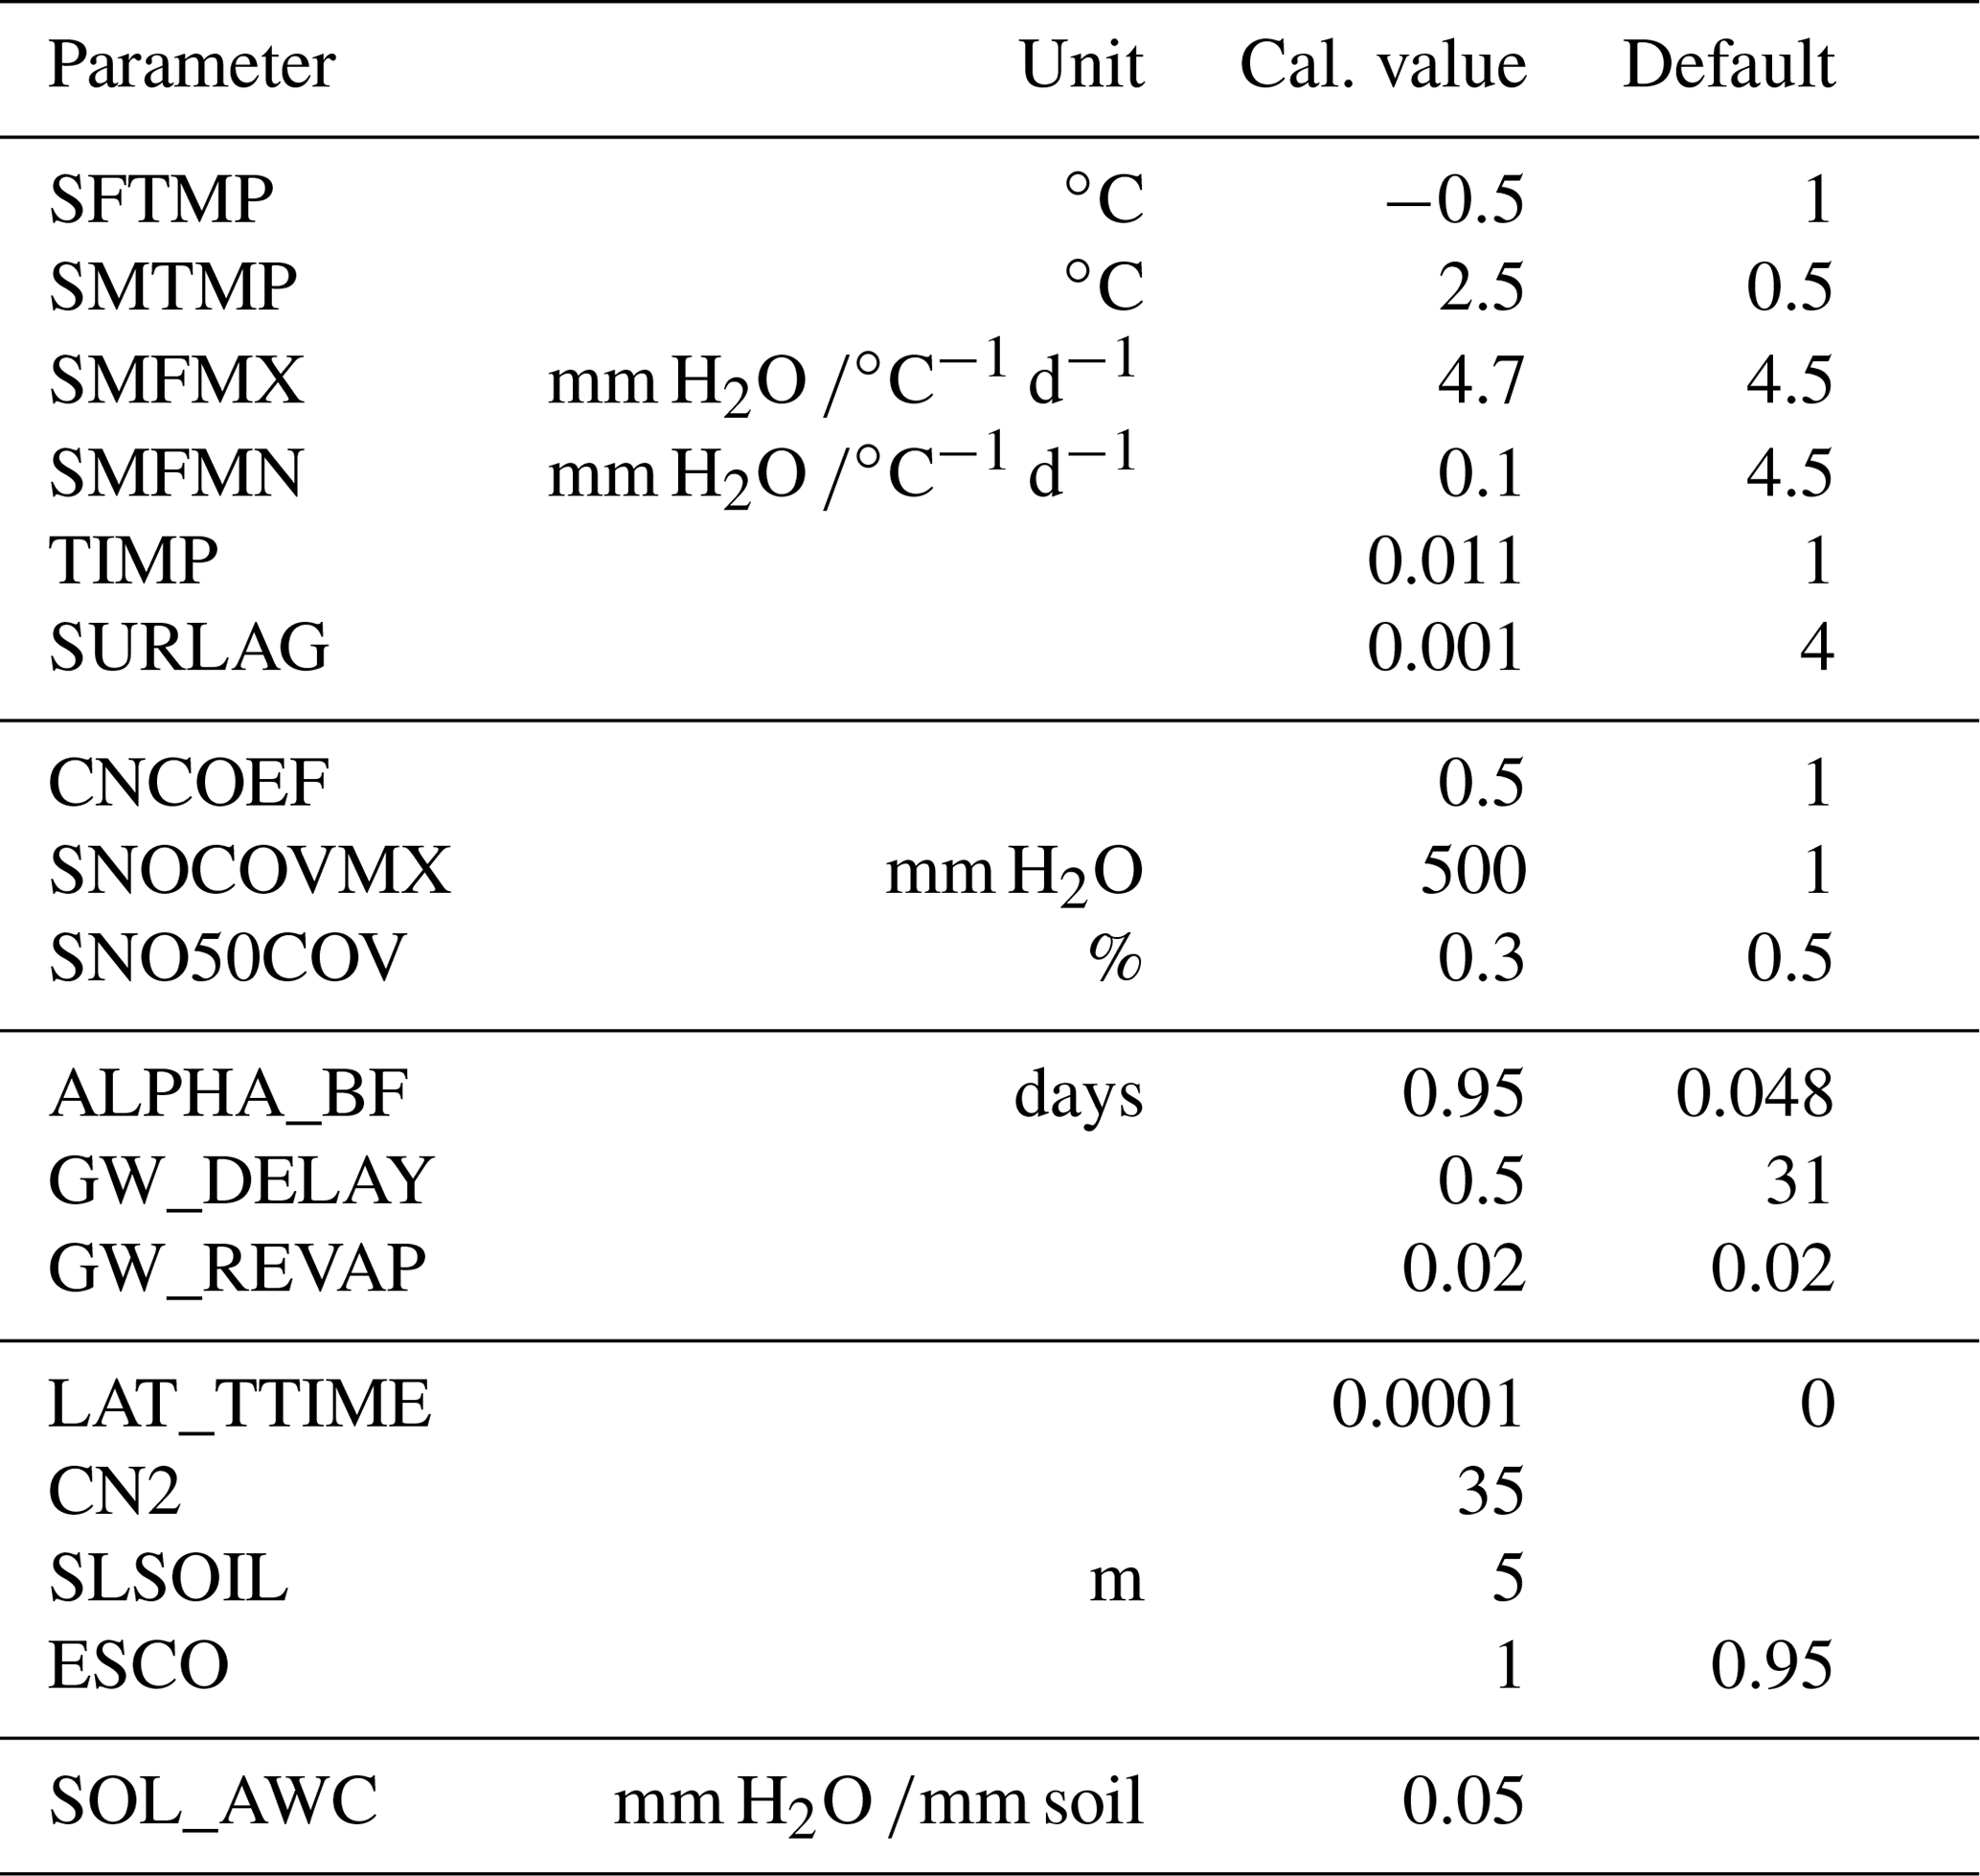
Since the Damma glacier watershed is part of the greater Göscheneralpsee feeding catchment, the parameters of the model were transferred using the spatial proximity approach, with no further regionalization procedure. In this case, the initial setup of SWAT for the greater catchment was conducted using the input data presented in Sect. 3.2, and only the parameters presented in Table 1 were changed to the calibrated values derived from the calibration of the Damma glacier watershed. The initial parameterization of the model during the setup and the watershed delineation assisted in the transferability of the model since a number of parameters are already defined based on the topography, land use and soil data.
Subsequently, the model was further transferred on a temporal scale by conducting climate change simulations, and results were compared with those of a previous study for the same area, which used two other hydrological models with different characteristics, PREVAH and ALPINE3D (Kobierska et al., 2013).
This methodology is a modified version of the proxy-basin test introduced by Klemeš (1986), which is one of the proposed testing schemes for the enhancement of the calibration and validation procedure in hydrological modelling. According to Klemeš (1986) the proxy basin test can be used to test the geographical transposability of the model between two regions, for subsequent simulation of the streamflow in ungauged watersheds with similar characteristics. The model is calibrated and validated for two watersheds, and if the results are acceptable, it is then considered safe to be transferred and used at a third watershed with similar characteristics.
SWAT was initially set up for the Damma glacier CZO and the greater area feeding the Göscheneralpsee using the topography, soil and land-use data presented in Sect. 3.2. Following the delineation procedure, the Damma watershed and the greater area were divided into 5 and 25 sub-basins respectively. By setting the lowest possible thresholds for land use, slope and soil, 48 HRUs were created for the Damma watershed and 285 HRUs for the greater area. Finally, six elevation bands were defined for each sub-basin of both study sites. The setup was complete with the addition of the meteorological input and the definition of the initial snow for each elevation band of each sub-basin. For the climate change simulations, the meteorological input consists of the climate change scenarios described in Sect. 3.2.3 and the initial snow that corresponds to the first year of each future period, as calculated by the glacier extent data described in Sect. 3.2.5.
5.1 Model calibration
SWAT was calibrated for the Damma watershed only, using the meteorological data from 2009 to 2011 and evaluated with the data from 2012 to 2013. Data for the years 2007 and 2008 were used for the warm-up and the stability of the model. The calibration was firstly conducted manually. The most important parameters are the ones controlling snowmelt such as the snowpack temperature lag factor (TIMP), the snowmelt factors (SMFMX and SMFMN), the snowfall and snowmelt temperatures (SFTMP and SMTMP respectively) and finally the CN_FROZ, which was set to active. In SWAT input files, a different set of snow parameters can be applied for each sub-basin, which can enable the user to simulate differently the snow-covered from the glacier-covered sub-basins. However, most of the sub-basins of the Damma glacier watershed, delineated during the initial setup of the model, were partially glacier-covered, and it was decided to apply the same snow parameters for all the sub-basins. This means that the same parameters were applied for both glacier and snow dynamics.
Groundwater flow parameters such as the groundwater delay time (GW_DELAY), the base flow alpha factor (ALPHA_BF) and the surface runoff lag coefficient (SURLAG) were also found to play an important role in the performance of the model. Evapotranspiration (ET) related parameters were not significant since our study site is above the tree line and ET is relatively minor.
The manual calibration was followed by an automatic calibration and uncertainty analysis using the SWAT-CUP software with the Sequential Uncertainty Fitting ver. 2 (SUFI-2) algorithm for inverse modelling (Abbaspour et al., 2007). Starting with some initial parameter values, SUFI-2 is iterated until (a) the 95 % prediction uncertainty (95PPU) between the 2.5th and 97.5th percentiles includes more than 90% of the measured data and (b) the average distance between the 2.5th and 97.5th percentiles is smaller than the standard deviation of the measured data. A model is considered calibrated when the chosen criterion between the best simulation and calibration data reaches the best value (Abbaspour et al., 2007). The parameters introduced in SWAT-CUP as well as their range are the ones that were identified during the manual calibration as the most important.
The criterion used for the calibration with SWAT-CUP is the Nash–Sutcliffe (Nash and Sutcliffe, 1970) model efficiency (NS), since it was the criterion available in SUFI-2 that is commonly used in hydrological studies. The NS shows the relationship between the measured and simulated runoff (Eq. 1). The performance of the calibrated model was further evaluated by the square of Pearson's product moment correlation R2, which represents the proportion of total variance of measured data that can be explained by simulated data. Better model performance is considered when both criteria are close to 1. NS coefficients greater than 0.75 are considered “good,” whereas values between 0.75 and 0.36 are considered “satisfactory” (Wang and Melesse, 2006).
where qobs is the observed runoff; qsim is the simulated runoff by SWAT; and qmean is the mean observed value.
However, as Schaefli and Gupta (2007) pointed out, the NS criterion is not enough to judge the efficiency of the model when simulating runoff with high seasonality like the one in high-altitude watersheds. Therefore, as an additional criterion for the performance of the model, a benchmark efficiency indicator was calculated, according to Eq. (2):
where qobs and qsim are as above and qb is runoff given by the benchmark model. The calendar day model was chosen as a benchmark (Schaefli and Gupta, 2007), which is the observed interannual mean runoff for every calendar day.
Table 1 shows the default and the after-calibration values of the SWAT parameters that were changed during calibration. TIMP was set to a very low value, indicating that the glacier is not affected by the temperature of the previous day as much as the snowpack would be. Snowmelt and glacier melt in the Damma watershed occur from April to September, a fact that explains the low value of the SMFMN (0.1 mm H2O ∕∘C−1 d−1), the minimum melt factor, while the SMFMX is set to the value of 4.7 mm H2O ∕ ∘C−1 d−1. SMTMP is also sensitive since it is the controlling factor in the initialization of the snowmelt and the availability of melted snow on a specific day. SURLAG and GW_DELAY play an important role in the model performance as they control the melted snow routing process and the hydrologic response of the watershed. The Damma glacier watershed has a fast response and therefore GW_DELAY was set to 0.5 d and ALPHA_BF to 0.95.

Figure 2Results of SWAT in comparison to the measured runoff of the Damma glacier watershed for (a) and (c) the calibration period 2009–2011 and (b) and (d) the evaluation period 2012–2013. Graphs in (c) and (d) show the accumulative runoff.
The results of the calibrated model for the daily runoff and the observed data are presented in Fig. 2a, while cumulative runoff is presented in Fig. 2c. The fit of the model to the observed data is satisfactory and the results of the calibrated model matched the observed data throughout most of the year. The graph of the cumulative runoff (Fig. 2c) shows that runoff is slightly overestimated in July and August, when it is dominated by glacier melt. The best results occur for the years 2009 and 2010; 2011 is characterized by the unusually warm and dry months of September, October and November which resulted in a slight underestimation of the runoff. The NS efficiency is 0.84 and R2 is 0.85, which means that overall SWAT performance for the calibrated period is considered very satisfactory, especially considering the fact that results are in daily steps that influence the NS value. BE for this period is 0.22, a value that we consider to be satisfactory.
5.2 Model evaluation
SWAT was evaluated using the meteorological data for 2012 and 2013 and the results as well as the measured runoff are presented in Fig. 2b. Figure 2d presents the cumulative graphs. The model performed efficiently, similarly to the calibration period, with a Nash–Sutcliffe efficiency of 0.85, R2 0.86 and the BE 0.25. Although, due to the lack of longer monitoring data, the total calibration–evaluation period 2009–2013 is short, it still includes a relatively large variability in the weather conditions and precipitation amounts and despite this variability the overall model performance is satisfactory. The small seasonal differences in model performance are due to the evolution of runoff generation throughout the season: runoff in spring and early summer (May, June) comes mainly from snowmelt and in July and August from glacier melt.

Figure 3Results of SWAT and the measured inflow of the Göscheneralpsee reservoir for the period 1997–2010. Graphs in (b) show the measured and simulated cumulative inflow over this period.
6.1 Upscaling SWAT to the greater catchment feeding the Göscheneralpsee reservoir
The results of the model for the greater area that feeds the Göscheneralpsee are presented in Fig. 3a together with the measured inflow in the reservoir. The observed and predictive cumulative flow is presented in Fig. 3b. Both Fig. 3a, b show that there is an overestimation of total runoff for the period 1999–2002, which might be linked to the higher precipitation amounts during this period. Measured precipitation measured at Gütsch weather station for this period is up to 46 % higher than the average precipitation of 1981–2010.
Table 2Difference in days of the simulated values from the measured values of the snowmelt timing, autumn recession period, peak flow timing and centre of mass (COM) for the greater catchment feeding the Göscheneralpsee.
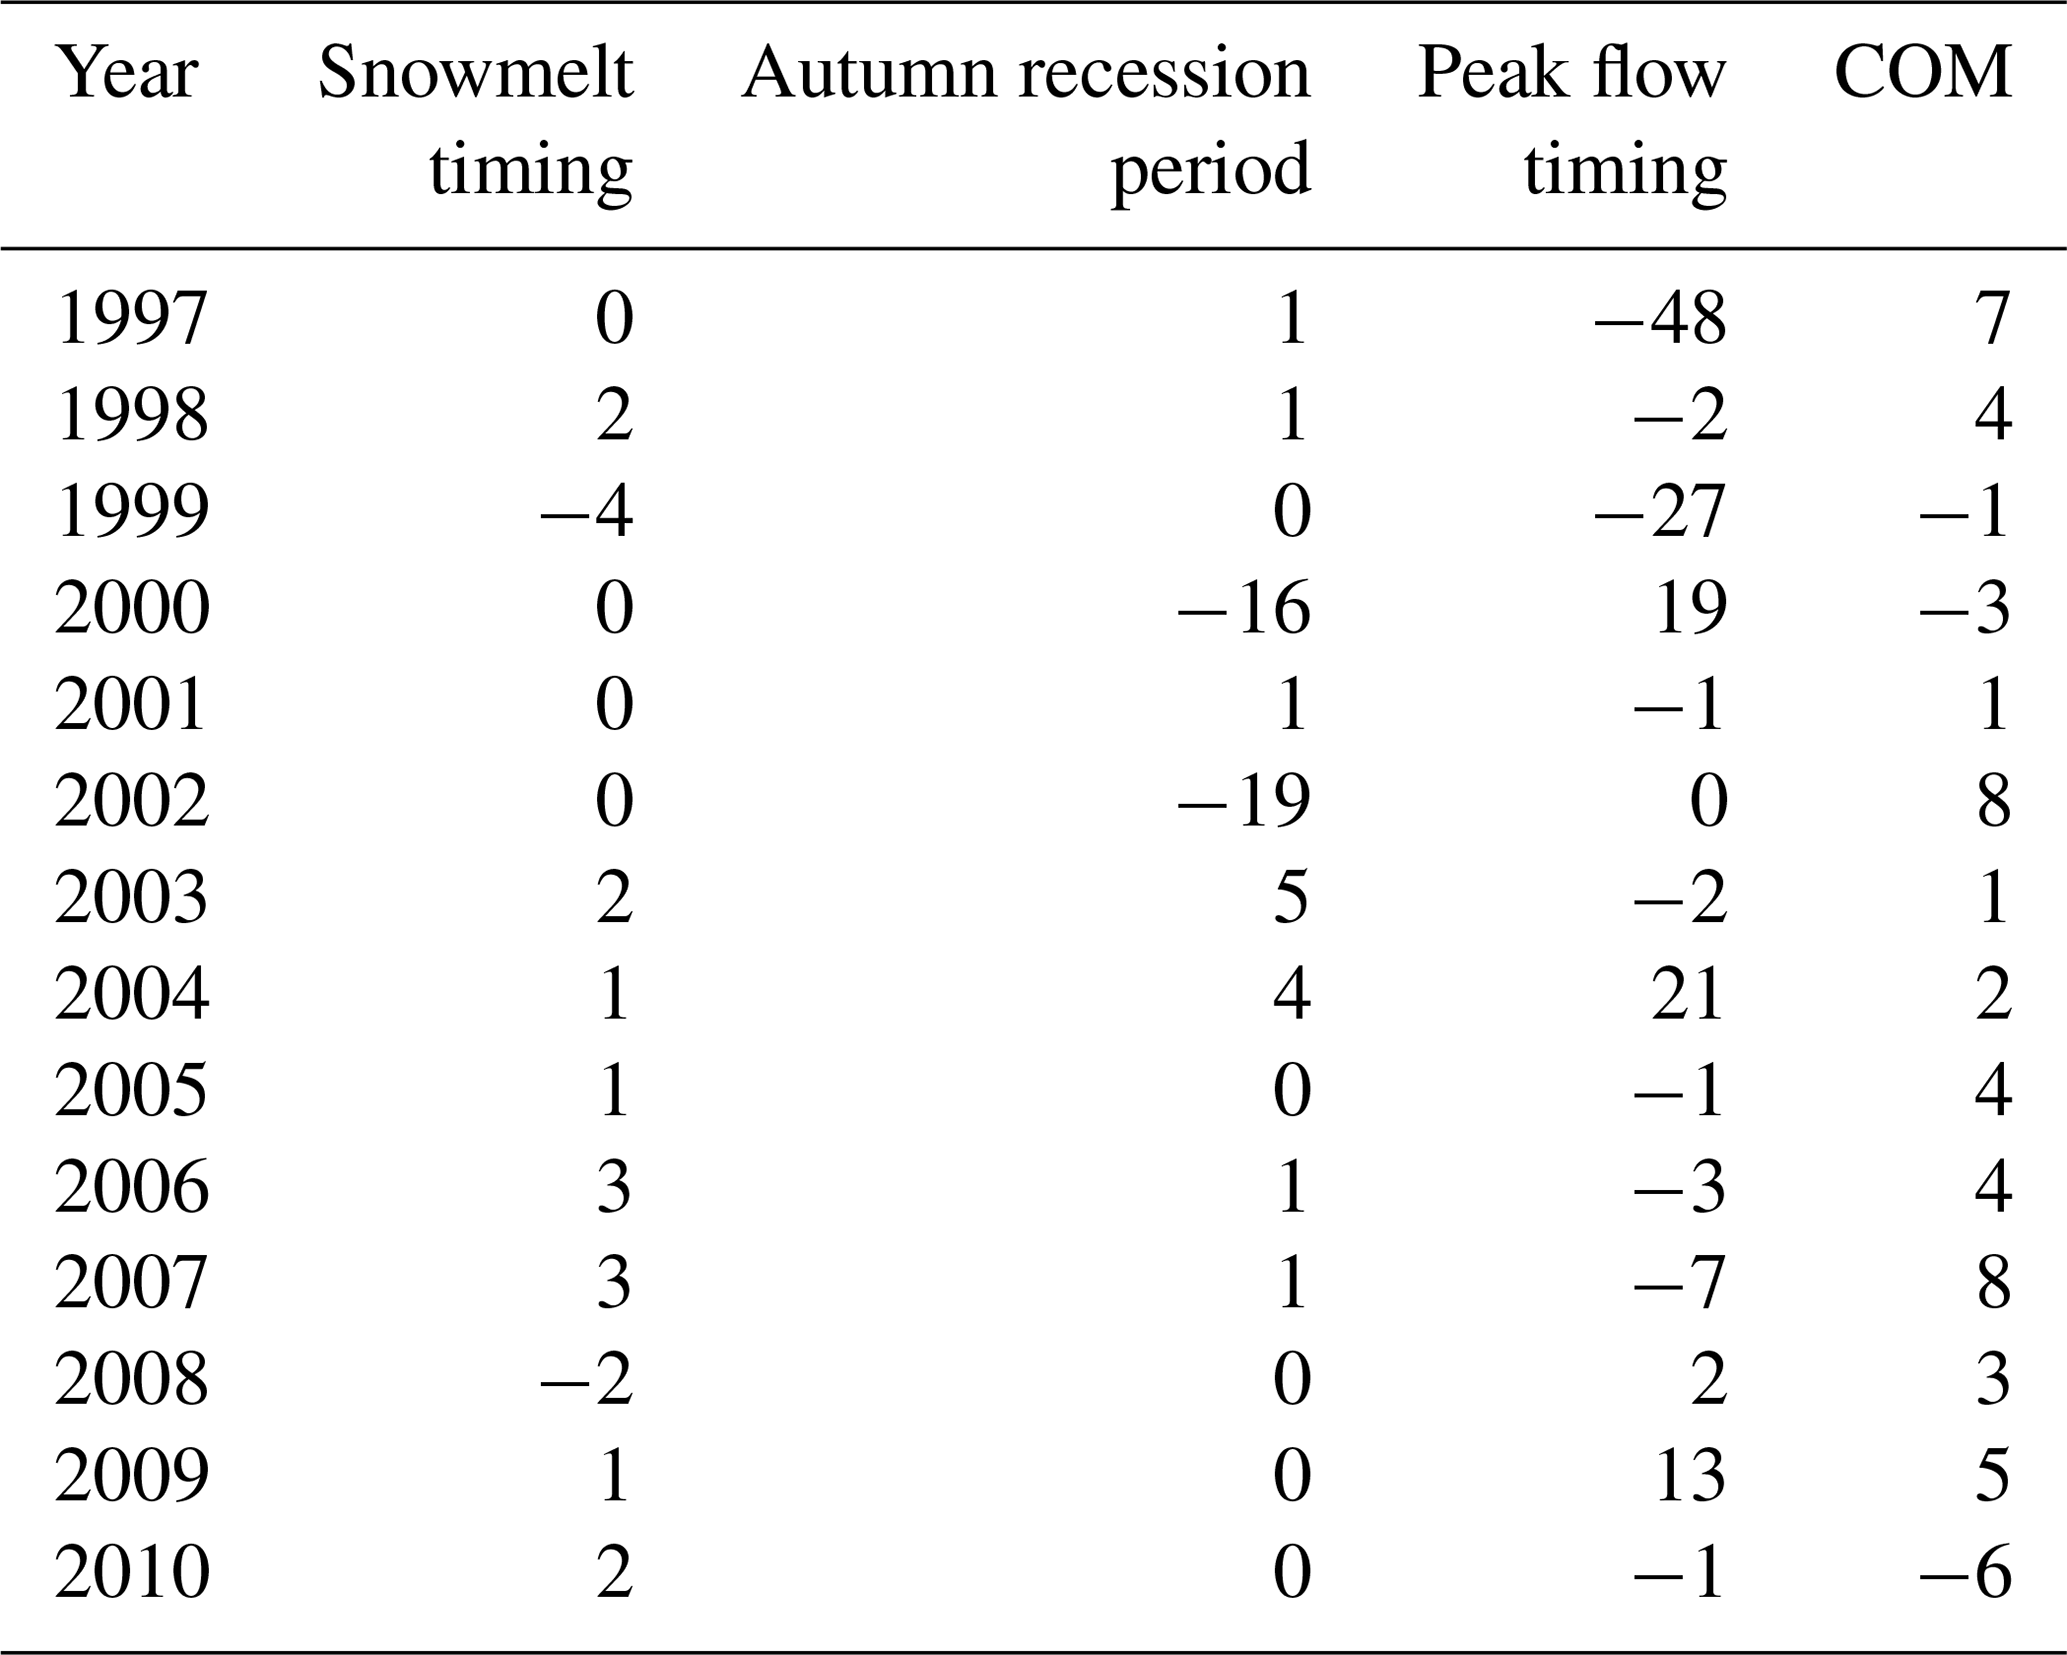
The cumulative graph (Fig. 3b) shows that there is an overall good agreement between model results and the measured reservoir inflow. However, the performance criteria had relatively lower values, with NS efficiency equal to 0.49, R2 equal to 0.72 and BE equal to −1. This is why the predictability of the model was further tested by analysing key parameters related to median runoff such as spring snowmelt timing, timing of peak flow, autumn recession period and the centre of mass (COM), which can indicate temporal shifts in the hydrological regime. Table 2 shows the difference in days between the observed and simulated values of the above parameters for each year of the period 1997–2010. A 15 d moving average window was applied to daily runoff. Snowmelt timing and autumn recession are simulated successfully since the differences for most years are zero or close to zero, except for the years 2000 and 2002 for autumn recession. Peak flow timing shows some inconsistencies between observed and simulated data for certain years, which are mainly related to the fact that for these years and during the snowmelt period, SWAT produces results with higher peaks. Finally, the COM of the simulated data is in good agreement with that of the observed data, with an average difference of 4 d.
On the whole, SWAT performance is considered to be acceptable, and it was successfully transferred to the greater Göscheneralpsee feeding catchment. One of the main reasons for the deterioration of the model performance is that SWAT does not differentiate between snow and glacier dynamics. In Omani et al. (2017) this issue was addressed by applying different snow parameters to the glacier-covered sub-basins than those applied for the non-glacierized ones. However, the sub-basins in our calibration watershed, the Damma glacier watershed, were partly glacierized, and for this reason it was decided to apply only one set of snow parameters for the whole watershed.
Furthermore, some inconsistency is caused by the fact that for two out of the four watersheds of the greater area feeding the Göscheneralpsee, runoff is drained through tunnels into the reservoir. Furthermore, Damma is characterized by very steep slopes (even up to nearly 80 ∘) and the groundwater–surface water interactions are less significant since runoff originates mainly from snowmelt, glacier melt and rainfall (Magnuson et al., 2012). For this reason, the ALPHA_BF parameter of SWAT was set to a high value and the GW_DELAY to low, parameter trends that characterize a watershed like Damma. However, a very high ALPHA_BF and low GW_DELAY might not be able to fully describe the Göscheneralpsee feeding area. The combination of these two factors could be the reason why some of the simulated peaks are higher but also narrower compared to the observed inflows into the reservoir, and SWAT does not simulate efficiently the winter low flows shown in Fig. 4.
Finally, SWAT results were compared to results from the PREVAH and ALPINE3D models, already published in Magnusson et al. (2011) and Kobierska et al. (2013) (Fig. 4). PREVAH is a semi-distributed conceptual hydrological model suited for applications in mountainous regions (Viviroli et al., 2009a, b), while ALPINE3D is a fully distributed energy balance model (Lehning et al., 2006).
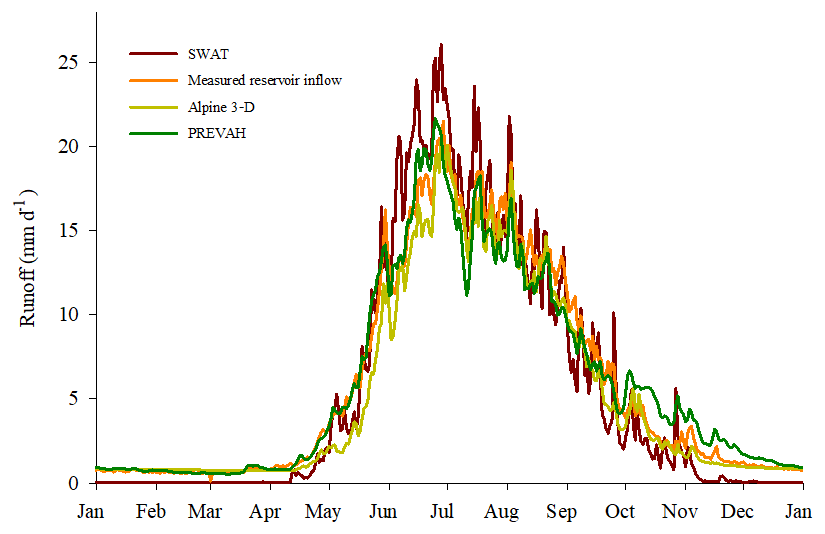
Figure 4Interannual average of the results of the SWAT, ALPINE3D and PREVAH models and the measured runoff of the Göscheneralpsee feeding catchment for the 1997–2010 period.
Figure 4 shows the interannual average of the period 1997–2010 daily reservoir inflow for each model. SWAT overestimated the inflow of the snowmelt period, from May to the beginning of July, while from mid July to late September its results are close to the observed values and in agreement with the other two models. Finally, in October inflow is slightly underestimated. The seasonality in variation between model results and observed values is linked to the application of only one melt rate for both snowmelt and glacier melt periods. The best fit of the model is observed when glacier melt is the major contributor to runoff, while it is overestimated during the snowmelt period. Seasonal variability in model performance is observed not only for SWAT, but also for ALPINE3D and PREVAH, as ALPINE3D underestimated the reservoir inflow during the snowmelt period, from May to June, while on the other hand runoff was slightly overestimated by PREVAH in October and November (Kobierska et al., 2013).
6.2 SWAT transferability on a temporal scale
As a next step, we simulated climate change scenarios for the greater area that feeds the Göscheneralpsee and compared the results with the climate change study in Kobierska et al. (2013) using the same time periods as follows.
-
Reference period T0: 1981–2010
-
T1: 2021–2050
-
T2: 2070–2099
The results of SWAT are presented as the interannual average reservoir inflow for each different scenario in Fig. 5a for the T1 period and in Fig. 5b for T2. The reference period shows the results of SWAT forced by the meteorological data of the Gütsch weather station for the period 1981–2010.
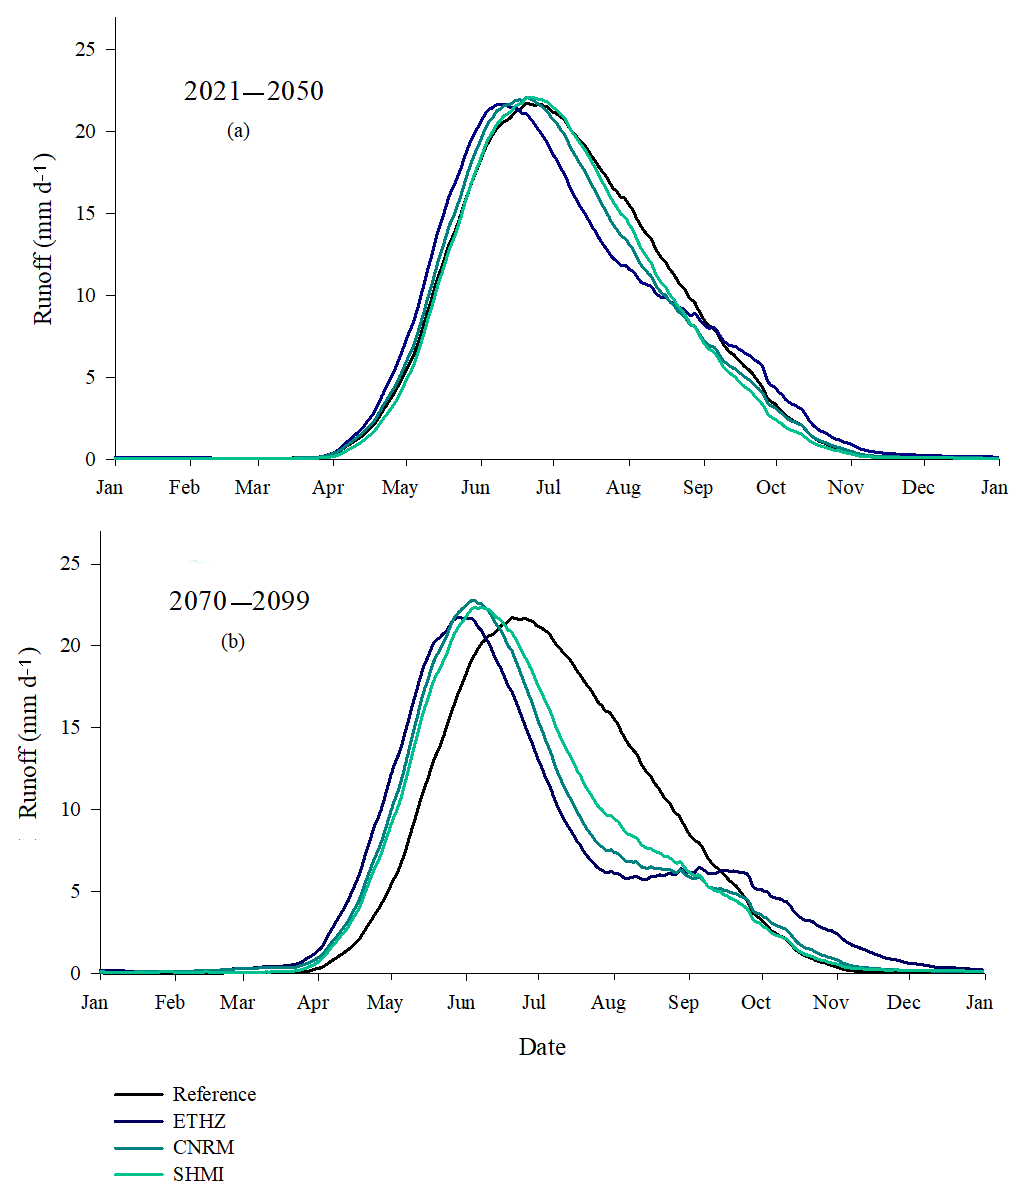
Figure 5Interannual average of SWAT results of the three climate change scenarios and the reference period T0 for the Göscheneralpsee feeding catchment (a) for the T1 period 2021–2050 and (b) for the T2 period 2070–2099. A 30 d average window is applied.
During the reference period, runoff peaks in mid June when snowmelt is combined with glacier melt. During the T1 period from July to September, all scenarios predict lower reservoir inflow than the reference period, indicating that the glacier melt cannot compensate for the predicted decrease in precipitation. From September until the end of the season, the predictions of all scenarios are higher than the reference period, which is explained by the higher predicted precipitation during autumn. The annual peak remains in mid June.
For the T2 period, reservoir inflow from spring to June is predicted to increase significantly for all three scenarios due to more intense snowmelt and higher precipitation. Based on the available glacier extent data described in Sect. 3.2.5, we estimated that in 2070, the total glacier volume would be reduced to almost half, resulting in less glacier melt between July and late August. For this reason, and in combination with the significant decrease in precipitation, predicted by all scenarios for this period, the simulated runoff is lower than that of the reference. Finally, the snow-free period is predicted to extend until December instead of September.
At the end of the T2 period, only a small part of the glacier is predicted to remain at high elevation. The date of peak flow would shift to be in the beginning of June. The main projected runoff volume is observed in spring and early summer, while during the glacier melt period, it is significantly lower than that of the reference period. Overall the total water yield for the scenarios in the T2 period is predicted to decrease.
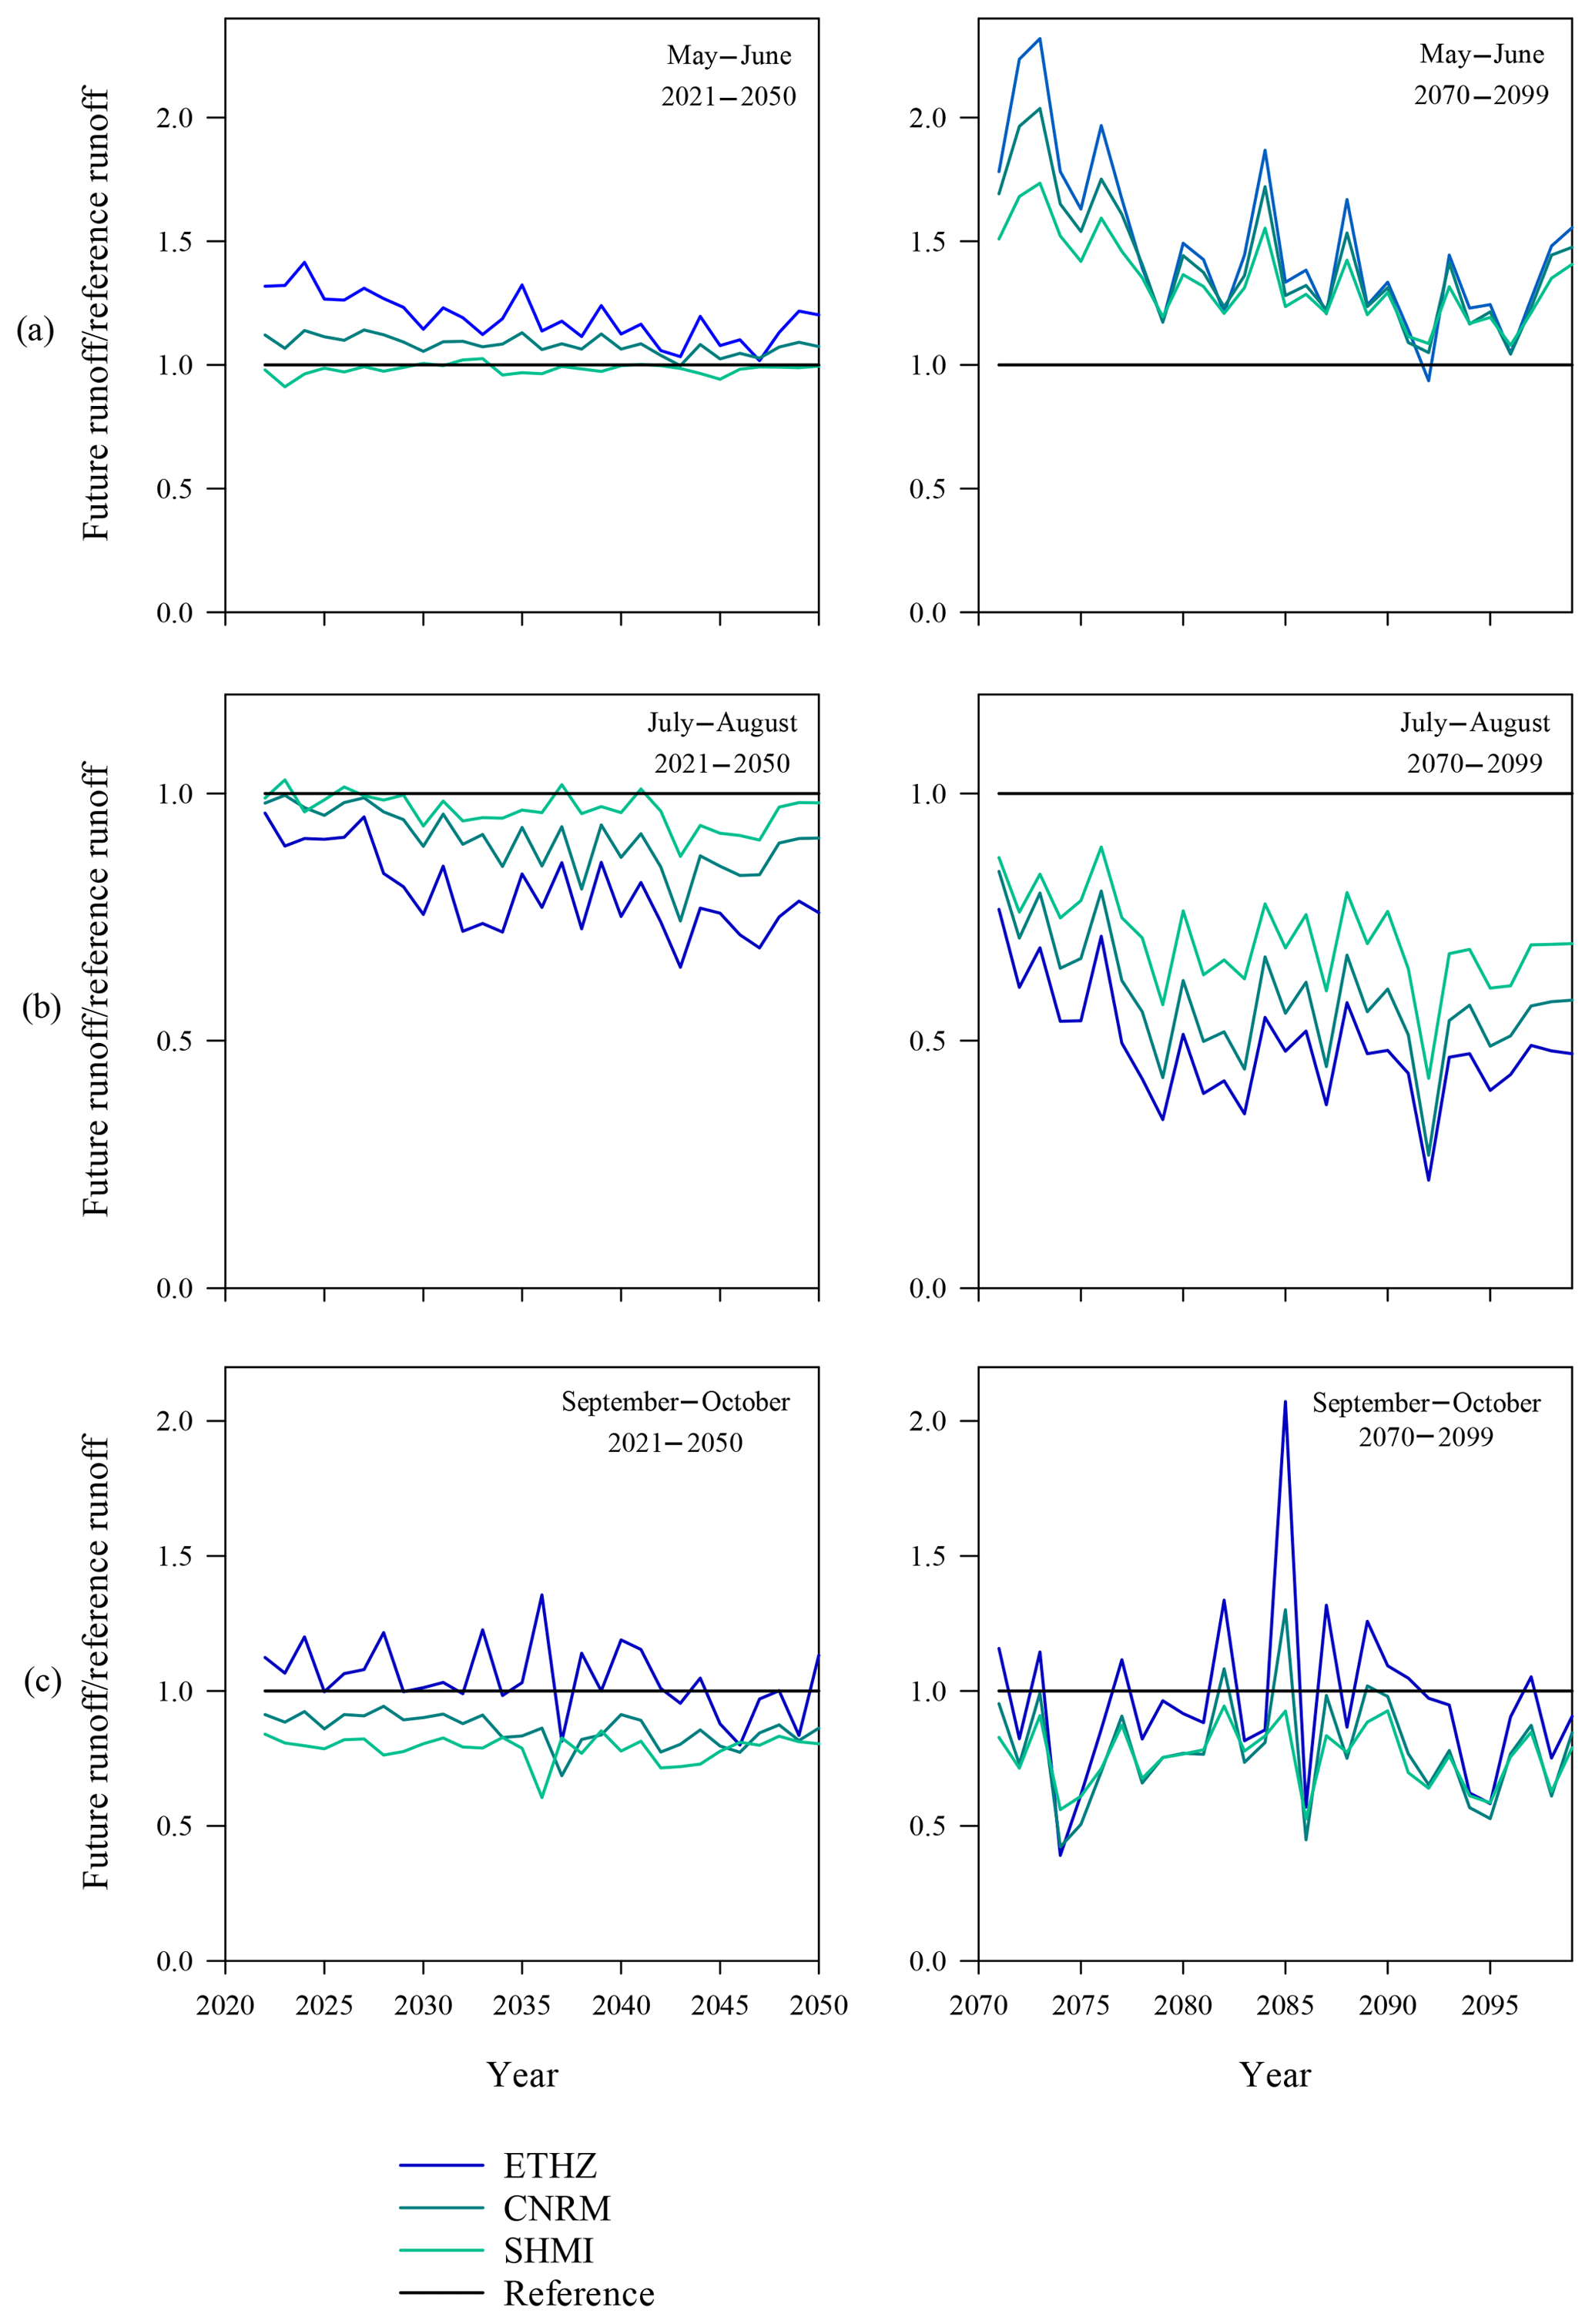
Figure 6Seasonal changes in the reservoir inflow simulated with SWAT for the Göscheneralpsee reservoir for the reference period T0 and future periods T1 and T2 for all three climate change scenarios. The interannual mean of the months (a) May and June, (b) July and August and (c) September and October is taken.
To better observe the seasonal changes in estimated reservoir inflow, Fig. 6 shows the interannual average inflow for (a) May–June, (b) July–August and (c) September–October for the T1 and T2 periods divided by the average of the reference period of the same months for all three scenarios. In May and June, as mentioned above, projected runoff is mainly dominated by snowmelt. The three climate change scenarios predict increased temperatures and higher precipitation during May and June which result in faster snowmelt and therefore in the increased predicted runoff as observed in Fig. 6a. The increase is higher in the T2 period due to the higher temperatures. The only exemption to that is the SHMI scenario for the near-future period, since it is the colder scenario that predicts the lowest temperature and precipitation changes. In July and August, climate change scenarios predict a significant decrease in precipitation, which is also depicted in the predicted reservoir inflow. The scenario that has the most drastic effect is the ETHZ because it is the scenario that predicts the most prominent increase in the temperature and decrease in the precipitation. For September and October, results do not show a clear trend for the warmer ETHZ scenario; however, for the CNRM and SHMI scenarios, predicted runoff is lower than the reference. Finally, the predicted inflow of the far-future period T2 shows higher fluctuations from year to year than that of the near-future period, especially from September to October.
Table 3Shift in days of the centre of mass (COM) and shift in the highest runoff peak of the interannual average reservoir inflow for all three scenarios. T1 and T2 stand for the T1 and T2 periods respectively.
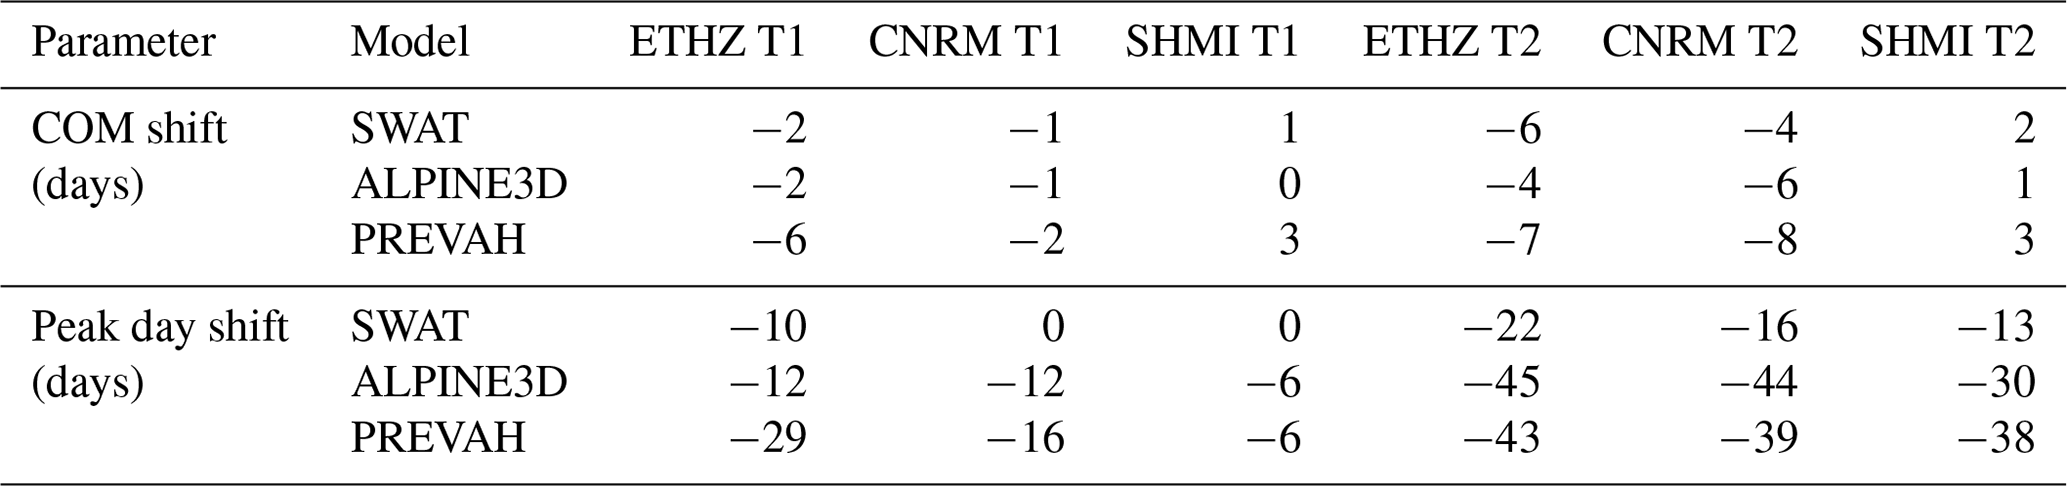
The climate change predictions of SWAT and the subsequent conclusions show many similarities in the seasonal variations to that of ALPINE3D and PREVAH. There are however uncertainties and differences between the models. Table 3 presents a comparison of the shift in days for the highest peak day and the COM between the three models for all the scenarios. Although the shift of COM is in good agreement among the three models for each scenario, the models differed significantly concerning the shift in the highest peak day. ALPINE3D and PREVAH predict the peak flow to shift by approximately 3 and 6 weeks for the T1 and T2 periods respectively (Kobierska et al., 2013). On the other hand, the shift of the highest peak day with SWAT is significantly smaller since a 10 d shift is predicted only with the warmer ETHZ scenario for the T1 period, while a maximum shift of approximately 3 weeks is predicted for the T2 period (Table 3). This finding suggests that ALPINE3D and PREVAH responded to a greater extent to glacier melt regarding the climate change scenarios than SWAT. This observation could be attributed to the application of one set of snow parameters for both glacier melt and snowmelt, even though the initial glacier cover was adjusted for both future periods, T1 and T2, according to the available glacier cover predictions. However, it should be noted that by transferring the model from the small Damma watershed to the greater area, we increased considerably the uncertainty regarding the hydrological modelling. Therefore, a further quantitative comparison between the models could not be made.
This study is an assessment of the transferability or upscaling of SWAT on a spatial and temporal scale for a partly glacierized catchment at a high altitude. For this reason, we followed an approach similar to the proxy-basin test introduced by Klemeš (1986).
Firstly, SWAT was calibrated and evaluated for the Damma glacier watershed, and it was demonstrated that despite the extreme conditions of this high Alpine watershed, SWAT performed successfully, with satisfactory NS and BE efficiencies. Subsequently, we assessed the transferability of the model by upscaling and applying SWAT for the greater area that drains into the Göscheneralpsee reservoir and includes the Damma glacier watershed. By comparing model results with existing inflow data, we showed that the model was able to predict key parameters such as the snowmelt timing, autumn recession period and the peak flow timing. However, overestimation of runoff during the snowmelt period highlights the importance of taking into account the difference in snow and glacier dynamics. It showed that better performance could have been achieved if different parameters for snowmelt and glacier melt had been applied. This observation is quite important for study sites where streamflow is greatly dependent on both snowmelt and glacier melt.
The temporal transferability of SWAT was analysed by assessing the impact of climate change on the hydrology of the greater catchment and comparing these results with a previous climate change study conducted for the same area. Climate change predictions showed that the hydrological regime will change significantly in the future, especially towards the end of the century. Although the results of SWAT show many similarities in the seasonal pattern of the predicted runoff to the results of PREVAH and ALPINE3D, there are also significant differences. These differences are related to the lack of sensitivity of SWAT to changes in the snowmelt and glacier melt dynamics. As the contribution of glacier melt to runoff is predicted to decrease, the significance of snowmelt becomes more prominent. It is therefore important when applying SWAT on high-altitude watersheds to distinguish the glacier-covered or snow-dominated sub-basins and pay particular attention to the applied snow parameters. This climate change study identifies qualitatively the impact of climate change on our study site, but no further quantifications could be made or further conclusions drawn.
In conclusion, our findings show how important are the transferability assessment tests in identifying the strengths and weaknesses of the hydrological models, when they are applied under extreme climatic and geographical conditions or even under conditions different to the ones that were created and calibrated. They become even more important when they concern the widely used hydrological models like SWAT. Regarding the transferability of the model at a temporal scale and under climate change, more detailed tests such as the ones proposed by Klemeš (1986) and Thirel et al. (2015) could give more insightful results. Finally, the upscaling methodology used here, where SWAT is calibrated for a small watershed and then applied for a greater area that includes the calibration watershed, is a simple but still effective approach. It can be valuable in predicting streamflow of ungauged watersheds, in large-scale hydrological simulations and for policy makers working in water management.
Model simulation data, Damma glacier watershed runoff, reservoir inflow data and meteorological data of the weather station located at the Damma glacier watershed are available upon request by the corresponding author. Digital elevation model and soil maps were provided by the Swiss Federal Office for Topography. Land-use data can be freely downloaded by the Corine database of the European Environmental Agency. Meteorological data of the Gütsch weather station are provided by the Swiss Federal Office of Meteorology and Climatology Meteoswiss. Data on the glacier extent and the climate change scenarios are given according to the given reference.
MA applied the SWAT model, analysed data and prepared the manuscript with contributions from all the co-authors. JS reviewed the manuscript and assisted in the modelling procedure. FK provided meteorological and runoff data. NPN provided guidance for the research goals. SMB was the supervisor of the research project and provided the funding that lead to this publication.
The authors declare that they have no conflict of interest.
This study was supported by the European Commission FP 7 Collaborative Project: Soil Transformations in European Catchments (SoilTrEC). We thank Thomas Bosshard (Institute for Atmospheric and Climate Science, ETH Zürich, Switzerland), Frank Paul (Department of Geography, University of Zürich, Switzerland), MeteoSwiss and SwissTopo for providing all the necessary data for the completion of this study. We would also like to thank the editor and the reviewers for their valuable contributions in improving this paper.
This research has been supported by the European Commission (grant no. SOILTREC (244118)).
This paper was edited by Bettina Schaefli and reviewed by Guillaume Thirel and one anonymous referee.
Abbaspour, K. C., Yang, J., Maximov, I., Siber, R., Bogner, K., Mieleitner, J., Zobrist, J., and Srinivasan, R.: Modelling hydrology and water quality in the pre-alpine/alpine Thur watershed using SWAT, J. Hydrol., 333, 413–430, https://doi.org/10.1016/j.jhydrol.2006.09.014, 2007.
Ahl, R. S., Woods, S. W., and Zuuring, H. R.: Hydrologic Calibration and Validation of SWAT in a Snow-Dominated Rocky Mountain Watershed, Montana, U.S.A., J. Am. Water Resour. As., 44, 1411–1430, https://doi.org/10.1111/j.1752-1688.2008.00233.x, 2008.
Aili, T., Soncini, A., Bianchi, A., Diolaiuti, G., D'Agata, C., Bocchiola, D. J. T., and Climatology, A.: Assessing water resources under climate change in high-altitude catchments: a methodology and an application in the Italian Alps, Theor. Appl. Climatol., 135, 135–156, https://doi.org/10.1007/s00704-017-2366-4, 2019.
Andrianaki, M., Bernasconi, S. M., and Nikolaidis, N. P.: Chapter Eight - Quantifying the Incipient Development of Soil Structure and Functions Within a Glacial Forefield Chronosequence, in: Advances in Agronomy, edited by: Steven, A. B. and Donald, L. S., Academic Press, 215–239, 2017.
Arnold, J. G., Srinivasan, R., Muttiah, R. S., and Williams, J. R.: Large area hydrologic modeling and assessment – Part 1: Model development, J. Am. Water Resour. As., 34, 73–89, https://doi.org/10.1111/j.1752-1688.1998.tb05961.x, 1998.
Banwart, S., Bernasconi, S. M., Bloem, J., Blum, W., Brandao, M., Brantley, S., Chabaux, F., Duffy, C., Kram, P., Lair, G., Lundin, L., Nikolaidis, N., Novak, M., Panagos, P., Ragnarsdottir, K. V., Reynolds, B., Rousseva, S., de Ruiter, P., van Gaans, P., van Riemsdijk, W., White, T., and Zhang, B.: Soil Processes and Functions in Critical Zone Observatories: Hypotheses and Experimental Design, Vadose Zone J., 10, 974–987, https://doi.org/10.2136/vzj2010.0136, 2011.
Bárdossy, A.: Calibration of hydrological model parameters for ungauged catchments, Hydrol. Earth Syst. Sci., 11, 703–710, https://doi.org/10.5194/hess-11-703-2007, 2007.
Bavay, M., Grünewald, T., and Lehning, M.: Response of snow cover and runoff to climate change in high Alpine catchments of Eastern Switzerland, Adv. Water Resour., 55, 4–16, https://doi.org/10.1016/j.advwatres.2012.12.009, 2013.
Bernasconi, S. M., Christl, I., Hajdas, I., Zimmermann, S., Hagedorn, F., Smittenberg, R. H., Furrer, G., Zeyer, J., Brunner, I., Frey, B., Plotze, M., Lapanje, A., Edwards, P., Venterink, H. O., Goransson, H., Frossard, E., Bunemann, E., Jansa, J., Tamburini, F., Welc, M., Mitchell, E., Bourdon, B., Kretzschmar, R., Reynolds, B., Lemarchand, E., Wiederhold, J., Tipper, E., Kiczka, M., Hindshaw, R., Stahli, M., Jonas, T., Magnusson, J., Bauder, A., Farinotti, D., Huss, M., Wacker, L., Abbaspour, K., and Biglink Project, M.: Weathering, soil formation and initial ecosystem evolution on a glacier forefield: a case study from the Damma Glacier, Switzerland, Mineral. Mag., 72, 19–22, https://doi.org/10.1180/minmag.2008.072.1.19, 2008.
Bernasconi, S. M., Bauder, A., Bourdon, B., Brunner, I., Bunemann, E., Christl, I., Derungs, N., Edwards, P., Farinotti, D., Frey, B., Frossard, E., Furrer, G., Gierga, M., Goransson, H., Gulland, K., Hagedorn, F., Hajdas, I., Hindshaw, R., Ivy-Ochs, S., Jansa, J., Jonas, T., Kiczka, M., Kretzschmar, R., Lemarchand, E., Luster, J., Magnusson, J., Mitchell, E. A. D., Venterink, H. O., Plotze, M., Reynolds, B., Smittenberg, R. H., Stahli, M., Tamburini, F., Tipper, E. T., Wacker, L., Welc, M., Wiederhold, J. G., Zeyer, J., Zimmermann, S., and Zumsteg, A.: Chemical and Biological Gradients along the Damma Glacier Soil Chronosequence, Switzerland, Vadose Zone J., 10, 867–883, https://doi.org/10.2136/vzj2010.0129, 2011.
Bosshard, T., Kotlarski, S., Ewen, T., and Schär, C.: Spectral representation of the annual cycle in the climate change signal, Hydrol. Earth Syst. Sci., 15, 2777–2788, https://doi.org/10.5194/hess-15-2777-2011, 2011.
CH2011: Swiss Climate Change Scenarios CH2011, published by C2SM, MeteoSwiss, ETH, NCCR Climate, and OcCC, Zurich, Switzerland, 88 pp., 2011.
Bocchiola, D., Diolaiuti, G., Soncini, A., Mihalcea, C., D'Agata, C., Mayer, C., Lambrecht, A., Rosso, R., and Smiraglia, C.: Prediction of future hydrological regimes in poorly gauged high altitude basins: the case study of the upper Indus, Pakistan, Hydrol. Earth Syst. Sci., 15, 2059–2075, https://doi.org/10.5194/hess-15-2059-2011, 2011.
Corine landcover database: available at: http://www.eea.europa.eu/data-and-maps/data/corine-land-cover-2006-raster-2, last access: 30 May 2019.
Debele, B., Srinivasan, R., and Gosain, A. K.: Comparison of Process-Based and Temperature-Index Snowmelt Modeling in SWAT, Water Resour. Manag., 24, 1065–1088, https://doi.org/10.1007/s11269-009-9486-2, 2010.
Di Luzio, M., Srinivasan, R., and Arnold, J. G.: Integration of watershed tools and SWAT model into basins, J. Am. Water Resour. As., 38, 1127–1141, https://doi.org/10.1111/j.1752-1688.2002.tb05551.x, 2002.
Deckers, D. L. E. H., Booij, M. J., Rientjes, T. H. M., and Krol, M. S.: Catchment Variability and Parameter Estimation in Multi-Objective Regionalisation of a Rainfall-Runoff Model, Water Resour. Manag., 24, 3961–3985, https://doi.org/10.1007/s11269-010-9642-8, 2010.
Dumig, A., Smittenberg, R., and Kogel-Knabner, I.: Concurrent evolution of organic and mineral components during initial soil development after retreat of the Damma glacier, Switzerland, Geoderma, 163, 83–94, https://doi.org/10.1016/j.geoderma.2011.04.006, 2011.
Farinotti, D., Usselmann, S., Huss, M., Bauder, A., and Funk, M.: Runoff evolution in the Swiss Alps: projections for selected high-alpine catchments based on ENSEMBLES scenarios, Hydrol. Process., 26, 1909–1924, https://doi.org/10.1002/hyp.8276, 2012.
Fontaine, T. A., Cruickshank, T. S., Arnold, J. G., and Hotchkiss, R. H.: Development of a snowfall-snowmelt routine for mountainous terrain for the soil water assessment tool (SWAT), J. Hydrol., 262, 209–223, https://doi.org/10.1016/S0022-1694(02)00029-X, 2002.
Garee, K., Chen, X., Bao, A., Wang, Y., and Meng, F.: Hydrological Modeling of the Upper Indus Basin: A Case Study from a High-Altitude Glacierized Catchment Hunza, Water, 9, 17, https://doi.org/10.3390/w9010017, 2017.
Grusson, Y., Sun, X., Gascoin, S., Sauvage, S., Raghavan, S., Anctil, F., and Sáchez-Pérez, J.-M.: Assessing the capability of the SWAT model to simulate snow, snow melt and streamflow dynamics over an alpine watershed, J. Hydrol., 531, 574–588, https://doi.org/10.1016/j.jhydrol.2015.10.070, 2015.
Hock, R.: Temperature index melt modelling in mountain areas, J. Hydrol., 282, 104–115, https://doi.org/10.1016/S0022-1694(03)00257-9, 2003.
Hrachowitz, M., Savenije, H. H. G., Blöschl, G., McDonnell, J. J., Sivapalan, M., Pomeroy, J. W., Arheimer, B., Blume, T., Clark, M. P., Ehret, U., Fenicia, F., Freer, J. E., Gelfan, A., Gupta, H. V., Hughes, D. A., Hut, R. W., Montanari, A., Pande, S., Tetzlaff, D., Troch, P. A., Uhlenbrook, S., Wagener, T., Winsemius, H. C., Woods, R. A., Zehe, E., and Cudennec, C.: A decade of Predictions in Ungauged Basins (PUB) – a review, Hydrol. Sci. J., 58, 1198–1255, https://doi.org/10.1080/02626667.2013.803183, 2013.
Klemeš, V.: Operational Testing of Hydrological Simulation-Models, Hydrol. Sci. J., 31, 13–24, https://doi.org/10.1080/02626668609491024, 1986.
Kobierska, F., Jonas, T., Magnusson, J., Zappa, M., Bavay, M., Bosshard, T., Paul, F., and Bernasconi, S. M.: Climate change effects on snow melt and discharge of a partly glacierized watershed in Central Switzerland (SoilTrec Critical Zone Observatory), Appl. Geochem., 26, 60–62, https://doi.org/10.1016/j.apgeochem.2011.03.029, 2011.
Kobierska, F., Jonas, T., Zappa, M., Bavay, M., Magnusson, J., and Bernasconi, S. M.: Future runoff from a partly glacierized watershed in Central Switzerland: A two-model approach, Adv. Water Resour., 55, 204–214, https://doi.org/10.1016/j.advwatres.2012.07.024, 2013.
Lehning, M., Völksch, I., Gustafsson, D., Nguyen, T. A., Stähli, M., and Zappa, M.: ALPINE3D: a detailed model of mountain surface processes and its application to snow hydrology, Hydrol. Process., 20, 2111–2128, https://doi.org/10.1002/hyp.6204, 2006.
Magnusson, J., Farinotti, D., Jonas, T., and Bavay, M.: Quantitative evaluation of different hydrological modelling approaches in a partly glacierized Swiss watershed, Hydrol. Process., 25, 2071–2084, https://doi.org/10.1002/hyp.7958, 2011.
Magnusson, J., Jonas, T., and Kirchner, J. W.: Temperature dynamics of a proglacial stream: Identifying dominant energy balance components and inferring spatially integrated hydraulic geometry, Water Resour. Res., 48, W06510, https://doi.org/10.1029/2011WR011378, 2012.
Merz, R. and Blöschl, G.: Regionalisation of catchment model parameters, J. Hydrol., 287, 95–123, https://doi.org/10.1016/j.jhydrol.2003.09.028, 2004.
Nash, J. E. and Sutcliffe, J. V.: River flow forecasting through conceptual models part I – A discussion of principles, J. Hydrol., 10, 282–290, https://doi.org/10.1016/0022-1694(70)90255-6, 1970.
Neitsch, S. L., Arnold, J. G., Kiniry, J. R., and Williams, J. R.: Soil and water assessment tool – Theoretical documentation, Version 2009, Texas Water Resources Institute technical report No. 406, Texas, 77843-2118, 2011.
Omani, N., Srinivasan, R., Karthikeyan, R., and Smith, P.: Hydrological Modeling of Highly Glacierized Basins (Andes, Alps, and Central Asia), Water, 9, 111, https://doi.org/10.3390/w9020111, 2017.
Parajka, J., Merz, R., and Blöschl, G.: A comparison of regionalisation methods for catchment model parameters, Hydrol. Earth Syst. Sci., 9, 157–171, https://doi.org/10.5194/hess-9-157-2005, 2005.
Patil, S. and Stieglitz, M.: Modelling daily streamflow at ungauged catchments: what information is necessary?, Hydrol. Process., 28, 1159–1169, https://doi.org/10.1002/hyp.9660, 2014.
Paul, F., Maisch, M., Rothenbühler, C., Hoelzle, M., and Haeberli, W.: Calculation and visualisation of future glacier extent in the Swiss Alps by means of hypsographic modelling, Global Planet. Change, 55, 343–357, https://doi.org/10.1016/j.gloplacha.2006.08.003, 2007.
Rahman, K., Maringanti, C., Beniston, M., Widmer, F., Abbaspour, K., and Lehmann, A.: Streamflow Modeling in a Highly Managed Mountainous Glacier Watershed Using SWAT: The Upper Rhone River Watershed Case in Switzerland, Water Resour. Manag., 27, 323–339, https://doi.org/10.1007/s11269-012-0188-9, 2013.
SwissALTI3D: available at: https://shop.swisstopo.admin.ch/de/products/height\models/alti3D, last access: 30 May 2019.
Schaefli, B. and Gupta, H. V.: Do Nash values have value?, Hydrol. Process., 21, 2075–2080, https://doi.org/10.1002/hyp.6825, 2007.
Schaltegger, U.: The central Aar granite – Highly differentiated calc-alkaline magmatism in the Aar massif (central Alps, Switzerland), Eur. J. Mineral., 2, 245–259, 1990.
Sivapalan, M., Takeuchi, K., Franks, S. W., Gupta, V. K., Karambiri, H., Lakschmi, V., Liang, X., McDonnel, J. J., Mendiondo, E. M., O`Connell, P. E., Oki, T., Pomeroy, J. W., Schertzer, D., Uhlenbrook, S., and Zehe, E.: IAHS Decade on Predictions in Ungauged Basins, PUB. 2003–2012: shaping an exciting future for the hydrological sciences, Hydrol. Sci. J., 48, 857–880, https://doi.org/10.1623/hysj.48.6.857.51421, 2003.
Srinivasan, R., Ramanarayanan, T. S., Arnold, J. G., and Bednarz, S. T.: Large area hydrologic modeling and assessment – Part II: Model application, J. Am. Water Resour. As., 34, 91–101, https://doi.org/10.1111/j.1752-1688.1998.tb05962.x, 1998.
Thirel, G., Andréassian, V., and Perrin, C.: On the need to test hydrological models under changing conditions, Hydrol. Sci. J., 60, 1165–1173, https://doi.org/10.1080/02626667.2015.1050027, 2015.
Viviroli, D. and Weingartner, R.: The hydrological significance of mountains: from regional to global scale, Hydrol. Earth Syst. Sci., 8, 1017–1030, https://doi.org/10.5194/hess-8-1017-2004, 2004.
Viviroli, D., Zappa, M., Schwanbeck, J., Gurtz, J., and Weingartner, R.: Continuous simulation for flood estimation in ungauged mesoscale catchments of Switzerland – Part I: Modelling framework and calibration results, J. Hydrol., 377, 191–207, https://doi.org/10.1016/j.jhydrol.2009.08.023, 2009a.
Viviroli, D., Mittelbach, H., Gurtz, J., and Weingartner, R.: Continuous simulation for flood estimation in ungauged mesoscale catchments of Switzerland – Part II: Parameter regionalisation and flood estimation results, J. Hydrol., 377, 208–225, https://doi.org/10.1016/j.jhydrol.2009.08.022, 2009b.
Wagener, T., Sivapalan, M., Troch, P., and Woods, R.: Catchment Classification and Hydrologic Similarity, Geography Compass, 1, 901–931, https://doi.org/10.1111/j.1749-8198.2007.00039.x, 2007.
Wang, X. and Melesse, A. M.: Effects of STATSGO and SSURGO as inputs in SWAT model's snowmelt simulation, J. Am. Water Resour. As., 42, 1217–1236, https://doi.org/10.1111/j.1752-1688.2006.tb05296.x, 2006.
Zhang, X. S., Srinivasan, R., Debele, B., and Hao, F. H.: Runoff simulation of the headwaters of the Yellow River using the SWAT model with three snowmelt algorithms, J. Am. Water Resour. As., 44, 48–61, https://doi.org/10.1111/j.1752-1688.2007.00137.x, 2008.
Zhang, Y., Chiew, F. H. S., Li, M., and Post, D.: Predicting Runoff Signatures Using Regression and Hydrological Modeling Approaches, Water Resour. Res., 54, 7859–7878, https://doi.org/10.1029/2018wr023325, 2018.