the Creative Commons Attribution 4.0 License.
the Creative Commons Attribution 4.0 License.
 | 23 Jul 2019
Assessing the characteristics and drivers of compound flooding events around the UK coast
Ivan D. Haigh
Robert J. Nicholls
Hugo Winter
Robert Neal
Thomas Wahl
Amélie Joly-Laugel
Stephen E. Darby
In low-lying coastal regions, flooding arises from oceanographic (storm surges plus tides and/or waves), fluvial (increased river discharge), and/or pluvial (direct surface run-off) sources. The adverse consequences of a flood can be disproportionately large when these different sources occur concurrently or in close succession, a phenomenon that is known as “compound flooding”. In this paper, we assess the potential for compound flooding arising from the joint occurrence of high storm surge and high river discharge around the coast of the UK. We hypothesise that there will be spatial variation in compound flood frequency, with some coastal regions experiencing a greater dependency between the two flooding sources than others. We map the dependence between high skew surges and high river discharge, considering 326 river stations linked to 33 tide gauge sites. We find that the joint occurrence of high skew surges and high river discharge occurs more frequently during the study period (15–50 years) at sites on the south-western and western coasts of the UK (between three and six joint events per decade) compared to sites along the eastern coast (between zero and one joint events per decade). Second, we investigate the meteorological conditions that drive compound and non-compound events across the UK. We show, for the first time, that spatial variability in the dependence and number of joint occurrences of high skew surges and high river discharge is driven by meteorological differences in storm characteristics. On the western coast of the UK, the storms that generate high skew surges and high river discharge are typically similar in characteristics and track across the UK on comparable pathways. In contrast, on the eastern coast, the storms that typically generate high skew surges are mostly distinct from the types of storms that tend to generate high river discharge. Third, we briefly examine how the phase and strength of dependence between high skew surge and high river discharge is influenced by the characteristics (i.e. flashiness, size, and elevation gradient) of the corresponding river catchments. We find that high skew surges tend to occur more frequently with high river discharge at catchments with a lower base flow index, smaller catchment area, and steeper elevation gradient. In catchments with a high base flow index, large catchment area, and shallow elevation gradient, the peak river flow tends to occur several days after the high skew surge. The previous lack of consideration of compound flooding means that flood risk has likely been underestimated around UK coasts, particularly along the south-western and western coasts. It is crucial that this be addressed in future assessments of flood risk and flood management approaches.
- Article
(13819 KB) - Full-text XML
-
Supplement
(9149 KB) - BibTeX
- EndNote


Flooding is the most dangerous and costly of natural disasters (Pall et al., 2011). From 1980 to 2013, floods accounted for more than USD 1 trillion in losses and resulted in at least 220 000 fatalities globally (Munich Re, 2017). More than 50 % of these deaths and a large proportion of the economic losses occurred in densely populated low-lying coastal regions. Globally, coastal areas are home to more than 600 million people and constitute strategic economic centres (McGranahan et al., 2007). Recent flood events, for example, Cyclone Nargis in Myanmar (Fritz et al., 2009), Hurricane Katrina in the US (Jonkman et al., 2009), flooding in the UK over the winter of 2013–2014 (Haigh et al., 2016), and Hurricane Harvey in the US (Emanuel, 2017), have demonstrated the ever-present threat of serious flood impacts in coastal regions despite improvements in levels of flood protection and advancements in flood forecasting and warnings. Furthermore, coastal flooding is a growing threat due to sea-level rise and changes in storminess (Nerem et al., 2018; Church et al., 2013), ongoing vertical land movement (Brown and Nicholls, 2015), and rapid population growth and accompanying development in flood-exposed areas (Brown et al., 2018; Hallegatte et al., 2013).
Flooding in coastal regions arises from four main source mechanisms: (1) storm surge combined with high astronomical tide (storm tides), (2) locally or remotely (swell) generated waves, (3) river discharge (fluvial), or (4) direct surface run-off (pluvial). The first two sources are oceanographic in origin, while the latter two mainly arise from heavy precipitation but can also arise from snow melt. Most existing flood risk assessments consider these four main drivers of flooding separately. However, in coastal regions floods are often caused by more than just one factor because they may be naturally correlated (i.e. with storms). Furthermore, the adverse consequences of a flood can be greatly exacerbated when the oceanographic (storm tides and waves), fluvial, and/or pluvial drivers occur concurrently or in close succession (i.e. a few hours to days apart). Depending on local characteristics (which influence lag times between variables), this can result in disproportionately extreme events, referred to as compound flood events. Compound events are defined by the Intergovernmental Panel on Climate Change (Seneviratne et al., 2012) as “(1) two or more extreme events occurring simultaneously or successively, (2) combinations of extreme events with underlying conditions that amplify the impact, (3) and combinations of events that are not themselves extremes but lead to an extreme event when combined”. Zscheischler et al. (2018) define compound events as “the combination of multiple drivers and/or hazards that contributes to societal or environmental risk”. With the potential to create considerable destruction, the World Climate Research Program (WCRP) Grand Challenge on Weather and Climate Extremes has recently identified compound events as an international research priority (Zscheischler et al., 2018). In this paper we assess the potential for compound flooding arising from the joint occurrence of high storm surges and high river discharges around the coast of UK.
A recent example of compound flooding occurred during Hurricane Harvey in 2017. Record-breaking rainfall, river discharge, and run-off, combined with a moderate but long-lasting storm surge, resulted in disastrous flooding in Houston (Emanuel, 2017). It was the second-costliest natural disaster in US history (NOAA, 2018). Hurricane Irma in 2017 was also a prime example of compound flooding, where significant flooding occurred along the St Johns River in Jacksonville as a result of a combined storm surge and extensive rainfall run-off (Cangialosi et al., 2017). Compound flooding can also arise from extratropical storms. For example, a storm surge on the Adriatic coast of Italy obstructed large amounts of freshwater run-off (generated by the same storm) from draining, causing major compound flooding in Ravenna, Italy (Bevacqua et al., 2017). It is now recognised that by not considering compound flooding, the risk to these locations and elsewhere was, and continues to be, greatly underestimated (Wahl et al., 2015).
In recent years there has been an increase in the number of studies that have started to investigate compound flood sources and events. The majority of these studies have been undertaken on a small spatial scale for specific localised regions, e.g. Fuzhou, China (Lian et al., 2013); Tsengwen River basin, Taiwan (Chen and Liu, 2014); Hudson River, USA (Orton et al., 2015); Shoalhaven River, Australia (Kumbier et al., 2018); the Rhine delta, Netherlands (Kew et al., 2013 and Khanal et al., 2018); Brest, France (Mazas and Hamm, 2017); Santander, Spain (Rueda et al., 2016); Ravenna, Italy (Bevacqua et al., 2017); and the river Trent, the Yare basin, the river Ancholme, and the rivers Taff and Lewes in East Sussex in the UK (Granger, 1959; Mantz and Wakeling, 1979; Thompson and Law, 1983; Samuels and Burt, 2002; and White, 2007, respectively). These studies have typically examined the dependence between two source variables only, such as storm surge (or storm tide) and river discharge, between storm surge and waves, or between storm surge and rainfall (as a proxy for run-off). Larger-scale assessments of compound flood events have been undertaken more recently for Australia (Zheng et al., 2013 and Wu et al., 2018), the USA (Wahl et al., 2015), the UK (Svensson and Jones, 2002, 2004), and Europe (Petroliagkis et al., 2016; Paprotny et al., 2018). Recently, Ward et al. (2018) assessed the dependence between coastal and river flooding on a quasi-global scale, using observational datasets, and Marcos et al. (2019) examined the dependence between extreme storm surges and wind waves along the global coasts using outputs from numerical models.
This paper focusses on the UK, where coastal flooding is ranked as the second-highest risk for causing civil emergency in the government's National Risk Register (Cabinet Office, 2015). A series of studies in the 1990s and early 2000s, commissioned and funded by the Department for Environment Food and Agricultural Affairs (DEFRA), examined the dependence between coastal and river flooding around the UK coast (e.g. Hawkes et al., 2002, 2005; Svensson and Jones, 2002, 2004; Hawkes and Svensson, 2003; Hawkes, 2005). These investigations found that large storm surges are more likely to coincide with high river discharge events at sites on the western coast than the eastern coast of the UK. Petroliagkis et al. (2016) analysed the dependence between storm surge, wave height, and river flow at selected sites around Europe, including a few sites in the UK. More recently, Paprotny et al. (2018) examined the dependency between storm surge, river discharge, and rainfall across Europe, including a greater number of sites in the UK than had previously been analysed. They both identified similar spatial patterns in the strength of dependency between storm surges and river discharge across the UK. In their global study, Ward et al. (2018) also identified a west–east difference in the strength of dependence between storm surge and river discharge for the UK. However, none of these studies identified the reason or reasons for this spatial variability.
The need to consider compound events in the design of flood protection schemes is strongly illustrated by the flood event on the 24–25 December 1999 in Lymington, on the southern coast of England. On the 16–17 December 1989 Lymington was flooded by high sea levels and waves, with considerable damage to 50 houses and the railway line (Ruocco et al., 2011; Haigh et al., 2015). This event was the driving force for a large upgrade of coastal flood defences for the town, including new sluice gates which allowed the Lymington River to drain at low tide but sealed it from tidal flooding during high sea levels. However, no allowance or consideration of compound flooding appears to have been made at the time. Ten years later, on 24 December 1999, a storm generated a storm surge which did not directly cause flooding itself because of the raised defences. However, the storm surge prevented the sluice gates from opening for prolonged periods, while large volumes of rainfall during the storm raised river flow. Combined with the lack of drainage, this caused flooding from the river on the upstream side of the sea defences (Ruocco et al., 2011). Subsequently the Lymington flood defences were upgraded again. This event strongly highlights the importance of considering compound flooding when assessing and designing flood management.
In this paper, we build on the studies mentioned earlier and assess the potential for compound flooding arising from the joint occurrence of high storm surge and high river discharge around the coast of UK. We have three specific objectives that seek to advance the earlier studies. The first objective is to map the spatial dependence between storm surges and high river discharge around the UK, comparing different methods for quantifying the dependence between these two variables. The research question is the following: where do compound flood events occur around the coast? Our hypothesis is that there will be spatial variation in compound flood frequency, with some coastal regions experiencing a greater dependency between the two flooding sources than others. A key concern in regard to compound flooding is timing of the two flood sources. For example, if a surge arrives after the extreme river flow, a compound flood event may be avoided; therefore we investigate the lag between the two flood sources.
Our second objective is to investigate the meteorological conditions that drive compound and non-compound events across the UK. Svensson and Jones (2002, 2004) briefly examined storm tracks associated with joint-occurrence events, but here we undertake a much more extensive meteorological analysis and use the results from this to explain, for the first time, why large storm surges and high river discharge are more likely to coincide on the western UK coasts compared to the eastern coast. The research question is the following: which weather types favour the occurrence of compound events? Our hypothesis is that certain types of weather conditions will favour the joint occurrence of storm surge and river discharge, while other weather patterns will not. This will be particularly useful for flood forecasting and will therefore be compared to Coastal Decider, a medium- to long-range operational forecasting tool developed by The UK Flood Forecasting Centre (a collaboration between the UK Environment Agency and Met Office).
Our third and final objective is to briefly examine how the strength and phase of dependence between storm surge and river discharge are influenced by the characteristics (i.e. flashiness, size, and elevation gradient) of the corresponding river catchments. We hypothesise that the lower the flashiness, the smaller the catchment area, and the greater the average elevation gradient, the more likely that storm surges will occur around the same time as high river discharge.
We used four main data types in this study, namely (1) sea-level time series, (2) river discharge records, (3) meteorological datasets, and (4) river catchment characteristics. Those are described in the following four sub-sections. In Sect. 2.5 we then describe how we select the tide gauge and river discharge sites for the subsequent analysis outlined in Sect. 3.
2.1 Sea-level data
Sea-level time series from the UK National Tide Gauge Network were obtained from the British Oceanographic Data Centre (BODC; https://www.bodc.ac.uk, last access: 24 April 2018). Data are available for 42 tide gauge sites around the UK coast, but we focus on 33 sites (see Sect. 2.5). Sea-level records are available as hourly measurements before 1993 and quarter hourly after 1993. The longest sea-level record (Newlyn [5]; square brackets refer to site numbers seen in Fig. 1a) starts in 1915, whilst the shortest (Portrush [20]) begins in 1995. We consider data up to the end of 2016. The data were previously quality controlled by the BODC, with questionable values flagged as being improbable, null, or interpolated. Any values that were flagged as improbable or null have been removed from the analysis.
2.2 River discharge data
River discharge data were obtained from the UK's National River Flow Archive (NRFA; https://nrfa.ceh.ac.uk/, last access: 25 June 2018). Data are available for more than 1500 river gauge sites, but we focus on 326 sites (see Sect. 2.5). The measurements are available as daily mean rates. The longest river discharge record (Kingston, on the Thames) starts in 1883, whilst the shortest (Deerhurst on the Severn) begins in 1995. Again, we consider data up to the end of 2016. The data were previously quality controlled by the Centre for Ecology & Hydrology (CEH), and we excluded data that were flagged as suspect.
2.3 Meteorological data
We use gridded mean sea-level pressure (SLP), near-surface U and V wind, and precipitable water content (PWC; entire atmosphere considered as a single layer) fields to investigate the meteorological conditions that drive compound and non-compound events. The first two variables are chosen because they are the primary variables leading to storm surges, whereas the latter is used as a proxy for rainfall. We use data from the 20th Century Reanalysis, Version 2c (Compo et al., 2011), obtained from the National Oceanic and Atmospheric Administration website (NOAA; https://www.esrl.noaa.gov/psd/data/20thC_Rean/, last access: 11 June 2018). The fields have a spatial and temporal resolution of 2∘ and 6 h, respectively, and are available from 1851. Whilst the spatial resolution is relatively coarse, the 20th Century Reanalysis was chosen to encompass the full time series of tide and river gauge data. Finer resolution reanalysis datasets (such as ERA-5) have shorter time series. We focus on the data within the area 34 N to 70∘ N and 60∘ W to 20∘ E, which encompasses the region where storms affecting the UK are generated and influence the region.
We also compare the results to Coastal Decider. This is based on probabilistic weather-pattern forecasts and helps in identifying periods with an increased likelihood of coastal flooding from high sea levels around the UK. Coastal Decider uses a set of 30 distinct weather patterns (referred to as the “Met Office weather patterns”) which were derived by Neal et al. (2016) using k-means clustering techniques. These weather patterns (shown in Supplement Fig. S32) represent the large-scale meteorological conditions experienced over the UK and surrounding European area. Neal et al. (2018) used a daily historical weather-pattern catalogue to show that particular weather patterns tend to relate to high-sea level events at different sites around the UK, with this analysis forming the basis for Coastal Decider. Other research which relates the Met Office weather patterns to meteorologically induced hazards includes that of Richardson et al. (2018), who related the weather patterns to precipitation observations for the application of drought forecasting.
2.4 Catchment characteristics
We obtained or calculated river catchment characteristics from information on the NRFA website for each of the river discharge sites we analysed. We consider three catchment characteristics as follows: (i) the base flow index (BFI), (ii) catchment area, (iii) and catchment elevation variation. The BFI is a measure of the proportion of the river run-off that derives from stored sources (Gustard et al., 1992) and gives an indication of the flashiness (how quickly a river responds to precipitation) of a catchment. The more permeable the rock and soils in a catchment, the higher the base flow. Rivers draining impervious clay catchments (with minimal lake or reservoir storage) typically have baseflow indices in the range 0.15 to 0.35, whilst chalk streams have a BFI greater than 0.9 as a consequence of the high groundwater component in the river flow. The catchment area is the size of the drainage basin of a particular river. Both the BFI and catchment area are provided directly on the NRFA website for each catchment (NRFA; https://nrfa.ceh.ac.uk/, last access: 25 June 2018). The catchment elevation variation is a measure of the steepness of a catchment. The NRFA provides statistics on the elevation of the minimum and maximum elevations in a catchment along with the elevations at the 10, 50, and 90 percentiles of the river catchment. We calculated an elevation variation index by taking the difference between the 90 and 10 elevation percentiles and normalising these about the mean of all sites; values close to 1 indicate a catchment with a steep elevation gradient, and values close to 0 indicate a catchment with a gentle gradient.
Figure 1(a) Location and overlapping data length (in years) of the 33 tide gauge sites (black dots) and 326 river discharge stations (triangles, circles, and squares show the river stations that discharge onto the western, eastern, and southern coasts, respectively), and (b) pairing of the tide gauge and river discharge stations.
2.5 Site selection
From the available datasets, described above in Sect. 2.1 and 2.2, we match combinations of tide gauge and river discharge sites that satisfied the following criteria: (1) there are at least 15 years of overlapping records and (2) daily mean river discharge is at least 5 m3 s−1 at the river site. Previous studies often matched river gauge sites to the nearest tide gauge sites (Paprotny et al., 2018) or every river gauge to every tide gauge site (Svensson and Jones, 2002, 2004). However, because of the complex topography of the coastline, this does not always associate a river gauge site to the hydrologically relevant tide gauge (and coast) for that river system. Therefore, we visually matched each river site to the tide gauge site nearest to the appropriate river mouth. Nine tide gauge sites – (1) Dover; (2) Newhaven; (3) Port Erin, Isle of Man; (4) St Helier, Jersey; (5) St Mary's, Isles of Scilly; (6) Stornoway, Isle of Lewis and Isle of Harris; (7) Lerwick, Shetland Islands; (8) Lowestoft; and (9) Harwich – were excluded from the analysis, as there were no appropriate nearby river systems with discharge measurements or the corresponding overlapping record length was less than 15 years for that specific combination of sites.
Following this selection, there are 326 combinations of discharge stations and tide gauges, the locations of which are shown in Fig. 1, linked to 33 tide gauge sites. In Fig. 1a, and subsequent figures of this nature hereafter, river sites discharging onto the western, eastern, and southern coasts of the UK are plotted as triangles, circles, and squares, respectively. There is good spatial coverage across most of the country, except in the south-east. The river sites discharging along the south-east tend to have discharges below 5 m3 s−1 or the overlapping data lengths are less than 15 years. Some tide gauge sites (e.g. Newlyn (5) and Wick [26]) are not in the near vicinity of where corresponding rivers drain into the sea. However, as storm surges have large spatial extents, they are close enough to be considered representative of the broader-scale storm surge characteristics in that area.
The number of years for which overlapping data are available for both sites is also shown in Fig. 1a. The tide gauge data were typically the shorter of the two sets. The mean overlapping length across all sites was 24 years, with a maximum of 50 years. Tide gauges had an average of 10 river gauges linked to them (Fig. 1b), with a minimum of 1 (Newlyn [5], Fishguard [12] and Holyhead [14]) and a maximum of 37 (Immingham [31]). At some tide gauge sites, multiple sub-catchments have been used, sometimes with multiple discharge stations on the same river. Details of the location of the combination of sites and their overlapping data lengths are given in Table 1.
The analysis was undertaken in three main stages, each addressing one of the three study objectives outlined above. These stages are described in turn in the sections below.
3.1 Joint occurrence and dependence
Our first objective is to map the dependence between storm surge and river discharge, comparing different methods for quantifying the dependence between these two variables. For sea level we considered two parameters: (1) total still sea-level and (2) storm surge (i.e. the meteorological component of sea level). To represent the latter, we used the skew surge parameter, which is the difference between the maximum observed high water and the maximum predicted (astronomical) high water, in each tidal cycle, regardless of its timing. To extract time series of skew surges from the sea-level records at each tide gauge site, we followed the approach of Haigh et al. (2016). To do this, we first undertook a harmonic analysis, for each calendar year, using the T-Tide harmonic analysis package (Pawlowicz et al., 2002) with the standard 67 tidal constituents. Each instance of observed and predicted high water was identified, and the difference between the two was computed to give time series of skew surges. Daily maxima of total still sea level and skew surge time series were then extracted at each tide gauge site. The exact time of the daily maxima was retained for the meteorological analyses, described later in Sect. 3.2. The river discharge records were obtained in the format of daily mean values, and so no pre-processing was necessary on these records.
Extreme levels were extracted for each of the three (i.e. total sea level, skew surge, and river discharge) daily time series, at each site, using a peaks-over-threshold (POT) approach. We used a declustering algorithm, with a storm length of 48 h (which is appropriate, as Haigh et al., 2016, found that storms in the UK typically affect sea level for 3.5 days) to guarantee independent events. We varied the threshold at each site to ensure that each of the three time series had on average 2.3 to 2.5 extreme levels per year. This threshold range ensured that (1) we had enough data points to estimate dependence between the variables reliably and (2) the threshold was high enough for the exceedances to be considered “extreme” (Svensson and Jones, 2005). The average thresholds across all sites were the 99, 99.1, and 99.2 percentiles for total sea level, skew surge and river discharge, respectively.
We then used two different approaches to assess the dependence between total sea level or skew surge and river discharge. The first approach we term hereafter the “dependence method”. Here, we measure dependence between the daily maximum total sea-level or skew surge and discharge time series using Kendall's rank correlation τ (Kendall, 1938), which, unlike Pearson's correlation coefficient, captures non-linear relationships. Significance was assessed at α=0.05 (i.e. 95 % confidence level), using corresponding p values estimated from exact permutation distributions. We also repeat the analysis using time lags from −5 to +5 days. For example, for daily maximum skew surge, we select corresponding daily maximum discharge values with time lags of −5, −4, −3, −2, −1, 0, +1, +2, +3, +4, and +5 days. This is to allow for that fact that when a storm approaches the coast, for example, it might first generate a high storm surge before travelling inland and generating high precipitation and therefore elevated river discharge sometime afterwards.
The second approach we term hereafter the “joint-occurrence method”. Here we simply count the number of times extreme total sea-levels events, or skew surges events, above the chosen threshold for that site, occurring on the same day as extreme river discharge. Each pair of sites has varying overlapping data lengths. Therefore, to standardise the results, the number of joint occurrences per decade were determined. Again, we repeat the analysis but lag the discharge using time lags of −5 to +5 days.
To illustrate the approaches, time series of daily maximum skew surges are plotted against records of daily maximum river discharge at the 0-day lag for Devonport (south-western coast) and Whitby (eastern coast) in Fig. 2a and b along with their respective percentile thresholds. At Devonport there are nine occasions (red dots in Fig. 2a) when extreme skew surges occur on the same date as extreme river discharges, whereas at Whitby (Fig. 2b) there are no coincident events.

Figure 2Daily maximum skew surge plotted against daily maximum river discharge for (a) Devonport and (b) Whitby. The dotted red lines indicate the high percentiles chosen in the analysis for the two variables at these sites. Red dots (plotted in Zone 2) show the events with potential for compound flooding (i.e. joint occurrence of high storm surge and large river discharge), whereas blue (Zone 1) and green (Zone 3) dots define the non-compound events (i.e. high storm surge or high river discharge only, respectively).
3.2 Meteorological analysis
Our second objective is to investigate the meteorological conditions that drive compound (i.e. joint occurrence of high skew surges and large river discharge) and non-compound (i.e. high skew surge or high river discharge only) events across the UK. For each site, we extract fields of SLP, wind speed, and PWC for the 6 h period closest to the peak of each (1) extreme total sea level or skew surge event (i.e. all the events in Zone 1 in Fig. 2), (2) each joint-occurrence event (i.e. all the events in Zone 2 in Fig. 2), and (3) each extreme river flow event (i.e. all the events in Zone 3 in Fig. 2). For each site, and each of these three types of events, we derive composite plots of SLP, wind speed, and PWC by taking an arithmetic mean and standard deviation of the data at each hindcast grid cell through the time of the corresponding events. The composite plots thus represent the mean (with variance around the mean) conditions of the storms that generate compound and non-compound events. We also digitised the tracks of all responsible storms for the three different event types, using the storm tracking algorithm developed by Haigh et al. (2016). This captures the location of the storm centre for each 6-hourly time step of the metrological reanalysis, from cyclogenesis to storm dissipation or when the storm leaves the area of interest (defined above). We calculate the mean storm track for each event type at each site. This allows us to compare and contrast the weather patterns related to the storms which caused the compound and non-compound events.
3.3 Catchment correlations
Our final objective is to briefly examine how the strength and phase of dependence between total sea level or skew surge and river discharge are influenced by the characteristics of the corresponding river catchments. To do this we calculate correlation coefficients between the strength of dependence (or number of joint occurrences per decade) and the maximum phase lag, with our three selected catchment variables (BFI, catchment area, and catchment elevation variation). Again, significance was assessed at α=0.05. We hypothesise that the lower the BFI, the smaller the catchment area, and the greater the average elevation gradient, the more likely that high total sea levels or skew surges will occur around the same time as high river discharge. The higher the BFI, the larger the catchment area, and the gentler the elevation gradient of the catchment, the more likely it is that high river discharge will occur several days after high total sea level or skew surge for the sites closest to the coast.
Figure 3(a) Kendall's rank correlation τ between daily maximum total sea level and daily maximum river discharge and (b) number of joint occurrences per decade between extreme total sea levels and river discharge at 0-day lag. Thick black lines in (a) represent the dependence being statistically significant (95 % confidence) at these sites. Note that the triangles, circles, and squares show the river stations that discharge onto the western, eastern, and southern coasts, respectively.
4.1 Dependence and joint occurrences
We used two methods to assess the dependence between high total sea level or high skew surge with high river discharge, across the 326 combinations of discharge stations and tide gauge sites. The results of the first method, the dependence method, are shown in Figs. 3a and 4a for daily maximum total sea level and daily maximum skew surge, respectively, with daily maximum river discharge for the 0-day lag. As expected, there is generally greater dependence between skew surges and river discharge (Fig. 4a) than between total sea level and river discharge (Fig. 3a). This is because total sea levels are strongly influenced by the deterministic tidal component around the majority of the coastline of the UK (Haigh et al., 2016). Interestingly, the dependence is stronger for total sea levels for sites linked to tide gauges in the northern Irish Sea (e.g. Portrush [20] and Bangor [19] in North Ireland and Portpatrick [21] and Millport [22] in Scotland), and this is most likely because tidal range is small here and not such a dominant factor on total sea levels compared to other sites. A clear spatial variation in the dependence between high sea levels or skew surges with high river discharge is evident in Figs. 3a and 4a. For many of the sites along the south-western and western coasts of the UK, τ typically ranges from 0.1 to 0.35, whilst along the eastern coast, this drops to 0.0 to 0.15. The greatest dependence is found at river gauges linked to the Millport [22] and Portpatrick [21] tide gauges in south-western Scotland. The lowest dependence is located at river gauges near Cromer [32] on the eastern coast. Two river sites linked to the Bangor [19] tide gauge in Northern Ireland show negative dependence.
Figure 4(a) Kendall's rank correlation τ between daily maximum skew surge and daily maximum river discharge and (b) number of joint occurrences per decade between extreme skew surge and extreme river discharge at 0-day lag. Sites with a cross through them in (a) represent the dependence is not being statistically significant (95 % confidence) at these sites. Note that the triangles, circles, and squares show the river stations that discharge onto the western, eastern, and southern coasts, respectively.
Table 2Day of maximum dependence between high skew surges and river discharge in number of sites and percentage of sites.
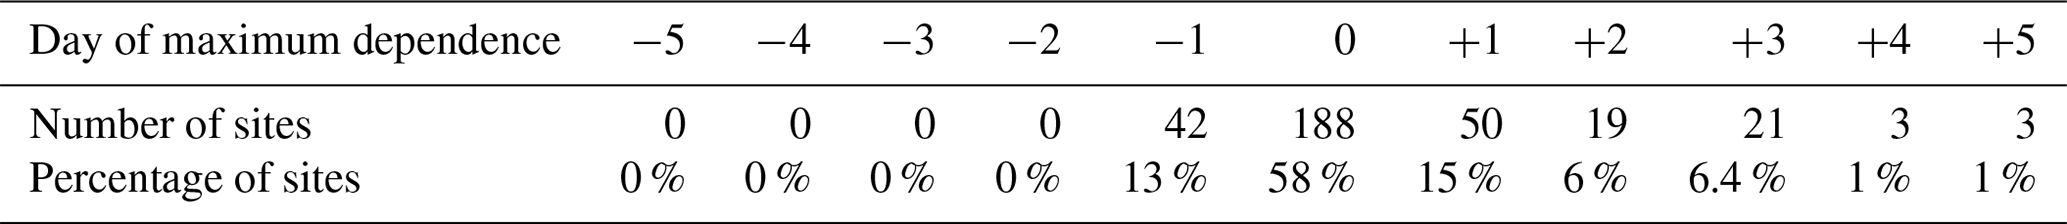
We also calculated the dependence between daily maximum total sea level or skew surge and daily maximum river discharge using time lags from −5 to +5 days. The results for high skew surge and high river discharge are shown in Figs. S1a to S11a for all sites. Dependence is typically weak until the −1-day lag. Interestingly the dependence is higher for +1-day to +5-day lags compared to −5-day to −1-day lags. This is illustrated in Fig. 5 for the six river sites closest to the tide gauges of Bournemouth [2], Devonport [4], Workington [18], Ullapool [24], Whitby [30], and Cromer [32]. The distributions are typically skewed to the right, and this is probably because river levels remain elevated for several days after a storm event. The lag day when there is the maximum dependence between daily maximum skew surge and daily maximum river discharge is shown in Fig. 6a for all sites. Interestingly, 42 inland sites (13 % of the 326 sites) on the eastern coast have a maximum correlation at the −1-day lag. The majority of the sites (188; 58 %) have maximum correlation at the 0-day lag. Sites on the south-western and western coast typically have maximum correlations between +1 and +5 days. The number of sites on each day of maximum dependence can be seen in Table 2. The sites with maximum correlations at the +4-day and +5-day lag are mostly situation in the Severn River, which has a large catchment area (see Sect. 4.3).
Table 3The number of sites with joint occurrences per decade between (i) total water level and river discharge and (ii) skew surge and river discharge.
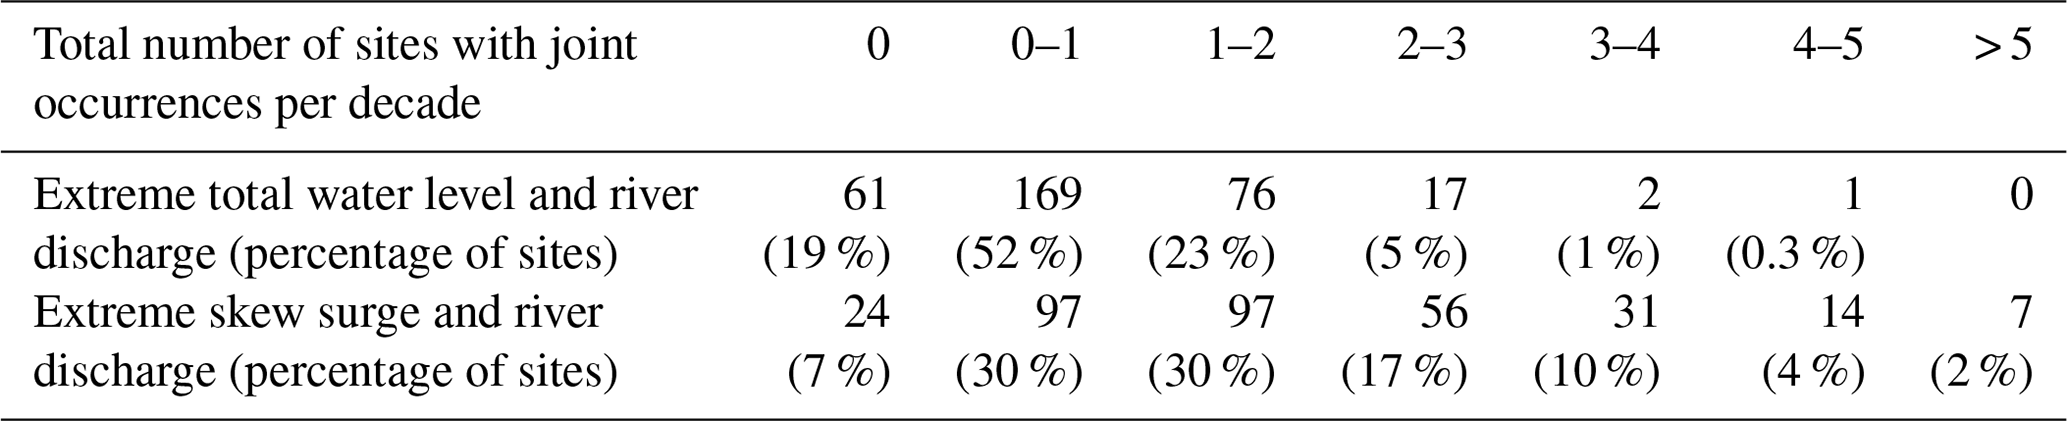

Figure 5Kendall's rank correlation τ plotted against day of lag at the follow sites: (a) Bournemouth [2], (b) Devonport [5], (c) Workington [18], (d) Ullapool [24], (e) Whitby [30], and (f) Cromer [32]. The red dot shows the day with maximum lag.
The results for the second method, the joint-occurrence method, are shown in Figs. 3b and 4b for high total sea levels and high river discharge and high skew surges and high river discharge, respectively, at the 0-day lag. The spatial patterns are very similar to those of the daily dependence results. For many of the sites along the south-western and western coasts of the UK, there are a higher number of joint occurrences between high skew surges and high river discharge (between three and six joint events per decade) than for sites along the eastern coast (between zero and one joint events per decade). Sites with the largest numbers of joint occurrences (five to six events per decade) include river discharge sites linked to Millport [22], Workington [18], Mumbles [10], Devonport [4], and Bournemouth [2] tide gauges. There are several sites along the south-western and western coasts which show low (< 1 event per decade) or zero joint occurrences at the 0-day lag. These include river discharge sites linked to tide gauges at Heysham [17] and Portsmouth [1] in England; Bangor [19] in Ireland; Barmouth [13] and Milford Haven [11] in Wales; and Portpatrick [21], Ullapool [24], and Kinlochbervie [25] in Scotland. Interestingly, there is large variation on a regional or local scale, particularly in areas which mostly have high numbers of joint occurrences. For example, at many sites around the Bristol Channel, the number of joint occurrences varies between one to four per decade at river discharge sites less than 80 km apart. The number of sites with joint occurrences per decade between (i) total water level and river discharge and (ii) skew surge and river discharge can be seen in Table 3.

Figure 6(a) The lag day when Kendall's rank correlation τ is maximum between daily maximum skew surge and daily maximum river discharge and (b) the lag day when the number of joint occurrences between high skew surge and high river discharge is maximum. Note that the triangles, circles, and squares show the river stations that discharge onto the western, eastern, and southern coasts, respectively.
The lag day when there are the maximum number of joint occurrences between high skew surge and high river discharge is shown in Fig. 6b for all study sites. The results are similar to those seen for the daily maximum dependence approach (Fig. 6a). Inland sites on the eastern coast typically have a maximum number of joint occurrences at the −1-day to −3-day lag, whereas several sites on the western coast have a maximum number of joint occurrences at the +1-day to +5-day lag.
4.2 Meteorological analysis
We now investigate the meteorological conditions that drive compound (i.e. joint occurrence of high skew surges and large river discharge) and non-compound events (i.e. high skew surge or high river discharge only) events across the UK. We focus here on skew surge rather than total sea level, as the dependence between skew surges and river discharge is stronger. At each of the 326 river discharge sites, we have derived composite plots of SLP, wind speed, and PWC through the time of the events that have led to (1) high skew surge events only, (2) joint-occurrence events, and (3) high river discharge events only. To illustrate the results of this component we focus on two contrasting sites: Devonport [4] on the UK south-western coast, where high storm surges and high river discharge have occurred at similar times in the past (Fig. 2a), and Whitby [30] on the UK eastern coast, where high storm surges have never occurred (during the period of record) at times of high river discharge (Fig. 2b). Examples of eight other sites are shown in Figs. S23 to S30.

Figure 7Meteorology conditions for Devonport [5]: (a, d, g) sea-level pressure (mbar), (b, e, h) wind speed (m s−1) and direction (grey arrows), and (c, f, i) precipitable water content (kg m−2) during (a, b, c) high skew surge events only, (d, e, f) both high skew surge and high river discharge events, and (g, h, i) extreme high river discharge events only. SD corresponds to the averaged standard deviation over the grid for each variable across the selected events.
Composite plots are shown in Figs. 7 and 8 for Devonport [4] and Whitby [30], respectively, for SLP (Fig. 7a, d, and g and Fig. 8a, d, and g), wind speed (Fig. 7b, e, and h and Fig. 8b, e, and h), and PWC (Fig. 7c, f, and i and Fig. 8c, f, and i) for the events that had (1) only high skew surge (Fig. 7a, b, and c and Fig. 8a, b, and c), (2) both high skew surge and high river discharge (Fig. 7d, e, and f and Fig. 8d, e, and f), and (3) only high river discharge (Fig. 7g, h, i and Fig. 8g, h, and i). The number of events recorded for each type is listed, and the average standard deviation (SD), across all grid cells, is also reported. The latter gives an indication of the spread of the spatial patterns across all the corresponding events (i.e. a low SD indicates that the storms across all events have very similar spatial patterns).
At Devonport (Fig. 7), the meteorological patterns in SLP are similar across the three event types. All three event types feature a low-pressure system to the north-west of Ireland (Fig 7a, d and g), with strong south-westerly winds affecting the south-western coast. As expected, the wind speed is more intense along the southern coast for the skew surge-only (Fig. 7b) and joint event types (Fig. 7e) compared to the events with river discharge only (Fig. 7g). The differences in PWC patterns are more pronounced. There is low PWC over the south-west for the surge only events (Fig. 7c) and higher PWC for the joint and river only event types (Fig. 7f and j). The composite plot of PWC is characterised by a higher SD for surge-only events (e.g. there is more spread across the range of events) in comparison to the event types that are joint and river only.
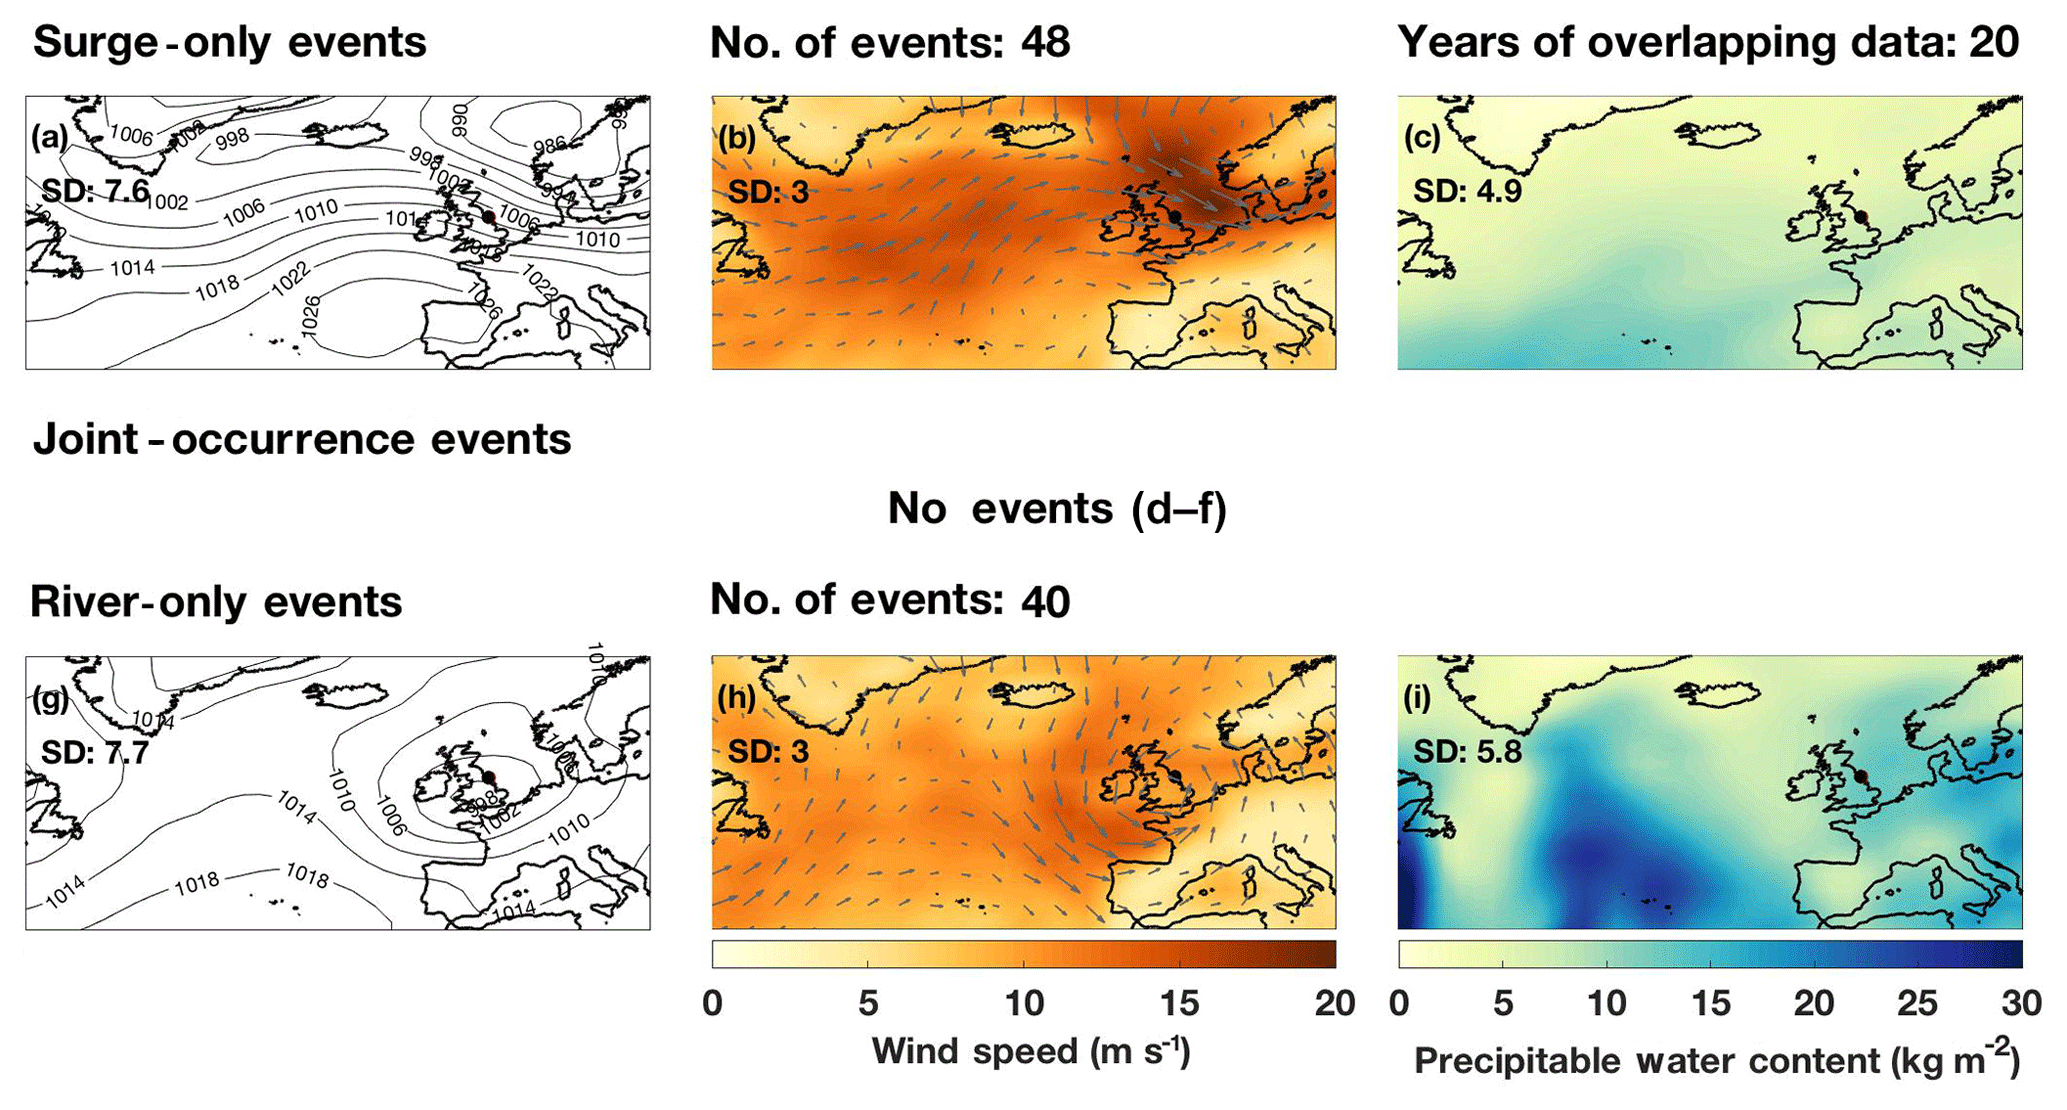
Figure 8Meteorology conditions for Whitby [30]: (a, d, g) sea-level pressure (mbar), (b, e, h) wind speed (m s−1) and direction (grey arrows), and (c, f, i) precipitable water content (kg m−2) during (a, b, c) events with high skew surge only, (d, e, f) both high skew surge and high river discharge events, and (g, h, i) events with extreme events with high river discharge only. SD corresponds to the averaged standard deviation over the grid for each variable across the selected events.
In contrast, at Whitby, the meteorological patterns in SLP are very different across the two event types (note that no joint high skew surge and high river discharge were observed here; Fig. 8), showing that the storms that lead to high skew surges are distinct from the storms that lead to high rainfall and therefore river discharge. For events with high skew surge only, the storm centre is situated over Scandinavia (Fig. 8a), producing strong north-westerly winds across the North Sea (Fig. 8b). PWC is low for the entire eastern coast (Fig. 8c). For events with high river only, a weaker low-pressure system is centred over central UK (Fig. 8g). The wind speeds are therefore low on the eastern coast (Fig. 8h). However, the PWC is high over much of the UK.
The results for other sites are similar (Figs. S23 to S30). For sites on the western coast of the UK, the storms typically have similar SLP characteristics between the three event types, whereas for sites on the eastern coast, the storms are more distinct.
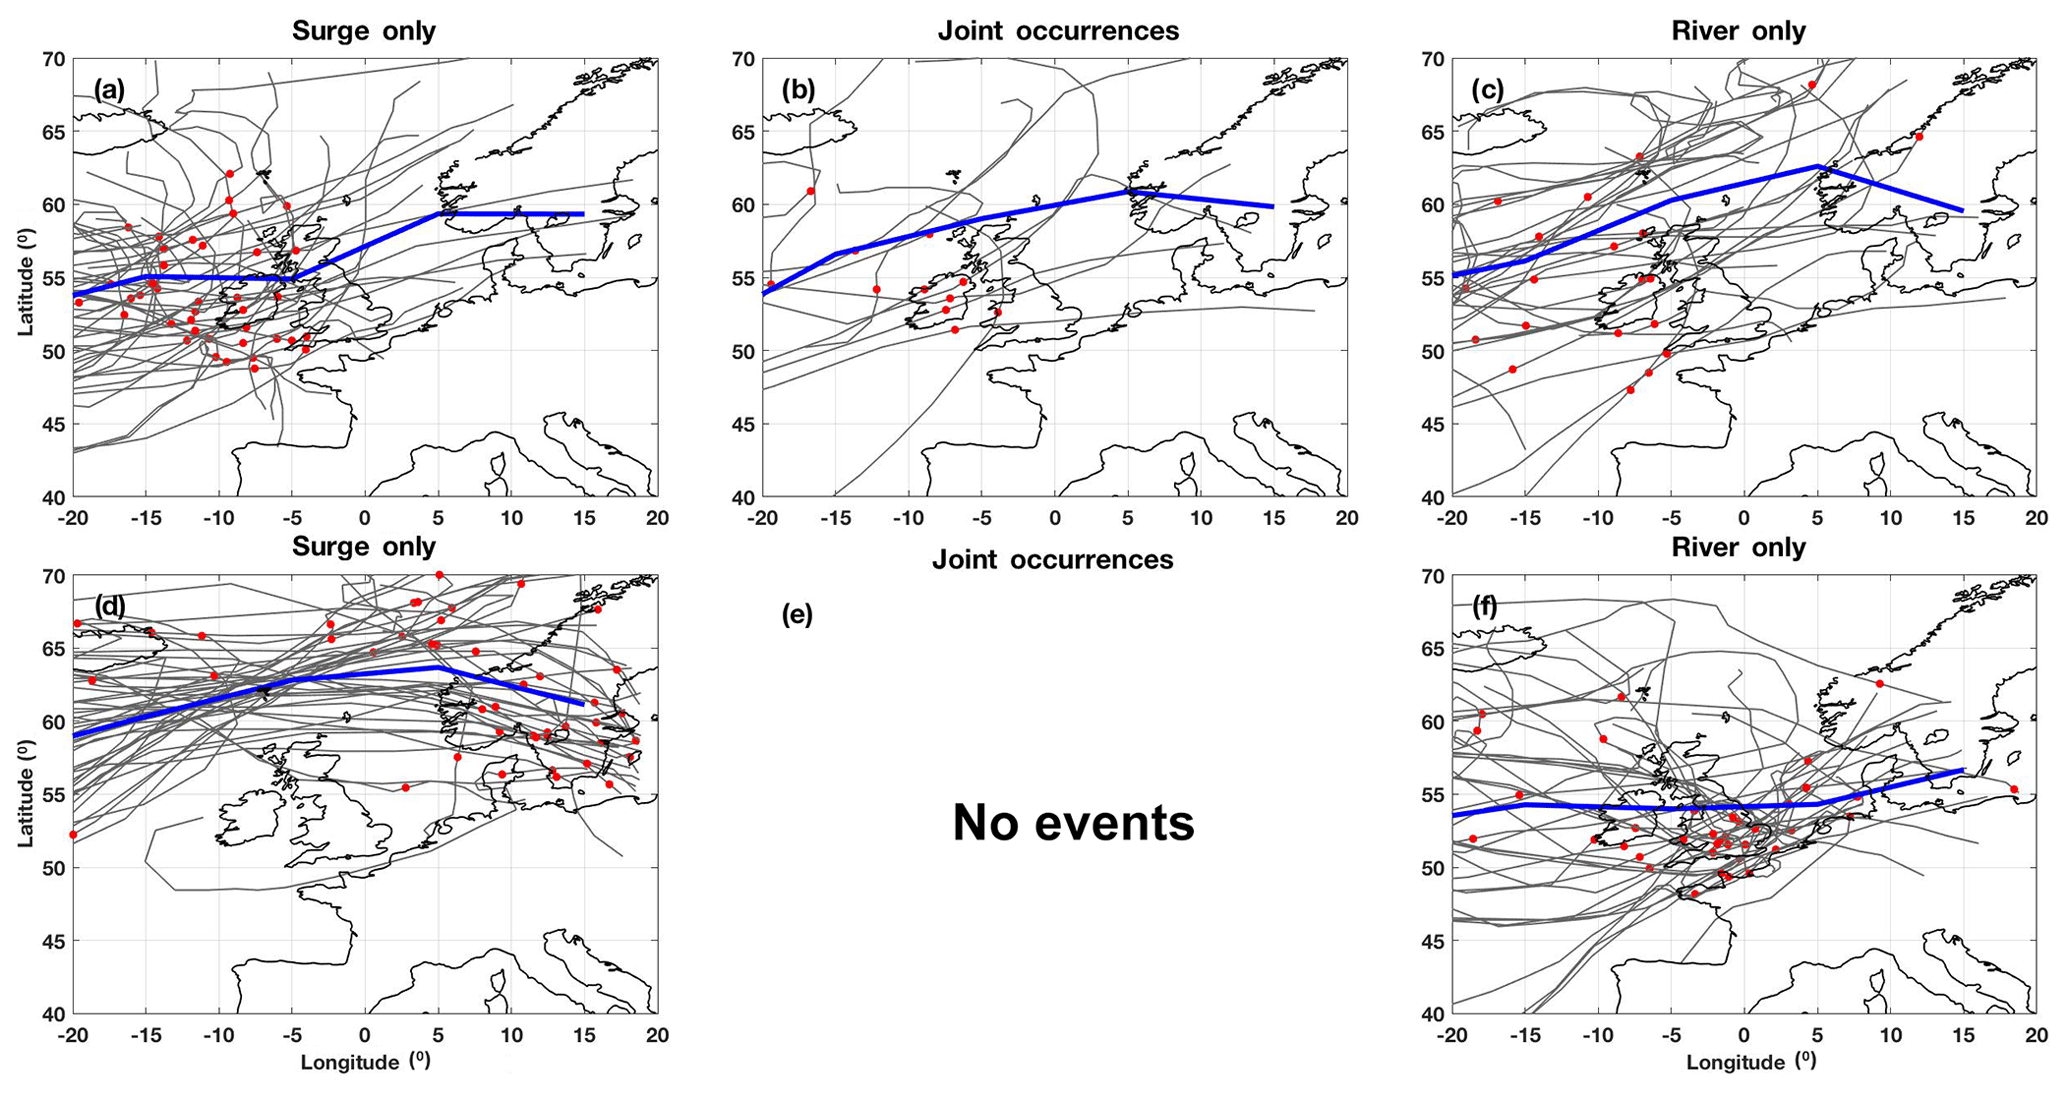
Figure 9Storm tracks for Devonport [5] (a, b, c) and Whitby [30] (d, e, f) over northern Europe. The first column (a, d) shows events with high skew surge only. The second column (b, e) both high skew surge and high river discharge events. The third column (c, f) shows events with high river discharge only. The blue line represents the mean storm track. Grey lines show individual storm tracks, with the location of the storm at peak skew surge and/or peak river discharge shown by the red dot.
We also digitised the tracks of the storms responsible for each of the three event types at these two selected sites. These storm tracks are shown in Fig. 9 for Devonport (Fig. 9a–c) and Whitby (Fig. 9d–f). The mean storm tracks are overlaid in each instance. At Devonport, the mean storm tracks are typically similar, moving in an easterly–north-easterly direction and cross over the north or just to the north of Scotland (Fig. 9a, b, and c). The slight variation is likely due to the resolution of the average track. In contrast, at Whitby, the mean storm tracks for the high skew surge events and high river discharge events are very different. The mean storm track for the high skew surge events passes to the north of Scotland (Fig. 9d), while the events with high river only cross central UK (Fig. 9f), all in a west–east direction.
4.3 Localised correlations
The analysis of weather types (described in Sect. 4.2) has helped to explain national-scale spatial variations in the occurrence of compound events (i.e. the west–east difference shown in Fig. 4), but to understand variations locally, we need to consider other variables. We therefore briefly assess here how the strength and phase of dependence between skew surge and river discharge is influenced by the characteristics of the corresponding river catchments.
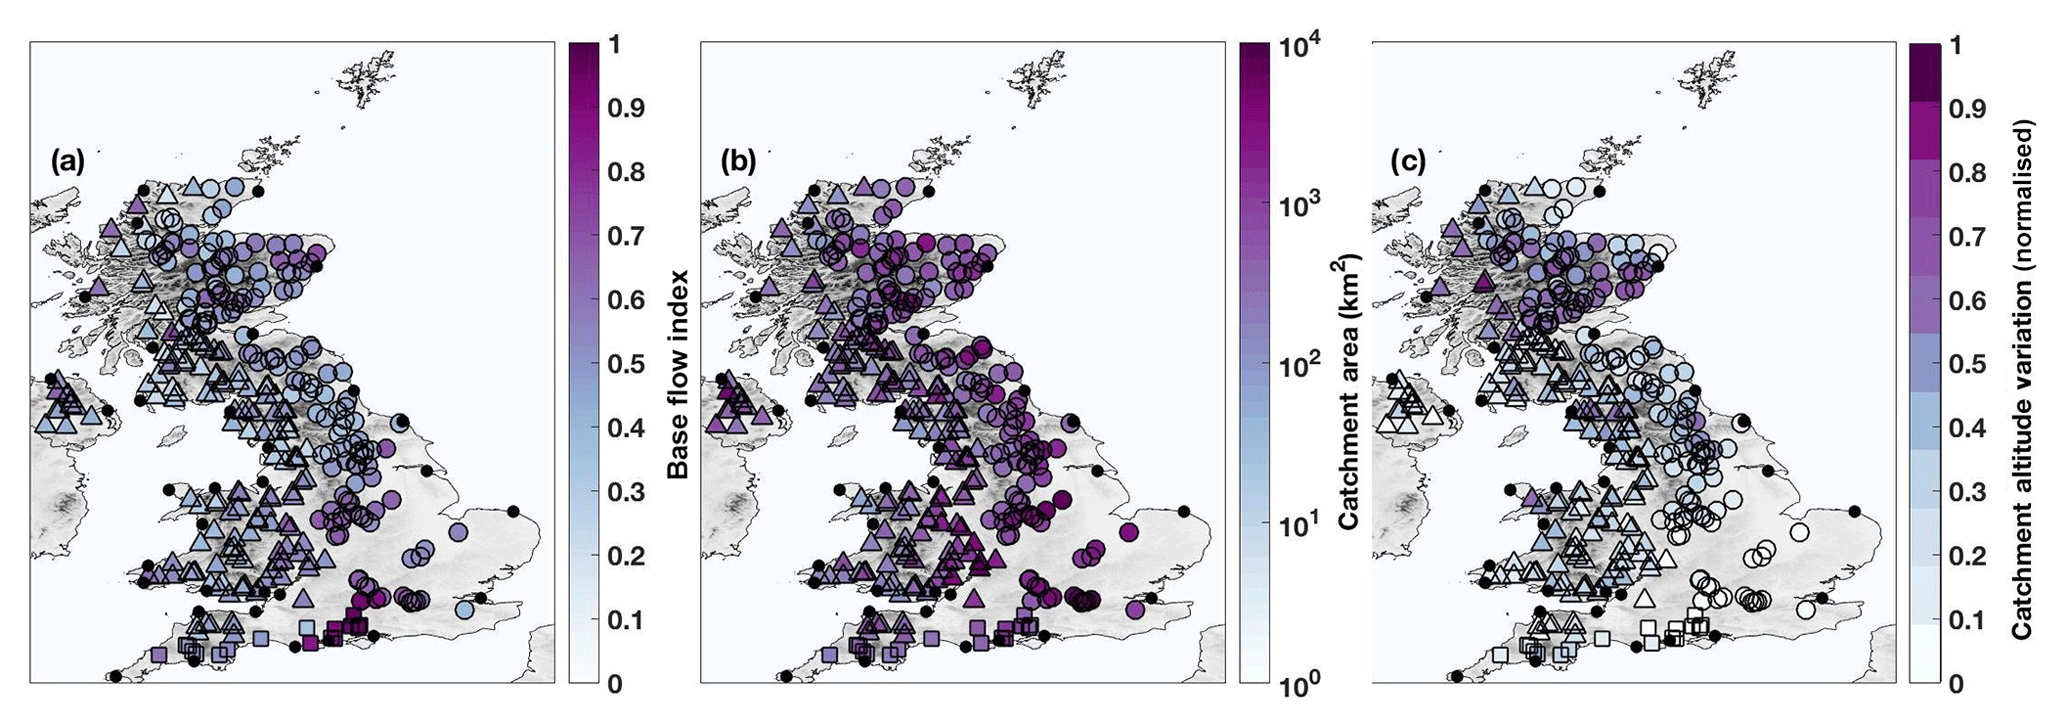
Figure 10(a) Base flow index, (b) catchment area size (logged km2), and (c) catchment altitude variation (normalised). Note that the triangles, circles, and squares show the river stations that discharge onto the western, eastern, and southern coasts, respectively.
The three selected catchment characteristics (BFI, catchment area, and catchment elevation variation) are plotted in Fig. 10a, b, and c, respectively. The river sites that drain onto the central southern coast typically have the greatest BFI (nearly 1, i.e. extremely porous chalk), whilst those on the north-western coast typically have the lowest (0–0.2, i.e. predominately clay soils; Fig. 10a). Catchments are largest on the Severn River, the river Bann in Northern Ireland, and the eastern coast of Scotland, whereas smaller catchments are found in Cornwall, western Scotland, and around Weymouth (Fig. 10b). The largest elevation variation is seen on the river Spey in Scotland, and altitude variation is low across the eastern coast of UK between Immingham and Dover (Fig. 10c). Visually, there is no obvious strong spatial correlation between any of the three catchment characteristics (Fig. 10) and either the rank correlation between daily maximum skew surge and daily maximum river discharge (Fig. 4a) or the number of joint occurrences per decade between extreme skew surge and extreme river discharge (Fig. 4b).
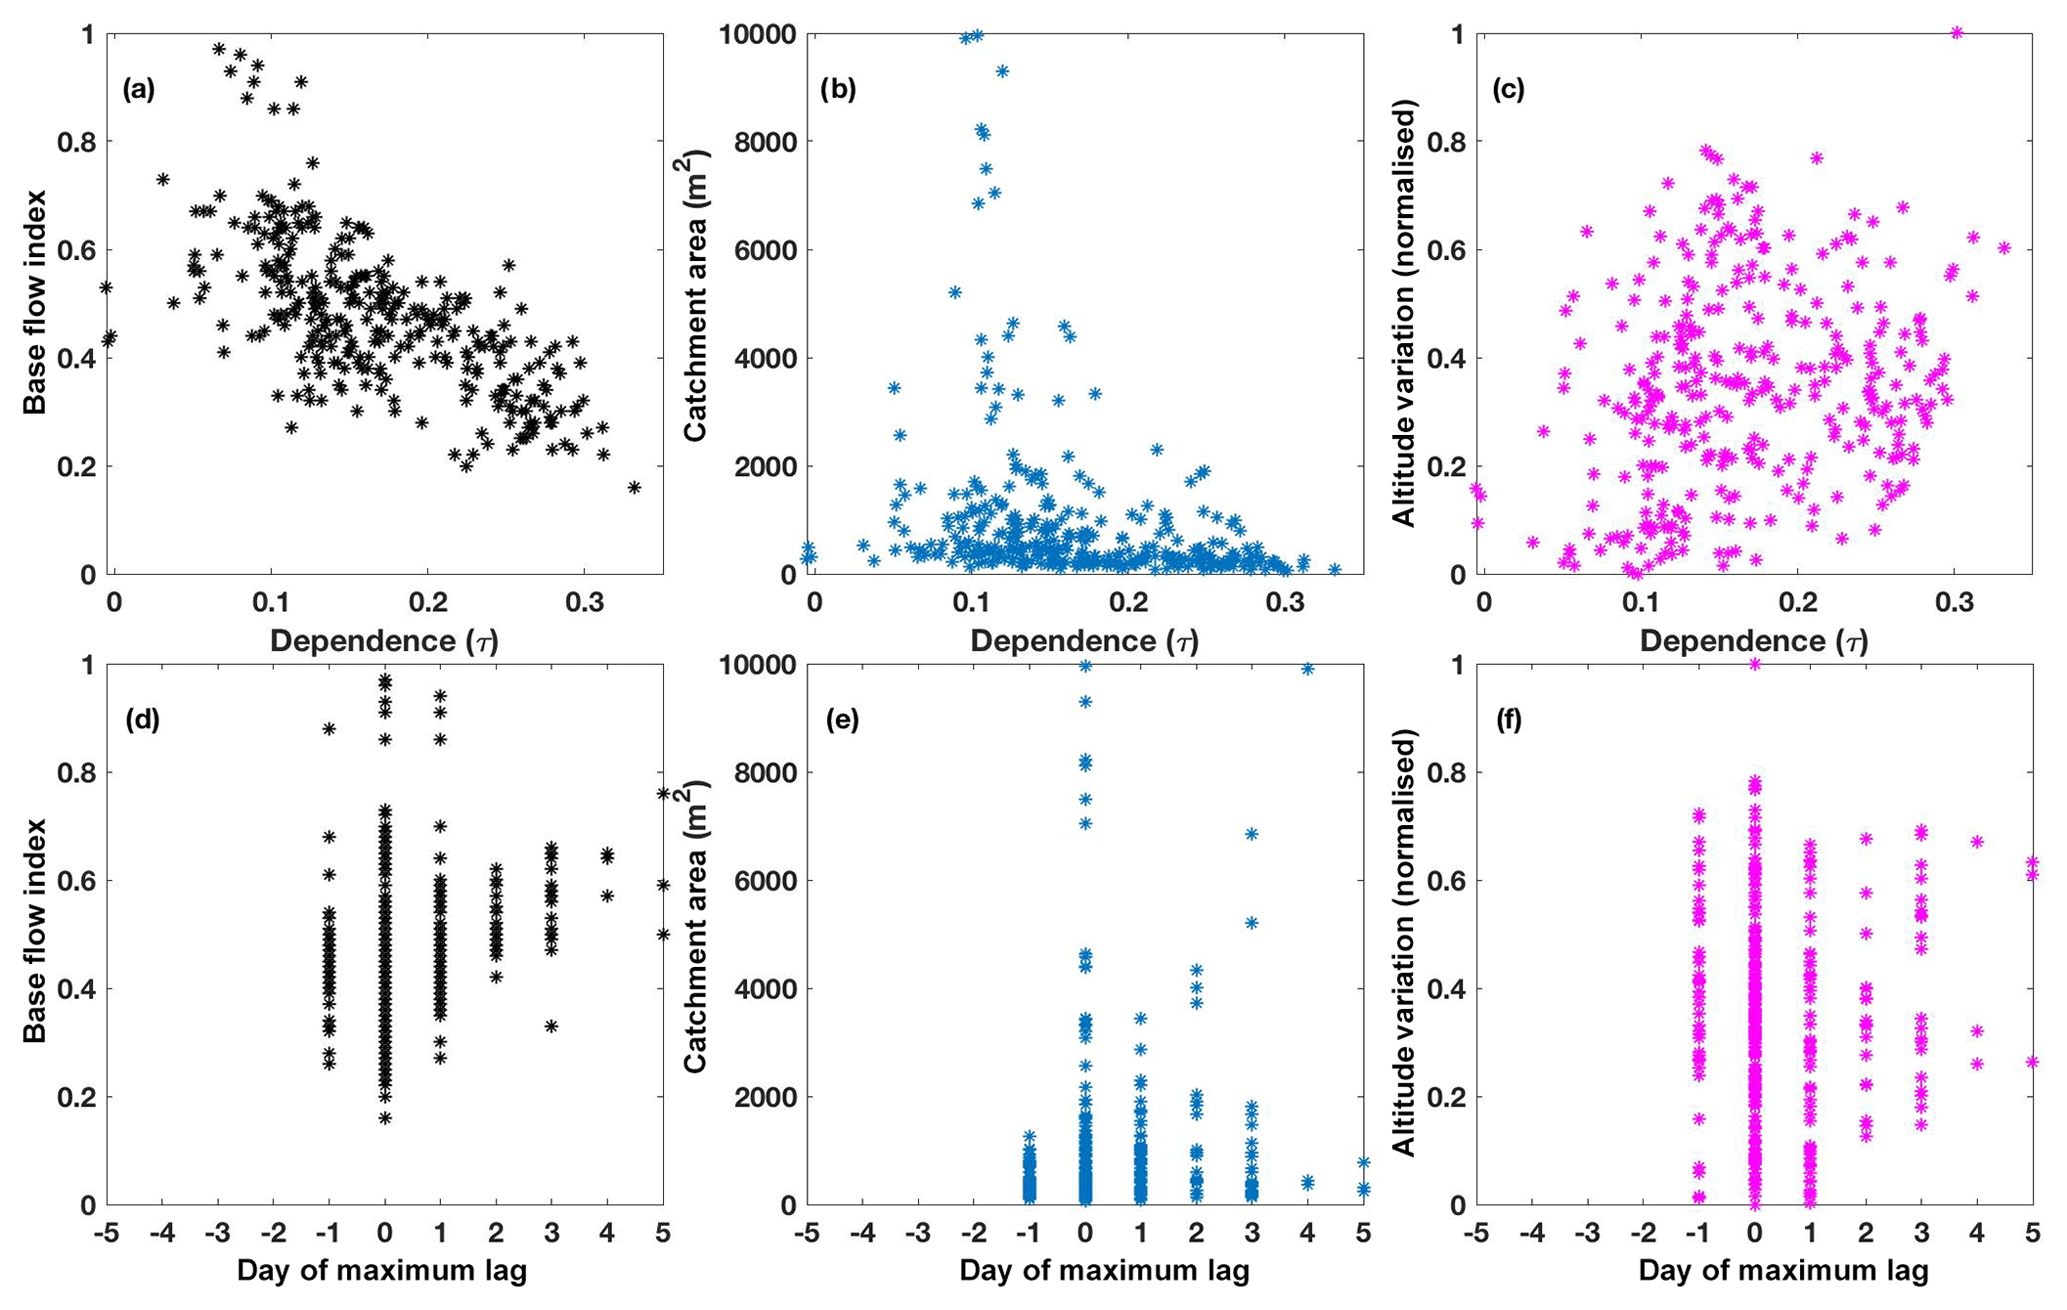
Figure 11Kendall's rank correlation τ between daily maximum skew surge and daily maximum river discharge with (a) base flow index, (b) catchment area size (logged km2), (c) catchment altitude variation (normalised), and correlation of the day of lag with the largest Kendall's rank correlation τ with (d) base flow index, (e) catchment area size (logged km2), and (f) catchment altitude variation (normalised) for all sites.
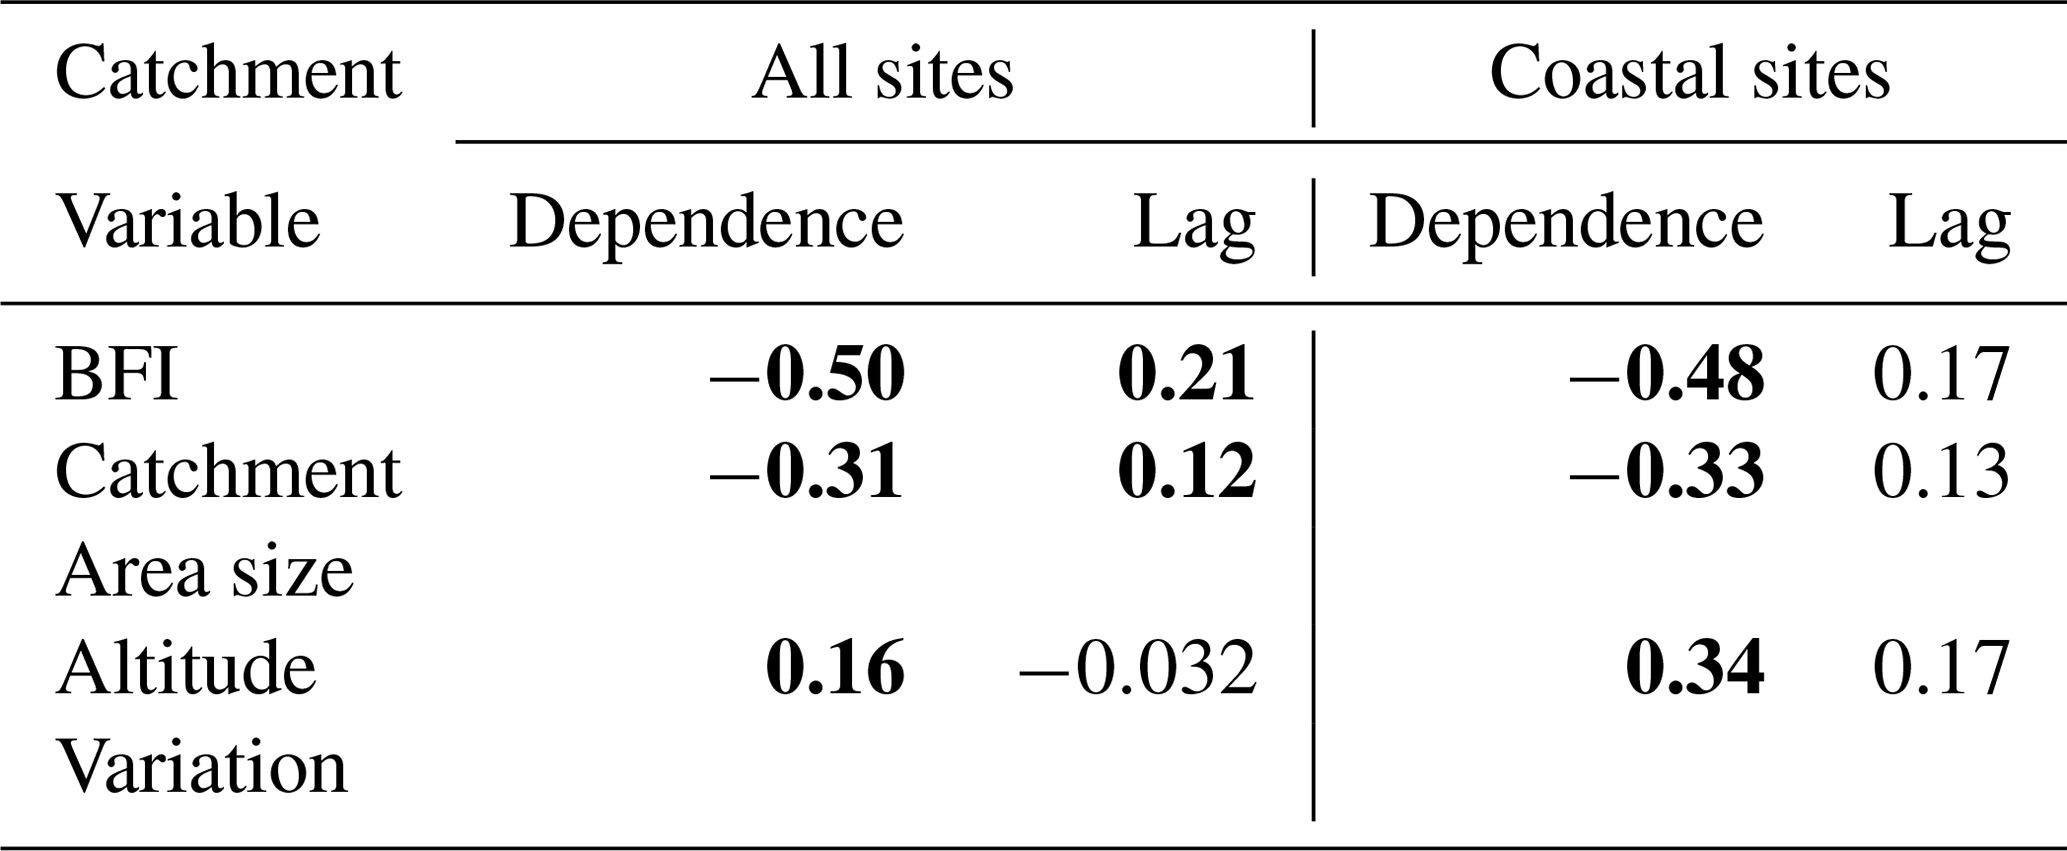
The rank correlation for daily maximum skew surge and daily maximum river discharge (at the 0-day lag) is plotted against the three catchment characteristics for each site in Fig. 11a, b, and c. The day of maximum lag for the rank correlation is plotted against the three catchment characteristics for each site in Fig. 11d, e, and f. Corresponding correlation coefficients (CCs) are listed in Table 4, first for all sites and then just the river sites closest to the 33 tide gauge sites. There is a negative correlation (CC , significant at 95 %) between dependence and BFI. This is in line with our hypothesis that the lower the BFI of the site (e.g. the flashier the catchment), the more likely that high skew surges will occur around the same time as high river discharge. There is a statistically significant negative correlation (CC ) between dependence and catchment area. Again, this is in line with our hypothesis that high skew surges are more likely to occur around the same time as high river discharge in small catchments. There is a weak but statistically significant positive correlation (CC =0.16) between dependence and catchment altitude variation. Again, this is in line with our hypothesis that the steeper the catchment, the more likely that high skew surges will occur around the same time as high river discharge. The correlation is higher (CC =0.34, significant at 95 %) for just the 33 river sites closest to each tide gauge site. The correlations between the three catchment characteristics and the day of maximum lag are not as strong (Table 2; Fig. 11d, e and f). There is a weak statistically significant correlation (CC =0.21, significant at 95 %) between the day of the maximum lag and BFI. Sites with larger BFI typically have larger positive lags. There is also a weak, statistically significant correlation (CC =0.11, significant at 95 %) between the day of the maximum lag and catchment area. Sites with large catchment area typically have larger positive lags.
Table 4Correlation between catchment variables and (i) the number of joint occurrences per decade between high skew surges and river discharge and (ii) the lag day when there is the maximum number of joint occurrences between high skew surge and high river discharge. Bold text indicates statistical significance at a 95 % confidence interval.
In this paper we have assessed the potential for compound flooding arising from the joint occurrence of extreme total water level or skew surge and river discharges around the coast of UK. Like earlier studies (i.e. Svensson and Jones, 2002, 2004; Petroliagkis et al., 2016; Paprotny et al., 2018), we have identified that the joint occurrence of high skew surges and high river discharge occurs more frequently on the south-western and western coasts of the UK compared to the eastern coast. However, here we have been able to show, for the first time, that this spatial variability is driven by meteorological differences in storm characteristics. On the western coast of the UK, the storms that generate high skew surges and high river discharge are typically similar in characteristics (i.e. there is a low-pressure system to the north-west of Ireland with strong south-westerly winds affecting the south-western coast) and track across the UK on comparable pathways. In contrast, on the eastern coast, the storms that typically generate high skew surges (i.e. when there is a low pressure over Scandinavia producing strong north-westerly winds across the North Sea) are distinct from the types of storms that tend to generate high river discharge in this area (i.e. when there is a weaker low-pressure system over central UK).
We also identified, for the first time, relationships across the UK between the strength and phase of the dependence between high skew surge and high river discharge and the characteristics of the corresponding river catchments. We find that high skew surges tend to occur more frequently with high discharge in catchments with a lower base flow index, smaller area, and steeper elevation gradient. In catchments with a high base flow index, large area, and shallow elevation gradient, the peak river flow tends to occur several days after high skew surge. We also found that for inland river discharge sites on the eastern coast, the maximum number of joint occurrences happens when river discharge occurs −1 days before peak skew surge. This is because the maximum storm surge in the North Sea occurs after the storm has crossed the North Sea into Scandinavia, whereas the high rainfall occurs a day earlier when the storm is centred over the UK.
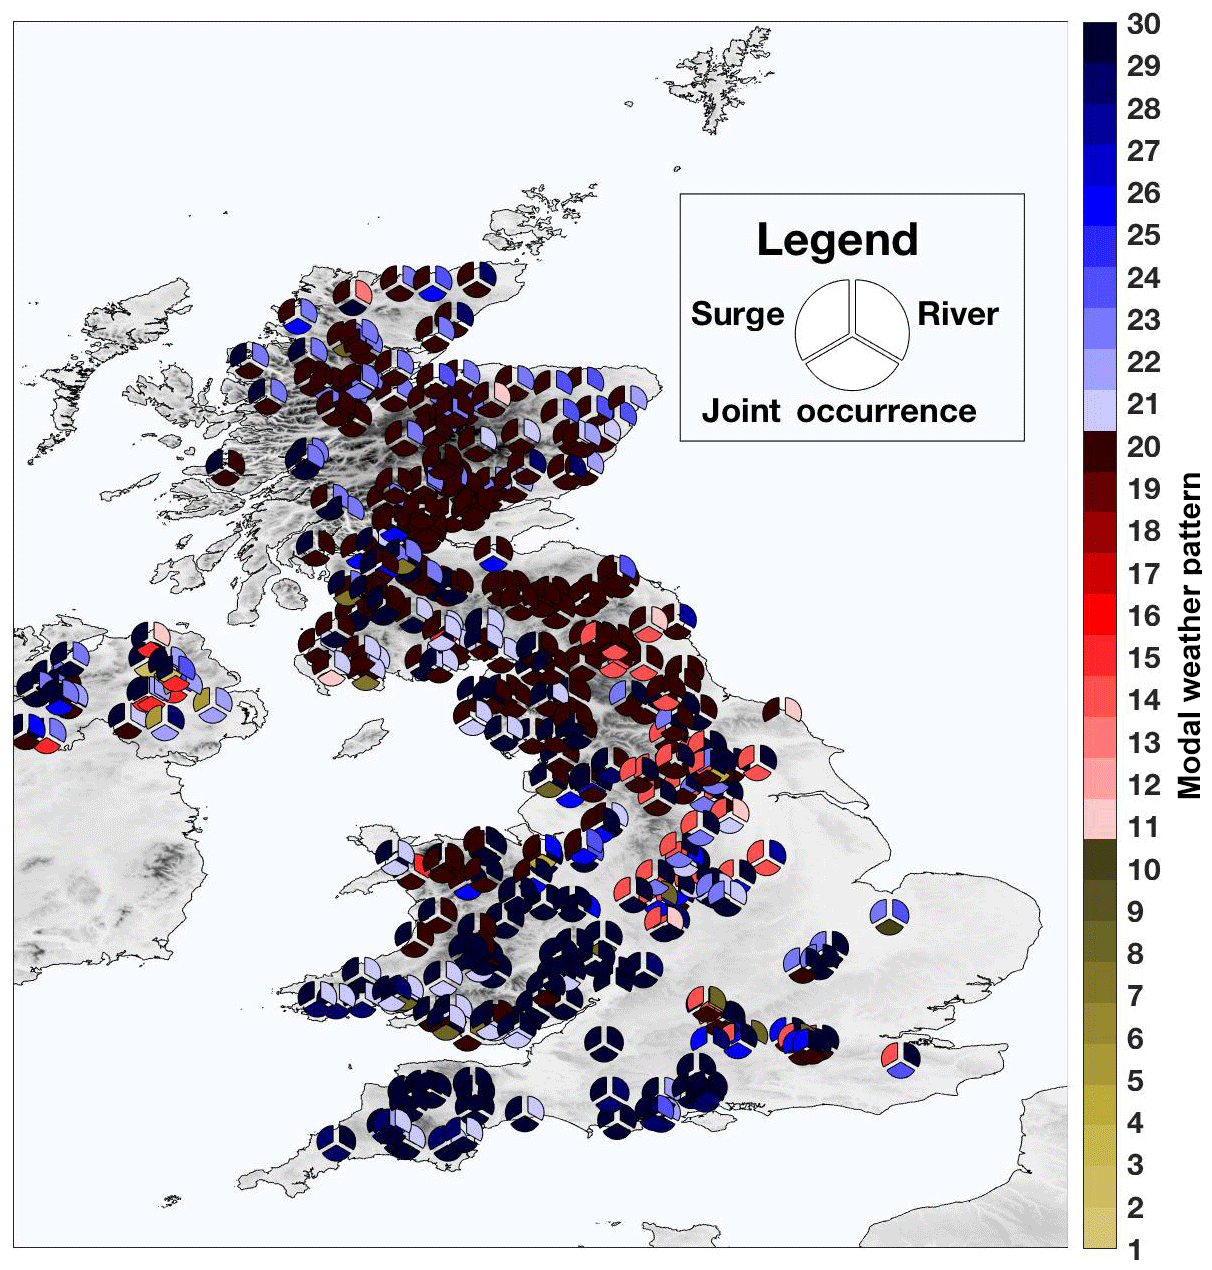
Figure 12The modal weather-pattern type (indicated by the colours in the legend) for extreme surge only events (top left segment), extreme river flow only events (top right segment), and extreme joint-occurrence events (bottom segment) observed at the study locations.
The key concern for compound flooding is when estuaries or coastal regions experience both high storm surge and high river discharge around the same time (i.e. the 0-day lag), which is likely to lead to disproportionately large adverse flood consequences. Of the 33 tide gauge sites considered, dependence between high skew surge and high river discharge is at its maximum at the 0-day lag at 19 sites (for the river discharge station closest to these sites; see Fig. S31). At most other sites, high river discharge occurs between +1 and +5 days after peak skew surge, and therefore compound flooding is not as much of a concern. However, there are still important implications for flood management and emergency response if a large fluvial flood occurs several days after a major coastal flood, as this is likely to stretch emergency services.
The meteorological analysis we have undertaken indicates subtle differences in the types of storms that tend to generate compound events compared to non-compound events, particularly for sites on the western coast of the UK (see Fig. 6). As compound events tend to exacerbate the adverse consequences of a flood, it is vital that they are forecasted accurately and that appropriate warning is provided. Furthermore, the best response to a compound event might differ from a non-compound event. Therefore, being able to accurately forecast that an event might be a compound event, as opposed to a non-compound event, is crucial. With these insights and improvement in forecast opportunities discussed below, these aspects of emergency response should be analysed in more detail.
Here, we use the same daily historical weather-pattern catalogue as Neal et al. (2018) and Richardson et al. (2018) to calculate the modal weather pattern at each site for (1) high skew surge events only, (2) joint-occurrence events, and (3) high river discharge events only. This is done in order to briefly assess whether Coastal Decider could be expanded to give early warnings of events with the potential to generate compound flooding from both high sea level and high river discharge. Results are shown in Fig. 12. Nearly all the events are dominated by the higher-numbered weather patterns, which tend to be the more stormy types and which are most likely to occur in the winter. Clear distinctions are found along coastal regions. Weather pattern 30 occurs for sites along the south-western and western UK coast for each of the three types of events. This is one of the stormiest weather patterns, with a large depression situated to the north of Scotland. This causes a strong westerly flow across the UK, with frontal rainfall being particularly heavy in western parts of the UK. Weather pattern 20 is dominant along the central western coast, particularly from the Bristol Channel northwards. This weather pattern is similar to weather pattern 30, but with the depression centre being further north, therefore shifting the wind and rain impacts further north. Sites in Scotland typically feature weather patterns 20 (cyclonic westerly) and 21 (cyclonic south-westerly). Along the eastern coast, high skew surge and river discharge events experience different weather patterns, with pattern 14 (cyclonic northerly) generally being seen during high skew surge events compared to patterns 11 (low pressure centred over the UK), 24 (southerly tracking cyclone centred over the North Sea), and 30 (very cyclonic westerly), which are generally related to high river events. These results indicate that it may be possible to extend the forecasting capability of Coastal Decider to also include indications for the likelihood of compound events. Small-scale weather features will need to be included in the mean composites for each weather pattern (e.g. weather pattern 30, which is a very stormy cyclonic south-westerly type, will have a mean composite that is formed from many subtle variations in the overall broad-scale stormy south-westerly flow; this means that the small-scale (and perhaps rarer) features will still be represented within a broader-scale weather pattern).
So far, we have just considered high water levels which produce the potential for flooding. In periods of high run-off in the UK, such as 1998, 2000, and 2007, floods happened repetitively near the tidal limit of rivers due to tidal locking at high tide, such as the floods in Lewes in 2000 (White, 2007). However, these may not be compound events as defined here. To briefly assess the extent of flooding during compound events, we compared the dates of joint occurrences at Devonport (which had a higher number of joint occurrences per decade) with reports of coastal flooding in the SurgeWatch database (Haigh et al., 2015, 2017). SurgeWatch records the social, economic, and environmental consequences of 330 coastal floods that have impacted the UK in the last 100 years. Of the nine joint-occurrence events when there was both high skew surge and high river discharge observed at Devonport, seven events had reports of coastal flooding. Events with significant flooding included the following: 24–25 December 1999, which caused extensive flooding in Lymington, Dorset, as discussed below, and the 14th February 2014 storm, which led to the destruction of the main railway line in Dawlish (Devon Maritime Forum, 2014; note that this event also had large waves). No flooding was reported for the Great Storm of 15–16 October 1987 (Burt and Mansfield, 1988). There was extensive wind damage to the UK during this event, but little coastal flooding because the event coincided with neap tides.
As stated earlier, compound flooding can occur not only during two (or more) extreme events but also when just one flood source is extreme (for example, extreme river discharge combines with a moderate storm surge) or when two moderate flooding sources combine to create a flood event. It should be noted that the latter two types of compound flooding involving moderate events were beyond the scope of this paper and so were not considered in our methods. These types of events are important, however, and need to be recognised in future studies into flood risk.
This paper has assessed the potential for compound flooding arising from the joint occurrence of extreme total water level or skew surge and river discharges around the coast of UK. We found that the joint occurrence of high skew surges and high river discharge occurs more frequently during the study period (15–50 years) at sites on the south-western and western coasts of the UK (between three and six joint events per decade), compared to sites along the eastern coast (between zero and one joint events per decade). We showed, for the first time, that the spatial variability in the dependence and number of joint occurrences of high skew surges and high river discharge is driven by meteorological differences in storm characteristics. On the western coast of the UK, the storms that generate high skew surges and high river discharge are typically similar in characteristics and track across the UK on comparable pathways. In contrast, on the eastern coast, the storms that typically generate high skew surges are mostly distinct from the types of storms that tend to generate high river discharge. We found that high skew surges tend to occur more frequently with high river discharge at catchments with a lower base flow index, smaller catchment area, and steeper elevation gradient. In catchments with a high base flow index, large catchment area, and shallow elevation gradient, the peak river flow tends to occur several days after the high skew surge. The previous lack of consideration of compound flooding means that flood risk has likely been underestimated around UK coasts, particularly along the south-western and western coasts. Furthermore, the additional damages caused due to compound events are unknown. It is therefore crucial that this be addressed in future assessments of flood risk and flood management approaches.
This study relies entirely on publicly available data from the following locations: sea level data from the BODC (https://www.bodc.ac.uk/data/online_delivery/ntslf/, British Oceanographic Data Centre, 2017), river discharge and catchment data from the NRFA (https://nrfa.ceh.ac.uk/, NERC CEH, 2018), and meteorological data from the 20th Century Reanalysis, Version 2c, and NOAA (http://www.esrl.noaa.gov/psd/data/gridded/data.20thC_ReanV2.html, NOAA/OAR/ESRL PSD, 2018). Dependence and joint-occurrence results from the study can be seen in Table S1 in the Supplement.
The supplement related to this article is available online at: https://doi.org/10.5194/hess-23-3117-2019-supplement.
AH and IDH conceived, planned, and carried out the analysis and interpretations. RJN aided as an expert in coastal flooding. HW provided guidance on extreme value statistics. RN and AJL provided the knowledge on the meteorological component. TW offered his expertise in compound flooding. SED added his knowledge of fluvial processes. The paper was prepared by AH and IDH, with contributions from all co-authors.
The authors declare that they have no conflict of interest.
We would also like to thank the following data providers: the British Oceanographic Data Centre and the National River Flow Archive for supplying the sea-level and river data, respectively. In addition, we would like to thank the Earth Systems Research Laboratory (ESRL, NOAA) for providing the 20th Century, Version 2c, meteorological reanalysis. We would like to thank EDF Energy R&D Centre UK and the Southampton Marine and Maritime Institute (SMMI) for partially funding this research. Ivan D. Haigh also acknowledges the NERC grant CHANCE (NE/S010262/1).
This research has been supported by the NERC grant CHANCE (grant no. NE/S010262/1).
This paper was edited by Albrecht Weerts and reviewed by Daniel Bachmann and Michalis Vousdoukas.
Bevacqua, E., Maraun, D., Hobæk Haff, I., Widmann, M., and Vrac, M.: Multivariate statistical modelling of compound events via pair-copula constructions: analysis of floods in Ravenna (Italy), Hydrol. Earth Syst. Sci., 21, 2701–2723, https://doi.org/10.5194/hess-21-2701-2017, 2017.
British Oceanographic Data Centre: UK Tide Gauge Network, available at: https://www.bodc.ac.uk/data/online_delivery/ntslf/, last access: 22 March 2017.
Brown, S. and Nicholls, R. J.: Subsidence and human influences in mega deltas: The case of the Ganges-Brahmaputra-Meghna, Sci. Total Environ., 527–528, 362–374, https://doi.org/10.1016/j.scitotenv.2015.04.124, 2015.
Brown, S., Nicholls, R. J., Goodwin, P., Haigh, I. D., Lincke, D., Vafeidis, A. T., and Hinkel, J.: Quantifying Land and People Exposed to Sea-Level Rise with No Mitigation and 1.5 ∘C and 2.0 ∘C Rise in Global Temperatures to Year 2300, Earths Futurure, 6, 583–600, https://doi.org/10.1002/2017EF000738, 2018.
Burt, S. D. and Mansfield, D.: The Great Storm of 15–16 October 1987, Weather, 43, 90–110, 1988.
Cabinet Office: National Risk Register of Civil Emergencies, available at: https://www.gov.uk/government/uploads/system/uploads/attachment_data/file/419549/20150331_2015-NRR-WA_Final.pdf (last access: 13 March 2017), 2015.
Cangialosi, J. P., Latto, A. S., and Berg, R.: National Hurrican Centrer Tropical Cyclone Report: Hurricane Irma (AL112017), available at: https://www.nhc.noaa.gov/data/tcr/AL112017_Irma.pdf (last access: 7 November 2018), 2017.
Chen, W. B. and Liu, W. C.: Modeling flood inundation induced by river flow and storm surges over a river basin, Water, 6, 3182–3199, https://doi.org/10.3390/w6103182, 2014.
Church, J. A., Clark, P. U., Cazenave, A., Gregory, J. M., Jevrejeva, S., Levermann, A., Merrifield, M. A., Milne, G. A., Nerem, R. S., Nunn, P. D., Payne, A. J., Pfeffer, W. T., Stammer, D., and Unnikrishnan, A. S.: Sea Level Change, in: Climate Change 2013: The Physical Science Basis, Contribution of Working Group I to the Fifth Assessment Report of the Intergovernmental, Panel on Climate Change edited by: Stocker, T. F., Qin, D., Plattner, G.-K., Tignor, M., Allen, S. K., Boschung, J., Nauels, A., Xia, Y., Bex, V., and Midgley, P. M., Cambridge University Press, Cambridge, United Kingdom and New York, NY, USA, 2013.
Compo, G. P., Whitaker, J. S., Sardeshmukh, P. D., Matsui, N., Allan, R. J., Yin, X., Gleason, B. E., Vose, R. S., Rutledge, G., Bessemoulin, P., BroNnimann, S., Brunet, M., Crouthamel, R. I., Grant, A. N., Groisman, P. Y., Jones, P. D., Kruk, M. C., Kruger, A. C., Marshall, G. J., Maugeri, M., Mok, H. Y., Nordli, O., Ross, T. F., Trigo, R. M., Wang, X. L., Woodruff, S. D., and Worley, S. J.: The Twentieth Century Reanalysis Project, Q. J. Roy. Meteor. Soc., 137, 1–28, https://doi.org/10.1002/qj.776, 2011.
Devon Maritime Forum: Reviewing the impacts, responses and resilience of people and places in Devon to the winter storms of 2013/2014, 2014.
Emanuel, K.: Assessing the present and future probability of Hurricane Harvey's rainfall, P. Natl. Acad. Sci. USA, 114, 12681–12684, https://doi.org/10.1073/pnas.1716222114, 2017.
Fritz, H. M., Blount, C. D., Thwin, S., Thu, M. K., and Chan, N.: Cyclone Nargis storm surge in Myanmar, Nat. Geosci., 2, 448–449, https://doi.org/10.1038/ngeo558, 2009.
Granger, C. W. J.: Estimating the probability of flooding on a tidal river, J. Inst. Water Eng., 13, 165–174, 1959.
Gustard, A., Bullock, A., and Dixon, J. M.: Low flow estimation in the United Kingdom, Inst. Hydrol. Wallingford, 108, 1–292, available at: http://nora.nerc.ac.uk/id/eprint/6050/1/IH_108.pdf (last access: 19 January 2018), 1992.
Haigh, I. D., Wadey, M. P., Gallop, S. L., Loehr, H., Nicholls, R. J., Horsburgh, K., Brown, J. M., and Bradshaw, E.: A user-friendly database of coastal flooding in the United Kingdom from 1915–2014, Sci. Data, 2, 1–13, https://doi.org/10.1038/sdata.2015.21, 2015.
Haigh, I. D., Wadey, M. P., Wahl, T., Ozsoy, O., Nicholls, R. J., Brown, J. M., Horsburgh, K., and Gouldby, B.: Analysis: Spatial and temporal analysis of extreme sea level and storm surge events around the coastline of the UK, 1–14, https://doi.org/10.1038/sdata.2016.107, 2016.
Haigh, I. D., Ozsoy, O., Wadey, M. P., Nicholls, R. J., Gallop, S. L., Wahl, T., and Brown, J. M.: An improved database of coastal flooding in the United Kingdom from 1915 to 2016, Sci. Data, 4, 170100, https://doi.org/10.1038/sdata.2017.100, 2017.
Hallegatte, S., Green, C., Nicholls, R. J., and Corfee-Morlot, J.: Future flood losses in major coastal cities, Nat. Clim. Chang., 3, 802–-806, https://doi.org/10.1038/nclimate1979, 2013.
Hawkes, P. and Svensson, C.: Defra / Environment Agency Flood and Coastal Defence R & D Programme Joint Probability: Dependence Mapping and Best Practice R&D Interim Technical Report, 2003.
Hawkes, P., Svensson, C., and Surendran, S.: The joint probability of pairs of variables relevant to flood risk: dependence mapping and best practice, Proc. 40th Defra Flood Coast. Manag. Conf., 2005.
Hawkes, P. J.: Use of Joint Probability Methods in Flood Management: A Guide to Best Practice, Flood and Coastal Defence R&D Programme, 2005.
Hawkes, P. J., Gouldby, B. P., Tawn, J. A., and Owen, M. W.: The joint probability of waves and water levels in coastal engineering design, J. Hydraul. Res., 40, 241–251, https://doi.org/10.1080/00221680209499940, 2002.
Jonkman, S. N., Maaskant, B., Boyd, E., and Levitan, M. L.: Loss of life caused by the flooding of New Orleans after hurricane Katrina: Analysis of the relationship between flood characteristics and mortality, Risk Anal., 29, 676–698, https://doi.org/10.1111/j.1539-6924.2008.01190.x, 2009.
Kendall, M. G.: A New Measure of Rank Correlation, Biometrika, 30, 81, https://doi.org/10.2307/2332226, 1938.
Kew, S. F., Selten, F. M., Lenderink, G., and Hazeleger, W.: The simultaneous occurrence of surge and discharge extremes for the Rhine delta, Nat. Hazards Earth Syst. Sci., 13, 2017–2029, https://doi.org/10.5194/nhess-13-2017-2013, 2013.
Khanal, S., Ridder, N., de Vries, H., Terink, W., and van den Hurk, B.: Storm surge and extreme river discharge: a compound event analysis using ensemble impact modelling, Hydrol. Earth Syst. Sci. Discuss., https://doi.org/10.5194/hess-2018-103, 2018.
Kumbier, K., Carvalho, R. C., Vafeidis, A. T., and Woodroffe, C. D.: Investigating compound flooding in an estuary using hydrodynamic modelling: a case study from the Shoalhaven River, Australia, Nat. Hazards Earth Syst. Sci., 18, 463–477, https://doi.org/10.5194/nhess-18-463-2018, 2018.
Lian, J. J., Xu, K., and Ma, C.: Joint impact of rainfall and tidal level on flood risk in a coastal city with a complex river network: a case study of Fuzhou City, China, Hydrol. Earth Syst. Sci., 17, 679–689, https://doi.org/10.5194/hess-17-679-2013, 2013.
Mantz, P. and Wakeling, H.: Forecasting flood levels for joint events of rainfall and tidal surge flooding using extreme value statistic, Proc. Inst. Civ. Eng., 67, 31–50, https://doi.org/10.1680/iicep.1979.2315, 1979.
Marcos, M., Rohmer, J., Vousdoukas, M., Mentaschi, L., Le Cozannet, G., and Amores, A.: Increased extreme coastal water levels due to the combined action of storm surges and wind-waves, Geophys. Res. Lett., 1, 2019GL082599, https://doi.org/10.1029/2019GL082599, 2019.
Mazas, F. and Hamm, L.: An event-based approach for extreme joint probabilities of waves and sea levels, Coast. Eng., 122, 44–59, https://doi.org/10.1016/j.coastaleng.2017.02.003, 2017.
McGranahan, G., Balk, D., and Anderson, B.: The rising tide: assessing the risks of climate change and human settlements in low elevation coastal zones, Environ. Urban., 19, 17–37, https://doi.org/10.1177/0956247807076960, 2007.
Munich Re: NatCatSERVICE, available at: https://www.munichre.com/natcatservice, last access: 13 March 2017.
Neal, R., Fereday, D., Crocker, R., and Comer, R. E.: A flexible approach to defining weather patterns and their application in weather forecasting over Europe, Meteorol. Appl., 23, 389–400, https://doi.org/10.1002/met.1563, 2016.
Neal, R., Dankers, R., Saulter, A., Lane, A., Millard, J., Robbins, G., and Price, D.: Use of probabilistic medium- to long-range weather-pattern forecasts for identifying periods with an increased likelihood of coastal flooding around the UK, Meteorol. Appl., 25, 534–547, https://doi.org/10.1002/met.1719, 2018.
NERC CEH: National River Flow Archive, Wallingford, available at: https://nrfa.ceh.ac.uk, last access: 25 June 2018.
Nerem, R. S., Beckley, B. D., Fasullo, J. T., Hamlington, B. D., Masters, D., and Mitchum, G. T.: Climate-change-driven accelerated sea-level rise detected in the altimeter era, P. Natl. Acad. Sci. USA, 115, 2022–2025, https://doi.org/10.1073/pnas.1717312115, 2018.
NOAA: Costliest U.S. tropical cyclones tables updated, https://doi.org/10.1080/00049187308702635, 2018.
NOAA/OAR/ESRL PSD: The 20th Century Reanalysis (V2), Boulder, Colorado, USA, available at: http://www.esrl.noaa.gov/psd/data/gridded/data.20thC_ReanV2.html, last access: 26 July 2018.
Orton, P., Conticello, F., Cioffi, F., Hall, T., Georgas, N., Lall, U., and Blumberg, A.: Hazard Assessment from Storm Tides and Rainfall on a Tidal River Estuary, 36th IAHR World Congr., 2015.
Pall, P., Aina, T., Stone, D. A., Stott, P. A., Nozawa, T., Hilberts, A. G. J., Lohmann, D., and Allen, M. R.: Anthropogenic greenhouse gas contribution to flood risk in England and Wales in autumn 2000, Nature, 470, 382–385, https://doi.org/10.1038/nature09762, 2011.
Paprotny, D., Vousdoukas, M. I., Morales-Nápoles, O., Jonkman, S. N., and Feyen, L.: Compound flood potential in Europe, Hydrol. Earth Syst. Sci. Discuss., https://doi.org/10.5194/hess-2018-132, 2018.
Pawlowicz, R., Beardsley, B. and Lentz, S.: Classical tidal harmonic analysis including werror estimates in MATLAB using T_TIDE, Comput. Geosci., 28, 929–937, https://doi.org/10.1016/S0098-3004(02)00013-4, 2002.
Petroliagkis, T. I., Voukouvalas, E., Disperati, J., and Bidlot, J.: Joint Probabilities of Storm Surge, Significant Wave Height and River Discharge Components of Coastal Flooding Events, EUR 27824 EN, 2016.
Richardson, D., Fowler, H. J., Kilsby, C. G., and Neal, R.: A new precipitation and drought climatology based on weather patterns, Int. J. Climatol., 38, 630–648, https://doi.org/10.1002/joc.5199, 2018.
Rueda, A., Camus, P., Tomás, A., Vitousek, S. ,and Méndez, F. J.: A multivariate extreme wave and storm surge climate emulator based on weather patterns, Ocean Model., 104, 242–251, https://doi.org/10.1016/j.ocemod.2016.06.008, 2016.
Ruocco, A. C., Nicholls, R. J., Haigh, I. D., and Wadey, M. P.: Reconstructing coastal flood occurrence combining sea level and media sources: a case study of the Solent, UK since 1935, Nat. Hazards, 59, 1773–1796, https://doi.org/10.1007/s11069-011-9868-7, 2011.
Samuels, P. G. and Burt, N.: A new joint probability appraisal of flood risk, Proc. Inst. Civ. Eng. Water Marit. Eng., 154, 109–115, https://doi.org/10.1680/maen.154.2.109.38642, 2002.
Seneviratne, S., Nicholls, N., Easterling, D., Goodess, C., Kanae, S., Kossin, J., Luo, Y., Marengo, J., McInnes, K., Rahimi, M., Reichstein, M., Sorteberg, A., Vera, C., and Zhang, X.: Changes in climate extremes and their impacts on the natural physical environment, Manag. Risk Extrem. Events Disasters to Adv. Clim. Chang. Adapt., 109–230, available at: https://www.ipcc.ch/pdf/special-reports/srex/SREX-Chap3_FINAL.pdf (last access: 21 September 2017), 2012.
Svensson, C. and Jones, D. A.: Dependence between extreme sea surge, river flow and precipitation in eastern Britain, Int. J. Climatol., 22, 1149–1168, https://doi.org/10.1002/joc.794, 2002.
Svensson, C. and Jones, D. A.: Dependence between sea surge, river flow and precipitation in south and west Britain, Hydrol. Earth Syst. Sci., 8, 973–992, https://doi.org/10.5194/hess-8-973-2004, 2004.
Svensson, C. and Jones, D. A.: Joint Probability: Dependence between extreme sea surge , river flow and precipitation:, R&D Tech. Rep. FD2308/TR3 to DEFRA, CEH Wallingford, Wallingford, UK, 2005.
Thompson, G. and Law, F.: An assessment of the fluvial tidal flooding problem of the River Ancholme, UK, in: Proceedings from the IUGG Interdisciplinary Symposium on Assessment of Natural Hazards, Hamburg, 1983.
Wahl, T., Jain, S., Bender, J., Meyers, S. D., and Luther, M. E.: Increasing risk of compound flooding from storm surge and rainfall for major US cities, Nat. Clim. Change, 5, 1093–1097, https://doi.org/10.1038/nclimate2736, 2015.
Ward, P. J., Couasnon, A., Eilander, D., Haigh, I. D., Hendry, A., Muis, S., Veldkamp, T. I. E., Winsemius, H. C., and Wahl, T.: Dependence between high sea-level and high river discharge increases flood hazard in global deltas and estuaries, Environ. Res. Lett., 13, 084012, https://doi.org/10.1088/1748-9326/aad400, 2018.
White, C. J.: The Use of Joint Probability Analysis to Predict Flood Frequency in Estuaries and Tidal Rivers, University of Southanpton, oonline available at: https://eprints.soton.ac.uk (last access: 22 March 2017), 2007.
Wu, W., McInnes, K., O'Grady, J., Hoeke, R., Leonard, M., and Westra, S.: Mapping Dependence Between Extreme Rainfall and Storm Surge, J. Geophys. Res.-Ocean., 123, 2461–2474, https://doi.org/10.1002/2017JC013472, 2018.
Zheng, F., Westra, S., and Sisson, S. A.: Quantifying the dependence between extreme rainfall and storm surge in the coastal zone, J. Hydrol., 505, 172–187, https://doi.org/10.1016/j.jhydrol.2013.09.054, 2013.
Zscheischler, J., Westra, S., van den Hurk, B. J. J. M., Seneviratne, S. I., Ward, P. J., Pitman, A., AghaKouchak, A., Bresch, D. N., Leonard, M., Wahl, T., and Zhang, X.: Future climate risk from compound events, Nat. Clim. Change, 8, 469-–477, https://doi.org/10.1038/s41558-018-0156-3, 2018.