the Creative Commons Attribution 4.0 License.
the Creative Commons Attribution 4.0 License.
A unique vadose zone model for shallow aquifers: the Hetao irrigation district, China
Zhongyi Liu
Xingwang Wang
Zailin Huo
Rapid population growth is increasing pressure on the world water resources. Agriculture will require crops to be grown with less water. This is especially the case for the closed Yellow River basin, necessitating a better understanding of the fate of irrigation water in the soil. In this paper, we report on a field experiment and develop a physically based model for the shallow groundwater in the Hetao irrigation district in Inner Mongolia, in the arid middle reaches of the Yellow River. Unlike other approaches, this model recognizes that field capacity is reached when the matric potential is equal to the height above the groundwater table and not by a limiting soil conductivity. The field experiment was carried out in 2016 and 2017. Daily moisture contents at five depths in the top 90 cm and groundwater table depths were measured in two fields with a corn crop. The data collected were used for model calibration and validation. The calibration and validation results show that the model-simulated soil moisture and groundwater depth fitted well. The model can be used in areas with shallow groundwater to optimize irrigation water use and minimize tailwater losses.
- Article
(2446 KB) - Full-text XML
- BibTeX
- EndNote
With global climate change and increasing human population, much of the world is facing substantial water shortage (Alcamo et al., 2007). The water crisis has caused widespread concern among public governmental officials and scientists (Guo and Shen, 2016; Oki and Kanae, 2006). Years of rapid population growth have squeezed the world water resources. The available fresh water per capita decreased from 13 400 m3 in 1962 to 5900 m3 in 2014 (World Bank Group, 2019).
Water supply in China is especially stressed. When averaged over the whole country, available water per capita is at the water stress threshold of 1700 m3 yr−1 (Falkenmark, 1989; Brown and Matlock, 2011). It is even less in the arid to semi-arid Yellow River basin that produces 33 % of the total agricultural production in China. To overcome water shortages in the Yellow River basin, crops are irrigated from surface water and groundwater. This irrigation has directly changed the hydrology of the basin. While 50 years ago, the semi-arid North China Plain had springs, shallow groundwater and rivers feeding the Yellow River, at present rivers and springs have dried up where groundwater is used for irrigation (Yang et al., 2015a). At the same time, in arid Inner Mongolia, along the Yellow River, the once-deep groundwater is now within 3 m of the soil surface in the large irrigation projects such as the Hetao irrigation district because of downward percolation of the excess irrigation water that has been applied.
In the Yellow River basin, crop irrigation accounts for 96 % of the total water use (Li et al., 2004). Due to the increased demand for irrigation, the river has stopped flowing downstream for an average of 70 d yr−1 (Hinrichsen, 2002). Saving water upstream in Inner Mongolia by improved management practices mean that more water will be available downstream (Gao et al., 2015). In addition, the Hetao district is suffering from salinization, which leads to the land degradation (Guo et al., 2018; Huang et al., 2018). Salinization is caused by upward migration of water (and salt) from the shallow groundwater table that leads to salt accumulation at the surface (Ren et al., 2016; Yeh and Famiglietti, 2009). Designing improved management practices to save water and decrease salinization can be achieved by field trials or with the aid of a computer simulation mode measuring the fluxes. Field trials are time-consuming and expensive, and only a limited set of water management practices can be investigated. Models can test many management practices; however, the modeling results are often questionable because they have not been validated under local field condition and have not been validated for the future conditions. A combination of field experiments together with models has the benefits of both approaches with few negative effects.
Central to modeling irrigation management practices under shallow groundwater conditions (such as in the Yellow River basin) is simulating the soil moisture content accurately (Batalha et al., 2018, Gleeson et al., 2016; Jasechko and Taylor, 2015; Venkatesh et al., 2011a) because the moisture content plays a critical role in the growth of crops (Rodriguez-Iturbe, 2000), groundwater recharge (Hodnett and Bell, 1986) and upward movement of water to the root zone in areas (Gleeson et al., 2016; Jasechko and Taylor, 2015; Venkatesh et al., 2011a; Batalha et al., 2018). The last effect is unique to shallow groundwater areas where the moisture content and thus the unsaturated conductivity are high and where the drying of the surface soil sets up the hydraulic gradient that causes the upward capillary movement from the shallow groundwater (Kahlown et al., 2005; Liu et al., 2016; Luo and Sophocleous, 2010; Yeh and Famiglietti, 2009). The upward-moving water contains salt that is deposit in the root zone and at the surface.
There is tendency with the ever-increasing computer power to include all processes and the highly heterogeneous field conditions in hydrological models (Asher et al., 2015). In the case of simulating moisture contents, these models become complex and often fully distributed in three dimensions (Cui et al., 2017). Examples of these fully developed models are HYDRUS (Šimůnek et al., 1998), SWAP (Dam et al., 1997) and MODFLOW (Mcdonald and Harbaugh, 2003; Langevin et al., 2017). These models have long run times when applied to scenario simulations for real-world problems. In addition, calibration effort increases exponentially with the number of model parameters (Rosa et al., 2012; Flint et al., 2002). This makes the use of the complex models for real-time management and decision support cumbersome where many model runs are needed (Cui et al., 2017).
To overcome the disadvantages of the full and more complete models, computationally efficient surrogate models have been developed to speed up the modeling process without sacrificing accuracy or detail. Surrogate models are known under several names, such as metamodels, reduced models, model emulators, proxy models and response surfaces (e.g., Razavi et al., 2012a; Asher et al., 2015). We call the complex models “full” or comprehensive models.
Computational efficiency is the main reason for applying surrogate models in place of full models. Other advantages of surrogate models are shortening the time needed for calibration and identifying insensitive and irrelevant parameters in the full models (Young and Ratto, 2011). Most importantly, surrogate models allow investigating structural model uncertainty (Matott and Rabideau, 2008). Finally, surrogate models might be able to deal better with the self-organization of complex systems prevalent in hydrology than the full models (Hoang et al., 2017). For example, full models based on small-scale physics (Kirchner, 2006) cannot necessarily model the repetitive wetting patterns observed in humid watersheds, and for that reason, simple surrogate models often outperform their complex counterparts in predicting runoff when a perched water table is present in sloping terrains (Moges et al., 2017; Hoang et al., 2017).
Surrogate models can be classified in two categories (Todini, 2007; Asher et al., 2015): data-driven and physically derived models. Data-driven surrogates analyze relationships between the data available and physically derived surrogates simplifying the underlying physics or reduce numerical resolution. In recent years, most emphasis in the research literature has been on data-driven surrogate approaches (Razavi et al., 2012a). Relatively little research has been published on physically derived approaches. Despite its popularity, data-driven surrogates can be an inefficient and unreliable approach for optimizing complex field situations, especially when data are scarce, such as in groundwater systems (Razavi et al., 2012b). The physically derived surrogates overcome many of the limitations of data-driven approaches and are therefore superior over data-driven methods (Asher et al., 2015).
In the Yellow River basin various water-accounting models have been developed to simulate the soil water content and water fluxes (Xu et al., 2012; Chen et al., 2014; Xue and Ren, 2017; Yang et al., 2017; Ren et al., 2019). Numerical implementations are the finite-element model HYDRUS-1D by Ren et al. (2016) and Luo and Sophocleous (2010) and a finite-difference model by Moiwo et al. (2010). Surrogate models for the North China Plain, where the groundwater is more than 20 m deep, were published by Wang et al. (2001), Kendy et al. (2003), Chen et al. (2010), Ma et al. (2013), Yang et al. (2015, 2017a, b) and Li et al. (2017). In these models, the matric potential is ignored, and the hydraulic potential is equal to the gravity potential; thus the gradient of the hydraulic potential is unity (at least when it is expressed in head units). Under these conditions the water flux becomes negligible when the soil reaches field capacity at −33 kPa (equivalent to −3.3 m in head units), at which point the hydraulic conductivity becomes limiting. These models are not valid for irrigation projects along the Yellow River with shallow groundwater because the matric potential cannot be ignored over the short distance between the water table and the surface of the soil. Since the gravity and matric potential are of the same order, the water moves either down to the groundwater or up from the groundwater to the root zone, depending on the matric potential at the soil (Gardner, 1958; Gardener et al., 1970a, b). In summary, for shallow groundwater at less than 3.3 m from the surface, equilibrium is reached (i.e. fluxes are negligible) when the hydraulic gradient is zero (i.e., matric potential and gravity potential add up to constant value) and thus not when the conductivity becomes limited at a matric potential of −33 kPa.
For the irrigation perimeters with shallow groundwater in the Yellow River basin, we could find only two surrogate models developed by Xue et al. (2018) and Gao et al. (2017a, b). These two models do not consider the dynamics of groundwater depth and matric potential. By including these dynamics, more realistic predictions of moisture contents and upward flow can be obtained and would give better results when extended outside the area they are developed for (Wang and Smith, 2004). The reason is that for areas with shallow groundwater, evapotranspiration sets up a hydraulic gradient that causes the upward capillary water movement to sustain the evapotranspiration demands and crop water use (Kahlown et al., 2005; Liu et al., 2016; Luo and Sophocleous, 2010; Yeh and Famiglietti, 2009).
Advantages of physically driven surrogates are particularly relevant to groundwater studies where water tables are simulated over entire large areas, as shown by Brooks et al. (2007). Despite this, Asher et al. (2015) poses that physically driven methods have not been applied widely to groundwater problems, and even fewer have been applied with the interaction of moisture contents in the vadose zone, which is key in salinization and plant growth of the many cropped irrigated field in arid and semi-arid regions. In these water short areas it is extremely important to develop models that give directions on how to save water. The main objective of this study is, therefore, to develop a novel surrogate model and to validate this approach using experimental data collected in a field with shallow groundwater, where the ultimate goal is to save water in irrigation districts. In addition, sensitive and insensitive model parameters were identified for simulating moisture content in the shallow groundwater area to optimize future data collection efforts. The experimental fields are located in the Hetao irrigation district, Inner Mongolia, China, where in two maize fields, the moisture content and the groundwater table depth were measured over a 2-year period.
The surrogate model developed is a one-dimensional model simulating the moisture content in the root zone using the groundwater depth and information of the soil moisture characteristic curve. It can be easily adapted to the field scale by including the lateral movement of the regional groundwater. However, over short times, lateral movement can be neglected in nearly level areas outside a strip of 5–100 m from the river (Saleh et al., 1989), such as in deltas and lakes (Dam et al., 1997; Kendy et al., 2003).
2.1 Study area
The Hetao irrigation district (HID) is the third-largest irrigation district of China. It covers an area of 1.12×10⁶ ha, of which half is irrigated (Xu et al., 2015). About 5 billion m3 of water is diverted from the Yellow River each year (Xu et al., 2010). The primary irrigation method used is surface flood irrigation (Sun et al., 2013). The groundwater table is very shallow, ranging between 0.5 and 3 m. The overall hydraulic gradient is 0.1 ‰–0.25 ‰ (Ren et al., 2018). Soil salinization is serious, and the chemical composition of groundwater salinity mainly consists of NaCl, Kcl and CaSO4. The Hetao district has a typical arid continental climate, with high evaporation and low rainfall. The average annual precipitation is 180 mm, and the annual potential evapotranspiration is 2225 mm (Luan et al., 2018). The soil is mainly alluvial deposits with a silty loam texture. It is frozen 5 to 6 months per year, from late November to the middle of May. Maize and wheat are the main food crops, and sunflower is the main cash crop.
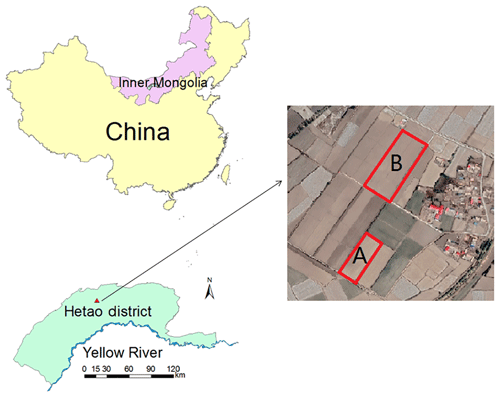
Figure 1Location of the field experiment in Hetao irrigation district. The blue line is the Yellow River.
2.2 Field experiment and data collection
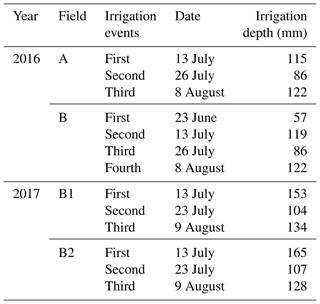
The experiment was carried out in Fenzidi, Bayannur (41∘9′ N, 107∘39′ E), in the Hetao district in 2016 and 2017 (Fig. 1). In 2016, the experiment was carried out separately in site A (about 3100 m2) and site B (about 7000 m2; Fig. 1). In 2017, Field B was split into Field B1 and B2, and experiments were carried out in these two fields. Field B1 was about 3400 m2, and B2 was about 3600 m2. Experimental fields were planted both years with maize. The sowing dates were 24 April 2016 and 13 May 2017. The harvest date was 1 October in both 2016 and 2017. The plant growth stages are given in Table 1. The fields were flood irrigated three or four times during the heading and filling stages starting in late June or early July (Table 2).
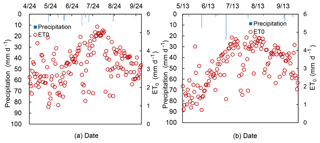
Figure 2Daily reference evapotranspiration, ET0, and precipitation during the growing season in (a) 2016 and (b) 2017.
Precipitation, air temperature, relative humidity, sunshine duration and wind speed were collected from the weather station at the experimental station. The reference evapotranspiration (ET0) was calculated based on the FAO Penman–Monteith equation with the daily meteorological data (Allen et al., 1998). Precipitation and ET0 during the growing season are shown in Fig. 2. The soil moisture was monitored daily in the top 90 cm using HydraProbe soil sensors (Stevens Water Monitoring System Inc., Portland, OR, USA) installed in both experimental fields. Soil moisture was measured at five depths: 0–10, 10–30, 30–50, 50–70 and 70–90 cm. The sensors were connected to data loggers and downloaded via wireless transmission. Calibration was conducted by oven drying soil samples (Wang et al., 2018; Gao et al., 2017a). The groundwater depth was measured by piezometers (HOBO Water Level Logger U20, Onset, Cape Cod, MA, USA) recorded at 30 min intervals.
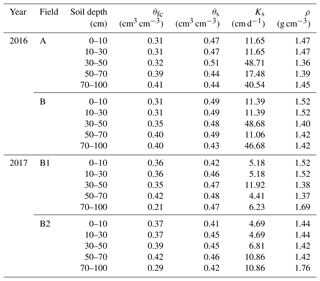
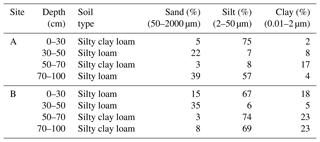
Soil samples were collected in rings from the same five layers where moisture contents were measured and used for determining soil physical properties including soil moisture at field capacity (θfc), soil moisture at saturation (θs), dry bulk density (ρ) and saturated hydraulic conductivity (Ks; Table 3). For Field A, B, B1 and B2, the saturated hydraulic conductivity was determined by the constant head method. Field capacity was determined at −33 kPa, and bulk density was determined by oven drying and dividing by the volume of the ring. Soil texture of Field A and B was analyzed with the laser particle size analyzer (Mastersizer 2000, Malvern Instruments Ltd., United Kingdom) in the laboratory and is shown in Table 4. The American soil texture classification was used in this study. The soils vary from silty loam to silty clay loam.
2.3 The shallow-aquifer–vadose zone model surrogate model
In developing the shallow-aquifer–vadose zone surrogate model for modeling moisture contents in the vadose zone, we followed the standards of good modeling practice by Jakeman et al. (2006). We made the model as simple as possible, provided justification for our surrogate technique, tested the surrogate model performance and finally provided detail on the method to encourage discussion on the technique that was followed.
2.3.1 Theoretical background
For shallow groundwater (less than 3.3 m deep), the matric potential is a function of depth under equilibrium conditions. Since the soil moisture characteristic curve for each soil is the relationship of moisture content and matric potential, the moisture content is also a function of the depth of the water table under equilibrium conditions.
Soil moisture characteristic curve
There are several formulations describing the soil moisture characteristic curve (Bauters et al., 2000; Brooks and Corey, 1964; Gupta and Larson, 1979; Haverkamp and Parlange, 1986; van Genuchten, 1980); the van Genuchten and Brooks–Corey models are widely used in hydrological and soil sciences. Here, we selected the Brooks–Corey model for its simplicity.
The Brooks–Corey model can be expressed as (Gardner et al., 1970a, b; Mccuen et al., 1981; Williams et al., 1983)
in which Se is the effective saturation, φb is the bubbling pressure (cm), φm is matric potential (cm) and λ is the pore size distribution index. The effective saturation is defined as
in which θ is the volumetric moisture content, θs is the volumetric saturated moisture content and θd is the residual air dry moisture content (all in cm3 cm−3). Equation (2) can be simplified to the form by setting θd=0:
For cases when the groundwater is close to the surface, under equilibrium conditions when the water flow is negligible (i.e., hydraulic potential is constant with depth), the matric potential can be expressed as height above the water table. For our field experiment the bubbling pressure, φb, and the pore size distribution index, λ, in the Brooks–Corey model can be obtained through a trial-and-error procedure by using the measured moisture content and matric potential derived from the groundwater depth after an irrigation event when the equilibrium state was reached and the sum of the gravity potential and matric potential was constant with depth.
2.3.2 Parameters based on soil moisture characteristic curve
The soil of the crop root zone is divided into several soil layers, and each soil layer has its specific soil moisture characteristic curve. After a sufficiently large irrigation and rainfall event, the moisture content is at equilibrium after the drainage stops. After such an event, the soil moisture of the vadose zone stays at the equilibrium moisture content as long as the evapotranspiration is less than upward flux from the groundwater.
Equilibrium moisture content
The equilibrium soil moisture content, θequ, in a layer can be determined by first replacing the matric potential in Eq. (1a) by the matric potential of the layer that is dependent on the depth of the groundwater and depth of the soil layer, z, e.g.,
where is the matric potential under equilibrium moisture content at a depth z below the surface and h is the depth of the groundwater below the surface:
where is the equilibrium soil moisture at the depth z below the surface, while the groundwater depth is h. Note that the superscripts z and h indicate the dependence on the distance from the soil surface, z, and the depth, h, of the groundwater table.
Drainable porosity
The drainable porosity, or specific yield, is defined as the amount of water drained from the soil for a unit decrease in the groundwater table when the soil moisture is at equilibrium. It is a crucial parameter in modeling the moisture content in our case or the amount of runoff for a shallow perched water table when there is rain (Brooks et al., 2007).
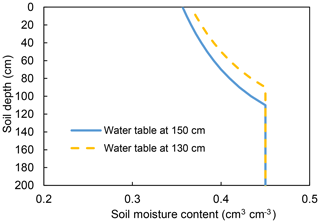
Figure 3Illustration of drainable porosity for a soil moisture characteristic curve with a bubbling pressure of 40 cm. The yellow and the blue lines are the equilibrium moisture contents for the groundwater depth at 130 and 150 cm, respectively. The area between the two lines represents the amount of water for the decrease in groundwater table drained from the profile when the groundwater decreases from 130 to 150 cm.
By subtracting the total moisture content at equilibrium in the profile at the initial water table depth and at the new position one unit lower, we obtain the drainable porosity. For example, the area between the yellow and blue curve is the amount of water drained for a decrease in the water table from 130 to 150 cm (Fig. 3).
The total water content amount of the soil over a prescribed depth with a water table at depth h can be expressed as
where is the average equilibrium moisture content of layer j for h taken at the midpoint of the layer, n is the number of layers in the profile and Lj is the height of soil layer j. The drainable porosity, μh, with the groundwater at depth h, can simply be found as
where Δh=0.5Lj.
2.3.3 Calculating fluxes in the soil
The model accounts for the downward flux due to the irrigation and rainfall, evapotranspiration by plants and soil, and upward flux from the groundwater to satisfy some or all the evapotranspiration demand by the crop and soil. There are sets of rules implemented in an Excel spreadsheet to calculate the fluxes.
Evapotranspiration
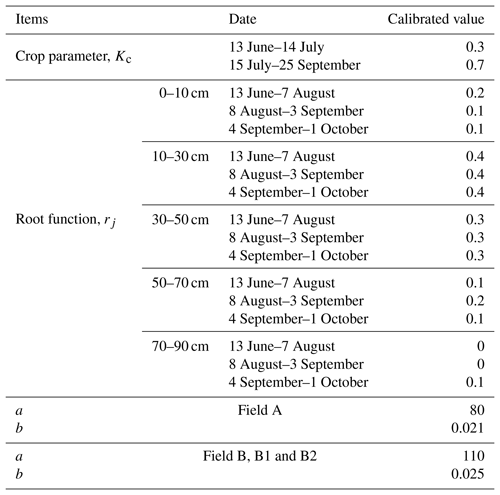
The plant evapotranspiration was calculated in two steps. First the daily reference evapotranspiration (ET0) was calculated by the Penman–Monteith equation (Allen et al., 1998). We assumed that the moisture content was limiting; therefore the plant evapotranspiration rate was obtained by multiplying the reference evapotranspiration by a crop coefficient (Allen et al., 1998; Sau et al., 2004; DeJonge et al., 2012). Values for the crop coefficients were calibrated according to the water balance in the soil and found to agree with published values for stage of crop development and soil salinity.
On days without rain or irrigation, the evapotranspiration lowers the water table, and the moisture content in the soil decreases due to upward movement of water to the plant roots and soil surface. On days with rain or irrigation, the potential evapotranspiration is subtracted from the irrigation and/or rainfall, and water moves downward.
Upward flux from groundwater
The upward flux from the groundwater, , is either limited by the potential evapotranspiration or the maximum flux of groundwater. The maximum flux, , depends on the depth of the groundwater, the type of soil moisture characteristic curve and the condition at the surface (Gardner, 1958). These equations have an exponential form (Gardner, 1958; Yang et al., 2011; Zammouri, 2001),
where a and b are constants and ETp is the potential evapotranspiration. The upward flux from the groundwater can be written as
On days without rain or irrigation, the soil moisture content is calculated by taking the difference of the equilibrium moisture content associated with the change in depth of groundwater. If in addition the upward flux is less than evapotranspiration, the difference between the upward flux and the evapotranspiration is extracted out of the root zone according to a predetermined distribution, rj, e.g.,
where is the average soil moisture content at time t of layer j, is the average equilibrium soil moisture content of layer j when the groundwater depth is h at time t, Kc is a reduction factor of the potential evapotranspiration for saline soil water and the canopy, and rj is the root function that determines that the portion of the evapotranspiration is taken up by the roots in layer j. The value z is taken at the midpoint of layer j. The time t is expressed in days and time, and t−Δt, is the previous day.
The downward flux
The rules for downward flux on days with the effective rain and/or irrigation are relatively simple. If the net flux at the surface (irrigation plus rainfall minus actual evapotranspiration) is greater than that needed to bring the soil up to equilibrium moisture content, the groundwater will be recharged, the distance to soil surface decreases and the moisture content will be equal to the equilibrium moisture content at the new depth. When the groundwater is not recharged, the following water balance is calculated: the rainfall and the irrigation are added to first layer. This layer will be brought up to the equilibrium moisture content, the remaining water fills up the next layer to the equilibrium moisture content and so on. The calculations can be expressed as follows:
where for j≥2, Rj−1 is the flux from the layer above and equals
For j=1, R1 is equal to the rainfall plus the irrigation amounts minus potential evaporation.
Groundwater table depth
The groundwater in Hetao irrigation district has a small hydraulic gradient of 0.10 ‰–0.25 ‰ (Ren et al., 2016). In addition, the soil varies from silt loam to clay loam (Table 4) that has saturated hydraulic conductivity of less than 2 m d−1. This means that the lateral fluxes are small compared the vertical fluxes and can therefore be neglected for the calculation of the groundwater depth. Based on this assumption, the net change in groundwater depth, Δh, can be calculated on days without rainfall or irrigation as
and days with rain or irrigation as
where the upward flux, , is calculated with Eq. (9), the percolation of the bottom layer, R5, with Eq. (12) and the drainable porosity, μh, with Eq. (7). When the groundwater is close to the surface, the drainable porosity is zero. This would make the change in groundwater infinite. Thus, we limited the maximum decrease in groundwater after the irrigation event to 10–20 cm based on field observations.
2.3.4 Model calibration and validation
The soil moisture contents were measured from 30 May to 25 September in 2016 and 2017. Groundwater depth was observed from 13 June to 26 September in 2016 and 2017. For the convenience of simulation, the period of 13 June to 25 September was set as the simulation period. The model parameters were calibrated with the 2016 data and the validation with data collected in 2017 growing seasons. Soil moisture content of the top 90 cm (0–10, 10–30, 30–50, 50–70 and 70–90 cm) and the groundwater depth were simulated for model calibration and validation.
Relatively few parameters can be calibrated in the shallow-aquifer–vadose zone model. These are the crop coefficient, the Kc value, the two groundwater parameters and the root function. The other input data needed for model were the parameters in the Brooks–Corey equation (e.g., θs, θd, φb and λ) and were obtained by fitting the equation to the soil moisture characteristic curve of each layer of the soil. The saturated moisture content was measured independently as well and agreed with values obtained from the fit. Reference evapotranspiration was calculated directly from observed meteorological data.
For better understanding the model fitting performance, statistical indicators were used to evaluate the hydrological model goodness of fit (Ritter and Muñoz-Carpena, 2013). The statistical indicators including the mean relative error (MRE; Dawson et al., 2006), the root-mean-square error (RMSE; Abrahart and See, 2000; Bowden et al., 2002), the Nash–Sutcliffe efficiency coefficient (NSE; Nash and Suscliff, 1970), the regression coefficient (b; Xu et al., 2015), the determination coefficient (R2) and the regression slope (Krause et al., 2005) were used to qualify the model fitting performance during the model calibration and validation in this study. These statistical indicators can be expressed as follows:
where N is the total number of observations, Oi and Pi are the ith observed and predicted values (), and and are the mean observed values and mean predicted values, respectively. For the MRE and RMSE, the values closest to 0 indicate good model predictions. NSE = 1.0 means a perfect fit, and the negative NSE values indicate that the mean observed value is a better predictor than the simulated value (Moriasi et al., 2007). For b and R2, the values closest to 1 indicate good model predictions.
In this section, we present first the 2016 and 2017 experimental observations of the Fenzidi experimental fields in the Hetao irrigation district (Fig. 1). This is followed by the calibration and validation of the shallow-aquifer–vadose zone model of moisture content in each of the five layers and the groundwater table depth.
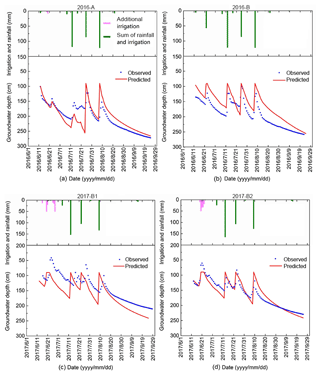
Figure 4Simulated and observed groundwater depth during the growing period for the Fenzidi experimental fields in the Hetao irrigation district: (a, b) calibration in 2016 and (c, d) validation in 2017. (Note: additional irrigation means the irrigation recharge from the adjacent field which leads to the water table rise and is not planned.)
3.1 Results of the field experiment
The total precipitation at the experimental during growing season was 62 mm in 2016 and 67 mm in 2017. The maximum daily rainfall was 23 mm in July 2017 (Fig. 2). The reference evapotranspiration varied between 1 to 5.5 mm d−1, and the total ET0 was 517 and 442 mm in the growing seasons during 2016 and 2017, respectively (Fig. 2). Daily observation consisted of groundwater depth (blue points; Fig. 4) and soil moisture content at five soil depths up to 90 cm (blue points; Fig. 5) for Field A and B in 2016 and Field B1 and B2 in 2017.
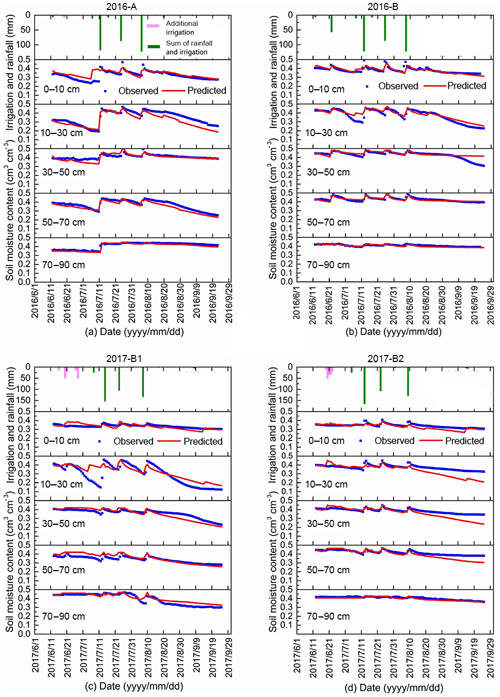
Figure 5Simulated and observed soil moisture content for five soil depths during the growing period for the Fenzidi experimental fields in the Hetao irrigation district: (a, b) calibration in 2016 and (c, d) validation in 2017.
3.1.1 Groundwater observations
In 2016, the groundwater depth was generally more than 100 cm, except during the last two irrigation events in Field B, when it reached a depth of 72 cm for 1 or 2 d (Fig. 4). In 2017, groundwater tables were slightly closer to the surface than in 2016, especially in Field B2. The minimum groundwater depth was 61 cm on 21 June 2017 in Field B2 after an irrigation event.
In general, groundwater rose during an irrigation event and then decreased slowly due to upward movement of water to the plant roots to meet the transpiration demand. However, in the beginning of the growing season, we can see that the water table increased without an irrigation event. This occurred in Field A on 24 June 2016 and in Field B1 and B2 on 20 June 2017 (Fig. 4). This is curious and could be due to water originating from irrigation in a nearby field.
The water table at the end of the period of observation on 24 September 2016 is approximately 2 m deep, whereas on 15 June 2017, the depth decreased to around 125 cm. This is due to an irrigation application after the crops were harvested to leach the salt from the surface to deeper in the profile, bringing the water table up to near the surface. Evapotranspiration during the winter is small but sufficient for bringing the water table down. There was also a rainfall event on 5 June 2017 of 13 mm (Fig. 2) before the water table was measured, increasing the water level.
3.1.2 Soil moisture
Moisture contents are shown for the five layers and the two fields for 2016 and 2017 in Fig. 5. The moisture contents were near saturation when irrigation water was added and subsequently decreased (Fig. 5). For example, the soil moisture content changed in the 0–10 cm layer from 0.26 cm3 cm−3 to 0.42 cm3 cm−3 after the irrigation on 13 July 2016 in Field A and then gradually decreased to 0.34 cm3 cm−3. The moisture content decreased faster in the 10–30 cm depth than at any other depth for Field A, B and B1 but not for Field B2. The moisture content in Field A also showed a decrease at the 50–70 cm depth. For all plots, the moisture content at the 70–90 cm depth stayed nearly constant and only decreased during the growing season when the water table decreased below the 150 cm depth (Fig. 5). In Field A, the initial moisture content when the observation started was less than saturation; then after the first irrigation, it remained close to the saturated moisture content.
It is interesting that while the soil profile was saturated (Fig. 4), the groundwater table was between 75–100 cm (Fig. 5). Before equilibrium moisture content was reached the water table was likely near the surface during the irrigation event. Because the drainable porosity was extremely small, even a minimum amount of evapotranspiration or drainage would cause the water table to decrease to roughly the height of the capillary fringe equal to the bubbling pressure, φb, in Eq. (5). The values of bubbling pressure are listed in Table 5.
3.1.3 Soil moisture characteristic curve
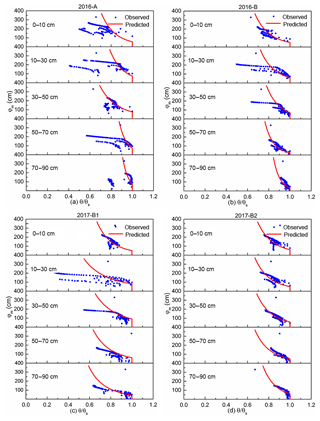
In 2016 and 2017, the observed reduced moisture contents were plotted versus the height above the water table for the five soil layers of the two field sites in Fig. 6. These plots were used to define the soil moisture characteristic curves, which were of critical importance in simulating the moisture contents.
To define the soil moisture characteristic curve, the Brooks–Corey equation (Eq. 1) was fitted through the points closest to saturation at each matric potential representing the equilibrium conditions after an irrigation event. The fitted parameter values are shown in Table 5. Points to the left of the soil moisture characteristic curve are a result of evapotranspiration drying out the soil when the upward movement of water was insufficient for replenishing the moisture content in these layers, and thus matric potential and groundwater depth were not in equilibrium. In addition, the few points to the right indicate that the soil moisture was greater than the equilibrium moisture content. Many of the outlier soil moisture contents occurred in the layer from 0–10 cm, indicating that the soil was still draining after a rainfall event shortly before the measurements. Thus, the soil was not at the equilibrium moisture content.
The saturated moisture contents in Table 5 agree in general with those measured in Table 3 but are not exact. This is not a surprise, as the alluvial soil deposited by the rivers with layers varies over short distances. The variation within the field was also obvious from the soil's physical measurements. Field B1 and B2 are within Field B. The soil's physical properties of the various layers (Table 4) were not the same for the three sites, clearly showing the variability within the field.
Generally, large values of a pore size index coefficient λ are for sandy soils, and lower values are for clay soils (Bahmani and Bayram, 2018). We find this to be true for our site: for example, in Field A, λ=0.23 corresponds to a sandy layer with only 8 % clay in the 30–50 cm layer (Tables 4 and 5). In the 70–90 cm layer of Field B, the λ=0.07 corresponds to the clay layer of 23 % clay. In addition, bubbling pressure, φb, is greater for soils with a large clay content (Bahmani and Bayram, 2018). This is demonstrated for Field A in the 10–30 cm layer, where the bubbling pressure of 75 cm corresponded with the clay layer of 20 % clay. However, the correspondence between Tables 4 and 5 is not always perfect. This is especially obvious for the layer of 70–90 cm in Field A, where the values in Table 5 clearly indicate that the soil has a dense clay layer; however, the soil description in Table 4 shows that the soil is 39 % sand. This is due to the alluvial deposition patterns with changes in soil texture over short distances, as mentioned before.
3.2 Modeling results
The four parameters that can be calibrated in the shallow-aquifer–vadose zone model are the crop coefficient Kc value and the root function, both related to removal of water by the atmosphere, and the two groundwater parameters that determine the upward movement of water from the groundwater.
3.2.1 Calibration of the parameters related to moisture content
The first step in the calibration was to fit the Kc value from the water balance. From the moisture contents and the groundwater depth, we can calculate approximately the amount of water lost to evapotranspiration. By comparing these values to the reference evapotranspiration calculated with the Penman–Monteith equation, we found that initially during the early stages the crop coefficient was 0.3 until the filling stage and then increased to 0.7 during the filling stage to the maturing stage (Table 6). These values are in accordance with the findings of Katerji et al. (2003) that salinity reduces the evapotranspiration (Katerji et al., 2003). According to the observed total salt content, the mean total salt content of experiment field in the 0–100 cm soil layer during the crop growth period was 2.29 g kg−1 in Field A, 1.79 g kg−1 in Field B, 2.33 g kg−1 in Field B1 and 2.09 g kg−1 in Field B2.
Table 7Model statistics for calibration of the shallow aquifer model in 2016. The mean relative error (MRE), root-mean-square error (RMSE), regression slope, coefficient of determination (R2) and regression coefficient (b) are listed. Note: SWC is the soil water content, and GWD is the groundwater depth.
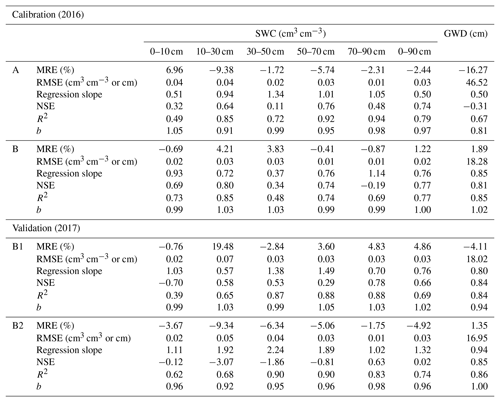
The second step was calibrating the moisture content by adapting the root function indicating the layers from which the water was taken up. Calibration was done manually by trial and error. We found that we could use the same root function for Field A, B, B1 and B2 (Table 6). The calibrated soil moisture contents of the five soil layers for the two fields in general are in agreement with the measured values in 2016 (Fig. 5a, b), with the coefficient of determination R2 ranging between 0.48 to 0.94 with slopes of around 1, the MRE ranging between −9.38 % and 6.96 %, and the RMSE varying from 0.01 to 0.04 cm3 cm−3 for the five layers (Table 7). Finally, the parameters behaved physically and realistically, as water was extracted from shallow layers when the groundwater was close to the surface and from the deeper layers when the groundwater and the associated capillary fringe went down.
3.2.2 Validation of the parameters related to moisture content
The moisture contents predicted by the shallow-aquifer–vadose zone model were validated with the 2017 data in Field B1 and B2. Although the validation statistics of the five layers were slightly worse than for calibration in Table 7, the overall fit was still good, as shown in Fig. 5c and d. The coefficient of determination varied between 0.39 and 0.90. The MRE varied between −9.34 % and 19.48 %, and the mean RMSE range was from 0.01 to 0.07 cm3 cm−3 for the five soil layers (Table 7).
3.2.3 Calibration of the parameters related to groundwater depth
The final step was to calibrate the groundwater table coefficients with the 2016 data for both fields. We found that for fields not in the same location (e.g., A, B), the subsurface was sufficiently different; thus the same set of parameters could not be used (Table 6). The difference between the calibrated parameters for the two fields was small (Table 6). The measured and simulated groundwater depths were in good agreement with the chosen set of parameters (Fig. 4a, b), with the coefficient of determination R2 being 0.67 for Field A and 0.85 for Field B (Table 7). Only from 15 July to 24 July did the observed water table on Field B decrease slower than the simulated water table. This is partly related to the fact that the properties of the soil below 90 cm were not measured, and the assumption was made that the soil moisture characteristic curve below 90 cm was the same as that from 70–90 cm. Thus the drainable porosity of the soil, which is a very sensitive parameter, might be different than what was used in the model. Another reason might be that the equation for upward movement might be too simple. Other statistical indicators show a good fit as well (Table 7).
3.2.4 Validation of the parameters related to groundwater depth
Since Field B1 and B2 are in the same location as Field B, we used the same set of groundwater parameters for the three fields (Table 6). The resulting fit between observed and predicted daily groundwater depths for Field B1 and B2 in 2017 was better than for the calibration in 2016 (Fig. 4c, d), with R2 values of 0.84 for Field B1 and 0.86 for Field B2 (Table 7). In both cases, the slope of the regression line was close to 1. The other statistics indicated a good fit as well (Table 7), with the MRE being −0.05 for Field B1 and −0.02 for Field B2, the RMSE being 18.02 cm for Field B1 and 16.95 cm for Field B2, and the regression coefficient b being 0.94 and 1 for Field B1 and B2, respectively. The general agreement between the measured and simulated groundwater depth suggests that the two parameters are adequate, and the model can be used as a tool to simulate the change of the groundwater depth.
In this paper, a novel surrogate model was developed for irrigation systems where the groundwater is close to the surface. The model uses the soil moisture characteristic curve to derive the drainable porosity and to predict the moisture contents in the soil. It is based on a definition of field capacity that is used less often (or equilibrium moisture content, as it is called in this paper) based on the observation that the flow becomes negligible when the hydraulic gradient is zero. In other words, the system is in equilibrium when the sum of the matric potential and the gravity potential is constant. Thus, when we chose the groundwater level as the reference point for the gravity potential, the matric potential is equal to the height above the groundwater. This is different from other applications of Darcy's law, where the groundwater is below 3.3 m. In these cases, groundwater movement stops when the conductivity becomes negligible at −33 kPa or 3.3 m in head units. The hydraulic conductivity value above −33 kPa (3.3 m in head units) does not limit the system, reaching equilibrium for daily time steps. No need therefore exists to measure this parameter in great detail for surrogate models. The opposite is true for the soil moisture characteristic curve for determining the spatial distribution of moisture content with depth above the groundwater.
In general, this surrogate model simulated the soil moisture content in each soil layer well, especially when compared to other models that attempted the soil moisture contents in the Yellow River basin such as the North China Plain (Kendy et al., 2003) and the Hetao irrigation district in Gao et al. (2017b) during the crop growth period. Our simulation results suggest that the reduction factor of the potential evaporation for soil saline Kc and root function parameters, together with the information of the soil moisture characteristic curves, can be used to adequately predict the soil moisture content. To predict the groundwater depth, two additional parameters are needed for the exponential function that defines the upward movement of groundwater.
The simulations, together with the observed data, indicated that information about the soil is very important to obtain the exact moisture content in the soil. However, generalized soil moisture characteristic curves for each soil type can be used in the simulation and will not result in great differences in water use by plants, since percolation to deeper layers was negligible, and thus the only loss of water was by evapotranspiration independent of the soil moisture content.
Finally, in the simulations we did not consider the influence of crop type and the influence of crop growth on soil moisture and groundwater depth. It would be of interest to investigate in future work whether the simulations would be improved by considering the dynamic crop characteristics during the growing season (Singh et al., 2018; Talebizadeh et al., 2018). A mature crop model, such as the EPIC model (Williams et al., 1989), which needs relatively few parameters, will certainly help to predict the crop yield but might not change the water use predictions. Actually, the EPIC model was already applied to the Hetao irrigation district by many researchers to analyze the crop growth during the crop growth period (Jia et al., 2012; Xu et al., 2015).
A novel surrogate vadose zone model for an irrigated area with a shallow aquifer was developed to simulate the fluctuation of groundwater depth and soil moisture during the crop growth stage in the shallow groundwater district. To validate and calibrate the surrogate model we carried out a 2-year field experiment in the Hetao irrigation district in upper Mongolia with groundwater close to the surface. Using meteorological data and the soil moisture characteristic curve and upward capillary movement, the surrogate model predicted the soil water content with depth and groundwater height on a daily time step with acceptable accuracy during validation and was an improvement of two previous models applied in the Hetao district that could predict the overall water content in the root zone but not the distribution with depth.
The surrogate modeling results show that after an irrigation event, as long as the upward flux from the groundwater to the root zone was greater than the plant evapotranspiration rate, the moisture contents in the vadose zone could be found directly from the soil moisture characteristic curve by equating the depth to the groundwater with the absolute value of the matric potential. When the plant evapotranspiration rate exceeded the upward movement, moisture contents would be indicated by groundwater depth and were predicted by a root zone function. Another finding was that the daily moisture contents were simulated without using the unsaturated hydraulic conductivity function in the surrogate model. For a daily time step, equilibrium (defined as the hydraulic potential being constant) in moisture contents in the profile was attained; thus precise unsaturated conductivity was not needed. Of course, for shorter time steps, for predicting the transient fluxes and groundwater, the conductivity function is needed. For management purposes a daily time step is acceptable.
Future improvement to this model will focus on coupling the EPIC model and applying it to simulate other crops and other locations with a shallow groundwater table. The surrogate model should also be compared with a “full” model to test the conditions under which the surrogate model will fall short.
The observed data used in this study are not publicly accessible. These data have been collected by personnel the College of Water Resources and Civil Engineering, China Agricultural University, with funds from various cooperative sources. Anyone who would like to use these data should contact Zhongyi Liu, Xingwang Wang and Zailin Huo to obtain permission.
XW collected the data. ZL, ZH and TS contributed to the development of the model. The simulations with the novel model were done by ZL and TS. Preparation and revision of the paper were done by ZL, under the supervision of TS and ZH.
The authors declare that they have no conflict of interest.
Peggy Stevens helped greatly with polishing the English. We thank Xingwang Wang, who helped in collecting data.
This research has been supported by the National Key Research and Development Program of China (grant no. 2017YFC0403301) and the National Natural Science Foundation of China (grant nos. 51639009 and 51679236).
This paper was edited by Nunzio Romano and reviewed by Jan Boll, Tiago Ramos and one anonymous referee.
Abrahart, R. J. and See, L.: Comparing neural network and autoregressive moving average techniques for the provision of continuous river flow forecasts in two contrasting catchments, Hydrol. Process., 14, 2157–2172, https://doi.org/10.1002/1099-1085(20000815/30)14:11/12<2157::AID-HYP57>3.0.CO;2-S, 2000.
Alcamo, J., Florke, M., and Marker, M.: Future long-term changes in global water resources driven by socio-economic and climatic changes, Hydrol. Sci. J., 52, 247–275, https://doi.org/10.1623/hysj.52.2.247, 2007.
Allen, R. G., Pereira, L. S., Raes, D., and Smith, M.: Crop evapotranspiration. Guidelines for computing crop water requirements-FAO Irrigation and Drainage Paper 56, FAO, Rome, 1998.
Asher, M. J., Croke, B. F. W., Jakeman, A. J., and Peeters, L. J. M.: A review of surrogate models and their application to groundwater modeling, Water Resour. Res., 51, 5957–5973, https://doi.org/10.1002/2015WR016967, 2015.
Bahmani, O. and Bayram, M.: Investigating the hydraulic conductivity and soil characteristics under compaction and soil texture and performances as landfill liner, Arab. J. Geosci., 11, 453, https://doi.org/10.1007/s12517-018-3817-7, 2018.
Batalha, M. S., Barbosa, M. C., Faybishenko, B., van Genuchten, M. T.: Effect of temporal averaging of meteorological data on predictions of groundwater recharge, J. Hydrol. Hydromech., 66, 143–152, https://doi.org/10.1515/johh-2017-0051, 2018.
Bauters, T. W. J., Steenhuis, T. S., Dicarlo, D. A., Nieber, J. L., Dekker, L. W., Ritsema, C. J., Parlange, J. Y., and Haverkamp, R.: Physics of water repellent soils, J. Hydrol., 231, 233–243, 2000.
Brooks, E. S., Boll, J., and McDaniel, P. A.: Distributed and integrated response of a geographic information system-based hydrologic model in the eastern Palouse region, Hydrol. Process., 21, 110–122, https://doi.org/10.1002/hyp.6230, 2007.
Bowden, G. J., Maier, H. R., and Dandy, G. C.: Optimal division of data for neural network models in water resources applications, Water Resour. Res., 38, 1010, https://doi.org/10.1029/2001WR000266, 2002.
Brooks, R. H. and Corey, A. T.: Hydraulic properties of porous media, Hydrology Paper 3, Colorado State University, Fort Collins, Colorado, 37 pp., 1964.
Brown, A. and Matlock, M. D.: A review of water scarcity indices and methodologies. White paper 106, University of Arkansas. The Sustainability Consortium, 26 pp., 2011.
Chen, C., Wang, E., and Yu, Q.: Modelling the effects of climate variability and water management on crop water productivity and water balance in the North China Plain, Agr. Water Manage., 97, 1175–1184, https://doi.org/10.1016/j.agwat.2008.11.012, 2010.
Chen, L., Feng, Q., Li, F., and Li, C.: A bidirectional model for simulating soil water flow and salt transport under mulched drip irrigation with saline water, Agr. Water Manage., 146, 24–33, https://doi.org/10.1016/j.agwat.2014.07.021, 2014.
Cui, T., Peeters, L., Pagendam, D., Pickett, T., Jin, H., Crosbie, R., Raiber, M., Rassam, D., and Gilfedder, M.: Emulator-enabled approximate Bayesian computation (ABC) and uncertainty analysis for computationally expensive groundwater models, J. Hydrol., 564, 191–207, https://doi.org/10.1016/j.jhydrol.2018.07.005, 2018.
Dawson, C. W., Abrahart, R. J., Shamseldin, A. Y., and Wilby, R. L.: Flood estimation at ungauged sites using artificial neural networks, J. Hydrol., 319, 391–409, https://doi.org/10.1016/j.jhydrol.2005.07.032, 2006.
DeJonge, K., Ascough, J., Andales, A., Hansen, N., Garcia, L., and Arabi, M.: Improving evapotranspiration simulations in the CERES-Maize model under limited irrigation, Agr. Water Manage., 115, 92–103, https://doi.org/10.1016/j.agwat.2012.08.013, 2012.
Falkenmark, M.: The Massive Water Scarcity Now Threatening Africa: Why Isn't It Being Addressed?, Ambio, 18, 112–118, 1989.
Flint, A. L., Flint, L. E., Kwicklis, E. M., Fabryka-Martin, J. T., and Bodvarsson, G. S.: Estimating recharge at Yucca Mountain, Nevada, USA, comparison of methods, Hydrogeol. J., 10, 180–204, https://doi.org/10.1007/s10040-001-0169-1, 2002.
Gao, X., Huo, Z., Qu, Z., Xu, X., Huang, G., and Steenhuis, T. S.: Modeling contribution of shallow groundwater to evapotranspiration and yield of maize in an arid area, Sci. Rep.-UK, 7, 43122, https://doi.org/10.1038/srep43122, 2017a.
Gao, X., Huo, Z., Bai, Y., Feng, S., Huang, G., Shi, H., and Qu, Z.: Soil salt and groundwater change in flood irrigation field and uncultivated land: a case study based on 4-year field observations, Environ. Earth Sci., 73, 2127–2139, https://doi.org/10.1007/s12665-014-3563-4, 2015.
Gao, X., Bai, Y., Huo, Z., Xu, X., Huang, G., Xia, Y., and Steenhuis, T. S.: Deficit irrigation enhances contribution of shallow groundwater to crop water consumption in arid area, Agr. Water Manage., 185, 116–125, https://doi.org/10.1016/j.agwat.2017.02.012, 2017b.
Gardner, W.: Some study-state solutions of the unsaturated moisture flow equation with application to evaporation from a water table, Soil Sci., 85, 228–232, 1958.
Gardner, W., Hillel, D., and Benyamini, Y.: Post-Irrigation Movement Soil Water 1, Redistribution, Water Resour. Res., 6, 851–860, https://doi.org/10.1029/WR006i003p00851, 1970a.
Gardner, W., Hillel, D., and Benyamini, Y.: Post-Irrigation Movement of Soil Water 2, Simultaneous Redistribution and Evaporation, Water Resour. Res., 6, 1148–1153, https://doi.org/10.1029/WR006i004p01148, 1970b.
Gleeson, T., Befus, K. M., Jasechko, S., Luijendijk, E., and Cardenas, M. B.: The global volume and distribution of modern groundwater, Nat. Geosci., 9, 161–167, https://doi.org/10.1038/NGEO2590 2016.
Guo, S., Ruan, B., Chen, H., Guan, X., Wang, S., Xu, N., and Li, Y.: Characterizing the spatiotemporal evolution of soil salinization in Hetao Irrigation District (China) using a remote sensing approach, Int. J. Remote Sens., 39, 6805–6825, https://doi.org/10.1080/01431161.2018.1466076, 2018.
Guo, Y. and Shen, Y.: Agricultural water supply/demand changes under projected future climate change in the arid region of northwestern China, J. Hydrol., 540, 257–273, https://doi.org/10.1016/j.jhydrol.2016.06.033 2016.
Gupta, S. and Larson, W.: Estimating Soil Water Retention Characteristics From Particle Size Distribution, Organic Matter Percent and Bulk Density, Water Resour. Res., 15, 1633–1635, https://doi.org/10.1029/WR015i006p01633, 1979.
Haverkamp, R. and Parlange, J.: Predicting the Water-Retention Curve from Particle-Size Distribution: 1. Sandy Soils Without Organic Matter1, Soil Sci., 142, 325–339, https://doi.org/10.1097/00010694-198612000-00001, 1986.
Hinrichsen, D. and Henrylito, D. T.: The Coming Freshwater Crisis is Already Here, Finding the Source: The Linkages Between Population and Water, Environmental Change and Security Program, Washington, DC, 26 pp., 2002.
Hoang, L., Schneiderman, E. M., Moore, K. E. B., Mukundan, R., Owens, E. M., and Steenhuis, T. S.: Predicting saturation-excess runoff distribution with a lumped hillslope model: SWAT-HS, Hydrol. Process., 31, 2226–2243, https://doi.org/10.1002/hyp.11179, 2017.
Hodnett, M. and Bell, J.: Soil moisture investigations of groundwater recharge through black cotton soils in Madhya Pradesh, India, Hydrolog. Sci. J., 31, 361–381, https://doi.org/10.1080/02626668609491054, 1986.
Huang, Q., Xu, X., Lu, L., Ren, D., Ke, J., Xiong, Y., Huo, Z., and Huang, G.: Soil salinity distribution based on remote sensing and its effect on crop growth in Hetao Irrigation District, Transactions of the Chinese Society of Agricultural Engineering, 34, 102–109, 2018.
Jakeman, A. J., Letcher, R. A., and Norton, J. P.: Ten iterative steps in development and evaluation of environmental models, Environ Modell Softw., 21, 602–614, https://doi.org/10.1016/j.envsoft.2006.01.004, 2006.
Jasechko, S. and Taylor, R. G.: Intensive rainfall recharges tropical groundwaters, Environ. Res. Lett., 10, 124015, https://doi.org/10.1088/1748-9326/10/12/124015, 2015.
Jia, H., Wang, J., Cao, C., Pan, D., and Shi, P.: Maize drought disaster risk assessment of China based on EPIC model, Int. J. Dig. Earth., 5, 488–515, https://doi.org/10.1080/17538947.2011.590535, 2012.
Kahlown, M., Ashraf, M., and Zia-Ul-Haq.: Effect of shallow groundwater table on crop water requirements and crop yields, Agr. Water Manage., 76, 24–35, https://doi.org/10.1016/j.agwat.2005.01.005, 2005.
Katerji, N., van Hoorn, J. W., Hamdy, A., and Mastrorilli, M.: Salinity effect on crop development and yield, analysis of salt tolerance according to several classification methods, Agr. Water Manage., 62, 37–66, https://doi.org/10.1016/S0378-3774(03)00005-2, 2003.
Kendy, E., Gérard-Marchant, P., Walter, M. T., Zhang, Y., Liu, C., and Steenhuis, T. S.: A soil-water-balance approach to quantify groundwater recharge from irrigated cropland in the North China Plain, Hydrol. Process., 17, 2011–2031, https://doi.org/10.1002/hyp.1240, 2003.
Kirchner, J. W.: Getting the right answers for the right reasons: Linkingmeasurements, analyses, and models to advance the science of hydrology, Water Resour. Res., 42, W03S04, https://doi.org/10.1029/2005WR004362, 2006.
Krause, P., Boyle, D. P., and Bäse, F.: Comparison of different efficiency criteria for hydrological model assessment, Adv. Geosci., 5, 89–97, https://doi.org/10.5194/adgeo-5-89-2005, 2005.
Langevin, C. D., Hughes, J. D., Banta, E. R., Niswonger, R. G., Panday, S., and Provost, A. M.: Documentation for the MODFLOW 6 Groundwater Flow Model: U.S. Geological Survey Techniques and Methods, book 6, chap. A55, p. 197, https://doi.org/10.3133/tm6A55, 2017.
Li, C., Yang, Z., and Wang, X.: Trends of Annual Natural Runoff in the Yellow River Basin. Water Int., 29, 447–454, https://doi.org/10.1080/02508060408691807, 2004.
Li, X., Zhao, Y., Xiao, W., Yang, M., Shen, Y., and Min, L.: Soil moisture dynamics and implications for irrigation of farmland with a deep groundwater table, Agr. Water Manage., 192, 138–148, https://doi.org/10.1016/j.agwat.2017.07.003, 2017.
Liu, Z., Chen, H., Huo, Z., Wang, F., and Shock, C. C.: Analysis of the contribution of groundwater to evapotranspiration in an arid irrigation district with shallow water table, Agr. Water Manage., 171, 131–141, https://doi.org/10.1016/j.agwat.2016.04.002, 2016.
Luan, X., Wu, P., Sun, S., Wang, Y., and Gao, X.: Quantitative study of the crop production water footprint using the SWAT model, Ecol. Indic., 89, 1–10, https://doi.org/10.1016/j.ecolind.2018.01.046, 2018.
Luo, Y. and Sophocleous, M.: Seasonal groundwater contribution to crop-water use assessed with lysimeter observations and model simulations, J. Hydrol, 389, 325–335, https://doi.org/10.1016/j.jhydrol.2010.06.011, 2010.
Ma, Y., Feng, S., and Song, X.: A root zone model for estimating soil water balance and crop yield responsesto deficit irrigation in the North China Plain, Agr. Water Manage., 127, 13–24, https://doi.org/10.1016/j.agwat.2013.05.011, 2013.
Matott, L. S. and Rabideau, A. J.: Calibration of complex subsurface reaction models using a surrogate-model approach, Adv. Water Resour., 31, 1697–1707, 2008.
Mccuen, R., Rawls, W., and Brakensiek, D.: Statistical Analysis of the Brooks-Corey and the Green-Ampt Parameters, Water Resour. Res., 17, 1005–1013, https://doi.org/10.1029/WR017i004p01005, 1981.
Mcdonald, M. and Harbaugh, A.: The history of MODFLOW, Groundwater, 41, 280–283, https://doi.org/10.1111/j.1745-6584.2003.tb02591.x, 2003.
Moges, M., Schmitter, P., Tilahun, S., Langan, S., Dagnew, D., Akale, A., and Steenhuis, T. S.: Suitability of Watershed Models to Predict Distributed Hydrologic Response in the Awramba Watershed in Lake Tana Basin, Land Degrad. Dev., 10, 1386–1397, https://doi.org/10.1002/ldr.2608, 2017.
Moiwo, J. P., Lu, W., Zhao, Y., Yang, Y., and Yang, Y.: Impact of land use on distributed hydrological processes in the semi-arid wetland ecosystem of Western Jilin, Hydrol. Process., 24, 492–503, https://doi.org/10.1002/hyp.7503, 2010.
Moriasi, D. N., Arnold, J. G., Van Liew, M. W., Bingner, R. L., and Harmel, R. D.: Model evaluation guidelines for systematic quantification of accuracy in watershed simulations, T. ASABE., 50, 885–900, 2007.
Nash, J. E. and Sutcliffe, J. V.: River flow forecasting through conceptual models part I – a discussion of principles, J. Hydrol., 10, 282–290, 1970.
Oki, T. and Kanae, S.: Global Hydrological Cycles and World Water Resources, Science, 313, 1068–1072, https://doi.org/10.1126/science.1128845, 2006.
Razavi, S., Tolson, B. A., and Burn, D. H.: Review of surrogate modeling in water resources, Water Resour. Res., 48, W07401, https://doi.org/10.1029/2011WR011527, 2012a.
Razavi, S., Tolson, B. A., and Burn, D. H.: Numerical assessment of metamodelling strategies in computationally intensive optimization, Environ. Modell. Softw., 34, 67–86, https://doi.org/10.1016/j.envsoft.2011.09.010, 2012b.
Ren, D., Xu, X., Hao, Y., and Huang, G.: Modeling and assessing field irrigation water use in a canal system of Hetao, upper Yellow River basin: Application to maize, sunflower and watermelon, J. Hydrol., 532, 122–139, https://doi.org/10.1016/j.jhydrol.2015.11.040, 2016.
Ren, D., Xu, X., Engel, B., and Huang, G.: Growth responses of crops and natural vegetation to irrigation and water table changes in an agro-ecosystem of Hetao, upper Yellow River basin: Scenario analysis on maize, sunflower, watermelon and tamarisk, Agr. Water Manage., 199, 93–104, https://doi.org/10.1016/j.agwat.2017.12.021, 2018.
Ren, D., Xu, X., Engel, B., Huang, Q., Xiong, Y., Huo Z., and Huang, G.: Hydrological complexities in irrigated agro-ecosystems with fragmented land cover types and shallow groundwater: Insights from a distributed hydrological modeling method, Agr. Water Manage., 213, 868–881, https://doi.org/10.1016/j.agwat.2018.12.011, 2019.
Renewable internal freshwater resources per capita (cubic meters), available at: https://data.worldbank.org/indicator/ER.H2O.INTR.PC, last access: 2019.
Ritter, A., and Muñoz-Carpena, R.: Performance evaluation of hydrological models: Statistical significance for reducing subjectivity in goodness-of-fit assessments, J. Hydrol., 480, 33–45, https://doi.org/10.1016/j.jhydrol.2012.12.004, 2013.
Rodriguez-Iturbe, I.: Ecohydrology: A hydrologic perspective of climate-soil-vegetation dynamics, Water Resour. Res., 36, 3–9, https://doi.org/10.1029/1999WR900210, 2000.
Rosa, R. D., Paredes, P., Rodrigues, G. C., Alves, I., Fernando, R. M., Pereira, L. S., and Allen, R. G.: Implementing the dual crop coefficient approach in interactive software, 1. Background and computational strategy, Agr. Water Manage., 103, 8–24, https://doi.org/10.1016/j.agwat.2011.10.013, 2012.
Saleh, A., Steenhuis, T. S., and Walter, M.: Groundwater table simulation under different rice irrigation practices, J. Irrig. Drain. Eng., 115, 530–544, https://doi.org/10.1061/(ASCE)0733-9437(1989)115:4(530), 1989.
Sau, F., Boote, K., Bostick, W., Jones, J., and Minguez, M.: Testing and improving evapotranspiration and soil water balance of the DSSAT crop models, Agron. J., 96, 1243–1257, https://doi.org/10.2134/agronj2004.1243, 2004.
Šimůnek, J., Šejna, M., and van Genuchten, M. T.: The HYDRUS-1D software package for simulating the one-dimensional movement of water, heat, and multiple solutes in variably-saturated media. Version 2.0, IGWMC-TPS-70, Int. Groundwater Modeling Ctr., Colorado Schoolof Mines, Golden, 1998.
Singh, L. K., Jha, M. K., and Pandey, M.: Framework for Standardizing Less Data-Intensive Methods of Reference Evapotranspiration Estimation, Water Resour. Manag., 32, 4159–4175, https://doi.org/10.1007/s11269-018-2022-5, 2018.
Sun, S., Wu, P., Wang, Y., Zhao, X., Liu, J., and Zhang, X.: The impacts of interannual climate variability and agricultural inputs on water footprint of crop production in an irrigation district of China, Sci. Total Environ., 444, 498–507, https://doi.org/10.1016/j.scitotenv.2012.12.016, 2013.
Talebizadeh, M., Moriasi, D., Gowda, P., Steiner, J. L., Tadesse, H. K., Nelson, A. M., and Starks, P.: Simultaneous calibration of evapotranspiration and crop yield in agronomic system modeling using the APEX model, Agr. Water Manage., 208, 299–306, https://doi.org/10.1016/j.agwat.2018.06.043, 2018.
Todini, E.: Hydrological catchment modelling: past, present and future, Hydrol. Earth Syst. Sci., 11, 468–482, https://doi.org/10.5194/hess-11-468-2007, 2007.
van Dam, J. C., Huygen, J., Wesseling, J. G., Feddes, R. A., Kabat, P., van Walsum, P. E. V., Groenendijk, P., van Diepen, C. A.: Theory of SWAP version 2.0, Simulation of water flow, solute transport and plant growth in the soil-water-atmosphere-plant environment, Report 71, Deparment Water Resources, Wageningen Agricultural University, Technical document 45, DLO Winand Staring Centre, Wageningen, 152 pp., 1997.
van Genuchten, M. T.: A Closed-form Equation for Predicting the Hydraulic Conductivity of Unsaturated Soils, Soil Sci. Soc. Am. J., 44, 892–898, https://doi.org/10.2136/sssaj1980.03615995004400050002x, 1980.
Venkatesh, B., Lakshman, N., Purandara, B. K., and Reddy, V. B.: Analysis of observed soil moisture patterns under different land covers in Western Ghats, India, J. Hydrol, 397, 281–294, https://doi.org/10.1016/j.jhydrol.2010.12.006, 2011.
Wang, E. and Smith, C. J.: Modelling the growth and water uptake function of plant root systems: a review, Aust. J. Agr. Res., 55, 501, https://doi.org/10.1071/AR03201, 2004.
Wang, H., Zhang, L., Dawes, W. R., and Liu, C.: Improving water use efficiency of irrigated crops in the North China Plain – measurements and modelling, Agr. Water Manage., 48, 151–167, https://doi.org/10.1016/S0378-3774(00)00118-9, 2001.
Wang, X., Huo, Z., Guan, H., Guo, P., and Qu, Z.: Drip irrigation enhances shallow groundwater contribution to crop water consumption in an arid area, Hydrol. Process., 32, 747–758, https://doi.org/10.1002/hyp.11451, 2018.
Williams, J., Prebble, R., Williams, W., and Hignett, C.: The influence of texture, structure and clay mineralogy on the soil moisture characteristic, Aust. J. Soil Res., 21, 15–32, https://doi.org/10.1071/SR9830015, 1983.
Williams, J., Jones, C., Kiniry, J., and Spanel, D.: The EPIC Crop Growth Model, T. ASAE, 32, 479–511, 1989.
Xu, X., Huang, G., Qu, Z., and Pereira, L. S.: Assessing the groundwater dynamics and impacts of water saving in the Hetao Irrigation District, Yellow River basin, Agr. Water Manage., 98, 301–313, https://doi.org/10.1016/j.agwat.2010.08.025, 2010.
Xu, X., Huang, G., Zhan, H., Qu, Z., and Huang, Q.: Integration of SWAP and MODFLOW-2000 for modeling groundwater dynamics in shallow water table areas, J. Hydrol., 412, 170–181, https://doi.org/10.1016/j.jhydrol.2011.07.002, 2012.
Xu, X., Sun, C., Qu, Z., Huang, Q., Ramos, T. B., and Huang, G.: Groundwater Recharge and Capillary Rise in Irrigated Areas of the Upper Yellow River Basin Assessed by an Agro-Hydrological Model, Irrig. Drain., 64, 587–599, https://doi.org/10.1002/ird.1928, 2015.
Xue, J., Huo, Z., Wang, F., Kang, S., and Huang, G.: Untangling the effects of shallow groundwater and deficit irrigation on irrigation water productivity in arid region: New conceptual model, Sci. Total Environ., 619-620, https://doi.org/10.1016/j.scitotenv.2017.11.145, 2018.
Xue, J. and Ren, L.: Assessing water productivity in the Hetao Irrigation District in Inner Mongolia by an agro-hydrological model, Irrigation Sci., 35, 357–382, https://doi.org/10.1007/s00271-017-0542-z, 2017.
Yang, X., Chen, Y., Pacenka, S., Gao, W., Ma, L., Wang, G., Yan, P., Sui, P., and Steenhuis, T. S.: Effect of diversified crop rotations on groundwater levels and crop water productivity in the North China Plain, J. Hydrol., 522, 428–438, https://doi.org/10.1016/j.jhydrol.2015.01.010, 2015a.
Yang, X., Chen, Y., Pacenka, S., Gao, W., Zhang, M., Sui, P., and Steenhuis, T. S.: Recharge and Groundwater Use in the North China Plain for Six Irrigated Crops for an Eleven Year Period, Plos One, 10, e0115269, https://doi.org/10.1371/journal.pone.0115269, 2015b.
Yang, X., Chen, Y., Steenhuis, T. S., Pacenka, S., Gao, W., Ma, L., Zhang, M., and Sui, P.: Mitigating Groundwater Depletion in North China Plain with Cropping System that Alternate Deep and Shallow Rooted Crops, Front. Plant Sci., 8, 980, https://doi.org/10.3389/fpls.2017.00980, 2017.
Yang, J., Lei, H., Yang, D., Huang, M., Liu, D., and Yuan X.: Impact of vegetation dynamics on hydrological processes in a semi-arid basin by using a land surface-hydrology coupled model, J. Hydrol., 551, 116–131, https://doi.org/10.1016/j.jhydrol.2017.05.060, 2017.
Yang, F., Zhang, G., Yin, X., Liu, Z., and Huang, Z.: Study on capillary rise from shallow groundwater and critical water table depth of a saline-sodic soil in western Songnen plain of China, Environ. Earth Sci., 64, 2119–2126, https://doi.org/10.1007/s12665-011-1038-4, 2011.
Yeh, P. J. and Famiglietti, J. S.: Regional Groundwater Evapotranspiration in Illinois, J. Hydrometeorol., 10, 464–478, https://doi.org/10.1175/2008JHM1018.1, 2009.
Young, P. C. and Ratto, M.: Statistical Emulation of Large Linear Dynamic Models, Technometrics, 53, 29–43, https://doi.org/10.1198/TECH.2010.07151, 2011.
Zammouri, M.: Case Study of Water Table Evaporation at Ichkeul Marshes (Tunisia), J. Irrig. Drain. Eng., 127, 265–271, https://doi.org/10.1061/(ASCE)0733-9437(2001)127:5(265), 2001.


