the Creative Commons Attribution 4.0 License.
the Creative Commons Attribution 4.0 License.
 | 19 Jul 2019
Spatiotemporal changes in aridity of Pakistan during 1901–2016
Kamal Ahmed
Shamsuddin Shahid
Xiaojun Wang
Nadeem Nawaz
Najeebullah Khan
The changing characteristics of aridity over a larger spatiotemporal scale have gained interest in recent years due to climate change. The long-term (1901–2016) changes in spatiotemporal patterns of annual and seasonal aridity during two major crop growing seasons of Pakistan, Kharif and Rabi, are evaluated in this study using gridded precipitation and potential evapotranspiration (PET) data. The UNESCO aridity index was used to estimate aridity at each grid point for all the years between 1901 and 2016. The temporal changes in aridity and its associations with precipitation and PET are evaluated by implementing a moving window of 50 years of data with an 11-year interval. The modified Mann–Kendall (MMK) trend test is applied to estimate unidirectional change by eliminating the effect of natural variability of climate, and Pettitt's test is used to detect year of change in aridity. The results revealed that the climate over 60 % of Pakistan (mainly in southern parts) is arid. The spatial patterns of aridity trends show a strong influence of the changes in precipitation on the aridity trend. The increasing trend in aridity (drier) is noticed in the southwest, where precipitation is low during Kharif, while there is a decreasing trend (wetter) in the Rabi season in the region which receives high precipitation due to western disturbances. The annual and Kharif aridity is found to decrease (wetter) at a rate of 0.0001 to 0.0002 per year in the northeast, while Kharif and Rabi aridity are found to increase (drier) at some locations in the south at a rate of −0.0019 to −0.0001 per year. The spatial patterns of aridity changes show a shift from arid to the semi-arid (wetter) climate in annual and Kharif over a large area while showing a shift from arid to hyper-arid (drier) region during Rabi in a small area. Most of the significant changes in precipitation and aridity are observed in the years between 1971 and 1980. Overall, aridity is found to increase (drier) in 0.52 %, 4.44 % and 0.52 % of the area and decrease (wetter) in 11.75 %, 7.57 % and 9.66 % of the area for annual, Rabi and Kharif seasons respectively during 1967–2016 relative to 1901–1950.
- Article
(6474 KB) - Full-text XML
- BibTeX
- EndNote


More than 20 % of the global population is living in arid regions under the threat of severe consequences of climate change, particularly due to increasing hydrological extremes (Alazard et al., 2015). The temporal variability and spatial distribution of precipitation and other hydrological phenomena have significantly changed with the increase in global temperature (Kousari et al., 2014). Changes in precipitation have caused more hydrological extremes such as floods or droughts. The ecosystems of arid and semi-arid climates are sensitive to minor changes in climate (Ahmed et al., 2018). These regions are also characterized by very complex hydrological systems due to high variability in precipitation, which often exhibits extreme behaviors, such as flash floods caused by extreme precipitation and extended droughts due to a prolonged dry spell (Buytaert et al., 2012). The droughts are projected to become more frequent and severe in arid regions due to an increase in aridity (Nam et al., 2015), as reported in Iran (Tabari et al., 2012), Serbia (Hrnjak et al., 2014), Turkey (Selek et al., 2018), Iraq (Şarlak and Agha, 2018), India (Ramarao et al., 2018) and China (Liu et al., 2018a), among others. Climate models projected an increase in the range of 11 % to 23 % by 2100 in global arid and semi-arid climate area, which will expand aridification in different parts of the globe (Huang et al., 2016).
Pakistan, located in South Asia, has a complex terrain with limited water resources. Several attempts have been made to classify the aridity and climate of Pakistan based on different climate variables and methods (Bharuqha and Shanbhag, 1956; Oliver et al., 1978; Shamshad, 1988; Chaudhry and Rasul, 2004; Hussain and Lee, 2009; Zahid and Rasul, 2011; Sarfaraz, 2014; Sarfaraz et al., 2014; Haider and Adnan, 2014). Bharuqha and Shanbhag (1956) classified the climate of a station (Hyderabad) based on the fraction of precipitation to evaporation for the period 1926–1940 and found that Hyderabad has an arid (desert) climate. Oliver et al. (1978) applied a clustering approach for climate classification using meteorological data from 53 stations. The results of the study showed that Pakistan has nine climate regimes, where most of the area falls under arid climate. Chaudhry and Rasul (2004) used Thornthwaite's precipitation effectiveness index (PEI) for the estimation of annual and seasonal aridity for the period 1961–1990 using temperature data of 50 stations. The results showed that around 75 % of the land has an arid climate, while only a small area in the northeastern plain has a sub-humid climate. Hussain and Lee (2009) classified the climate using factor and cluster analysis, utilizing 26 years (1980–2006) of rainfall and temperature records of 32 stations. The study concluded that the land of Pakistan could be divided into six regions based on the topology of the country. Haider and Adnan (2014) used several aridity indices (the de Martonne aridity index, Erinç aridity index, Thornthwaite's PEI, UNESCO aridity index and Thornthwaite moisture index) to classify the climate of Pakistan based on records of 54 stations for the period 1961–2009. Their study reported that around 75 % to 85 % of the land of the country belongs to the arid climate and less than 10 % of land in the north belongs to the humid climate. Sarfaraz (2014) used principal component analysis for the subregional classification of Pakistan's winter precipitation using data from 35 stations from 1976 to 2005 and reported six subregions of winter precipitation in Pakistan. Sarfaraz et al. (2014) used the Köppen classification to classify the climate based on data from 59 stations for the period 1981 to 2010 and showed that 75 % of the country has arid to semi-arid climate. Recently, Nabeel and Athar (2018) classified the climate based on wet and dry spells using data from 46 stations for the period 1976–2007. They reported that 66 % of the country belongs to the arid climate while only 4 % belongs to the humid climate. Even though several studies have been conducted for the classification of climate using aridity indices, there is still no comprehensive study for assessing the long-term trends in the aridity of Pakistan in different seasons (annual, Kharif and Rabi). Furthermore, no study has been conducted to determine the impacts of climate change on aridity, particularly the influence of different climate variables like precipitation, temperature and potential evapotranspiration on aridity in different seasons.
Both an increasing and decreasing trend in aridity have been reported in different regions of the world due to climate change. Several studies reported an increase in aridity on global (Dai, 2013; Trenberth et al., 2014) and regional (Ramarao et al., 2018; Jiao et al., 2016) scales. On the other hand, decrease in aridity is also reported in the USA (Finkel et al., 2016), China (Yin et al., 2018) and some regions of Iran (Tabari and Talaee, 2013). In recent years, an increase in aridity in some regions of Pakistan has been reported (Haider and Adnan, 2014). However, it was just anticipation based on the assumption that rising temperature intensifies potential evapotranspiration (PET) and thus increases aridity. The magnitude of temperature rises and the changes in the regional precipitation pattern determines the changes in the aridity of an area. Therefore, assessing the changes in aridity on the regional scale considering the changes in both temperature and precipitation due to global warming is required.
Several studies suggest that rising temperature and changing precipitation in Pakistan are due to global warming. Recently, Pakistan experienced several temperature extremes in the form of scorching heatwaves that resulted in significant fatalities. Additionally, the prolonged spell of droughts due to lack of seasonal precipitation has caused enormous economic damages. The annual maximum temperature in the country is increasing at a rate of 0.17–0.29 ∘C per decade (Khan et al., 2018), while the precipitation is reported to increase in the north and decrease in the south at a rate of −4 to 4 mm yr−1 in the last 50 years (Ahmed et al., 2017). The variations in temperature and precipitation patterns are also reported in different climatic and cropping seasons (Iqbal et al., 2016). The rising temperature has intensified the evaporation, which in turn has caused water losses from major water reservoirs, thus causing water scarcity. In this context, assessing the changing characteristics of precipitation and PET over the manifold topography and climate of Pakistan is very important. As the characteristics of precipitation, PET and aridity change with season and time, it is also imperative to evaluate their changing patterns for different periods and seasons.
The main objective of the present study is to evaluate the changing characteristics of aridity based on precipitation and PET annually and in two distinct cropping seasons (Rabi and Kharif) of Pakistan. Several aridity indices are available for the classification of aridity, such as the de Martonne aridity index (de Martonne, 1926), Thornthwaite aridity index (Thornthwaite, 1931), Erinç aridity index (Erinç, 1965) and UNESCO aridity index (UNESCO, 1979). Among all the aridity indices, the UNESCO aridity index, which considers the effect of precipitation and PET for the classification of climate, is most widely used (Zarch et al., 2017). The long-term (1901–2016) gauge-based gridded precipitation and PET datasets are analyzed by implementing a moving window of 50 years of data with an 11-year interval. The modified Mann–Kendall (MMK) trend is used to evaluate the significance of changes estimated using Sen's slope estimator, and Pettitt's test is used to identify the year of change in aridity and climate. It is expected that the use of the MMK test would provide the changes in aridity due to global warming by eliminating the effect of natural variability of climate, which appeared to be a long-term autocorrelation in time series. The procedures presented in this study can be used for the assessment of the changing characteristics of aridity and the identification of the factors that drives the changes which can help to understand the possible shift in the climatology of an area that results from climate change. The findings of the study can be helpful for Pakistan in planning adaptation measures and adjusting cropping patterns to ensure sustainability in agriculture.
2.1 Description of the study area
Pakistan, located in South Asia, shares borders with India in the east, China in the north, and Iran and Afghanistan in the west and shares the long coastline with the Arabian Sea in the south (Fig. 1). Around 80 % of the land is characterized by an arid to semi-arid climate, where precipitation is less and temperature is high (Khatoon and Ali, 2004). The topography of the country varies widely, from plain lands in the south to high mountainous ranges in the north. The large variations in topography from 0 to 8552 m a.m.s.l. cause a large variation in the climate in the country.
Rabi and Kharif are the two major cropping seasons of Pakistan (Chaudhry and Rasul, 2004). The Rabi season commences in November and finishes in May, while the Kharif season starts in April and finishes in October (Nabeel and Athar, 2018). Besides cropping seasons, there are two major rainy seasons, i.e., winter and monsoon, which coincide with the Rabi and Kharif season. Winter precipitation, which begins in December and lasts until March, is important for Rabi crops, while monsoon precipitation, which begins in June and lasts until September, is important for Kharif crops. Winter precipitation occurs due to the moist wind from the Mediterranean Sea in the west and north of Pakistan (Hussain and Lee, 2014). On the other hand, monsoon precipitation occurs due to the moist wind from the Bay of Bengal, which contributes 60 % of the total precipitation of the country (Sheikh, 2001). The agricultural economy and the livelihood of farmers, constituting 43 % of the total population of Pakistan, depend on winter and monsoon precipitation (Ahmed et al., 2018a).
The precipitation in both seasons varies widely in time and space (Ullah et al., 2018b). The mean annual precipitation in Rabi is 119 mm yr−1 and is 191 mm yr−1 in Kharif. The precipitation varies from 10 to 700 mm from the southwest to the north during Rabi and 11 to 900 mm from the southwest to the north near the foothills of the Himalaya during Kharif. Most of the country receives precipitation less than <100 mm in Rabi and <190 mm in Kharif (Ahmed et al., 2018a).
The Rabi and Kharif have contrasting temperatures due to their coincidence with winter and summer respectively (Ullah et al., 2018a). The annual average temperature is 14 ∘C during Rabi and 26 ∘C in Kharif (Khan et al., 2018). The average temperature in around 10 % of the country (the northwest and far north) goes below zero during Rabi, while it goes above 30 ∘C in 45 % of the area during Kharif. The overall temperature varies from −12 to 23 ∘C in Rabi and 1.9 to 33 ∘C in Kharif (Ahmed et al., 2018a).
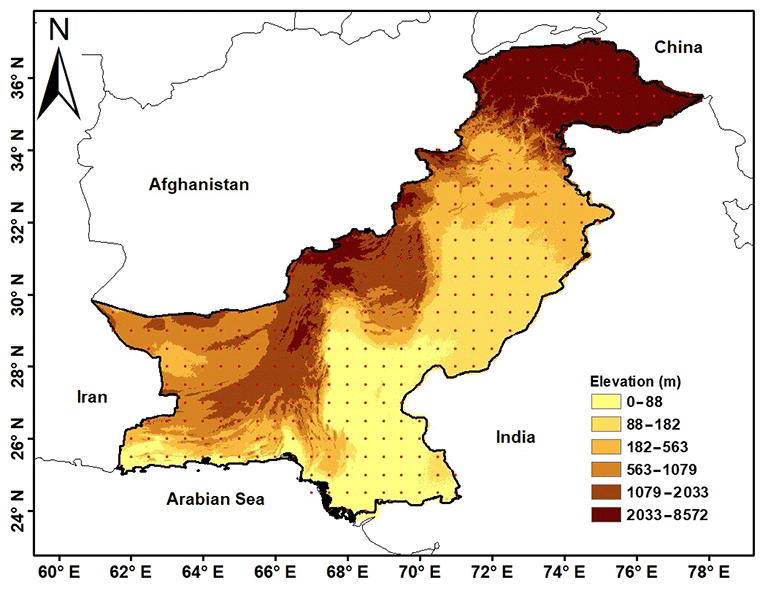
Figure 1Geographic location and topography of Pakistan. The locations of precipitation and potential evapotranspiration data extraction are presented using dots.
2.2 Datasets
The gauge-based gridded climate data are widely used as a proxy of observed precipitation and PET data around the world (Shiru et al., 2018). Over the last 2 decades, several gauge-based gridded datasets have been developed and applied for different purposes (Li et al., 2014). Among them, the datasets of Global Precipitation Climatology Centre (GPCC; Schneider et al., 2013; https://dwd.de/EN/ourservices/gpcc/gpcc.html, last access: 3 August 2018) and Climatic Research Unit (CRU; Harris et al., 2014) of the University of East Anglia (http://www.cru.uea.ac.uk/, last access: 3 August 2018) are the most popular due to their spatial and temporal continuity (Kishore et al., 2015). Thus, GPCC precipitation and CRU PET data are used in the present study. The GPCC and CRU data have several advantages that make the products superior to others. Both the datasets are developed by considering relatively a large number of in situ data (Schneider et al., 2014; Harris et al., 2014). Besides this, these datasets are available at high spatial resolution () and longer period (1901 to 2016), which helps in better understanding the changes in climate (Spinoni et al., 2014). Furthermore, an extensive quality control procedure was followed during the development of GPCC and CRU data which has made them more reliable compared to other products (Sun et al., 2014). Additionally, a robust interpolation technique was used in the development of GPCC (Spheremap spatial interpolation) and CRU (Thin plate smoothing splines interpolation; Becker et al., 2013; New et al., 2002). Several studies revealed better agreement of GPCC and CRU data with station records of Pakistan (Adnan and Ullah, 2015; Asmat et al., 2017). The precipitation and PET data are extracted from 350 grid points for the period 1901–2016 to cover entire Pakistan.
The procedure used for the assessment of the changes in the characteristics of aridity in Pakistan is outlined below:
-
The aridity is estimated as the ratio of precipitation to PET at each GPCC–CRU grid point for all the years during 1901–2016. The aridity values are estimated separately for annual, Rabi and Kharif seasons.
-
Sen's slope estimator is used to estimate the rate of change in precipitation, PET and aridity in annual, Rabi and Kharif seasons for the period 1901–2016.
-
The MMK trend test is used to evaluate the significance of the change in precipitation, PET and aridity for all the seasons.
-
The influence of precipitation and PET on aridity is assessed for different 50-year windows with an interval of 11 years over the period 1901–2016.
-
The shift in the aridity from one aridity class to another between two periods, 1901–1950 and 1967–2016, is mapped to assess the changes in areal extent of different arid classes.
-
Pettitt's test is used to detect the change points in aridity, precipitation and PET in Pakistan.
3.1 Aridity index
The aridity index (AI) is often used to quantify the long-term climatic conditions of an area (Ashraf et al., 2014). Several definitions of aridity can be found in the literature, which are derived using different climate variables like precipitation, temperature and PET (Zarch et al., 2017). Among them, the AI definition of UNESCO (1979) as a ratio of precipitation to PET is most widely used (UNEP, 1992). The precipitation and PET data are averaged for a year or a season to estimate the AI. The AI categorized climate of an area into five classes: hyper-arid (AI<0.03), arid (), semi-arid (), sub-humid () and humid (AI≥0.75). In other words, a higher value of the AI indicates wetter conditions, while a lower value of the AI indicates drier conditions.
Various methods are available in the literature to estimate PET. Among them, the Thornthwaite (Thornthwaite, 1948) and Penman–Monteith (Monteith, 1965) methods are the most widely used. The Penman–Monteith method was adopted in UNESCO (1979), while the Thornthwaite method was adopted in United Nations Environment Programme (UNEP) (1992) for defining aridity. The Thornthwaite method is preferred over the Penman–Monteith method in data-scarce regions (Zarch et al., 2015). However, the Penman–Monteith method provides a better estimation compared to other approaches (Tukimat et al., 2012). Thus, CRU PET data estimated using the Penman–Monteith method are used in the present study.
3.2 Sen's slope estimator
Sen's slope estimator (Sen, 1968) is a non-parametric method which is widely used for robust estimation of change over a period (Yue et al., 2002; Khan et al., 2018). In this method, the rate of change in data between two consecutive times is first estimated for the whole series. The median of all the consecutive changes in data series is then determined to show the rate of change for the whole period. The slope between two data points is calculated as follows:
where Q is the slope between two data points xj and xk estimated at time j and k. The median of all Q values estimated for both the two consecutive data points in the time series is the Sen's slope, which gives a measure of change for the whole period.
3.3 Modified Mann–Kendall (MMK) test
In the MMK test (Hamed, 2008), the significance in the trend is first computed by applying the classical MK test. The MK test statistics (S) for time series with n data points can be calculated as
where xi and xj are sequential data and Sign(xi−xj) is calculated as below:
The standardized test static (μ1) is then calculated from the variance of S as
The null hypothesis on no trend is rejected at a confidence interval of 95 % if |μ1|>1.96. The MMK test is conducted when the null hypothesis of no trend is rejected. For this purpose, the existing trend in time series data is removed, and the data are ranked. The equivalent normal variants of ranked data (Ri) are calculated as
where ϕ−1 is the inverse standard normal distribution function. The Hurst coefficient (H) is estimated by maximizing the log-likelihood function. If H is found to be significant, the biased variance of S is calculated as
where ρ is the auto-correlation function for a given H. The unbiased estimate V(S)H is calculated as
where B is a function of H as below:
where the coefficients a0, a1, a2, a3 and a4 are the functions of the sample size n, which can be found in Hamed (2008). The significance of the MMK test is computed by using V(S)H in place of V(S) in Eq. (4).
3.4 Relationship of aridity trends with precipitation and PET
The relationships of precipitation and PET with aridity are assessed using a moving window of 50 years with an 11-year interval over the study period, i.e., 1901–1950, 1912–1961, 1923–1972, 1934–1983, 1945–1994, 1956–2005 and 1967–2016. The main purpose of considering a 50-year window is for deciphering the changing pattern in the relationship over the study period. The 11-year interval was considered to assess the relationship for the whole period (1901–2016).
3.5 Pettitt test
The point of change in time series is detected using the Pettitt test (Pettitt, 1979). This non-parametric test allows identification of the point at which any significant shift occurred in the time series. The test relies on Mann–Whitney statistic Ut,N, where the two samples, x1…xt and xt+1…xn, are tested to confirm whether they are from the same population or not. The Mann–Whitney statistic Ut,N is calculated as below:
and
The test statistic (KN) calculates the number of times where the first sample exceeds the second. The change point is detected when the estimated value exceeds the test statistics (KN), which can be calculated as below:
4.1 Spatial patterns of precipitation and PET
The spatial patterns in annual and seasonal precipitation and PET for 1901–2016 are shown in Fig. 2. Precipitation values are grouped into seven classes using a natural break algorithm available in ArcGIS 10.3 to show the spatial distribution. Figure 2a shows that mean annual precipitation varies from 38 mm in the south to 2390 mm in the north of Pakistan. The annual average precipitation in the north ranges from 1278 to 2390 mm, while it ranges between 38 and 158 in the southwest and some areas in the southeast. The precipitation in the Rabi and Kharif seasons is presented as a percentage of annual precipitation in Fig. 2b and c respectively. The Rabi season coincides with the winter precipitation which enters Pakistan from the west; therefore, Rabi precipitation contributes more than 80 % of annual precipitation in the southwest, while it contributes less than 20 % in the southeast (Fig. 2b). The Kharif season coincides with the monsoon that mostly enters from the northeast of Pakistan. Therefore, the eastern part of the country receives more rainfall in Kharif (60 % to >80 % of annual precipitation; Fig. 2c). Overall, the average annual and seasonal precipitations are high in the north, low in the southeast during Rabi and low in the southwest during Kharif.
Figure 2d depicts the spatial distribution of average annual PET. The PET is relatively high in the south and low in the north. The southwestern and southeastern corners showed the highest PET, ranging from 2100 to 2529 mm. The Rabi and Kharif PET as a percentage of annual PET is presented in Fig. 2e and f respectively. Like the annual trend, the PET in Rabi and Kharif shows more or less similar distributions. In Rabi, PET is low (<30 %) in the north and high (>45 %) in the south, while the spatial distribution of PET during Kharif is opposite to Rabi. Relatively lower PET in Rabi indicates the influence of winter (low temperature), while higher PET in Kharif is due to its coincidence with summer, when the temperature usually is high in most of the country.
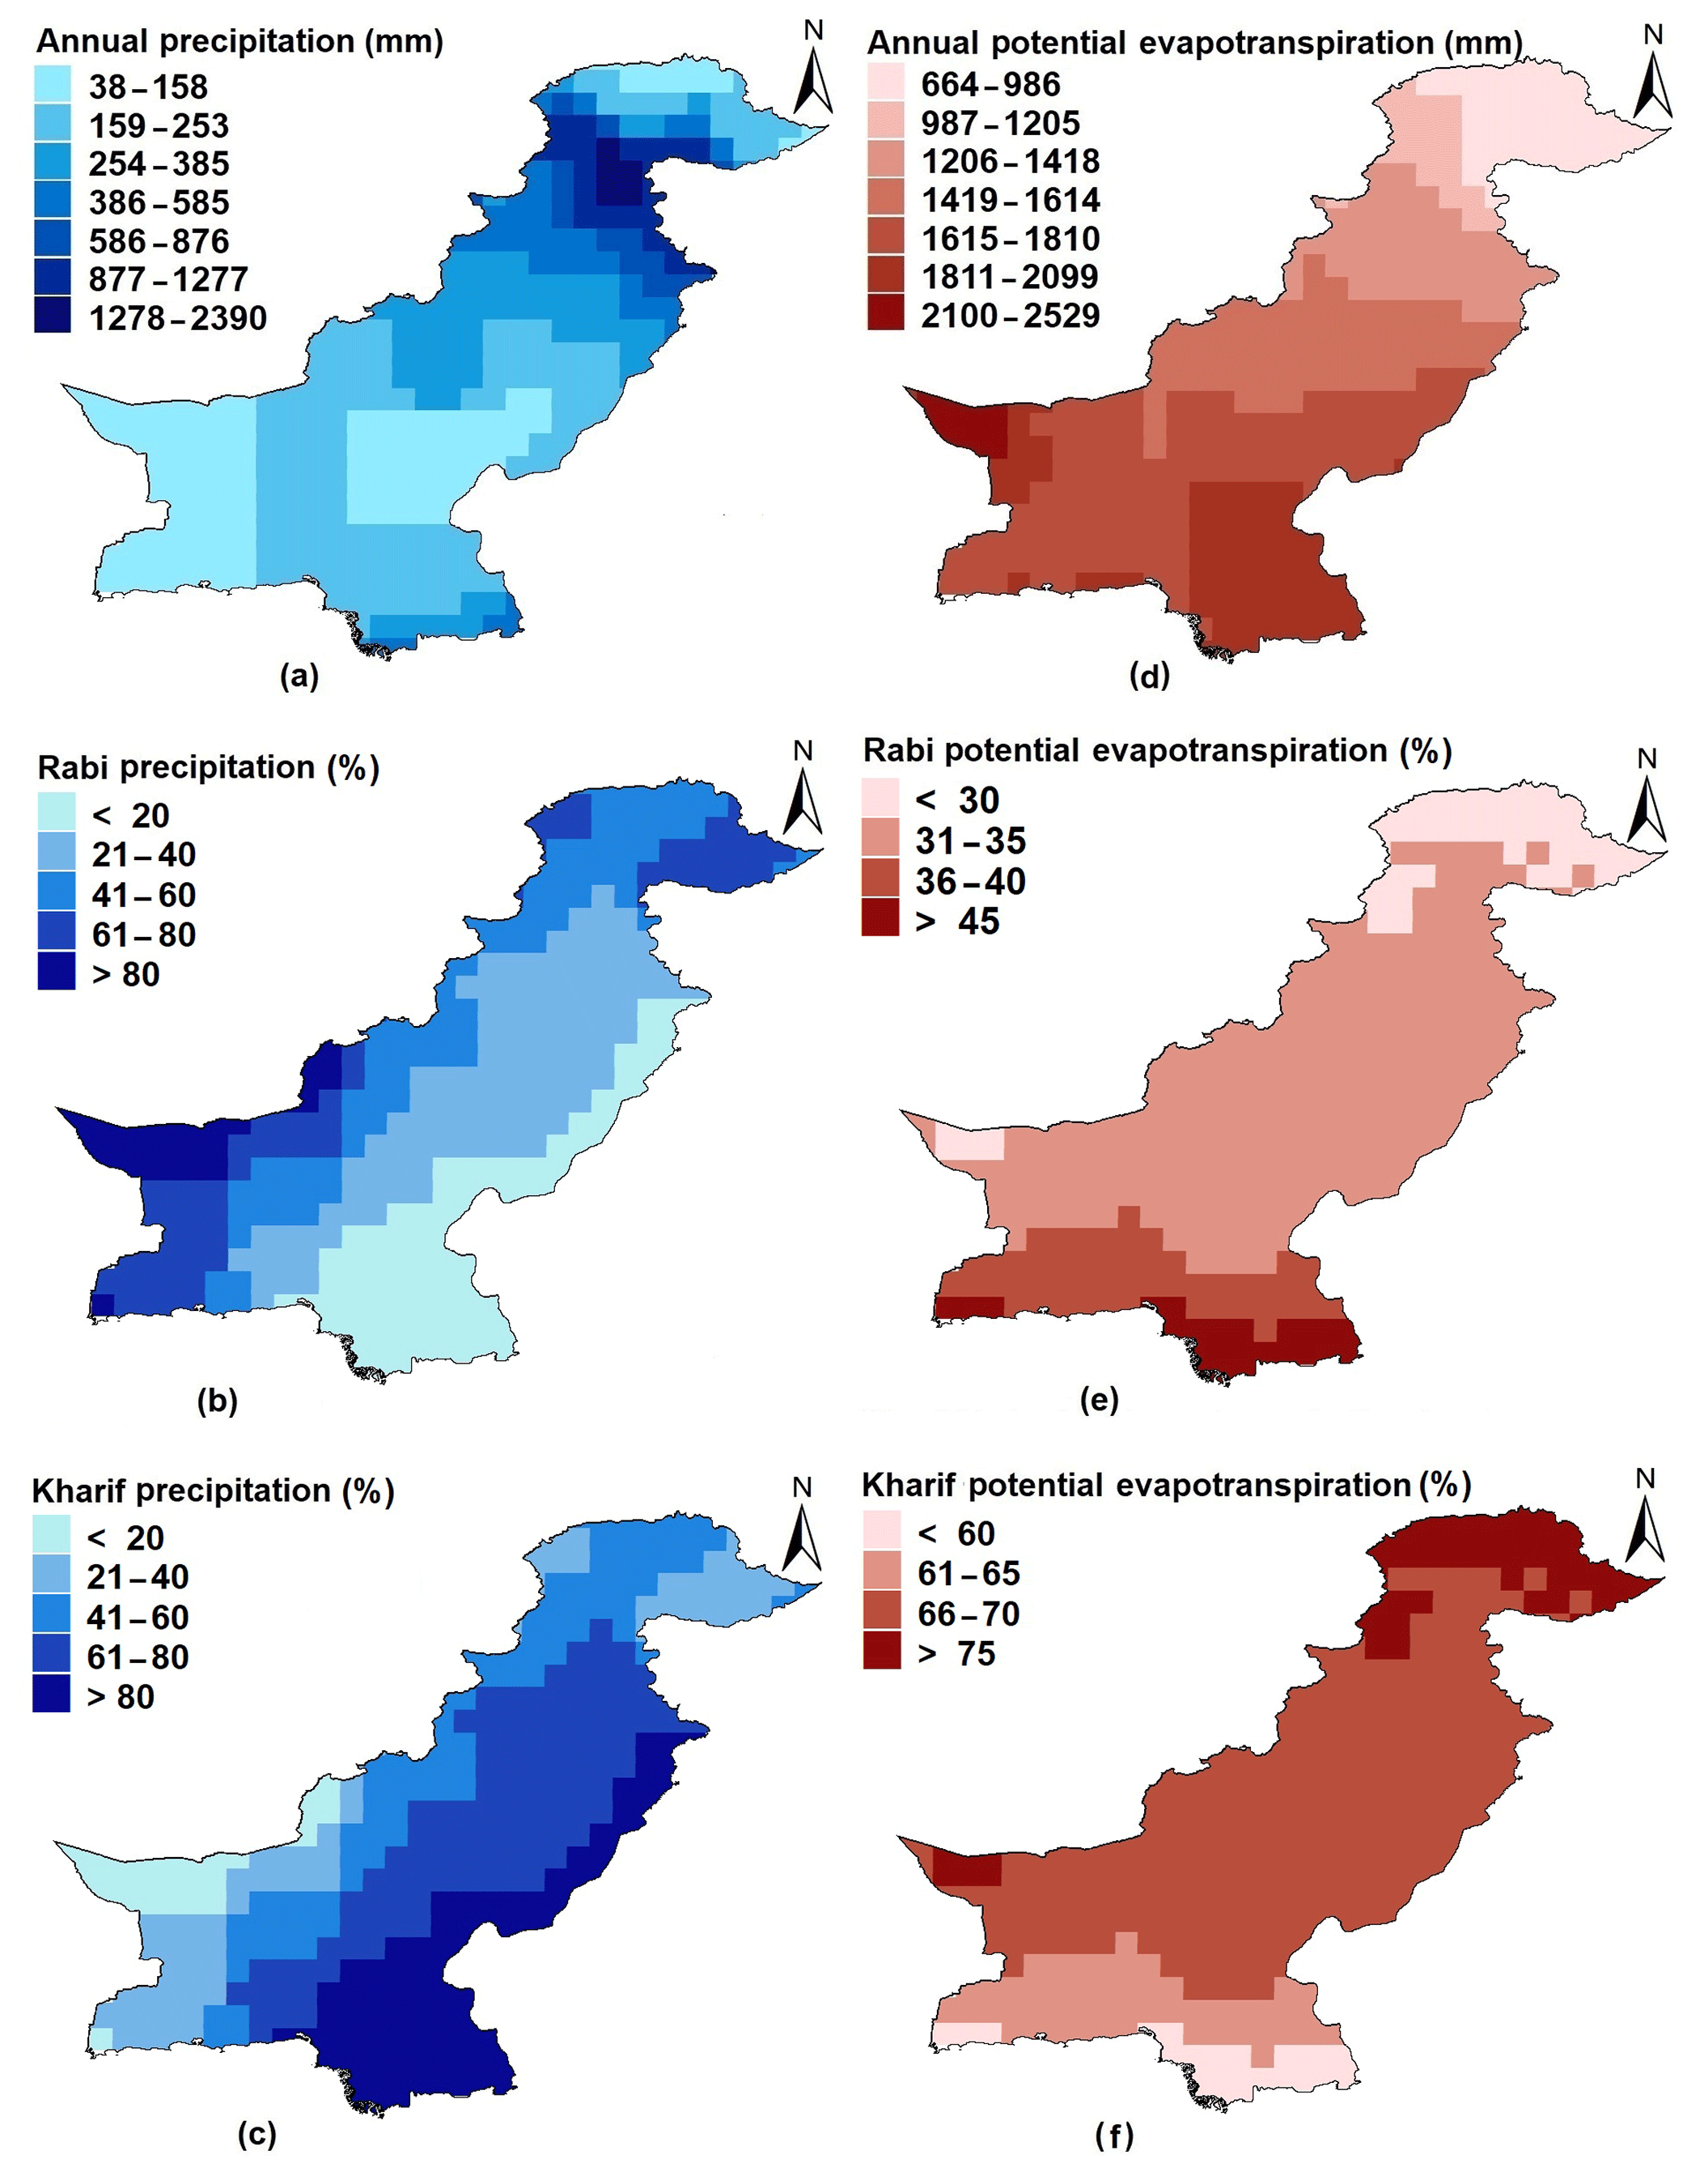
Figure 2Spatial distribution of (a) annual, (b) Rabi, and (c) Kharif precipitation as well as (d) annual, (e) Rabi and (f) Kharif potential evapotranspiration in Pakistan.
4.2 Spatial pattern of annual and seasonal aridity
The AI values are classified as hyper-arid, arid, semi-arid, sub-humid and humid based on the UNESCO classification to show the spatial distribution of annual and seasonal aridity in Pakistan (Fig. 3). The annual aridity over Pakistan for the period 1901–2016 (Fig. 3a) reveals an arid climate in most of the country (61 %), followed by a semi-arid (21 %) and humid (11 %) climate. The arid climate covers a larger area in the south and a small area at the top north. The sub-humid and humid climate dominates near the foothills of the Himalaya, where precipitation is high. On the other hand, the climate in a small area (2 %) in the southwest is found to be hyper-arid, where PET is high and precipitation is very low.
Figure 3b shows the spatial patterns of aridity during Rabi. Cold winds bring precipitation from the Mediterranean Sea during Rabi season which enters the country from the southwest, and therefore, aridity in Rabi is notably less in the southwest. The percentage of the area belongs to semi-arid, sub-humid and humid climate increases during Rabi, which indicates a decrease in aridity over a major portion of the country. However, the area that belongs to the hyper-aridity climate (9 %) increases in the southeast during Rabi. Besides this, the aridity in the top north reduces and the humid climate zone near the foothills of the Himalaya increases.
The spatial distribution of aridity during Kharif is presented in Fig. 3c. Most of the country is characterized by an arid climate (59 %), followed by a semi-arid (20 %) and hyper-arid (9 %) climate. The area belonging to the hyper-arid climate in the southwest increases during Kharif due to the lack of precipitation in the west during this season. On the other hand, aridity reduces in the southeast due to monsoon precipitation. The area in the top north and near the foothills of the Himalaya, which are characterized as semi-arid, also reduces, which could result from an increase in PET. Overall, figures show that the climate in more than 70 % of the country is arid to semi-arid. The aridity varies with the season due to the occurrences, and dominance of precipitation is different in different seasons. In general, the southern region of the country is characterized by the arid climate and the north is predominantly sub-humid to humid.
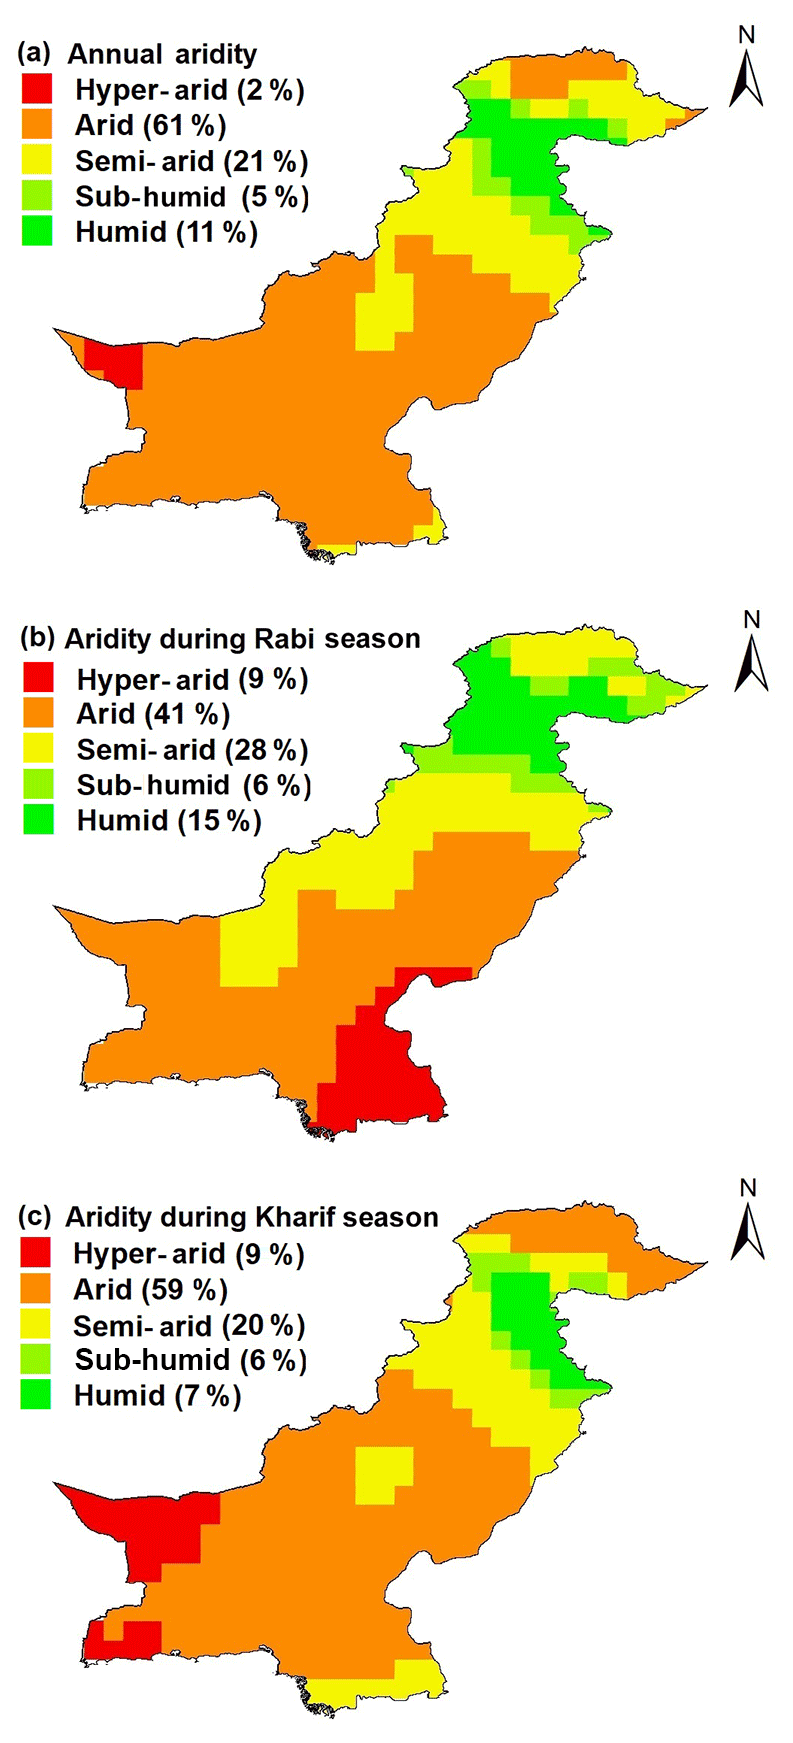
Figure 3Spatial distribution of aridity for (a) annual, (b) Rabi and (c) Kharif precipitation in Pakistan.
4.3 Spatial pattern in the trends of precipitation and PET
Sen's slope is used to assess the magnitude of change in precipitation and PET for all the seasons at all the 350 grid points over Pakistan to prepare the corresponding maps as shown in Figs. 4 to 6. The significance increasing and decreasing trends estimated using MMK test at the 95 % level of confidence are presented using the plus (+) and minus (−) signs in the figures. The increase in precipitation indicates a wetter condition, and the decrease indicates a drier condition, while an increase in PET indicates a drier and decrease a wetter condition. Figure 4a shows that annual precipitation is increasing significantly over a large area in the northeast and at a few places in the far north, while it is decreasing significantly at a few places in the south and three locations near the foothills of the Himalaya. It is worth to mention that precipitation is decreasing at a few locations near the foothills of the Himalaya, where precipitation is highest in Pakistan (Fig. 2a). The spatial distributions of the trends in annual PET are shown in Fig. 4b. The annual PET in Pakistan is increasing (high evaporation rates) in the southeast corner and decreasing (low evaporation rates) at a few grid points scattered in the center and northwestern parts, where precipitation is usually high and the temperature is low.
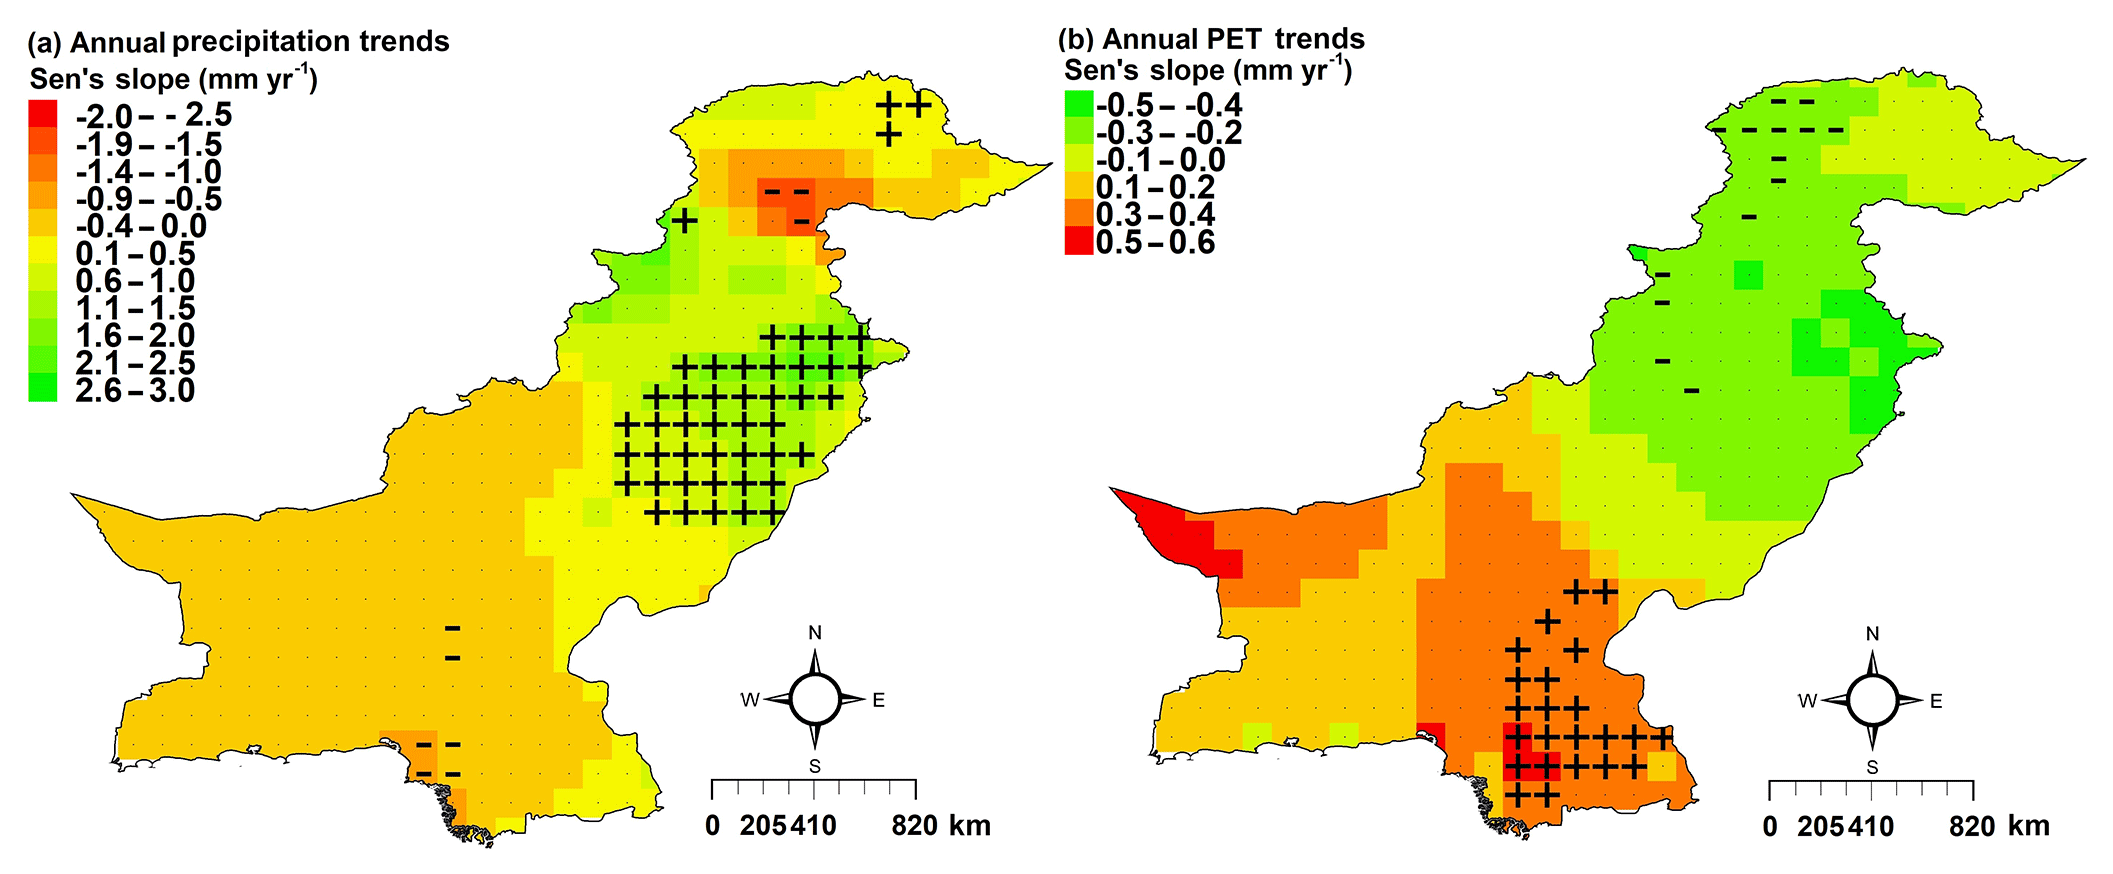
Figure 4Spatial distribution of the trends in annual (a) precipitation and (b) PET in Pakistan, estimated using modified Mann–Kendall (MMK) test. The plus (+) and minus (−) sign indicates increasing and decreasing trend at 95 % confidence level respectively.
Figure 5a shows the spatial patterns in the trend of Rabi precipitation. The precipitation during Rabi is found to increase significantly at a few grid points in the north and two grid points in the east while decreasing significantly at two locations in the south. It can be observed that there is a non-significant decreasing tendency in Rabi precipitation over a large area in the south. The PET in Rabi (Fig. 5b) is found to increase significantly (high evaporation rates) over a large area in the southeast and the southwest, while it is not found to decrease significantly at any location.
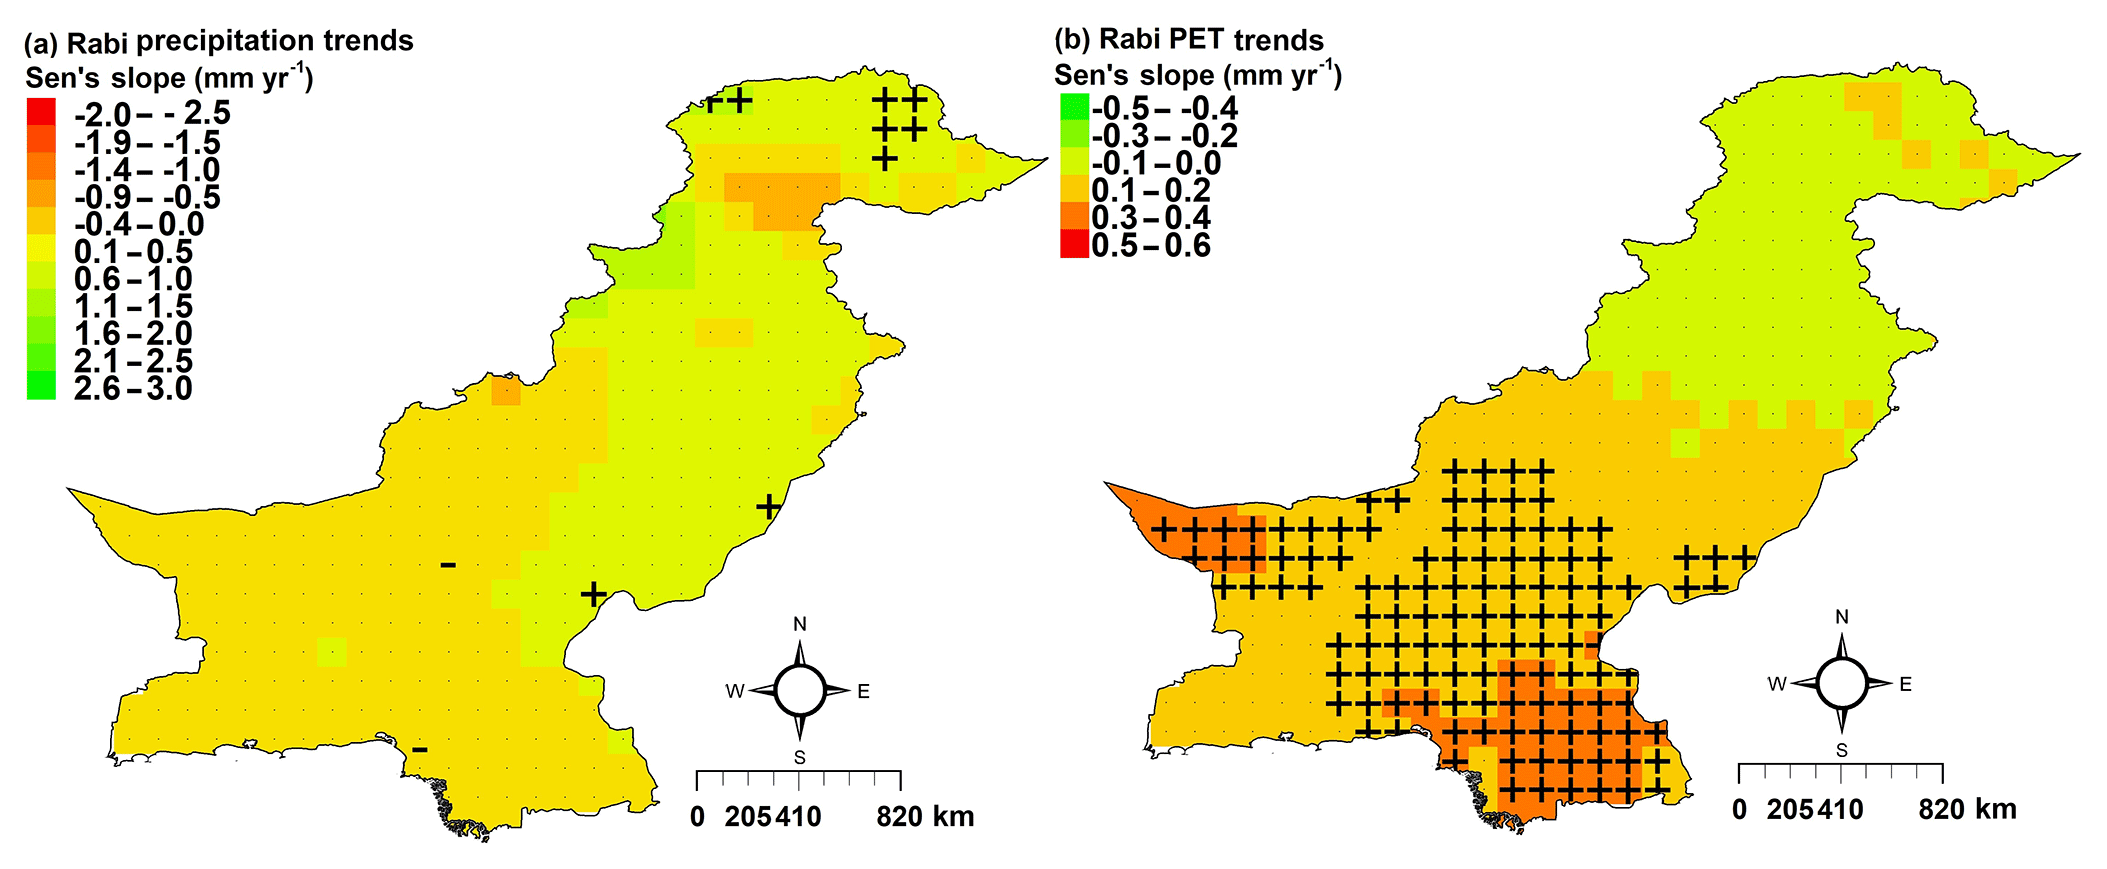
Figure 5Spatial distribution of the trends in Rabi (a) precipitation and (b) PET in Pakistan, estimated using modified Mann–Kendall (MMK) test. The plus (+) and minus (−) sign indicates increasing and decreasing trend at 95 % confidence level respectively.
The Kharif precipitation (Fig. 6a) is found to increase significantly in the northeast and at two grid points in the north. The significant decreasing trend in Kharif precipitation is also observed over a large area in the southwest and at a few grid points near the foothills of the Himalaya. Overall, the spatial patterns in annual and Kharif precipitation trends are found very similar. The spatial distribution of PET trends in Kharif is displayed in Fig. 6b. The figure shows a significant decrease in PET over a large area in the northeast and a decrease at two grid points in the south.
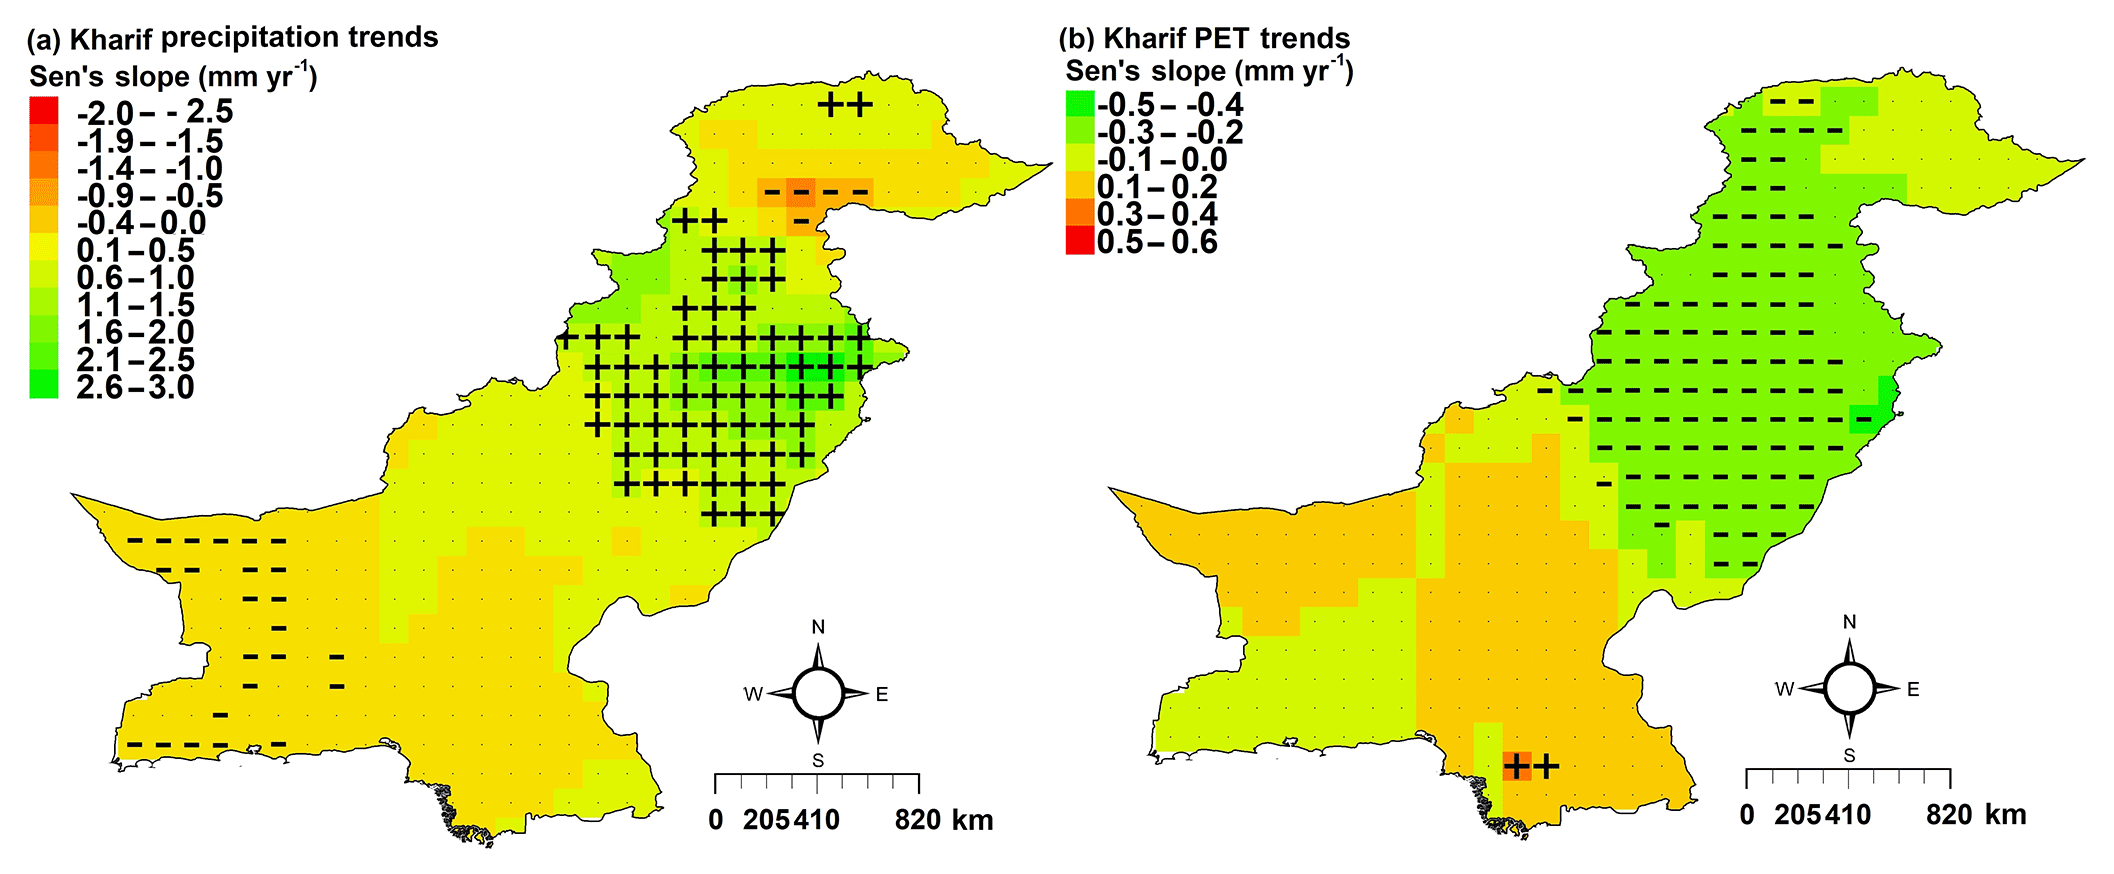
Figure 6Spatial distribution of the trends in Kharif (a) precipitation and (b) PET in Pakistan, estimated using modified Mann–Kendall (MMK) test. The plus (+) and minus (−) sign indicates increasing and decreasing trend at 95 % confidence level respectively.
4.4 Spatial pattern in the trends of annual and seasonal aridity
Sen's slope method was used to estimate the changes in aridity values calculated using UNESCO method, and the MMK test was used to determine the significance of the change at 95 % level of confidence. The changes in the aridity index are found in the range of −0.0039 to 0.0060 for Pakistan (Fig. 7). The values were divided into five classes using a natural break algorithm available in ArcGIS 10.3. The plus sign in the figure indicates a significant reduction in aridity (wetter condition), while the minus sign indicates a significant increase in aridity (drier condition). Figure 7a shows that the mean annual aridity has a significant wetter trend over a large area in the northeast and a significant drier trend at a few locations in the south. The aridity trends in Rabi (Fig. 7b) show a significant drier trend in the southwest, at two grid points in the center and in the south. Significant wetter conditions during Rabi are also observed at a few grid points in the north. The aridity trend in Kharif (Fig. 7c) is found to follow similar patterns to the annual aridity trend. A significant wetter trend is noticed over a major area in the northeast and at a few grid points in the north, while a drier trend is noticed at few locations in the southwest and southern corner of the country. Overall, the results reveal a wetter trend over a major portion in the northeast and a drier trend at a few locations in the southwest.
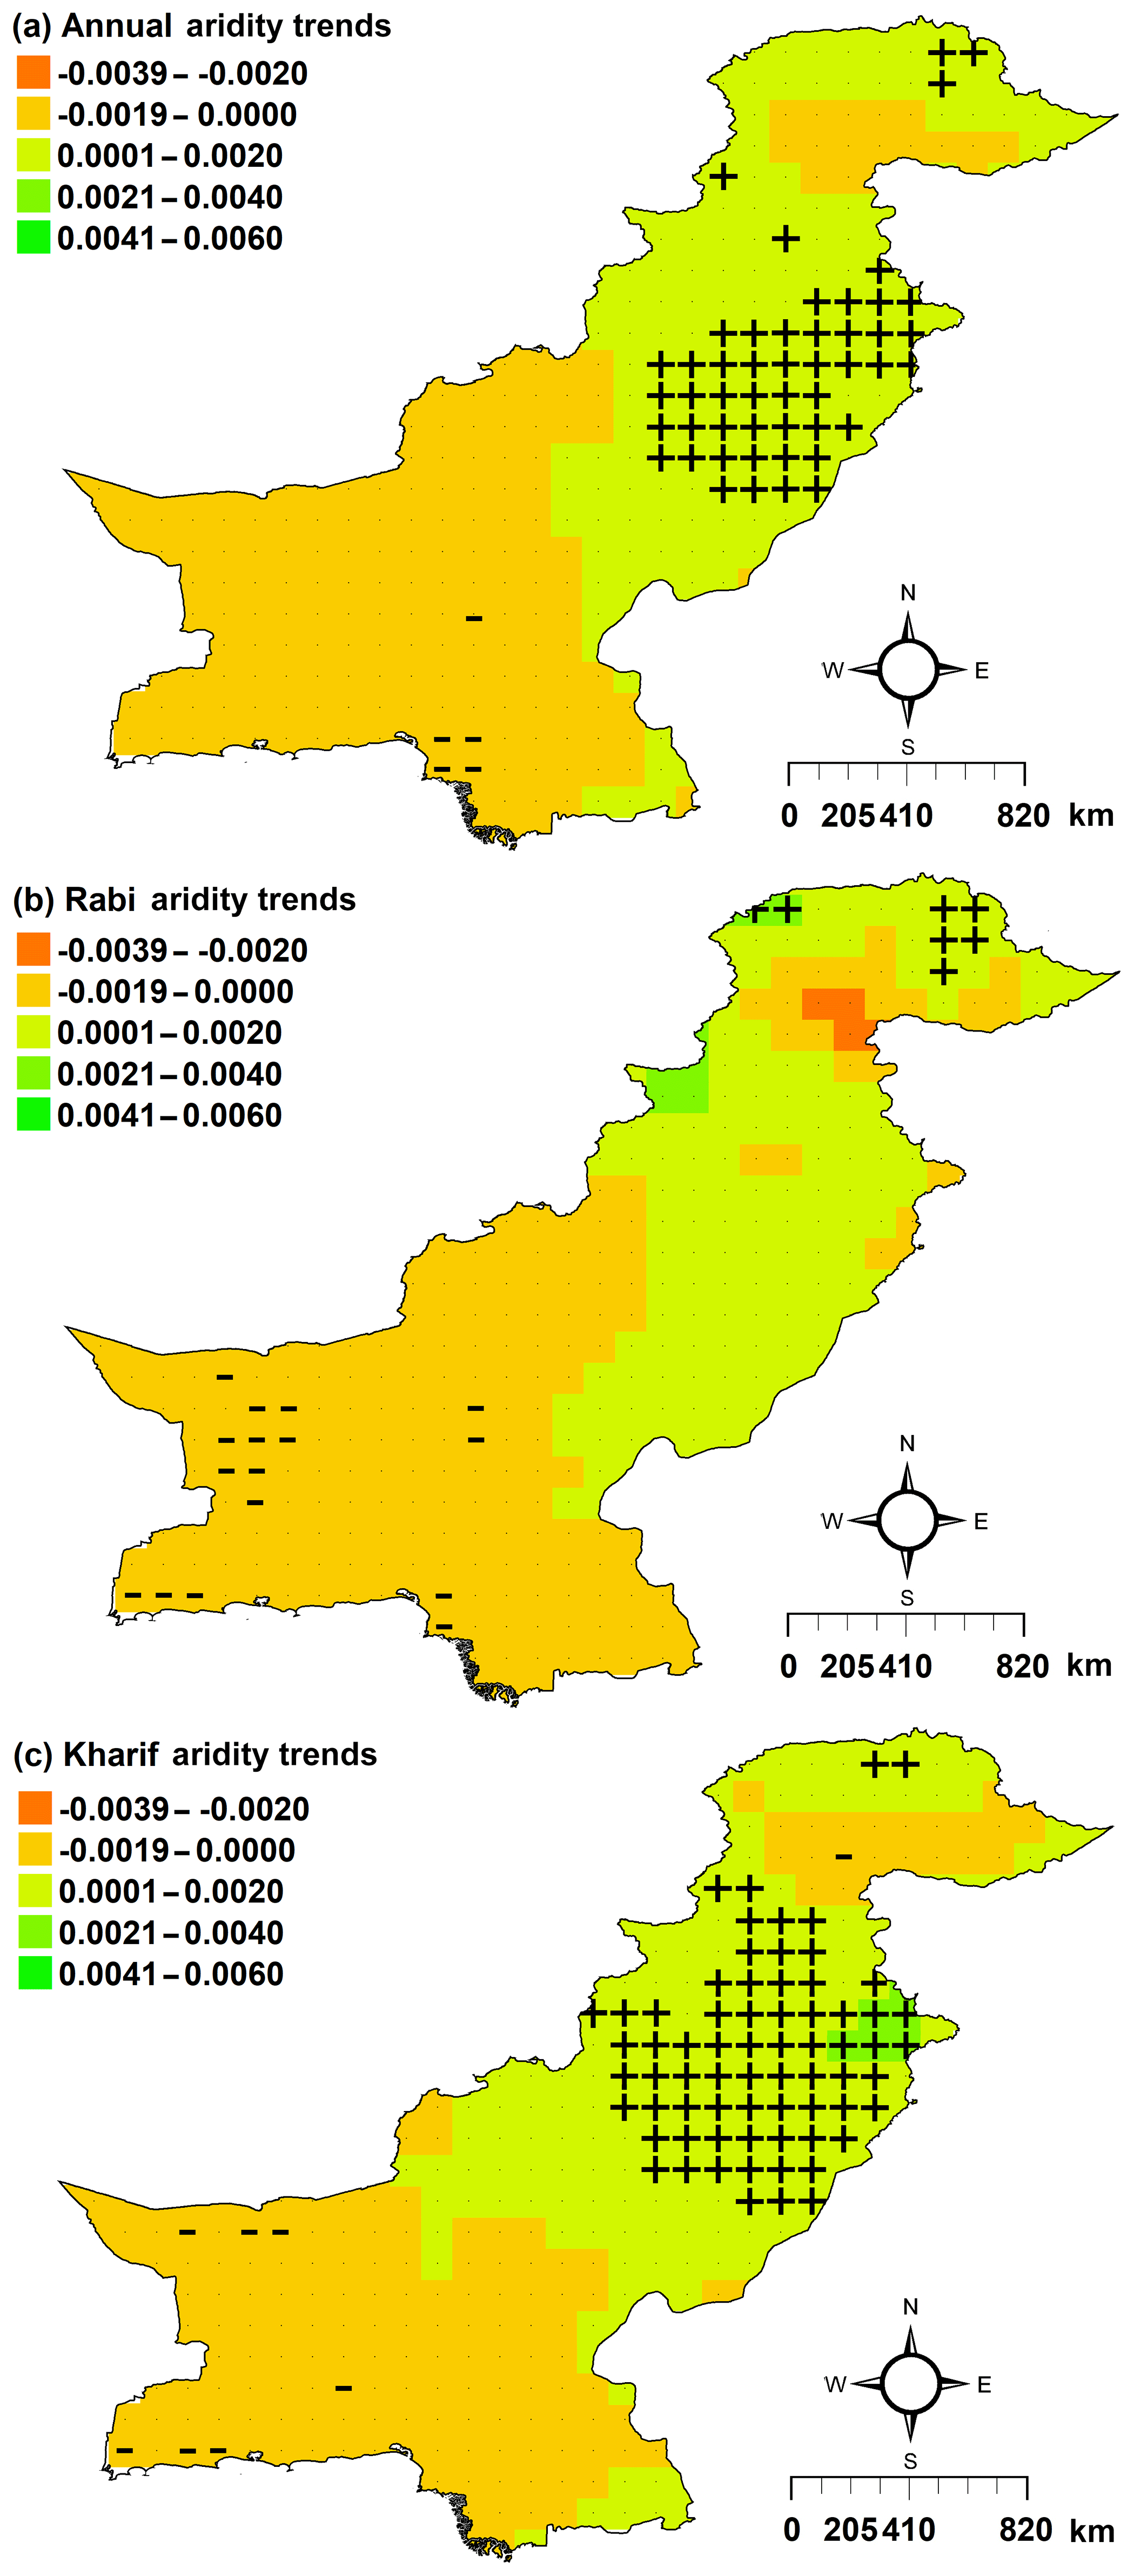
Figure 7Spatial distribution of the trends in (a) annual, (b) Rabi and (c) Kharif aridity over Pakistan, estimated using modified Mann–Kendall (MMK) test. The plus (+) and minus (−) sign indicates increasing and decreasing trend at 95 % confidence level respectively.
4.5 Time-varying trends in areal extent of aridity
A moving window of 50 years with an 11-year interval over the period 1901–2016 is used to assess the time-varying trends in aridity, precipitation and PET. The major purpose was to understand the influence of precipitation and PET on aridity in different periods. The obtained results are presented in Figs. 8 and 9. The figures show a higher influence of precipitation on aridity compared to temperature. For instance, a reduction in precipitation at 80 grid points caused an increase in aridity at 77 grid points in 1923–1972. On the other hand, a decrease in PET at 150 grid points was the reason for a reduction of aridity at 40 grid points during 1934–1983 (Fig. 8). Similar results are also noticed for Rabi and Kharif seasons (Fig. 9). Therefore, it can be stated that the changes in precipitation have a higher impact compared to PET in determining the aridity of Pakistan.
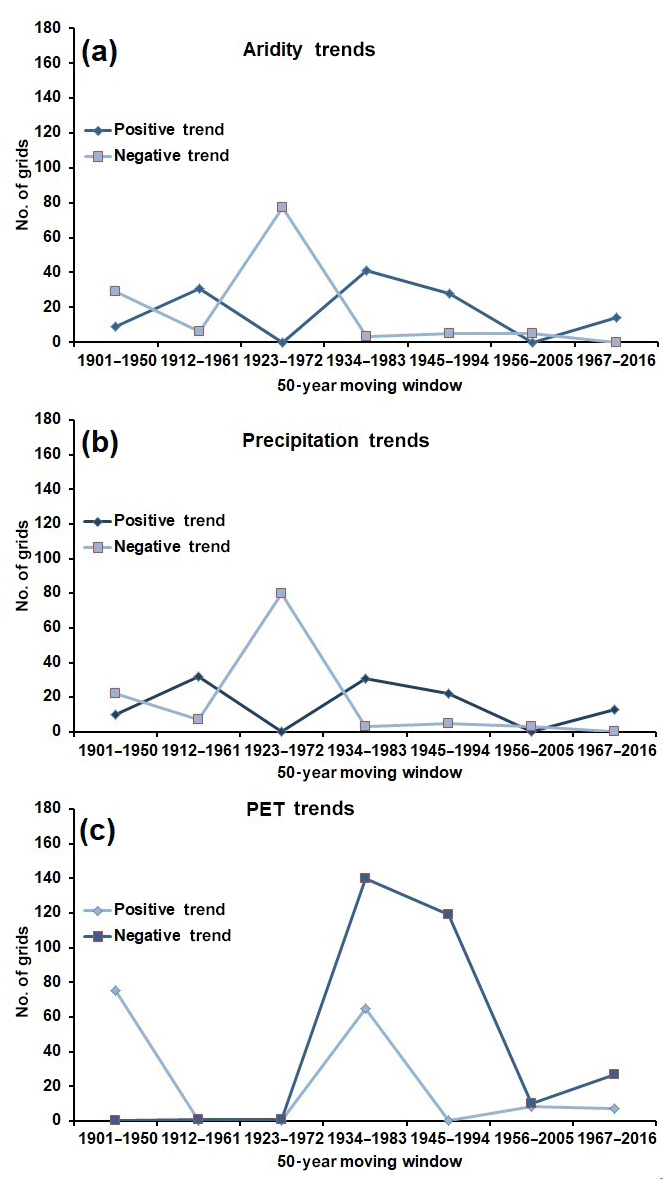
Figure 8Number of grids where annual aridity, precipitation and PET changed significantly during different periods.
4.6 The shift in aridity
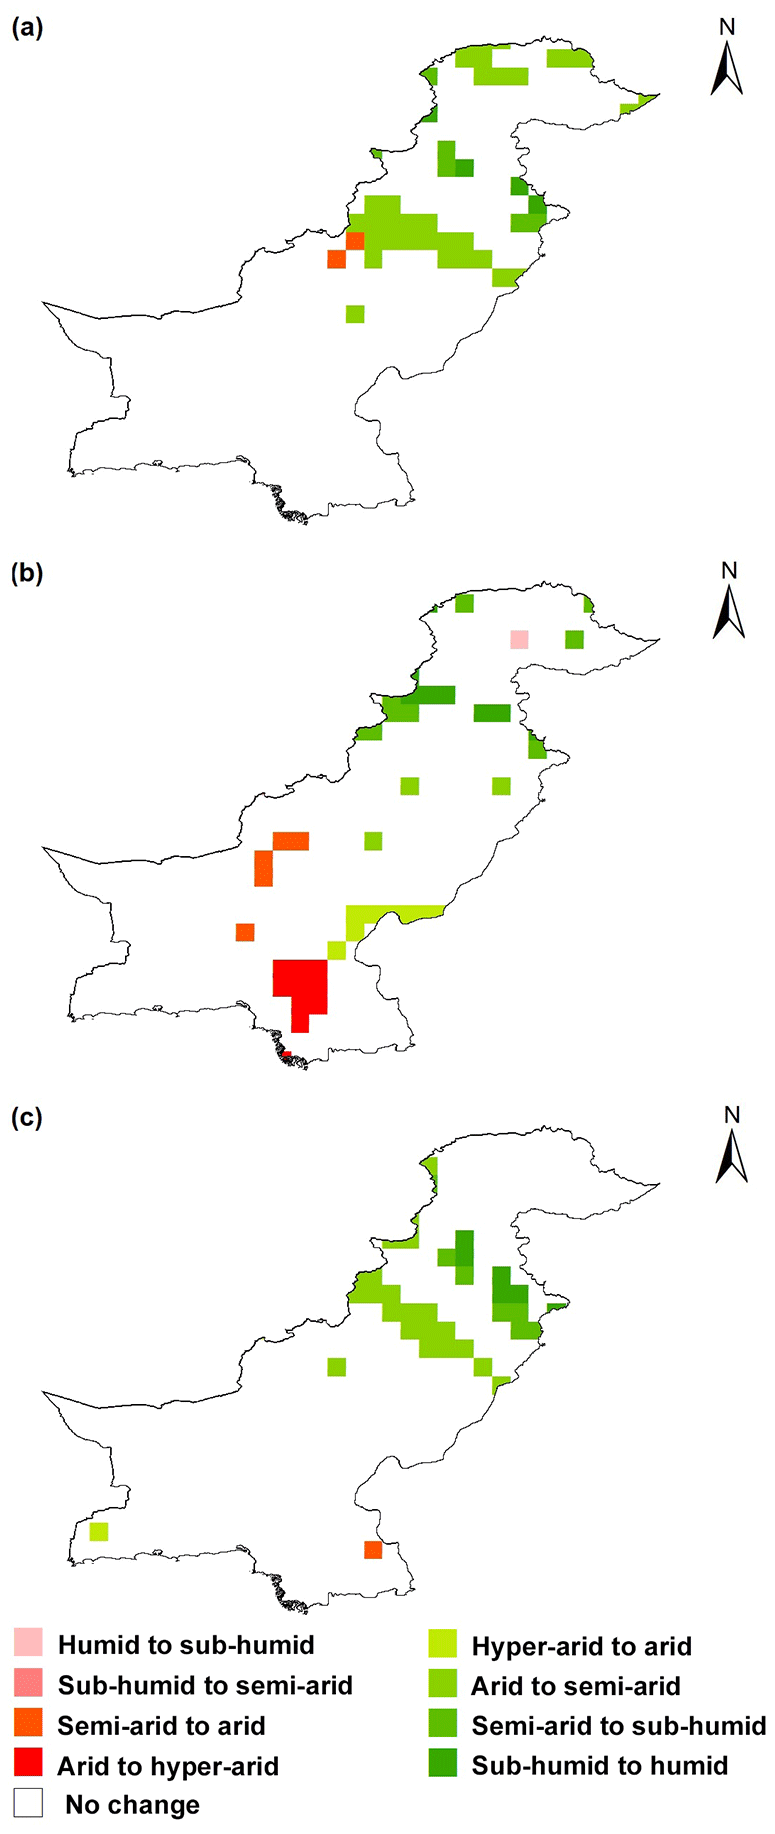
The spatial pattern in the shift of aridity from one class to another is estimated by comparing the aridity maps of the early period (1901–1950) and late period (1967 to 2016). The obtained results are presented in Fig. 10. The shifting of aridity from one to another class is illustrated using different colors, while the white color represents no shift in aridity class. The annual climate in a large area is found to shift from arid to semi-arid (Fig. 10a). A shift from the semi-arid to sub-humid climate is also observed at a few grid points near the foothills of the Himalaya. On the other hand, the climate at two grid points in the southwest is found to shift from semi-arid to arid.
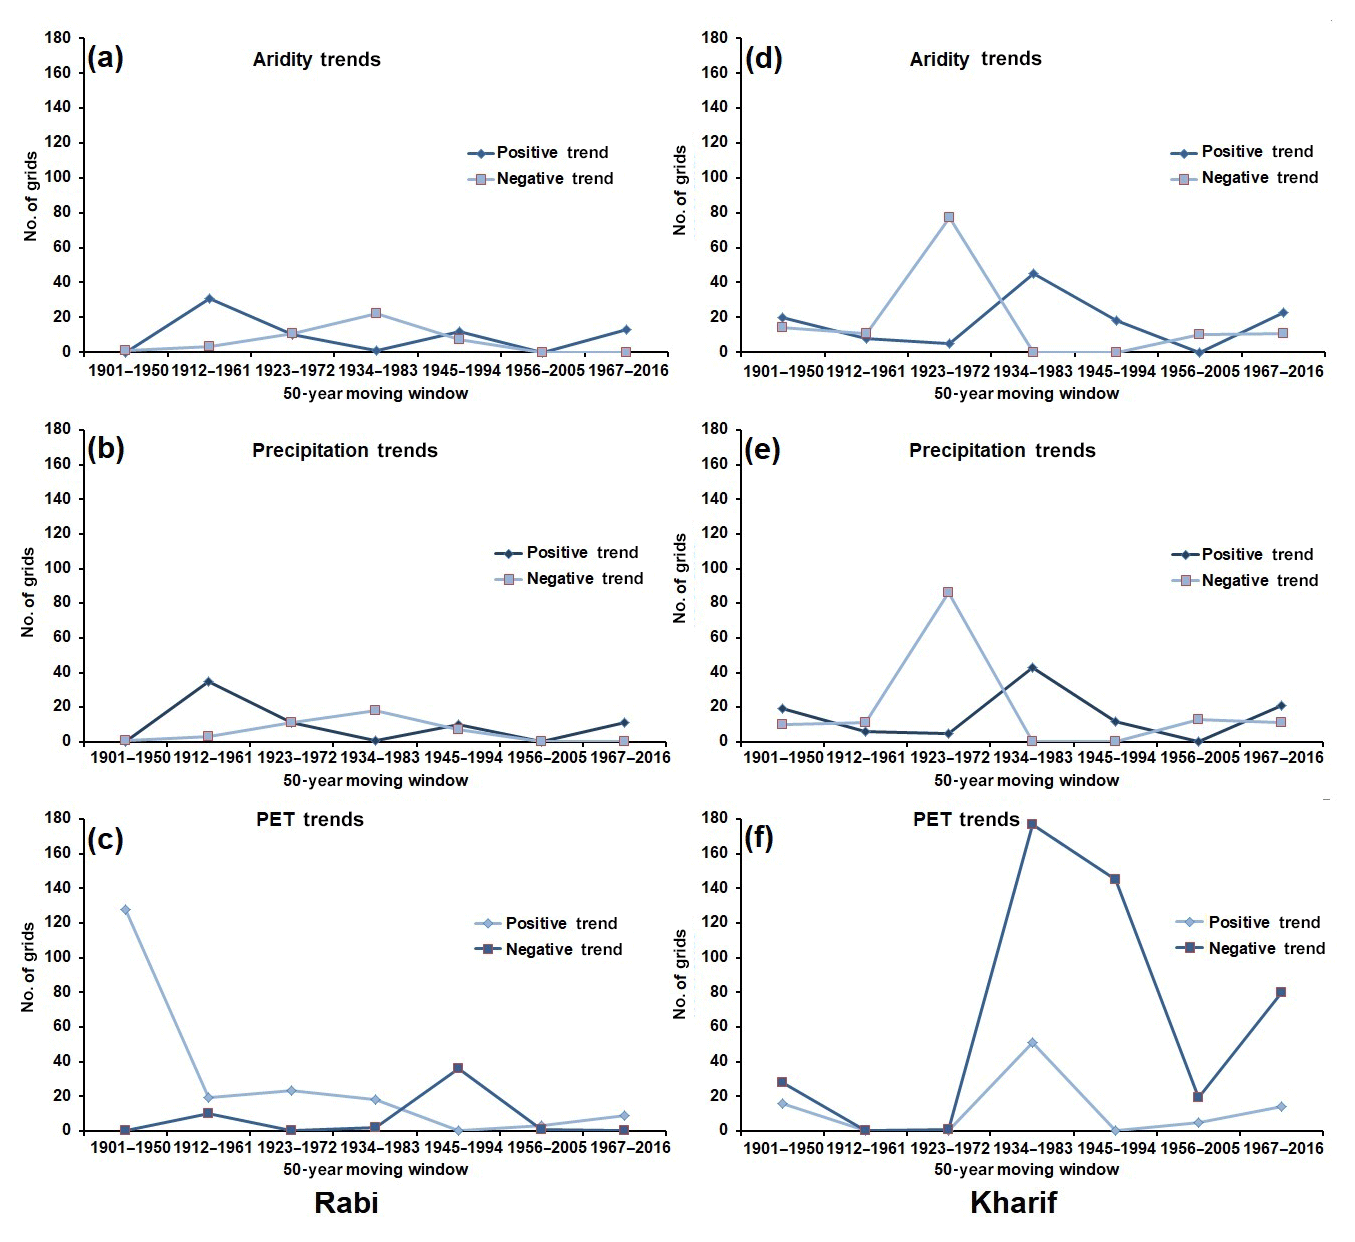
Figure 9Number of grids where annual Rabi and Kharif aridity, precipitation and PET changed significantly during different periods.
Relatively more changes in aridity during the Rabi (Fig. 10b) compared to annual season are observed. A large area in the southeast has changed from arid to hyper-arid. The climate at some grid points in the center and the southwest are also found to change from semi-arid to arid. Besides this, the sub-humid climate at a grid point in the north is found to become humid. The climate at several points also changes from hyper-arid to arid in the southeast and arid to semi-arid at different locations in the north. The spatial pattern of the shift of climate in Kharif (Fig. 10c) reveals a change in the arid to the semi-arid climate in the central region, hyper-arid to arid at a grid point in the southwest corner and semi-arid to arid at a grid point in the southeast corner.
The percentages of changes in different aridity classes are shown in Table 1. No shift in aridity class is observed in more than 85 % of the area. There are both positive shifts (more arid to less arid class) and negative shifts (less arid to more arid class). However, positive shifts are found relatively more often compared to negative shifts.
The highest positive shift is found from the arid to semi-arid climate (9.14 % of the total area for the annual trend and 5.47 % for Kharif), while 2.61 % area is noticed to shift from the semi-arid to sub-humid climate during the Rabi season. On the other hand, a negative shift in only 0.52 % and 0.27 % of areas is noticed for the annual and Kharif seasons, and a relatively higher negative shift is noticed (2.61 %) for Rabi.
Table 1Percentage of the area shifted from one aridity class to another between the periods 1901–1950 and 1967–2016.
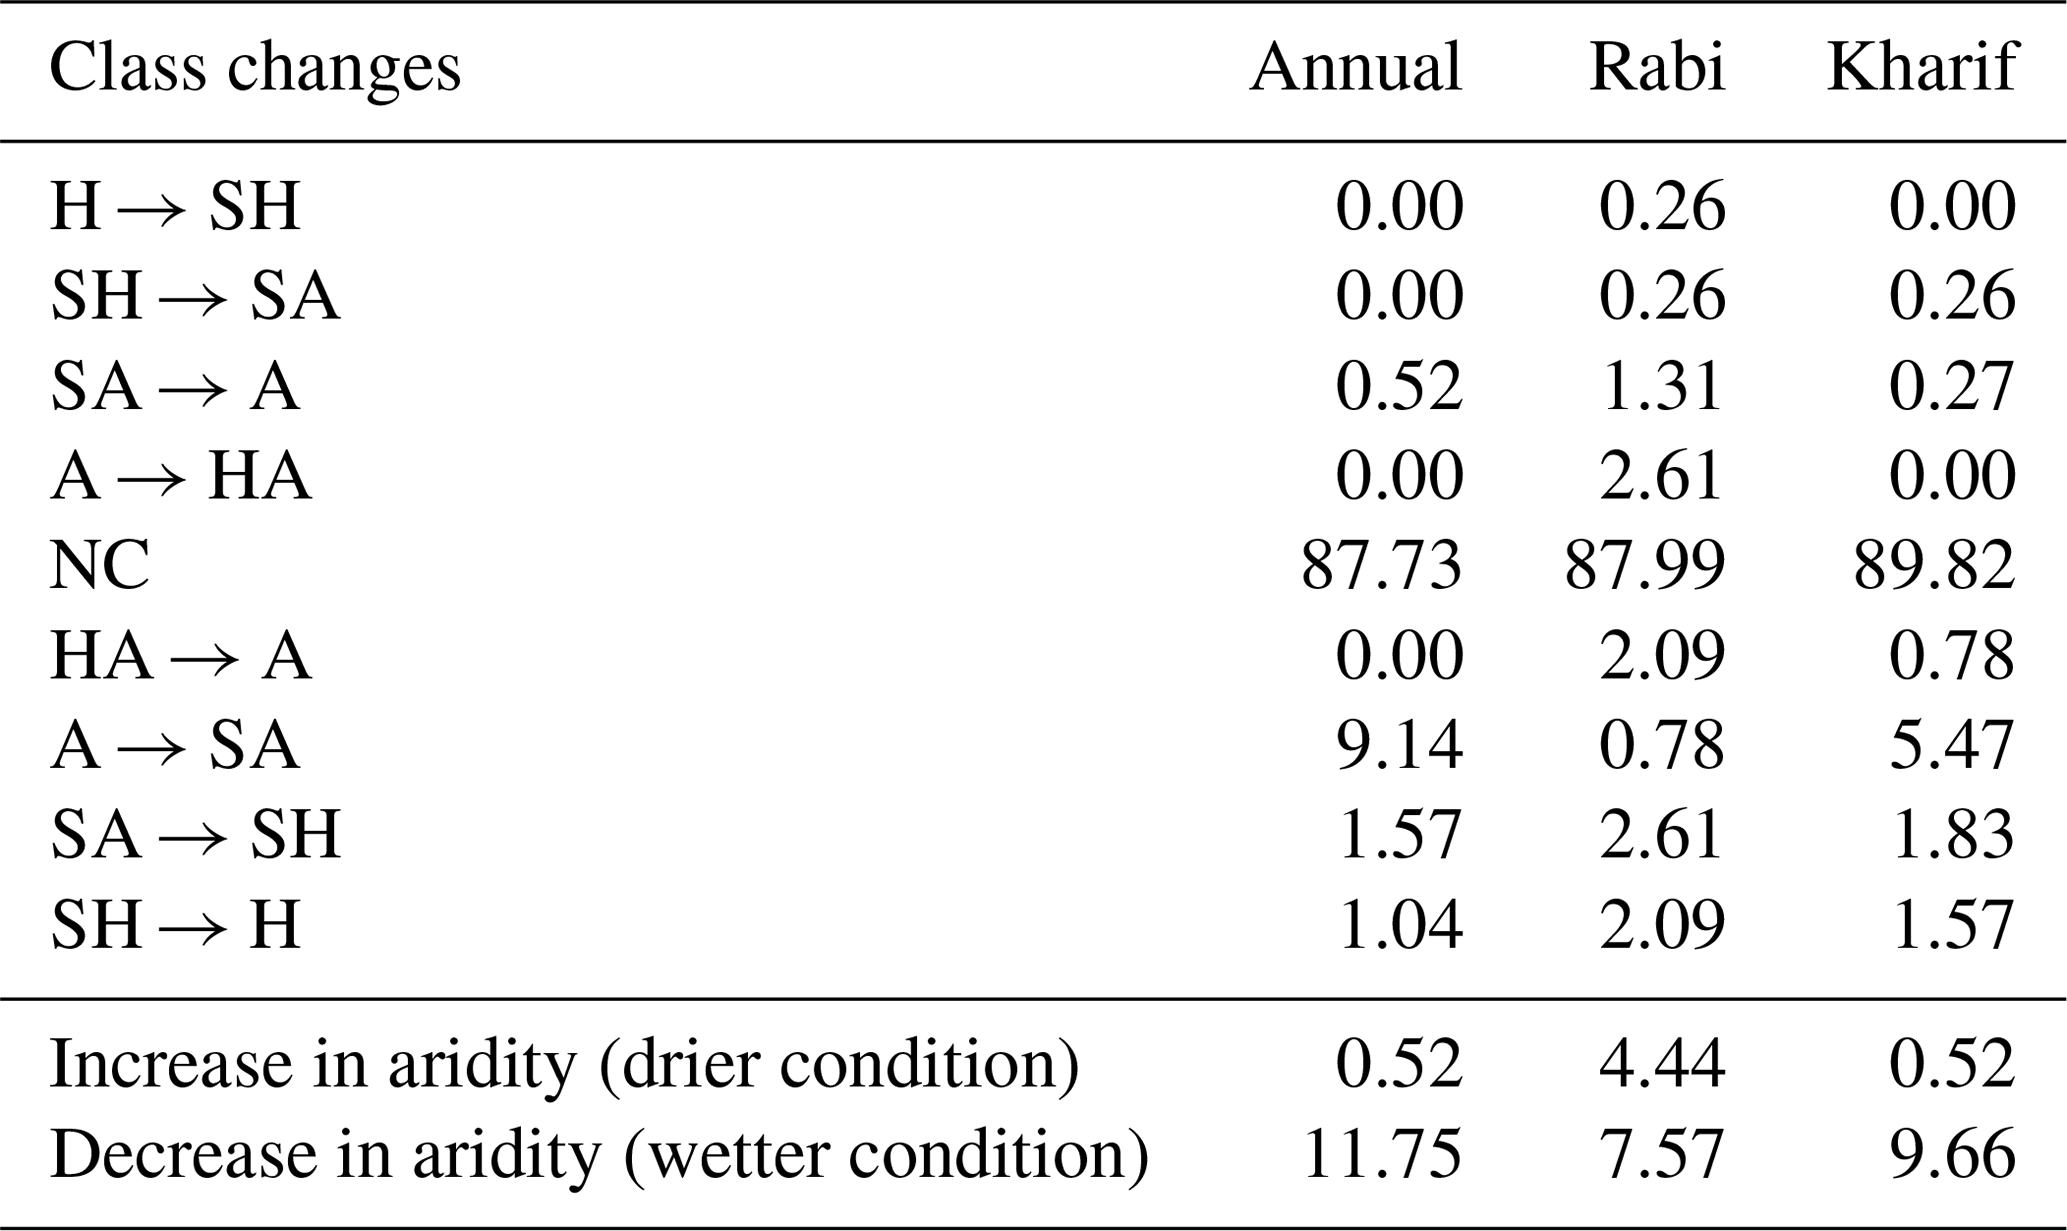
H is humid, SH is sub-humid, SA is semi-arid, A is arid, HA is hyper-arid and NC is no change.
4.7 Detection of change point in climate
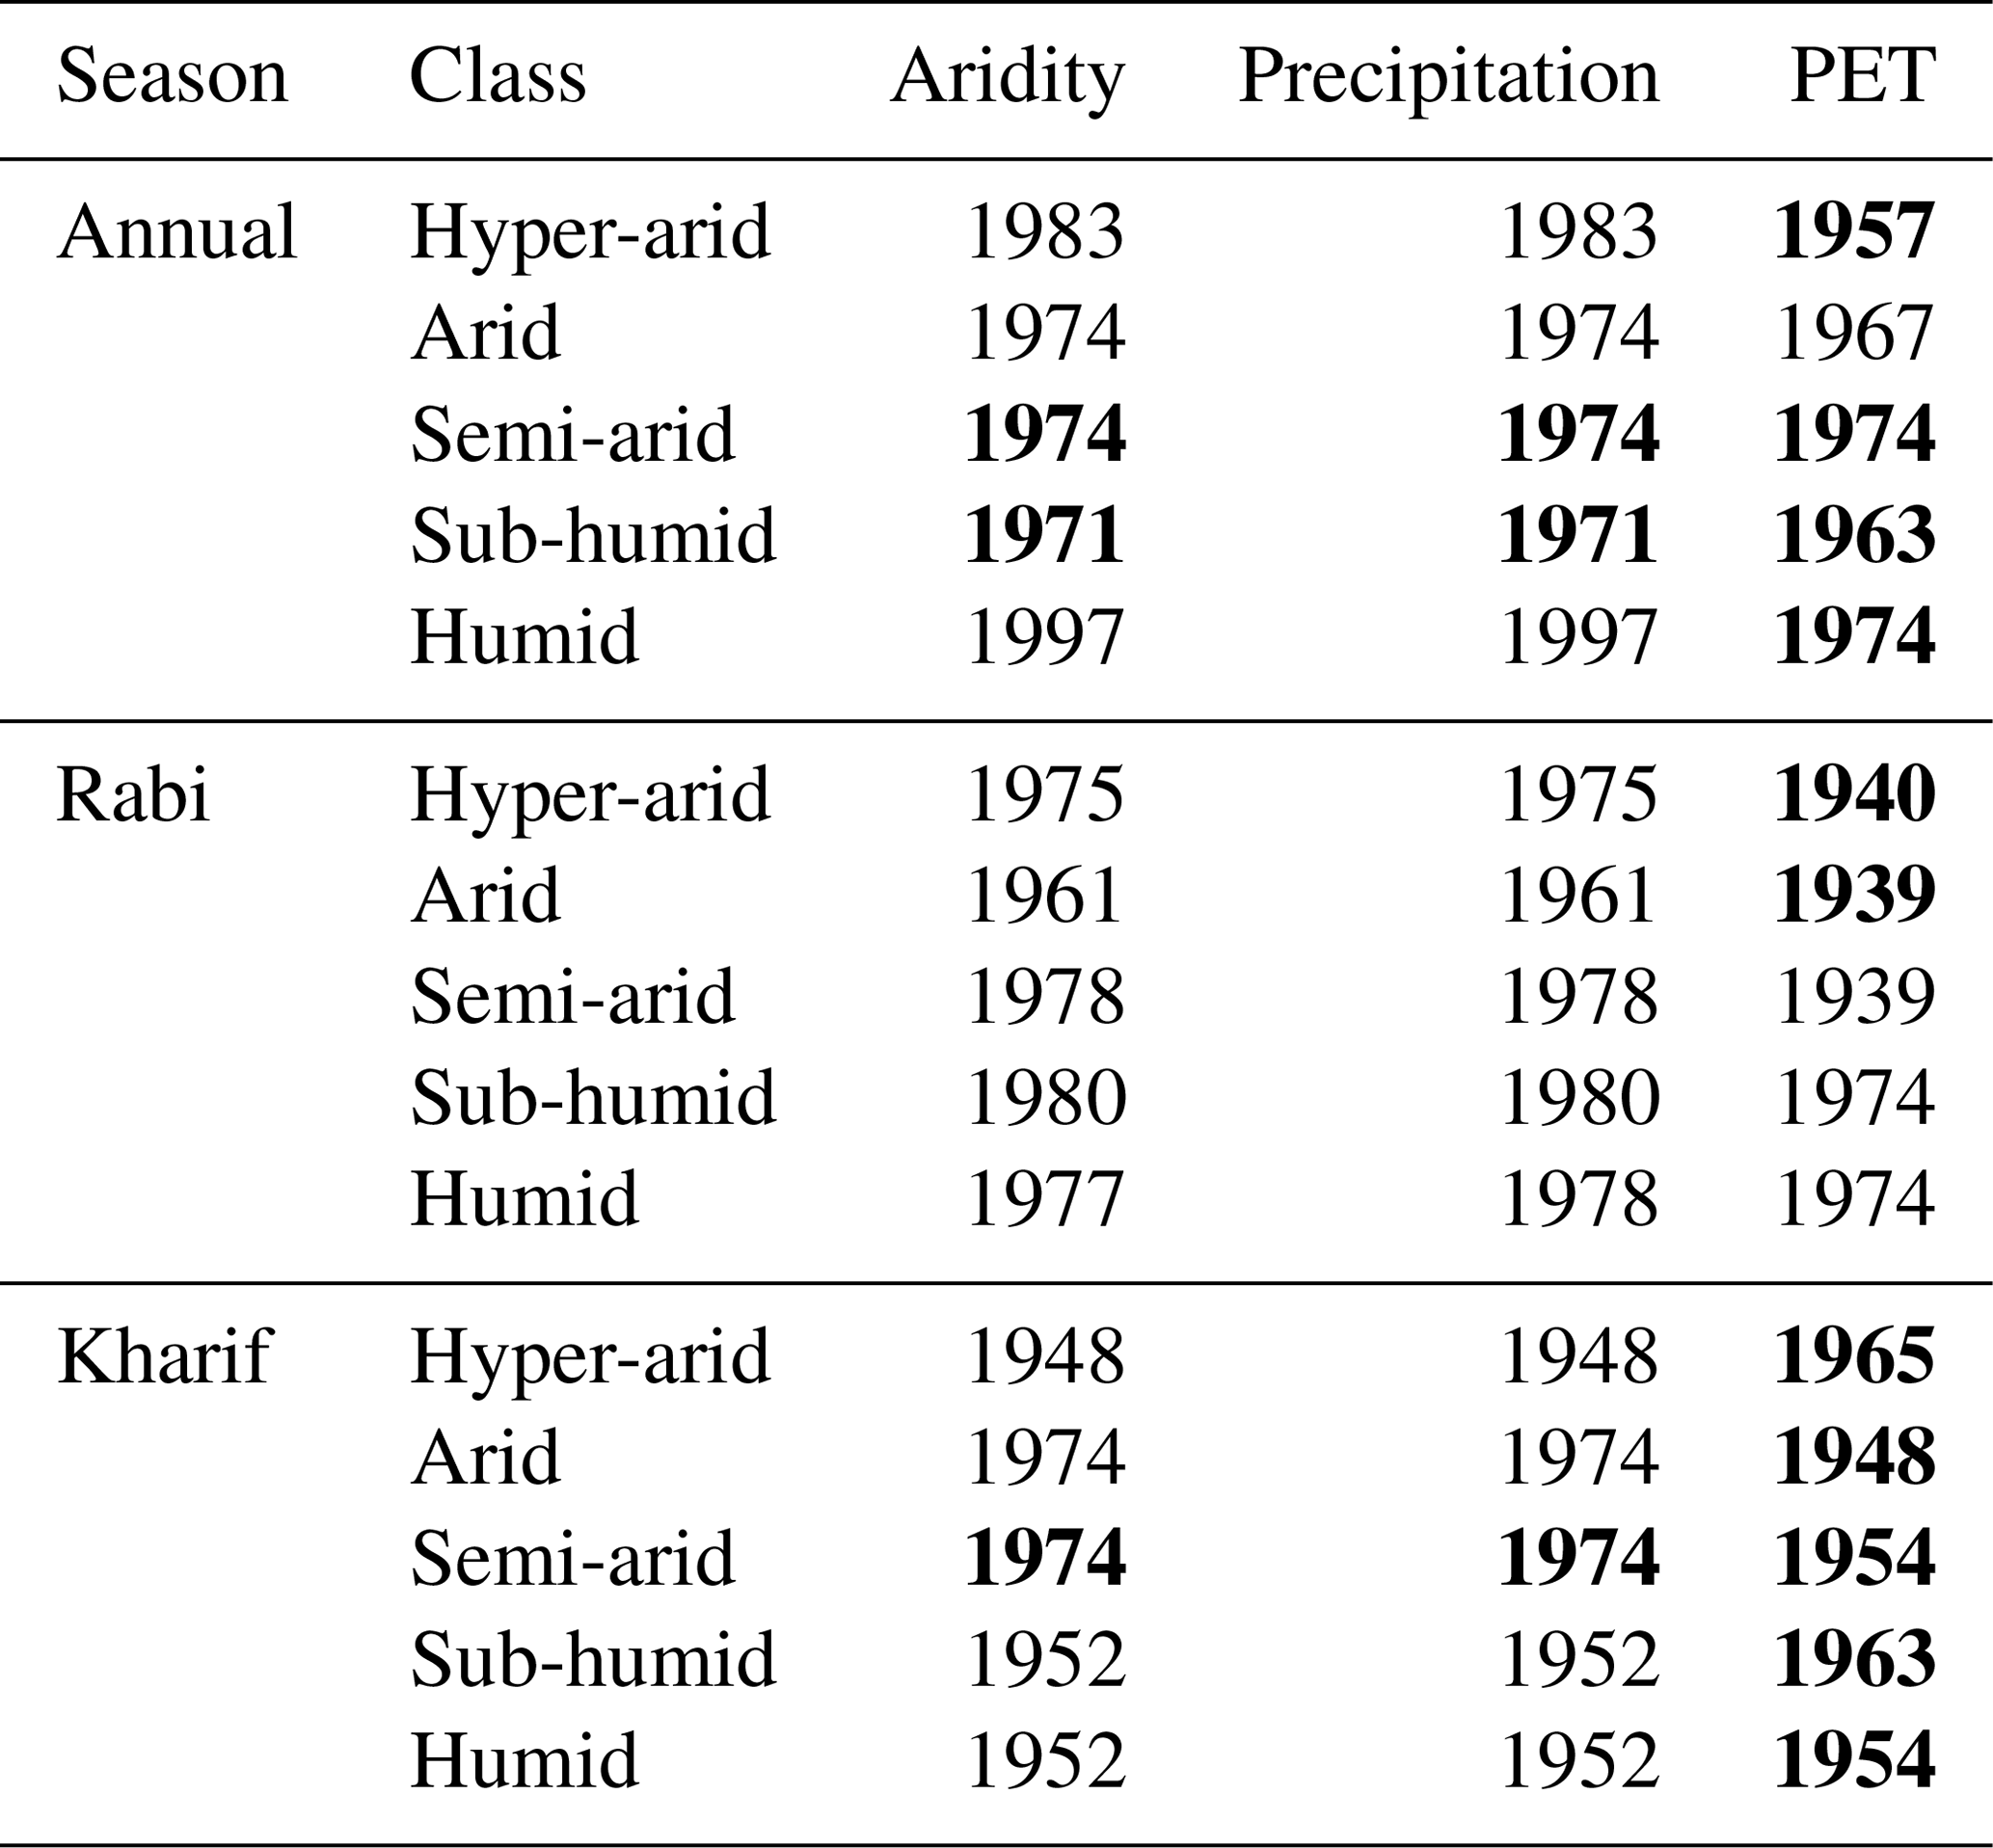
The areal averages of aridity, precipitation and PET of different aridity classes are used to detect the year of their changes using Pettitt's test. The significant changes detected in different years are presented using bold font in Table 2. Most of the changes in aridity and precipitation are detected between 1971 and 1980, while the change point for PET showed more significant changes compared to aridity and precipitation.
It is important to note that the changes (years) detected for aridity and precipitation are the same for all seasons. For example, the change point of both aridity and precipitation in the hyper-arid region is 1983. The results again suggest that the influence of precipitation on aridity is higher compared to PET.
Table 2The year of change in aridity, precipitation and PET in different climatic regions of Pakistan. The bold numbers in the table represent the year of significant change.
The changes in aridity depend on the changes of different climatic variables. The present study found precipitation to be the most dominating factor to drive the changes in aridity in Pakistan. Some literature is available on the changes in aridity in the neighboring countries of Pakistan namely, India, China and Iran. The influence of different climatic variables is examined in those studies to identify the driving factors of aridity changes. Ramarao et al. (2018) assessed the changing pattern of aridity in the semi-arid regions of India during 1951–2005 and reported an increase in semi-aridity in the last decade due to the reduction in precipitation and escalation of PET. Ramachandran et al. (2015) assessed the changing behavior of aridity on the eastern coast of southern India using regional climate models and the RCP4.5 scenario. They reported that aridity would increase with the increase in temperature and lowering of precipitation; however, the rising temperature has more influence on the aridity on the eastern coast of southern India. Gao et al. (2015) evaluated the relationship of aridity with PET, precipitation, temperature, sunshine duration, wind speed and the diurnal temperature range over the Tibetan Plateau and found precipitation to be the most dominating factor that contributes to the aridity. Liu et al. (2018b) assessed the individual contribution of different variables including precipitation, temperature, wind speed, sunshine duration and total solar radiation on aridity of China for the period 1961–2006 and showed that the contribution of different variables on aridity varies from region to region, but precipitation is the most dominating factor in most of the regions. Tabari and Talaee (2013) reported that increasing PET and decreasing precipitation are the cause of increasing aridity in Iran. Most recently, Araghi et al. (2018) also identified increasing temperature and decreasing precipitation due to global warming being the major cause of increasing aridity in Iran. These studies indicate different climate variables as the major driver of aridity in the region. The present study reveals that changes in precipitation are the major cause of the changes in aridity in Pakistan.
Pakistan receives precipitation from the monsoon originating in the Bay of Bengal and the western disturbances originating from the Mediterranean Sea. The monsoon contributes a large quantity to annual precipitation as compared to winter rainfall (Sheikh et al., 2009). Therefore, the geographical distribution of annual precipitation is found to be more or less the same with the monsoon. Several studies such as Ahmed et al. (2017) claimed that climate change has altered monsoon precipitation in the form of more precipitation in the north and at a few places in the southeast of Pakistan. A similar pattern in annual and Kharif precipitation trends is observed in the present study. The aridity decreased in the area where precipitation increased. The PET is found to increase significantly in a large area in the southeast, but its impact is not significant for annual aridity. Like the monsoon, an increase in winter precipitation in a large area was reported (Ahmed et al., 2017). The aridity during Rabi season is found to follow the same pattern of Rabi precipitation. However, a mismatch in rainfall and aridity trends is found in the southwest. This is due to a large increase in PET in the region. Khan et al. (2018) reported a rapid rise in temperature in the southwest which has probably increased PET and aridity in the area. This indicates that both the changes in precipitation and PET have impacts on the changes in aridity in Pakistan. However, precipitation has a much higher influence on the aridity of Pakistan compared to PET.
The aridity is found to increase (drier) and decrease (wetter) in different regions and seasons with the changes in precipitation and PET. Overall, 11.75 %, 7.57 % and 9.66 % of areas are found to shift to wetter conditions, while 0.52 %, 4.44 % and 0.52 % of areas shift to drier condition for annual, Rabi and Kharif seasons respectively. It is important to mention that a large area has a wetter trend in recent years, particularly in the semi-arid or sub-humid regions, which means that more area has become wetter in recent years. However, some areas in the arid region are found to have become drier. This indicates that few dry regions are becoming drier and a large relatively wet area is becoming wetter. A similar finding has been reported by Liu et al. (2018b) in neighboring China. Overall, a large area in the northeast of Pakistan became wetter and a few locations in the south became drier during 1901–2016.
Pakistan is mainly an agriculture-based country where a notable portion of the population is associated with the agriculture-based economy. Haider and Adnan (2014) reported that changes in aridity could have a severe impact on the agricultural sector of Pakistan. They showed that some regions in the northeast of the country are becoming less arid, while some of the regions in the south are becoming drier. It is important to mention that southern regions of the country are highly prone to droughts (Ahmed et al., 2018b). An increase in drier conditions can have a severe impact on the agriculture-based economy of the south. Similarly, the agriculture of northeastern regions can benefit from the wetter condition.
The changes in temporal patterns of aridity reveal that the major shift in aridity and rainfall occurred between 1971 and 1980. The global atmospheric moisture amount is found to increase after 1973 (Ross and Elliott, 2001). An increase in precipitation in many regions of the world is observed due to the increase in global moisture content (Trenberth, 1998). The present study suggests that precipitation of Pakistan also changed during 1971–1980, which may be due to the increase in global atmospheric moisture after 1973. This has caused a shift in precipitation and aridity in Pakistan. Machiwal et al. (2017) reported a significant change in dry season precipitation in the period 1973–1975 in the hot arid region of India. Some'e et al. (2012) assessed the change points in precipitation in the eastern part of Iran bordering Pakistan and reported a shift in annual precipitation at some stations during 1981–1982. The results collaborate with finding that precipitation is the main cause of the aridity shift in Pakistan.
Many factors influence regional and local changes in precipitation, including a shift in monsoon circulation due to global climate change (IPCC, 2014), land use changes like the changes in forest cover and irrigated agriculture (Pielke, 2001), and aerosols in the atmosphere due to human activities (Guo et al., 2016). Studies related to anthropogenic activities on precipitation changes in Pakistan and nearby countries are very limited (Basistha et al., 2009). Previous studies suggested that global warming is the cause of the shift in precipitation pattern in the region (Duan et al., 2002; Gautam et al., 2009). The nature of the shift in the rainfall regime over a large region, which coincides with the increase in global atmospheric moisture, suggests that global climate change may be the cause of the shift in precipitation and aridity of Pakistan.
The present study suggests that the relative influence of precipitation and temperature on aridity determines its trends in the context of climate change. Aridity may decrease due to a small increase in precipitation in the regions where the influence of precipitation is higher in aridity. The gridded data used in this may cause uncertainty in the estimation of aridity and its trends. Other gridded data can be used in future to assess the uncertainty in the estimated trends in aridity. Besides this, different aridity assessment methods can be used to compare the results.
The long-term changes (1901–2016) in annual and seasonal aridity in Pakistan and its causes are analyzed in this paper. Gauge-based gridded precipitation and PET data are used to show the spatial and temporal patterns of the changes in aridity over the diverse climate of the country. The conclusions are drawn based on the following findings: (1) the precipitation is high in the north and low in the southeast and southwest during both the Rabi and Kharif seasons, while the PET is low in the north due to the cold climate and high in the south due to high temperature. (2) Most of the country is characterized by arid and semi-arid climate, except the northern region near the foothills of the Himalaya, which is characterized by the sub-humid to humid climate. However, the aridity of the country is found to vary for different seasons due to the spatial pattern of precipitation occurrence in the corresponding season. (3) The annual and Kharif precipitation of Pakistan is increasing in the northeast, while Rabi precipitation is increasing at a few grid points in the north. The decreasing trends in annual and seasonal precipitation are mostly observed in the southern parts of the country. (4) The increases in annual and Rabi PET are noticed in the southeast corner, while a decrease in Kharif PET is noticed over a large area in the north. (5) The aridity for annual and Kharif showed wetter trends over a large area in the northeast and drier trends at a few points in the south while the aridity in Rabi showed drier trends in the southwest and wetter trend in a small area in the north. (6) Overall, there is a wetting tendency over a large area in the northeast and drying tendency at few locations in the southwest. Therefore, it can be stated that Pakistan became wetter from 1901 to 2016. (7) The time-varying trends in aridity reveal that the influence of precipitation is high on the aridity compared with PET. An increase in precipitation in the southeast has reduced the aridity to some extent in the region. Even though the increasing temperature has caused an increase in PET, its influence is found less on aridity. (8) The changes in spatial patterns of aridity show that the climate in a large area has shifted from arid to semi-arid for annual and Kharif, while a small area shifted from arid to hyper-arid in Rabi. (9) The highest shift in arid climatology is observed between arid to semi-arid. About 9.1 % of the area is found to have shifted from the arid to semi-arid climate between the periods 1901–1950 and 1967–2016. (10) A significant shift in aridity and precipitation in most of the climatic regions of Pakistan is found during 1971–1980.
The model codes and the data are available upon request.
KA, SS and XW designed the research and wrote the paper. NN and NK conducted statistical analysis and prepared the results.
The authors declare that they have no conflict of interest.
We are grateful to the developers of GPCC and CRU for providing gridded precipitation and PET datasets.
This work has been supported by the Young Top-Notch Talent Support Program of National High-level Talents Special Support Plan and Professional Development Research University (PDRU) grant no. Q.J130000.21A2.04E10 of the Universiti Teknologi Malaysia.
This paper was edited by Nadia Ursino and reviewed by three anonymous referees.
Adnan, S. and Ullah, K.: Characterization of drought and its assessment over Sindh, Pakistan during 1951–2010, J. Meteorol. Res.-Prc., 29, 837–857, 2015.
Ahmed, K., Shahid, S., Chung, E.-S., Ismail, T., and Wang, X.-J.: Spatial distribution of secular trends in annual and seasonal precipitation over Pakistan, Clim. Res., 74, 95–107, 2017.
Ahmed, K., Shahid, S., and Nawaz, N.: Impacts of climate variability and change on seasonal drought characteristics of Pakistan, Atmos. Res., 214, 364–374, https://doi.org/10.1016/j.atmosres.2018.08.020, 2018a.
Ahmed, K., Shahid, S., Nawaz, N., and Khan, N.: Modeling climate change impacts on precipitation in arid regions of Pakistan: a non-local model output statistics downscaling approach, Theor. Appl. Climatol., 1–18, 2018b.
Alazard, M., Leduc, C., Travi, Y., Boulet, G., and Ben Salem, A.: Estimating evaporation in semi-arid areas facing data scarcity: Example of the El Haouareb dam (Merguellil catchment, Central Tunisia), J. Hydrol., 3, 265–284, https://doi.org/10.1016/j.ejrh.2014.11.007, 2015.
Araghi, A., Martinez, C. J., Adamowski, J., and Olesen, J. E.: Spatiotemporal variations of aridity in Iran using high-resolution gridded data, Int. J. Climatol., 38, 2701–2717, https://doi.org/10.1002/joc.5454, 2018.
Ashraf, B., Yazdani, R., Mousavi-Baygi, M., and Bannayan, M.: Investigation of temporal and spatial climate variability and aridity of Iran, Theor. Appl. Climatol., 118, 35–46, 2014.
Asmat, U., Athar, H., Nabeel, A., and Latif, M.: An AOGCM based assessment of interseasonal variability in Pakistan, Clim. Dynam., 50, 349–373, 2017.
Basistha, A., Arya, D., and Goel, N.: Analysis of historical changes in rainfall in the Indian Himalayas, Int. J. Climatol., 29, 555–572, 2009.
Becker, A., Finger, P., Meyer-Christoffer, A., Rudolf, B., Schamm, K., Schneider, U., and Ziese, M.: A description of the global land-surface precipitation data products of the Global Precipitation Climatology Centre with sample applications including centennial (trend) analysis from 1901–present, Earth Syst. Sci. Data, 5, 71–99, https://doi.org/10.5194/essd-5-71-2013, 2013.
Bharuqha, F. and Shanbhag, G.: Classification of the vegetation of India, Pakistan and Burma according to effective precipitation, 185–202, 1956.
Buytaert, W., Friesen, J., Liebe, J., and Ludwig, R.: Assessment and management of water resources in developing, semi-arid and arid regions, Water Resour. Manage., 26, 841–844, 2012.
Chaudhry, Q. and Rasul, G.: Agro-climatic classification of Pakistan, Science Vision, 9, 59–66, 2004.
Dai, A.: Increasing drought under global warming in observations and models, Nat. Clim. Change, 3, 52–58, 2013.
De Martonne, E.: Aréisme et Indice d'aridité, Comptes Rendus de L'Academy of Science, Paris, 1395–1398, 1936.
Duan, K., Yao, T., Pu, J., and Sun, W.: Response of monsoon variability in Himalayas to global warming, Chin. Sci. Bull., 47, 1842–1845, https://doi.org/10.1007/bf03183854, 2002.
Finkel, J., Canel-Katz, L., and Katz, J.: Decreasing US aridity in a warming climate, Int. J. Climatol., 36, 1560–1564, 2016.
Gao, Y., Li, X., Leung, L. R., Chen, D., and Xu, J.: Aridity changes in the Tibetan Plateau in a warming climate, Environ. Res. Lett., 10, https://doi.org/10.1088/1748-9326/10/3/034013, 2015.
Gautam, R., Hsu, N. C., Lau, K.-M., and Kafatos, M.: Aerosol and rainfall variability over the Indian monsoon region: distributions, trends and coupling, Ann. Geophys., 27, 3691–3703, https://doi.org/10.5194/angeo-27-3691-2009, 2009.
Guo, L., Turner, A. G., and Highwood, E. J.: Local and remote impacts of aerosol species on Indian summer monsoon rainfall in a GCM, J. Climate, 29, 6937–6955, 2016.
Haider, S. and Adnan, S.: Classification and assessment of aridity over Pakistan provinces (1960–2009), Int. J. Environ., 3, 24–35, 2014.
Hamed, K. H.: Trend detection in hydrologic data: The Mann–Kendall trend test under the scaling hypothesis, J. Hydrol., 349, 350–363, https://doi.org/10.1016/j.jhydrol.2007.11.009, 2008.
Harris, I., Jones, P. D., Osborn, T. J., and Lister, D. H.: Updated high-resolution grids of monthly climatic observations – the CRU TS3.10 Dataset, Int. J. Climatol., 34, 623–642, https://doi.org/10.1002/joc.3711, 2014.
Hrnjak, I., Lukić, T., Gavrilov, M. B., Marković, S. B., Unkašević, M., and Tošić, I.: Aridity in Vojvodina, Serbia, Theor. Appl. Climatol., 115, 323–332, 2014.
Huang, J., Yu, H., Guan, X., Wang, G., and Guo, R.: Accelerated dryland expansion under climate change, Nat. Clim. Change, 6, 166–171, 2016.
Hussain, M. S. and Lee, S.: A classification of rainfall regions in Pakistan, Journal of the Korean Geographical Society, 44, 605–623, 2009.
Hussain, M. S. and Lee, S.: Long-term variability and changes of the precipitation regime in Pakistan, Asia-Pac. J. Atmos. Sci., 50, 271–282, 2014.
IPCC: Climate Change 2014: Synthesis Report, Contribution of Working Groups I, II and III to the Fifth Assessment Report of the Intergovernmental Panel on Climate Change, edited by: Core Writing Team, Pachauri, R. K., and Meyer, L. A., IPCC, Geneva, Switzerland, 979–1037, 2014.
Iqbal, M. A., Penas, A., Cano-Ortiz, A., Kersebaum, K. C., Herrero, L., and del Río, S.: Analysis of recent changes in maximum and minimum temperatures in Pakistan, Atmos. Res., 168, 234–249, https://doi.org/10.1016/j.atmosres.2015.09.016, 2016.
Jiao, F., Shi, X.-R., Han, F.-P., and Yuan, Z.-Y.: Increasing aridity, temperature and soil pH induce soil C-N-P imbalance in grasslands, Sci. Rep.-UK, 6, 19601, https://doi.org/10.1038/srep19601, 2016.
Khan, N., Shahid, S., Ismail, T. B., and Wang, X.-J.: Spatial distribution of unidirectional trends in temperature and temperature extremes in Pakistan, Theor. Appl. Climatol., 136, 899-–913, https://doi.org/10.1007/s00704-018-2520-7, 2018.
Khatoon, S. and Ali, Q.: Biodiversity of the semi-arid and arid regions of Pakistan: Status, threats, and conservation measures, Ann. Arid Zone, 43, 277–291, 2004.
Kishore, P., Jyothi, S., Basha, G., Rao, S. V. B., Rajeevan, M., Velicogna, I., and Sutterley, T. C.: Precipitation climatology over India: validation with observations and reanalysis datasets and spatial trends, Clim. Dynam., 46, 541–556, https://doi.org/10.1007/s00382-015-2597-y, 2015.
Kousari, M., Dastorani, M., Niazi, Y., Soheili, E., Hayatzadeh, M., and Chezgi, J.: Trend Detection of Drought in Arid and Semi-Arid Regions of Iran Based on Implementation of Reconnaissance Drought Index (RDI) and Application of Non-Parametrical Statistical Method, Water Resour. Manage., 28, 1857–1872, https://doi.org/10.1007/s11269-014-0558-6, 2014.
Li, L., Xu, C.-Y., Zhang, Z., and Jain, S. K.: Validation of a new meteorological forcing data in analysis of spatial and temporal variability of precipitation in India, Stoch. Environ. Res. Risk Assess., 28, 239–252, 2014.
Liu, C., Huang, W., Feng, S., Chen, J., and Zhou, A.: Spatiotemporal variations of aridity in China during 1961–2015: decomposition and attribution, Sci. Bull., 63, 1187–1199, 2018a.
Liu, L., Wang, Y., You, N., Liang, Z., Qin, D., and Li, S.: Changes in aridity and its driving factors in China during 1961–2016, Int. J. Climatol., 50–60, https://doi.org/10.1002/joc.5781, 2018b.
Machiwal, D., Dayal, D., and Kumar, S.: Long-term rainfall trends and change points in hot and cold arid regions of India, Hydrol. Sci. J., 62, 1050–1066, 2017.
Monteith, J. L.: Evaporation and environment, Symp. Soc. Exp. Biol, 19, 205–234, 1965.
Nabeel, A. and Athar, H.: Classification of precipitation regimes in Pakistan using wet and dry spells, Int. J. Climatol., 38, 2462–2477, 2018.
Nam, W.-H., Hayes, M. J., Svoboda, M. D., Tadesse, T., and Wilhite, D. A.: Drought hazard assessment in the context of climate change for South Korea, Agr. Water Manage., 160, 106–117, https://doi.org/10.1016/j.agwat.2015.06.029, 2015.
New, M., Lister, D., Hulme, M., and Makin, I.: A high-resolution data set of surface climate over global land areas, Clim. Res., 21, 1–25, 2002.
Oliver, J., Siddiqi, A., and Goward, S.: Spatial patterns of climate and irrigation in Pakistan: A multivariate statistical approach, Archiv für Meteorologie, Geophysik und Bioklimatologie, 25, 345–357, 1978.
Pettitt, A.: A non-parametric approach to the change-point problem, Appl. Statist., 28, 126–135, 1979.
Pielke, R. A.: Influence of the spatial distribution of vegetation and soils on the prediction of cumulus convective rainfall, Rev. Geophys., 39, 151–177, 2001.
Ramachandran, A., Praveen, D., Jaganathan, R., and Palanivelu, K.: Projected and observed aridity and climate change in the east coast of South India under RCP 4.5, The Scientific World Journal, 11 pp., 2015.
Ramarao, M., Sanjay, J., Krishnan, R., Mujumdar, M., Bazaz, A., and Revi, A.: On observed aridity changes over the semiarid regions of India in a warming climate, Theor. Appl. Climatol., 136, 693–702, 2018.
Ross, R. J. and Elliott, W. P.: Radiosonde-based Northern Hemisphere tropospheric water vapor trends, J. Climate, 14, 1602–1612, 2001.
Sarfaraz, S.: The sub-regional classification of Pakistan's winter precipitation based on principal components analysis, Pakistan Journal of Meteorology, 10, 57–66, 2014.
Sarfaraz, S., Arsalan, M. H., and Fatima, H.: Regionalizing the climate of Pakistan using Köppen classification system, Pak. Geogr. Rev., 69, 111–132, 2014.
Şarlak, N. and Agha, O. M. M.: Spatial and temporal variations of aridity indices in Iraq, Theor. Appl. Climatol., 133, 89–99, 2018.
Schneider, U., Becker, A., Finger, P., Meyer-Christoffer, A., Ziese, M., and Rudolf, B.: GPCC's new land surface precipitation climatology based on quality-controlled in situ data and its role in quantifying the global water cycle, Theor. Appl. Climatol., 115, 15–40, https://doi.org/10.1007/s00704-013-0860-x, 2014.
Selek, B., Tuncok, I. K., and Selek, Z.: Changes in climate zones across Turkey, J. Water Clim. Change, 9, 178–195, 2018.
Sen, P. K.: Estimates of the regression coefficient based on Kendall's tau, J. Am. Stat. Assoc., 63, 1379–1389, 1968.
Shamshad, K. M.: The meteorology of Pakistan: climate and weather of Pakistan, Royal Book Company, 1988.
Sheikh, M. M.: Drought management and prevention in Pakistan, COMSATS 1st meeting on water resources in the south: present scenario and future prospects, Islamabad, 1–2, 2001.
Sheikh, M. M., Manzoor, N., and Khan, A.: Climate Profile and Past Climate Changes in Pakistan. Global Change Impact Studies Centre (GCISC), Islamabad Research Report: GCISC-RR-01, 118 pp., 2009.
Shiru, M. S., Shahid, S., Alias, N., and Chung, E.-S.: Trend Analysis of Droughts during Crop Growing Seasons of Nigeria, Sustainability, 1–13, 2018.
Some'e, B., Ezani, A., and Tabari, H.: Spatiotemporal trends and change point of precipitation in Iran, Atmos. Res., 113, 1–12, https://doi.org/10.1016/j.atmosres.2012.04.016, 2012.
Spinoni, J., Naumann, G., Carrao, H., Barbosa, P., and Vogt, J.: World drought frequency, duration, and severity for 1951–2010, Int. J. Climatol., 34, 2792–2804, https://doi.org/10.1002/joc.3875, 2014.
Sun, Q., Miao, C., Duan, Q., Kong, D., Ye, A., Di, Z., and Gong, W.: Would the “real” observed dataset stand up? A critical examination of eight observed gridded climate datasets for China, Environ. Res. Lett., 9, 015001, https://doi.org/10.1088/1748-9326/9/1/01500, 2014.
Tabari, H. and Talaee, P. H.: Moisture index for Iran: spatial and temporal analyses, Global Planet. Change, 100, 11–19, 2013.
Tabari, H., Abghari, H., and Hosseinzadeh Talaee, P.: Temporal trends and spatial characteristics of drought and rainfall in arid and semiarid regions of Iran, Hydrol. Proc., 26, 3351–3361, 2012.
Thornthwaite, C. W.: The climates of North America: according to a new classification, Geogr. Rev., 21, 633–655, 1931.
Thornthwaite, C. W.: An approach toward a rational classification of climate, Geogr. Rev., 38, 55–94, 1948.
Trenberth, K. E.: Atmospheric Moisture Residence Times and Cycling: Implications for Rainfall Rates and Climate Change, Clim. Change, 39, 667–694, https://doi.org/10.1023/a:1005319109110, 1998.
Trenberth, K. E., Dai, A., van der Schrier, G., Jones, P. D., Barichivich, J., Briffa, K. R., and Sheffield, J.: Global warming and changes in drought, Nat. Clim. Change, 4, 17–22, 2014.
Tukimat, N. N. A., Harun, S., and Shahid, S.: Comparison of different methods in estimating potential evapotranspiration at Muda Irrigation Scheme of Malaysia, J. Agr. Rural Dev. Trop., 113, 77–85, 2012.
Ullah, S., You, Q., Ali, A., Ullah, W., Jan, M. A., Zhang, Y., Xie, W., and Xie, X.: Observed changes in maximum and minimum temperatures over China-Pakistan economic corridor during 1980–2016, Atmos. Res., 216, 37–51, 2018a.
Ullah, S., You, Q., Ullah, W., and Ali, A.: Observed changes in precipitation in China-Pakistan economic corridor during 1980–2016, Atmos. Res., 210, 1–14, 2018b.
UNEP: World atlas of desertification, Edward Arnold, London, 1992.
UNESCO: Map of the world distribution of arid regions, UNESCO Paris, 1979.
Yin, Y., Ma, D., and Wu, S.: Nonlinear changes in aridity due to precipitation and evapotranspiration in China from 1961 to 2015, Clim. Res., 74, 263–281, 2018.
Yue, S., Pilon, P., and Cavadias, G.: Power of the Mann–Kendall and Spearman's rho tests for detecting monotonic trends in hydrological series, J. Hydrol., 259, 254–271, 2002.
Zahid, M. and Rasul, G.: Thermal classification of Pakistan, Atmos. Clim. Sci., 1, 206, https://doi.org/10.4236/acs.2011.14023, 2011.
Zarch, M. A. A., Sivakumar, B., and Sharma, A.: Assessment of global aridity change, J. Hydrol., 520, 300–313, 2015.
Zarch, M. A. A., Sivakumar, B., Malekinezhad, H., and Sharma, A.: Future aridity under conditions of global climate change, J. Hydrol., 554, 451–469, 2017.