the Creative Commons Attribution 4.0 License.
the Creative Commons Attribution 4.0 License.
 | 27 May 2019
The influence of litter crusts on soil properties and hydrological processes in a sandy ecosystem
Zeng Cui
Ze Huang
Hai-Tao Miao
Litter crusts are integral components of the water budget in terrestrial ecosystems, especially in arid areas. This innovative study is designed to quantify the ecohydrological effectiveness of litter crusts in desert ecosystems. We focus on the positive effects of litter crusts on soil water holding capacity and water interception capacity compared with biocrusts. Litter crusts significantly increased soil organic matter compared to biocrusts and bare lands, by 2.4 times and 3.8 times, respectively. Higher organic matter content resulted in increased soil porosity and decreased soil bulk density. Meanwhile, soil organic matter can help to maintain maximum infiltration rates. Litter crusts significantly increased the water infiltration rate under high water supply. Our results suggested that litter crusts significantly improve soil properties, thereby influencing hydrological processes. Litter crusts play an important role in improving hydrological effectiveness and provide a microhabitat conducive to vegetation restoration in dry sandy ecosystems.
- Article
(7792 KB) - Full-text XML
- BibTeX
- EndNote


Desertification represents one of the most serious global environmental issues as it leads to the degradation of ecosystem functioning and services and impacts the livelihoods of more than 25 % of the world's population (Geist and Lambin, 2004; Kefi et al., 2007; Huenneke et al., 2010). The occurrence of desertification, high air temperature, low soil humidity, and abundant solar radiation results in high potential evapotranspiration (Reynolds et al., 2007). Moreover, soil nutrients are eroded by drastic water loss, and soil fertility decreases with sand transport and dune burial, consequently impeding vegetation growth. It is a challenge for ecologists to stabilize mobile dunes and to transform them into productive ecosystems.
With the increasing harm of desertification, many measures have been implemented to prevent and combat desertification, such as afforestation, establishment of sand barriers, or spraying reinforcing agents. One widely popular restoration technique establishes straw checkerboards (wheat straw, reed and other materials are used in the desert to form a square wall) on mobile sand dunes and eroded land. The straw checkerboards enhance dust entrapment on the surface of stabilized dunes, which facilitates topsoil development and makes it easier for biological soil crusts (biocrusts) to form (Li et al., 2006). Biocrusts are soil surface communities composed of microscopic and macroscopic poikilohydric organisms, are globally widespread and are an important component of the soil community in many desert ecosystems (Grote et al., 2010; Gao et al., 2017). Biocrusts are highly specialized soil-surface plant-soil complex groups that are an important component of desert ecosystems, especially in arid and semiarid regions. Biocrusts provide important ecological functions including increasing soil aggregation and stability, preventing soil loss, increasing the retention of topsoil nutrients, and improving soil fertility (Chamizo et al., 2012).
Large area afforestation is one effective measure used in the prevention and control of desertification in arid and semi-arid regions. Deciduous trees have been widely used in most of the sandy-land afforestation efforts (Liu et al., 2018). In addition to biocrusts, afforestation also produces litter crusts, which form from the accumulation of litter that results from the common influences of wind and water (Jia et al., 2018). Unlike the common litter layer, litter crust is a hard shell formed by mixing litter and sand under external forces such as rain or wind. In this study, litter crust was defined as the crust formed by all dead organic material consisting of both decomposed and undecomposed plant parts which are not integrated into the mineral soils, that is, the litter crust formed by the mixing of litter organisms and soil. The interactions between precipitation, vegetation and litter crust are important issues for hydrologists (Dunkerley, 2015). Litter crusts have the capacity to store water on their surface, with this storage being filled by rainfall and emptied by evaporation and drainage (Guevara-Escobar et al., 2007; Gerrits et al., 2010; Li et al., 2013). Previous studies have explored the interception of rainfall, the water-holding capacity (WHC) of litter materials, and the degree of retention within the litter (Makkonen et al., 2013; Dunkerley, 2015; Acharya et al., 2016). The plant-litter input from above and below ground comprises the dominant sources of energy and matter for a very diverse soil organism community that are linked by extremely complex interactions (Hättenschwiler et al., 2005). On the one hand, litter crusts can improve microhabitat conditions (Chomel et al., 2016) and form soil organic matter (SOM) through biochemical and physical pathways (Makkonen et al., 2013; Cotrufo et al., 2015). On the other hand, litter crusts affect hydrological processes by serving as a barrier that prevents precipitation from directly reaching the soil and controls soil evaporation (Bulcock and Jewitt, 2012; Van Stan et al., 2017), attenuating both directions of ground radiation flux, and by increasing resistance to water flux from the ground (Juancamilo et al., 2010). The combined effects of these mechanisms produced by litter crusts provide strong controls on water transport. Consequently, interception by litter crusts is a key component of the water budget in some vegetated ecosystems (Gerrits et al., 2007; Bulcock and Jewitt, 2012; Acharya et al., 2016).
The Grain for Green Project was implemented to control soil erosion and improve the ecological environment across a large portion of China (Chen et al., 2015). This project increased vegetation coverage on the Loess Plateau from 31.6 % in 1999 to 59.6 % in 2013 (Chen et al., 2015). Consequently, the environmental conditions have improved and are suitable for the development and growth of biocrusts and litter crusts in the arid areas. Litter crusts and biocrusts were important contributors for the improvement of the surface microhabitat conditions. Although the importance of biocrusts in water processes has been recognized, the effect of litter crusts on sandy lands has received little attention. Therefore, the objectives of the study are (1) to determine the role of litter crust for soil properties (soil water content, bulk density, soil total porosity, soil organic carbon) and hydrological processes (WHC, water interception capacity (WIC), water infiltration rate (WIR), and infiltration depth), and (2) to determine which are the dominant control factors of litter crust that affect water infiltration processes in sandy lands. The results will clarify the impact exerted by crusts on hydrological process, which protect the soil against erosion and improve soil microhabitats in sandy lands.
2.1 Study sites
The experimental site was located in the southern Mu Us Desert (110∘21′–110∘23′ E, 38∘46′–38∘51′ N; 1080–1270 m a.s.l.), which is a water–wind intersection erosion region of China. It has a continental semi-arid monsoon climate, with a mean annual temperature of 8.4 ∘C. The minimum monthly temperature is −9.7 ∘C in January and the maximum monthly temperature is 23.7 ∘C in July, and the mean annual precipitation is 437 mm yr−1 (minimum of 109 mm in winter and maximum of 891 mm in summer), with approximately 77 % of the rainfall occurring between June and September. A mean of 16.2 d has wind speed exceeding Beaufort force 8, and they are predominant during the spring. The soils are aeolian sandy soils, which are prone to wind–water erosion, with sand, silt, and clay contents of the soil being 98.6, 1.3, and <1.0, respectively (Wu et al., 2016). The areas with sandy loess soil, loose structure, and poor erosion resistance were given priority. The Chinese government implemented several projects to reduce soil erosion and to prevent the drifting of sand as well as to improve the fragile ecosystem. Vegetation restoration has transformed the landscape from mobile sand dunes to shrubby dunes, which are composed of fixed and semi-fixed sand dunes. The dominant natural vegetation is psammophytic shrubs and grasses (e.g. Artemisia ordosica, Salix cheilophila, Lespedeza davurica). In many of the sand dune sites Populus simonii was chosen for sand fixation.
2.2 Experimental design and soil sampling
This study was conducted in the wind–water erosion intersection region, and Populus simonii was chosen as the main species for wind speed reduction at the surface. The region has suffered wind–water erosion in consecutive years due to its unique geographical position, which has shaped its specific landscape characteristics. There is abundant plant litter gathered every year as a result of the interaction between wind transport and water erosion. Many litter layers were mixed with sand and eventually were fixed on the ground; this gradual process formed litter crusts. Soils covered by two types of crusts represented the most common crusts in this region. Biological soil crusts (biocrusts) were moss dominated, and litter crusts were dominated by Populus simonii leaves. The litter crusts were divided into two groups: a 2-year crust (covered by only litter, LC2) and a 4-year crust (covered by litter and a semidecomposed layer, LC4). For each crust type (LC2, LC4 and biocrusts) as well as bare sandy land (BSL, as control, Fig. 1), six experimental plots (>100 m2) were selected. Five duplicate sample sites were selected in each experimental plot for repeatability.
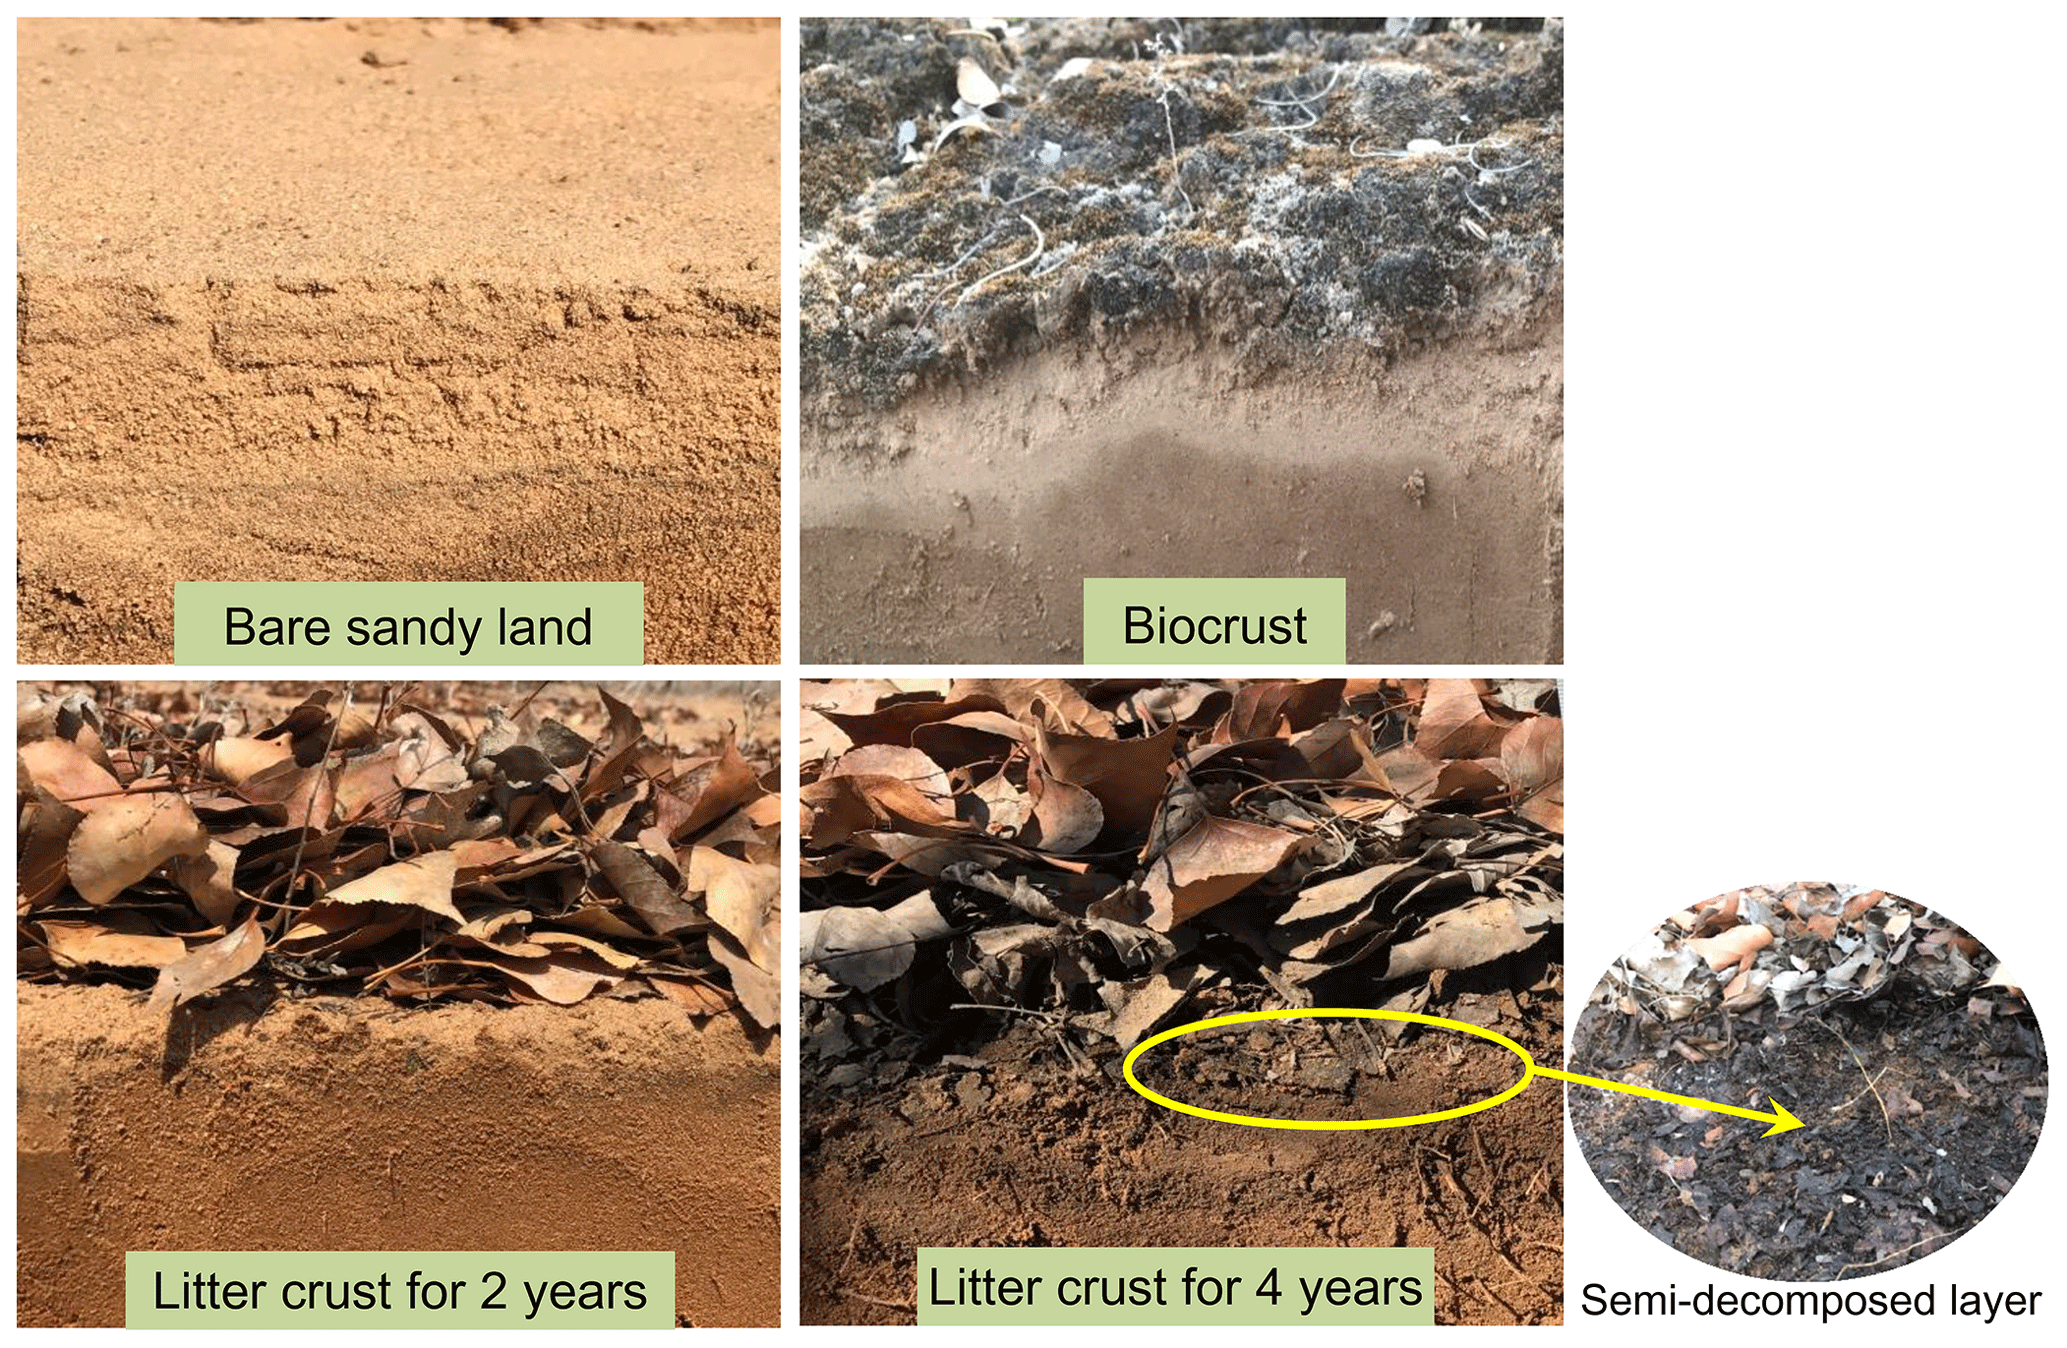
Figure 1The vertical soil profiles in bare sandy land and different crusts in the southern Mu Us Desert.
After a sample site was selected, the crust thickness was measured using a tape. In each sample site, the undisturbed crust layer was sampled using a cylindrical container with a 15 cm diameter (with an area of 1.77 dm2). Moreover, biocrust mass was represented by moss biomass per unit area (g dm−2). The soil on the mosses was removed by wet sieving, and the moss plants were used as the biocrust samples. Various types of crusts from each plot were collected to determine the maximum water interception capacity (Max WIC, g dm−2) and maximum water-holding (storage) capacity (Max WHC, g dm−2). Ten samples were collected for analysis in each sample site and all samples collated. Soil samples were collected using a soil drilling sample corer. The samples in the soil layers were collected at depths of 0–3, 3–5, and 5–10 cm. Three replicates were taken from each sample site, and the same layer samples were mixed into one sample for each plot. Bulk density (BD, g cm−3) was measured using a soil bulk sampler (100 cm3) stainless steel cutting ring and soil total porosity (TP, %) was calculated by the (1− BD ∕ PD) ×100, where BD represents soil bulk density (g cm−3) and PD represents particle density (g cm−3), which was assumed to be 2.65 g cm−3. The samples were weighed and then oven-dried to a constant weight at 105 ∘C and then weighed to determine BD and soil water content (SWC, weight – %). The analyses in each sample site were repeated five times.
2.3 Water interception and water holding capacity of litter crust
Water interception was defined as the amount of rainfall temporarily stored in the litter after drainage ceased (Guevara-Escobar et al., 2007; Acharya et al., 2016). In the laboratory, collected litter was air-dried (65 ∘C to constant weight) and weighed to obtain the dry weight. To measure the amount of water intercepted by the litter, a circular quadrat with a permeable mesh bottom (diameter of 15 cm) was used in such a way that the quadrat area was equal to that of the soil corer. The collected litter was then distributed uniformly over the entire quadrat. Simulated rainfall (rainfall intensity was 20 mm h−1) was applied to the quadrats for 30 min continuously and then allowed to rest for 10 min in order for the moisture to stabilize before weighing to determine the Max WIC (g dm−2).
To determine the Max WHC, all crust samples were submerged in water for 24 h. The samples were retrieved from the water and allowed to air dry and drain for approximately 30 min. Then, the samples were weighed to obtain the maximum weight. The Max WHC (g dm−2) was calculated as the difference between the maximum weight and the dry weight. The soil organic matter content (SOM, g kg−1) was determined by the dichromate oxidation method.
2.4 Quantitative infiltration design
To investigate the influence of crusts on water infiltration, infiltration experiments using five different amounts of water were conducted in each plot. A cylinder with an inner diameter of 15 cm and a height of 15 cm was used for single-ring infiltrometry. Single-ring infiltrometry has been extensively applied as a basic infiltration measurement tool to measure the soil infiltration process (Ries and Hirt, 2008). The infiltration device was driven carefully to a depth of 5 cm by means of a plastic collar and a rubber hammer. To prevent water leakage from the ring, the same soil materials were used to support the outside of the ring.
A paper board (5×5 cm) was placed in the ring above the crust and soil to prevent scouring when the water was added into the ring. Specific quantitative amounts of water (500, 1000, 1500, 2000 and 2500 mL in the study) were carefully poured on the paper board until, as quickly as possible, it was 3 cm deep (the depth of 500 mL of water in the ring is close to 3 cm); this process was timed using a stopwatch. During the infiltration process, water was added by hand to maintain the water level within the ring. The amount of time required for water to infiltrate into the ring was recorded to determine the water infiltration rate. The infiltration measurement of each water quantity was repeated 3 times in each sample site. After the infiltration experiment, the ring was removed, and then, a vertical soil profile was quickly excavated and the infiltration depth (centimetres) measured directly using a tape.
Based on the water mass balance, the infiltration rate measured using the ring method was estimated from
where i represents the infiltration rate (mm min−1), W is the amount of water supplied for infiltration (mL), A is the infiltration area (cm2), T is the infiltration time (min), and 10 is the conversion coefficient.
2.5 Statistical analyses
Two types of crusts (biocrust and litter crusts) were selected to determine the impact of crust components on hydrological process, and five BSL plots were selected as controls. The normality of the data and their homoscedasticity were tested using the Kolmogorov–Smirnov and Levene tests. In these comparisons, we conducted analysis of variance (ANOVA) on the data. Tukey's honestly test was used to analyse the differences in SWC, BD and TP in the different crust types at the different soil layers or within the same soil layer. Differences in the crust thickness, Max WHC, and WIR of the crust types were also tested using Tukey's honestly test. The difference in the Max WIC of LC2 and LC4 was detected using an independent t test. All differences were tested at the level of p<0.05. Generalized linear model (GLM) analysis was used to explain the interactions between crust types and water supply in determining the water infiltration time, depth and rate. Correlation analysis was performed to explore the relationships among the different soil properties and the infiltration rates under different water supply scenarios. All of these statistical analyses were completed using R statistical software v 3.4.2 (R Development Core Team, 2017).
3.1 Influence of crusts on soil properties
The contents of SOM were markedly higher in crust soils than in BSL (Fig. 2). The highest SOM content was in LC4 at a depth of 0–3 cm, and was 3.8 times greater than the content in BSL and 2.4 times greater than the content found in biocrust. Compared to the BSL, the SOM contents in the subsurface layers (3–10 cm) were 63.6 %–108.4 %, 18.2 %–20.8 % and 48.2 %–79.2 % greater in the biocrust groups, LC2 and LC4, respectively. Within each type of crust, the SOM content clearly decreased with increasing soil depth. Over the 4-year period, the litter significantly reduced soil BD in both in surface soil and subsurface soil (Table 1). With the decrease in BD, soil TP was significantly higher in LC4 than in the BSL and in biocrust.
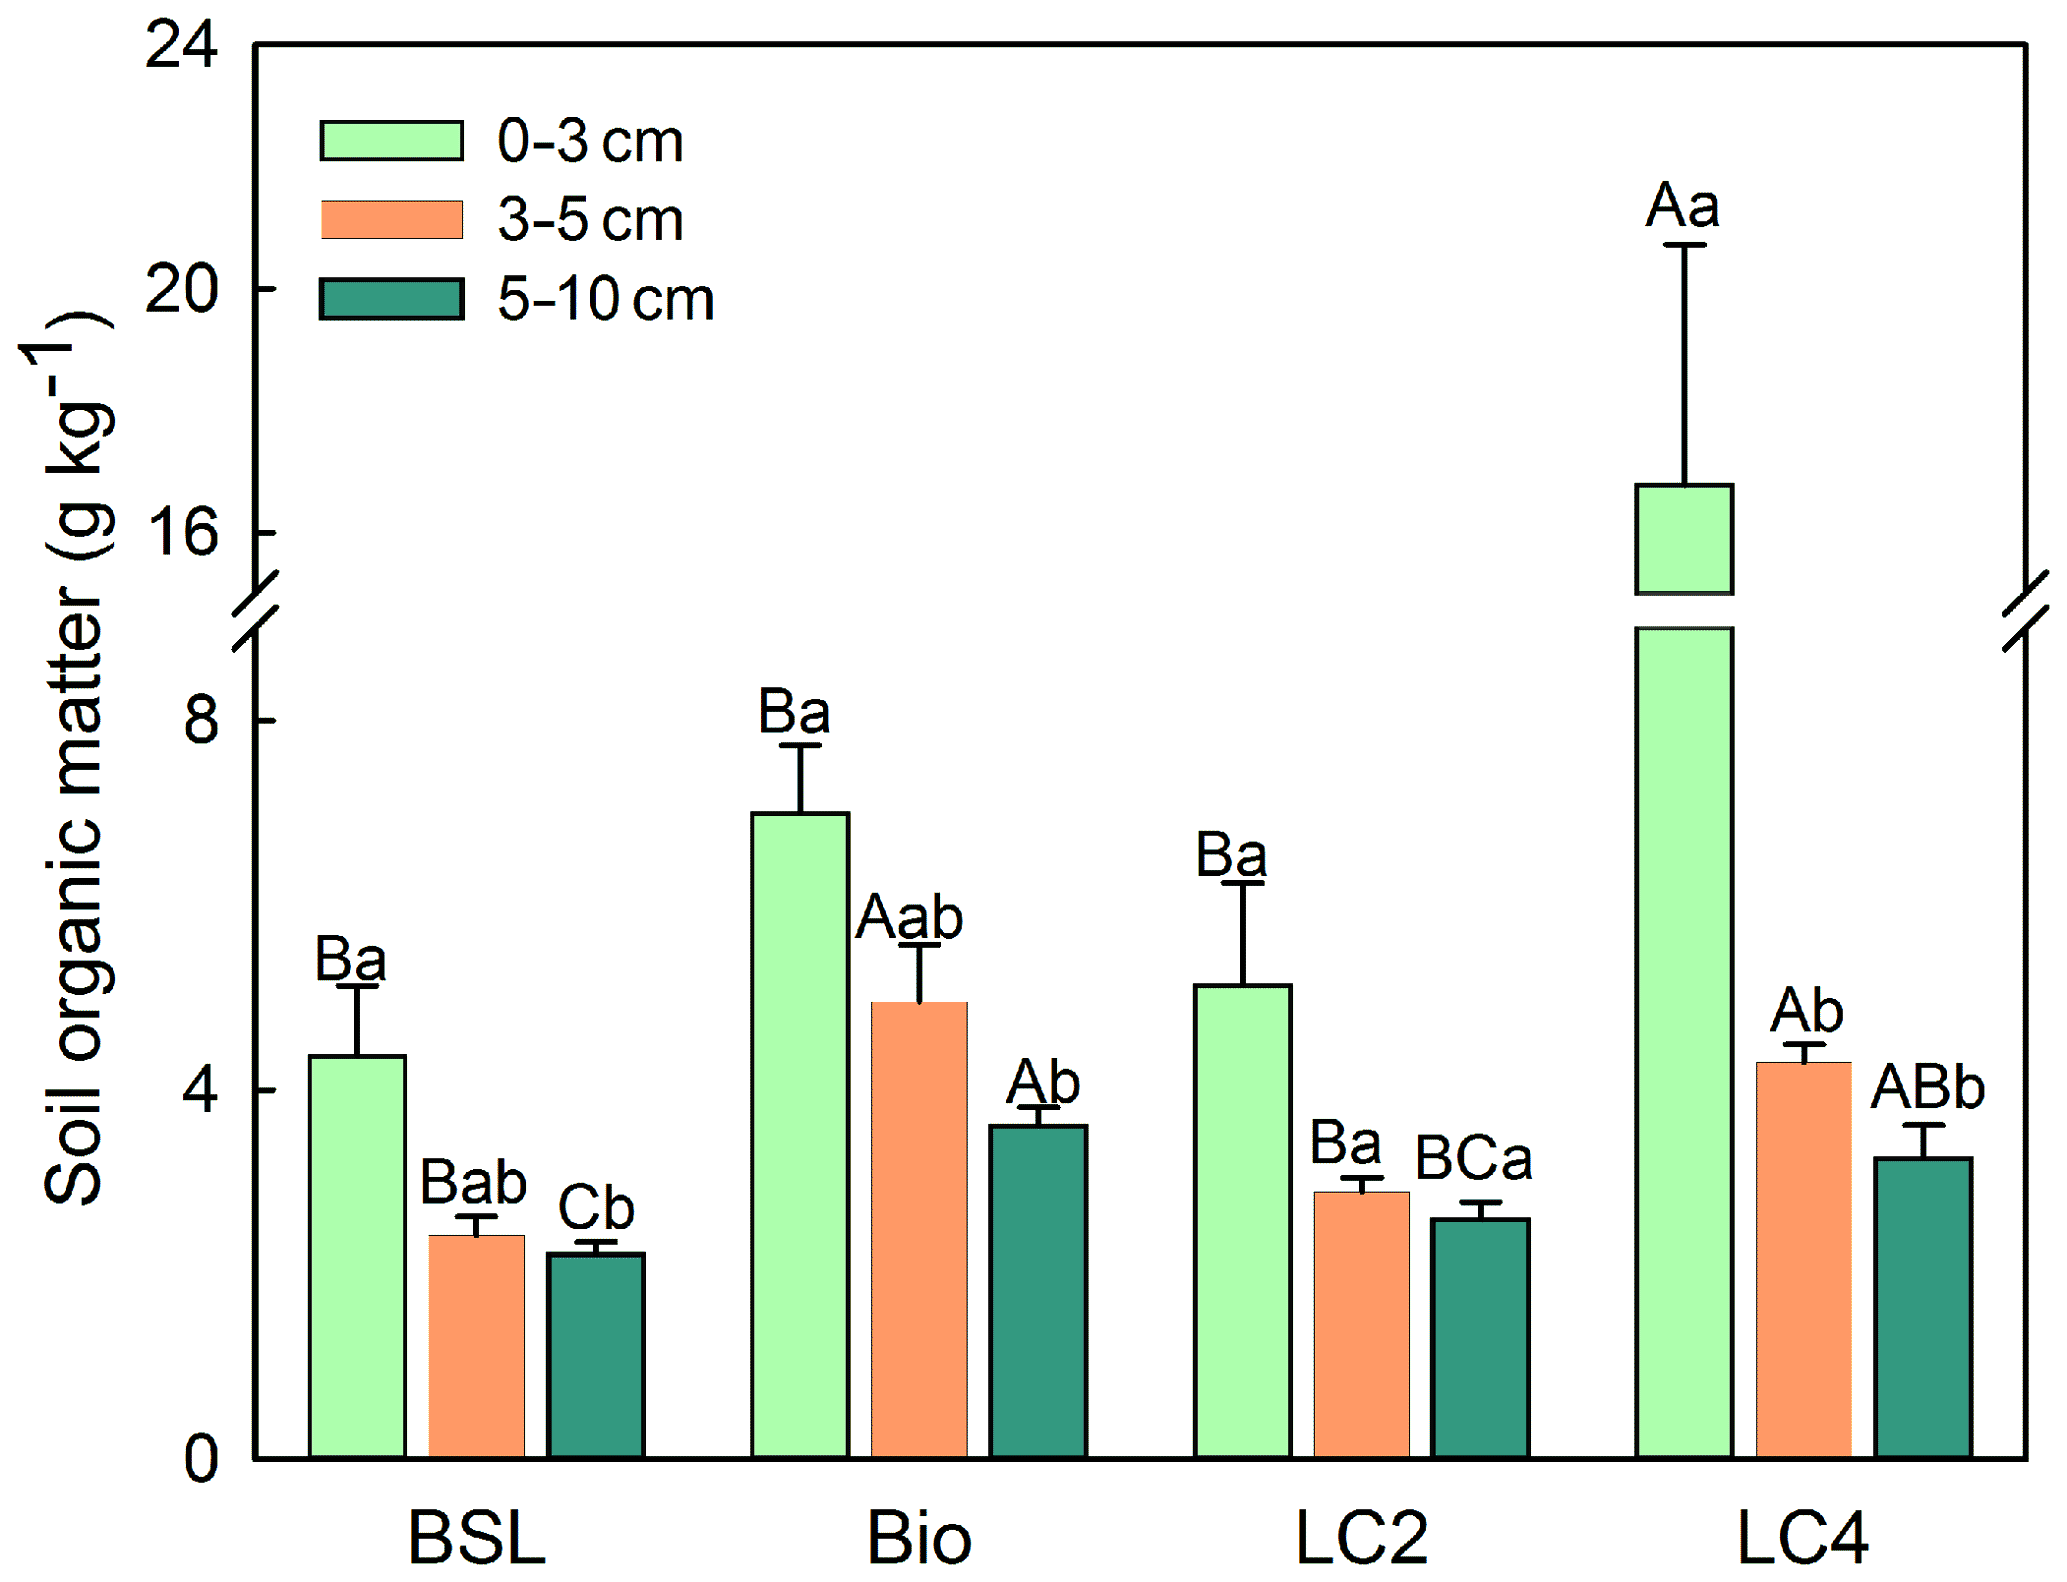
Figure 2Soil organic matter content (0–10 cm soil depth) in bare sandy land and different crust soils (M ± SE). Note: BSL, bare sandy land; Bio, moss crust; LC2, litter crust for 2 years; LC4, litter crust for 4 years. Different uppercase letters indicate significant differences among the various crust soils in the same soil layer at the level of p<0.05, and different lowercase letters indicate significant differences among the different soil layers at the level of p<0.05.
Table 1Soil water content and bulk density (mean ± SE) at the 0–10 cm soil layer depth with different crust types. SWC, soil water content; BD, bulk density; TP, soil total porosity; BSL, bare sandy land; Bio, moss crust; LC2, litter crust for 2 years; LC4, litter crust for 4 years. Different lowercase letters indicate significant differences among the various crust soils at the level of p<0.05, and different uppercase letters indicate significant differences among different depths at the level of p<0.05.
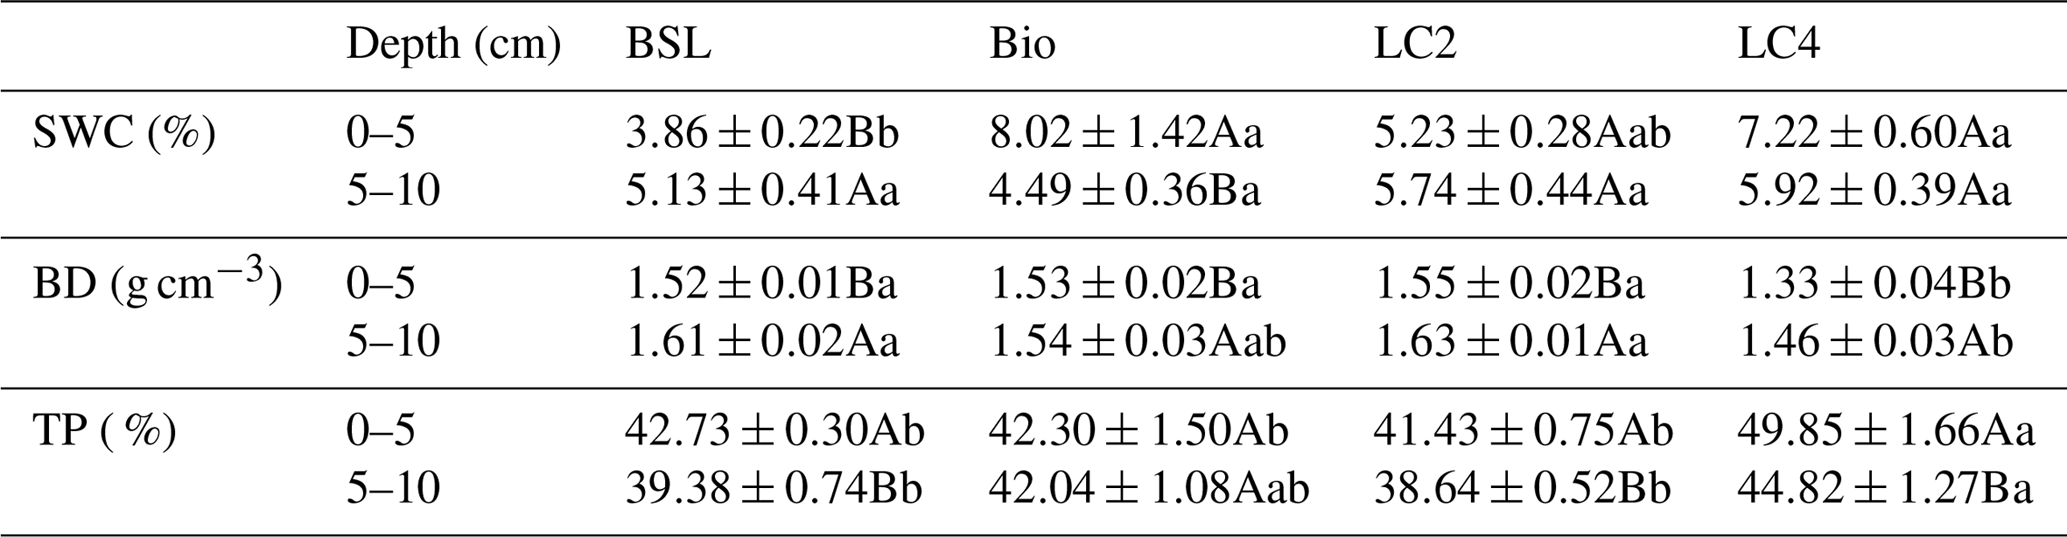
Soil properties did show differences between crust types (Table 1). Compared to the BSL, both biocrusts and litter crusts significantly increased SWC in surface soil (0–5 cm). However, SWC showed a decreasing trend in crusts and showed an increasing trend in the BSL with increasing soil depth. The SWC in the BSL was 33 % higher in surface soil than in subsurface soil (5–10 cm), while the SWCs in biocrusts and LC4 were 44 % and 18 % lower, respectively, in surface soil than in subsurface soil (5–10 cm).
3.2 Crusts improve hydrological effectiveness
The crust thickness, crust mass and Max WHC were clearly higher in the litter crust than in the biocrust (Fig. 3). Moreover, LC4 had a mass 1.6 times higher than the mass of LC2 (Fig. 3b). The Max WHC values in LC4 and LC2 were 3.2 and 2.0 times that of biocrust (Fig. 3c), respectively. Meanwhile, the Max WIC in LC4 was 72.1 % higher than in LC2 (Fig. 3d). An analysis of infiltration measurements showed that the effects of crust type and water supply on infiltration time, depth and rate were all significant (Table 2). While the water infiltration rate with a 500 mL water supply in various crust types was ranked LC4 > biocrust > BSL > LC2, the infiltration rates with 1000, 1500, 2000 and 2500 mL water supplies in different crust types were ranked LC4 > LC2 > BSL > biocrust; further, the rates in litter crusts and biocrust were significantly different (Fig. 4). The water infiltration depth increased significantly with water supply, but the trend of water infiltration depths was BSL > LC2 > LC4 > biocrust among the different crust types (Fig. 5).
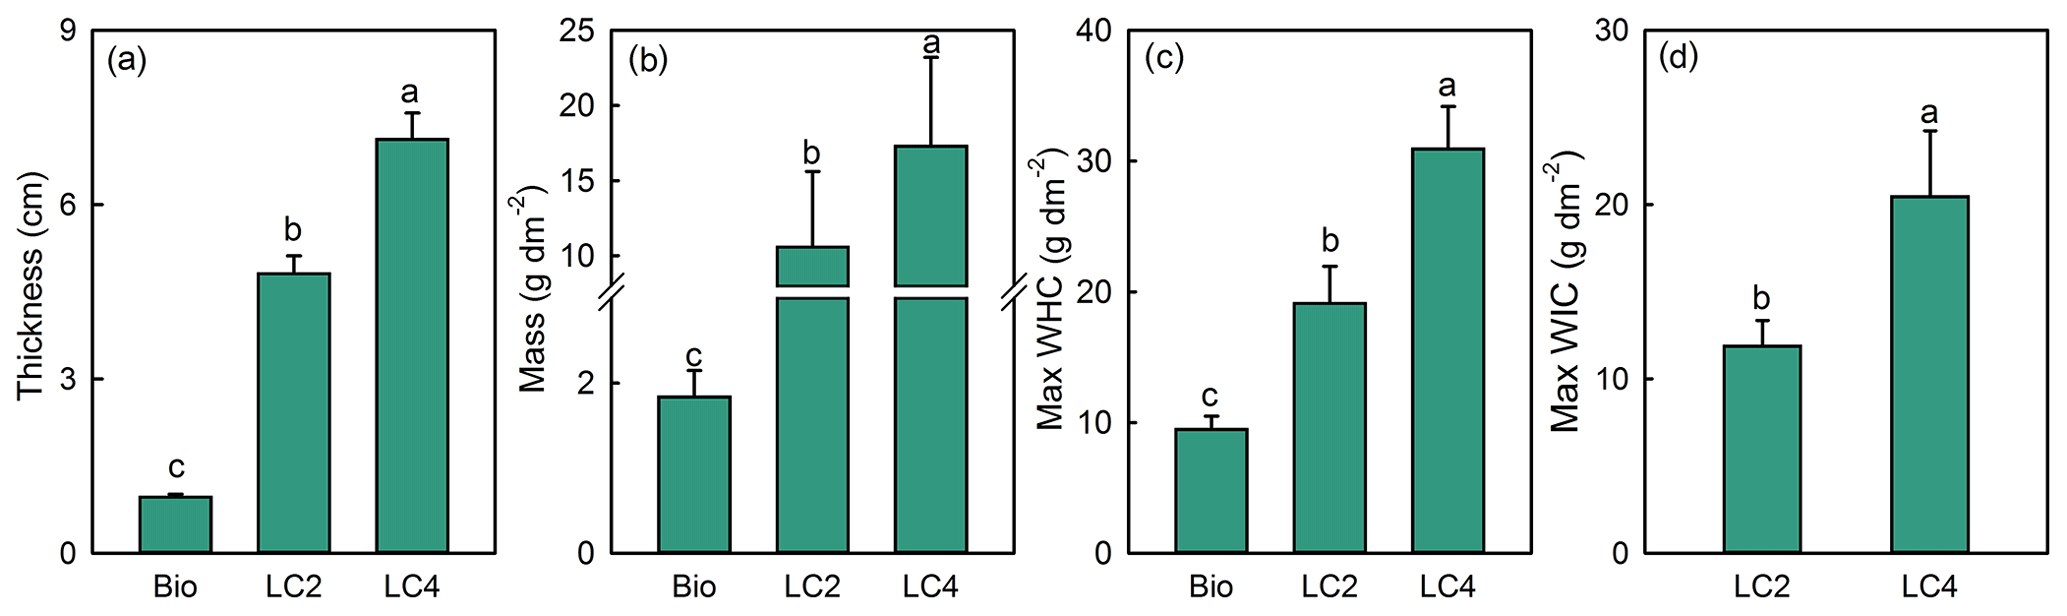
Figure 3Thickness (a), mass (b), maximum water holding capacity (c) and maximum water holding rate (d) in the bare sandy land and different crust plots (M ± SE). Note: BSL, bare sandy land; Bio, moss crust; LC2, litter crust for 2 years; LC4, litter crust for 4 years. Different lowercase letters indicate significant differences among the various crust plots at the level of p<0.05.
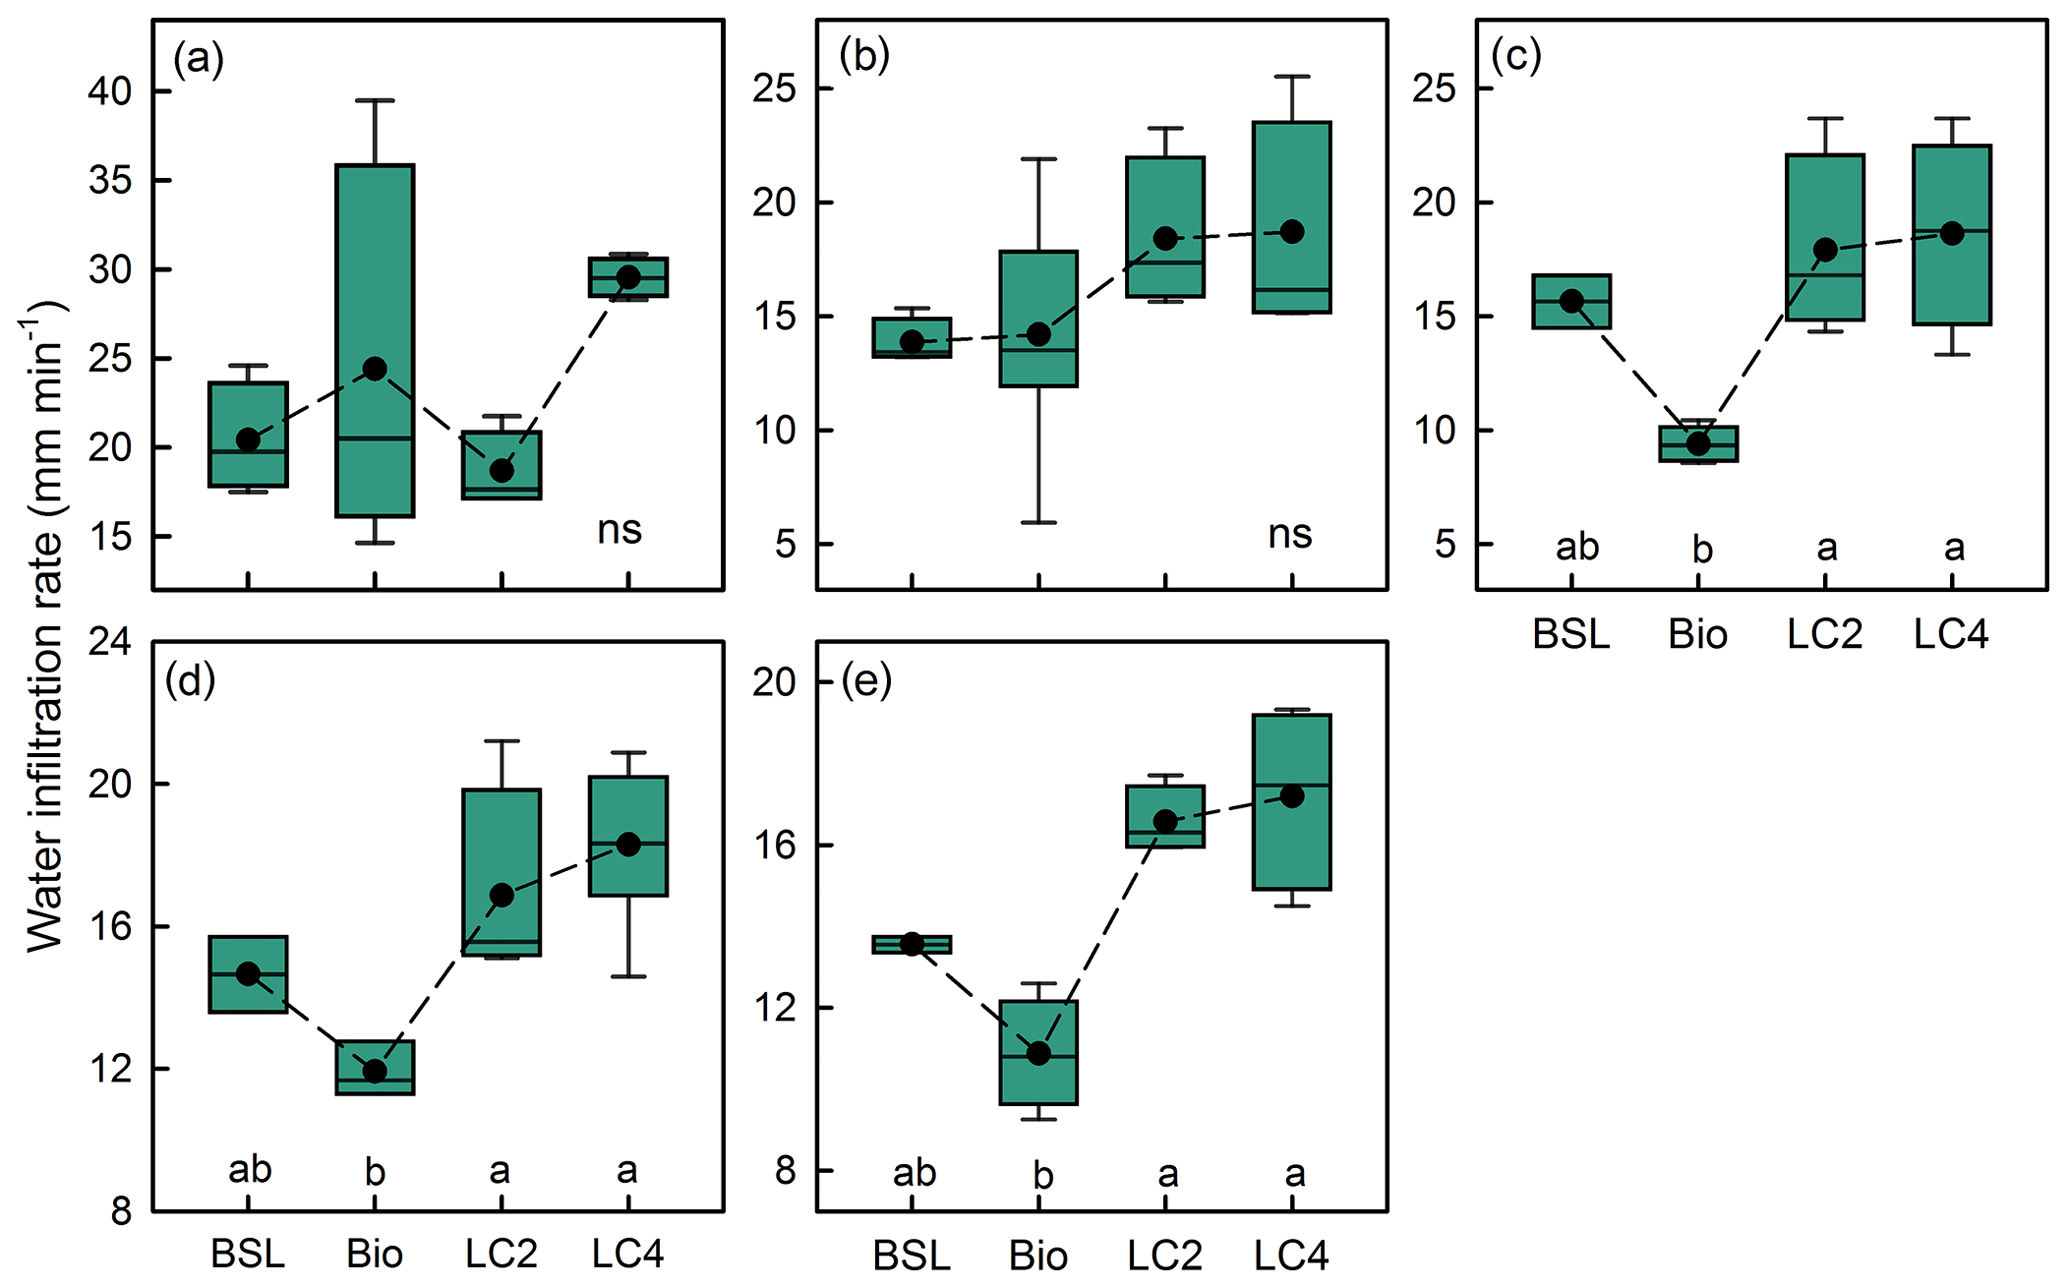
Figure 4Water infiltration rates (M ± SE) of different water volumes (a – 500, b – 1000, c – 1500, d – 2000, and e – 2500 mL) among bare sandy land and crust types. Note: ns, no significant difference, BSL, bare sandy land, Bio, moss crust; LC2, litter crust for 2 years; LC4, litter crust for 4 years. Dashed lines represent the average values. Different lowercase letters indicate significant differences among the various crust plots at the level of p<0.05.
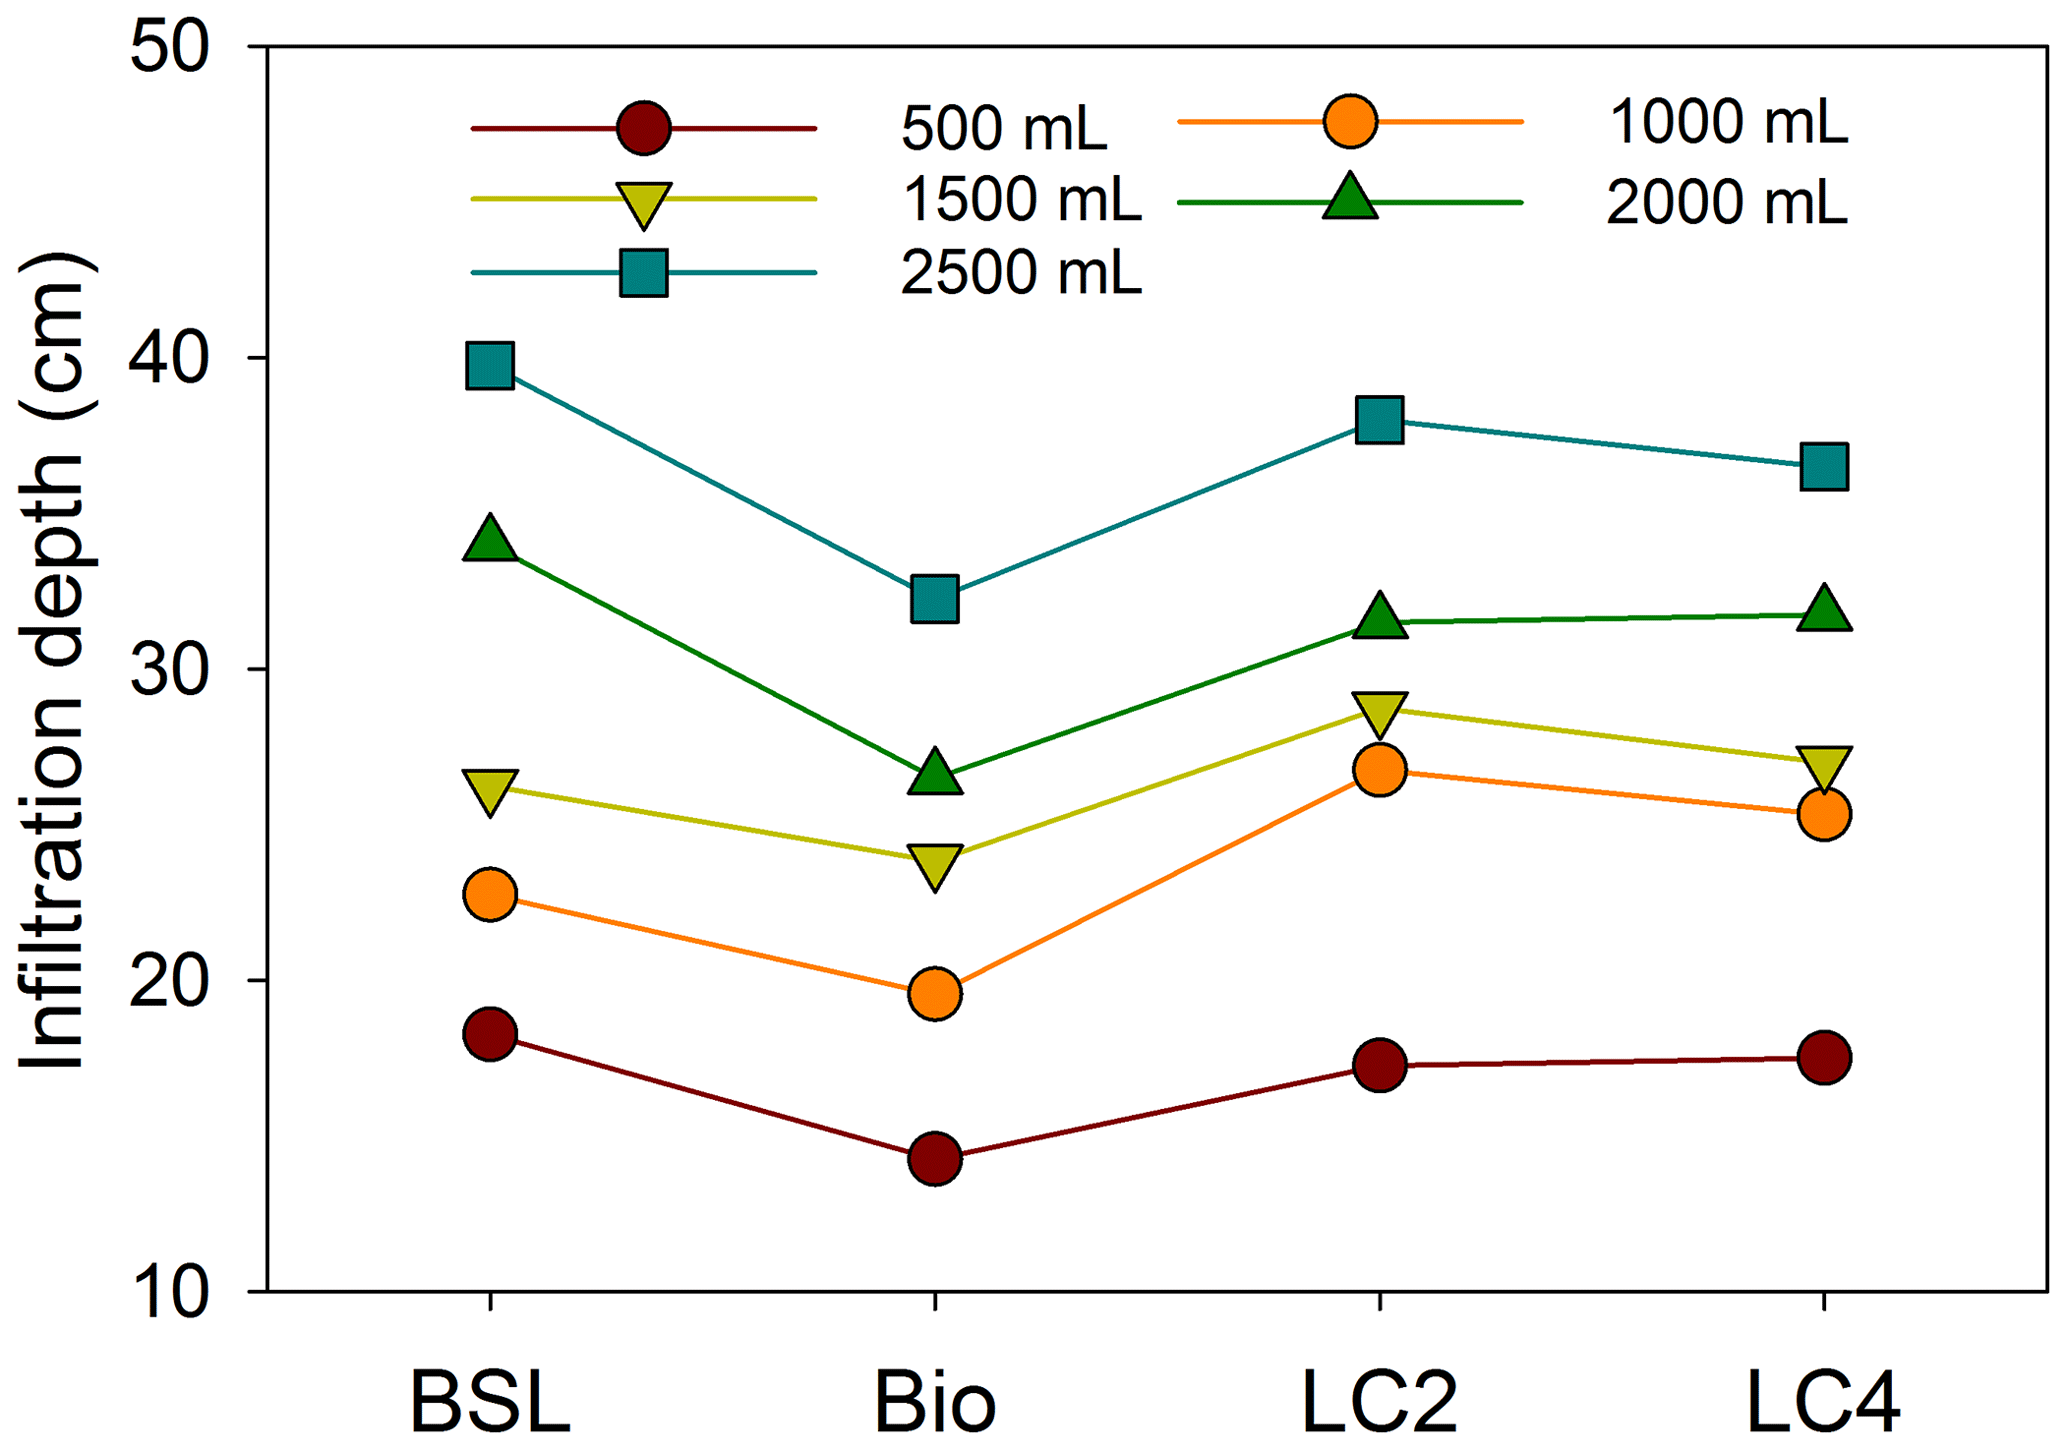
Figure 5Water infiltration depth of different water supplies among bare sandy land and crust types. Note: BSL, bare sandy land, Bio, moss crust; LC2, litter crust for 2 years; LC4, litter crust for 4 years; 500, 1000, 1500, 2000, and 2500 mL represent the quantities of water supplied at different treatments.
Table 2The results of GLM analysis for effects of crust types and the amount of water supply on the water infiltration time, infiltration depth and infiltration rate in the study. Note: type – bare sandy land, moss crust, litter crust for 2 years, litter crust for 4 years; water supply – 500, 1000, 1500, 2000 and 2500 mL.

3.3 Soil properties affect infiltration rates of different water supplies
Infiltration rates of different water supplies were significantly correlated with soil and crust properties as shown by Pearson's correlation analysis (Fig. 6). Crust thickness and mass were significantly correlated with high water supply (>1000 mL) infiltration rates. An infiltration rate with a 500 mL water supply was significantly positively correlated with TP in the 0–5 cm soil layer and SOM content in the 0–3 cm soil layer, and significantly negatively correlated with BD in the 0–5 and 5—10 cm soil layers. The infiltration rates of the 1000, 1500, 2000 and 2500 mL water supplies were significantly correlated with the SWC in the 5–10 cm soil layer.
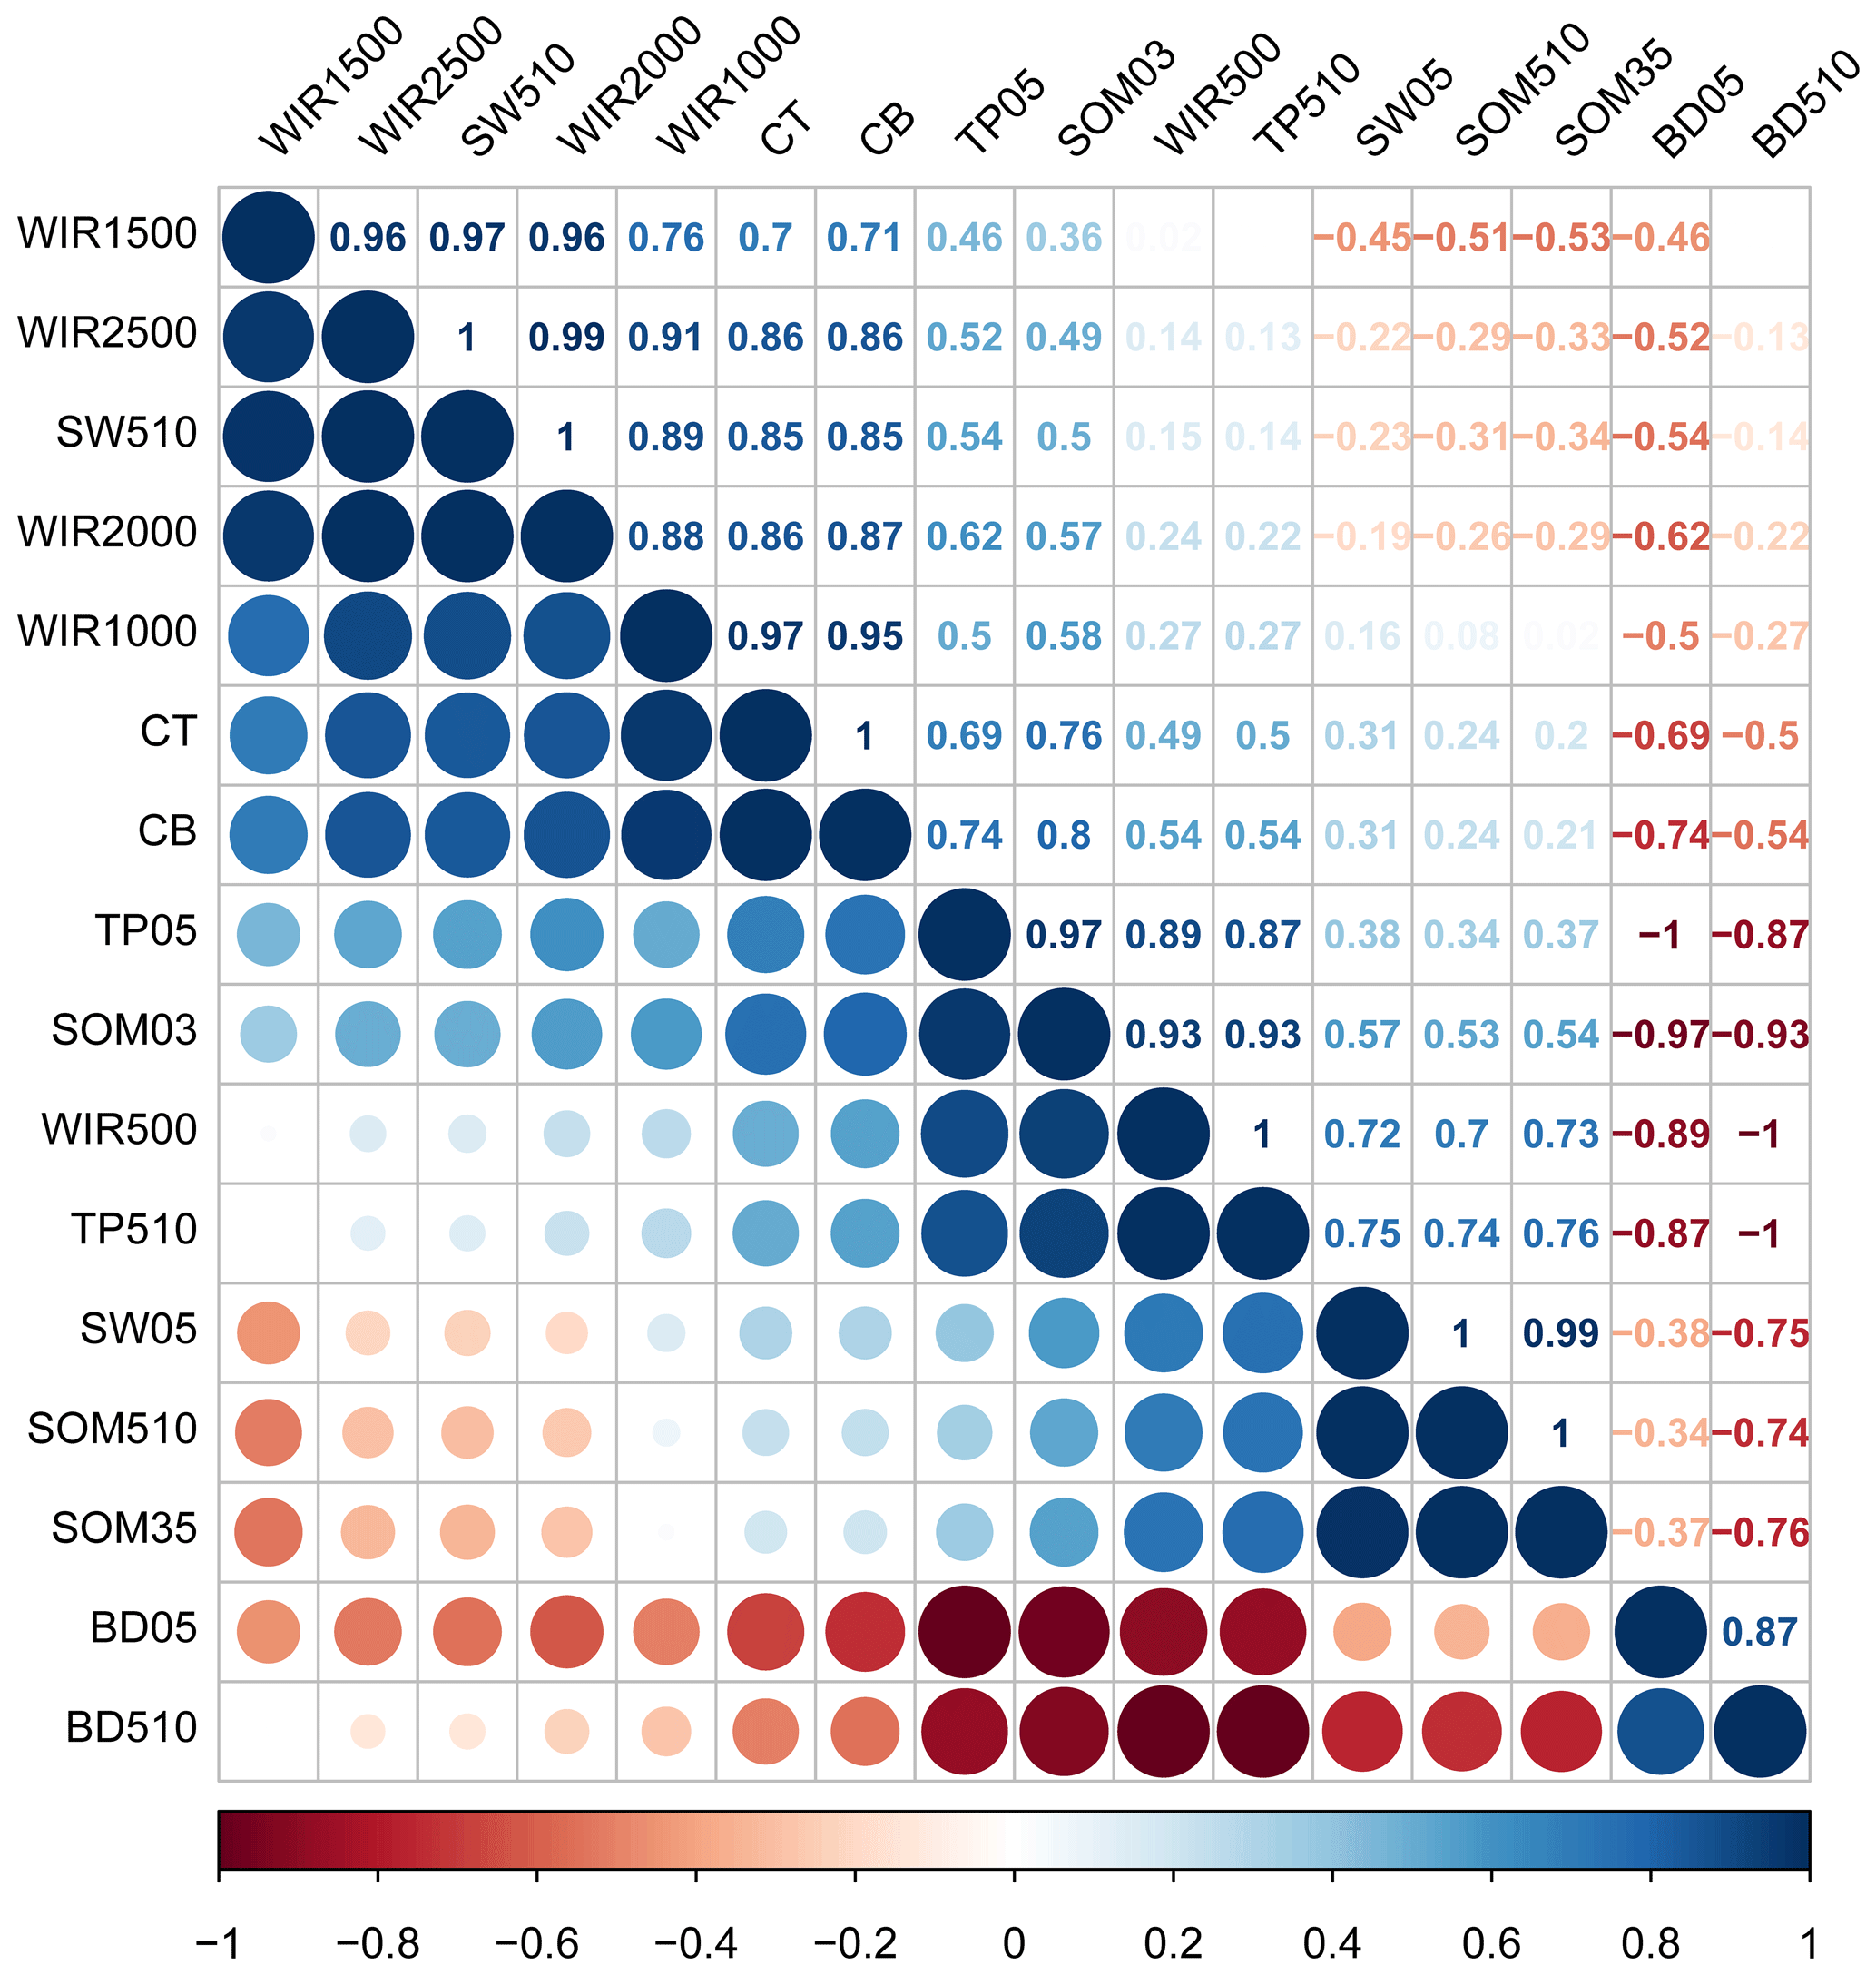
Figure 6Correlation matrix among the different soil and crust properties and water infiltration rates. Note: blue indicates positive correlations and red indicates negative correlations; the numerical values represent correlation coefficients. WIR500, WIR1000, WIR1500, WIR2000, and WIR2500 represent water infiltration rates (mm min−1) of the 500, 1000, 1500, 2000, and 2500 mL water supplies, respectively; CT and CB represent crust thickness (cm) and crust mass (g dm−2); SW05 and SW510 represent soil water content in the 0–5 and 5–10 cm soil layers (%); SOM03, SOM35, and SOM510 represent soil organic matter content (g kg−1) in the 0–3, 3–5, and 5–10 cm soil layers, respectively; BD05 and BD510 represent soil bulk density (g cm−3) in the 0–5 and 5–10 cm soil layers; TP05 and TP510 represent soil total porosity (%) in the 0–5 and 5–10 cm soil layers.
Biocrusts influence many soil properties that are also impacted by other major ecosystem processes in dry lands, such as nutrient cycling and hydrological processes (Gao et al., 2017). Previous studies have separately reported an increase in water retention and SOM content due to the presence of biocrusts (Chamizo et al., 2016). To our knowledge, few previous studies have reported how soil properties change in the litter crusts or how litter crust influences the hydrological processes in sandy lands (Jia et al., 2018). We examined changes in soil properties and hydrological functions in contrasting biocrusts and litter crusts in a desert ecosystem. Our results will fill these gaps in knowledge and demonstrate that litter crusts significantly influence soil properties and hydrological processes in sandy lands.
4.1 Influence of litter crusts on soil properties
As plant litter falls to the ground, it forms an assembly developing a porous barrier that is structured by wind and water called litter crust. The litter crust modifies the bidirectional fluxes of liquid water and water vapor and affects water evaporation from the soil by insulating the soil surface from the atmosphere and by intercepting radiation (Dunkerley, 2015; Van Stan et al., 2017). Litter crusts play an important role in changing soil bulk density and porosity, and they serve as a major source of soil organic matter in surface soils. The present study showed that litter crusts decreased the soil bulk density and increased soil porosity and SOM contents. Litter decomposition is an important ecosystem process that is critical to maintaining available nutrients. The SOM is formed through the partial decomposition and transformation of plant litter by soil organisms (Cotrufo et al., 2015). Fragments produced during litter decomposition can promptly associate with the topsoil layer, while some brittle residues move to surface soils by water and wind transfer before forming coarse particulate organic matter in the soil. The addition of organic matter to the soil increases porosity and decreases bulk density. This study demonstrated that SOM is significantly higher in LC4 than in LC2. The decomposition times of the two litter crusts are a powerful explanation for this result. Over time, the increasing quantity of litter input forms a new microclimate and promotes SOM accumulation in surface soils (Liu et al., 2017). The Max WHC also contributes to the higher SOM in LC4. In general, the higher water content enhanced the decomposition rate in litter monocultures (Makkonen et al., 2013).
In our study, litter crusts and biocrusts significantly increased surface soil moisture. However, the biocrusts showed obvious desiccation in the subsurface soil layer not present in litter crusts. The higher moisture under biocrusts can be attributed to biocrust-anchoring structures that bind soil particles and form mats on the soil surface; these properties strongly increase soil surface water retention (Chamizo et al., 2012). In arid and semi-arid regions during low-intensity rainfall, dominant in our study area, rainfall is completely intercepted by biocrusts and cannot penetrate the crust to reach the subsurface soil. Moreover, biocrusts decrease subsurface soil water by consuming water during growth, which results in the desiccation of the subsurface soil layer. The change in soil properties (BD, porosity and SOM) caused by litter crusts improved hydrological characteristics.
4.2 Effect of litter crusts on hydrological processes
The litter crusts can develop a significant thickness depending on wind, water and other factors. Our study showed that litter crusts could reach 5 cm in 2-year old and 9 cm in 4-year old Populus simonii forests. Our study also demonstrated that there are significant differences in the porosity of different aged litter crusts and that there are differences in the interstitial spaces of litter crusts. These variations are major contributors that can cause the observed differences in the WIC of litter crusts. The WIC of litter crusts is an integral factor impacting litter infiltration and the development of surface runoff (Gerrits et al., 2010; Dunkerley, 2015). This is because litter interception of a certain amount of water can satisfy early stage infiltration and runoff water requirements (Gerrits et al., 2010). Litter crusts are continually broken down and decomposed by microbial activities and, therefore, the frequency of movement and recombination of litter crusts and other organic components can also be considered to influence the porosity and hydrological characteristics of litter crusts (Dunkerley, 2015). In our study, the Max WHC of litter crusts was 48.7 g dm−2. However, the maximum volume of litter crust was 1540 cm3, and only approximately 5 % of the available void space in the litter was occupied by water. This result indicates that water is retained only in smaller void spaces within the litter crusts and not in large gaps, where gravity drainage is expected to dominate due to gravity and cohesive forces, which primarily control interception (Li et al., 2013; Dunkerley, 2015). The litter crust could store water equal to 154 %–200 % of its dry weight, so a large proportion of this storage water is determined by the litter characteristics. In our study, the dominant litter crusts were formed by broadleaf litter (Populus simonii leaves), which played an important role in determining the water dynamics of the litter crusts (Sato et al., 2004). According to the findings of Li et al. (2013), the Max WHC showed a strong linear relationship with litter mass, whether the litter was a monoculture or a mixture. The maximum mass in LC4 was 28.3 g dm−2, indicating the possibility of high water storage levels.
The high WIC of litter crusts and soil organic matter help to maintain maximum infiltration rates, allowing penetration of water into the soil profile, thereby slowing soil desiccation caused by evaporation (Sayer, 2005). The litter and SOM can increase soil porosity and aeration indirectly, thus increasing the WIR. Our results show that the SOM content is positively correlated with porosity and negatively correlated with BD. Meanwhile, compared to BSL, the litter crusts increased the WIR with water supplies >1000 mL. The low water supply (500 and 1000 mL) was similar to low-intensity rainfall, and soil or litter crusts quickly absorbed water. This observation is believed to be related to the amount of available water and the empty storage spaces in soil or litter crusts that have not yet reached their full water retention capacities (Dunkerley, 2015); as a result, there were no significant differences in the WIRs between different crust types. When the affected soil layer was saturated and water was transported to deeper soil layers, the WIR could be considered a soil characteristic that is dependent on the initial soil water content (Thompson et al., 2010). Therefore, the TP and SOM contents in the surface soil layer significantly influenced the WIR with low water supplies, and BD and SWC significantly influenced the WIR with high water supply. The increased WHC and WIC in litter crusts and surface soil layers are the main reason the WIR in the litter crusts were slightly lower than in BSL. In addition, abundant SOM results in a soil structure that is uncompacted, which can lead to the partitioning of water into lateral flows in litter crusts.
More diverse litter crusts can reasonably be assumed to be structurally richer than monospecific litter crusts (Hättenschwiler et al., 2005). Different litter sizes, litter shapes and litter colours all contribute to distinct geometric organization, WIC, WHC and radiative-energy balance in a species-rich litter layer (Sato et al., 2004). In our study, a monoculture litter was researched to analyse the impacts of litter crusts on soil properties and hydrological functions. In the future, the effects of litter crusts mixed with different species, not only on litter structure but also on the movement of water within the litter crusts, should be considered. Moreover, litter crusts affected vegetation properties, such as seed germination, seedling emergence, establishment, and survival (Jia et al., 2018), and this should receive more attention to improve the vegetation in desert ecosystems.
Litter crusts significantly influenced soil properties and hydrological functions. The presence of litter crusts plays a critical role in soil fertility and hydrological functions in sandy lands. Litter crusts increased the soil water content in both the surface (0–5 cm) and subsurface (5–10 cm) soils, but biocrusts increased the soil water content in the surface soil and decreased the content in the subsurface soil. Litter crusts significantly increased soil organic matter by 2.4 times and 3.8 times the content in biocrusts and bare sandy lands, respectively. Higher organic matter content resulted in increased soil porosity and decreased soil bulk density. Meanwhile, soil organic matter can help to maintain maximum infiltration rates. Litter crusts significantly increased the water infiltration rates with high water supplies (>1000 mL). With low water supplies, the water infiltration rate was mainly determined by soil organic matter and soil porosity. The water infiltration was mainly determined by soil water content and crust properties when water supplies were high. Our results suggested that litter crusts significantly improved the soil properties, thereby influencing the hydrological processes. A number of national ecological programs have improved vegetation recovery and litter crust development extensively in China. The results indicate that litter crusts are instrumental in many hydrological processes because of their ability to increase organic matter and water infiltration. Therefore, it is necessary to consider the hydrological effectiveness of litter crusts. In the future, the effects of litter crusts mixed with different species, not only on litter structure but also on the movement of water within the litter crusts, should be considered. Moreover, the litter crusts effected vegetation properties, such as seed germination, seedling emergence, establishment, and survival, and these factors should receive more attention to improve the vegetation in desert ecosystems.
All the data used in this study can be requested by contacting the corresponding author Gao-Lin Wu at gaolinwu@gmail.com.
GLW and YL conceived the study, and YL, ZC and HTM carried out the field experiments. YL, ZH, and GLW analyzed data. YL wrote the paper with contributions from all the co-authors.
The authors declare that they have no conflict of interest.
We thank the editors and anonymous reviewers for their constructive comments and suggestions on this work.
This research has been supported by the National Natural Science Foundation of China (NSFC grant nos. 41722107, 41525003, and 41390463), the West Light Foundation of the Chinese Academy of Science (grant nos. XAB2015A04 and XAB2018B09), and the Youth Talent Plan Foundation of Northwest A & F University (grant no. 2452018025).
This paper was edited by Miriam Coenders-Gerrits and reviewed by Darryl Carlyle-Moses and one anonymous referee.
Acharya, B. S., Stebler, E., and Zou, C. B.: Monitoring litter interception of rainfall using leaf wetness sensor under controlled and field conditions, Hydrol. Process., 31, 240–249, https://doi.org/10.1002/hyp.11047, 2016.
Bulcock, H. H. and Jewitt, G. P. W.: Field data collection and analysis of canopy and litter interception in commercial forest plantations in the KwaZulu-Natal Midlands, South Africa, Hydrol. Earth Syst. Sci., 16, 3717–3728, https://doi.org/10.5194/hess-16-3717-2012, 2012.
Chamizo, S., Cantón, Y., Miralles, I., and Domingo, F.: Biological soil crust development affects physicochemical characteristics of soil surface in semiarid ecosystems, Soil Biol. Biochem., 49, 96–105, https://doi.org/10.1016/j.soilbio.2012.02.017, 2012.
Chen, Y. P., Wang, K. B., Lin, Y. S., Shi, W. Y., Song, Y., and He, X.: Balancing green and grain trade, Nat. Geosci., 8, 739–741, https://doi.org/10.1038/ngeo2544, 2015.
Chomel, M., Guittonny-Larchevêque, M., Desrochers, A., and Baldy, V.: Effect of mixing herbaceous litter with tree litters on decomposition and n release in boreal plantations, Plant Soil, 398, 229–241, https://doi.org/10.1007/s11104-015-2648-5, 2016.
Cotrufo, M. F., Soong, J. L., Horton, A. J., Campbell, E. E., Haddix, M. L., Wall, D. H., and Parton, W. J.: Formation of soil organic matter via biochemical and physical pathways of litter mass loss, Nat. Geosci., 8, 776–779, https://doi.org/10.1038/ngeo2520, 2015.
Dunkerley, D.: Percolation through leaf litter: What happens during rainfall events of varying intensity?, J. Hydrol., 525, 737–746, https://doi.org/10.1016/j.jhydrol.2015.04.039, 2015.
Gao, L. Q., Bowker, M. A., Xu, M. X., Sun, H., Tuo, D. F., and Zhao, Y. G.: Biological soil crusts decrease erodibility by modifying inherent soil properties on the Loess Plateau, China, Soil Biol. Biochem., 105, 49–58, https://doi.org/10.1016/j.soilbio.2016.11.009, 2017.
Geist, H. J. and Lambin, E. F.: Dynamic causal patterns of desertification, Bioscience, 54, 817–829, https://doi.org/10.1641/0006-3568(2004)054[0817:DCPOD]2.0.CO;2, 2004.
Gerrits, A. M. J., Savenije, H. H. G., Hoffmann, L., and Pfister, L.: New technique to measure forest floor interception – an application in a beech forest in Luxembourg, Hydrol. Earth Syst. Sci., 11, 695–701, https://doi.org/10.5194/hess-11-695-2007, 2007.
Gerrits, A. M. J., Pfister, L., and Savenije, H. H.: Spatial and temporal variability of canopy and forest floor interception in a beech forest, Hydrol. Process., 24, 3011–3025, https://doi.org/10.1002/hyp.7712, 2010.
Grote, E. E., Belnap, J., Housman, D. C., and Sparks, J. P.: Carbon exchange in biological soil crust communities under differential temperatures and soil water contents: implications for global change, Glob. Change Biol., 16, 2763–2774, https://doi.org/10.1111/j.1365-2486.2010.02201.x, 2010.
Guevara-Escobar, A., Gonzalez-Sosa, E., Ramos-Salinas, M., and Hernandez-Delgado, G. D.: Experimental analysis of drainage and water storage of litter layers, Hydrol. Earth Syst. Sci., 11, 1703–1716, https://doi.org/10.5194/hess-11-1703-2007, 2007.
Hättenschwiler, S., Tiunov, A. V., and Scheu, S.: Biodiversity and litter decomposition in terrestrial ecosystems, Annu. Rev. Ecol. Evol. S., 36, 191–218, https://doi.org/10.1146/annurev.ecolsys.36.112904.151932, 2005.
Huenneke, L. F., Anderson, J. P., Remmenga, M., and Schlesinger, W. H.: Desertification alters patterns of aboveground net primary production in Chihuahuan ecosystems, Glob. Change Biol., 8, 247–264, https://doi.org/10.1046/j.1365-2486.2002.00473.x, 2010.
Jia, C., Huang, Z., Miao, H. T., Lu, R., Li, J. J., Liu, Y., Shen, W. B., He, H. H., and Wu, G. L.: Litter crusts promote herb species formation by improving surface microhabitats in a desert ecosystem, Catena, 171, 245–250, https://doi.org/10.1016/j.catena.2018.07.024, 2018.
Juancamilo, V., Davidd, B., Zou, C, and Darinj, L.: Ecohydrological controls of soil evaporation in deciduous drylands: How the hierarchical effects of litter, patch and vegetation mosaic cover interact with phenology and season, J. Arid Environ., 74, 595–602, https://doi.org/10.1016/j.jaridenv.2009.09.028, 2010.
Kéfi, S., Rietkerk, M., Alados, C. L., Pueyo, Y., Papanastasis, V. P., Elaich, A., and de Ruiter, P. C.: Spatial vegetation patterns and imminent desertification in Mediterranean arid ecosystems, Nature, 449, 213–217, https://doi.org/10.1038/nature06111, 2007.
Li, X., Niu, J. Z., and Xie, B. Y.: Study on hydrological functions of litter layers in north China, PLoS One, 8, e70328, https://doi.org/10.1371/journal.pone.0070328, 2013.
Li, X. R., Xiao, H. L., He, M. Z., and Zhang, J. G.: Sand barriers of straw checkerboards for habitat restoration in extremely arid desert regions, Ecol. Eng., 28, 149–157, https://doi.org/10.1016/j.ecoleng.2006.05.020, 2006.
Liu, Y., Dang, Z. Q., Tian, F. P., Wang, D., and Wu, G. L.: Soil organic carbon and inorganic carbon accumulation along a 30-year grassland restoration chronosequence in semi-arid regions (China), Land Degrad. Dev., 28, 189–198, https://doi.org/10.1002/ldr.2632, 2017.
Liu, Y., Miao, H. T., Huang, Z., Cui, Z., He, H. H., Zheng, J. Y., Han, F. P., Chang, X. F., and Wu, G. L.: Soil water depletion patterns of artificial forest species and ages on the Loess Plateau (China), Forest. Ecol. Manag., 417, 137–143, https://doi.org/10.1016/j.foreco.2018.03.005, 2018.
Makkonen, M., Berg, M. P., van Logtestijn, R. S. P., van Hal, J. R., and Aerts, R.: Do physical plant litter traits explain non-additivity in litter mixtures? A test of the improved microenvironmental conditions theory, Oikos, 122, 987–997, https://doi.org/10.1111/j.1600-0706.2012.20750.x, 2013.
Reynolds, J. F., Smith, D. M. S., Lambin, E. F., Nd, T. B., Mortimore, M., Batterbury, S. P., Downing, T. E., Dowlatabadi, H., Fernández, R. J., Herrick, J. E., Huber-Sannwald, E., Jiang, H., Leemans, R., Lynam, T., Maestre, F. T., Ayarza, M., and Walker, B.: Global desertification: building a science for dryland development, Science, 316, 847–851, https://doi.org/10.1126/science.1131634, 2007.
Ries, J. B. and Hirt, U.: Permanence of soil surface crusts on abandoned farmland in the Central Ebro Basin Spain, Catena, 72, 282–296, https://doi.org/10.1016/j.catena.2007.06.001, 2008.
Sato, Y., Kumagai, T., Kume, A., Otsuki, K., and Ogawa, S.: Experimental analysis of moisture dynamics of litter layers-the effects of rainfall conditions and leaf shapes, Hydrol. Process., 18, 3007–3018, https://doi.org/10.1002/hyp.5746, 2004.
Sayer, E. J.: Using experimental manipulation to assess the roles of leaf litter in the functioning of forest ecosystems, Biol. Rev., 80, 1–31, https://doi.org/10.1017/S1464793105006846, 2005.
Thompson, S. E., Harman, C. J., Heine, P., and Katul, G. G.: Vegetation-infiltration relationship across climatic and soil type gradients, J. Geophys. Res., 115, G02023, https://doi.org/10.1029/2009JG001134, 2010.
Van Stan II, J. T., Coenders-Gerrits, M., Dibble, M., Bogeholz, P., and Norman, Z.: Effects of phenology and meteorological disturbance on litter rainfall interception for a Pinus elliottii stand in the Southeastern United States, Hydrol. Process., 31, 3719–3728, https://doi.org/10.1002/hyp.11292, 2017.
Wu, G. L., Wang, D., Liu, Y., Hao, H. M., Fang, N. F., and Shi, Z. H.: Mosaic-pattern vegetation formation and dynamics driven by the water–wind crisscross erosion, J. Hydrol., 538, 355–362, https://doi.org/10.1016/j.jhydrol.2016.04.030, 2016.