the Creative Commons Attribution 4.0 License.
the Creative Commons Attribution 4.0 License.
Contribution of low-frequency climatic–oceanic oscillations to streamflow variability in small, coastal rivers of the Sierra Nevada de Santa Marta (Colombia)
Juan Camilo Restrepo
Aldemar Higgins
Jaime Escobar
Silvio Ospino
Natalia Hoyos
This study evaluated the influence of low-frequency oscillations, that are linked to large-scale oceanographic–atmospheric processes, on streamflow variability in small tropical coastal mountain rivers of the Sierra Nevada de Santa Marta, Colombia. We used data from six rivers that had > 32 years of complete, continuous monthly streamflow records. This investigation employed spectral analyses to (1) explore temporal characteristics of streamflow variability, (2) estimate the net contribution to the energy spectrum of low-frequency oscillations to streamflow anomalies, and (3) analyze the linkages between streamflow anomalies and large-scale, low-frequency oceanographic–atmospheric processes. Wavelet analyses indicate that the 8–12-year component exhibited a quasi-stationary state, with a peak of maximum power between 1985 and 2005. These oscillations were nearly in phase in all rivers. Maximum power peaks occurred for the Palomino and Rancheria rivers in 1985 and 1995, respectively. The wavelet spectrum highlights a change in river variability patterns between 1995 and 2015, characterized by a shift towards the low-frequency oscillations' domain (8–12 years). The net contribution of these oscillations to the energy spectrum was as high as 51 %, a value much larger than previously thought for rivers in northwestern South America. The simultaneous occurrence of hydrologic oscillations, as well as the increase in the amplitude of the 8–12-year band, defined periods of extremely anomalous wet seasons during 1989–1990, 1998–2002 and 2010–2011, reflecting the role of low-frequency oscillations in modulating streamflow variability in these rivers. Cross-wavelet transform and wavelet coherence revealed high common powers and significant coherences in low-frequency bands (>96 months) between streamflow anomalies and Atlantic Meridional Oscillation (AMO), Pacific Decadal Oscillation (PDO) and the Tropical North Atlantic Index (TNA). These results show the role of large-scale, low-frequency oceanographic–climate processes in modulating the long-term hydrological variability of these rivers.
- Article
(11936 KB) - Full-text XML
-
Supplement
(3826 KB) - BibTeX
- EndNote
In the past several decades, streamflow variability has increased (Milliman et al., 2008; Dai et al., 2009), causing frequent and pronounced flood–drought cycles (Huntington, 2006). Atmospheric and oceanographic processes are major sources of streamflow variability (Jhonson et al., 2013; Schulte et al., 2016). The El Niño–Southern Oscillation (ENSO) is among the most prevalent oceanographic–atmospheric processes linked to streamflow variability in tropical and subtropical areas (Battisti and Sarachick, 1995; Amarasekera et al., 1997; Garcia and Mechoso, 2005; Labat, 2010). ENSO, however, is also affected by longer-period changes in the background state (Garreaud et al., 2009; Chowdary et al., 2014). It has been pointed out that its effects can be modulated by the coupling that exists between ENSO phases and long-period events, such as the Pacific Decadal Oscillation (PDO) and the Atlantic Meridional Oscillation (AMO) (i.e., Brown and Comrie, 2004; Murgulet et al., 2017; Shi et al., 2017). For example, the 1997–1998 El Niño event occurred during a PDO shift from a warm to a cold phase, but recent warming (2010–2011) in the Pacific occurred during a cold phase of the PDO. Multiple atmospheric–oceanographic oscillations collectively impose a more complex influence on hydrology (Labat, 2010; Nalley et al., 2016; Shi et al., 2017). Thus, changes in the intensity and frequency of extreme events depend on the coupling and teleconnections of these large-scale atmospheric–oceanographic processes. Overall, such interactions occur through changes in the sea level pressure (SLP) and sea surface temperature (SST) gradients, which in turn lead to flux changes in the atmosphere (i.e., Enfield and Alfaro, 1999; Jhonson et al., 2013; Sagarika et al., 2015; Murgulet et al., 2017; Shi et al., 2017). Such atmospheric and oceanographic interactions, as well as their role in hydrological variability, have gained attention in recent years (Tootle et al., 2008; Arias et al., 2015; Sagarika et al., 2015; Nalley et al., 2016). Thus, a major question in the study of hydrology is the potential effect of longer-period climate modes on the variability of hydrological processes and on the strength of a particular event, such as El Niño/Niña. The interplay that exists between the multiple large-scale oscillations and the regional hydrological processes constitutes a complex climate–land coupled system (Steinman et al., 2014; Murgulet et al., 2017).
Several authors have examined the relationship between streamflow variability in northern South America and large-scale oceanographic–climate indices, particularly those linked to ENSO (e.g., the Southern Oscillation Index – SOI, the Multivariate ENSO Index – MEI, and Niño 1, 2, 3, 4) (Robertson and Mechoso, 1998; Hastenrath, 1990; Gutiérrez and Dracup, 2001; Poveda et al., 2001; Restrepo and Kjerfve, 2004; Garcia and Mechoso, 2005). New variables such as SST gradients in the Caribbean Sea and low-frequency oscillations, together with new statistical methods (e.g., singular value decomposition and principal component analyses) are now used in streamflow analysis. These new approaches have improved hydrological forecast models compared to predictions based solely on El Niño-based indices. For example, such an approach allowed us to establish that the extremely anomalous wet seasons in northern South America between 2010 and 2012 were associated not only with ENSO anomalies, but also with an enhanced Atlantic Meridional Mode (AMO), a low-frequency oscillation that is independent of ENSO (Arias et al., 2015). The new models also reduce the spatial bias of SST, which affects hydrology at regional scales (Tootle et al., 2008; Córdoba-Machado et al., 2016). These studies, however, failed to include representative small basins (area ≤ 5000 km2) that drain into the Caribbean Sea in northern South America. Furthermore, mountain rivers flowing from the Sierra Nevada de Santa Marta (SNSM) massif (Fig. 1, Table 1) are absent from these models. Pierini et al. (2015) indicated that rivers from the SNSM exhibit a distinctive hydrological pattern, which differs from that of other rivers in northwestern South America. Differences are especially pronounced between rivers in the SNSM and those with headwaters in the Colombian Andes. SNSM rivers exhibit a relatively low contribution from ENSO-related oscillations and a larger influence of quasi-decadal oscillations in their streamflow variability signals, compared to Andean rivers (Restrepo et al., 2012, 2014). The magnitude of such influence and its link with large-scale climatic–oceanographic oscillations is still unknown. Overall, contribution from low-frequency oscillations to streamflow variability is poorly understood, particularly in small, tropical, coastal mountain rivers (Stevens and Ruscher, 2014; Nalley et al., 2016; Marini et al., 2016). These fluvial systems possess low streamflow buffering capacity because of their topographic setting (Milliman and Syvitski, 1992), and they are exposed to regional-scale atmospheric–oceanographic processes (Hastenrath, 1990; Enfield and Alfaro, 1999). Furthermore, it has been established that changes in the Caribbean SST gradients affect the amount of rainfall in northern South America (Enfield and Alfaro, 1999), but there is no evidence that such changes affect the hydrological variability of SNSM rivers, which are characterized by a limited ability to filter hydrological signals (Restrepo et al., 2014).
Table 1Drainage basin (A), headwater elevation, mean monthly streamflow (Q), maximum monthly streamflow (Qmax), minimum monthly streamflow (Qmin), flood regimes (Qmax∕Q) and discharge variability (Qmax∕Qmin) of the rivers draining the Sierra Nevada de Santa Marta.

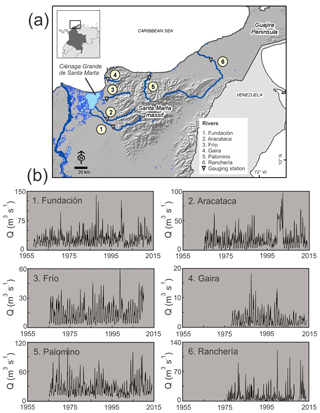
Figure 1(a) Map of the different drainage basins, with locations of streamflow stations and major geographic features; (b) historical monthly streamflow series of the Fundación, Aracataca, Frío, Gaira, Palomino and Rancheria rivers.
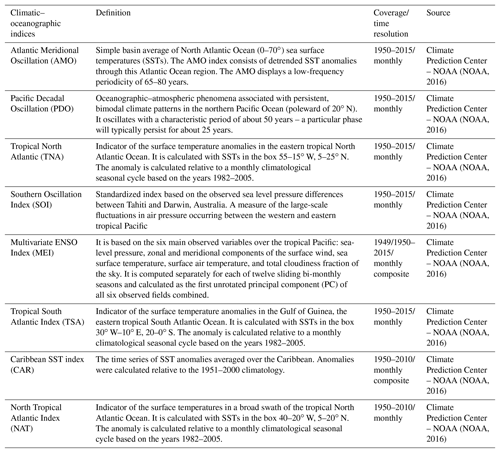
Standard statistical techniques are generally unable to explain the complex interactions, based on nonlinear and non-stationary underlying processes, among a wide range of climatic–oceanographic oscillations and their associated effects on hydrology (i.e., Grinsted et al., 2004; Xu et al., 2004; Labat, 2005; Shi et al., 2017). Spectral analyses such as wavelet transform (WT) and the Hilbert–Huang transform (HHT) (Grinsted et al., 2004; Labat et al., 2005; Torrence and Compo, 1998; Massei and Fournier, 2012; Schulte et al., 2016) have proven useful for identifying the timing of important features of non-stationary signals and for discriminating the relative contribution of signal components, which may change through time. The objectives of this study were to (1) explore the temporal characteristics of streamflow variability, with emphasis on low-frequency oscillations, (2) estimate the net contribution (i.e., energy spectrum) of low-frequency oscillations to streamflow anomalies, and (3) analyze the linkages between streamflow anomalies and large-scale, low-frequency, oceanographic–atmospheric processes (Table 2) in small, tropical, coastal mountain rivers of the SNSM (Fig. 1 and Table 1). To our knowledge, this is the first study to estimate the contribution of low-frequency oscillations to the hydrologic variability at a subregional scale in these types of watersheds (i.e., small, coastal, and mountainous), and specifically in northern South America, where ENSO has been identified previously as the preeminent driver of streamflow variability (i.e., Gutiérrez and Dracup, 2001; Poveda et al., 2001; Córdoba-Machado et al., 2016).
The Sierra Nevada de Santa Marta (SNSM) is a massif of metamorphic and intrusive rocks that is isolated from other mountain ranges that make up the Andean Colombian Cordillera (Montes et al., 2010) (Fig. 1). The SNSM possesses the highest peak in Colombia (5800 m) and is contiguous with an ocean trench about 3200 m deep. These two features form one of the greatest topographic gradients of any coastal range in the world. Rivers with areas of less than 5000 km2, very steep slopes and small alluvial flood plains drain the Sierra with only the exception of the Rancheria River, which drains large lowland areas in the Guajira Peninsula (Fig. 1). Rivers that run through the western slopes of the SNSM flow into the Ciénaga Grande de Santa Marta (CGSM), the largest Colombian coastal lagoon (∼730 km2) (Fig. 1), which was designated a Ramsar wetland because of its ecological diversity and importance and its role as a shelter for migratory birds (Ramsar, 2019). The environmental and ecological functioning of the CGSM depends heavily on water discharge from the rivers on the western slopes of the SNSM (Vilardy et al., 2009). Rivers that drain the northern and eastern slopes discharge directly into the Caribbean Sea. Their fluvial discharge plays an important role in beach stability (Restrepo et al., 2017). Rivers that drain the southern slopes were not included in this study as they are not considered coastal rivers and/or are tributaries of high-order rivers.
The SNSM experiences two wet seasons annually, as a result of meridional displacement of the Intertropical Convergence Zone (ITCZ). Precipitation from May to June is associated with northward movement of the ITCZ. Rain, of higher intensity and duration, extends from September to November, when the ITCZ moves southward. The dynamics of the North Jet (i.e., Caribbean or San Andrés Jet), and mountain effects produced by the SNSM, produce a more complex regional distribution of moisture (Bernal et al., 2006; Poveda et al., 2001). The interaction between the northeasterly trade winds and belts of low pressure at <900 hPa between latitudes 13 and 14∘ N promote formation of the North Jet stream. This jet stream produces a deflection of moisture in northwestern South America, which leads to the rise of air masses along the slopes of the SNSM and causes strong surface wind currents and low humidity on the Guajira Peninsula (Bernal et al., 2006). Thus, the SNSM experiences precipitation of >2000 mm yr−1 and a mean annual temperature of <20 ∘C. The rest of the Colombian Caribbean is warm and dry, with rainfall < 1000 mm yr−1 and mean annual temperatures > 27 ∘C (Poveda, 2004).
Mean monthly streamflow in the principal rivers of the SNSM ranges between 2.3 and 28.5 m3 s−1 (Fig. 1 and Table 1). These rivers exhibit strong seasonal variability in their discharge, usually as high as 5–10-fold when comparing the lowest and highest monthly streamflow. Inter-annual flow variability can also be large, with values for high-streamflow years 2–4× those during low-streamflow years (Restrepo et al., 2014). In addition, the SNSM rivers exhibit high to very high discharge variability (Qmax∕Qmin) and a high flood regime (Qmax∕Q) while possessing drainage areas < 5.0×10³ km2 in mountainous zones (Table 1). Thus, topography is a primary factor controlling flood variability (Restrepo et al., 2014). Except for the Ranchería River with a dam built in the late 2000s, the SNSM rivers have no damming or fragmentation. However, just 15 % of the natural forest remains completely unaltered, due to widespread logging and an increase in agriculture. Only 8.5 % of the river headwaters remain pristine (Fundación Pro-Sierra Nevada de Santa Marta, 1997). These land-use changes have led to a general loss of hydrologic modulation capacity in the watersheds, and in turn have favored the occurrence of changes in the hydrological patterns, specifically, an increase in seasonal streamflow extremes (e.g., Pierini et al., 2017; Hoyos et al., 2019).
3.1 Streamflow data
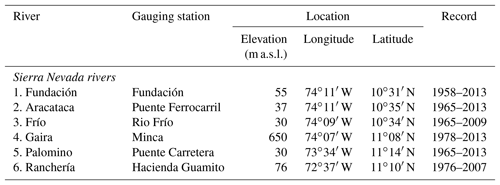
Streamflow monthly average data from rivers that drain the SNSM were obtained from the Colombian Hydrology and Meteorology Institute (IDEAM). Streamflow data are useful for understanding the hydrologic response of a watershed to climate variability (Dai et al., 2009; Labat, 2010) as they integrate stream response to multiple hydrologic processes (precipitation, groundwater exchange, evapotranspiration and runoff) (Milliman et al., 2008). Selection of streamflow gauging stations was based on the location and length of records, which had to be sufficiently long to enable analysis of the role and properties of low-frequency oscillations in streamflow variability. Gauge stations are located close to the river mouth, in the lower part of the basin. Streamflow time series measured close to the river mouth are considered a reliable integrated signal for a drainage basin's water cycle (e.g., Garcia and Mechoso, 2005; Milliman et al., 2008; Labat, 2010; Pasquini and Depetris, 2007; Restrepo et al., 2014). For this study, the quasi-decadal oscillations (i.e., 8–12 years) or longer-period oscillations were classified as low-frequency oscillations. This classification is in close agreement with several previous hydrologic studies (Robertson and Mechoso, 1998; Pekarova et al., 2003; Grinsted et al., 2004). Only stations with a minimum of 32 years of data were selected, to obtain statistically significant information about quasi-decadal oscillations, following the edge effects () and the cutoff frequency (T∕2) approach, where T is the hydrological record total length (Shumway and Stoffer, 2004). We used streamflow data from six rivers with more than 32 years of complete monthly records (Fig. 1 and Table 3).
Table 3Rivers and gauging stations analyzed in this study. The location and historic record of freshwater discharge data are also included.
We used continuous wavelet transform (CWT) and Hilbert–Huang transform (HHT) analyses to estimate periodicities, variability patterns, and the net contribution (i.e., energy spectrum) of low-frequency oscillations to streamflow anomalies. We also used wavelet coherence (WTC) and cross-wavelet transform (XWT) to estimate the correlation between streamflow and eight large-scale climate–oceanographic processes (Table 2). The XWT unveils high common powers and relative phases in a time–frequency space, whereas the WTC finds significant coherence even with a low common power and shows confidence levels against red noise, highlighting locally phase-locked patterns (Shumway and Stoffer, 2004; Grinsted et al., 2004; Labat, 2005). Definitions of the climate–oceanographic indices used in this study are presented in Table 2. Only the most significant results (PDO, AMO, and TNA) are shown, with other results displayed in the Supplement. Prior to the time-series analyses continuity and homogeneity tests were applied. Data series with a non-normal distribution were transformed prior to applying the XWT and WTC analyses, using a widely used standardization procedure (zero mean, unit standard deviation) (e.g., Torrence and Compo, 1998; Grinsted et al., 2004; Labat, 2005).
3.2 Spectral wavelet analysis
Analysis of monthly streamflow data was performed using generalized local base functions with CWT. Mother wavelets were translated and stretched in time resolution and frequency (Torrence and Compo, 1998). This technique is helpful with the evaluation of time series that contain non-stationary functions with different frequencies and provides a timescale signal localization. The CWT, applied to monthly, “de-seasonalized” streamflows, was used to estimate periodicities and variability patterns, distinguish temporal oscillations, and identify the intermittency of each timescale process. The wavelet spectrum was also time averaged (global wavelet spectrum) in order to quantify the main scales of underlying processes, and to determine the signal distribution variance. The global wavelet spectrum provides an adequate estimation of the long-term processes' characteristics (Torrence and Compo, 1998; Labat, 2005). The XWT and the WTC were estimated based on the CWT. An XWT spectrum between signals indicates regions where there is common high power and reveals information about phase relationships. The WTC spectrum highlights the intensity of the covariance of these signals, regardless of the high-power display (Grinsted et al., 2004; Nalley et al., 2016). The WTC covariance ranges from 0 to 1, where 1 represents the highest covariance. Values of the coherence coefficient were estimated following the Grinsted et al. (2004) procedure. The relationships between streamflow and some large-scale oceanographic–atmospheric indices were identified using the phase angle observed in the spectra. An in-phase relationship is indicated by arrows in the enclosed significant regions of the XWT and WTC spectra that point straight to the right. On the other hand, and anti-phase relation is indicated by arrows pointing straight to the left. Arrows that do not point straight to the right or left indicate a lead–lag relationship when a climate–oceanographic index led the streamflow response (Grinsted et al., 2004; Nalley et al., 2016).
A complex symmetric function, the Morlet wavelet spectrum, was used to distinguish between the real and imaginary wavelet parts. The imaginary section contains the phase information that is necessary to calculate the spectrum coherence between two variables (WTC) (Grinsted et al., 2004; Nalley et al., 2016). The real section captures the negative and positive time-series oscillatory characteristics and isolates components such as jumps and discontinuities. The Morlet wavelet also allows us to describe the hydrological data structure as well as to have better frequency resolution (Grinsted et al., 2004; Labat, 2005). A value of 6 was defined for the frequency localization of the Morlet wavelet (ωo) to fulfill the admissibility condition (localization in time and frequency, zero mean, and to acquire a proper balance between frequency and time) (Torrence and Compo, 1998; Grinsted et al., 2004; Nalley et al., 2016). The 95 % confidence level was calculated for contours and edge effects' area following the method of Torrence and Compo (1998). The edge effect was addressed by the zero-padding approach. This procedure creates discontinuities at both ends of the data, particularly at larger scales. The power displayed in this area is expected to be weaker than actually shown (Nalley et al., 2016). The area in the WT spectrum where the edge effect is shown is referred to as the cone of influence (COI). The interpretation of the WT power spectra was limited to the area outside the COI; thus, the COI is represented by the region outside of the concave-up area.
3.3 Hilbert–Huang transform
The HHT is an adaptive empirical method used to obtain modes of variability with nonlinear and non-stationary data (Huang et al., 1999). The additive decomposition of a time series (X(t)) is obtained from the intrinsic modes functions (IMFs) and the residual (Eq.1) indicates the data trend. This process is known as the empirical mode decomposition (EMD). The time series (X(t)) can be represented by the sum of the modes (ci) plus the residue (rn(t)).
where ci represents each of the decomposition modes, r is the residue and n is the number of decomposition modes. The Hilbert transform () (Eq. 2) is then applied to each of the IMFs to extract the information in terms of energy–time–frequency:
where P is the main value of the Couchy number (Long et al., 1995). We can then construct the analytic signal (Ci(t)) from the , defined as (Eq. 3)
where and , which corresponds to the instantaneous amplitude and the instantaneous phase angle, respectively. The instantaneous frequency (wi(t)) associated with each IMF is defined as (Eq. 4)
The original signal (Eq. 5), excluding the residue, can be expressed from the real part, i.e., the left-hand side of Eq. (3):
The Hilbert spectrum can be expressed from the square of the instantaneous amplitude (H(w, t)=A2(wt)). From the Hilbert spectrum we can define the Hilbert marginal spectrum (h(w)) (Eq. 6), which represents the sum of all amplitudes (energy) over all data (Barnhart, 2011):
The Hilbert marginal spectrum corresponds to the energy associated with each of the frequencies that make up the signal (Huang et al., 1999). In order to determine the frequency and energy of each of the signal modes, we define the average frequency (f(n)) and average energy (En) of each mode (Huang et al., 1999, 2009):
where En is the Fourier power density spectrum. A combination of the algorithm to obtain the functions of intrinsic modes, together with the Hilbert spectral analysis, is called the Hilbert–Huang transform (Huang et al., 1999; Barnhart, 2011).
4.1 Short- and long-term patterns of streamflow variability
Intra-annual and annual processes are the dominant signals, but they exhibit intermittency throughout the CWTs (Fig. 2). The Fundación, Aracataca, Palomino and Ranchería rivers exhibit an intermittent signal at the intra-annual and annual bands, with maximum powers localized around the periods 1985–1990, 1998–2002 and 2008–2010. The Frío and Gaira rivers show a quasi-continuous annual signal of comparable magnitude, with maximum powers around the 1985–2010 and 1985–2002 intervals, respectively (Fig. 2). In most of these rivers, the inter-annual signal (i.e., 3–7 years) was discontinuous, highly localized, and exhibited relatively low powers throughout the CWT spectra (Fig. 2). These spectra highlight inter-annual processes in the Fundación, Aracataca and Gaira rivers during the 1995–2005 period, whereas the Ranchería River experienced such processes over the 1980–1988 and 1995–2005 intervals. The inter-annual signal also appeared in the Frío and Palomino rivers from 1996/1998 to 2010. Most inter-annual signals exhibit their maximum power around the 1998–2002 interval (Fig. 2). Quasi-decadal or low-frequency signals (i.e., >8-year band) are observed in most CWT spectra. All rivers exhibit powers of comparable magnitude between the 1980s and 2010. The intensity of this signal increased in the 1990s and reached maximum power during the 1998–2005 interval (Fig. 2).
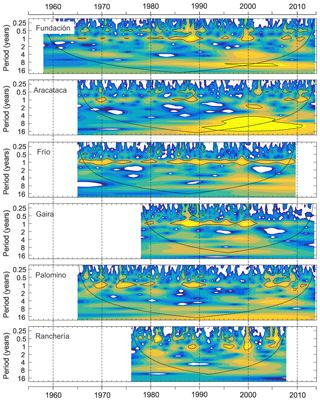
Figure 2Continuous wavelet transform spectrum for the Fundación, Aracataca, Frío, Gaira, Palomino and Ranchería rivers. The dark yellow/light blue colors in the wavelet spectra correspond to high/low values of the transform coefficients (power). The thick black contour delimits the 95 % confidence level against AR(1) red noise, and the cone of influence where edge effects () are not negligible is shown as a black line.
Most of the CWT spectra exhibit periods where the maximum power of the different signal bands occurs simultaneously (Fig. 2). For example, all rivers exhibit high-power signals on the annual and quasi-decadal bands during the 1988–1990 interval. All rivers, except the Palomino, experienced superimposed oscillations on the annual, inter-annual and quasi-decadal bands over the 1998–2002 interval. A quasi-biennial oscillation occurred jointly with annual, inter-annual and quasi-decadal oscillations during the 2008–2012 interval in the Fundación, Aracataca and Palomino rivers (Fig. 2). The simultaneous occurrence of relatively high-power signals led to periods of intense hydrological variability, in which extreme flows occurred, such as those experienced in most rivers in 1988–1989, 1998–2000 and 2010–2011 (Figs. 1 and 2).
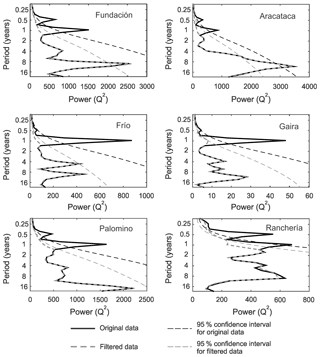
The global wavelet spectrum is obtained by time-averaging processes of the CWT (Fig. 3). In the Frío, Gaira and Ranchería rivers, the main oscillatory component is the annual band. The second-order source of hydrologic variability is the quasi-decadal band. The global wavelet spectrum also displays an 8–12-year or larger oscillation, which constitutes the main oscillatory component in the Fundación, Aracataca and Palomino rivers. Although the inter-annual scales are common in all rivers, excluding the Aracataca River, they exhibit relatively low power signals and thus constitute a second-order source of hydrologic variability (Fig. 3). Oscillations greater than 1 year were not statistically significant, except in the Aracataca River. The global wavelet spectrum remains unchanged (dashed gray lines in Fig. 3) when the intra-annual and annual bands are extracted, removing monthly average values from the original streamflow time series. The significance-level curve, however, changes, making the power of certain oscillations, such as in the Fundación and Frío rivers, significant (Fig. 3). Thus, it is likely that longer time series are required to test the low-frequency oscillations' statistical significance within the global wavelet spectrum. Information on these low-frequency oscillations was considered useful because (1) the zero-padding technique reduces the lower frequencies' true power, (2) the CWT isolates hidden signals not shown by other techniques, and (3) they are within the range defined by edge effects and cutoff frequency.
4.2 Intrinsic component of monthly streamflow and energy distribution
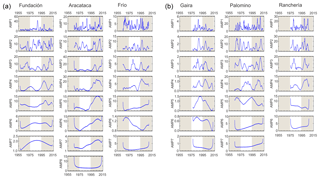
IMFs were generated by extracting the monthly, multi-year average from the original time-series data. We obtained between six and eight oscillation modes and the residual (Fig. 4 and Table 4). The C1–C4 modes represent intra-annual, annual and quasi-biennial oscillations. Mode C5 represents the inter-annual oscillations. Mode C6 and higher modes correspond to low-frequency oscillations (i.e., quasi-decadal or greater) (Fig. 4 and Table 4). Information on the last IMF mode of the Fundación (C7) and Gaira (C7) rivers must be analyzed cautiously as they are outside the range established for the edge effects approach (Table 4). The C1–C4 modes exhibit frequent but generally homogenous oscillations, except during specific periods, as with the Gaira River in 1988–1990 and the Aracataca and Rancheria rivers in 1998–2000, when these modes exhibited large oscillations (Fig. 4). In most rivers, the C5 oscillation mode became more pronounced and recurrent about 1995. A similar pattern occurs with the C6–C8 oscillation modes, with the notable exception of the Gaira River, which exhibits quasi-steady, large oscillations on these modes during the entire record. The Aracataca River constitutes the most representative example of such changes (Fig. 4). Residuals show increasing trends in the Aracataca, Frío, Palomino and Ranchería rivers, whereas a decreasing trend is seen in the Fundación and Gaira rivers. Most of these trends showed inflection points in the 1990s or in the early 2000s (Fig. 4).
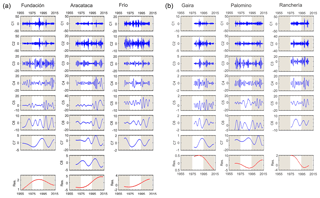
Figure 4Ensemble empirical mode decomposition (EEMD) for the Fundación, Aracataca, Frío, Gaira, Palomino and Ranchería rivers.
Table 4Period (T) and percentage of energy for each IFM mode estimated for the rivers of the Sierra Nevada of Santa Marta – contribution to the global energy spectrum.

The contribution of modes C1 to C4 (intra-annual to quasi-biennial) ranges between 43.6 % and 83.8 % (Table 4). These modes provide the highest proportion of the energy spectrum in all rivers, except the Aracataca. In the latter case, the highest proportion of energy comes from modes associated with low-frequency oscillations (i.e., ≥108.1 months), whose contribution amounts to 51.4 %. In other rivers, the contribution of low-frequency modes (C6–C8) (i.e., ≥94.1 months) is higher than 12.3 %, except in the Ranchería River, where the contribution of these modes amounts to only 3.6 %. The contribution of modes associated with the inter-annual signal (C5, except the Aracataca River) varies between 7.4 % and 17.9 % (Table 4). Discrimination of the contribution of each MFI mode shows that mode C1 (3.5–3.9 months) provides the greatest amount of energy in the Fundación, Frío, Gaira and Ranchería rivers (21.1 %–28.0 %). Modes C2 (8.1 months) and C5 (108.1 months) provide the highest proportion of energy in the Palomino (19.9 %) and Aracataca (19.7 %) rivers. The contribution of modes associated with the quasi-decadal oscillations (94–144 months) is higher than 10.0 % in all rivers, except the Ranchería, in which it reaches only 3.6 %. The largest contribution of these modes is recorded in the Aracataca River, at 36.1 % (Table 4).
The application of the Hilbert–Huang transform to each IMF component provides information on amplitude changes at each of the estimated timescales (Fig. 5). High-frequency components (AMP1–AMP4) show recurrent oscillations in amplitude which coincide with periods of extreme flow events (Figs. 1 and 5). The inter-annual component (AMP5) showed a marked increase since the 1990s in the Fundación, Aracataca, Frío and Ranchería rivers, whereas the Gaira and Palomino rivers exhibited the opposite behavior. The low-frequency components (AMP6 or above) also experienced an increase in amplitude for the same time period, with the exception of the Gaira River and the Fundación River (AMP7). In most of these rivers the amplitude of low-frequency components (≥ AMP6) is comparable to or even higher than the amplitude exhibited by the inter-annual component (AMP5) (Fig. 5).
4.3 Spectral correlation with atmospheric–oceanographic processes
The XWT and the WTC spectrum show that the AMO, PDO and TNA are correlated and coherent with river streamflow over a range of timescales and frequencies. Differences are noticeable, however, for power and phase relationships when comparing high- and low-frequency signals (Figs. 6–8). The XWT spectrum reveals that AMO and river streamflow exhibited high common powers in bands higher than 64 months, with the highest scale in the ≥96-month bands (≥8 years). These common powers showed different phase relationships and durations (Fig. 6). For example, for the 96-month band, the XWT revealed a lagged (with AMO leading) but significant common power during the periods 1982–1998 and 1992–2005 in the Fundación and Frío rivers, respectively. The XWT also revealed an anti-phase significant power in the Aracataca River from 1996 to 2015. Other rivers exhibited very localized significant common powers at high-frequency bands, but not at low-frequency bands (Fig. 6). The WTC also revealed significant coherences with AMO in the low-frequency bands with the Frío, Gaira, Palomino and Ranchería rivers. Such coherences, however, exhibited a variety of lengths and phase relationships. The Frío, Gaira and Palomino rivers showed coherence in the ∼96-month band throughout the entire record, with lagged (with AMO leading) and almost in-phase relationships. The Palomino River exhibited a significant in-phase coherence between 1965 and 2002 (Fig. 6). Significant coherences were also observed in other frequency bands. The WTC spectra revealed significant lagged (with AMO leading) coherences in the ∼32-month band during the periods 1984–2015 (Gaira River) and 1985–2005 (Ranchería River). The spectra for the Fundación and Palomino rivers also revealed significant coherences at the ∼32-month band during highly localized periods (Fig. 6).
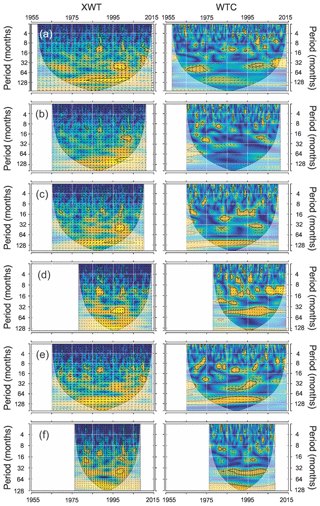
Figure 6Cross-wavelet transform (XWT) and wavelet coherence (WTC) between AMO and the (a) Fundación, (b) Aracataca, (c) Frío, (d) Gaira, (e) Palomino, and (f) Ranchería rivers. Dark arrows enclosed in the significant regions (thick black contours) represent the angle-phase relationships. For explanation of types and the statistical significance of such relationships, see Sect. 3.2.
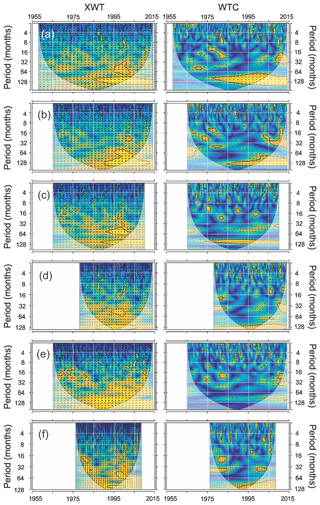
Figure 7XWT and WTC between PDO and the (a) Fundación, (b) Aracataca, (c) Frío, (d) Gaira, (e) Palomino, and (f) Ranchería rivers. Dark arrows enclosed in the significant regions (thick black contours) represent the angle-phase relationships. For explanation of types and the statistical significance of such relationships, see Sect. 3.2.
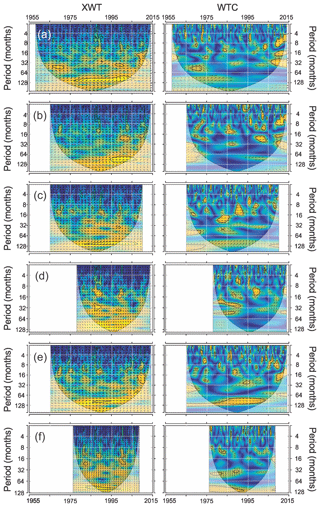
Figure 8XWT and WTC between TNA and the (a) Fundación, (b) Aracataca, (c) Frío, (d) Gaira, (e) Palomino, and (f) Ranchería rivers. Dark arrows enclosed in the significant regions (thick black contours) represent the angle-phase relationships. For explanation of types and the statistical significance of such relationships, see Sect. 3.2.
The XWT analysis revealed significant correlations between PDO and streamflow, particularly in the low-frequency bands (Fig. 7). This relatively high scale dependence was significant from the early 1990s in most of the rivers, except the Palomino. The Fundación, Aracataca and Frío rivers experienced significant anti-phase coherences at the ∼96-month band from the early 1990s. The Gaira and Ranchería rivers showed significant lagged (with PDO leading) coherences during the 1985–2005 and 1992–2000 periods, respectively. Patterns obtained through the WTC spectrum were similar (Fig. 7). Periods of significant anti-phase coherence between the PDO and streamflow, extending from 1977 to 2015 in the Fundacion River, 1985 to 2015 in the Aracataca River, and 1974 to 2010 in the Frío River, were identified at the ∼96- to 128-month bands. The WTC analysis also detected a statistically significant coherent and anti-phase streamflow relationship for the entire record at the ∼128-month band in the Gaira River and at the 64- to 128-month bands in the Ranchería River, from 1989 to 2009. Both the XWT and the WTC spectrum revealed dispersed, significant common powers/coherences at the high-frequency bands. There is a significant coherence observed in most of the rivers at the 32-month band, from 2005 (Fig. 7).
Significant statistical relationships between TNA and streamflow were observed at low-frequency bands (Fig. 8). They were, however, relatively low and dispersed compared to those obtained through the spectral analysis of AMO and PDO (Figs. 6 and 7). The XWT revealed a significant and lagged (with TNA leading) common power in the ∼96-month band during the 1975–2005, 1982–2008 and 1982–1998 periods in the Fundación, Frío and Ranchería rivers, respectively. The Palomino exhibited high-scale dependence in the ≥64-month bands. Such common powers were mostly not significant, except during a very narrow band in a short period between 1985 and 1995 (Fig. 8). Most of the significant coherences at low-frequency bands fell within the edge effects area, i.e., outside the COI. The Frío, Palomino and Ranchería rivers exhibited spectral coherences through the entire spectrum at the ≥96-month bands, all significant at the beginning and end of the spectrum, but mainly outside the COI. The WTC spectrum also revealed highly localized and dispersed significant coherences at the high-frequency bands in most of the rivers, particularly from 1995 to 2015 (Fig. 8). The WTC spectrum showed different phase relationships within each spectral analysis, indicating phase-unlocked coherence (Fig. 8).
5.1 Role of low-frequency oscillations in hydrological variability
Two approaches indicate that low-frequency oscillations play a significant role in the hydrological variability experienced by rivers of the Sierra Nevada de Santa Marta (Figs. 3–5 and Table 4). The global wavelet spectrum shows that these oscillations (≥8–12 years) constitute at least a second-order variability source in these rivers, surpassed in some cases only by oscillations associated with the annual band (Fig. 3). The HHT indicates that the contribution to the global energy spectrum from the low-frequency modes is >12 %, reaching up to 51 % in the Aracataca River. This contribution is on the same order as, or even greater than, the contribution from the inter-annual mode (Table 4). The HHT analysis also revealed that the amplitude of the low-frequency components is of comparable magnitude to, or even greater than, the amplitude of the inter-annual components (Fig. 5). Recent studies underscore the importance of quasi-decadal signals for streamflow variability of rivers in northwestern South America (Restrepo et al., 2014). The magnitude of these contributions, however, had not been quantified before, as previous studies in this region focused on assessing the effect of ENSO on hydrological variability (Hastenrath, 1990; Gutiérrez and Dracup, 2001; Poveda et al., 2001; Restrepo and Kjerfve, 2004). These studies were also characterized by a strong bias on Andean and Pacific rivers where the influence of ENSO on hydrological variability is predominant (Poveda, 2004; Poveda et al., 2001). It is valid to assume that because of their location, i.e., proximity to the Caribbean Sea, direct exposure to the trade winds and the North Jet Stream, extension (i.e., small drainage basins with limited capacity to filter hydro-climate signals, and low basin storage capacity), and high relief (i.e., it favors deep convection), rivers in the SNSM are exposed to greater influence from other climate and atmospheric drivers, particularly variations in sea level pressure (SLP) and sea surface temperature (SST) of the Caribbean Sea (Enfield and Alfaro, 1999).
Our results also underscore the role of overlapping oscillations in generating extreme streamflow rates, as noted in other studies (Labat, 2008; Brabets and Walvoord, 2009; Rood et al., 2016; Váldes-Pineda et al., 2007), especially during periods in which the low-frequency oscillations exhibited their maximum power (1998–2002 and 2008–2012) (Figs. 1, 2, 4 and 5). This indicates that the superimposition of different frequency signals can lead to the attenuation or intensification of the hydro-climate signal, depending on the phase of the different oscillatory components. Overlapping oscillations can also lead to a time shift. Low-frequency oscillations seem to play an important role in the intensification (attenuation) of the annual and inter-annual signals in SNSM rivers. The Frío and Aracataca rivers experienced maximum peak streamflows in 1998 (59.4 m3 s−1) and 2002 (97.6 m3 s−1), respectively. These values are between 4 and 5 times the inter-annual monthly average (Fig. 1). During those periods, these rivers exhibited simultaneous high-power oscillations in the semi-annual, annual, inter-annual and quasi-decadal bands (Figs. 2 and 4). By contrast, between 1969 and 1970, when low-frequency oscillations exhibited low strength, and high-frequency oscillations exhibited relatively high power (Figs. 2 and 4), the maximum recorded streamflow was just 38.9 m3 s−1 in the Frío River and 62.3 m3 s−1 in the Aracataca River (Fig. 1). These values represent substantially lower peaks compared to high values observed after the 1990s. Other results also highlight the amplification/attenuation effect of low-frequency oscillations, particularly on the inter-annual signal. In most rivers, the inter-annual signal intensified after 1995, which coincides with an increase in low-frequency oscillations (Figs. 2 and 4). The maximum intensity of the inter-annual signal, which occurred between 1998 and 2002 in most rivers, also coincides with the interval of greater intensity of the quasi-decadal signal (1998–2005) (Fig. 2). Streamflow rates also exhibit inflection points in their trends between the 1990s and 2000s, a period that also coincides with the increase in the amplitude of low-frequency oscillations (Fig. 4). These results show that the superposition of climatic–oceanographic signals, particularly the modulation of the effects of the interannual signal due to phase changes in long-period signals, is a key element within the occurrence of extreme events at sub-regional scale (i.e., Steinman et al., 2014; Shi et al., 2017; Murgulet et al., 2017; Su et al., 2018).
5.2 Role of major oceanographic–atmospheric drivers
Low-frequency oscillations were identified in this study as a source of significant streamflow variability in SNSM rivers (Figs. 2–5 and Table 4). Such oscillations might be associated with climatic–oceanographic drivers, whose modes of variability include quasi-decadal or higher oscillations. The PDO, AMO and TNA are among the most important factors that influence long-term streamflow variability in these rivers (Figs. 6–8 and Supplement). These indices exhibited relatively high spectral correlations (WTC and XWT) with streamflow starting in the 1980s, particularly in the low-frequency bands (≥96 months). Spectral correlations for PDO were more intense and steady throughout the entire SNSM region (Fig. 6), whereas the spectral correlations for AMO and TNA were relatively lower and dispersed, also showing differences between rivers from the western and eastern slopes (Figs. 6 and 7). Maximum power for these spectra occurred in periods during which there were phase changes for such indexes. For example, between 1995 and 2002, when all main oscillatory components exhibited high power and large oscillations (Figs. 2 and 4–5), the AMO and TNA shifted from a negative phase to a positive phase, and the PDO shifted from a warm phase to a cold phase (Fig. 9). These results suggest a relation between changes in these climatic–oceanographic indexes and long-term streamflow variability, indicating that these watersheds are sensitive to changes in the background climate state. Furthermore, power and phase relationships between streamflow and different indices (Figs. 6–8) were relatively steady for low frequencies (i.e., >96 months) but unstable and disperse for high frequencies (i.e., <96 months). Such differences in these patterns suggest that during longer periods, streamflow might be modulated by the slow change in the climate background state, whereas during shorter periods, the streamflow is controlled not only by large-scale ocean–atmosphere patterns, but also by local short-term phenomena. This result highlights, once again, the significant effect of the superposition of signals of different frequencies on the streamflow variability (e.g., Pasquini and Depetris, 2007; Labat, 2010; Steinman et al., 2014; Murgulet et al., 2017; Shi et al., 2017). For the lower frequencies, in both the XWT and WTC analyses, the phase relationship exhibited a stable phase lag inside the significance common power regions for each river (Figs. 6–8). Such a consistent varying phase lag implies a phase-locked relationship and suggests a physical link (i.e., not a casual relationship) between the streamflow variability and each of the climatic–oceanographic indices (Grinsted et al., 2004; Labat, 2005). Outside areas with significant power the phase relationship changed (Figs. 6–8). We therefore speculate that despite the relatively strong link between streamflow and these indices at specific frequencies (low) and temporal windows (Figs. 6–8), these relationships are highly nonlinear and non-stationary, depending heavily on the phase experienced by these oscillations and their dynamic feedback processes (e.g., Battisti and Sarachick, 1995; Enfield and Alfaro, 1999; Garreaud et al., 2009). Differences in spectral correlations between rivers from the western and eastern slopes, and observed differences in phase relationships, indicate that further research is required to draw conclusions about the specific drivers of low-frequency variability.
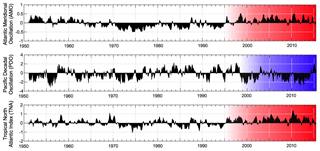
Figure 9Monthly values of Atlantic Meridional Oscillation (AMO), Pacific Decadal Oscillation and Tropical North Atlantic Index (TNA) anomalies (1951–2015). Colored boxes highlight the last shift in the phase of these indexes.
Studies of the effects that these phenomena (PDO, AMO and TNA) have on the hydroclimatology of the Caribbean and South America are relatively recent (Robertson and Mechoso, 1998; Enfield and Alfaro, 1999; Tootle et al., 2008; Labat, 2010; Arias et al., 2015; Córdoba-Machado et al., 2016; Váldes-Pineda et al., 2007). Although robust hypotheses have been put forth regarding the physical relation between the PDO (Poveda, 2004), the AMO (Arias et al., 2015) and the TNA (Enfield and Alfaro, 1999) and the climate of northwestern South America, the physical mechanisms by which these phenomena influence the hydrology at low-frequency scales remain elusive. Understanding the specific physical links between streamflow variability and these climatic–oceanographic indices is beyond the aim of this study. Nevertheless, we believe these mechanisms may relate to SST gradients between the Pacific and Atlantic oceans. According to Enfield and Alfaro (1999), anomalous Atlantic SSTs might not be sufficient to promote hydrologic anomalies when the Pacific is also warm, as occurs during ENSO warm phases. They concluded that opposite SST anomalies in the tropical North Atlantic and the eastern Pacific are linked to increased precipitation and streamflow variability over northwestern South America and the Caribbean. Anomalously high streamflows in northwestern South America are promoted by strengthened northeasterly trade winds, accelerated cross flow over the Caribbean, and strong SST gradients between the eastern Pacific (low) and tropical North Atlantic (high). Since the mid-1990s, the Atlantic Ocean and the tropical North Atlantic have been warmer (Fig. 9), favoring the occurrence of such rainfall-enhancing mechanisms. These circulation features reflect the southward displacement of the ITCZ and positive SOI anomalies, which in turn are strengthened by SST-positive gradients along the tropical North Atlantic and eastern Pacific. Such a physical link provides a reasonable explanation for the process of amplification/attenuation of streamflow revealed by spectral analysis. The possible connection between this low-frequency mode of variability and external forcings, and their influence on a regional scale, warrants further analysis.
Previous studies have shown extremely low correlations between low-frequency phenomena, such as PDO, AMO, and TNA, and streamflow variability of rivers in northwestern South America, suggesting minimal effects on regional hydrology (Gutiérrez and Dracup, 2001; Tootle et al., 2008; Córdoba-Machado et al., 2016). Those studies, however, used (1) databases with a strong bias towards rivers of the Pacific and Andean regions, where the influence of ENSO is dominant, (2) databases with no rivers in the SNSM, (3) data on SST primarily from the southern Atlantic Ocean, thereby leaving out regions covered by the AMO, PDO and TNA, (4) estimates of seasonal averages for climatic–oceanographic indices, thus reducing amplitude anomalies, especially for low-frequency oscillations, and (5) linearity for time-series analysis, which is not entirely suitable for detecting hidden signals in non-stationary data such as streamflow and climatic–oceanographic indices. Our study, on the other hand, highlights the significant role of low-frequency oscillations in the hydrological variability of rivers from the SNSM and their potential linkage with large-scale phenomena such as the AMO, PDO, and TNA. Studies using similar approaches have also found such relationships in other regions of South America (Labat et al., 2005; Pasquini and Depetris, 2007; Labat, 2010; Restrepo et al., 2014; Valdes-Pineda et al., 2007).
Low-frequency oscillations (≥8–12-year) play a significant role in the hydrological variability of rivers in the SNSM. These oscillations did not just exhibit an increase in amplitude, but also became more pronounced and recurrent after about 1995. In most of the studied rivers, the amplitude of low-frequency components was comparable to or even higher than the amplitude exhibited by the inter-annual component, which has been considered previously as the main driver of streamflow variability in northern South America at a regional scale. Low-frequency oscillations constitute at least a second-order variability source in these rivers, surpassed in some cases only by oscillations associated with the annual band. Although intra-annual to quasi-biennial modes provide the highest proportion of the global energy spectrum in all rivers (between 43.6 % and 83.8 %), the contributions from low-frequency modes are >12 % and reach 51 % in the Aracataca River, indicating an active effect of such low-frequency oscillations in the streamflow variability at a sub-regional scale in northern South America. Such an effect deserves further studies.
Periods of intense hydrological variability, in which extreme flows occurred, such as those experienced in 1988–1989, 1998–2000 and 2010–2011, were characterized by the simultaneous occurrence of relatively high-power signals, including low-frequency bands. In addition, the strengthening of the inter-annual signal after 1995, the occurrence of its maximum intensity between 1998 and 2002, and the occurrence of inflection points in the streamflow trends between the 1990s and 2000s coincide with the increase in the amplitude of low-frequency oscillations and with the interval of its greatest signal power (1998–2005). Results suggest that streamflow variability is largely dependent on the modulation of low-frequency oscillations. Overlapping of different frequency signals can lead to intensification or attenuation of the hydro-climatological cycle, depending on the phase of the different oscillatory components. This pattern highlights the importance of the interaction of different frequency signals and their phase-shifting interactions for the streamflow variability of these rivers.
Previous studies have shown a very low correlation between low-frequency phenomena and streamflow variability in northwestern South America, suggesting minimal effects on regional hydrology. The sub-regional-scale approach and the statistical spectral analysis of this study allow us to identify and estimate a significant contribution of low-frequency oscillations in the streamflow variability of the SNSM rivers. Such oscillations, identified as a source of significant streamflow variability in the SNSM rivers, are associated with large-scale climatic–oceanographic drivers, with modes of variability that include quasi-decadal or higher oscillations. The XWT and WTC spectra show that the AMO, PDO and TNA are correlated and coherent with river streamflow at different timescales. These indices exhibited relatively high spectral correlations with streamflow starting in the 1980s, particularly in the low-frequency bands (≥96 months). Spectral correlations for PDO were more intense and steady throughout the entire SNSM region, whereas the spectral correlations for AMO and TNA were relatively lower and dispersed, showing differences between rivers on the western and eastern slopes. Maximum power for these spectra occurred in periods during which there were phase changes in such indexes, suggesting a link between the shift of these climatic–oceanographic indexes and changes in long-term streamflow variability. The physical link between these indexes and hydrologic variability in northwestern South America might be related to SST and SLP gradients between the Atlantic and Pacific oceans. The physical connection between this low-frequency mode of variability and external forcings warrants further analysis.
Our study highlights the significant role of low-frequency oscillations in the hydrological variability of rivers in the SNSM and potential linkages with large-scale phenomena such as PDO, AMO and TNA. We hypothesize that the location and the physiography of these watersheds (i.e., proximity to the Caribbean Sea, direct exposure to the trade winds and the North Jet Stream, small drainage basins, low basin storage capacity and high relief) make rivers more exposed to sea level pressure (SLP) and sea surface temperature (SST) anomalies, particularly from the Atlantic Ocean and the Caribbean Sea. Further work is necessary to examine the role of these watershed properties, and others such as baseflow index and groundwater residence time, in establishing the relation between low-frequency oscillations and streamflow variability.
Raw data are available upon request to the authors. Data availability follows IDEAM (Colombian Hydrology and Meteorology Institute) policies on access to hydrological data granted to scientific projects.
The supplement related to this article is available online at: https://doi.org/10.5194/hess-23-2379-2019-supplement.
JCR, JHE and NH designed the experiments; JCR, AH and SO carried them out, including performing codes and statistical analysis. JCR prepared the manuscript with contributions from all the co-authors.
The authors declare that they have no conflict of interest.
This research was partially funded by a grant from the Inter-American Institute for Global Change Research (IAI) CRN3038, which is supported by the US National Science Foundation (grant GEO-1128040) and by an internal grant from Universidad del Norte. Jaime Escobar and Natalia Hoyos were partially funded by the Canadian Queen Elizabeth II Diamond Jubilee Scholarships (QES), a partnership among Universities in Canada, the Rideau Hall Foundation (RHF), and Community Foundations of Canada (CFC). The QES-AS is made possible with financial support from IDRC and SSHRC. Natalia Hoyos was partially supported by the Fulbright Visiting Scholar Program.
This research has been supported by the Inter-American Institute for Global Change Research (grant no. GEO-1128040).
This paper was edited by Luis Samaniego and reviewed by two anonymous referees.
Amarasekera, K., Lee, R., Williams, E., and Elthair, E.: ENSO and the natural variability in the flow of tropical rivers, J. Hydrol., 200, 24–39, https://doi.org/10.1016/S0022-1694(96)03340-9, 1997.
Arias, P., Martínez, A., and Vieira, S.: Moisture sources to the 2010–2012 anomalous wet season in northern South America, Clim. Dynam., 45, 2861–2884, https://doi.org/10.1007/s00382-015-2511-7, 2015.
Barnhart, B. L.: The Hilbert-Huang transform: theory, applications, development, PhD Thesis Dissertation, IOWA University, Iowa, p. 102, 2011.
Battisti, D. and Sarachick, B.: Understanding and predicting ENSO, Rev. Geophys., 33, 1367–1376, https://doi.org/10.1029/95RG00933, 1995.
Bernal, G., Poveda, G., Roldan, P., and Andrade, C.: Patrones de variabilidad de las temperaturas superficiales del mar en la costa Caribe colombiana, Revista de la Academia Colombiana de Ciencias Exactas, Físicas y Naturales, 30, 195–208, 2006.
Brabets, T. and Walvoord, M.: Trends in streamflow in the Yukon river Basin from 1944 to 2005 and the influence of the Pacific Decadal Oscillation, J. Hydrol., 371, 108–119, https://doi.org/10.1016/j.jhydrol.2009.03.018, 2009.
Brown, D. P. and Comrie, A. C.: A winter precipitation “dipole” in the western United States associated with multidecadal ENSO variability, Geophys. Res. Lett., 31, L09203, https://doi.org/10.1029/2003GL018726, 2004.
Chowdary, J. S., Parekh, A., Gnanaseelan, C., and Sreenivas, P.: Inter-decadal modulation of ENSO teleconnections to the Indian Ocean in a coupled model: special emphasis on decay phase of El Niño, Global Planet. Change, 112, 33–40, https://doi.org/10.1016/j.gloplacha.2013.11.003, 2014.
Córdoba-Machado, S., Palomino, R., Gámiz, S., Castro, Y., and Esteban, M.: Seasonal streamflow prediction in Colombia using atmospheric and oceanic patterns, J. Hydrol., 538, 1–12, https://doi.org/10.1016/j.jhydrol.2016.04.003, 2016.
Dai, A., Qian, T., Trenberth, K., and Milliman, J.: Changes in continental freshwater discharge from 1948 to 2004, J. Climate, 22, 2773–2792, https://doi.org/10.1175/2008JCLI2592.1, 2009.
Enfield, D. and Alfaro, E.: The dependence of Caribbean rainfall on the interaction of the tropical Atlantic and Pacific oceans, J. Climate, 12, 2093–2103., https://doi.org/10.1175/1520-0442(1999)012<2093:TDOCRO>2.0.CO;2, 1999.
Fundación Pro-Sierra Nevada de Santa Marta: Plan de Desarrollo Sostenible de la Sierra Nevada de Santa Marta, Technical Report, Santa Marta, p. 228, 1997.
Garcia, N. and Mechoso, C.: Variability in the discharge of South American rivers and in climate, Hydrolog. Sci. J., 50, 459–478, https://doi.org/10.1623/hysj.50.3.459.65030, 2005.
Garreaud, R., Vuille, M., Compagnucci, R., and Marengo, J.: Present-day South American climate, Palaeogeogr. Palaeocl., 281, 180-195, https://doi.org/10.1016/j.palaeo.2007.10.032, 2009.
Grinsted, A., Moore, J. C., and Jevrejeva, S.: Application of the cross wavelet transform and wavelet coherence to geophysical time series, Nonlin. Processes Geophys., 11, 561–566, https://doi.org/10.5194/npg-11-561-2004, 2004.
Gutiérrez, F. and Dracup, J.: An analysis of the feasibility of long-range streamflow forecasting for Colombia using El Nino – Southern Oscillation indicators, J. Hydrol., 246, 181–196, https://doi.org/10.1016/S0022-1694(01)00373-0, 2001.
Hastenrath, S.: Diagnostics and prediction of anomalous river discharge in northern South America, J. Climate, 3, 1080–1096, https://doi.org/10.1175/1520-0442(1990)003<1080:DAPOAR>2.0.CO;2, 1990.
Hoyos, N., Corre-Metrio, A., Jepsen, S., Wemple, B., Valencia, S., Marsik, M., Doria, R., Escobar, J., Restrepo, J. C., and Velez, M. I.: Modeling streamflow response to persistent drought in a coastal tropical mountainous watershed, Sierra Nevada de Santa Marta, Colombia, Water, 11, 94, https://doi.org/10.3390/w11010094, 2019.
Huang, N. E., Shen, Z., and Long, S. R.: A new view of nonlinear water waves: the Hilbert Spectrum 1, Annu. Rev. Fluid Mech., 31, 417–457, https://doi.org/10.1146/annurev.fluid.31.1.417, 1999.
Huang, Y., Schmitt, F. G., Lu, Z., and Liu, Y.: Analysis of daily river flow fluctuations using empirical mode decomposition and arbitrary order Hilbert spectral analysis, J. Hydrol., 373, 103–111, https://doi.org/10.1016/j.jhydrol.2009.04.015, 2009.
Huntington, T.: Evidence for intensification of the global water cycle: review and synthesis, J. Hydrol., 319, 83–95, https://doi.org/10.1016/j.jhydrol.2005.07.003, 2006.
Jhonson, N., Martinez, C., Kiker, G., and Letman, S.: Pacific and Atlantic sea surface temperature influences on streamflow in the Apalachicola–Chattahoochee–Flint river basin, J. Hydrol., 489, 160–179, https://doi.org/10.1016/j.jhydrol.2013.03.005, 2013.
Labat, D.: Recent advances in wavelet analyses: Part 1 – A review of concepts, J. Hydrol., 314, 275–288, https://doi.org/10.1016/j.jhydrol.2005.04.003, 2005.
Labat, D.: Cross wavelet analyses of annual continental freshwater discharge and selected climate indices, J. Hydrol., 385, 269–278, https://doi.org/10.1016/j.jhydrol.2010.02.029, 2010.
Labat, D., Ronchail, J., and Guyot, J. L.: Recent advances in wavelet analyses: Part 2 – Amazon, Parana, Orinoco and Congo discharges time scale variability, J. Hydrol., 314, 289–311, https://doi.org/10.1016/j.jhydrol.2005.04.004, 2005.
Long, S. R., Huang, N. E., Tung, C. C., Wu, M. L., Lin, R. Q., Mollo-Christensen, E., and Yuan, Y.: The Hilbert techniques: an alternate approach for non-steady time series analysis, IEEE Geosci. Remote Sens. Soc. Lett., 3, 6–11, 1995.
Marini, G., Zollo, R., Fontana, N., Giugni, M., and Singh, V.: Variability and trends in streamflow in northeast United States, Proced. Earth Planet. Sci., 16, 156–165, https://doi.org/10.1016/j.proeps.2016.10.017, 2016.
Massei, N. and Fournier, M.: Assessing the expression of large-scale climatic fluctuations in the hydrological variability of daily Seine river flow (France) between 1950 and 2008 using Hilbert–Huang Transform, J. Hydrol., 448–449, 119–128, https://doi.org/10.1016/j.jhydrol.2012.04.052, 2012.
Milliman, J. D. and Syvitski, P. M.: Geomorphic/Tectonic control of sediment discharge to the ocean: The importance of small mountainous rivers, J. Geol., 100, 525–544., https://doi.org/10.1086/629606, 1992.
Milliman, J. D., Farnsworth, K., Jones, P., Xu, K., and Smith, L. C.: Climatic and anthropogenic factors affecting river discharge to the global ocean, 1951–2000, Global Planet. Change, 62, 187–194, https://doi.org/10.1016/j.gloplacha.2008.03.001, 2008.
Montes, C., Guzman, G., Bayona, G., Cardona, A., Valencia, V., and Jaramillo, C.: Clockwise rotation of the Santa Marta massif and simultaneous Paleogene to Neogene deformation of the Plato-San Jorge and Cesar-Rancheria basins, J. S. Am. Earth Sci., 29, 832–848, https://doi.org/10.1016/j.jsames.2009.07.010, 2010.
Murgulet, D., Valeriu, M., Hay, R., Tissot, P., and Mestas-Nuñez, A.: Relationships between sea surface temperature anomalies in the Pacific and Atlantic Oceans and South Texas precipitation and streamflow variability, J. Hydrol., 550, 726–739, https://doi.org/10.1016/j.jhydrol.2017.05.041, 2017.
Nalley, D., Adamowski, J., Khalil, B., and Biswas, A.: Inter-annual to inter-decadal streamflow variability in Quebec and Ontario in relation to dominant large-scale climate indices, J. Hydrol., 536, 426–446, https://doi.org/10.1016/j.jhydrol.2016.02.049, 2016.
NOAA – National Oceanic and Atmospheric Administration: National Weather Service – Climate Prediction Center, United States, Base de datos en línea, available at: http://www.cpc.ncep.noaa.gov/products/analysis_monitoring/ensostuff/ensoyears.shtml, last access: December 2016.
Pasquini, A. and Depetris, P.: Discharge trends and flow dynamics of South American rivers draining the southern Atlantic seaboard: An overview, J. Hydrol., 333, 385–399, https://doi.org/10.1016/j.jhydrol.2006.09.005, 2007.
Pekarova, P., Miklanek, P., and Pekar, J.: Spatial and temporal runoff oscillation analysis of the main rivers of the world during the 19th–20th centuries, J. Hydrol., 274, 62–79, https://doi.org/10.1016/S0022-1694(02)00397-9, 2003.
Pierini, J. Restrepo, J. C., Lovallo, M., and Telesca, L.: Discriminating between different streamflow regimes by using the Fisher–Shannon method: an application to the Colombia rivers, Acta Geophysica, 63, 533–546, https://doi.org/10.2478/s11600-014-0229-2, 2015.
Pierini, J., Restrepo, J. C., Aguirre, J., Bustamante, A. M., and Velásquez, G. J.: Changes in seasonal streamflow extremes experienced in rivers of Northwestern South America (Colombia), Acta Geophysica, 65, 377–394, https://doi.org/10.1007/s11600-017-0036-7, 2017.
Poveda, G.: La hidroclimatología de Colombia: una síntesis desde la escala inter-decadal hasta la escala diurna, Revista de la Academia Colombiana de Ciencias Exactas, Físicas y Naturales, 28, 201–222, 2004.
Poveda, G., Jaramillo, A., Gil, M., Quiceno, N., and Mantilla, R.: Seasonality in ENSO-related precipitation, river discharges, soil moisture, and vegetation index in Colombia, Water Resour. Res., 37, 2169–2178, https://doi.org/10.1029/2000WR900395, 2001.
Ramsar: Ramsar Convention Homepage, available at: https://www.ramsar.org/, last access: February 2019.
Restrepo, J. C., Ortíz, J. C., Maza, M., Otero, L., Alvarado, M., and Aguirre, J.: Estimating Fluvial Discharge in the Caribbean Seaboard of Colombia: Magnitude, Variability and Extreme Events, edited by: Lane, P. and McKee Smith, J., in: Proceedings of the International Conference on Coastal Engineering 2012 (ICCE 2012), ISNN 2156–1028, https://doi.org/10.9753/icce.v33.management.44, 2012.
Restrepo, J. C., Ortíz, J. C., Pierini, J., Schrottke, K., Maza, M., Otero, L., and Aguirre, J.: Freshwater Discharge into the Caribbean Sea from the Rivers of Northwestern South America (Colombia): Magnitude, Variability and Recent Changes, J. Hydrol., 509, 266–281, https://doi.org/10.1016/j.jhydrol.2013.11.045, 2014.
Restrepo, J. C., Orejarena, A., and Torregroza, A.: Suspended sediment load in northwestern South America (Colombia): a new view on variability and fluxes into the Caribbean Sea, J. S. Am. Earth Sci., 80, 340–352, https://doi.org/10.1016/j.jsames.2017.10.005, 2017.
Restrepo, J. D. and Kjerfve, B.: The Pacific and Caribbean Rivers of Colombia: Water Discharge, Sediment Transport and Dissolved Loads, in: Environmental Geochemistry in Tropical and Subtropical Environments, edited by: Lacerda, L., Santelli, R., Duursma, E., and Abrao, J., Springer Verlag, Berlin, Germany, 169–187, https://doi.org/10.1007/978-3-662-07060-4_14, 2004.
Robertson, A. W. and Mechoso, C. R.: Interannual and decadal cycles in river flows of Southeastern South America, J. Climate, 11, 2947–2957, https://doi.org/10.1175/1520-0442(1998)011<2570:IADCIR>2.0.CO;2, 1998.
Rood, S., Foster, S., Hillman, E., Luek, A., and Zanewich, K.: Flood moderation: declining peak flows along some Rocky Mountain rivers and the underlying mechanism, J. Hydrol., 536, 174–182, https://doi.org/10.1016/j.jhydrol.2016.02.043, 2016.
Sagarika, S., Kaira, A., and Ahmad, S.: Interconnections between oceanic–atmospheric indices and variability in the U.S. streamflow, J. Hydrol., 525, 724–736, https://doi.org/10.1016/j.jhydrol.2015.04.020, 2015.
Schulte, J., Najjar, R., and Li, M.: The influence of climate modes on streamflow in the Mid-Atlantic region of the United States, J. Hydrol.: Reg. Stud., 5, 80–99, https://doi.org/10.1016/j.ejrh.2015.11.003, 2016.
Shi, P., Yang, T., Xu, C., Yong, B., Shao, Q., Li, Z., Wang, X., Zhou, X., and Li, S.: How do the multiple large-scale climate oscillations trigger extreme precipitation?, Global Planet. Change, 157, 48–58, https://doi.org/10.1016/j.gloplacha.2017.08.014, 2017.
Shumway, R. and Stoffer, D.: Time Series Analysis and Its Applications, Springer-Verlag, Amsterdam, the Netherlands, p. 549, 2004.
Steinman, B. A., Abbot, M. B., Mann, M. E., Ortíz, J. D., Feng, S., Pompeani, D. P., Stansell, N. D., Anderson, L., Finney, B. P., and Bird, B. W.: Ocean–atmosphere forcing of centennial hydroclimate variability in the Pacific Northwest, Geophys. Res. Lett., 41, 2553–2560, https://doi.org/10.1002/2014GL059499, 2014.
Stevens, K. and Ruscher, P.: Large-scale climate oscillations and mesoscale surface meteorological variability in the Apalachicola-Chattahoochee-Flint River Basin, J. Hydrol., 517, 700–714, https://doi.org/10.1016/j.jhydrol.2014.06.002, 2014.
Su, L., Miao, C., Kong, D., Duan, Q., Lei, X., Hou, Q., and Li, H.: Long-term trends in global river flow and the causal relationships between river flow and ocean signals, J. Hydrol., 563, 818–833, https://doi.org/10.1016/j.jhydrol.2018.06.058, 2018.
Tootle, G., Piechota, T., and Gutierrez, F.: The relationships between Pacific and Atlantic Ocean sea surface temperatures and Colombian streamflow variability, J. Hydrol., 349, 268–276, https://doi.org/10.1016/j.jhydrol.2007.10.058, 2008.
Torrence, C. and Compo, G.: A Practical Guide to Wavelet Analysis, B. Am. Meteorol. Soc., 79, 61–78, https://doi.org/10.1175/1520-0477(1998)079<0061:APGTWA>2.0.CO;2, 1998.
Váldes-Pineda, R., Cañón, J., and Valdés, J.: Multi-decadal 40- to 60-year cycles of precipitation variability in Chile (South America) and their relationship to the AMO and PDO signals, J. Hydrol., 556, 1153–1170, https://doi.org/10.1016/j.jhydrol.2017.01.031, 2007.
Vilardy, S., González, J., Martin-López, B., and Montes, C.: Relationships between hydrological regime and ecosystem services supply in a Caribbean coastal wetland: a social-ecological approach, Hydrolog. Sci. J., 56, 1423–1435., https://doi.org/10.1080/02626667.2011.631497, 2009.
Xu, Z. X., Chen, Y. N., and Li, J. Y.: Impact of climate change on water resources in the Tarim river basin, Water Resour. Manage., 18, 439–458, https://doi.org/10.1023/B:WARM.0000049142.95583.98, 2004.


