the Creative Commons Attribution 4.0 License.
the Creative Commons Attribution 4.0 License.
Spatial and temporal variability of groundwater recharge in a sandstone aquifer in a semiarid region
Ferdinando Manna
Steven Murray
Daron Abbey
Paul Martin
John Cherry
Beth Parker
With the aim to understand the spatial and temporal variability of groundwater recharge, a high-resolution, spatially distributed numerical model (MIKE SHE) representing surface water and groundwater was used to simulate responses to precipitation in a 2.16 km2 upland catchment on fractured sandstone near Los Angeles, California. Exceptionally high temporal and spatial resolution was used for this catchment modeling: hourly climate data, a 20 m×20 m grid in the horizontal plane, and 240 numerical layers distributed vertically within the thick vadose zone and in the upper part of the groundwater zone. The finest practical spatial and temporal resolutions were selected to accommodate the large degree of surface and subsurface variability of catchment features. Physical property values for the different lithologies were assigned based on previous on-site investigations, whereas the parameters controlling streamflow and evapotranspiration were derived from calibration to continuous streamflow at the outfall and to average hydraulic heads from 17 wells. Confidence in the calibrated model was enhanced by validation through (i) comparison of simulated average recharge to estimates based on the applications of the chloride mass-balance method to data from the groundwater and vadose zones within and beyond the catchment, (ii) comparison of the water isotope signature (18O and 2H) in shallow groundwater to the variability of isotope signatures for precipitation events over an annual cycle, and (iii) comparison of simulated recharge time series and observed fluctuation of water levels. The average simulated recharge across the catchment for the period 1995–2014 is 16 mm yr−1 (4 % of the average annual precipitation), which is consistent with previous estimates obtained by using the chloride mass balance method (4.2 % of the average precipitation). However, one of the most unexpected results was that local recharge was simulated to vary from 0 to >1000 mm yr−1 due to episodic precipitation and overland runoff effects. This recharge occurs episodically with the major flux events at the bottom of the evapotranspiration zone, as simulated by MIKE SHE and confirmed by the isotope signatures, occurring only at the end of the rainy season. This is the first study that combines MIKE SHE simulations with the analysis of water isotopes in groundwater and rainfall to determine the timing of recharge in a sedimentary bedrock aquifer in a semiarid region. The study advances the understanding of recharge and unsaturated flow processes and enhances our ability to predict the effects of surface and subsurface features on recharge rates. This is crucial in highly heterogeneous contaminated sites because different contaminant source areas have widely varying recharge and, hence, groundwater fluxes impacting their mobility.
- Article
(15510 KB) - Full-text XML
- BibTeX
- EndNote
Assessment of groundwater recharge is fundamental to create strategies for management of water resources and to estimate volumetric groundwater flow through contaminated sites. Recharge rates represent an indication of the upper limit of the volume of precipitation that may be accessible for sustainable use and can govern the volume of water available to transport contaminants. Its importance is greater in semiarid regions where dominance of evapotranspiration (ET) limits water resources. In these regions, estimated recharge rates depend on the temporal and spatial resolution of the investigation, and the uncertainties associated with recharge values are usually large (Scanlon, 2000; Xie et al., 2018; Crosbie et al., 2018). In favorable circumstances, geochemically based methods have proven to be especially useful for estimating recharge rates. In areas where the geologic and anthropogenic sources of chloride in the subsurface are negligible, the distribution of chloride in the vadose zone and groundwater has been used to calculate long-term, site-wide (Wood and Sanford, 1995; Gebru and Tesfahunegn, 2018; Jebreen et al., 2018) and location-specific recharge values (Heilweil et al., 2006; Huang et al., 2018) to determine mechanisms of flow in the vadose zone (Sukhija et al., 2003; Li et al., 2017) and to evaluate the effects of environmental changes on recharge (Scanlon et al., 2007; Cartwright et al., 2007). Elevated tritium in precipitation derived from atmospheric releases during nuclear tests in the 1960s and transported into the subsurface has also been an invaluable tracer to determine modern recharge and mechanisms of flow in both vadose and groundwater zones (Cook and Böhlke, 2000; De Vries and Simmers, 2002). These geochemical and isotopic techniques are based on the interpretation of hydrologic process influences on the distribution of tracers in the subsurface but cannot show the dynamic, short-term temporal effects nor provide a continuous spatial representation of these processes at the catchment scale.
Numerical hydrologic models that integrate surface water and groundwater flows have been developed to simulate the spatial and temporal distribution of surface runoff, infiltration, evapotranspiration and groundwater recharge. However, the application of nearly all such simulation tools has been limited to humid regions (Wheater et al., 2007) with minimal application to semiarid regions. Scanlon et al. (2006), in their review on recharge in semiarid areas, reported only seven papers providing a continuous spatial distribution of recharge, out of a total of 98 studies. However, these studies investigated large areas, from 1 039 647 km2 (Flint and Flint, 2007) to 60 km2 (Flint et al., 2001), using a relatively coarse spatial resolution (from 72 900 m2 – Flint and Flint, 2007, to 900 m2 – Flint et al., 2001). In the last decade, although modeling techniques have advanced to include combined surface-water–groundwater simulations, recharge in semiarid areas has been represented with a GIS approach (Hernández-Marín et al., 2018) often using remote sensing data (Wang et al., 2008; Coelho et al., 2017; Crosbie et al., 2015) or neglecting the surface water component and focusing on the unsaturated zone (Levy et al., 2017; Turkeltaub et al., 2015).
Among the commercially available models, the physically based MIKE SHE represents the land-based hydrologic system, with an integration of the surface flows (i.e., precipitation, infiltration, evapotranspiration and runoff) and subsurface flows (i.e., percolation into the vadose zone and recharge across the water table) (Ma et al., 2016). However, the literature shows only two applications of MIKE SHE to assess recharge in semiarid areas. Liu et al. (2007) analyzed the recharge response associated with overland flow in an alluvial watershed (surface area: 91 km2 – cell size: 2500 m2) in the Tarim Basin, China. Smerdon et al. (2009) distinguished and quantified the contributions of three sources to the total recharge for a valley bottom aquifer in the Okanagan Basin (Canada) (surface area: 130 km2 – cell size: 10 000 m2).
In this study encompassing a 20-year period (1995–2014), we used MIKE SHE to simulate the recharge and the other hydrologic processes in a small catchment (2.16 km2) located on an exposed bedrock upland plateau (from 650 to 490 m a.s.l.) in the Simi Hills, near Los Angeles, California (Fig. 1). The area is semiarid with potential evapotranspiration (CIMIS, 1999) exceeding the average annual precipitation (396 mm as the recorded average annual precipitation over the 1995–2014 period). The bedrock consists of sandstone with interbeds of shale and siltstone, densely fractured with bedding parallel partings and vertical joints and faults (Cilona et al., 2015, 2016; Link et al., 1984; MWH, 2016) (Fig. 2). The hydrogeology of the site has been investigated intensively over the past 20 years because of the chemical contamination (mainly trichloroethene – TCE) in groundwater (Pierce et al., 2018a, b; Sterling et al., 2005; MWH, 2009; Cherry et al., 2009), and construction and application of a 3-D flow model (FeFlow) has been an ongoing effort supporting characterization and corrective measures (AquaResource and MWH, 2007). From the application at the site of the chloride mass balance (CMB), based on measurement of chloride in atmospheric deposition, surface water and groundwater, Manna et al. (2016) estimated a long-term average recharge of 19 mm yr−1, corresponding to the 4.2 % of the average precipitation (455 mm for the period 1878–2014). More recently, Manna et al. (2017) analyzed porewater Cl concentration profiles from the vadose and groundwater zones at 11 locations across the site. This provided spatially variable, long-term recharge values ranging from 4 to 23 mm yr−1 and indicated that, on average, 80 % of the flow in the vadose zone occurs as intergranular flow in the rock matrix and 20 % as fracture flow. These chloride-based methods lump together hydrologic processes providing long-term recharge estimates for only few locations across a large site. However, to inform the 3-D groundwater flow model and to simulate plume fluxes, information about the spatial and temporal distribution of recharge is needed.
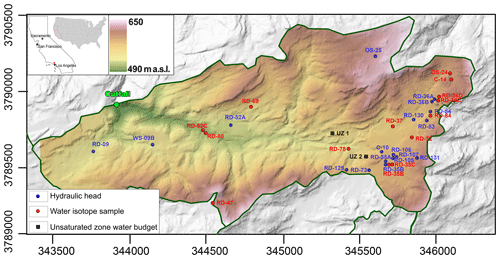
Figure 1Topographic map of the study area and location of the wells used for calibration (blue) and of water isotopes sampling (red). The two cells where unsaturated zone water budgets were analyzed are shown in black.
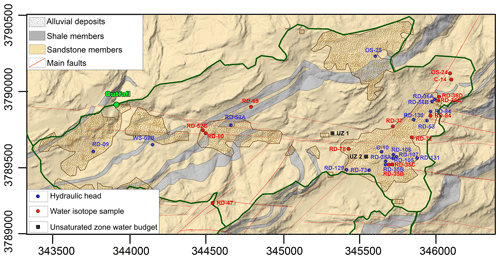
Figure 2Geologic map of the study area and location of the wells used for calibration (blue) and of water isotopes sampling (red). The two cells where unsaturated zone water budgets were analyzed are shown in black.
In this study, we analyze the spatial and temporal variability of recharge in a catchment of the contaminated site not only to constrain recharge values but also to uncover hydrologic processes that cause the borehole-scale spatial variability observed in those previous studies (Manna et al., 2016, 2017). The catchment was chosen because it is representative of the varied surface and subsurface conditions found throughout the contaminated area and it is believed to be minimally impacted during the calibration period by the surface water controls measures in place. Given that the scope of the paper is to simulate the natural conditions, these initiatives are not considered in our modeling. To better represent the large range of surface and subsurface features and provide high-resolution representation of the spatial distribution of recharge, we used hourly climate data, sub-hourly time step and a fine grid of 400 m2 cells for a total of 5420 cells. In addition to the spatial variability, we also examined the seasonal dynamics of the hydrologic processes by tracking vadose zone water budgets for representative cells of the model. This analysis helped in understanding the transient conditions that determine the rates of the hydrologic processes throughout the year. The model was calibrated using measurements of runoff from instrumented outfall flows and quarterly observations of groundwater levels in 17 wells distributed across the catchment for the simulated period. Unlike the previous applications of MIKE SHE in the literature, the simulation results were also validated through comparison with transient water levels from shallow wells, comparison with previous independent recharge estimates based on application of the chloride mass balance (Manna et al., 2016, 2017), and through the analysis of water isotopes from rainfall and groundwater that indicated the timing of recharge. Finally, we proposed a conceptual model for various recharge conditions in the fractured sandstone aquifer based on the results of the MIKE SHE simulation along with findings of previous recharge studies for the site (Manna et al., 2016, 2017). In particular, the MIKE SHE simulations contributed to the conceptual model concerning the role of surface feature variability (e.g., topography and vegetation) on the hydrological processes, whereas the Cl-based studies informed the flow mechanisms in the underlying portion of the system.
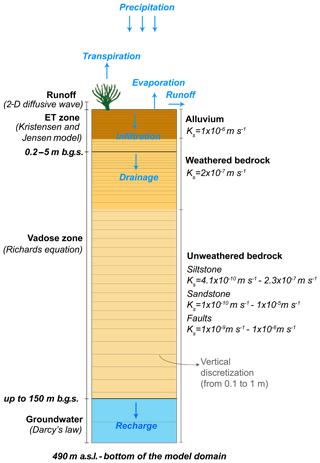
The MIKE SHE model (Refsgaard, 1995) simulations were conducted at a sub-hourly time step using hourly meteorological data measured from 1995 through 2014 on site and from stations proximal to the study area. A portion of the rainfall is intercepted by the vegetation canopy, from which evaporation occurs. The remaining water reaches the surface, where it may infiltrate, evaporate or run off downslope if depression storage is satisfied. Water infiltrating into the subsurface may be evapotranspired back to the atmosphere or percolate down to the water table to become groundwater recharge. Actual evaporation and transpiration were simulated based on the Kristensen and Jensen evapotranspiration model (Kristensen and Jensen, 1975), which considers potential evapotranspiration estimated using the FAO 56 Penman–Monteith method (Allen et al., 1998), available soil moisture and the crop characteristics (depth of the evapotranspiration zone, leaf area index and crop coefficient) in each grid cell (Table 1). When the rainfall exceeds the infiltration capacity, water is ponded on the ground surface and is available for runoff. The infiltration capacity in the model is dynamic and a function of the unsaturated hydraulic conductivity (Ku) and the water content properties (i.e., saturation point, field capacity and permanent wilting point) of the surficial media. To describe the relation between water content, conductivity and matric potential, the Van Genuchten model is used (Van Genuchten, 1980). The rate of runoff is simulated using a 2-D diffusive wave approximation and is controlled by the topographic slope, the surface roughness and detention storage. The latter is the volume of water stored in surface depressions before runoff starts. The unsaturated zone flow is simulated as the change in soil moisture, resulting from cyclical input (infiltration) and output (recharge and evapotranspiration). It is modeled as a 1-D column using the full Richards equations (Richards, 1931) with finite-difference cells that have variable discretization from the top of the column (ground surface) to the base of the column (the unsaturated–saturated zone interface). Given the variable thickness of the vadose zone and the low water fluxes, the model was run several times to set consistent initial conditions. Our analysis began when the simulation showed that the degree of change in average recharge value from one run to the next was about 0.3 %, indicating near-steady-state conditions. Recharge was calculated anytime that infiltration water arrived at the water table. Most precipitation events do not result in recharge because infiltration into the shallow subsurface is intercepted and evapotranspired. The flow in the groundwater zone was represented using the 3-D finite-difference Darcy equation. A fixed head boundary applied along the lateral sides and the bottom of the model domain (490 m a.s.l.) was used to simulate the flow to and from the deeper groundwater system, which is not explicitly represented in the integrated model but which extends several hundred meters (Fig. 3). These fixed heads are based on observed groundwater levels at the site and simulations based on a detailed 3-D groundwater flow model system that includes the catchment and a much larger domain beyond (AquaResource and MWH, 2007). The groundwater contribution to streamflow is minimal and intermittent (∼0.1 mm yr−1 for the period of 1995–2014) and only occurs at the farthest downstream location of the catchment where the groundwater table rises close to the ground surface.
Table 1Land use class-specific parameters to model runoff and evapotranspiration.
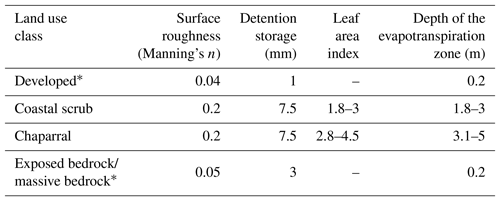
* impervious areas.
2.1 Climate data
Hourly rainfall data were collected from two stations within the catchment boundaries: the Sage Ranch station, managed by Ventura County watershed (http://www.vcwatershed.net/hydrodata/php/getstation.php?siteid=272#top, last access: January 2016); and the Simi Hills Rocketdyne Lab, managed by Boeing Inc. The annual precipitation ranges from 99 mm (2014) to 976 (1998), with an average value of 396 mm yr−1. The seasonal precipitation regime is Mediterranean, with 77 % of the total precipitation occurring from December to March.
Daily maximum and minimum air temperature observations were obtained from two climate stations of the NOAA network: from 1995 to 1998 data were gathered from the Cheeseboro station (https://www.ncdc.noaa.gov/cdo-web/datasets/GHCND/stations/GHCND:USR0000CCHB/detail, last access: January 2016) and from 1998 to 2015 from the Van Nuys station (https://www.ncdc.noaa.gov/cdo-web/datasets/GSOM/stations/GHCND:USW00023130/detail, last access: January 2016), respectively 6 km SW and 18 km E of the study site. Temperatures were adjusted using a dry (10 ∘C km−1) and wet (5.5 ∘C km−1) adiabatic lapse rate based on the elevation change between the SSFL (Santa Susana Field Laboratory) site and the collecting station. July, August and September are the warmest months with an average daily maximum temperature of 30.5, 31 and 30.4 ∘C, respectively, whereas February and December are the coldest with an average daily maximum temperature of 17 and 17.4 ∘C, respectively. Annual average temperature is 16.7 ∘C.
2.2 Surface and subsurface parameters
The MIKE SHE model was developed employing a 20 m by 20 m finite-difference horizontal-plane grid to represent the surface physical features; a fine vertical discretization of the vadose zone with 240 numerical layers ranging from 0.1 to 1 m thickness; and 2 groundwater zone layers, with thickness variable from 5 to 185 m, to represent vertical variability at, and just below, the position of the water table (Fig. 3). This resolution was selected as a compromise between representation of spatial variability at a more detailed scale and reasonable computational time. Maps of topography, vegetation, surficial geology and land use were used to assign surface parameters (Figs. 1, 2 and 4). High-resolution topographic data (2 ft = 0.5 m interval elevation contours) were obtained based on an aerial survey of the site in 2010. These topography data were used to define the ground surface elevations (Fig. 1).
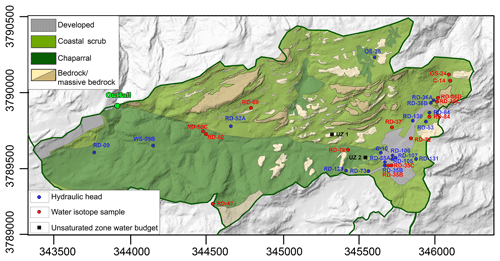
Figure 4Land use map and location of the wells used for calibration (blue) and of water isotopes sampling (red). The two cells where unsaturated zone water budgets were analyzed are shown in black.
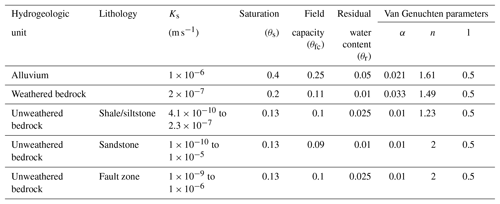
The surface and subsurface hydrogeologic units include alluvium, fractured weathered and unweathered bedrock comprised of sandstone, siltstone and shale beds of varying thickness, grain size and cementation (Figs. 2 and 3). The physical properties of these units, derived from previous on-site investigations (Allegre et al., 2016; Quinn et al., 2015, 2016) and adjusted by calibration, are summarized in Table 2. In particular, our model uses three separate sets of Van Genuchten parameters to represent the pressure-saturation–hydraulic-conductivity relationships. The parameters used reflect our understanding that the rock matrix transmits the largest volume of recharge (80 %), while recharge through the fractures is minimal (20 %) (Manna et al., 2017). Therefore, the relationships used are biased towards the matrix response. These values were further calibrated using the groundwater level responses and the streamflow. Further rock core samples indicate a high moisture content (∼80 %) (Cherry et al., 2009) indicating that Ku is often close to Ks and the hydraulic-conductivity–saturation curve reflects this understanding.
Four land use classes were identified and delineated based on aerial imagery and local land cover datasets (Davis et al., 1998): developed areas (roads, building, parking lots); chaparral (chamise, scrub oak), coastal scrub (black sage) and exposed bedrock (areas without vegetation) (Fig. 4). The first category represents only 5 % of the study catchment, whereas the two vegetation classes (chaparral and coastal sage scrub) cover 83 % of the area. The remaining 12 % is represented by bedrock outcrop. This latter category was subdivided into two classes: non-massive bedrock and massive bedrock based on physical appearance. Massive bedrock areas were identified based on rock masses that have resisted erosion over the decades and are presumed to be poorly fractured and/or well cemented such that local infiltration through these rock units is very low. These cell assignments were identified using topography and imagery analysis. First, we used the minimum downslope elevation change approach to identify topographic ridges; this algorithm calculates the minimum elevation drop to a downslope neighbor. In a second stage, we isolate from the land use map the exposed bedrock areas. Vegetation, indeed, generally does not grow on well-cemented rock. Finally, massive bedrock areas were assigned cells with downslope elevation change greater than 1.25 m in areas without vegetation.
Values of leaf area index, depth of the root zone, surface roughness and Manning's number were assigned to each land use class-specific parameter, based on the calibration process, with final values similar to those available in the literature (Canadell et al., 1996; Scurlock et al., 2001; Chin et al., 2000) (Table 1). To calculate the actual evapotranspiration, a crop coefficient varying monthly between 0.53 and 1.02 has been used. This estimate is based on (i) reference crop evapotranspiration rates (RET) for Zone 9 of the Reference Evapotranspiration Zones map of the California Irrigation Management Information System that corresponds with the area the site is within (ITRC, 2003), (ii) a “Pasture and Misc. grasses” land class chosen as representative of the site, and (iii) a reduction of 8 % to account for bare spots in vegetation and reduced vigor (ITRC, 2003).
2.3 Unsaturated zone water budgets
To assess the temporal variability of infiltration, evapotranspiration, change in storage and recharge, we extracted the simulated unsaturated zone water budgets for two locations representing the span of variability of the catchment. The two locations were selected based on surface geology (Fig. 2) and land use category (Fig. 4): UZ-1 represents an area of outcropping bedrock without vegetation and UZ-2 represents a cell with alluvium and vegetation cover. The average infiltration value over the simulated period at the two locations (UZ-1: 87 mm yr−1; UZ-2: 395 mm yr−1) matches the average infiltration value for all the cells of the catchments with the same land use and surface geology. For these cells, we extracted the weekly time series of infiltration, evapotranspiration, storage variations and flux at the bottom of the ET zone (i.e., drainage). The latter indicates the volume of water that infiltrates into the vadose zone and will eventually become recharge upon reaching the water table. The analysis of the seasonal variability of these fluxes provided insights about their transient nature and about the effect of the surface variability on the hydrologic processes in the unsaturated zone.
2.4 Approach for model calibration
In the model calibration procedure, the simulation results were compared to observed processes and, to obtain acceptable matches, 10 parameters were available to adjust: surface roughness, detention storage, imperviousness, rooting depth, leaf area index (LAI), crop coefficient, and unsaturated hydraulic conductivity and water content parameters of alluvium and weathered bedrock. These were tested against an objective function of streamflow and groundwater level measurements. An objective function is a measure of overall model fit of simulated to observed values of groundwater levels and streamflow.
For the streamflow calibration, we compared the surface runoff generated by MIKE SHE to the data collected at the catchment outfall between 2009 and 2011. This time interval had minimal occurrence of substantial anthropogenic activities and was representative of natural hydrologic conditions, as reported also by Manna et al. (2016).
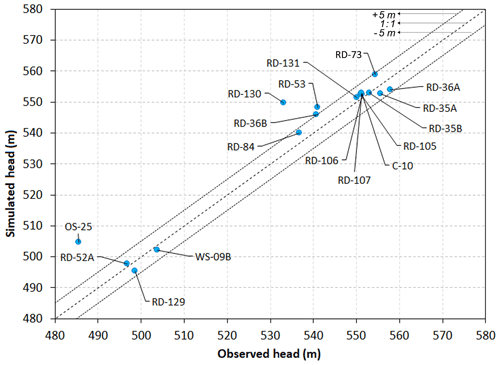
For the calibration to groundwater levels, quarterly manually measured water level data were used. Excluded from the calibration data were (i) wells with screened interval below the bottom of the model domain (490 m a.s.l.) and (ii) wells where the water table is strongly influenced by subsurface complexity not represented in the saturated zone portion of the MIKE SHE model. After these exclusions, water level data from 17 wells, with water depths ranging from 25 to 137 m b.g.s. (below ground surface), were used. The number of measurements in the time series at each well varies from 1 (RD-130) to 139 (WS-09B) measurements. In the calibration procedure, average values were used for comparison with average simulated values.
The calibration process proceeded in an iterative manner. After each calibration run, the two calibration targets were examined with a variety of metrics. For the streamflow, we analyzed mean error for simulated and observed average annual flow as well as mean error, root mean squared error, correlation and Nash–Sutcliffe efficiency for the simulated and observed average monthly and daily flows. An additional qualitative measure of the correlation between precipitation and streamflow event was provided by the analysis of the plots of observed and simulated daily streamflow hydrographs.
For the groundwater levels, the metrics were mean error, mean absolute error, root mean squared error, and normalized root mean squared error for the simulated and observed average water levels. In addition, residual plots of simulated and observed water levels provided a quantitative and qualitative assessment of the residual error present at the observation well throughout the domain. Spatial patterns of groundwater level residual were compared against other spatial data (e.g., hydraulic conductivity, boundary conditions, land uses, surface geology) to evaluate potential correlations and adjustments that could improve the calibration.
Following an assessment of these calibration targets, the 10 model parameters were adjusted for better calibration metrics. In instances where the results were not consistent with the site conceptualization, consideration was given as to whether an alternative conceptualization would explain the results predicted by the model. Testing of alternative conceptualizations through manual simulations was chosen over the alternative method of optimization of a single conceptualization using software such as PEST (Doherty, 2004) given the uncertainty in how to parameterize models in these semiarid environments. Given the structural changes (representation of the unsaturated flow, representation of impervious areas) that were made to the model during several simulations, it was not possible to carry out an exhaustive optimization or sensitivity analysis. However, through the calibration process we gained semi-quantitative information about the model sensitivity to each parameter which is presented in the results section.
2.5 Approach for model validation
To obtain confidence about the reasonableness of the results, simulation results from the calibrated model were tested by a validation procedure, which included comparison to previous independent recharge estimates based on chloride, and timing of recharge from isotopic data (18O–2H) and from analysis of observed fluctuations of water level hydrographs, which are not used in the calibration. The premise of the validation is that the calibrated model must provide results consistent with the validation information that are entirely independent of the parameter assignments made in the calibration.
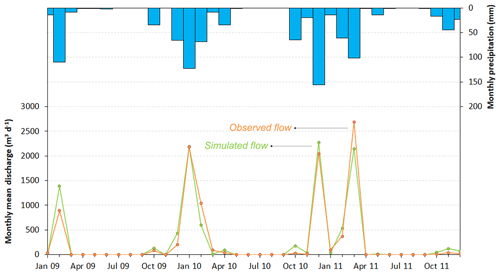
Figure 5Monthly precipitation values and comparison between simulated (green) and observed (red) runoff flow at the outfall of the catchment from January 2009 to December 2011.
Manna et al. (2016) estimated an average long-term recharge of 19 mm yr−1 for the same catchment using the chloride mass balance method, based on the average Cl concentration measured in the atmospheric deposition, comprised of rainfall and dry fallout (2.6 mg L−1), surface water at the catchment outfall (4 mg L−1) and groundwater (52.5 mg L−1). Since chloride concentration in groundwater is proportional to the concentrating effect of water loss due to evapotranspiration, it can be used as a proxy to determine the range of variability in recharge. Chloride concentration in shallow groundwater monitoring wells ranges across the area from 17 to 162 mg L−1 corresponding to recharge values of 43 and 5 mm yr−1, respectively. Manna et al (2017) also provided insights regarding spatial variability of recharge within the catchment based on analysis of Cl profiles in porewater from the vadose zone and groundwater, which indicate a range of recharge from 4 to 21 mm yr−1 corresponding to <1 %–4.7 % of the average annual precipitation for four locations located within the catchment area. Although the recharge values obtained from the CMB method integrate hydrologic processes occurring over longer time, from decades to millennia, they represent a reasonable assessment of long-term, site-wide and location-specific average values and are valuable for validation purposes.
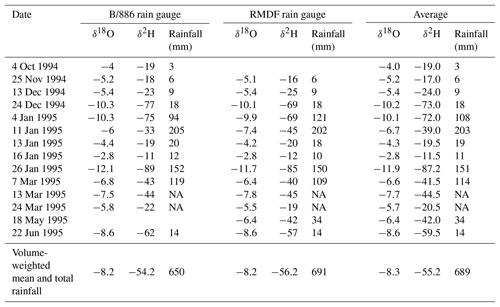
Samples of rainfall and groundwater were analyzed for water isotopes (18O–2H) . These water isotopes are commonly used to assess evaporative processes and to determine sources and origins of different groundwaters. Typically, the water isotope values vary seasonally over the annual cycle, so that the groundwater composition reflects the season with most of the recharge. In this study, we compared the isotopic signature of groundwater to that of precipitation for an entire hydrological year to determine whether the timing of recharge indicated by the model is consistent with the isotopic signature for the same period of the year. The available isotope data for rainfall were determined for the period October 1994 to June 1995 collected at two rain gauge stations (B/886 and RMDF) 5 km from the studied watershed and analyzed in the same year by an automated gas-source mass spectrometer at the University of California Berkeley. The groundwater samples were collected from monitoring wells in the studied catchment in two rounds of sampling: the first in 2003–2004 and the second in 2013 (Fig. 1).
Furthermore, to test the ability of the model to simulate unsaturated zone flow processes and to reproduce the transient recharge conditions, we compared the simulated time series of recharge, obtained from MIKE SHE, with quarterly water level measurements at five locations not used in the calibration process. The depth to groundwater at these wells ranges between 2 and 60 m with seasonal fluctuations due to the recharge events. The recharge time series is obtained, extracting the average, catchment-wide, monthly recharge values.
3.1 Model calibration and sensitivity
Streamflow measured at the outfall occurs in response to rainfall; however, some precipitation events are followed by very low or no measurable flow (Fig. 5). This is evident for precipitation events from April to June 2009, October and November 2010, and May and June 2011. In all these cases, the surface runoff, generated by the precipitation events, infiltrates into the subsurface without reaching the surface outfall (Fig. 5). These hydrologic dynamics are well simulated by MIKE SHE. The comparison between the observed and the simulated hydrographs shows a good correlation for the calibration period (R2=0.97; average difference 4.7 %). The average simulated flow is 48 mm yr−1, about 14.5 % of the average precipitation for the 2009–2011 period (331 mm), and is almost coincident with the measured flow (46.2 mm yr−1) (Fig. 5). This value reflects the precipitation conditions of the 2009–2011 period and is lower than the average runoff over the entire simulated interval (110 mm yr−1, 28 % of the annual precipitation). Monthly and daily Nash–Sutcliffe efficiency (NSE) values of 0.94 and 0.87 were achieved, respectively, indicating good fit to observed flows (NSE = 1 corresponds to a perfect match).
In addition to the surface water leaving the catchment, the model was also calibrated to the observed average groundwater head data (Fig. 6). A good match was obtained for the 17 locations, with almost all values falling within the 10 m confidence interval bands, with a correlation coefficient of 0.96 and a mean absolute error of 4.5 m (Fig. 6). This good correlation provides confidence about the spatial distribution of model parameters.
Of the 10 adjusted parameters, unsaturated hydraulic conductivity and water content parameters of alluvium and weathered bedrock had the strongest effect on the calibration and are, therefore, well constrained by the measured streamflow and groundwater levels. These geologic features represent the upper layers of the model domain, and variations in their physical and hydraulic properties control the rate of infiltration, evapotranspiration, drainage and therefore recharge. A third parameter important in the calibration was the detention storage. This is because a substantial amount of water from precipitation, especially at the beginning of the rainy season, infiltrates without generating runoff events at the outfall (Fig. 5). This volume of water is controlled not only by the properties of unsaturated zone (Table 2) but also by the value of detention storage assigned to each land use class (Table 1). Conversely, alterations in rooting depth, LAI and crop coefficient only resulted in small changes in streamflow. This is because significant runoff events tend to occur during brief high-intensity precipitation events with a magnitude that far exceeds the relative amount of evapotranspiration, which might occur during these events. For the same reason, though, these factors had a relatively greater effect on the volume of water available for drainage and subsequent recharge.
3.2 Spatial variability
To study the spatial variability of the water budget components, average annual maps of infiltration (Fig. 7a), evapotranspiration (Fig. 7b) and recharge (Fig. 7c) for the period 1995–2014 were created.
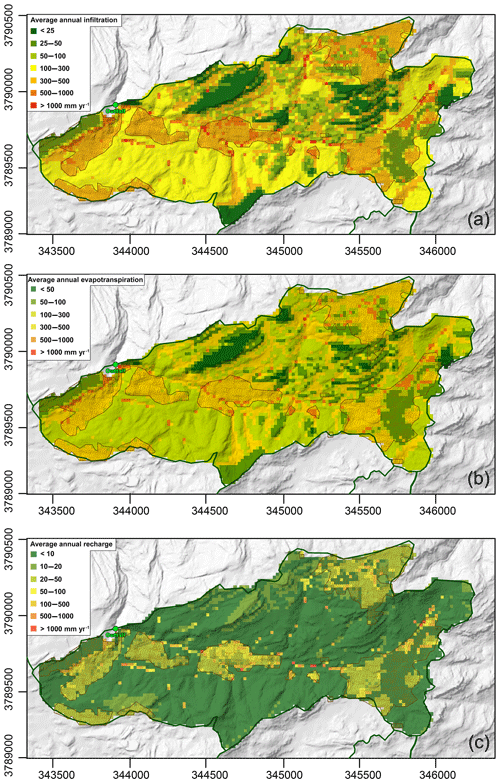
Figure 7Distribution of average annual infiltration (a), evapotranspiration (b) and recharge (c). Dashed polygons represent areas with alluvium at the surface.
Average infiltration for the catchment is 254 mm yr−1, corresponding to 64 % of the total precipitation, but single cell values span over 3 orders of magnitude from 9 to >1000 mm yr−1 (Fig. 7a). Low infiltration values are found in developed/paved (average 51 mm yr−1) and massive bedrock (average 14 mm yr−1) cells. Due to the low infiltration capacity, more runoff is generated in these cells, and thus infiltration is higher in nearby cells that receive the surface water. Where these neighboring cells are covered by alluvium at the surface, infiltration is even higher. On average, cells with alluvium at the surface have an infiltration value of 332 mm yr−1, 25 % more than those where bedrock outcrops. Higher infiltration is also displayed in depressed areas such as those along the main drainages and where closed topographic depressions occur. These cells collect most of the surface runoff creating conditions for focused infiltration and recharge.
Only a small portion of water that enters the subsurface reaches the water table because the majority is lost due to evapotranspiration (Fig. 7b). The average evapotranspiration estimated using MIKE SHE is 265 mm yr−1, a value slightly higher than the average infiltration. This excess of ET over infiltration is attributed to canopy interception and evaporation of temporarily ponded surface water. When removing these two water-loss processes, the average evapotranspiration is 237 mm yr−1, which corresponds to 60 % of the annual precipitation and to 94 % of the total infiltration. Transpiration is the main process of ET contributing to about 70 % of the total ET. This result is expected considering the considerable depth of the roots (up to 5 m for Chaparral) and the fact that vegetation covers 83 % of the catchment area. Single cell values of ET span over 3 orders of magnitude, from 50 to >1000 mm yr−1. Since the actual evapotranspiration depends strongly on the availability of subsurface water, the spatial variability mimics the infiltration pattern and the two factors are strongly correlated (R2=0.84). Therefore, low ET is associated with developed (asphalt, buildings) and massive bedrock areas, and high ET values are found along the main surface drainages where infiltration is high and locally available for evapotranspiration. The presence of alluvium at the surface increases the ET values on average by 25 %; for example, average ET in cells with chaparral and alluvium is 400 mm yr−1, whereas where chaparral is rooted in weathered bedrock it is ∼300 mm yr−1.
A map of the spatial distribution of the average annual recharge is shown in Fig. 7c. The average recharge value for the catchment is 16 mm yr−1, equal to 4.1 % of the precipitation and 6.5 % of the infiltration. The range of variability of recharge is over 3 orders of magnitude and spatially variable depending on topography, surface geology and land use. It is noteworthy that 79 % of the catchment has recharge less than 10 mm yr−1 and 90 % less than 30 mm yr−1, which indicates that the largest volumes of recharge are focused in small portions of the site. The recharge map (Fig. 7c) shows the influence of the surface parameters on recharge estimates. Recharge is high along the main drainage because of the contribution of surface water flowing from the surrounding slopes and enhanced infiltration where the topographic slope decreases abruptly. Relatively higher recharge values are also observed in areas with alluvium at the surface because the infiltration and retention capacities are higher, and therefore water can seep from the overburden into the bedrock once the evapotranspiration demand and driving forces are met. Recharge is also higher in cells without vegetation cover, compared to other cells with equivalent topographic slope and surficial geology, because the evapotranspiration in these areas is lower.
3.3 Temporal variability
The seasonal variability of the hydrologic processes was examined analyzing unsaturated water budgets at two locations with different land use and surficial geology (UZ-1 and UZ-2 in Fig. 1) Among the 20 years, we show the monthly average daily values from 2005 to 2007. This time span features a wet year (2005 – 978 mm), a dry year (2007 – 149 mm) and one year with average precipitation (2006 – 331 mm) and therefore is reasonably representative of the simulated period.
For areas with bedrock outcrop not covered by vegetation (UZ-1 in Fig. 1), the infiltration ranges from 0 to 2.5 mm d−1 (Fig. 8). The infiltration pattern shows null or minimal values during the summer and positive events during the wet season. Water that enters the subsurface between April and January replenishes the water content in the ET zone and becomes available for evaporation but not for drainage. Evaporation is null during the summer because of the lack of precipitation and because all the water stored in the first 20 cm of bedrock has been taken up by evaporation in the previous months. Downward flux at the bottom of the ET zone (i.e., drainage) only happens episodically when the water content in the ET zone is above the field capacity, at the end of the wet season (i.e., March and April) or occasionally after exceptionally high intensity precipitation events (i.e., January 2005).
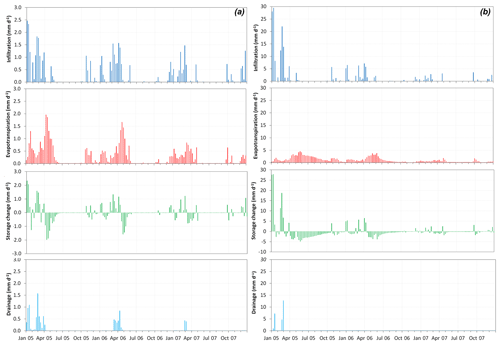
Figure 8Unsaturated zone water budget for the ET zone from January 2004 to December 2007 for two cells representative of the domain: (a) UZ-1 area with outcropping bedrock without vegetation; (b) UZ-2 area with alluvium deposit covered by vegetation.
For areas with alluvium at surface (UZ-2 in Fig. 1) the infiltration has the same pattern but a different order of magnitude (from 0 to 30 mm d−1) due to the higher infiltration capacity of the alluvium (Fig. 8). Here, the available water capacity of the ET zone is greater because of the different physical properties (e.g., larger porosity) of the soil and the greater depth of the ET zone. Therefore, almost all the infiltration water is taken up by the evapotranspiration. Unlike areas without vegetation, evapotranspiration is not directly related to precipitation events and occurs more continuously throughout the year. This is because alluvium stores a greater volume of water in the ET zone that is nearly completely consumed by ET. A drainage flux is observed only during high-intensity precipitation events that create near-saturation conditions such that water cannot be held by tension in the shallow unsaturated zone and downward flow is initiated.
For both cases, drainage is not steady throughout the year but occurs episodically, controlled by antecedent soil water content in the ET zone and by the intensity of precipitation. During drier-than-average years, such as 2007, drainage occurs in areas without vegetation, whereas no drainage is observed in cells with vegetation cover. After crossing the bottom of the ET zone, water arrives at the water table with a time lag depending on the magnitude of the flux and on the physical properties and the thickness of the vadose zone.
3.4 Model validation
The ability of the model to simulate transient hydrologic conditions was investigated through the comparison between well hydrographs at five locations and the temporal variability of recharge (Fig. 9). The spatially averaged recharge rates obtained from MIKE SHE (monthly time-step) range from 0.95 mm (November 2014) to 9.1 mm (March 2005). The latter is the response to the extraordinary rainy season that occurred between December 2004 and March 2005 (903 mm), whereas the first is due to dry conditions of the recent drought in California. The range of depth to groundwater from 1995 to 2014 at the five locations considered is 2.8–14.4 m at RD-09, 17.8–30 m at RD-35A, 16.2–28.7 at RD-73, 37.7–50.8 m at RD-36B and 33.1–60.1 at WS-09B. The shape of these hydrographs depends on surface (surface geology, topographic slope, land use) and subsurface (mechanisms of flow in the vadose zone) conditions. For our validation purpose, it is noteworthy that, at all the locations, the hydrographs show a good match with the recharge time series such that the peaks in recharge coincide with water table rises. The greatest rises overlap the two highest recharge periods (1998 and 2005), whereas a constant declining trend is observed from 2011 to 2014 in response to drier conditions (Fig. 9). The good correlation suggests that, at this scale, the equivalent porous media (EPM) approach used is reasonable to simulate average responses in groundwater because, although the bedrock has many interconnected fractures, it is only a minor contributor to recharge.

Figure 9Comparison between the monthly recharge time series and the depth to groundwater at five locations across the catchment.
The average recharge value for the catchment from the simulation is 16 mm yr−1 and is consistent with previous recharge estimates obtained for the site using the CMB method (19 mm yr−1, 4.2 % of the average precipitation, Manna et al., 2016; 16 mm yr−1, 3.5 % of the average precipitation, Manna et al., 2017). The frequency distribution of recharge values from the MIKE SHE simulation (92 % of the domain has average recharge lower than 40 mm yr−1) also corresponds well to the range of variability based on chloride (from 0 to 43 mm yr−1) reported by Manna et al. (2016, 2017).
For additional information on recharge processes, we analyzed water isotopes obtained from rainfall and groundwater samples (Fig. 10). The samples show a substantial isotopic range from one precipitation event to another over the 1-year collection period. 18O varies between −2.8 ‰ and −12.1 ‰ for B/886 and −2.8 ‰ and −11.7 ‰ for RDMF, and 2H varies between −11 ‰ and −89 ‰ for B/886 and −12 ‰ and −85 ‰ for RDMF (Table 3). This large range of values is probably due to the two different trajectories of the precipitation events in southern California, one originating in the Pacific and one over the Gulf of Mexico, as found by Friedman et al. (1992). The volume-weighted mean values for the two stations are −8.2 ‰ and −54.2 ‰ for B/886 and −8.2 ‰ and −56.2 ‰ for RDMF and are consistent with global-scale maps of water isotopes for precipitation in southern California (Bowen and Revenaugh, 2003).
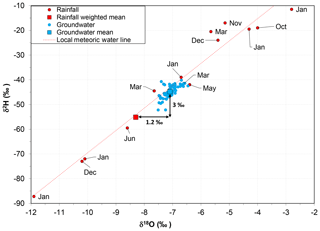
Figure 10Water isotopes plot for rainfall samples collected at two rain gauge stations and groundwater samples from 16 wells of the catchment.
Unlike rainfall, groundwater samples fall within a narrower range: from −6.5 ‰ to −7.5 ‰ for 18O and from −40.2 ‰ and to −52.2 ‰ for 2H. All the samples are aligned along the local meteoric water line (Fig. 10), indicating little if any evaporation from standing water on surface. This lack of concentration effect on the isotopes is apparently in contrast to the chloride data. Manna et al. (2016) found that Cl concentrations in groundwater are, on average, 20 times greater than those from atmospheric deposition because of the strong influence of evapotranspiration. The common explanation for the lack of evaporation effects on the water isotopes in groundwater is that the transpiration is the main evapotranspiration process (Clark, 2015; Cook and Böhlke, 2000). Although transpiration through the vegetation causes a concentration effect on Cl, it does not cause fractionation of the water isotopes and therefore the groundwater samples are not enriched (Clark, 2015; Cook and Böhlke, 2000).
The lack of evaporative water isotope signature associated with high groundwater Cl concentration can also be explained by recharging water that crosses the ET zone mobilizing precipitated salts but without any evaporation. This hypothesis supports the results of the MIKE SHE simulations, which show that throughout the year there are only episodic fluxes at the bottom of the ET zone (Fig. 9). A relevant observation that corroborates this hypothesis is that the isotopic composition of groundwater is similar to that found in rainfall samples collected at the end of the wet season (March and June) or, on occasion, with high-intensity precipitation events (January – 203 mm) (Table 3). This similarity can be attributed to the preponderance of recharge occurring at these times and thereby resulting in the groundwater values being different from the weighted mean precipitation by 1.2 ‰ 18O and 3 ‰ 2H. This proposed model of episodic flow through the unsaturated ET zone is also corroborated by the evidence presented by Manna et al. (2017) that, on average, 20 % of the flow in the vadose zone occurs as fast flow through the interconnected fractured network.
To summarize the findings of this study, and its relationship to the literature and to the previous recharge studies at the site (Manna et al., 2016, 2017), we propose the following process-based conceptual model for site recharge (Fig. 11).
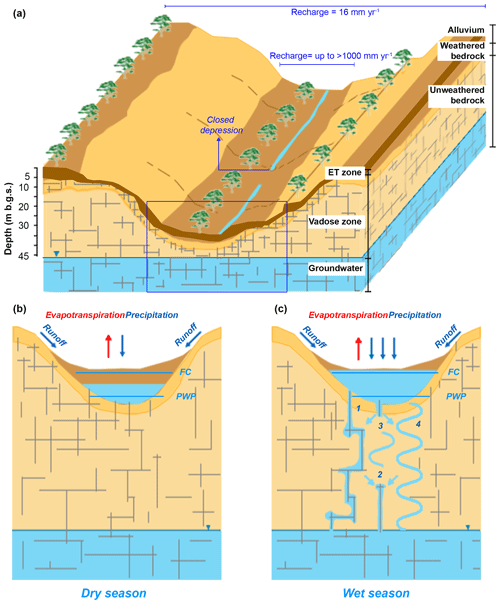
Figure 11Conceptual model for recharge at the site. (a) Spatial 3-D conceptual model of the catchment showing where high recharge occurs. The two-dimensional schematic of the unsaturated zone hydrologic process during (b) dry season and (c) wet season. During the dry season water content is between the field capacity (FC) and the permanent wilting point (PWP) and therefore is consumed by evapotranspiration. Conversely, during the wet season, water content is above the FC and seeps into the underlying bedrock. Numbers describe mechanisms of flow in the vadose zone: 1 is fracture flow, 2 is water flowing from matrix into fractures, 3 is water flux from fractures into matrix, and 4 is intergranular matrix flow.
The average recharge value is 16 mm yr−1, which is consistent with previous estimates at the site and with those obtained for other sandstone aquifers in semiarid areas in the US (4 % – Heilweil et al., 2006) and other studies in semiarid regions around the world (0.2–35 mm yr−1 equal to 0 %–5 % of the average precipitation, Scanlon et al., 2006). Recharge varies greatly across the catchment as a function of topography, surface geology and land use. High recharge occurs where most runoff water seeps into the subsurface, creating conditions for focused recharge. This condition happens where closed depressions occur and where sloped topography abruptly transitions to flat along the main surface drainages (Fig. 11a). In most areas, alluvium covers the fractured porous bedrock, thus enhancing infiltration and temporary storage of infiltrated water. Generally, in semiarid regions, high recharge values along a valley at the edge of the slope are referred to as mountain front recharge (MFR) (Wilson and Guan, 2004). However, our catchment is located on the top of a ridge standing 300 m above the surrounding valleys (Manna et al., 2016) and, thus, our case study represents groundwater recharge on the mountain block rather than MFR. Nonetheless, it is interesting that the processes observed in our small catchment are similar to those described for aquifer-scale recharge studies (Aishlin and McNamara, 2011; Carling et al., 2012; Manning and Solomon, 2003; Bresciani et al., 2018) and defined as MFR.
Infiltration from April to December (dry season) contributes to replenish the water content in the ET zone and remains available for evapotranspiration (Fig. 11b). Conversely, during the wet season, infiltration crosses the bottom of the ET zone (i.e., drainage) and migrates deeper through the vadose zone. This happens when the soil is above the field capacity (FC), which is more frequent at the end of the wet season in March or April and/or during high-intensity precipitation events (Fig. 11c). This recharging water quickly crosses the ET zone, as shown by the ET zone water budgets extracted from MIKE SHE (Fig. 9) and by the lack of evaporative signature in isotope composition (Fig. 10).
The occurrence of this fast and/or preferential flow out of the ET zone is also corroborated by the analysis of vertical chloride porewater concentration profiles in the unsaturated zone (Manna et al., 2017). The Cl concentration is high in the ET zone (up to 10 000 mg L−1) and considerably lower in deeper vadose and groundwater zones (average 49 mg L−1). The higher Cl concentration in the shallow subsurface is due to the effect of strong evapotranspiration that takes up water but not chloride, whereas the lower concentration below is due to fast and/or preferential flow of water that escapes the concentrating effect of water loss in the shallower zone. Case studies showing similar results for water that crosses the ET zone preferentially in time and space to become potentially recharge have been also reported in the literature (Kurtzman et al., 2016), also referred to as selective recharge (Gat and Tzur, 1967; Florea, 2013; Krabbenhoft et al., 1990). The occurrence of these fluxes has been also analyzed as a function of precipitation characteristics and antecedent water content with rainfall intensity being the main factor (Allocca et al., 2015; Crosbie et al., 2012; Nasta et al., 2018; Taylor et al., 2013).
Upon reaching the deeper vadose zone, water is redistributed between intergranular matrix flow and fracture flow due to wettability and saturation concepts. The fractures and the matrix pores drain the water from the ET zone. Active flow through the fractures is possible under conditions such as ponding or intense precipitation, when a continuous slug of water lets (i) the advective front move ahead into the fracture (1 in Fig. 11c) and (ii) the matrix water flow into the fractures (2 in Fig. 11c). Otherwise, water is drawn from the fractures into the unsaturated matrix blocks (3 in Fig. 11c) and contributes to the slow vertical intergranular matrix flow (4 in Fig. 11c). According to Manna et al. (2017), the first two mechanisms are much less frequent and contribute, on average, to only 20 % of the total recharge. It is most likely that conditions for flow in the fractures occur episodically in areas of the site with high infiltration (topographic low and alluvium at the surface) where temporary perched systems are observed.
For the upland bedrock catchment, the surface-water–groundwater numerical model (MIKE SHE), using a fine numerical grid (20 m×20 m) with calibration to streamflow and groundwater levels, simulated the spatial and temporal variability of recharge across a 2.16 km2 catchment in southern California, USA. This is the first study that combined MIKE SHE simulations supported by analysis of water isotopes and chloride mass balance to assess recharge in a sedimentary bedrock aquifer in a semiarid region. The calibrated simulations, indeed, were judged to be reliable and strongly reflective of the natural system, based on the validation comparisons to mean recharge obtained independently from the chloride mass balance method (Manna et al., 2016, 2017) and to the timing of major recharge events indicated by water isotopes and water level fluctuations. The simulations showed that major flux events at the bottom of the evapotranspiration zone, that result in recharge tens of meters below the surface, occur episodically mostly at the end of the rainy season and that recharge varies across the catchment between 0 and 1000 mm yr−1. The fine numerical grid in the horizontal plane allowed meaningful examination of recharge spatial variability. A substantially coarser grid would obscure influences of key surface features on the hydrologic processes.
The results obtained from the catchment-scale simulations are being used to specify rules for recharge to be assigned to the upper boundary condition of a 3-D numerical EPM groundwater flow model (FeFlow), covering the studied catchment and a much larger area beyond (52 km2). The modeled groundwater domain has many contaminant plumes, and recharge is key to determine the fluxes available to transport contaminants.
The aim of the MIKE SHE model is to represent the natural hydrologic conditions, after site industrial operations ceased more than a decade ago. During historical operations from the 1950s through mid-2000s, use of imported and pumped groundwater likely caused increases to infiltration and recharge locally in some areas. These conditions are beyond the scope of this paper but worth further consideration in a follow-on study as it relates to when contaminant releases occurred and may provide insights regarding how contaminant migration rates may have been influenced. Future modeling efforts will also evaluate the effect on recharge of the surface water control systems currently in place on the site. These storm water management measures aim to limit the volume of water leaving the catchment and, therefore, will likely influence the natural rates of the other hydrologic processes.
Precipitation and air temperature data are available at the link provided in Sect. 2.1. Water isotopes for rainfall samples are provided in Table 3.
FM, JAC and BLP formulated the overarching research goals and aims; BLP acquired the financial support for the project leading to this publication and supervised the execution; SM, DA and PM built and ran the MIKE SHE model; FM created the figures and wrote the original draft; SM, DA, PM, JAC and BLP reviewed and edited the draft.
The authors declare that they have no conflict of interest.
Funding for this work was provided by an NSERC Industrial Research Chair (no. IRCPJ 363783) to Beth Parker in partnership with the Boeing Company. Field work was supported by the site owner; their consultants (MWH Inc., now Stantec); and University of Guelph colleagues, especially Amanda Pierce from the G360 Institute for Groundwater Research, who collected and analyzed isotope samples.
This paper was edited by Marnik Vanclooster and reviewed by two anonymous referees.
Aishlin, P. and McNamara, J. P.: Bedrock infiltration and mountain block recharge accounting using chloride mass balance, Hydrol. Process., 25, 1934–1948, 2011.
Allegre, V., Brodsky, E. E., Xue, L., Nale, S. M., Parker, B. L., and Cherry, J. A.: Using earth-tide induced water pressure changes to measure in situ permeability: A comparison with long-term pumping tests, Water Resour. Res., 52, 3113–3126, https://doi.org/10.1002/2015wr017346, 2016.
Allen, R. G., Pereira, L. S., Raes, D., and Smith, M.: Crop evapotranspiration – Guidelines for computing crop water requirements, FAO Irrigation and drainage paper 56, Fao, Rome, available at: http://www.fao.org/3/X0490E/X0490E00.htm (last access: April 2019), 1998.
Allocca, V., De Vita, P., Manna, F., and Nimmo, J. R.: Groundwater recharge assessment at local and episodic scale in a soil mantled perched karst aquifer in southern Italy, J. Hydrol., 529, 843–853, https://doi.org/10.1016/j.jhydrol.2015.08.032, 2015.
AquaResource and MWH: Three-Dimensional Groundwater Flow Model Report, Santa Susana Field Laboratory, available at: https://www.dtsc-ssfl.com/files/lib_rcra_groundwater/3d_report/3dreport/REPORT/ThreeDimensionalGroundwaterFlowModelReportNov2007.pdf (last access: April 2019), 2007.
Bowen, G. J. and Revenaugh, J.: Interpolating the isotopic composition of modern meteoric precipitation, Water Resour. Res., 39, 1299–1311, https://doi.org/10.1029/2003WR002086, 2003.
Bresciani, E., Cranswick, R. H., Banks, E. W., Batlle-Aguilar, J., Cook, P. G., and Batelaan, O.: Using hydraulic head, chloride and electrical conductivity data to distinguish between mountain-front and mountain-block recharge to basin aquifers, Hydrol. Earth Syst. Sci., 22, 1629–1648, https://doi.org/10.5194/hess-22-1629-2018, 2018.
Canadell, J., Jackson, R. B., Ehleringer, J. R., Mooney, H. A., Sala, O. E., and Schulze, E. D.: Maximum rooting depth of vegetation types at the global scale, Oecologia, 108, 583–595, https://doi.org/10.1007/bf00329030, 1996.
Carling, G. T., Mayo, A. L., Tingey, D., and Bruthans, J.: Mechanisms, timing, and rates of arid region mountain front recharge, J. Hydrol., 428, 15–31, 2012.
Cartwright, I., Weaver, T. R., Stone, D., and Reid, M.: Constraining modern and historical recharge from bore hydrographs, 3H, 14C and chloride concentrations: Applications to dual-porosity aquifers in dryland salinity areas, Murray Basin, Australia, J. Hydrol., 332, 69–92, https://doi.org/10.1016/j.jhydrol.2006.06.034, 2007.
Cherry, J. A., McWorther, D. B., and Parker, B. L.: Site conceptual model for the migration and fate of contaminants in groundwater at the Santa Susana Field Laboratory, Simi, California (draft), in: Vols. 1–4, Association with the University of Guelph, Toronto, ON and MWH, Walnut Creek, CA, 2009.
Chin, D. A., Mazumdar, A., and Roy, P. K.: Water-resources engineering, Prentice Hall, Englewood Cliffs, 2000.
Cilona, A., Aydin, A., and Johnson, N.: Permeability of a fault zone crosscutting a sequence of sandstones and shales and its influence on hydraulic head distribution in the Chatsworth Formation, California, USA, Hydrogeol. J., 23, 405–419, https://doi.org/10.1007/s10040-014-1206-1, 2015.
Cilona, A., Aydin, A., Likerman, J., Parker, B., and Cherry, J.: Structural and statistical characterization of joints and multi-scale faults in an alternating sandstone and shale turbidite sequence at the Santa Susana Field Laboratory: Implications for their effects on groundwater flow and contaminant transport, J. Struct. Geol., 85, 95–114, https://doi.org/10.1016/j.jsg.2016.02.003, 2016.
CIMIS: Reference Evapotranspiration, Department of Land Arid and Water Resources, University of California, Davis and Water Efficiency Office, California Department of Water Resources, California Irrigation Management Unit, available at: https://cimis.water.ca.gov/Content/pdf/CimisRefEvapZones.pdf (last access: April 2019), 1999.
Clark, I.: Groundwater geochemistry and isotopes, CRC Press, available at: https://www.crcpress.com/Groundwater-Geochemistry-and-Isotopes/Clark/p/book/9781466591738 (last access: April 2019), 2015.
Coelho, V. H. R., Montenegro, S., Almeida, C. N., Silva, B. B., Oliveira, L. M., Gusmão, A. C. V., Freitas, E. S., and Montenegro, A. A.: Alluvial groundwater recharge estimation in semi-arid environment using remotely sensed data, J. Hydrol., 548, 1–15, 2017.
Cook, P. G. and Böhlke, J.-K.: Determining timescales for groundwater flow and solute transport, in: Environmental tracers in subsurface hydrology, Springer, 1–30, https://doi.org/10.1007/978-1-4615-4557-6_1, 2000.
Crosbie, R. S., McCallum, J. L., Walker, G. R., and Chiew, F. H.: Episodic recharge and climate change in the Murray-Darling Basin, Australia, Hydrogeol. J., 20, 245–261, 2012.
Crosbie, R. S., Davies, P., Harrington, N., and Lamontagne, S.: Ground truthing groundwater-recharge estimates derived from remotely sensed evapotranspiration: a case in South Australia, Hydrogeol. J., 23, 335–350, https://doi.org/10.1007/s10040-014-1200-7, 2015.
Crosbie, R. S., Peeters, L. J., Herron, N., McVicar, T. R., and Herr, A.: Estimating groundwater recharge and its associated uncertainty: Use of regression kriging and the chloride mass balance method, J. Hydrol., 561, 1063–1080, 2018.
Davis, F., Stoms, D., Hollander, A., Thomas, K., Stine, P., Odion, D., Borchert, M., Thorne, J., Gray, M., and Walker, R.: The California gap analysis project – final report, University of California, Santa Barbara, CA, 1998.
De Vries, J. J. and Simmers, I.: Groundwater recharge: an overview of processes and challenges, Hydrogeol. J., 10, 5–17, 2002.
Doherty, J.: PEST model-independent parameter estimation user manual, Watermark Numerical Computing, Brisbane, Australia, 3338, 3349, 2004.
Flint, A. L., Flint, L. E., Bodvarsson, G. S., Kwicklis, E. M., and Fabryka-Martin, J.: Evolution of the conceptual model of unsaturated zone hydrology at Yucca Mountain, Nevada, J. Hydrol., 247, 1–30, 2001.
Flint, L. E. and Flint, A. L.: Regional analysis of ground-water recharge, in: Ground-water recharge in the arid and semiarid southwestern United States, edited by: Stonestrom, D. A., Constantz, J., Ferre, T. P. A., and Leake, S. A., US Geological Survey Professional Paper 1703-B, 29–60, available at: http://pubs.usgs.gov/pp/pp1703/b/ (last access: April 2019), 2007.
Florea, L. J.: Selective recharge and isotopic composition of shallow groundwater within temperate, epigenic carbonate aquifers, Journal of hydrology, 489, 201-213, 2013.
Friedman, I., Smith, G. I., Gleason, J. D., Warden, A., and Harris, J. M.: Stable isotope composition of waters in southeastern California 1. Modern precipitation, J. Geophys. Res.-Atmos., 97, 5795–5812, 1992.
Gat, J. and Tzur, Y.: Modification of the isotopic composition of rainwater by processes which occur before groundwater recharge, in: Isotopes in Hydrology (Symposium Proceedings 1996), International Atomic Energy Agency, Vienna, 1967.
Gebru, T. A. and Tesfahunegn, G. B.: Chloride mass balance for estimation of groundwater recharge in a semi-arid catchment of northern Ethiopia, Hydrogeol. J., 27, 363–378, https://doi.org/10.1007/s10040-018-1845-8, 2018.
Heilweil, V. M., Solomon, D. K., and Gardner, P. M.: Borehole environmental tracers for evaluating net infiltration and recharge through desert bedrock, Vadose Zone J., 5, 98–120, 2006.
Hernández-Marín, M., Guerrero-Martínez, L., Zermeño-Villalobos, A., Rodríguez-González, L., Burbey, T. J., Pacheco-Martínez, J., Martínez-Martínez, S. I., and González-Cervantes, N.: Spatial and temporal variation of natural recharge in the semi-arid valley of Aguascalientes, Mexico, Hydrogeol. J., 26, 2811–2826, 2018.
Huang, Y., Chang, Q., and Li, Z.: Land use change impacts on the amount and quality of recharge water in the loess tablelands of China, Sci. Total Environ., 628, 443–452, 2018.
ITRC (Irrigation Training & Research Center): California Crop and Soil Evapotranspiration, ITRC Report No. R 03-001, Irrigation Training & Research Center, California Polytechnic State University, San Luis Obispo, California, USA, 65 pp., available at: http://www.itrc.org/reports/pdf/californiacrop.pdf (last access: April 2019), 2003.
Jebreen, H., Wohnlich, S., Wisotzky, F., Banning, A., Niedermayr, A., and Ghanem, M.: Recharge estimation in semi-arid karst catchments: Central West Bank, Palestine, Grundwasser, 23, 91–101, 2018.
Krabbenhoft, D. P., Bowser, C. J., Anderson, M. P., and Valley, J. W.: Estimating groundwater exchange with lakes: 1. The stable isotope mass balance method, Water Resour. Res., 26, 2445–2453, 1990.
Kristensen, K. and Jensen, S.: A model for estimating actual evapotranspiration from potential evapotranspiration, Hydrol. Res., 6, 170–188, 1975.
Kurtzman, D., Baram, S., and Dahan, O.: Soil–aquifer phenomena affecting groundwater under vertisols: a review, Hydrol. Earth Syst. Sci., 20, 1–12, https://doi.org/10.5194/hess-20-1-2016, 2016.
Levy, Y., Shapira, R. H., Chefetz, B., and Kurtzman, D.: Modeling nitrate from land surface to wells' perforations under agricultural land: success, failure, and future scenarios in a Mediterranean case study, Hydrol. Earth Syst. Sci., 21, 3811–3825, https://doi.org/10.5194/hess-21-3811-2017, 2017.
Li, Z., Chen, X., Liu, W., and Si, B.: Determination of groundwater recharge mechanism in the deep loessial unsaturated zone by environmental tracers, Sci. Total Environ., 586, 827–835, 2017.
Link, M. H., Squires, R. L., and Colburn, I. P.: Slope and deep-sea fan facies and paleogeography of Upper Cretaceous Chatsworth Formation, Simi Hills, California, AAPG Bull., 68, 850–873, 1984.
Liu, H.-L., Chen, X., Bao, A.-M., and Wang, L.: Investigation of groundwater response to overland flow and topography using a coupled MIKE SHE/MIKE 11 modeling system for an arid watershed, J. Hydrol., 347, 448–459, 2007.
Ma, L., He, C., Bian, H., and Sheng, L.: MIKE SHE modeling of ecohydrological processes: Merits, applications, and challenges, Ecol. Eng., 96, 137–149, 2016.
Manna, F., Cherry, J. A., McWhorter, D. B., and Parker, B. L.: Groundwater recharge assessment in an upland sandstone aquifer of southern California, J. Hydrol., 541, 787–799, https://doi.org/10.1016/j.jhydrol.2016.07.039, 2016.
Manna, F., Walton, K. M., Cherry, J. A., and Parker, B. L.: Mechanisms of recharge in a fractured porous rock aquifer in a semi-arid region, J. Hydrol., 555, 869–880, https://doi.org/10.1016/J.Jhydrol.2017.10.060, 2017.
Manning, A. H. and Solomon, D. K.: Using noble gases to investigate mountain-front recharge, J. Hydrol., 275, 194–207, 2003.
MWH: Draft-site wide groundwater remedial investigation report Santa Susana Field Laboratory, Ventura County, California, Prepared for The Boeing Company, NASA and US DOE by MWH Global Inc., Walnut Creek, CA, 2009.
MWH: Hydrogeological Characterization of Faults, Santa Susana Field Laboratory, Ventura County, Ca, prepared for The Boeing Company by Dr. Nicholas M. Johnson, MWH Americas Inc., Walnut Creek, CA, 2016.
Nasta, P., Adane, Z., Lock, N., Houston, A., and Gates, J. B.: Links between episodic groundwater recharge rates and rainfall events classified according to stratiform-convective storm scoring: A plot-scale study in eastern Nebraska, Agr. Forest Meteorol., 259, 154–161, 2018.
Pierce, A. A., Chapman, S. W., Zimmerman, L. K., Hurley, J. C., Aravena, R., Cherry, J. A., and Parker, B. L.: DFN-M field characterization of sandstone for a process-based site conceptual model and numerical simulations of TCE transport with degradation, J. Contam. Hydrol., 212, 96–114, 2018a.
Pierce, A. A., Parker, B. L., Ingleton, R., and Cherry, J. A.: Novel Well Completions in Small Diameter Coreholes Created Using Portable Rock Drills, Groundwater Monit. Remediat., 38, 42–55, 2018b.
Quinn, P. M., Cherry, J. A., and Parker, B. L.: Combined use of straddle packer testing and FLUTe profiling for hydraulic testing in fractured rock boreholes, J. Hydrol., 524, 439–454, 2015.
Quinn, P. M., Cherry, J. A., and Parker, B. L.: Depth-discrete specific storage in fractured sedimentary rock using steady-state and transient single-hole hydraulic tests, J. Hydrol., 542, 756–771, 2016.
Refsgaard, C.: Mike she, Computer models of catchment hydrology, in: Computer Models of Watershed Hydrology, edited by: Singh, V. P., Water Resources Publications, 809–846, 1995.
Richards, L. A.: Capillary conduction of liquids through porous mediums, Physics, 1, 318–333, 1931.
Scanlon, B. R.: Uncertainties in estimating water fluxes and residence times using environmental tracers in an arid unsaturated zone, Water Resour. Res., 36, 395–409, 2000.
Scanlon, B. R., Keese, K. E., Flint, A. L., Flint, L. E., Gaye, C. B., Edmunds, W. M., and Simmers, I.: Global synthesis of groundwater recharge in semiarid and arid regions, Hydrol. Process., 20, 3335–3370, 2006.
Scanlon, B. R., Reedy, R. C., and Tachovsky, J. A.: Semiarid unsaturated zone chloride profiles: Archives of past land use change impacts on water resources in the southern High Plains, United States, Water Resour. Res., 43, W06423, https://doi.org/10.1029/2006WR005769, 2007.
Scurlock, J., Asner, G., and Gower, S.: Worldwide historical estimates of leaf area index, 1932–2000, ORNL/TM-2001/268, 34 pp., available at: https://info.ornl.gov/sites/publications/Files/Pub57077.pdf (last access: April 2019), 2001.
Smerdon, B., Allen, D., Grasby, S., and Berg, M.: An approach for predicting groundwater recharge in mountainous watersheds, J. Hydrol., 365, 156–172, 2009.
Sterling, S., Parker, B., Cherry, J., Williams, J., Lane Jr., J., and Haeni, F.: Vertical cross contamination of trichloroethylene in a borehole in fractured sandstone, Groundwater, 43, 557–573, 2005.
Sukhija, B., Reddy, D., Nagabhushanam, P., and Hussain, S.: Recharge processes: piston flow vs preferential flow in semi-arid aquifers of India, Hydrogeol. J., 11, 387–395, 2003.
Taylor, R. G., Todd, M. C., Kongola, L., Maurice, L., Nahozya, E., Sanga, H., and MacDonald, A. M.: Evidence of the dependence of groundwater resources on extreme rainfall in East Africa, Nat. Clim. Change, 3, 374–378, 2013.
Turkeltaub, T., Kurtzman, D., Russak, E., and Dahan, O.: Impact of switching crop type on water and solute fluxes in deep vadose zone, Water Resour. Res., 51, 9828–9842, 2015.
Van Genuchten, M. T.: A closed-form equation for predicting the hydraulic conductivity of unsaturated soils, Soil Sci. Soc. Am. J., 44, 892–898, 1980.
Wang, H., Kgotlhang, L., and Kinzelbach, W.: Using remote sensing data to model groundwater recharge potential in Kanye region, Botswana, in: 21st ISPRS (International Archives of the Photogrammetry, Remote Sensing and Spatial Information Sciences) Conference, Vol. XXXVII, Part B8, 751–756, 2008.
Wheater, H., Sorooshian, S., and Sharma, K. D.: Hydrological modelling in arid and semi-arid areas, Cambridge University Press, Cambridge, 2007.
Wilson, J. L. and Guan, H.: Mountain-block hydrology and mountain-front recharge, Groundwater recharge in a desert environment: The Southwestern United States, in: Groundwater Recharge in a Desert Environment: The Southwestern United States, edited by: Hogan, J. F., Phillips, F. M., and Scanlon, B. R., 113–137, https://doi.org/10.1029/009WSA08, 2004.
Wood, W. W. and Sanford, W. E.: Chemical and isotopic methods for quantifying ground-water recharge in a regional, semiarid environment, Groundwater, 33, 458–468, 1995.
Xie, Y., Cook, P. G., Simmons, C. T., Partington, D., Crosbie, R., and Batelaan, O.: Uncertainty of groundwater recharge estimated from a water and energy balance model, J. Hydrol., 561, 1081–1093, 2018.


