the Creative Commons Attribution 4.0 License.
the Creative Commons Attribution 4.0 License.
 | 15 Jan 2019
Impact of climate model resolution on soil moisture projections in central-western Europe
Reindert J. Haarsma
Gerard van der Schrier
Global climate models project widespread decreases in soil moisture over large parts of Europe. This paper investigates the impact of model resolution on the magnitude and seasonality of future soil drying in central-western Europe. We use the general circulation model EC-Earth to study two 30-year periods representative of the start and end of the 21st century under low-to-moderate greenhouse gas forcing (RCP4.5). In our study area, central-western Europe, at high spatial resolution (∼25 km) soil drying is more severe and starts earlier in the season than at standard resolution (∼112 km). Here, changes in the large-scale atmospheric circulation and local soil moisture feedbacks lead to enhanced evapotranspiration in spring and reduced precipitation in summer. A more realistic position of the storm track at high model resolution leads to reduced biases in precipitation and temperature in the present-day climatology, which act to amplify future changes in evapotranspiration in spring. Furthermore, in the high-resolution model a stronger anticyclonic anomaly over the British Isles extends over central-western Europe and supports soil drying. The resulting drier future land induces stronger soil moisture feedbacks that amplify drying conditions in summer. In addition, soil-moisture-limited evapotranspiration in summer promotes sensible heating of the boundary layer, which leads to a lower relative humidity with less cloudy conditions, an increase in dry summer days, and more incoming solar radiation. As a result a series of consecutive hot and dry summers appears in the future high-resolution climate. The enhanced drying at high spatial resolution suggests that future projections of central-western European soil drying by CMIP5 models have been potentially underestimated. Whether these results are robust has to be tested with other global climate models with similar high spatial resolutions.
- Article
(3543 KB) - Full-text XML
- BibTeX
- EndNote


Global climate models project that global aridity over land will increase in response to anthropogenic climate warming (Feng and Fu, 2013; Huang et al., 2016; Scheff and Frierson, 2015). Nevertheless, there remains considerable uncertainty concerning regional trends in soil moisture (Greve and Seneviratne, 2015; Greve et al., 2017). Soil drying is a result of complex interactions between the land surface and the atmosphere (Hirschi et al., 2011; Seneviratne et al., 2006, 2010). Anthropogenic climate change expectedly enhances global mean evaporation and precipitation due to the larger moisture demand of the atmosphere with higher air temperatures (Feng and Fu, 2013; Scheff and Frierson, 2014). However, the net impact of these increases on land aridity and droughts remains difficult to predict (Sherwood and Fu, 2014). Projections of soil moisture in Europe for the 21st century indicate pronounced soil drying and an associated increase in drought area and intensity, but these changes are strongly dependent on season and location (Ruosteenoja et al., 2018; Samaniego et al., 2018). Regionally, future changes in evaporation over land will depend on the local soil moisture content and surface characteristics, but also on changes in available energy, wind speed, air temperature, and air humidity. At the same time, changes in precipitation are spatially variable between different future projections, leading to enhanced uncertainty at regional spatial scales (Kumar et al., 2013). How these processes will change under climate warming in individual regions is highly uncertain, whereas reliable regional information is essential for adaptation planning.
A frequently used approach to study land aridity or droughts is to use off-line computed indices, for example, the aridity index (the ratio of potential evaporation to precipitation) or the prominently used Palmer drought severity index (PDSI) (Palmer, 1965). However, recent studies show that these metrics often overestimate future increases in drought and decreases in water availability (Milly and Dunne, 2016; Roderick et al., 2015; Swann et al., 2016). Swann et al. (2016) and Berg et al. (2017) argue that projections of future aridity should therefore be based on direct output of the simulated land water balance (precipitation, evapotranspiration, runoff, and soil moisture) rather than on off-line aridity metrics.
Various studies have used direct model output to assess future changes in aridity. Studying a wide range of climate states, Greve et al. (2017) and Scheff et al. (2017) conclude that future projections depend largely on the physical quantity that is used as a measure of aridity. Climate model simulations of the Coupled Model Intercomparison Project (CMIP5) (Taylor et al., 2012) project a decline in the upper 10 cm soil moisture content over most of Europe (Zhao and Dai, 2015). However, Berg et al. (2017) state that soil moisture changes near the surface are more negative than total column soil moisture changes and can even be of opposite sign in middle- and high-latitude regions. Using the same suite of models but including the entire soil moisture profile in their analyses, Orlowsky and Seneviratne (2013) indicate a large inter-model spread over central-western Europe, with drought projections ranging from pronounced drying to wetting conditions. Therefore the vertical distribution of drying should be taken into account when studying future soil drying and water availability. Focusing on seasonality of soil drying, Ruosteenoja et al. (2018) show that summer and autumn exhibit strong drying trends in central and western Europe, while all-season drying occurs in southern Europe. This emphasises the necessity to study seasonal instead of annual mean values for future drying.
Orlowsky and Seneviratne (2013) indicate that by the end of the 21st century, model formulation of global climate models (GCMs) will become the dominant source of spread in drought projections, especially for soil moisture drought and at the regional scale. This suggests that improvements in GCMs could considerably reduce the inter-model spread in future soil moisture projections. Several studies have shown that high-resolution (∼25 km horizontal resolution) GCMs mimic the present-day climate state more realistically than standard-resolution models, since they resolve physical processes more explicitly (Delworth et al., 2012; Jung et al., 2012). Therefore, high-resolution simulations are generally expected to be more reliable in their representation of future climatic changes. For example, post-tropical cyclones and mid-latitude storm tracks that bring precipitation towards Europe could change their path in a future climate and are dependent on model resolution (Baatsen et al., 2015; Willison et al., 2015). Furthermore, atmospheric blocking frequencies (Berckmans et al., 2013; Jung et al., 2012) and atmospheric moisture transport from the ocean to the continents (Demory et al., 2014) are better represented at finer model resolution. Also, local-scale land-surface–atmosphere feedbacks related to soil moisture are arguably dependent on model resolution (Lorenz et al., 2016). Using high-resolution simulations could thus improve our physical understanding and provide potentially better estimates of future changes in soil drying. This will lead to enhanced confidence in future soil moisture projections at a regional level.
Motivated by these studies, this paper investigates for central-western Europe the consequences of climate warming for the regional hydrology with a high-resolution global climate model. To investigate the role of resolution we have repeated the experiment and analyses at standard CMIP5 resolution for the same climate model. The use of a single high-resolution model allows us to put emphasis on mechanistic explanations for the differences in regional hydrological changes between model resolutions. We assess the role of local feedbacks and the large-scale circulation on the response of regional soil moisture storage to climate warming. The study area in central-western Europe comprises a relatively small region and is therefore riddled with large inter-model differences in future hydrological projections. While most studies focus on annual mean changes, our analysis focusses on warm-season months (April–September). Furthermore, we will analyse changes in the total soil moisture column, which are most relevant for water availability and have been shown to exhibit large inter-model uncertainty in future drying over central-western Europe in standard-resolution GCMs (Berg et al., 2017; Orlowsky and Seneviratne, 2013).
The present paper is outlined as follows. Section 2 presents the data, methods, and a validation of the present-day climate. Section 3 describes the simulated soil drying characteristics, including climate- and resolution-induced changes in its spatial distribution and seasonal cycle. The drivers of central-western European soil drying and resolution-induced differences are presented in Sect. 4. Here, the land surface water balance components and their interaction with the surface energy balance are examined in detail. Also, the effect of changes in the large-scale atmospheric circulation is studied. Thereafter, Sect. 5 briefly describes climatic impacts that are closely related to soil drying, including soil moisture droughts, warm extremes, and dry days. Finally, Sect. 6 contains a summary and conclusions.
2.1 Model and experimental setup
This study is based on high-resolution climate model simulations that were also used in previous studies to assess the impact of high resolution on several climatic processes (Baatsen et al., 2015; Haarsma et al., 2013). The simulations were carried out using the EC-Earth V2.3 model (Hazeleger et al., 2012) at a resolution of T799L91 (∼25 km horizontal resolution, 91 vertical levels), which was the operational resolution at the European Centre for Medium-Range Weather Forecasts (ECMWF) from February 2006 until January 2010. Different model runs were performed for the present-day (2002–2006, final years of historical CMIP5 run) and future (2094–2098) climate. Each of these datasets consists of a 6-member ensemble spanning 5 years with perturbed initial conditions, resulting in a 30-year dataset for each climate state. In the present-day simulations, observed greenhouse gas and aerosol concentrations were applied, while future concentrations were derived from the RCP4.5 scenario (Van Vuuren et al., 2011). Sea surface temperatures were imposed using daily data at 0.25∘ horizontal resolution from NASA (Reynolds et al., 2007) for the 2002–2006 period. The sea surface temperatures for the future were calculated by adding the projected ensemble mean change using the 17 members of the coupled climate model ECHAM5/MPI-OM in the ESSENCE project (Sterl et al., 2008) under the SRES A1B emission scenario (Nakicenovic, 2000). This scenario is compatible with the RCP4.5 scenario but the median global temperature increase by the end of the 21st century is about 1 ∘C smaller (Rogelj et al., 2012). Further details on model setup and spin-up procedures can be found in Haarsma et al. (2013) and Baatsen et al. (2015). The simulations were repeated at the standard CMIP5 resolution of T159L62 (∼112 km horizontal resolution, 62 vertical levels) for the same climate model configuration. The generated data have been stored on five pressure levels (850, 700, 500, 300, and 200 hPa) at 6-hourly intervals, while surface fields have been saved on a 3-hourly basis.
2.2 Land surface scheme
The land surface scheme plays a central role in simulating soil moisture changes. The land surface scheme used in EC-Earth is HTESSEL (Balsamo et al., 2009). Up to six tiles are present over land (i.e. bare ground, low and high vegetation, intercepted water, and shaded and exposed snow) and two over water (i.e. open and frozen water), with separate energy and water balances. Considering the water balance, precipitation is initially collected in the interception reservoir until it is saturated. Then, excess precipitation is partitioned between surface runoff and infiltration into the soil column. The ratio of runoff to precipitation depends on the terrain complexity represented in the grid cell as well as on the soil texture and soil moisture content. The vertical discretization of the land surface scheme considers a four-layer soil that can be covered by a single layer of snow. The depths of the soil layers are in an approximate geometric relation (0.07 m for the top layer and then 0.21, 0.72, and 1.89 m for the layers underneath). HTESSEL does not include river routing. Instead, runoff is collected in pre-defined river basins and distributed instantaneously into ocean points near the outlets of major rivers, without considering delayed river transport. At both model resolutions all soil and vegetation characteristics of HTESSEL are kept constant. An evaluation of HTESSEL in the Transdanubian region in Hungary by Wipfler et al. (2011) reveals that HTESSEL slightly underpredicts the seasonal evaporative fraction compared to satellite estimates. The underestimation is most prominent for low evaporative fractions with a maximum prediction error of 30 % for individual grid cells.
2.3 Observations and validation
To gain some confidence in the model performance we have validated the present-day climate over central-western Europe. This is done for simulated present-day precipitation and near-surface air temperature. The latter is used instead of evapotranspiration since observations of evapotranspiration are scarce and air temperature mainly determines the evaporative demand of the atmosphere. For the validation we have used the observational E-OBS gridded dataset (0.5∘ horizontal resolution; version 11.0) for precipitation and 2 m temperature. The E-OBS data originated from the EU-FP6 project ENSEMBLES (Haylock et al., 2008) and is now maintained and updated by the data providers in the ECA&D project. The dataset is based on meteorological station measurements and is designed to provide the best estimate of grid box averages to enable direct comparison with climate models. The period used to compare the observational E-OBS data against EC-Earth simulations is 1982–2011. This period covers 30 years to make a robust comparison of the climatology.
Figure 1a and b show the annual cycle of precipitation and near-surface air temperature over the analysis domain (the black box in Fig. 2) for E-OBS observations and the EC-Earth model simulations at high and standard resolution. Precipitation biases of present-day climate simulations show that it is too wet over the study region (Fig. 1c). As discussed in Van Haren et al. (2015b) this is due to a too-zonal position of the storm track over the east Atlantic Ocean and western Europe. This is a common bias in CMIP3 and CMIP5 models (Haarsma et al., 2013; Van Ulden et al., 2007). The wet bias is reduced in the high-resolution version of EC-Earth primarily due to a less zonal orientation of the storm track (Van Haren et al., 2015b).
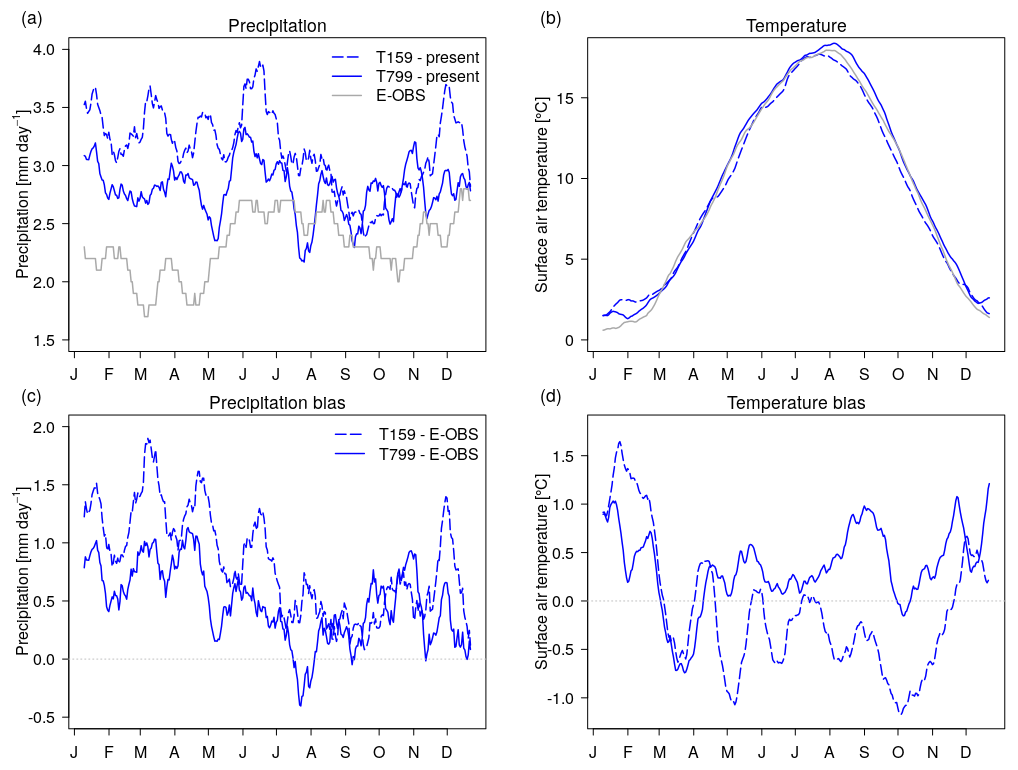
Figure 1Annual cycle of observed (grey) and simulated (blue) (a) precipitation and (b) daily mean near-surface air temperature at T159 (dashed) and T799 (solid) resolution for the present-day climate. Annual cycle of biases of (c) precipitation and (d) daily mean near-surface air temperature with respect to observations. Values are smoothed with a 20-day running mean filter and averaged over central-western Europe. The letters on the horizontal axis correspond with the first day of each month (based on a year with 365 days).
Surface air temperature biases show that the T159 version is a bit too cold compared to observations (Fig. 1d), whereas T799 is somewhat warmer, especially in summer. The warmer temperature is associated with the less zonal orientation of the storm track which makes the summer climate less maritime and more continental. The high-resolution simulations thus perform better with respect to the E-OBS precipitation and temperature data than the standard-resolution model. We shall see later that this contributes to enhanced future drying at high resolution.

Figure 2Top: soil moisture content (m) climate change signal (future–present) in Europe for (a) spring and (b) summer in the high-resolution model. Bottom: (c–d) same but for difference in climate change signal between the high- and standard-resolution model.
2.4 Definitions
Throughout this paper we quantify the intensity of soil drying by the soil moisture anomaly (S′). To compute this aridity metric, first the soil moisture content (S) is computed from integrating volumetric soil moisture content (θ) over the total soil profile in the land surface scheme:
For comparison of soil moisture in the present and future climates, the present climatology of soil moisture content averaged over all ensemble members (S0) is used to compute soil moisture anomalies in both the current and future climate. For each ensemble member and year, anomalies of soil moisture content (S′) are computed for each grid point by subtracting S0 from the simulated soil moisture content:
Threshold values for soil moisture droughts are based on distributions of monthly-mean soil moisture anomalies for the present climate consisting of 30 years of data. They are computed per month, considering each individual year as independent. Seasonal threshold values are based on three-monthly averages. For each grid cell, droughts are classified to be 6∕30 year events, corresponding to the 20th percentile of the S′ distribution. As a result, by definition, for the current climate each land surface grid cell is in drought for each individual month for 20 % of the sampling years.
Drought frequency (f) is defined as the percentage of months with soil moisture anomalies below the drought threshold value. To measure the impact of resolution on the frequency of future droughts we define the resolution factor (RF). RF is defined as the ratio of frequency of droughts in T799 (fT799) to T159 (fT159):
Also computed is the corrected resolution factor (CRF) to correct for differences in the present-day climate between T159 and T799. CRF is defined similarly to RF but uses the threshold values of the T159 present-day climate to compute the frequency of future droughts at T799 resolution. If CRF and RF are significantly different, this means that differences in the present-day soil moisture climatology could partly explain differences in the frequency of projected droughts.
3.1 Horizontal distribution and analysis domain
Spring (April–June) and summertime (July–September) maps of future soil moisture anomalies for the high-resolution model are shown in Fig. 2a and b, respectively. These seasonal definitions are slightly different from the common definition and chosen to focus on relevant physical processes that will be discussed later in this paper. Differences in the climate change signal between the high- and standard-resolution simulations are also depicted (Fig. 2c–d). Both model resolutions simulate strong increases in future spring- and summertime drying over large parts of the Mediterranean, especially in southeastern Europe. This broad change pattern in EC-Earth is similar to other CMIP5 model simulations (Zhao and Dai, 2015). Furthermore, in the high-resolution model a new drought-prone area emerges that is located over central-western Europe, roughly coinciding with the area stretching from southwestern Germany into Poland and the northern Balkans. This region experiences more severe drying in future in the high resolution than in the standard-resolution simulations. Model resolution seemingly plays an important role for projections of future soil drying over central-western Europe.
This partly motivates our choice for the study region in central-western Europe, defined as the area between 47 and 52∘ N and between 5 and 10∘ E (black box in Fig. 2), which roughly encompasses the Rhine–Meuse drainage basin and partly overlaps with the region studied by Van Haren et al. (2015a). The choice for this region is further motivated by the importance of this area for the fresh water supply to the Netherlands and Belgium, which are situated in the lower part of the Rhine–Meuse delta. Consumable water, shipping, irrigation, and cooling of power plants all depend on sufficient water supply from the Rhine–Meuse basin and could be affected by water depletion.
3.2 Seasonal cycle and vertical distribution
Soil moisture content over central-western Europe exhibits a large annual cycle and reaches its minimum value in September (Fig. 3a). Note that these values depend on the soil depth of the land surface scheme, and therefore are model dependent. For the present-day (baseline) climates, there are no significant resolution-dependent differences in monthly soil moisture content values, except for March. The projected changes in soil moisture content are, however, strongly season and resolution dependent. At both resolutions, the amplitude of the annual cycle is larger in the future climate than in the present-day climate due to drier soils around the annual soil moisture minimum.
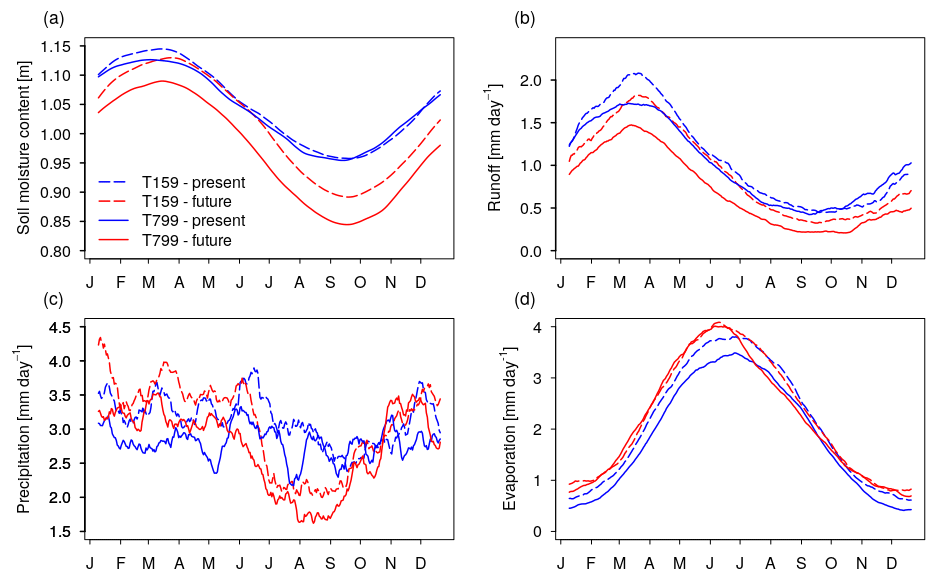
Figure 3Annual cycle of (a) soil moisture content, (b) runoff, (c) precipitation, and (d) actual evapotranspiration. Values are smoothed with a 20-day running mean filter and averaged over central-western Europe. The letters on the horizontal axis correspond with the first day of each month (based on a year with 365 days).
Figure 4 depicts monthly volumetric soil moisture anomalies over the four soil layers of HTESSEL under 2100 conditions, with respect to the current climate. At standard resolution, future soil moisture reduction is mainly confined to late summer and autumn. An almost full recovery of soil moisture occurs in late winter for top soil layers, and in late spring for deeper layers. On the other hand, high-resolution simulations exhibit year-round soil moisture depletions compared to the climate at the start of the 21st century. At high resolution, the soil moisture content over the top three soil layers of HTESSEL is restored to its former state in late winter, but the soil in the fourth layer remains drier than current values, suggesting a year-round reduction in ground water. The reduced soil moisture is compatible with lower year-round runoff values (Fig. 3b).

Figure 4Profile of future volumetric soil moisture monthly changes (θ′) under 2100 conditions with respect to the present-day climatology over central-western Europe for standard and high spatial resolution.
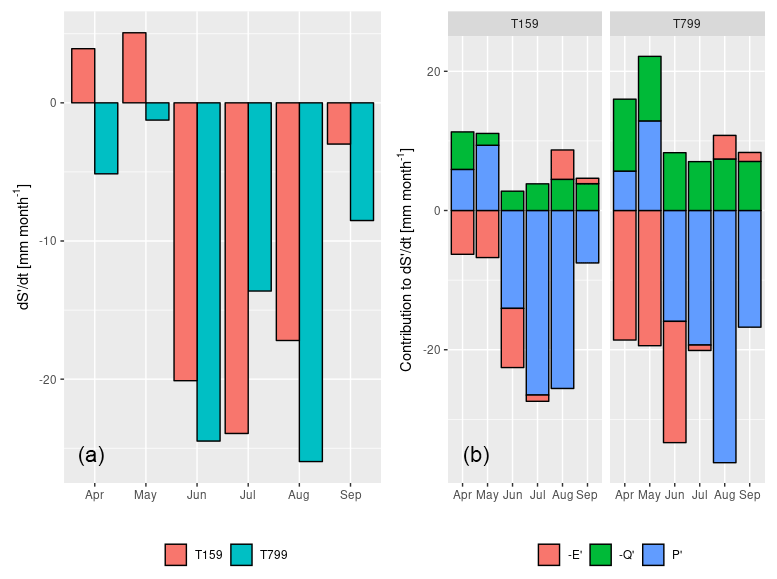
Figure 5(a) Monthly changes in soil moisture storage (future − present) under future global warming for (pink) T159 and (cyan) T799. Negative is drying, positive is moistening. (b) Contribution of water balance fluxes (P′, Q′, and E′) to changes of soil moisture storage in the future for T159 (left side of b) and T799 (right side of b). The changes in the water balance fluxes combine to d dt. Negative values indicate contributions to drying, positive values indicate soil moistening.
As a result, in late spring (April–June), future soil moisture content (Fig. 3a) differs significantly from present-day values at high model resolution ( mm) whereas there is no significant change at standard model resolution ( mm). At the start of summer, the soil is thus preconditioned towards drier conditions in T799 than in T159. Furthermore, future late summer (July–September) soil moisture depletion is on average more severe in T799 ( mm) than in T159 ( mm) (Welch t test: p=0.01). The more severe soil dessication in late spring at high resolution is thus maintained throughout the late summer months. In the rest of the paper we therefore focus on the modelled differences in late spring (preconditioning phase) and late summer (maintenance phase). For brevity, from now on we will refer to “spring” for the period April to June and “summer” for the period July to September.
Under similar soil and vegetation properties, changes in soil moisture content depend largely on precipitation and the evaporative demand of the atmosphere. We study mean changes in the land surface water balance in Sect. 4.1, which includes precipitation and evapotranspiration as important factors. The water balance provides more information on the drivers of soil drying. In the last two subsections, the focus is on mechanistic explanations for mean changes in the land surface water balance. These explanations are separately discussed for spring in Sect. 4.2 and summer in Sect. 4.3. The discussion includes local feedback mechanisms as well as large-scale processes.
4.1 Land surface water balance
The land surface water balance gives more information on the drivers of soil moisture changes:
Here, soil moisture storage (dS∕ dt) is the change in soil moisture content over time, P is precipitation, E is evapotranspiration, and Q is runoff. Since we focus on the warm season months and choose our study region outside mountainous regions, ice and snow can be neglected in the land surface water balance. To study climate-induced changes in more detail, the land surface water balance can also be written in terms of mean future changes, linking future changes in storage (d dt) to changes in water fluxes (P′, E′, Q′). Figure 5 shows on the left the average future changes in soil moisture storage compared to the current climate from April to September. On the right the contributions of P′, E′, and Q′ to the changes in d dt are depicted.
For both model resolutions, the changes in evapotranspiration and precipitation clearly show that climate change induces enhanced evapotranspiration in spring and reduced precipitation from June to September. Throughout the entire warm season, this results in decreases in runoff, leading to reduced availability of water resources downstream. At the same time, the decreases in runoff prevent the soil from further desiccation (Fig. 5).
In the following subsections, we focus on spring and summer averages for mechanistic explanations of the simulated changes in the surface water balance. Individual months are discussed if it adds relevant information to the analyses.
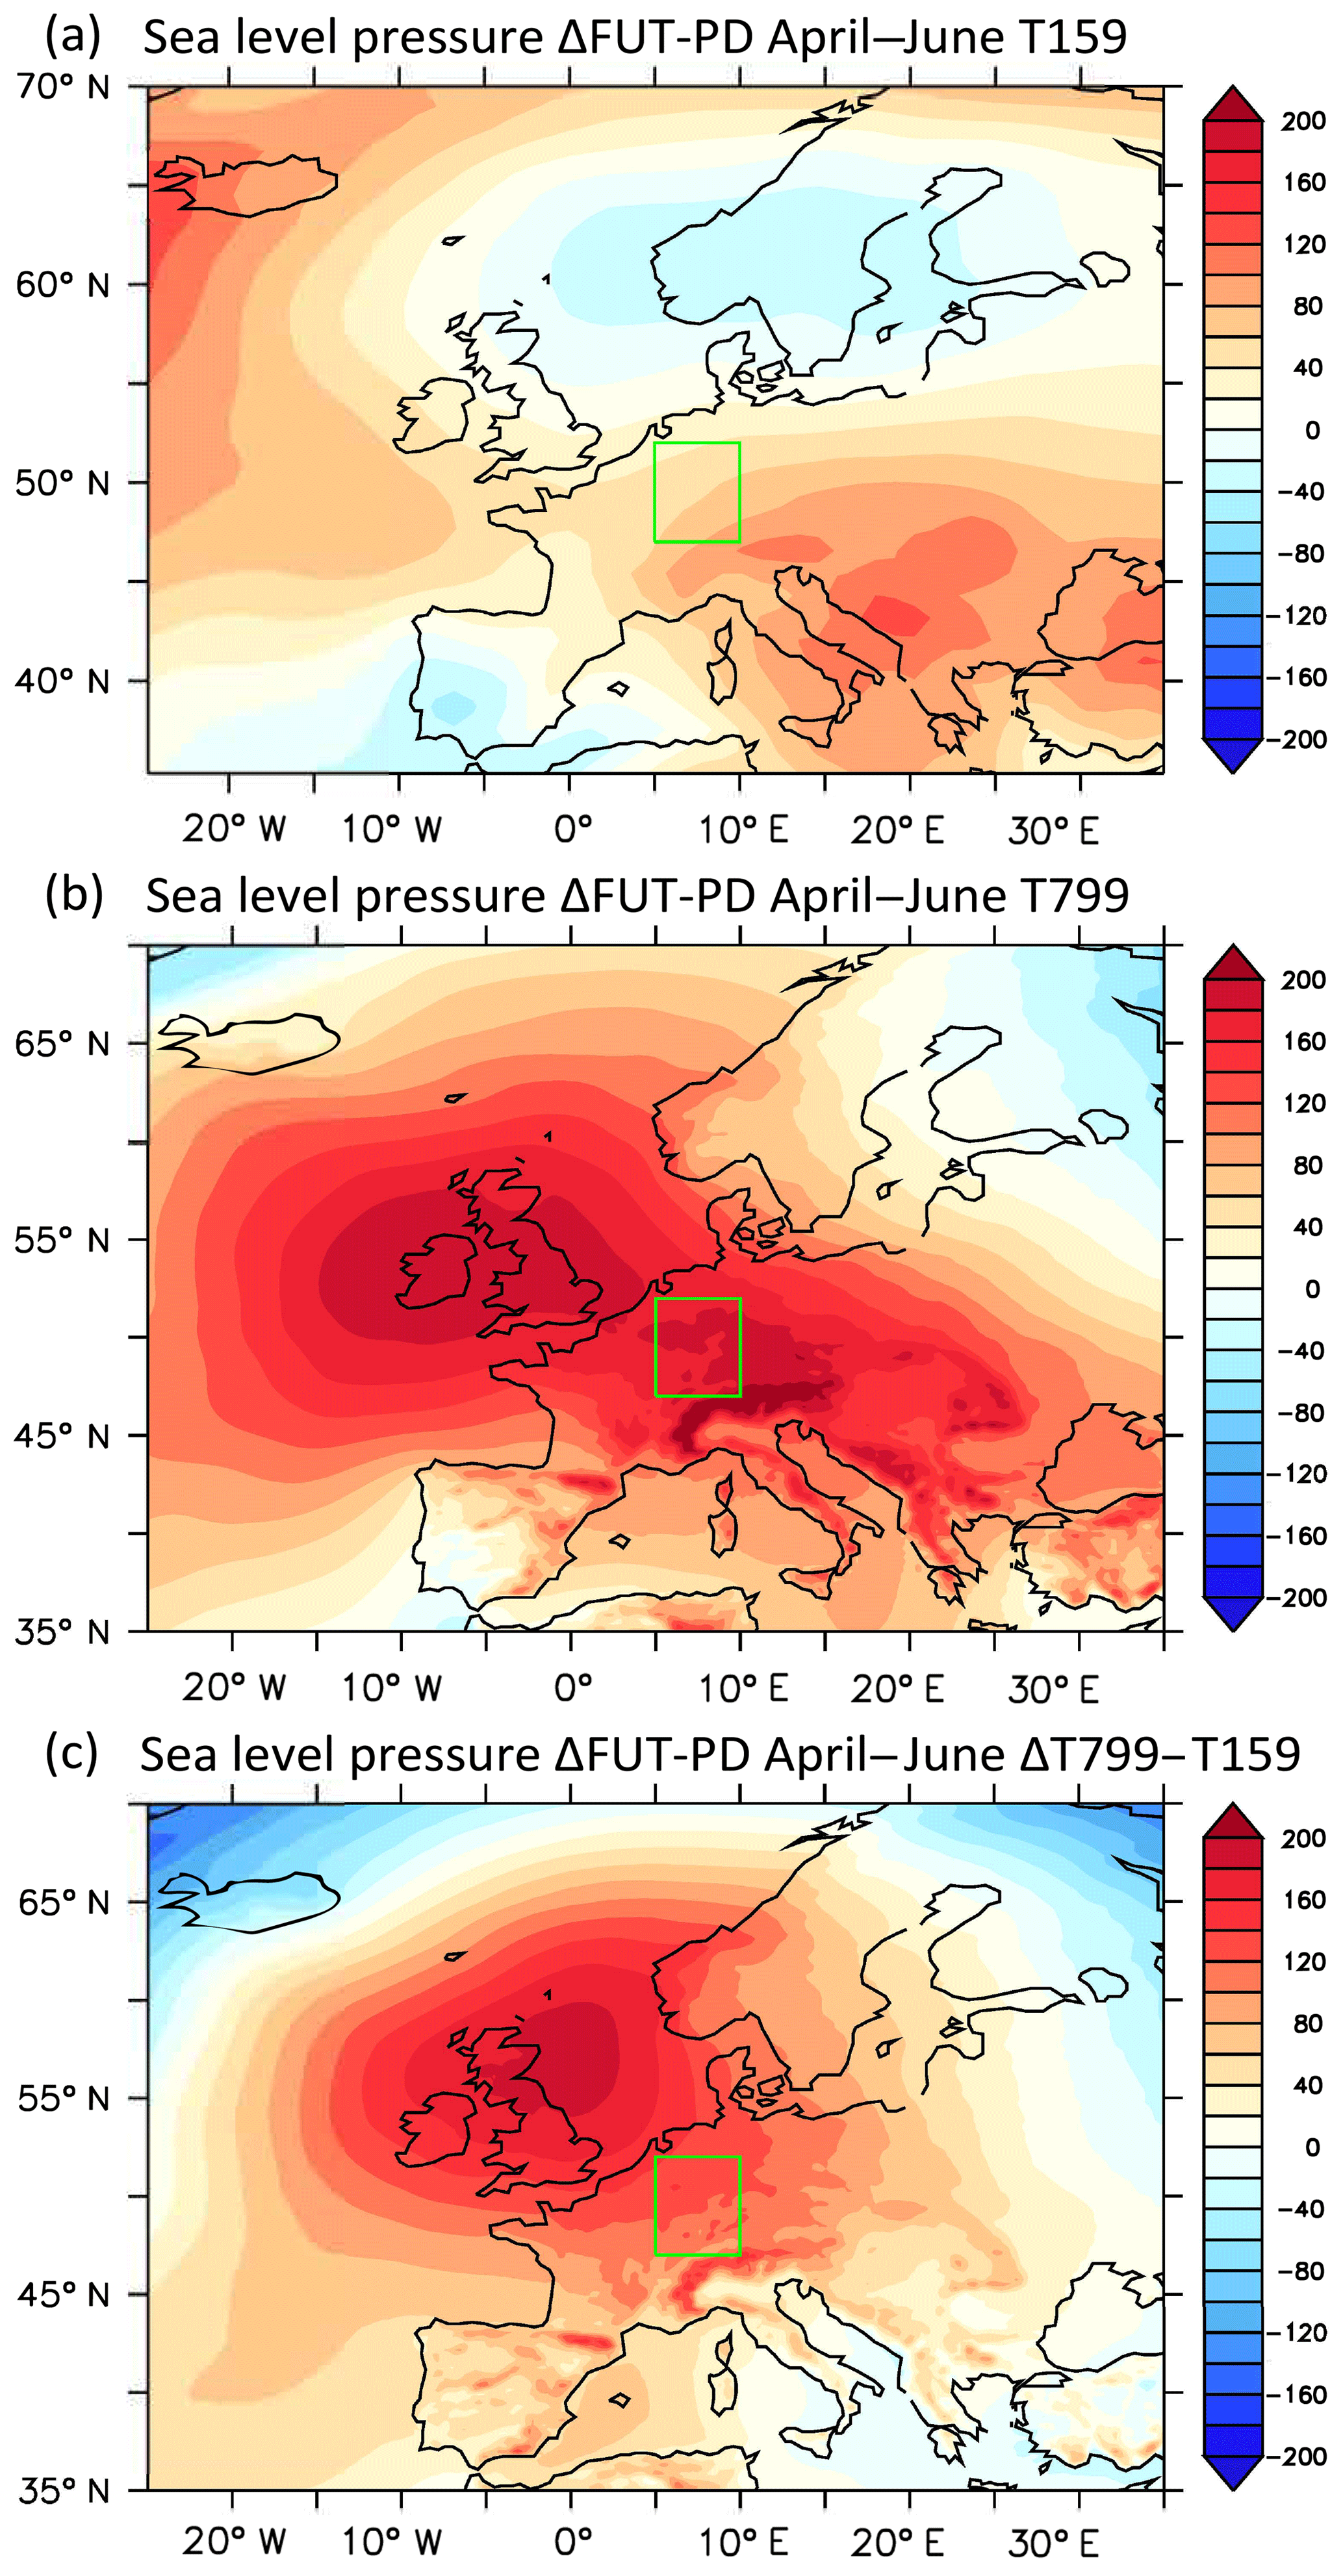
Figure 6Sea level pressure (Pa) climate change signal (future–present) for spring in the (a) standard- and (b) high-resolution model. (c) Same but for difference in climate change signal between the high- and standard-resolution model.
4.2 Spring evapotranspiration increase
The largest resolution-induced differences in soil drying occur in spring (Fig. 5). Averaged over spring months, drying is larger in T799 (d d mm month−1) than in T159 (d d mm month−1). Compared to the present, the future shows an intensification of the hydrological cycle, with enhanced evapotranspiration from April to June and enhanced precipitation in April and May (Fig. 5). At both model resolutions, evapotranspiration increase is the dominant contributor to spring soil drying (Fig. 5). This increase is stronger in T799 ( mm month−1) than in T159 ( mm month−1). Contributions of average springtime precipitation to drying are negligible since rainfall increases in April and May are compensated by a rainfall reduction in June. Furthermore, runoff plays an essential role in the soil moisture changes since there is close interaction between these two variables. Both model resolutions simulate reduced future runoff, indicating that less water flows away from the study region (positive value of d dt). In turn, the reduction in runoff is related to the soil moisture content, which partly determines the infiltration of water into the soil and therefore the ratio of surface runoff to precipitation. Reduced runoff thus acts as a negative feedback on soil drying in central-western Europe (Fig. 5), an effect which is stronger at high model resolution. This relatively local “moistening” effect (positive value of d dt) of reduced runoff does not fully compensate for the strong drying effect of enhanced evapotranspiration in T799. The net result is stronger spring drying in central-western Europe at high model resolution. In the remainder of this subsection, we focus on the dominant contributor to future spring drying, which is evapotranspiration.
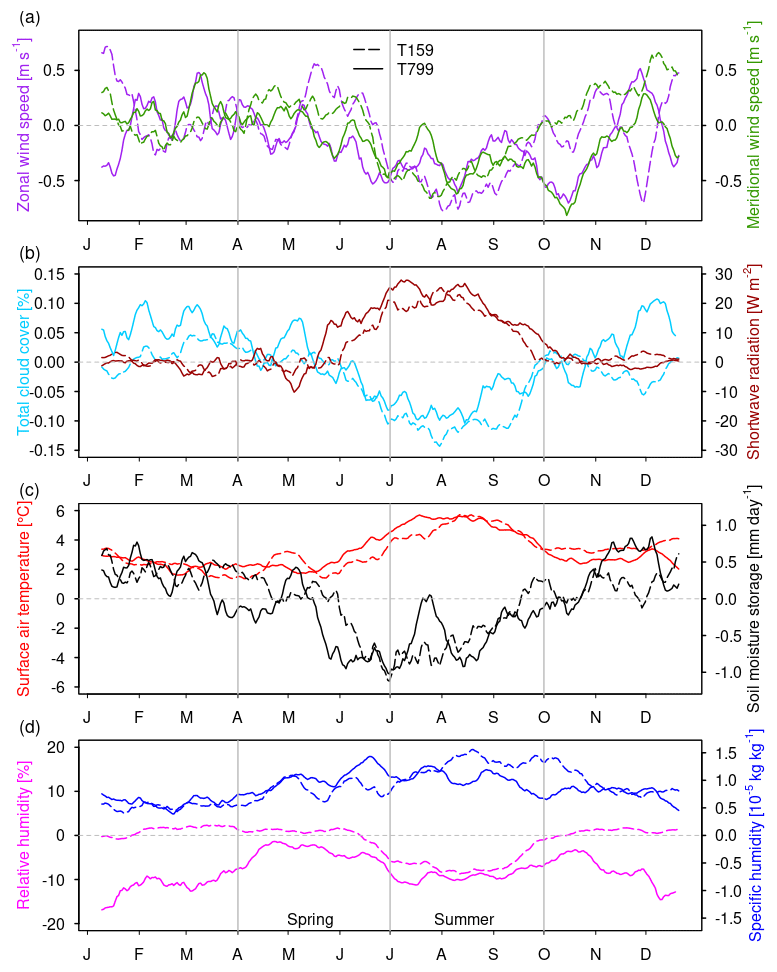
Figure 7Climate change signal (future − present) of (a) zonal and meridional wind speed at 10 m height, (b) total cloud cover and surface solar radiation, (c) daily mean surface air temperature and soil moisture storage, and (d) relative humidity and 850 hPa specific humidity for T159 (dashed lines) and T799 (solid lines). Values are smoothed with a 20-day running mean filter and averaged over central-western Europe. The letters on the horizontal axis correspond with the first day of each month (based on a year with 365 days).
Since local moisture recycling plays an important role in evapotranspiration over the continents, first we assess resolution differences in evapotranspiration in the present-day climate. The annual cycle of evapotranspiration over central-western Europe (Fig. 3d) indicates that T799 simulates lower evapotranspiration in the present-day climate than T159. As already discussed in Sect. 2, the precipitation bias over central-western Europe is smaller in T799 than in T159 (Fig. 1b). In spring, the high-resolution model simulates significantly less precipitation (2.9 mm day−1) than the standard-resolution model (3.4 mm day−1) (Welch t test: p<0.01). This is induced by a shift in the precipitation distribution towards more dry days (P≤1 mm day−1) in the high-resolution model compared to the standard-resolution model (Kolmogorov–Smirnov test: p<0.01). The reduced precipitation likely induces less evapotranspiration in T799 (2.9 mm day−1) than in T159 (3.3 mm day−1) in the current climate (Welch t test: p<0.01). In other words, suppressed precipitation in the present-day climate might lead to reduced recycling of moisture over land. This is because in HTESSEL rain is initially collected in the interception reservoir. Before saturation of the interception layer, less rainfall results in less evapotranspiration, which could explain the reduced evapotranspiration in spring in the current climate.
Second, we assess what mechanisms could explain the enhanced increase in evapotranspiration over the 21st century. Assuming that the top soil layer is still saturated at the start of spring (Fig. 4), this implies that the enhanced evapotranspiration in T799 is atmosphere-driven. We start with examining future changes in the atmospheric circulation. In the high-resolution model an anomalous high-pressure area develops near the British Isles that extends over central-western Europe (Fig. 6). The results show that the anomalous anticyclonic circulation does not significantly affect the wind climate over central-western Europe (Fig. 7a). However, high-pressure anomalies promote subsidence, thereby supporting clear skies, with more solar radiation reaching the surface (Fig. 7b). This effect is visible in the enhanced solar radiation in June, but not in April and May. As a consequence, more energy is available for future evapotranspiration and surface warming (Fig. 7c) in June in T799.
Third, the impact of air temperature on atmospheric humidity is examined. Present-day daily mean springtime temperatures are higher in T799 (12.3 ∘C) than in T159 (11.8 ∘C) (Welch t test: p<0.01) (not shown). These warmer springtime temperatures in T799 are associated with 10 % lower cloudiness and 12 W m−2 more surface solar radiation in the baseline climate than in T159. The reduced cloudiness is consistent with the smaller amount of precipitation in the T799 model. In the future climate, these resolution-dependent differences are roughly maintained (9 % reduced cloud cover and 15 W m−2 more surface solar radiation than in T159). The specific humidity of the atmosphere increases with climate warming (Fig. 7d). However, as temperature increases, the increase in saturation vapour pressure is larger in a warmer climate due to the nonlinearity of the Clausius–Clapeyron relation. The warmer baseline surface air temperature in T799 leads to a stronger increase in saturation vapour pressure for a similar daily mean temperature change (+2.7 ∘C in T799 compared to +2.3 ∘C in T159) and thus a larger increase in the atmospheric demand for moisture. This is clearly visible in the lower relative humidity of the atmosphere at high model resolution (Fig. 7d). Higher baseline surface air temperatures thus contribute to enhanced springtime evapotranspiration in T799 compared to T159 under future climate warming.
In summary, spring drying is larger in the high-resolution model version. This is due to a more continental climate in the high-resolution model, with less precipitation and warmer near-surface air temperatures, which promote enhanced evapotranspiration under climate warming. The main cause of the more continental climate is the less zonal position of the storm track in T799 as explained in Van Haren et al. (2015b).
4.3 Summer precipitation decline
Changes in summertime soil moisture storage are larger than springtime changes, but the summer differences between the model versions are relatively small. Compared to the present, the future increase in average summer drying at T799 resolution (d d mm month−1) is only slightly larger than the increase at T159 resolution (d d mm month−1). Consequently, the resolution-induced differences in soil moisture content developed in spring are more or less maintained during summer. The dominant contributor to future soil drying in summer is a decline in rainfall (Fig. 5). Consistent with enhanced drying, the decline in average summer precipitation is larger in T799 ( mm month−1) than in T159 ( mm month−1). Similar to spring months, runoff acts as a negative feedback on soil drying. Reduced runoff counteracts local soil drying in both T799 ( mm month−1) and T159 ( mm month−1). However, runoff is rather a result of the reduced water availability than an active contributor to the drying. Therefore we focus on the causes of the precipitation decline.
We first study the large-scale changes in the atmospheric circulation. During summer, an anomalous high-pressure area over the British Isles extends over central-western Europe in both model versions (Fig. 8). The anticyclonic circulation anomaly promotes subsidence and decreases convection. This leads to less cloud cover and reduced summer precipitation (Figs. 7b and 5). In addition, changes in the atmospheric circulation potentially affect horizontal moisture transport through changes in the wind climate over central-western Europe (Fig. 7a). Over this region, eastward winds (U) typically bring oceanic moisture over land, which increases the likelihood of continental precipitation. Due to the anticyclonic circulation anomaly, eastward winds are projected to decrease significantly in the future at both T159 ( m s−1) and T799 resolution ( m s−1) (Fig. 7a), reducing advection of atmospheric moisture from ocean sources. Zonal wind speed changes thus act to enhance summer soil drying over central-western Europe. However, zonal wind speed changes do not induce the resolution-dependent differences in future summer drying, since wind speed reductions in T799 are smaller than in T159 and thus have a counteractive effect on the differences in drying.
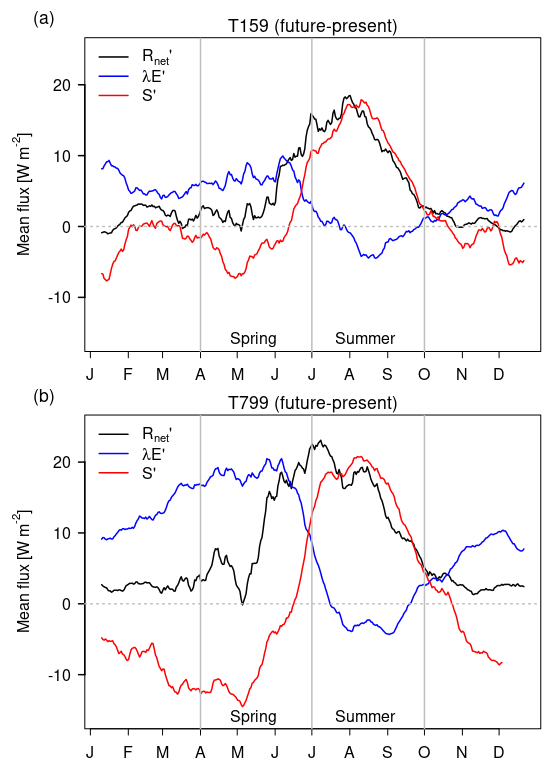
Figure 8Anomalies of surface fluxes under future climate change for (a) T159 and (b) T799. Positive indicates enhanced fluxes and negative reduced fluxes. Turbulent sensible heat (S′) and latent heat (λE′) fluxes are defined positive upward and net surface radiation () is defined positive downward. Values are smoothed with a 20-day running mean filter and averaged over central-western Europe. The letters on the horizontal axis correspond with the first day of each month (based on a year with 365 days).
Furthermore, future soil drying and precipitation decline are not uniformly spread over individual summer months. In August and September, changes in soil moisture storage are larger in T799 than in T159 (Fig. 5). Consistently, in August and September rainfall decline is larger in T799 than in T159 (Fig. 5). Remarkably, in July the climate change-induced soil moisture drying and precipitation decreases are larger in T159 than in T799 (Fig. 5). The simulations indicate that these monthly precipitation changes are largely determined by the magnitude and location of the anomalous high-pressure pattern over the British Isles. In August and September, the anomalous high pressure is stronger over central-western Europe in T799 (Fig. 9b, c), whereas in July, the high-pressure anomaly is larger in T159. It thus appears that the atmospheric circulation plays an important role in monthly precipitation changes, but is not the main cause of resolution-induced differences averaged over the summer months.
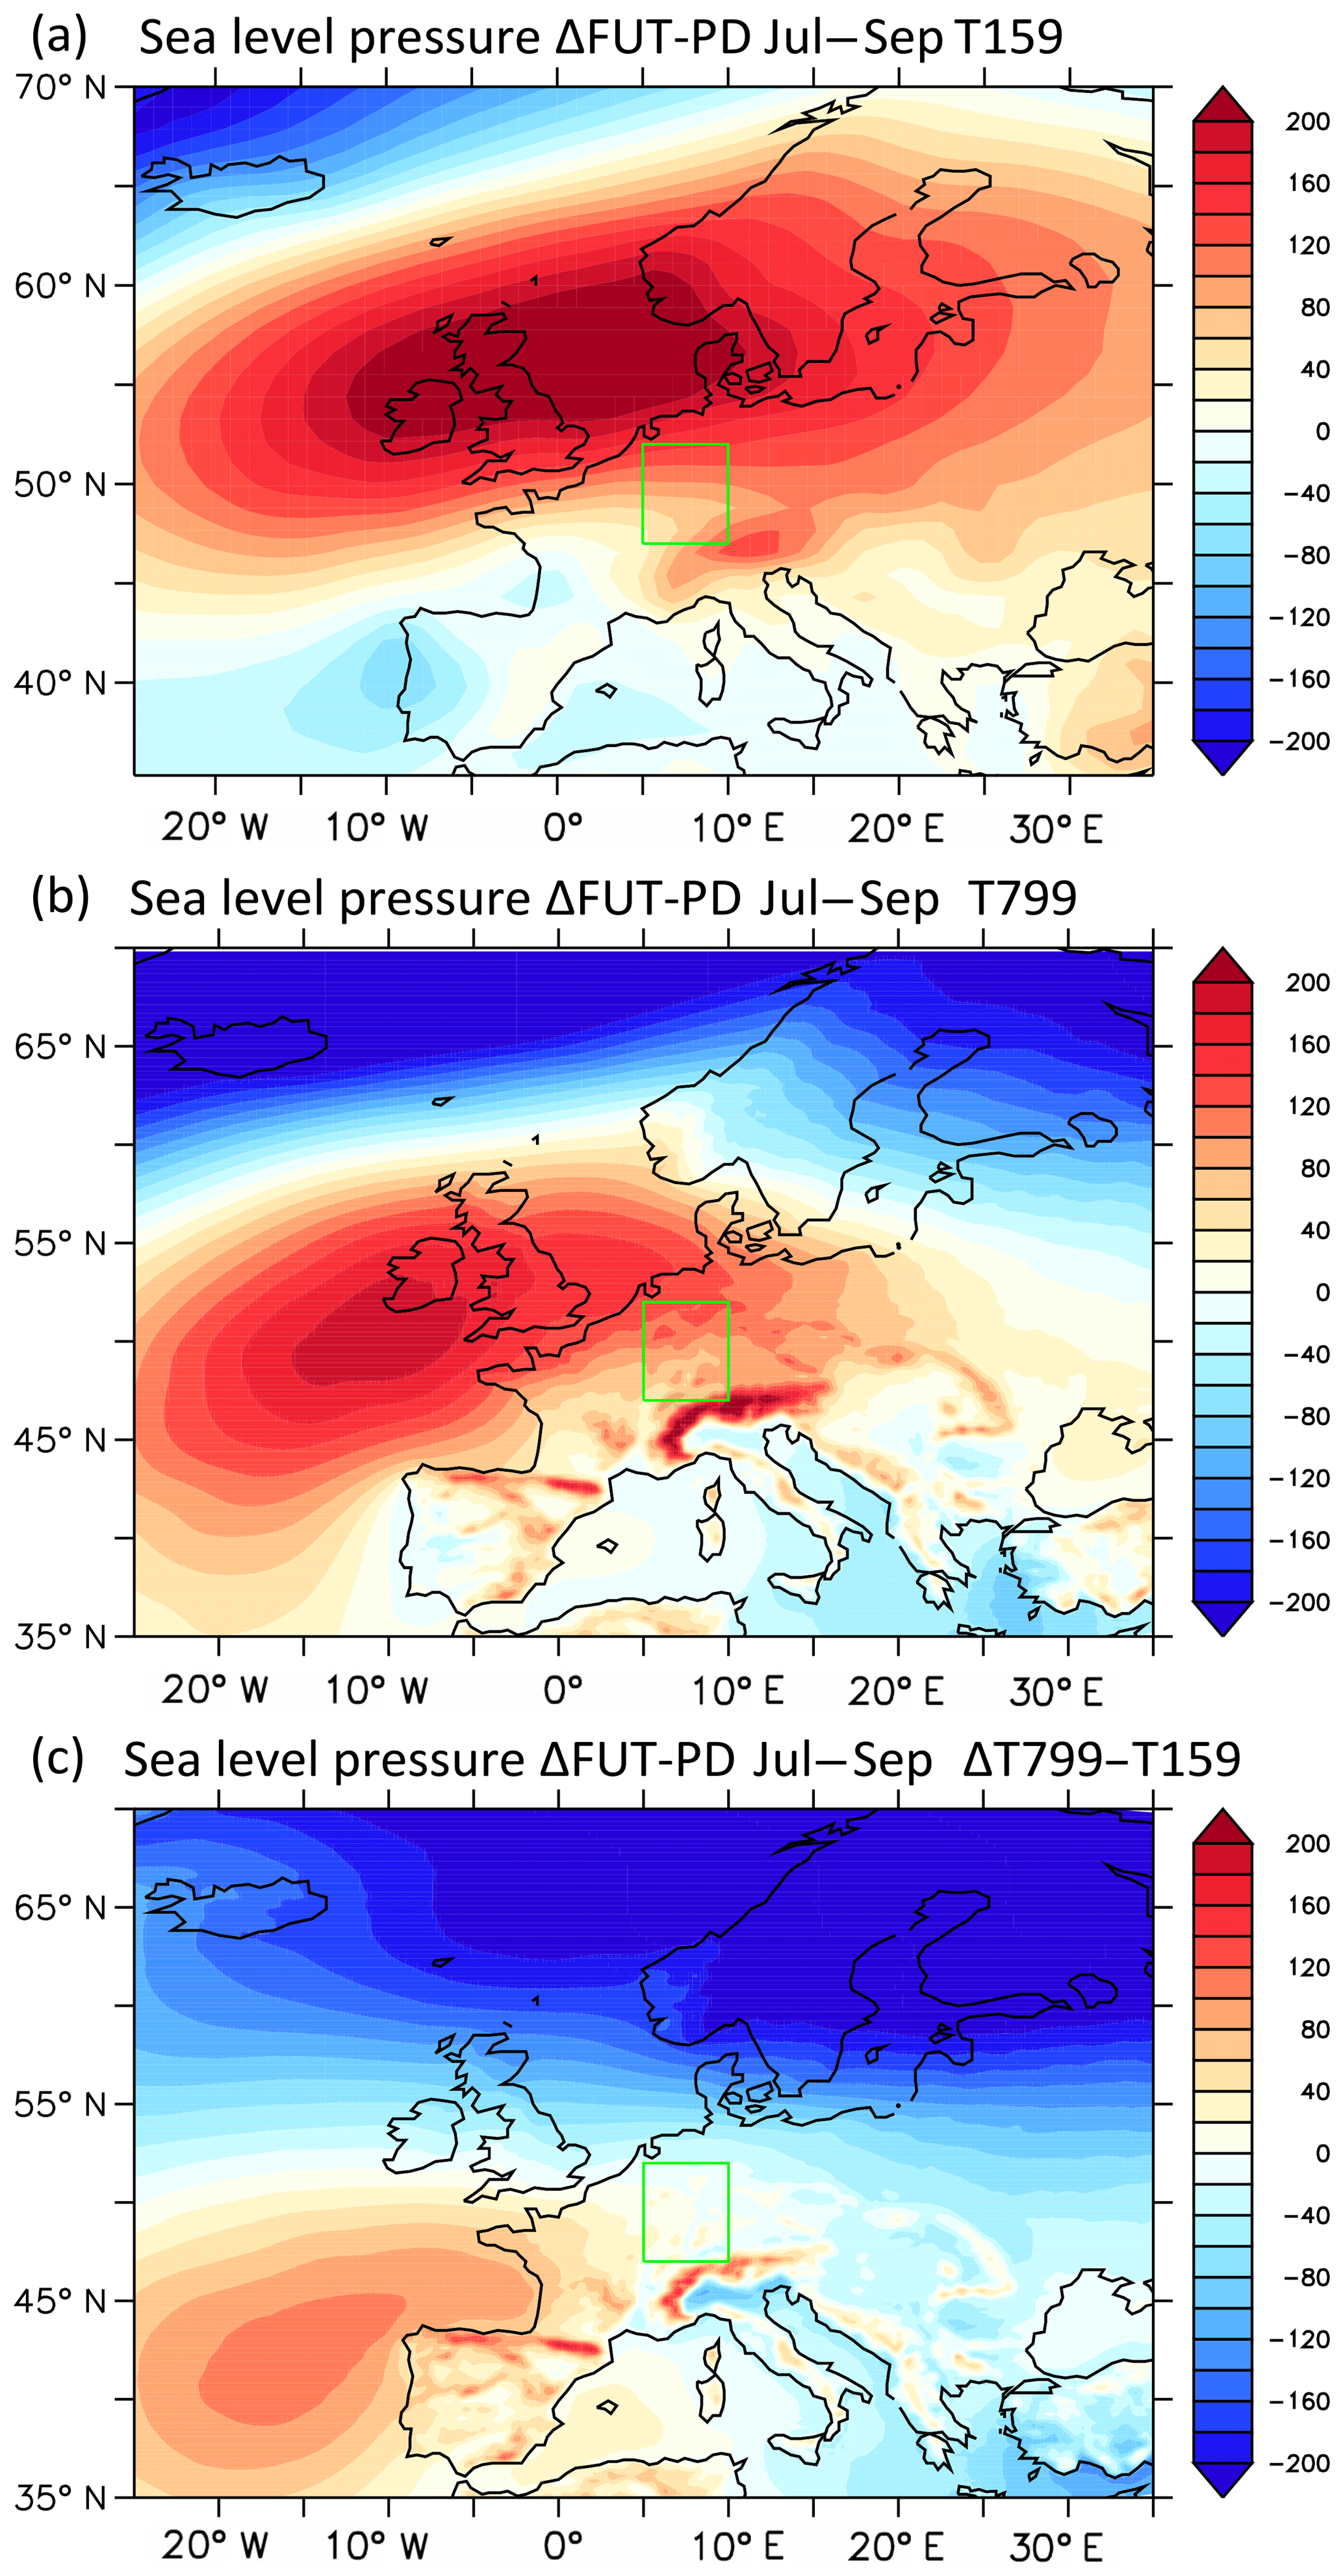
Figure 9Sea level pressure (Pa) climate change signal (future–present) for summer in the (a) standard and (b) high-resolution model. (c) Same but for difference in climate change signal between the high- and standard-resolution model.
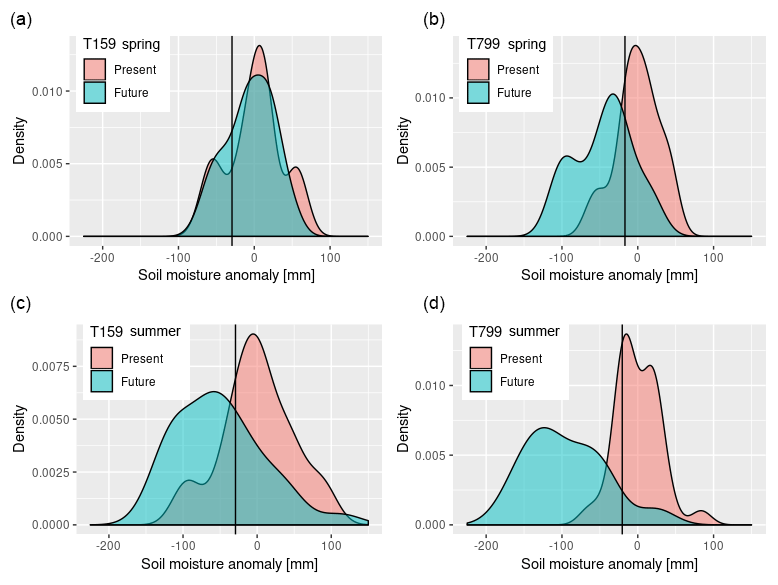
Figure 10Kernel density distribution of soil moisture anomalies over central-western Europe in (a) April–June at T159 resolution, (b) April–June at T799 resolution, (c) July–September at T159 resolution, and (d) July–September at T799 resolution for the present (blue) and future (pink) climates. Vertical black lines indicate the drought thresholds based on 6∕30 year events (20th percentile) of the present-day soil moisture anomaly distributions.
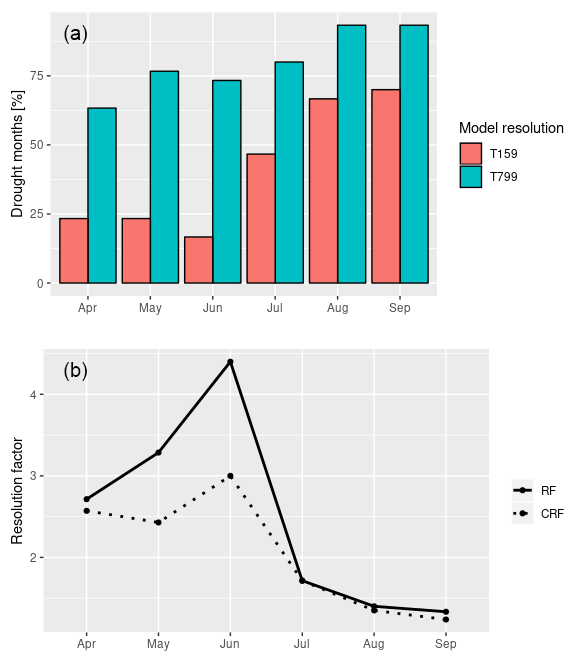
Figure 11(a) Frequency of future droughts, expressed as the percentage of months in drought for T159 and T799 over central-western Europe. (b) Resolution factor (RF) and corrected resolution factor (CRF). The resolution factor indicates the impact of resolution and is defined as the ratio of the frequency of droughts in T799 to the frequency of droughts in T159. The corrected resolution factor corrects for shifts in the baseline climate due to higher spatial resolution. CRF is computed similar to RF, but uses the thresholds of soil moisture anomalies based on the climatology of T159 for drought thresholds in T799.
Next to large-scale circulation changes, local feedbacks play a role in the reduced precipitation in summer. The surface water balance is closely connected to the surface energy balance through latent cooling by evapotranspiration. Figure 12 depicts average future changes of the main components of the surface energy balance, including the sensible heat flux (S′), latent heat flux (λE′), and the net surface radiation (). In future, maximum evapotranspiration is achieved in June for both T159 and T799 (Fig. 3). Thereafter evapotranspiration decreases rapidly, coinciding with a significant decrease in soil moisture in the top layer (Fig. 4). This decrease is stronger in T799 than in T159 (Fig. 6) and shows that from June onward evapotranspiration is limited by soil moisture. In the present-day climate, maximum evapotranspiration occurs 1 month later (July), for both T159 and T799, closer to the maxima in solar radiation and surface temperature (Fig. 7b, c), indicating that for the present climate evapotranspiration is not restricted by soil moisture but by available surface energy. As a result, there is no marked change in total summer evapotranspiration towards the future in T799 ( mm) and T159 ( mm). In turn, the minor increase in evapotranspiration limits the increase in specific humidity of the atmosphere (Fig. 7d) and thereby the local recycling of moisture. In addition, the limited atmospheric moisture content in combination with warmer temperatures leads to reduced relative humidity and less cloudiness, with more surface solar radiation (Fig. 7b, d). The resulting warmer and drier boundary layer (Fig. 7c, d) further diminishes rainfall. This effect is stronger at T799 resolution, presumably caused by the drier soils at the start of summer that alter the partitioning of the turbulent fluxes. Local feedbacks of soil moisture with temperature and precipitation thus seem to dominate the resolution-dependent differences in summer drying.
5.1 Soil moisture droughts
The changes in the seasonal cycle of soil moisture content affect the severity and frequency of future droughts under climate warming. Consider Fig. 10, which depicts the S′ distributions of spring and summer at T799 and T159 resolution, for the present and future climates. The drought threshold values (6∕30 year events) as defined in Sect. 2.4, which are based on these distributions, are also indicated. The associated frequency of droughts by the end of the 21st century, averaged over central-western Europe, can be seen in the bar chart of Fig. 11a.
In spring, model resolution has a high impact on the frequency of future droughts. In the T159 simulations, there is no significant future change in the frequency of springtime droughts. This is clearly visible in the large overlap of the present-day and future climates in the distributions of spring soil moisture anomalies for T159 (Fig. 10a). In contrast, in T799, the springtime soil moisture anomaly distributions indicate that the frequency of droughts increases due to a shift towards drier conditions in the future climate. Future springtime droughts are almost 3 times more frequent in T799 than in T159 (RF ≃2.7), occurring every 1 to 2 years (fT799≃ 71 %) (Fig. 11). The increase in the number of springtime drought months is partly due to a shift in the threshold value of S′: in T159 droughts are defined as mm compared to mm in T799. This is due to a relatively narrow distribution of soil moisture anomalies in the high-resolution baseline climate (Fig. 10d). Applying the threshold of T159 to T799 results in a slightly smaller percentage of the months being under drought conditions (CRF < RF) (Fig. 11b).
During the summer months, future droughts become more frequent at both resolutions (fT799≃89 % and fT159≃61 %). Nevertheless, model resolution is still an important factor in drought frequency, with about 50 % more drought months in T799 than in T159 (RF ≃1.5). The high-resolution simulations indicate that droughts in the present-day climate will become the normal climatological state in the future. However, it should be noted that the sample size is only 30 years of a single climate model. To obtain more robust answers a larger ensemble of different models is required.
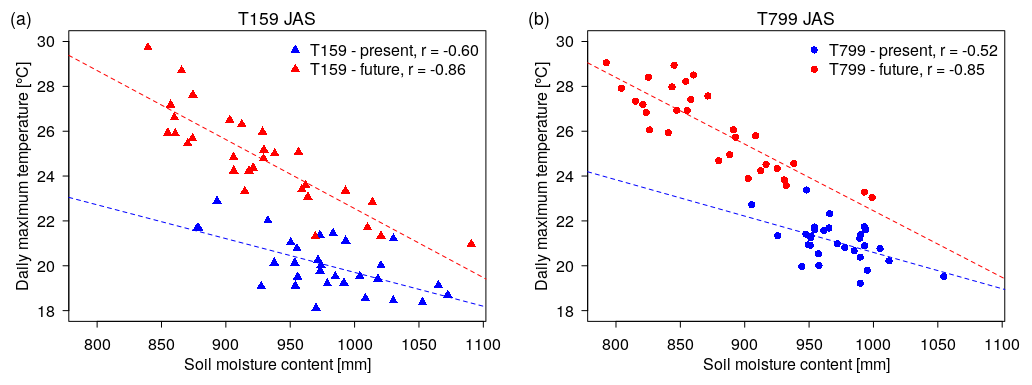
Figure 12Linear regression between summer (July–September) soil moisture content and daily maximum surface air temperature for (a) T159 and (b) T799, for the present (blue) and future (red) climate.
5.2 Warm extremes
The drier soil at the start of summer limits the evaporative fraction, leading to enhanced sensible heat fluxes that amplify near-surface warming (Figs. 7c and 8). Combined with warmer air temperatures, this decreases the relative humidity of the atmosphere (Fig. 7d). The warmer and drier boundary layer inhibits cloud formation and further enhances surface solar radiation (Fig. 7b). The resulting rise in daily maximum surface air temperature in T799 (+5.1 ∘C) and T159 (+4.8 ∘C) is about 2 times larger than in spring.
This local soil-moisture–temperature feedback starts a few weeks earlier for the high-resolution model (Fig. 7b) due to the enhanced soil drying in spring. The strengthening of the soil-moisture–temperature coupling is also visible in Fig. 12, which shows a steeper regression line between soil moisture content and daily maximum temperature for the future climate than for the present climate. The stronger feedback in T799 leads to a clustering of exceptionally dry and hot summers in T799 compared to T159 (clustered in the top left corner in Fig. 12b). The strong link between soil moisture and maximum temperatures is created by reduced soil moisture which strongly restrains latent cooling in summer in both T159 (r=0.78, p<0.01) and T799 (r=0.90, p<0.01). In the future, drier future spring soil conditions could therefore potentially act as a precursor for hot summers.
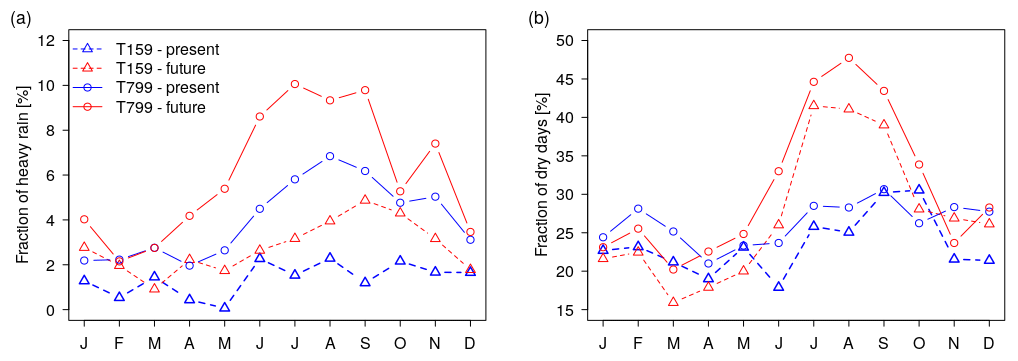
Figure 13(a) Monthly fraction of precipitation falling as heavy rain (≥30 mm day−1) in central-western Europe, computed as the contribution of heavy precipitation falling somewhere in the area to the total amount of precipitation. (b) Monthly fraction of dry days averaged over central-western Europe (≤1 mm day−1). Before the analysis we regridded precipitation values to the T159 model grid and computed the daily sum of precipitation per grid cell.
5.3 Heavy precipitation and dry days
In the current climate, T799 simulates a larger fraction of dry days and a larger fraction of precipitation falling as intense rain compared to T159 (Fig. 13), which is presumably caused by the higher surface air temperature. In the future climate, both resolutions simulate an increase in the number of dry days in summer and in the contribution of heavy precipitation to the total precipitation amount. This effect is larger in T799. Unless there is moisture supply from the ocean, after a day with heavy precipitation the air needs to be recharged before a new downpour can start. In between heavy precipitation days, it is therefore relatively dry with little rain. During these dry days there will be less cloud cover, with more incoming solar radiation, higher temperatures, and less relative humidity, inducing a higher evaporative demand. So for the same amount of rain, a shift to more dry days and heavy precipitation potentially increases the evaporative demand of the atmosphere. Dry soils, however, limit the rate of evapotranspiration and slow down the rate at which the atmosphere can recharge with water vapour. The drier soil conditions in T799 thus likely increase the number of dry days between heavy rain events.
Using two model resolutions of the global climate model EC-Earth, we have investigated the impact of model resolution on the occurrence and causes of projected soil drying in the Rhine–Meuse drainage area in central-western Europe. Consistent with previous studies (Berg et al., 2017; Ruosteenoja et al., 2018; Samaniego et al., 2018), both model resolutions project soil drying in the warm season months over central-western Europe. For the present-day climate the high-resolution (T799, ∼25 km) and standard-resolution (T159, ∼112 km) versions have similar soil moisture climatologies. However, for the future large differences occur. In spring, enhanced evapotranspiration with respect to the corresponding baseline climatology induces much stronger drying in the high-resolution model. The enhanced spring drying preconditions the soil to a drier state at the start of summer. Both resolutions simulate a significant increase in summer drying of similar magnitude. Due to the pre-drying in spring, this leads to more frequent droughts at high resolution than at standard resolution. Consequently, in the high-resolution model, summer droughts in the present-day climate become the normal climatological state in the future.
The analyses revealed that both anomalous circulation patterns and local feedbacks are responsible for the decrease in soil moisture in a future climate. A less zonal position of the storm tracks leads to a more continental climate over central-western Europe and a reduction in present-day biases in precipitation and surface air temperature (Van Haren et al., 2015b). The resulting warmer and drier spring promotes enhanced evapotranspiration in the high-resolution model. Furthermore, an anticyclonic pressure anomaly over the British Isles extends over central-western Europe. Although no significant changes in wind occur during the preconditioning phase in spring, the high-pressure anomaly supports clear skies with enhanced surface solar radiation reaching the surface. This provides additional surface energy for turbulent fluxes in June.
Simulated summer drying is mainly caused by a reduction in rainfall. The drying of the land surface results in a reduced evaporative fraction combined with enhanced solar radiation in higher surface temperatures. This feedback is slightly stronger at high model resolution due to the pre-drying in spring. The drier soil in the high-resolution model at the start of summer induces stronger local feedbacks with precipitation and evapotranspiration, which leads to a clustering of droughts and warm extremes. The impact of soil moisture on observed European warm extremes has also been demonstrated by Whan et al. (2015) using a simple water balance model. Another consequence of warm season drying is the absence of recovery of the ground water storage in the following winter, with consequences for year-round runoff. The stronger local feedbacks open, on the other hand, possibilities for predictability of summer droughts, heat waves, precipitation, and river runoff.
We argue that both dynamical and local feedback processes are better represented at higher resolution. The cause of the anomalous anticyclonic circulation over the British Isles could be a weakening of the Atlantic meridional overturning circulation (AMOC) under future climate warming, as discussed in Haarsma et al. (2015). The stronger response at the high T799 resolution is probably due to enhanced ocean–atmosphere coupling. Because CMIP5 models underestimate the natural interannual variability of this AMOC-induced UK high (Haarsma et al., 2015), we argue that the stronger response in T799 is more realistic. Furthermore, the additional increase in spring drying in the high-resolution simulations is partly due to a better representation of the Atlantic storm track at high model resolution as described in Van Haren et al. (2015b). Whether the simulated soil drying and the impact of resolution is robust has to be evaluated in a larger ensemble of different models. Initiatives such as the Horizon 2020 project PRIMAVERA and the CMIP6-endorsed HighResMIP (Haarsma et al., 2016) will contribute to the hypothesis put forward in this study that the simulated central-western European soil drying by CMIP5 is underestimated due to dynamical causes and local feedbacks that can only reliably be simulated at high resolution.
E-OBS precipitation and temperature gridded data are freely available from the European Climate Assessment and Dataset (Haylock et al., 2008). The EC-Earth model output is available upon request to the author.
ECvdL designed the study and wrote the paper. ECvdL and RJH conducted analysis of the data. All authors contributed to interpreting results.
The authors declare that they have no conflict of interest.
We thank Luis Samaniego and an anonymous referee for their valuable comments
which helped to considerably improve the quality of the
paper.
Edited by: Kerstin Stahl
Reviewed by: Luis Samaniego and one anonymous referee
Baatsen, M., Haarsma, R. J., Van Delden, A. J., and de Vries, H.: Severe autumn storms in future Western Europe with a warmer Atlantic Ocean, Clim. Dynam., 45, 949–964, https://doi.org/10.1007/s00382-014-2329-8, 2015. a, b, c
Balsamo, G., Beljaars, A., Scipal, K., Viterbo, P., van den Hurk, B., Hirschi, M., and Betts, A. K.: A Revised Hydrology for the ECMWF Model: Verification from Field Site to Terrestrial Water Storage and Impact in the Integrated Forecast System, J. Hydrometeorol., 10, 623–643, https://doi.org/10.1175/2008JHM1068.1, 2009. a
Berckmans, J., Woollings, T., Demory, M. E., Vidale, P. L., and Roberts, M.: Atmospheric blocking in a high resolution climate model: Influences of mean state, orography and eddy forcing, Atmos. Sci. Lett., 14, 34–40, https://doi.org/10.1002/asl2.412, 2013. a
Berg, A., Sheffield, J., and Milly, P. C.: Divergent surface and total soil moisture projections under global warming, Geophys. Res. Lett., 44, 236–244, https://doi.org/10.1002/2016GL071921, 2017. a, b, c, d
Delworth, T. L., Rosati, A., Anderson, W., Adcroft, A. J., Balaji, V., Benson, R., Dixon, K., Griffies, S. M., Lee, H. C., Pacanowski, R. C., Vecchi, G. A., Wittenberg, A. T., Zeng, F., and Zhang, R.: Simulated climate and climate change in the GFDL CM2.5 high-resolution coupled climate model, J. Climate, 25, 2755–2781, https://doi.org/10.1175/JCLI-D-11-00316.1, 2012. a
Demory, M. E., Vidale, P. L., Roberts, M. J., Berrisford, P., Strachan, J., Schiemann, R., and Mizielinski, M. S.: The role of horizontal resolution in simulating drivers of the global hydrological cycle, Clim. Dynam., 42, 2201–2225, https://doi.org/10.1007/s00382-013-1924-4, 2014. a
Feng, S. and Fu, Q.: Expansion of global drylands under a warming climate, Atmos. Chem. Phys., 13, 10081–10094, https://doi.org/10.5194/acp-13-10081-2013, 2013. a, b
Greve, P. and Seneviratne, S. I.: Assessment of future changes in water availability and aridity, Geophys. Res. Lett., 42, 5493–5499, https://doi.org/10.1002/2015GL064127, 2015. a
Greve, P., Roderick, M. L., and Seneviratne, S. I.: Simulated changes in aridity from the last glacial maximum to 4xCO2, Environ. Res. Lett., 12, 114021, https://doi.org/10.1088/1748-9326/aa89a3, 2017. a, b
Haarsma, R. J., Hazeleger, W., Severijns, C., De Vries, H., Sterl, A., Bintanja, R., Van Oldenborgh, G. J., and Van Den Brink, H. W.: More hurricanes to hit western Europe due to global warming, Geophys. Res. Lett., 40, 1783–1788, https://doi.org/10.1002/grl.50360, 2013. a, b, c
Haarsma, R. J., Selten, F. M., and Drijfhout, S. S.: Decelerating Atlantic meridional overturning circulation main cause of future west European summer atmospheric circulation changes, Environ. Res. Lett., 10, 094007, https://doi.org/10.1088/1748-9326/10/9/094007, 2015. a, b
Haarsma, R. J., Roberts, M. J., Vidale, P. L., Senior, C. A., Bellucci, A., Bao, Q., Chang, P., Corti, S., Fuckar, N. S., Guemas, V., von Hardenberg, J., Hazeleger, W., Kodama, C., Koenigk, T., Leung, L. R., Lu, J., Luo, J.-J., Mao, J., Mizielinski, M. S., Mizuta, R., Nobre, P., Satoh, M., Scoccimarro, E., Semmler, T., Small, J., and von Storch, J.-S.: High Resolution Model Intercomparison Project (HighResMIP v1.0) for CMIP6, Geosci. Model Dev., 9, 4185–4208, https://doi.org/10.5194/gmd-9-4185-2016, 2016. a
Haylock, M. R., Hofstra, N., Klein Tank, A. M., Klok, E. J., Jones, P. D., and New, M.: A European daily high-resolution gridded data set of surface temperature and precipitation for 1950–2006, J. Geophys. Res.-Atmos., 113, D20119, https://doi.org/10.1029/2008JD010201, 2008. a, b
Hazeleger, W., Wang, X., Severijns, C., Stefanescu, S., Bintanja, R., Sterl, A., Wyser, K., Semmler, T., Yang, S., van den Hurk, B., van Noije, T., van der Linden, E., and van der Wiel, K.: EC-Earth V2.2: Description and validation of a new seamless earth system prediction model, Clim. Dynam., 39, 2611–2629, https://doi.org/10.1007/s00382-011-1228-5, 2012. a
Hirschi, M., Seneviratne, S. I., Alexandrov, V., Boberg, F., Boroneant, C., Christensen, O. B., Formayer, H., Orlowsky, B., and Stepanek, P.: Observational evidence for soil-moisture impact on hot extremes in southeastern Europe, Nat. Geosci., 4, 17–21, https://doi.org/10.1038/ngeo1032, 2011. a
Huang, J., Yu, H., Guan, X., Wang, G., and Guo, R.: Accelerated dryland expansion under climate change, Nat. Clim. Change, 6, 166–171, https://doi.org/10.1038/nclimate2837, 2016. a
Jung, T., Miller, M. J., Palmer, T. N., Towers, P., Wedi, N., Achuthavarier, D., Adams, J. M., Altshuler, E. L., Cash, B. A., Kinter, J. L., Marx, L., Stan, C., and Hodges, K. I.: High-resolution global climate simulations with the ECMWF model in project athena: Experimental design, model climate, and seasonal forecast skill, J. Climate, 25, 3155–3172, https://doi.org/10.1175/JCLI-D-11-00265.1, 2012. a, b
Kumar, S., Merwade, V., Kinter, J. L., and Niyogi, D.: Evaluation of temperature and precipitation trends and long-term persistence in CMIP5 twentieth-century climate simulations, J. Climate, 26, 4168–4185, https://doi.org/10.1175/JCLI-D-12-00259.1, 2013. a
Lorenz, R., Argüeso, D., Donat, M. G., Pitman, A. J., Hurk, B. V. D., Berg, A., Lawrence, D. M., Chéruy, F., Ducharne, A., Hagemann, S., Meier, A., Milly, P. C., and Seneviratne, S. I.: Influence of land-atmosphere feedbacks on temperature and precipitation extremes in the GLACE-CMIP5 ensemble, J. Geophys. Res., 121, 607–623, https://doi.org/10.1002/2015JD024053, 2016. a
Milly, P. C. and Dunne, K. A.: Potential evapotranspiration and continental drying, Nat. Clim. Change, 6, 946–949, https://doi.org/10.1038/nclimate3046, 2016. a
Orlowsky, B. and Seneviratne, S. I.: Elusive drought: uncertainty in observed trends and short- and long-term CMIP5 projections, Hydrol. Earth Syst. Sci., 17, 1765–1781, https://doi.org/10.5194/hess-17-1765-2013, 2013. a, b, c
Palmer, W. C.: Meteorological Drought, vol. 45, U.S. Department of Commerce, Weather Bureau, Washington, DC, 1965. a
Reynolds, R. W., Smith, T. M., Liu, C., Chelton, D. B., Casey, K. S., and Schlax, M.G .: Daily High-Resolution-Blended Analyses for Sea Surface Temperature. J. Climate, 20, 5473–5496, https://doi.org/10.1175/2007JCLI1824.1, 2007. a
Roderick, M. L., Greve, P., and Farquhar, G. D.: On the assessment of aridity with changes in atmospheric CO2, Water Resour. Res., 51, 5450–5463, https://doi.org/10.1002/2015WR017031, 2015. a
Rogelj, J., Meinshausen, M., and Knutti, R.: Global warming under old and new scenarios using IPCC climate sensitivity range estimates, Nat. Clim. Change, 2, 248–253, https://doi.org/10.1038/nclimate1385, 2012. a
Ruosteenoja, K., Markkanen, T., Venäläinen, A., Räisänen, P., and Peltola, H.: Seasonal soil moisture and drought occurrence in Europe in CMIP5 projections for the 21st century, Clim. Dynam., 50, 1177–1192, https://doi.org/10.1007/s00382-017-3671-4, 2018. a, b, c
Samaniego, L., Thober, S., Kumar, R., Wanders, N., Rakovec, O., Pan, M., Zink, M., Sheffield, J., Wood, E. F., and Marx, A.: Anthropogenic warming exacerbates European soil moisture droughts, Nat. Clim. Change, 8, 421–426, https://doi.org/10.1038/s41558-018-0138-5, 2018. a, b
Scheff, J. and Frierson, D. M.: Terrestrial aridity and its response to greenhouse warming across CMIP5 climate models, J. Climate, 28, 5583–5600, https://doi.org/10.1175/JCLI-D-14-00480.1, 2015. a
Scheff, J. and Frierson, D. M. W.: Scaling potential evapotranspiration with greenhouse warming, J. Climate, 27, 1539–1558, https://doi.org/10.1175/JCLI-D-13-00233.1, 2014. a
Scheff, J., Seager, R., Liu, H., and Coats, S.: Are glacials dry? Consequences for paleoclimatology and for greenhouse warming, J. Climate, 30, 6593–6609, https://doi.org/10.1175/JCLI-D-16-0854.1, 2017. a
Seneviratne, S. I., Lüthi, D., Litschi, M., and Schär, C.: Land-atmosphere coupling and climate change in Europe, Nature, 443, 205–209, https://doi.org/10.1038/nature05095, 2006. a
Seneviratne, S. I., Corti, T., Davin, E. L., Hirschi, M., Jaeger, E. B., Lehner, I., Orlowsky, B., and Teuling, A. J.: Investigating soil moisture-climate interactions in a changing climate: A review, Earth-Sci. Rev., 99, 125–161, https://doi.org/10.1016/j.earscirev.2010.02.004, 2010. a
Sherwood, S. and Fu, Q.: A Drier Future?, Science, 343, 737–739, https://doi.org/10.1126/science.1247620, 2014. a
Sterl, A., Severijns, C., Dijkstra, H., Hazeleger, W., Jan van Oldenborgh, G., van den Broeke, M., Burgers, G., van den Hurk, B., Jan van Leeuwen, P., and van Velthoven, P.: When can we expect extremely high surface temperatures?, Geophys. Res. Lett., 35, L14703, https://doi.org/10.1029/2008GL034071, 2008. a
Swann, A. L. S., Hoffman, F. M., Koven, C. D., and Randerson, J. T.: Plant responses to increasing CO2 reduce estimates of climate impacts on drought severity, P. Natl. Acad. Sci. USA, 113, 1019–10024, https://doi.org/10.1073/pnas.1604581113, 2016. a, b
Taylor, K. E., Stouffer, R. J., and Meehl, G. A.: An Overview of CMIP5 and the Experiment Design, B. Am. Meteorol. Soc., 93, 485–498, https://doi.org/10.1175/BAMS-D-11-00094.1, 2012. a
Van Haren, R., Haarsma, R. J., de Vries, H., van Oldenborgh, G. J., and Hazeleger, W.: Resolution dependence of circulation forced future central European summer drying, Environ. Res. Lett., 10, 055002, https://doi.org/10.1088/1748-9326/10/5/055002, 2015a. a
Van Haren, R., Haarsma, R. J., Van Oldenborgh, G. J., and Hazeleger, W.: Resolution Dependence of European Precipitation in a State-of-the-Art Atmospheric General Circulation Model, J. Climate, 28, 5134–5149, https://doi.org/10.1175/JCLI-D-14-00279.1, 2015b. a, b, c, d, e
Van Ulden, A., Lenderink, G., van den Hurk, B., and van Meijgaard, E.: Circulation statistics and climate change in Central Europe: PRUDENCE simulations and observations, Climatic Change, 81, 179–192, https://doi.org/10.1007/s10584-006-9212-5, 2007. a
Van Vuuren, D. P., Edmonds, J., Kainuma, M., Riahi, K., Thomson, A., Hibbard, K., Hurtt, G. C., Kram, T., Krey, V., Lamarque, J. F., Masui, T., Meinshausen, M., Nakicenovic, N., Smith, S. J., and Rose, S. K.: The representative concentration pathways: An overview, Climatic Change, 109, 5–31, https://doi.org/10.1007/s10584-011-0148-z, 2011. a
Whan, K., Zscheischler, J., Orth, R., Shongwe, M., Rahimi, M., Asare, E. O., and Seneviratne, S. I.: Impact of soil moisture on extreme maximum temperatures in Europe, Weather and Climate Extremes, 9, 57–67, https://doi.org/10.1016/j.wace.2015.05.001, 2015. a
Willison, J., Robinson, W. A., and Lackmann, G. M.: North Atlantic storm-track sensitivity to warming increases with model resolution, J. Climate, 28, 4513–4524, https://doi.org/10.1175/JCLI-D-14-00715.1, 2015. a
Wipfler, E. L., Metselaar, K., van Dam, J. C., Feddes, R. A., van Meijgaard, E., van Ulft, L. H., van den Hurk, B., Zwart, S. J., and Bastiaanssen, W. G. M.: Seasonal evaluation of the land surface scheme HTESSEL against remote sensing derived energy fluxes of the Transdanubian region in Hungary, Hydrol. Earth Syst. Sci., 15, 1257–1271, https://doi.org/10.5194/hess-15-1257-2011, 2011. a
Zhao, T. and Dai, A.: The magnitude and causes of global drought changes in the twenty-first century under a low-moderate emissions scenario, J. Climate, 28, 4490–4512, https://doi.org/10.1175/JCLI-D-14-00363.1, 2015. a, b