the Creative Commons Attribution 4.0 License.
the Creative Commons Attribution 4.0 License.
 | 15 Mar 2019
Characterizing the potential for drought action from combined hydrological and societal perspectives
Heather Lazrus
Debasish PaiMazumder
Drought is a function of both natural and human influences, but fully characterizing the interactions between human and natural influences on drought remains challenging. To better characterize parts of the drought feedback loop, this study combines hydrological and societal perspectives to characterize and quantify the potential for drought action. For the hydrological perspective, we examine historical groundwater data, from which we determine the decadal likelihoods of exceeding hydrologic thresholds relevant to different water uses. Stakeholder interviews yield data about how people rate the importance of water for different water uses. We combine these to quantify the Potential Drought Action Indicator (PDAI). The PDAI is demonstrated for a study site in south-central Oklahoma, where water availability is highly influenced by drought and management of water resources is contested by local stakeholders. For the hydrological perspective, we find that the historical decadal likelihood of exceedance for a moderate threshold associated with municipal supply has ranged widely: from 23 % to 75 %, which corresponds well with natural drought variability in the region. For the societal perspective, stakeholder interviews reveal that people value water differently for various uses. Combining this information into the PDAI illustrates that potential drought action increases as the hydrologic threshold is exceeded more often; this occurs as conditions get drier and when water use thresholds are more moderate. The PDAI also shows that for water uses where stakeholders have diverse views of importance, the PDAI will be diverse as well, and this is exacerbated under drier conditions. The variability in stakeholder views of importance is partially explained by stakeholders' cultural worldviews, pointing to some implications for managing water when drought risks threaten. We discuss how the results can be used to reduce potential disagreement among stakeholders and promote sustainable water management, which is particularly important for planning under increasing drought.
- Article
(2322 KB) - Full-text XML
- BibTeX
- EndNote


Drought can pose significant challenges to meeting the water needs of society and ecosystems, which has led to increased interest in understanding and managing drought risk now and into the future (e.g., Georgakakos et al., 2014). There are many definitions of drought, with the classic definitions including meteorological, hydrological, agricultural, and socioeconomic (Wilhite and Glantz, 1985). Similarly, many different drought indices have been developed (Mishra and Singh, 2010). The main driver of drought in most definitions and indices of drought is natural climate variability (Van Loon, 2016a), which is where efforts to improve prediction and modeling have focused (see Mishra and Singh, 2011, and references therein). Even with advances in drought prediction, drought remains one of the most expensive hazards affecting the United States (NCDC, 2015), reinforcing the idea that social factors must also be considered for drought planning (Wilhite and Buchanan-Smith, 2005; Bachmair et al., 2016).
The need for more proactive drought planning has led to increased interest in the development of drought management plans (e.g., Wilhite et al., 2000, 2005; Knutson et al., 1998). Drought risk management requires identifying drought indicators and triggers (Steinemann and Hayes, 2005), which can be developed and evaluated using stakeholder processes to make them useful for decision-making (Steinemann and Cavalcanti, 2006; Steinemann et al., 2015). Further, the need to better link drought indices with impacts has been recognized (Bachmair et al., 2016). Frameworks to link drought indicators directly with impacts are emerging (Bachmair et al., 2016; Stagge et al., 2015; Towler and Lazrus, 2016), though there is still a need for more systematic impact monitoring (Lackstrom et al., 2013). Ostrom (1990) found that assessments that can account for how people value, perceive, and make decisions about resources such as water, particularly when water is scarce, are critical for guiding policies that meet management goals and stakeholder needs and thus promote sustainable management of water resources. Dessai and Sims (2010) explored public perceptions of drought and climate change to understand barriers to action and paths towards sustainable management. Lazrus (2016) examined how stakeholders perceive drought and how drought intersects with their cultural processes.
Recent work has highlighted how the natural and human causes of drought are intertwined and that researchers must consider both in any examination of drought (Van Loon, 2016a). This general notion has been echoed in the hydrologic science literature (Wagener et al., 2010), as well as the natural hazard (Jones and Preston, 2011) and climate change literature (Oppenheimer et al., 2014). This has also motivated the new science of socio-hydrology, which explores the dynamics and coevolution of human and water systems (Sivapalan et al., 2012). Van Loon et al. (2016b) describe a new framework that explicitly acknowledges the human dimension of drought. They outline several research gaps, including a gap in our understanding of the human feedbacks on drought.
Understanding human feedbacks on drought is important but has not been well studied, partially because of its complexity and potential for nonlinear feedbacks (Van Loon et al., 2016b). Drought feedbacks can be influenced by many factors, for example, through science and technology (Polsky and Cash, 2005), historical lessons learned (McLeman et al., 2014), and management strategies (Maggioni, 2015). Further, feedbacks may be positive (i.e., the drought is made worse) or negative (i.e., the drought condition is alleviated) (Pulwarty, 2003; Tijdeman et al., 2018). In addition, these interactions and feedbacks can result in changing the normal drought reference baseline (Van Loon et al., 2016b). However, fully characterizing the feedback loops between human and natural influences on drought remains challenging.
The goal of this paper is to provide an experimental methodology towards a better characterization of several components of the drought feedback loop, specifically to gain understanding on how and why people might take action in response to drought. To this end, we develop an indicator to characterize how natural influences on drought inform potential human actions on drought. We use the term “potential”, since in this study we do not have the data to validate whether or not human actions were actually taken as a result of these natural drought influences. In this investigation, we characterize the natural influences by taking a hydrological perspective on drought (Van Loon et al., 2016b); specifically, we examine the exceedance of relevant thresholds from historical hydrologic data. For the societal perspective, we examine stakeholder input from interviews, specifically how stakeholders rated the importance of water for different uses. In our attempt to better characterize the potential for drought action, we combine the data from the hydrological and societal perspectives, developing a new, derivative product that we call the Potential Drought Action Indicator (PDAI). Here, by “action” we generally mean some effort towards drought mitigation. Though we do not directly validate the PDAI, we are able to interpret the findings to provide insights to water management policy using additional interview data on stakeholder worldviews and social science theory; this is unique in that it allows us to investigate the theoretical underpinnings that are not typically explored in drought risk studies or stakeholder processes.
We demonstrate the PDAI through a place-based assessment of drought risk in south-central Oklahoma, where water availability is highly influenced by drought and management of water resources is contested by local stakeholders; we provide some background and describe this study site in Sect. 2. Section 3 outlines the methodology: Sect. 3.1 and 3.2 outline the details of the methods used to assess the hydrological and social perspectives, respectively. Details about how the PDAI is developed are provided in Sect. 3.3. In Sect. 3.4, we describe additional interview data on the stakeholder worldviews and provide an overview of the social science theory. Results for our study site are shown in Sect. 4.
The goal of this paper is to gain insights into the potential for human action on drought, and one suggested way to do this is to study a particular water system in detail (Sivapalan et al., 2012). As such, the PDAI is developed and demonstrated for the Arbuckle-Simpson Aquifer (ASA), a groundwater resource that underlies an area of about 520 square miles (1350 km2) in south-central Oklahoma. This area is part of Oklahoma Climate Division 8 (Karl and Koss, 1984), which is one of the 344 climate divisions that the United States is divided into for reporting purposes, based on climate as well as several other considerations (Guttman and Quayle, 1996). The ASA provides water for municipal supply, ranching, and mining and is also the source of local springs and streams that support wildlife, recreation, and tourism. Drought is part of the region's history (Silvis et al., 2014), and the ASA is recharged by rainfall, thus making it susceptible to climate variability and change. The ASA has been the center of a water management dispute that arose in 2002 when landowners began negotiations to sell their groundwater to an area outside of the ASA, near Oklahoma City. The landowners' actions were quickly contested by a local environmental group, the Citizens for the Protection of the Arbuckle-Simpson Aquifer (CPASA; Shriver and Peaden, 2009; Lazrus, 2016), which led to a moratorium in 2003 that suspended any activities to remove water from the basin until a hydrological study could be conducted. The study included a water balance, hydrogeological study, and groundwater model of the aquifer; the study shows that although water is extracted, groundwater use from the aquifer is relatively small and that the groundwater-fed streamflow discharge is mostly related to rainfall recharge (Christenson et al., 2011). This was followed by a ruling that reduced the amount of water that could be removed from the aquifer annually by an order of magnitude. This further exacerbated the tensions between (i) the landowners who see the decision as an encroachment on their individual property rights and (ii) CPASA and other community members who see the reduction as a way to protect local water resources (Lazrus, 2016). The ASA's susceptibility to drought, as well as its diverse community and contentious management issues, makes it an ideal site for exploring the potential for feedback on drought.
In this paper, we explicitly combine hydrological and societal perspectives, but historically these two perspectives would likely be examined in isolation. In fact, this work builds upon and extends two previous studies that focused on the same ASA case study but were disciplinary in nature: Lazrus (2016) and Towler and Lazrus (2016). Lazrus (2016) describes results of stakeholder interviews collected for the ASA; it offers an anthropological perspective, examining how stakeholders perceive drought and how those perceptions intersect with their cultural processes. Lazrus (2016) was motivated by the hydrological context of the ASA but did not engage directly with any quantitative meteorological or hydrological analysis. On the other hand, Towler and Lazrus (2016) take a hydrological perspective, developing a generalized framework that links meteorological drought indices with hydrologic threshold exceedances that are relevant to ASA stakeholders. To identify some of the hydrological thresholds and provide social context, Towler and Lazrus (2016) draw on qualitative insights gathered from the interviews but do not directly incorporate any of the quantitative interview results into the analysis. In this paper, we extend these two studies to offer a novel, quantitative, interdisciplinary approach, which results in a derivative product, adding value to the preceding studies. Although the PDAI is experimental, conducting this type of study is critical, given the grand challenge of engaging in interdisciplinary research at the climate–water–society interface (McNeeley et al., 2011).
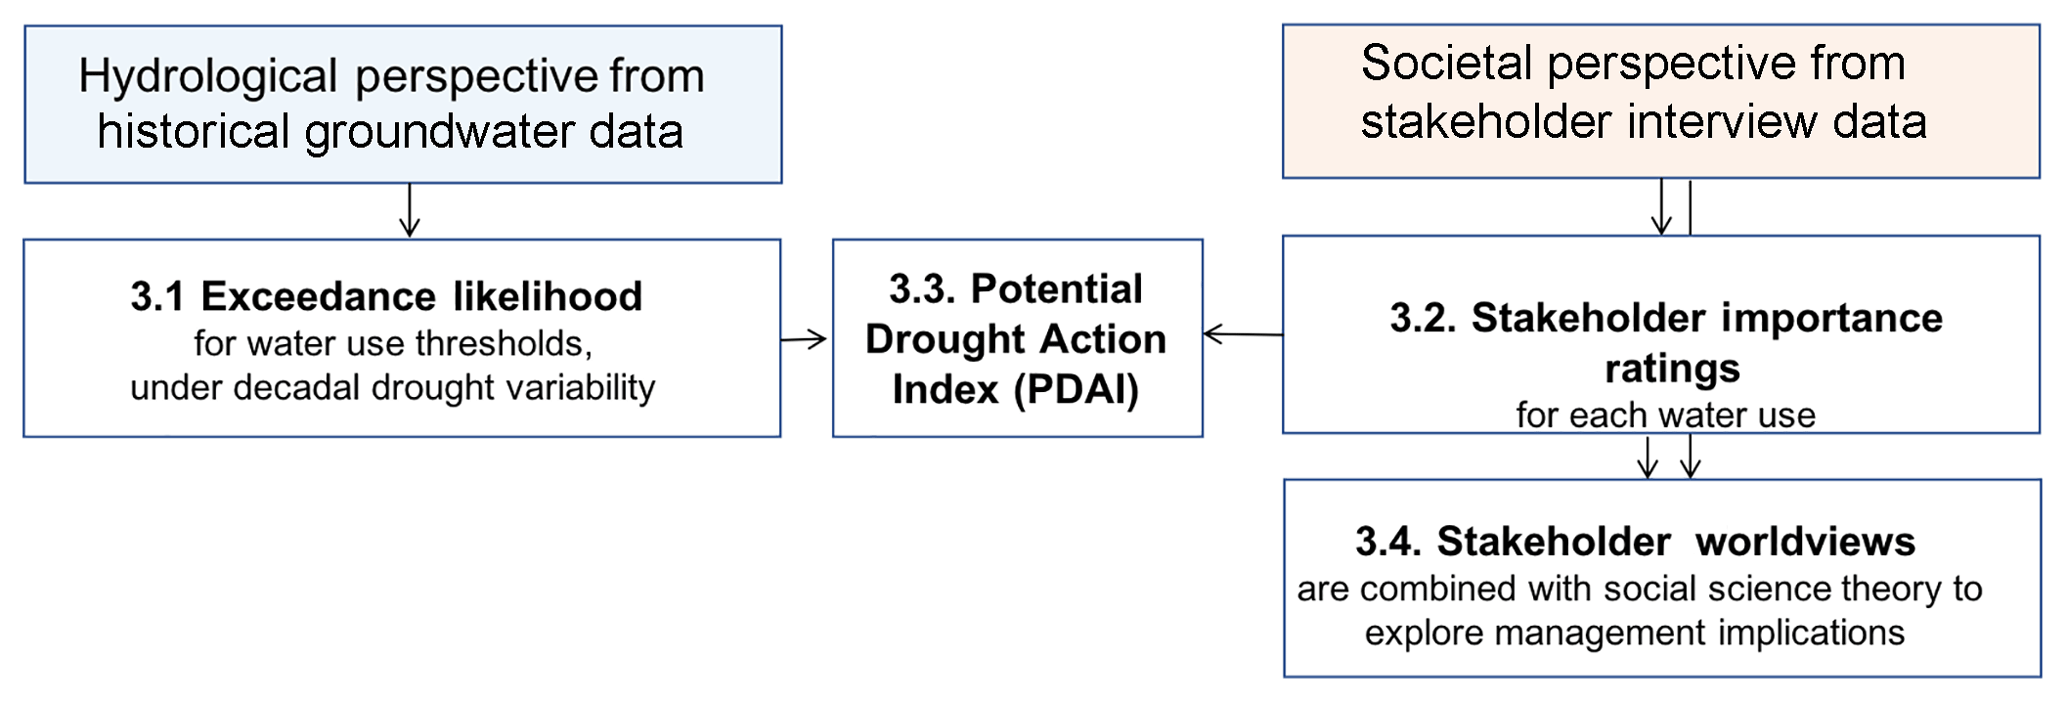
Figure 1Conceptual overview of the methodology that combines a hydrological perspective from historical groundwater data with a societal perspective from stakeholder interview data to quantify the Potential Drought Action Indicator (PDAI); stakeholder worldviews from the interviews and social science theory are used to explore management implications.
Figure 1 provides the conceptual overview of the study methodology, which is detailed in the subsequent sections.
3.1 Hydrologic perspective: threshold exceedance
To characterize natural influences on drought, we examine drought from a hydrological perspective. Taking a hydrological, rather than meteorological, perspective is advocated by Van Loon et al. (2016b), given the closer connection of surface water and groundwater with societal use and management. Here, we use a groundwater (GW) well that has relevance to the community (Towler and Lazrus, 2016), has a long available record, and is monitored by water managers in the community: the USGS Fittstown well (USGS 343457096404501). We use data from the beginning of the GW monitoring record through the year the interviews were conducted, which corresponds to 1959–2012. Details of this dataset can be found in Towler and Lazrus (2016).
To connect the hydrologic perspective with human action, we examine the historical groundwater data in terms of decision-relevant thresholds (Jones, 2001). From Towler and Lazrus (2016), we identify two main thresholds relevant to water uses asked about in the interviews (see Sect. 3.2). The first threshold is called a “moderate” threshold: this is a groundwater level of 111 ft (33.8 m) below the surface, which is decision relevant because it is when the aquifer begins to be closely monitored because of potential impacts to municipal supply. The second threshold is the “severe” threshold: this is when the groundwater level lowers further, to 117 ft (35.7 m) below the surface, which is the level at which artesian springs in the area have minimal flow or stop flowing altogether, affecting uses such as wildlife and recreation. For illustrative purposes, we also look at an “extreme” threshold of groundwater levels to 120 ft (36.6 m) below the surface, which have been experienced in the aquifer and further the likelihood of minimal or stopped spring flows (see Fig. 2 in Towler and Lazrus, 2016).
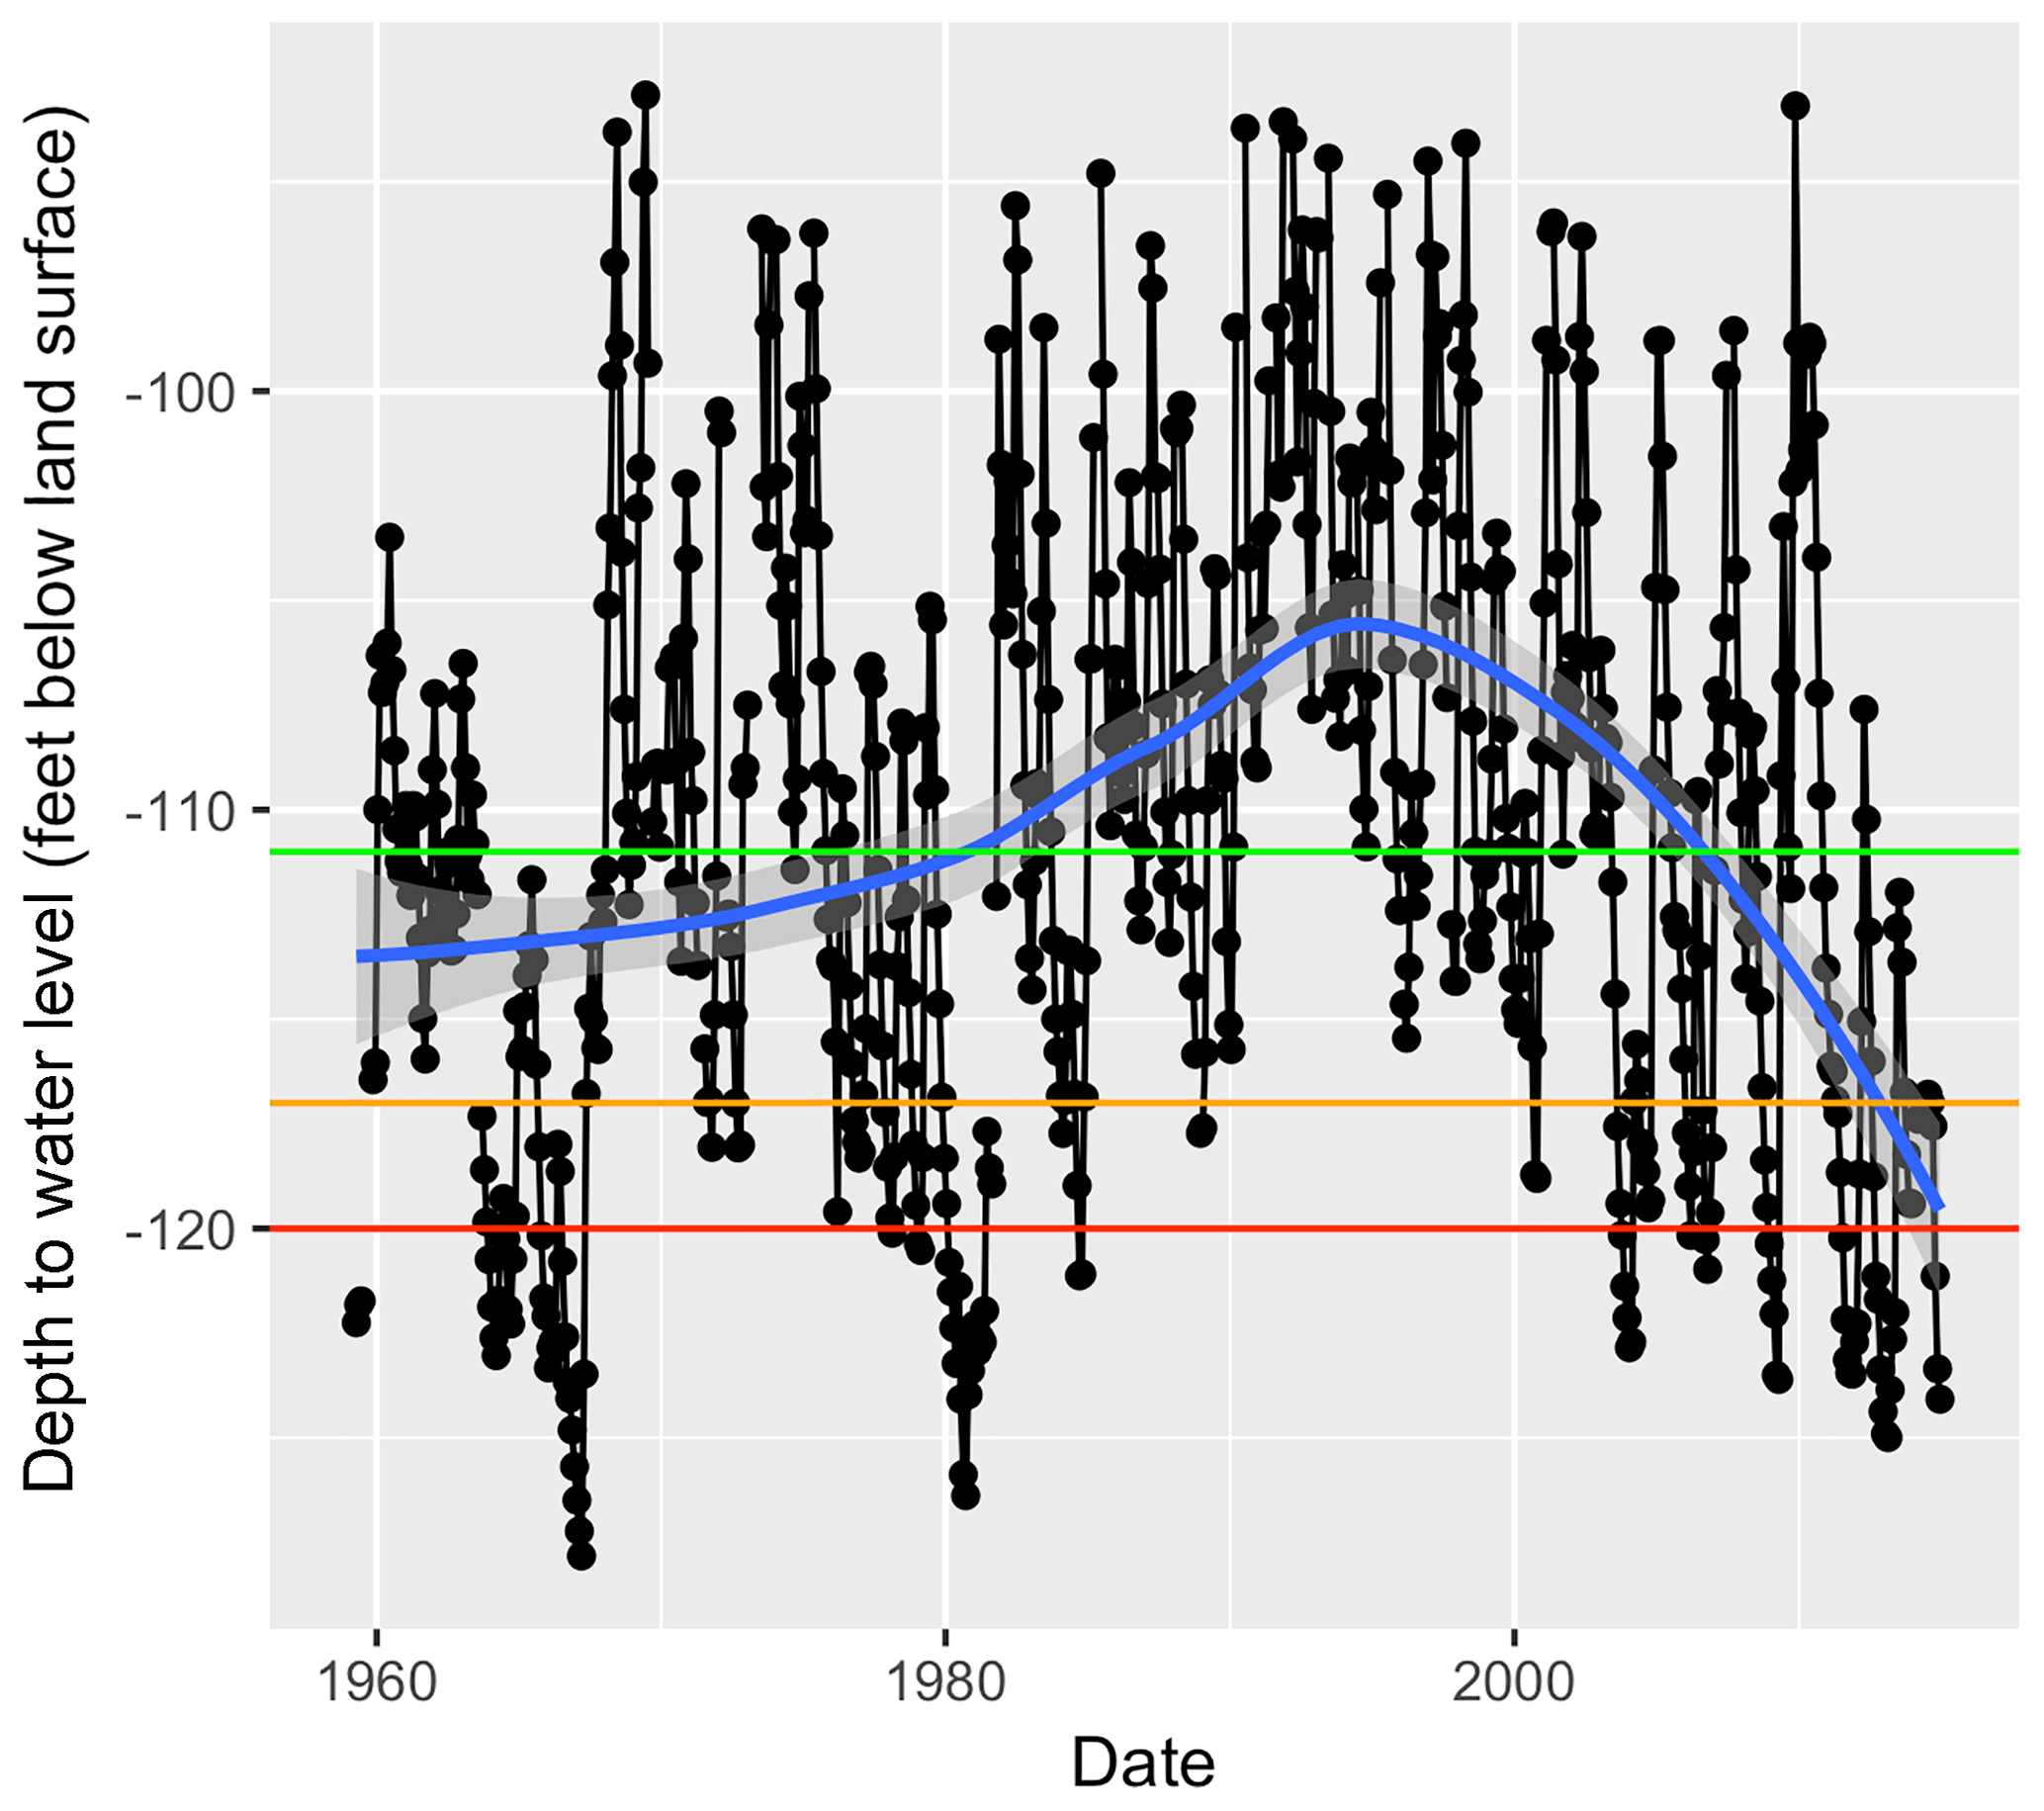
Figure 2Monthly groundwater time series; blue line is a local smoother average, green line is the moderate threshold ( ft/33.8 m), and the orange line is the severe threshold ( ft/35.7 m); the red line is an extreme threshold ( ft/36.6 m) that is used to illustrate a possible new normal drought threshold.
To quantify the threshold exceedance, we calculate the percent frequency of exceedance1 for each threshold in the historical record. To calculate the exceedance frequency, a time window needs to be selected; we initially examined 5-,10-,15-, and 20-year windows. Specifically, we calculate the number of months during each x-year running window that the threshold was exceeded across the available record. For example, for the 10-year window, it would be 1959–1968, 1960–1969, etc., all the way to 2003–2012. Henceforth, we refer to this as the groundwater drought likelihood. For the analysis, we look at the three most recent decades (i.e., 1983–1992, 1993–2002, and 2003–2012), as well as the highest, median, and lowest decades in terms of the groundwater drought likelihood.
We also calculate the Pearson correlation coefficient (r) values between the decadal likelihoods and several drought indices for the area. Specifically, we correlate the decadal likelihoods with 10-year running averages of several drought indicators from different categories. As a measure of agricultural drought, we use the well-known Palmer Drought Severity Index (PDSI; Palmer, 1965) that is based on a water balance of precipitation, soil moisture, potential evapotranspiration, and runoff. We also look at the Standardized Precipitation Index (SP), which only considers the effect of precipitation variability on drought (McKee et al., 1993). The SP can be calculated to consider different timescales: for example, the 1-month SP (SP01) considers short-term conditions, and the 24-month SP (SP24) considers longer-term conditions (i.e., precipitation from the last 2 years). We use the 6-month SP (SP06). To measure hydrological drought, we use the Palmer Hydrological Drought Index (PDHI; Palmer, 1965), which is a modification of the original PDSI to account for longer-term dryness that affects water storage, streamflow, and groundwater. NOAA's National Climatic Data Center provides these historical data for United States climate divisions; we downloaded monthly data from 1959 to 2012 for Oklahoma Climate Division 8 from http://www7.ncdc.noaa.gov/CDO/CDODivisionalSelect.jsp (last access: 22 August 2018).
3.2 Social perspective: stakeholder importance ratings
To understand how community members in the ASA region might respond to natural influences on drought, we use stakeholder interview data from a previous investigation (Lazrus, 2016). Stakeholder interviews (n=38) were conducted in the summer of 2012, following a significant drought in 2011. Interviewee selection followed a targeted snowball sampling strategy whereby interviewees were selected based on their involvement in the ASA water management negotiations, their dependence on or engagement with water resources – for example, in ranching or recreation operations – and recommendations from other interviewees.
For this study, we examined the following question: how do people perceive the importance of water for various uses? We make the assumption that the more important water is perceived to be for a particular use, the greater the potential will be for taking action – in this case, conserving water for that use.
To understand the importance of water for various uses, interviewees were asked how important (on a Likert scale of 1–5, with 5 being very important) water resources are in their community for (a) people's livelihoods, (b) recreational activities, (c) spiritual fulfillment, (d) cultural practices, (e) habitat for plants and animals, and (f) availability of drinking water. Data from these questions were used directly and called “importance ratings”, which were integrated into the PDAI (see Sect. 3.3).
3.3 Creating the Potential Drought Action Indicator (PDAI)
We express the PDAI as a function, f, of (i) the decadal probability (P) of the groundwater level, Z, exceeding the hydrologic threshold, z, and (ii) the importance ratings (I):
Here, we define f as the product (i.e., multiplication) of the two explanatory terms:
The multiplication of two terms to create a new indicator is based on a frequently used definition of risk, which combines the likelihood of an event and its consequence (Jones and Preston, 2011). However, we point out that the form of f is flexible; e.g., it could be additive.
Here, P(Z < z) is the decadal likelihood of exceeding a particular threshold (e.g., moderate or severe), as per Sect. 3.2. This is multiplied by the importance of water for a particular use, which is directly derived from the stakeholder ratings (Sect. 3.1). Essentially, the importance ratings are used as a weight function to modulate the likelihood of exceedance. In this definition, a lower PDAI equates to less potential for action and higher PDAI indicates greater likelihood of action. The PDAI was calculated for all six of the water uses asked about in Sect. 3.2.
3.4 Social perspective: stakeholder worldviews
We are also interested in exploring why people perceive the importance of water for various uses differently. For this, we again interrogate the interview data using a social science theory called the cultural theory of risk (CTR; Douglas, 1966; McNeeley and Lazrus, 2014). According to the CTR, people hold different cultural worldviews about how society should be organized and how society and nature should interact. The CTR predicts that people will perceive risks and consequences from hazards when their worldview is challenged. According to this understanding, perceptions are as much about social organization as they are about the physical hazard. Their worldview will also guide their preference for different risk management strategies, or in this case drought actions, making it relevant to our PDAI results. Two of the worldviews described by the CTR are individualism and egalitarianism. These represent idealized categories and are useful heuristics, but in reality people may adhere to some elements of the cultural worldviews more than others. People with individualist views favor weak social bonds and have little need for social structure, preferring individual competition and market-based transaction strategies. For them, nature is a bountiful resource robust to human uses and therefore may not need to be managed for conservation. People with egalitarian views favor strong social bonds and collective decision-making processes. For them, nature is fragile and easily impacted by humans and so must be carefully managed to avoid catastrophe (Thompson et al., 1990). By identifying the cultural processes that lead people to recognize risks and perceive consequences, the CTR also helps to diagnose why disagreements arise over risk management; that is, disagreements may arise between constituent groups holding different worldviews when management strategies do not reflect elements of each constituent's predominant worldview (Verweij et al., 2006).
To this end, we examined how peoples' importance ratings from Sect. 3.2 were related to their worldviews. If so, it would help us to understand how the PDAI could be operationalized – that is, might people respond more favorably to water management strategies that reflected their own management preferences based on their cultural worldviews? For the CTR, interview questions about worldview used previously tested measures for individualism and egalitarianism developed by Smith and Leiserowitz (2014) as well as additional questions informed by the CTR that reflected the particular water management context of the ASA; all questions can be seen in Tables 1 and 2 of Lazrus (2016). These questions asked people whether they strongly agreed, agreed, neither agreed nor disagreed, disagreed, or strongly disagreed (on a five-point Likert scale) to a series of statements. Responses were summed for each interviewee to determine a value for individualism or egalitarianism. Follow-up open-ended questions allowed interviewees to elaborate on their worldview preferences and importance ratings.
4.1 Threshold exceedance likelihood
Figure 2 shows the historical monthly groundwater time series, including the moderate threshold (111 ft/33.8 m below the surface) and severe threshold (117 ft/35.7 m below the surface) introduced in Sect. 3.2. Groundwater drought likelihood is calculated as the number of months within each 5-,10-,15-, and 20-year running window that the level went below a particular threshold. Drought likelihoods for the selected time windows (5,10,15, and 20 years) are shown in Fig. 3. Results for each time window follow similar patterns, though as expected, the shorter the time window, the greater variability in the likelihood. We selected the 10-year running window for calculating the PDAI (e.g., Fig. 3b), as it strikes a balance between shorter time windows that have high variability (e.g., 5-year windows) and longer time windows (e.g., 15 and 20 years) where much of the variability is smoothed out. Figure 3b shows the decadal likelihood for the moderate and severe threshold. As expected, the higher the threshold, the higher the likelihood of exceedance (i.e., a moderate threshold is exceeded more often than the severe threshold). Further, the likelihoods are correlated (r=0.94) and significant at the 99 % confidence level. We also point out the very close association between the groundwater threshold exceedance likelihoods and selected drought indices for the region (i.e., Oklahoma south-central Climate Division 8): Table 1 shows that for meteorological (SP06), agricultural (PDSI), and hydrological (PDHI) drought indices, the correlation with the moderate threshold exceedance is > −0.9 and with the severe threshold it is >−0.8. This underscores the notion that for this case study, the hydrological perspective is a good indicator of the natural influences on drought. This is the case because water extraction in the area is relatively low and the groundwater levels are very closely related to rainfall recharge (Christenson et al., 2011). However, we note that this may not be the case for other groundwater aquifers that are more affected by human extraction (e.g., Tarhule and Bergey, 2006) or aquifers with different properties (e.g., slower hydrologic responses due to increased propagation times). This point is further discussed in the discussion (Sect. 4.5 “Future enhancements').
Table 1Correlation between select drought indices1 and the likelihood (P) of groundwater (GW) level going below moderate (Mod) and severe (Sev) thresholds.
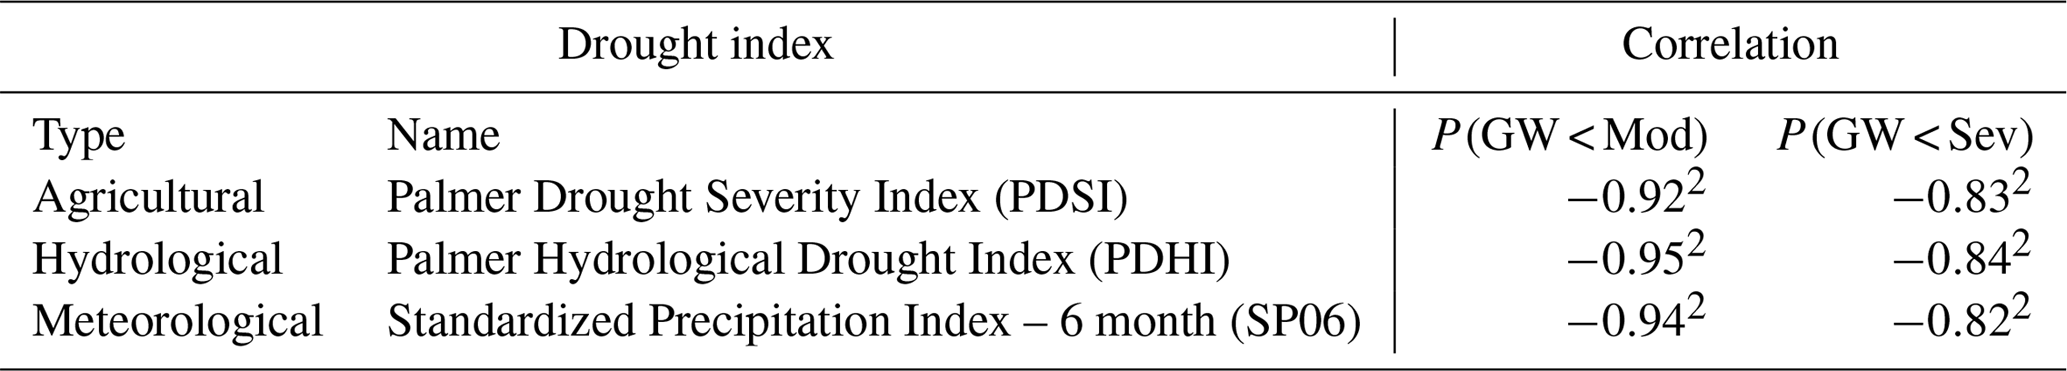
1 Drought indices for Oklahoma Climate Division 8 downloaded from http://www7.ncdc.noaa.gov/CDO/CDODivisionalSelect.jsp. 2 Significant at the 99th percentile.
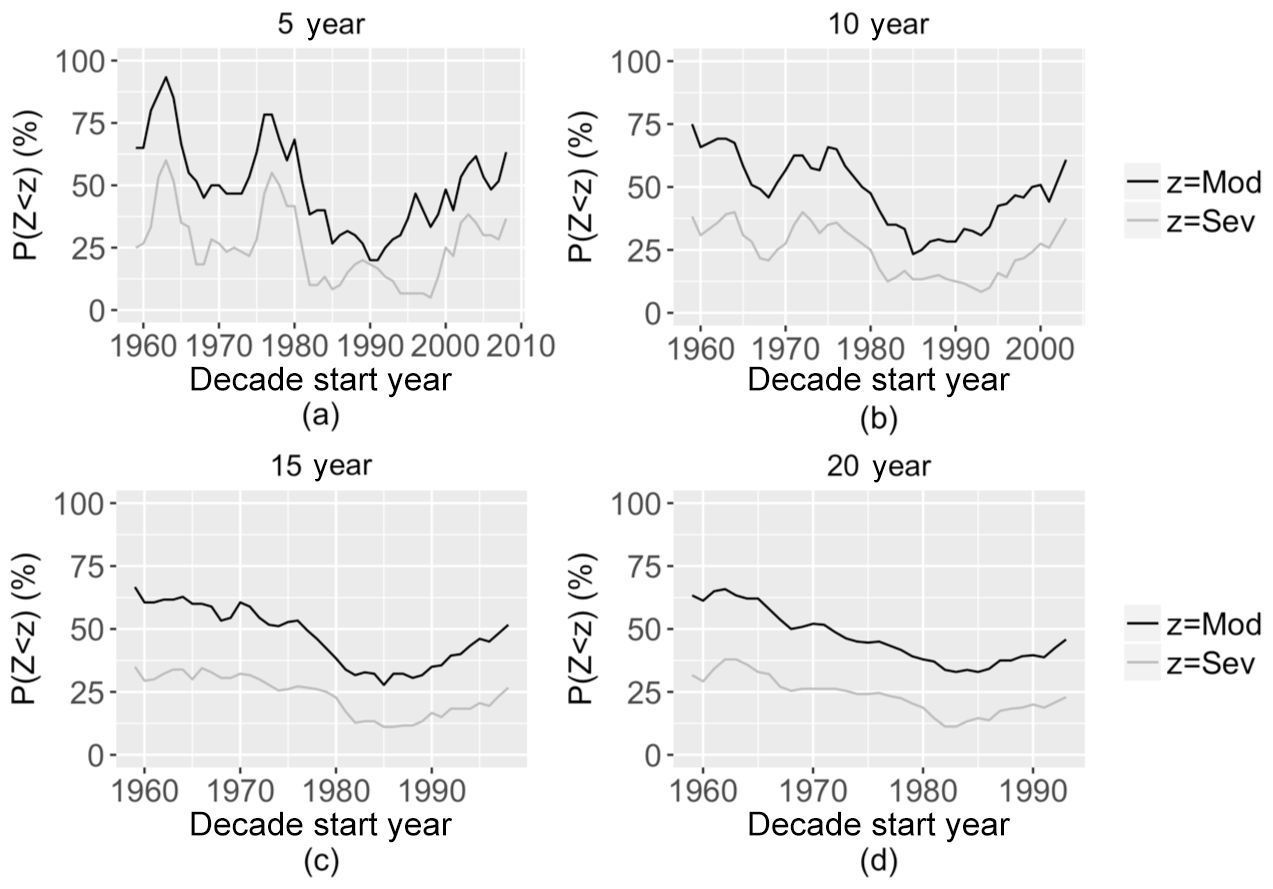
Figure 3Groundwater drought likelihood (P) of the depth to groundwater level (Z) going below the moderate (Mod, ft/33.8 m) and severe thresholds (Sev, ft/35.7 m) for time windows from 5 to 20 years.
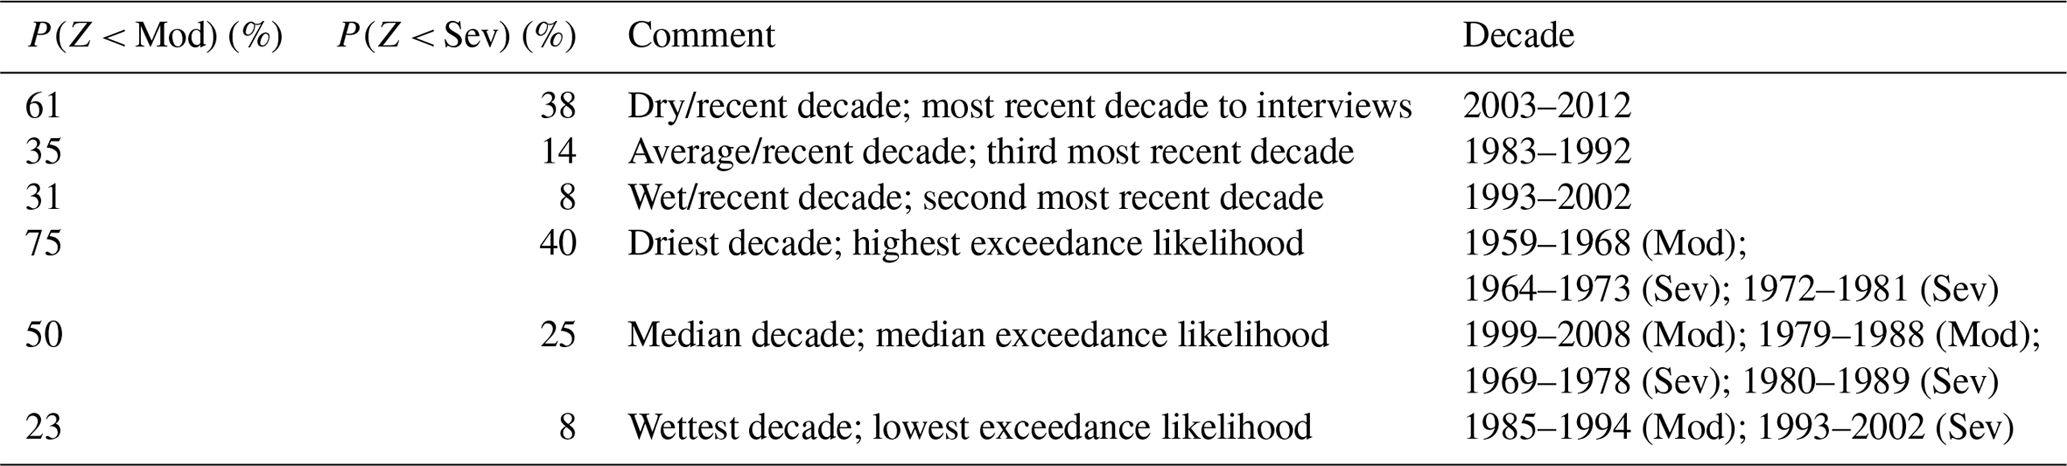
Table 2 shows the exceedance likelihoods of select decades from the historical record for both moderate and severe. First, we look at the three most recent decades (i.e., 1983–1992, 1993–2002, and 2003–2012), in which relatively wet, average, and dry conditions occurred. For 2003–2012, the moderate threshold was exceeded 61 % of the time, which we refer to as the “dry/recent” decade. In the next most recent decades, the exceedance likelihood decreased to 35 % (1983–1992) and 31 % (1993–2002), which we refer to as “average/recent” and “wet/recent” decades, respectively. To put this into context, for the moderate threshold, the decade with the lowest exceedance likelihood was 23 % (1985–1994), which we call the “wettest” decade, and the decade with the highest exceedance was 75 % (1959–1968), or the “driest” decade. Results follow similar patterns for the severe threshold (Table 2).
Table 2Decadal likelihood (P) of groundwater (Z) level going below moderate (Mod) and severe (Sev) thresholds for recent decades, as well as respective driest, median, and wettest decades.
4.2 Stakeholder importance ratings
Stakeholder interviews reveal that there is more consensus on the importance of water for some water uses than others (Fig. 4). On average, water was deemed most important for drinking water, followed closely by habitat for wildlife and supporting livelihoods. The importance of water for these uses was similar for most stakeholders interviewed, as is evident by the tightness of the box plot (Fig. 4). On the other hand, there was a spread in responses for recreation, cultural practices, and spiritual fulfillment. Some of the spread in responses on these measures may be due to how interviewees interpreted the water uses (Lazrus, 2016).
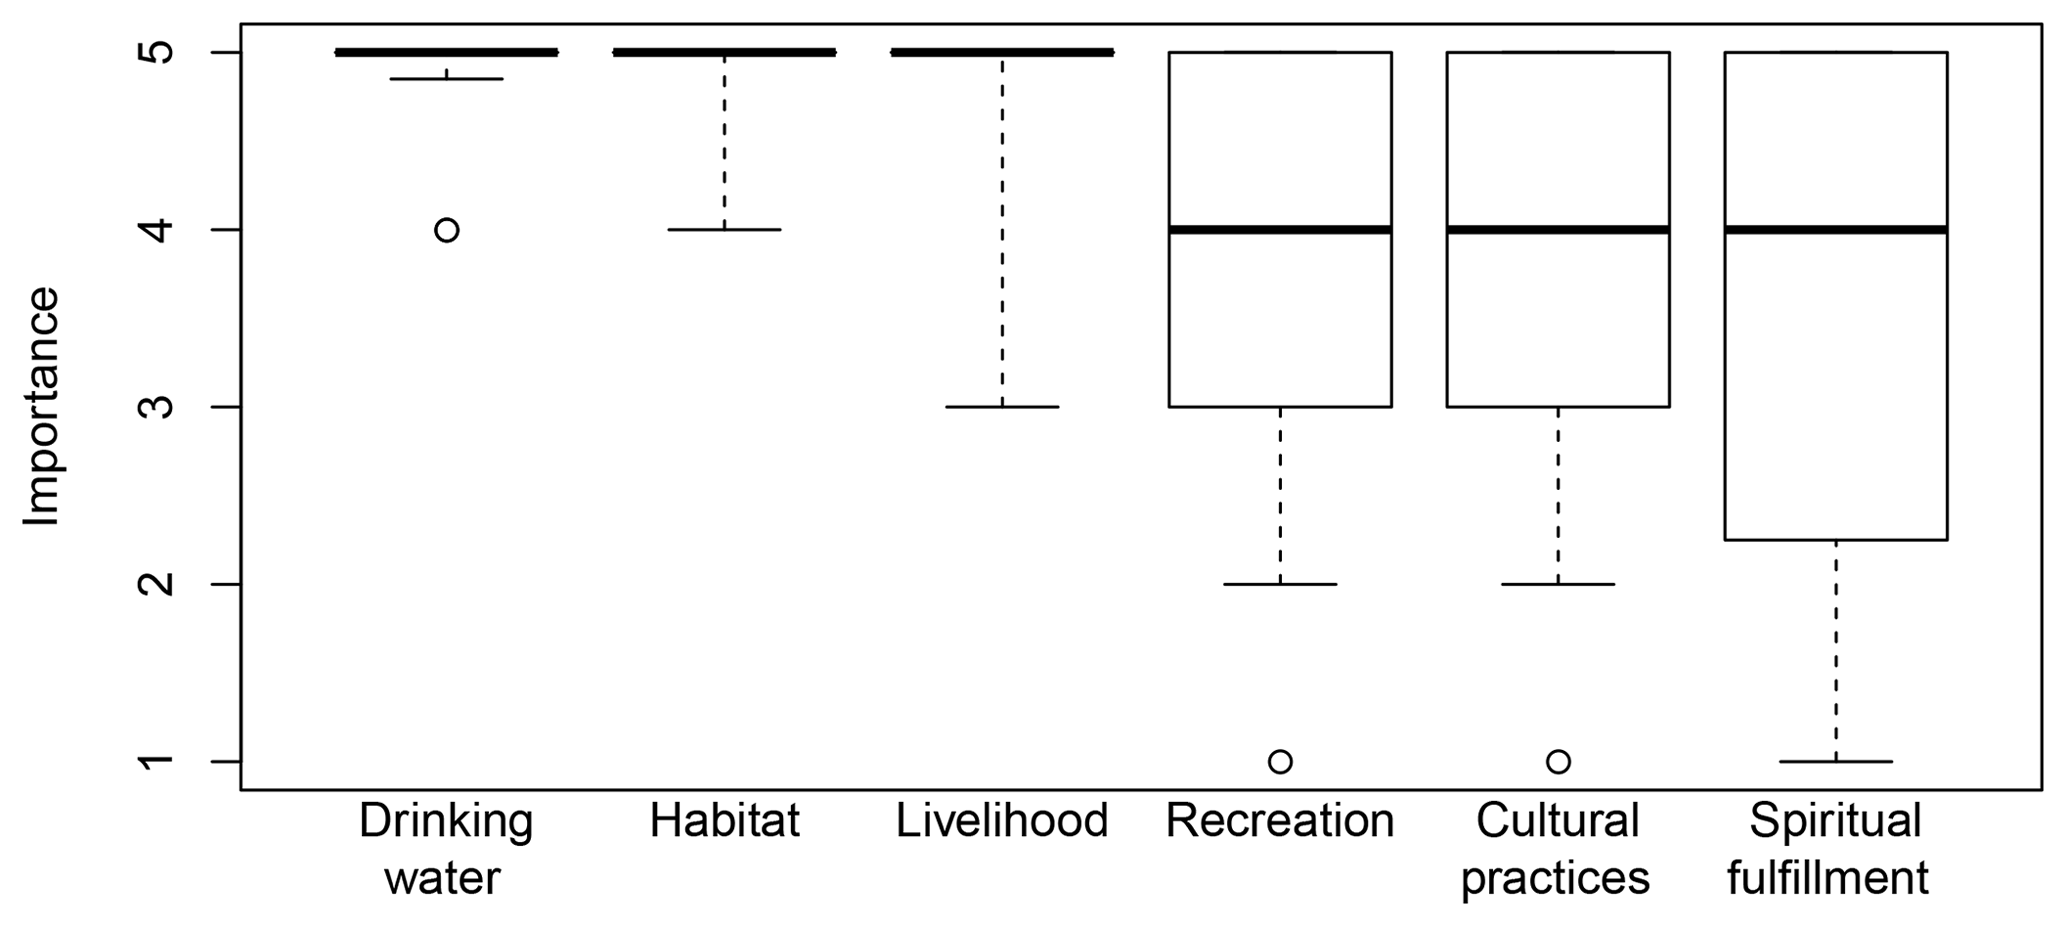
Figure 4Rated importance of water for each water use from stakeholder surveys (N=38) on a Likert scale of 1–5, with 5 being very important. Responses are shown as box plots, where the box represents the 25th and 75th percentile, the line is the median, and the whiskers are the 5th and 95th percentile. Outliers are shown as points outside the box and whiskers.
The spread in responses indicates that different stakeholders place different levels of importance on some water uses, such as water for recreation which shows a broader spread than water for drinking water, habitat, or livelihood. For example, one interviewee underscored the importance of water, describing that “Murray County is one of the top tourist attractions with Arbuckle Lake and Chickasaw National Recreation Area. So water is the absolute key” (Interview 1). Demonstrating a very different perspective, another interviewee noted that “Recreation and water are not critical to me. I mean in this part of the world, they do not necessarily go hand in hand because it's a relatively dry place, and there are not that many places to really go and play in the water” (Interview 5).
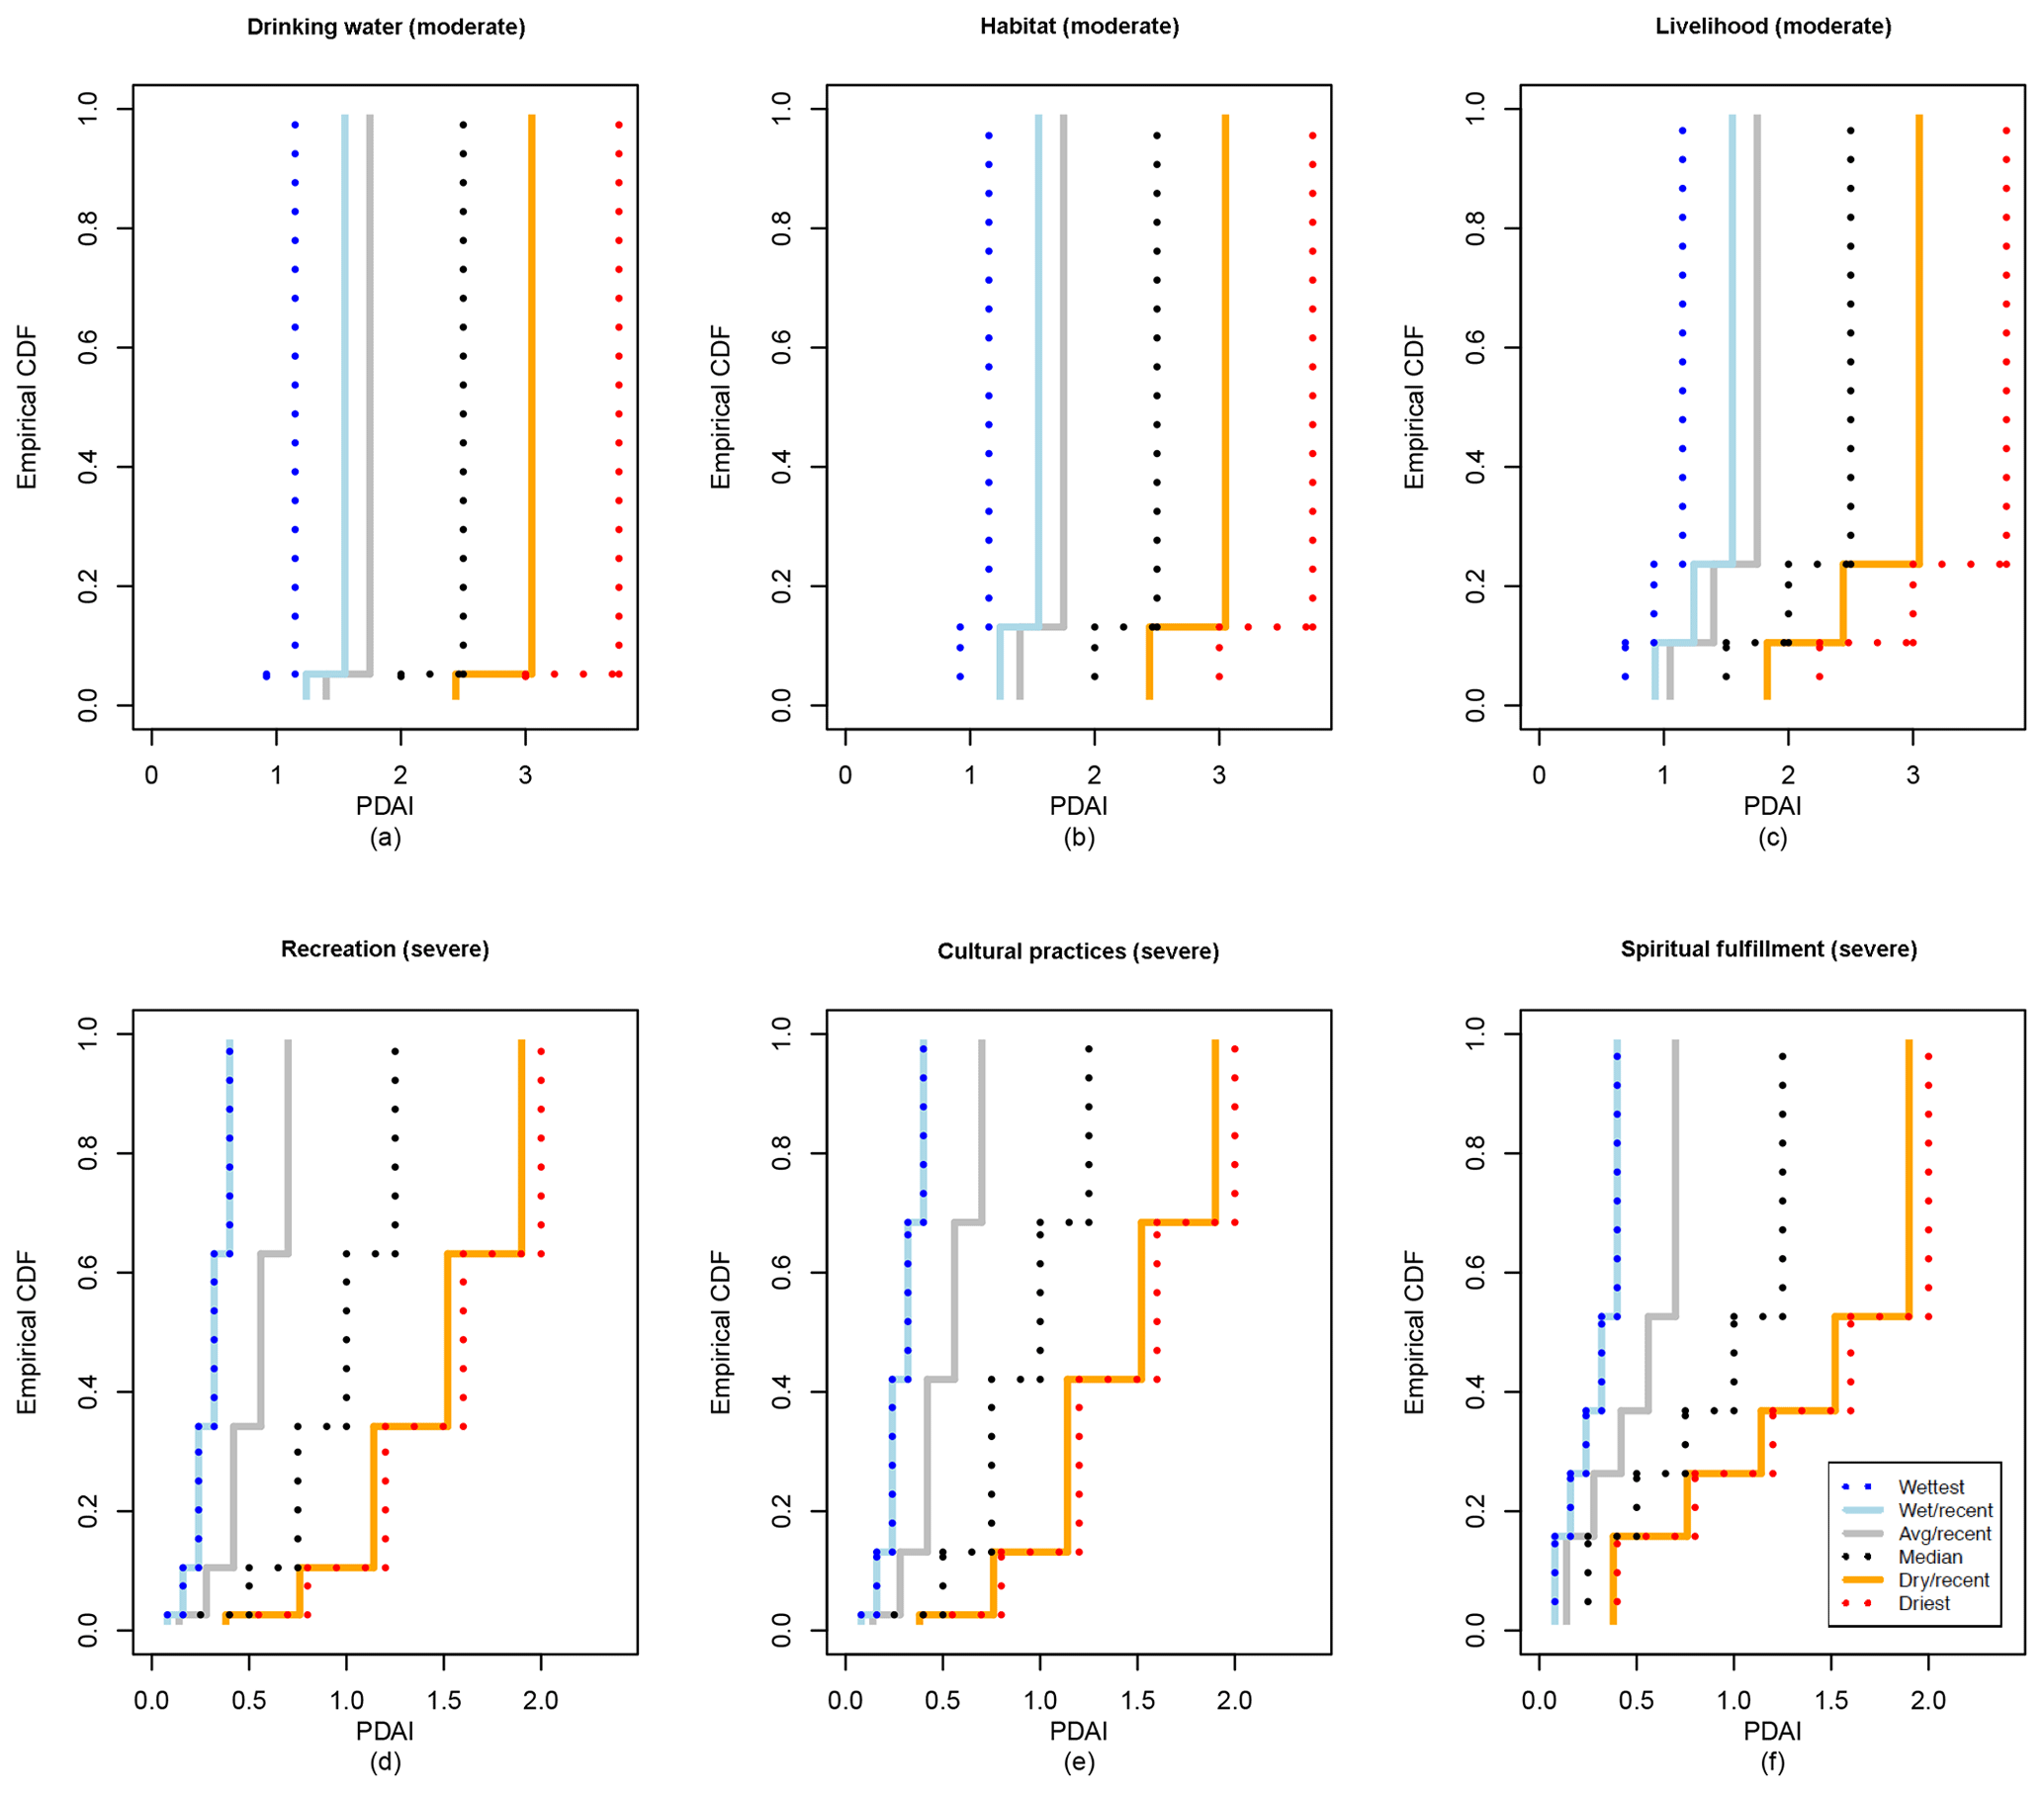
Figure 5Empirical cumulative density functions (eCDFs) for the PDAI (Potential Drought Action Indicator) for water uses using the moderate threshold (a–c) and for water uses using the severe threshold (d–f), under the wettest, wet/recent, average/recent, median, dry/recent, and driest historical decades.
4.3 Potential Drought Action Indicator (PDAI)
The PDAI is calculated for all of the water uses (Fig. 5). Here, the top row shows results for water uses using the moderate threshold (Fig. 5a–c) and the bottom row shows results for water uses using the severe threshold (Fig. 5d–f). Because the results across the rows are quite similar, we will focus on the results for drinking water (Fig. 5a) and then recreation (Fig. 5d).
First, we focus on drinking water, which is an example of a water use which exhibited more consensus among interviewees. For drinking water, to calculate the PDAI, we use the moderate threshold, since this is the threshold at which municipal supply is monitored (see Sect. 3.1). Figure 5a shows the PDAI for drinking water for the different drought conditions (e.g., wet/recent, dry/recent) from Table 2. Results are shown as empirical cumulative density functions (eCDFs) to reflect the discrete nature of the importance ratings. In the eCDFs, the vertical lines represent the PDAI values, and the horizontal lines represent the percentage of data that are equal to or less than that value. In Fig. 5a, as the eCDF moves across drought conditions from wettest to driest, the PDAI shifts towards higher values, reflecting the increased potential for action under drier conditions. Specifically, the wettest decade has an average PDAI value of 1.1, and the driest decade has an average PDAI value of 3.7. Given the stakeholder consensus on the importance for drinking water, for each drought condition there is very little range – that is, the eCDFs are fairly vertical. Results are similar when the moderate threshold is used for the other two water uses, habitat and livelihood, that showed strong consensus (Fig. 5b and c).
Next, we focus on the PDAI for recreation, a water use that shows diverse importance ratings from stakeholders (Fig. 5d). For recreation, to calculate the PDAI, we use the severe threshold, since that is the threshold at which artesian springs have minimal flow or no longer flow (see Sect. 3.1). Figure 5d shows the PDAI for recreation for the select decadal drought conditions, using the severe threshold likelihoods from Table 2. Similar to drinking water, we see that as we move from wetter to drier decades, the PDAI also increases; for example, from wet/recent to dry/recent, the average PDAI values are 0.3 and 1.5, respectively. However, given the stakeholder diversity in importance ratings, as we move towards drier conditions, the PDAI becomes more diffuse, spanning a great range of values: in the wet/recent, the PDAI spans from 0.08 to 0.4, or for 0.32 units of the PDAI scale, and in the dry/recent decade it spans from 0.4 to 1.9, or 1.5 units on the PDAI scale, indicating a wide range in stakeholder appetite for potential action. Interestingly, the wet/recent decade (1993–2002) was also the wettest decade on record, with the groundwater threshold only being exceeded 8 % of the time. Results are similar when the severe threshold is used for the other two water uses that showed diverse ratings, i.e., cultural practices and spiritual fulfillment (Fig. 5e and f).
In Fig. 6, we also looked at recreation under the possibility of a new “normal” drought baseline (Van Loon, 2016b). It has been suggested that human adaptation to new drought normals can be illustrated by changing thresholds (Vidal et al., 2012; Wanders et al., 2015); here, we show how this could influence the PDAI. To this end, we look at a more extreme threshold that has been identified for recreation (i.e., GW levels below 120 ft/36.6 m; see Sect. 3.1) under the dry/recent period: the eCDF curve shifts back to the left, towards lower action potential, with an average PDAI of 0.9, reflecting this new normal. This is relevant given climate change projections that suggest that the ASA will likely become drier in the future (Towler et al., 2016; Liu et al., 2012).
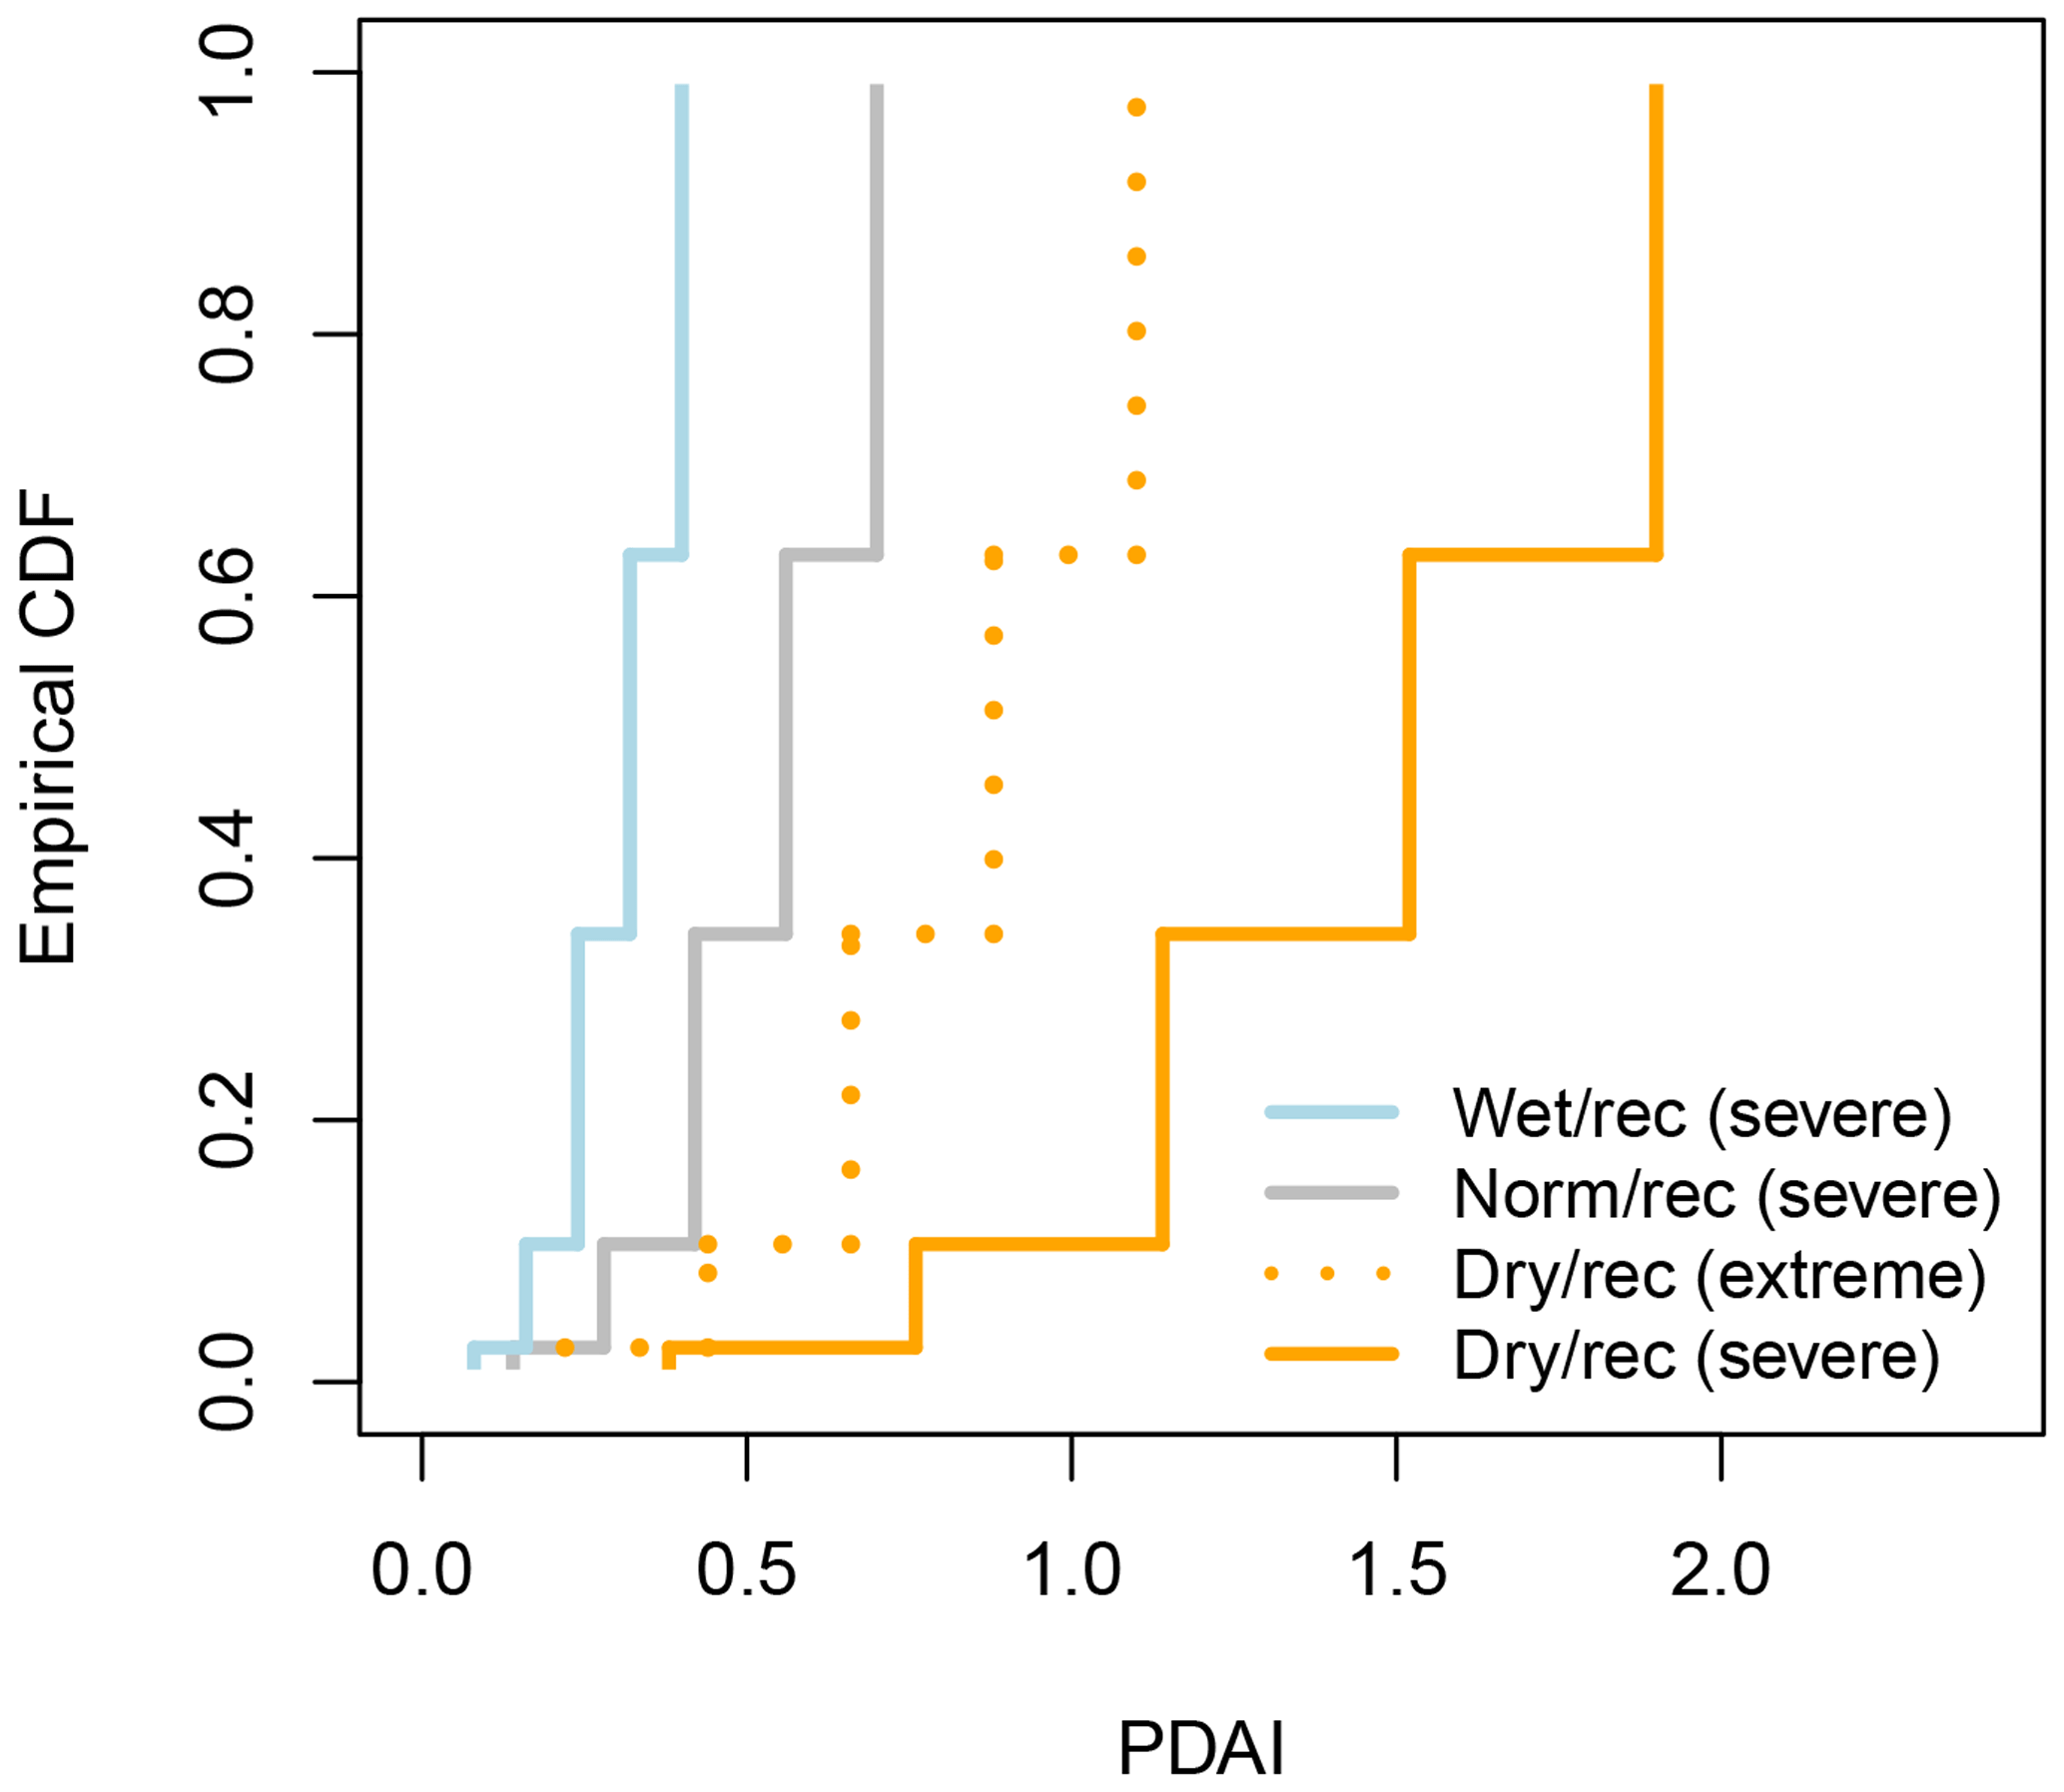
Figure 6Empirical cumulative density functions (eCDFs) for the PDAI (Potential Drought Action Indicator) for recreation under the wet/recent (1993–2002), normal/recent (1983–1992), and dry/recent (2003–2012) decade for the severe threshold, as well as the dry/recent decade for the extreme threshold.
Finally, in Fig. 7, we narrow our focus to the most recent decade (i.e., dry/recent, 2003–2012) and compare both drinking water and recreation with the moderate and severe thresholds, respectively. From Fig. 7, we see that drinking water has a higher action potential than recreation: the average PDAI for drinking water is 3, while it is about 1.5 for recreation. This is an artifact of the thresholds selected for each respective water use (i.e., moderate for drinking water and severe for recreation). This makes sense from a human standpoint, since drinking water is a primary consumptive use, and recreation is a more discretionary use. However, this could be more subjective for other water uses (e.g., spiritual fulfillment). Although it may seem counterintuitive at first, we purposely pair the moderate threshold with the primary use to indicate this hierarchy, but this does not mean that exceedance of the severe threshold would not also prompt action (or further action) to ensure adequate drinking water supplies. However, it does make the assumption that for a more discretionary use, like recreation, action would not be prompted until this severe threshold was exceeded.
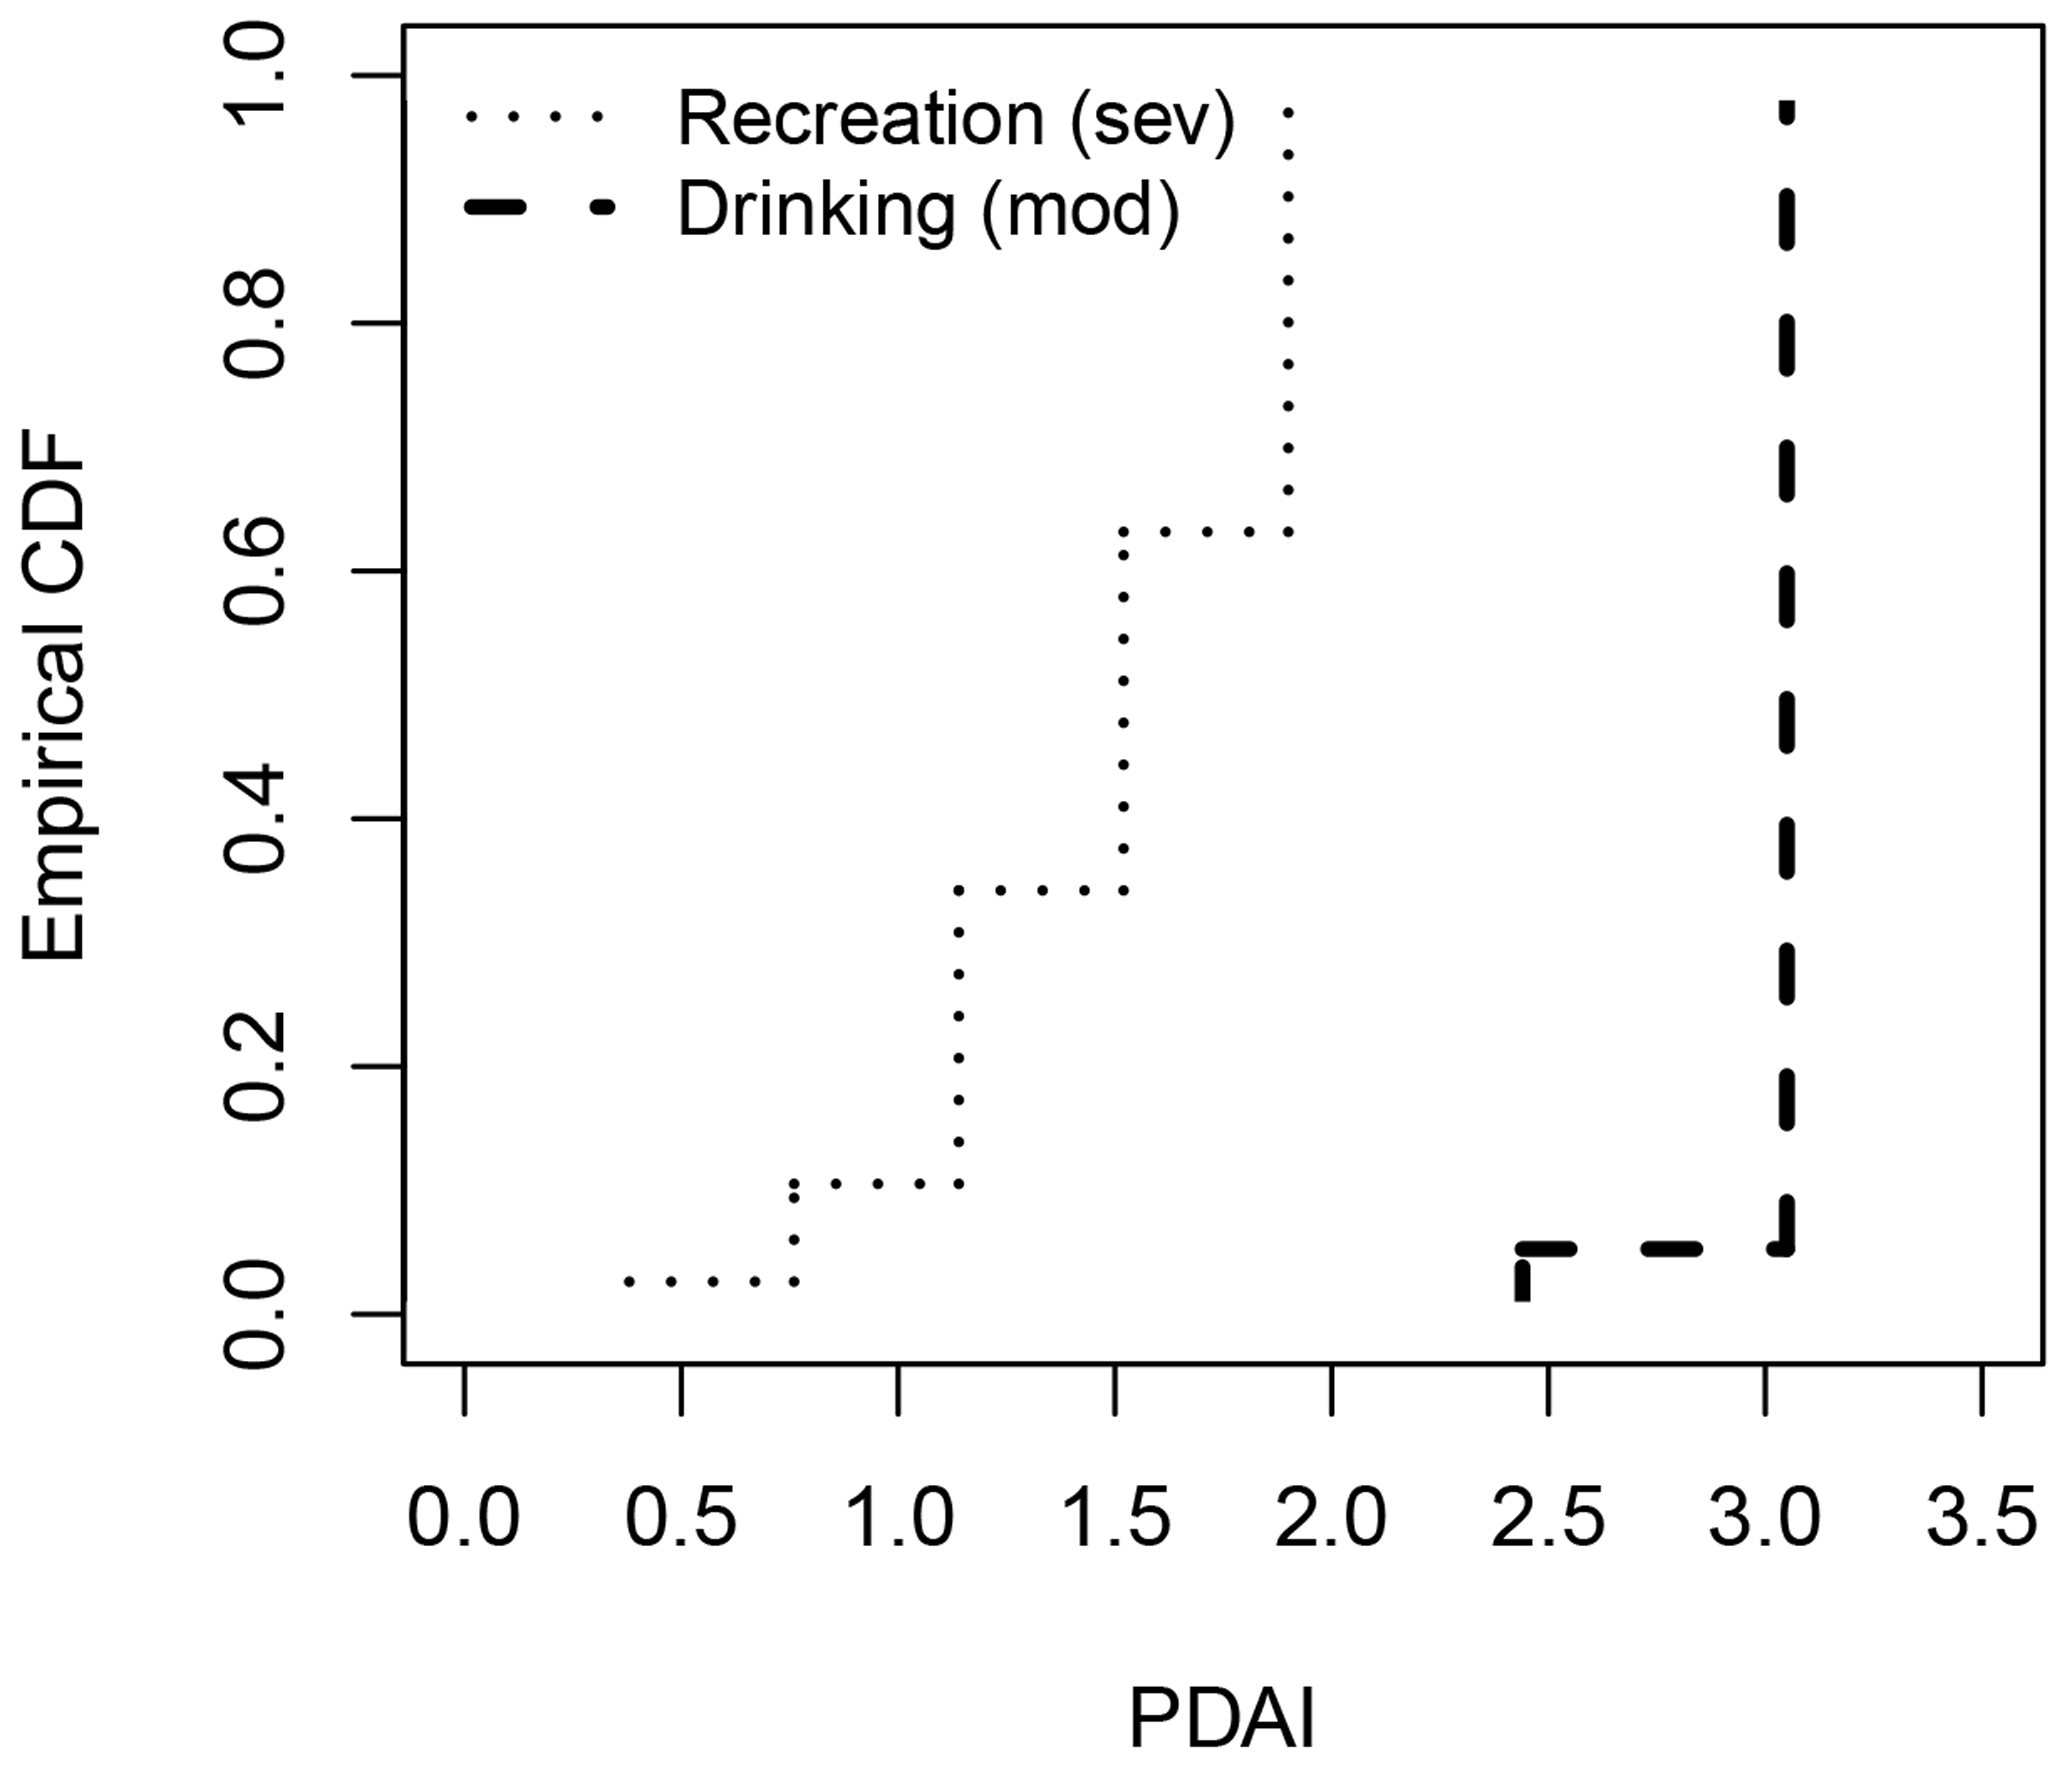
Figure 7Empirical cumulative density functions (eCDFs) for the PDAI (Potential Drought Action Indicator) for recreation using the severe (Sev) threshold and for drinking water using the moderate (Mod) threshold for the dry/recent decade (2003–2012).
Another key point from Fig. 7 is that drinking water spans a smaller range on the PDAI scale than recreation, which is more diffuse. Specifically, for drinking water, the eCDF only falls between 2.4 and 3.5; this is due to the agreement across respondents on the importance of water to this use (i.e., Fig. 4). On the other hand, the recreation PDAI eCDF covers a larger range of values – here it spans from 0.4 to 1.9, similarly reflecting the range of stakeholder responses. This shows that for water uses where values are diverse, the appetite for potential action will be diverse as well.
In summary, the key points from these results: the PDAI increases with (1) drier decadal drought conditions and (2) water use thresholds that are exceeded more often. Further, it shows that for water uses where perceived importance is diverse among stakeholders, the PDAI will be diverse as well, and this is exacerbated under drier conditions.
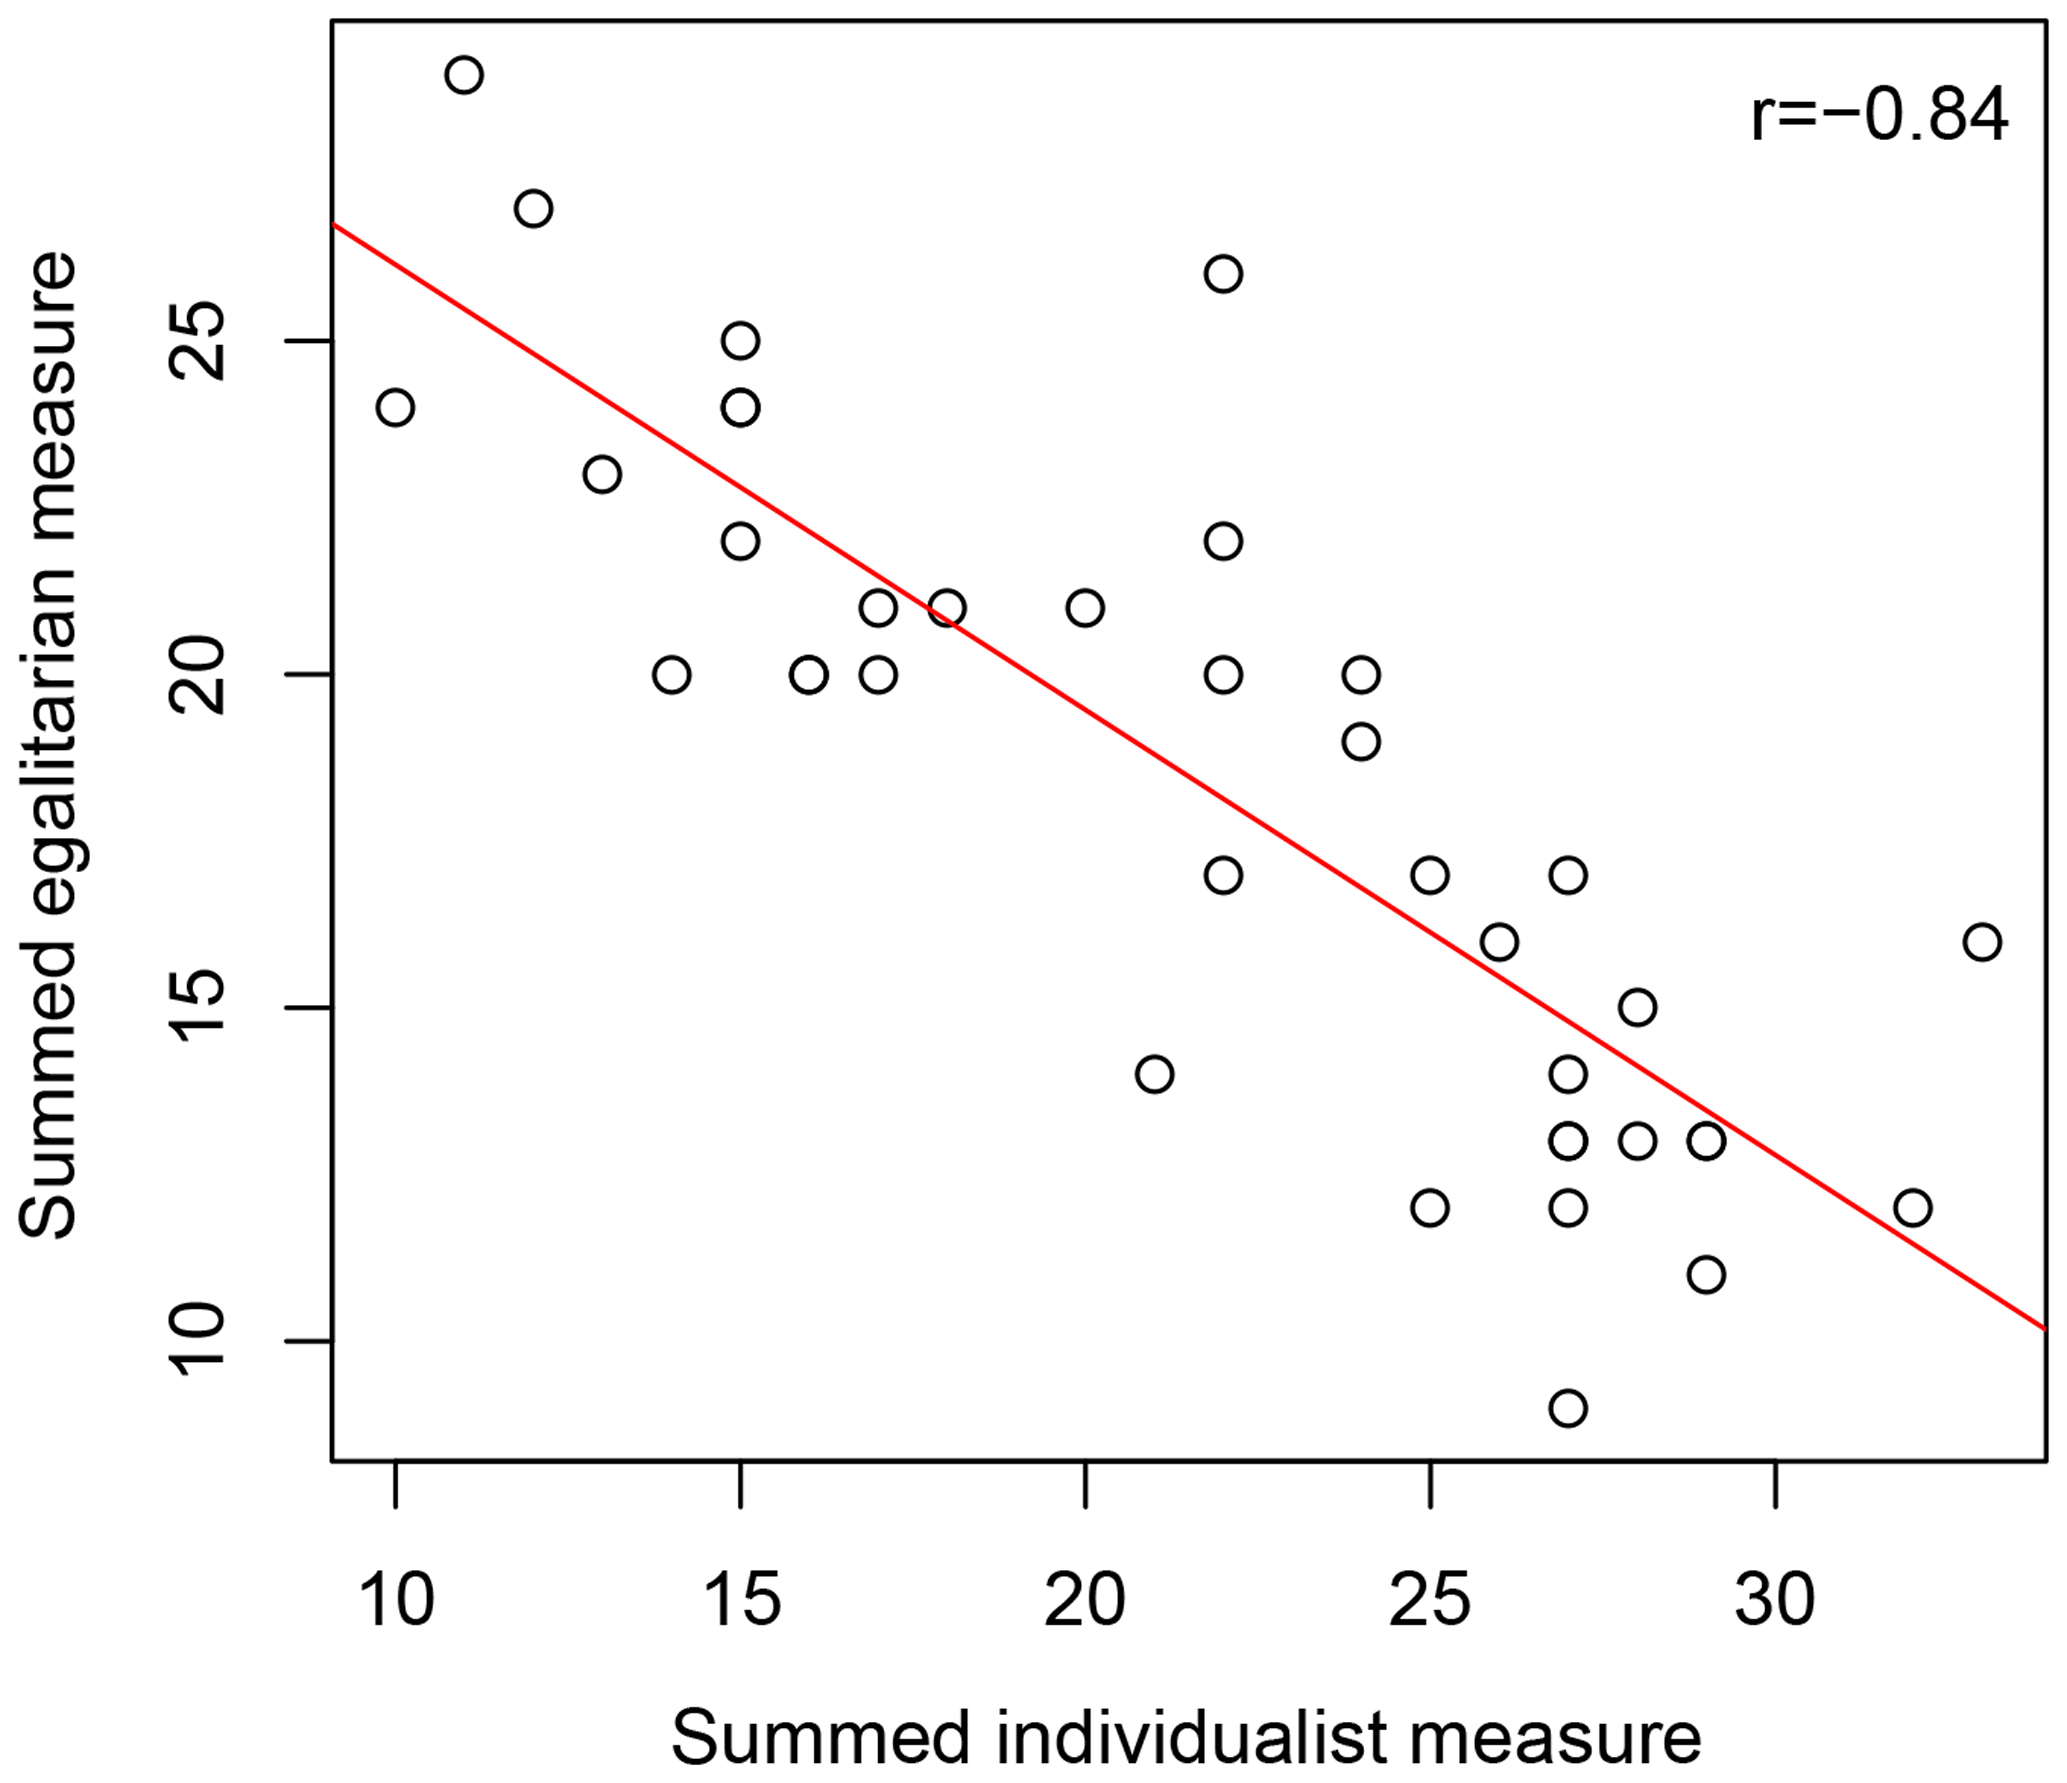
Figure 8Summed responses for individualism versus egalitarianism for each interviewee (n=38) show that both individualist and egalitarian worldviews were represented by the interviewees. The egalitarianism and individualism measures were strongly inversely correlated ().
4.4 Management implications based on worldviews
To understand the management implications, we need to look at the results alongside the CTR. Results from the CTR questions show that both individualist and egalitarian worldviews were represented by the interviewees (Fig. 8) and that some of the spread in the importance responses can be explained by worldview (Table 3). Although the correlations are relatively low, 8 out of 12 are statistically significant at the 90th percentile or higher. Further, the sign of each correlation coefficient is opposite between the egalitarianism and individualism measures, indicating that people holding each worldview have opposing importance ratings (Table 3). The water use that showed the highest correlation with worldview was recreation: r=0.45 for egalitarianism and r=0.40 for individualism. These correlations provide initial insight about the role of worldview in how people assess the importance of water and, by extension, their appetite for potential drought action.
Table 3Correlation and statistical significance of worldviews, as quantified by the egalitarian and individualist measures, with importance ratings for each water use.

1 Significant at the 90th percentile. 2 Significant at the 99th percentile.
Results from the CTR questions, along with the PDAI, point to some implications for water management policy. The CTR posits that disagreement over resource management strategies may arise among constituents with diverse worldviews for two reasons (McNeeley and Lazrus, 2014): first, as demonstrated in Table 3, worldviews explain some of the variance in how important people think that local water resources are for different activities – and thus presumably whether or not maintaining water for those activities should be prioritized by water management. For example, in recreation, because of the large spread in importance ratings, which can partially be explained by the CTR, there is an increase in the PDAI categories from the wet/recent to average/recent to dry/recent decades; this implies that people will disagree on whether or not water should be managed for recreation, potentially leading to disagreements that could hinder sustainable water management. The second reason is how water should be managed, even when people agree on its importance. In drinking water, there is consensus on importance – even among people with different worldviews – presumably indicating that people agree that water needs to be managed for drinking water. However, because of the different worldviews, there is still potential for disagreement over how it should be managed. That is, those with egalitarian preferences advocate for management that is collectively debated, implemented, and enforced, whereas those with individualist preferences favor management that is individually enacted and market-based. We see this in our qualitative data: for example, one interviewee with individualist preferences said, “we have to have a set of rules that everyone understands. And once those rules are set you cannot have a bunch of water Nazis trying to make judgment calls about how someone's using their water. So, if I can use a certain amount – tell me what that amount is, and then stay the hell out of my business” (Interview 2). The finding shows that disagreement is not solely due to threats to water resources – such as more frequent drought – but rather that it can also arise from disagreement about the strategies designed to manage water and address drought.
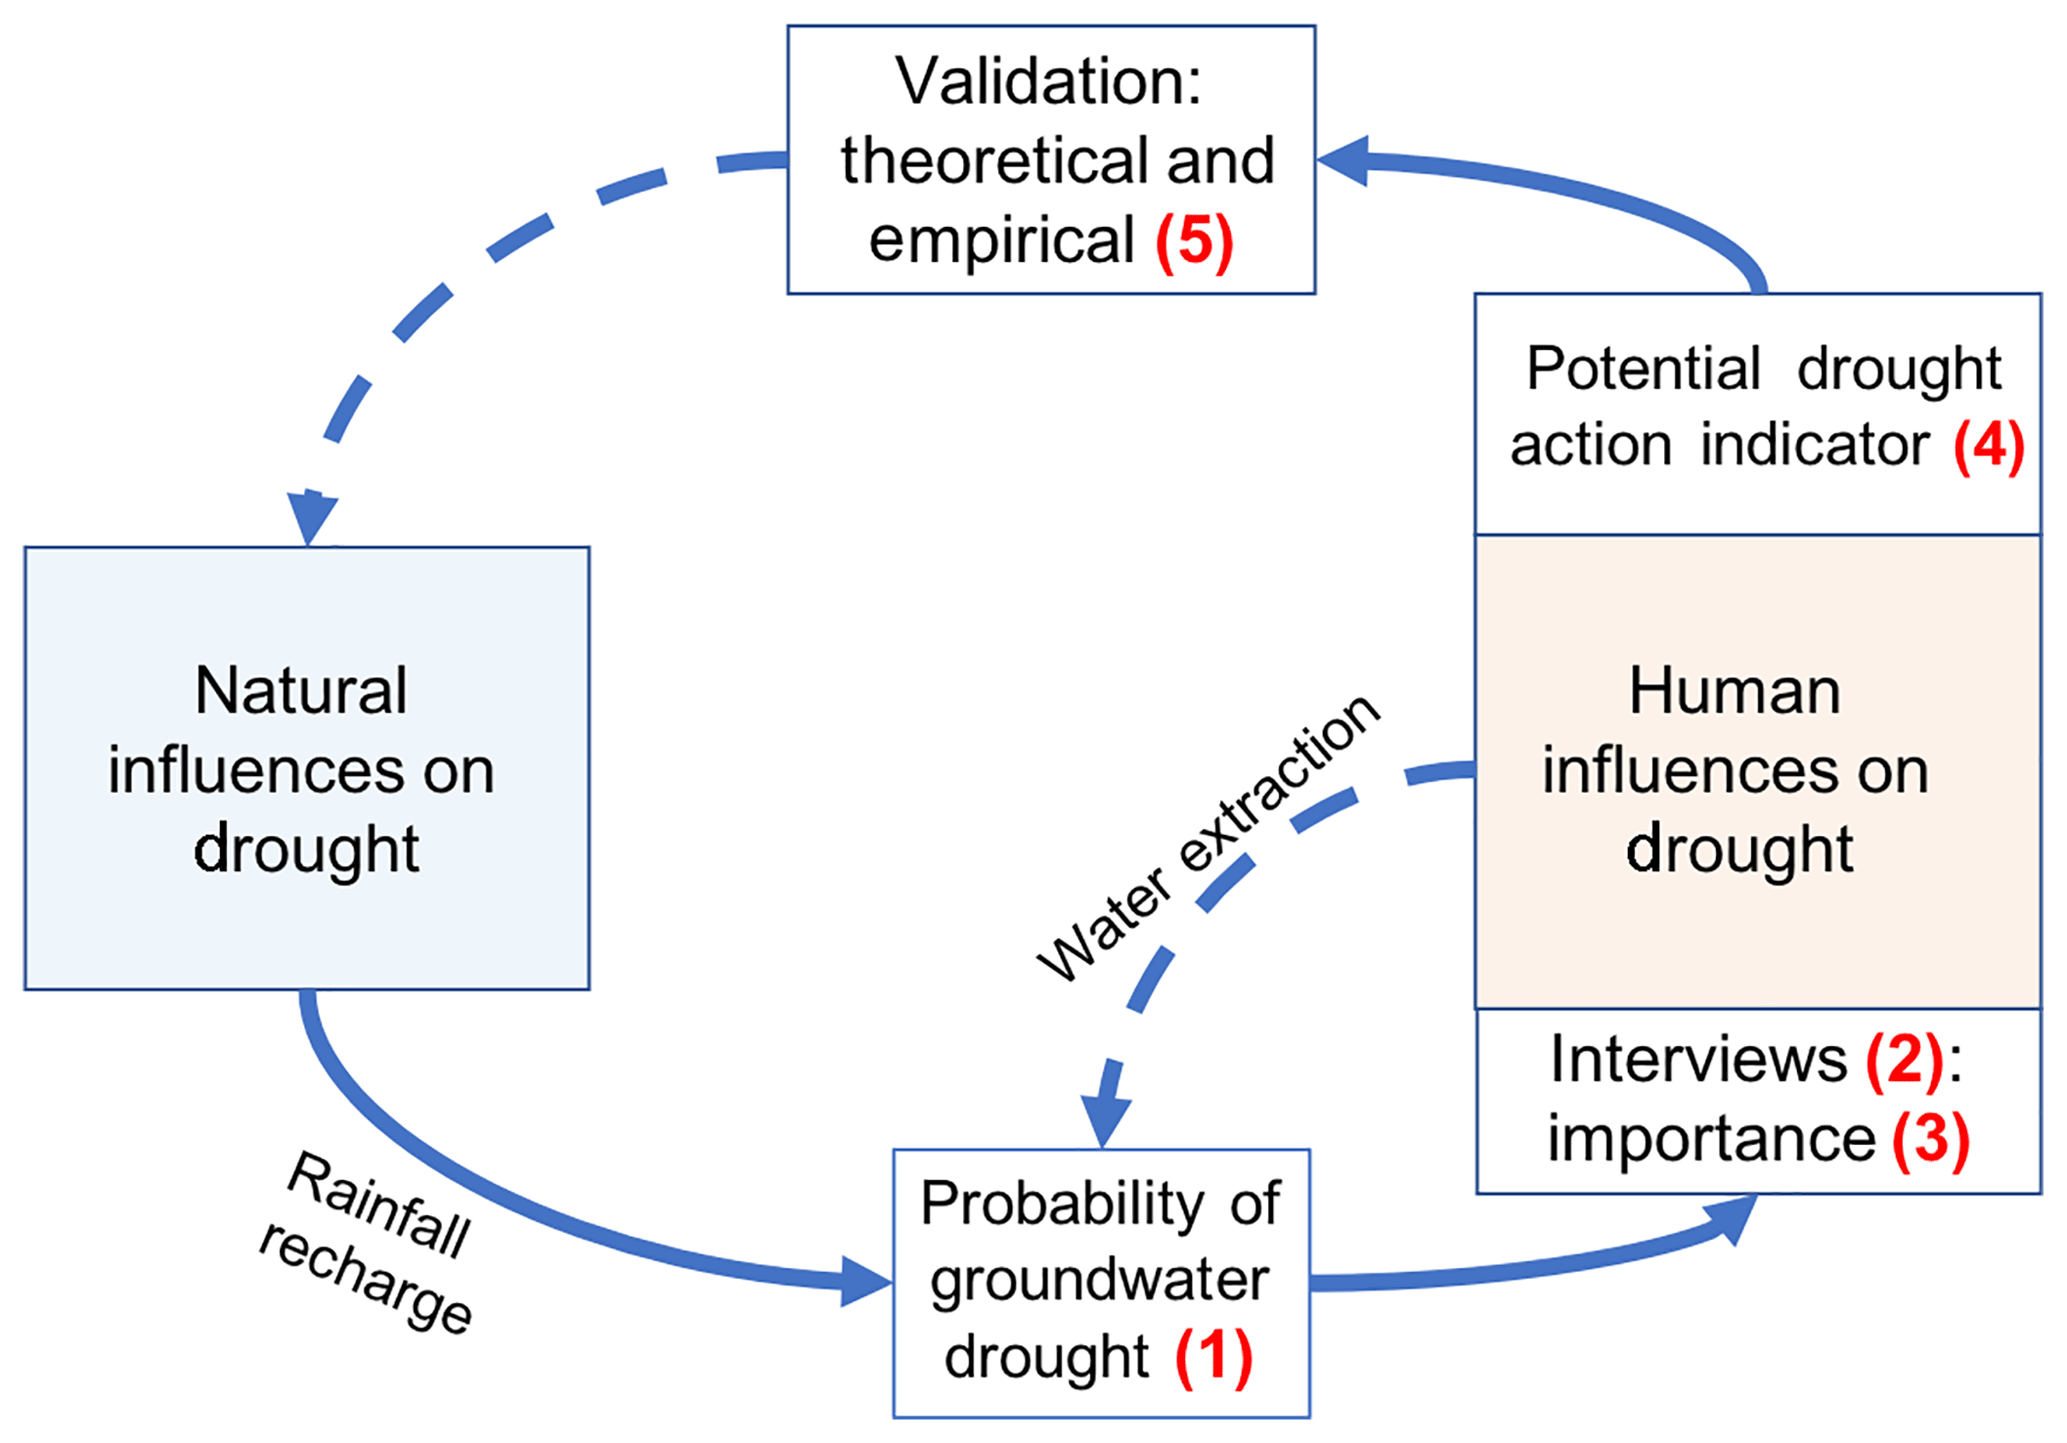
Figure 9Conceptual map of drought feedback loop components addressed in this study (solid blue lines) and remaining gaps (dashed blue lines). Numbers correspond to discussion points in the conclusions.
4.5 Future enhancements
We develop and demonstrate this methodology as a step towards closing the drought feedback loop but note that there are caveats and limitations that warrant discussion. A conceptual overview of the contribution of our study to the drought feedback loop is shown in Fig. 9, and we use this figure to identify five places where there is scope for future enhancements; each number below corresponds to a place in the drought feedback loop in Fig. 9.
-
For the natural influence on drought, we examine the probability of groundwater drought. In our case, the groundwater levels are closely related to rainfall recharge, which is a function of natural climate variability. We recognize that this is not the case for many groundwater aquifers, where human activities, such as groundwater extraction, may trump the natural climate signal (e.g., Tarhule and Bergey, 2006), often leading to water scarcity rather than a natural phenomenon of temporary water deficiency. In many systems a full water balance would need to be examined to understand the relative contributions of extraction versus moisture deficit to the likelihood of going below a relevant hydrologic threshold. Further, other aquifers may have different properties; for example, some aquifers' natural response may be different and the levels may not closely resemble rainfall.
-
Our interviews were conducted following a drought event, and we recognize that the timing of the interviews will likely affect the responses, possibly introducing a bias. For instance, interviews conducted during wet or average conditions might elicit less polarized responses, since drought impacts have not been recently experienced. We note that our approach of applying the interview responses across different climate conditions (i.e., wettest to driest) makes the assumption that the importance of water uses and management preferences are stationary. We acknowledge that different climate conditions, as well as cultural change, technological innovation, climate adaptation, and other processes, are likely to influence the cultural factors we investigated here and may mediate how people interact with their environments. Future work could investigate how responses change with different climate conditions over time and the subsequent implications for drought action. However, hazards and disasters research is almost always conducted immediately after an event, so this is a wise-spread epistemological issue with both pros and cons in terms of what we learn from post-disaster research.
-
We use stakeholders' importance ratings as a proxy for their willingness to take action in relation to particular water uses, where by “action” we generally mean some effort towards drought mitigation. The interviews included questions about the importance of different water uses to test the application of the cultural theory of risk (usually applied in a more global sense) to a specific water management issue, which had not been done before (Lazrus, 2016). For the purposes in this paper, multiplying the importance ratings by the probability served as a way to make an objective characterization of drought subjective; that is, we wanted to modulate the groundwater drought probability by each individual stakeholder's lens.
-
The formulation of the PDAI strongly affects the conclusions drawn. Our formulation of the PDAI follows from other precedents in risk management that take the product of the likelihood of an event and its importance (Jones and Preston, 2011; Oppenheimer et al., 2014). However, the functional form of the PDAI is flexible, allowing it to be tailored to other locations. As such, we note that the PDAI, as well as the best data to use to calculate it, will depend on the needs of the community, as well as the water system context.
-
We use social science theory to interpret our results and to better understand the theoretical underpinnings of how and why people take action in response to drought. However, we note that empirical validation is important for indicator development and refinement. We recommend that future project designs include a validation component in the methodology. This could take the form of follow-up interviews, such as direct feedback from stakeholders on whether the indicator reflects their willingness to take action for certain water uses at certain drought levels. Methods, including stakeholder processes, for developing and evaluating drought indicator effectiveness have been put forth in the drought community (Steinemann and Hayes, 2005; Steinemann and Cavalcanti, 2006; Steinemann et al., 2015). Other options for validation can be indirect, such as looking at historical data, like government and local reports, media, and/or other collected response information – e.g., the US Drought Impact Reporter (DIR) in the United States (Wilhite et al., 2007). Tijdeman et al. (2018) examined the relationship between drought indicators and impact data from the DIR; however, it has been noted that the DIR would benefit from a more systematic and coordinated collection effort (Lackstrom et al., 2013), which presents challenges for its interpretation. Promising methods for mining social media, such as Twitter, have also been developed (Demuth et al., 2018) and could be adapted for evaluative purposes.
Related to the points above is the question about how the PDAI could connect with existing operational products and its transferability to other locations. In our case, groundwater threshold exceedance was linked with water use impacts. Ideally, the PDAI could be modified to incorporate an operational drought indicator that is associated with impacts; however, evaluations of the connection between monitored indicators and impacts have been limited (Bachmair et al., 2016). In terms of the transferability of the social perspective, the idea behind the cultural theory of risk worldview measures is that they are loosely universal; that is, they should apply fairly generally to any context within the broad culture for which they were initially put together – in this case, the United States (Smith and Leiserowitz, 2014). However, worldview measures can also be tailored to a particular context (Lazrus, 2016), which might need to be revised for other applications.
Our study implements a conceptual methodology combining hydrological and societal perspectives to understand drought action potential. Results from stakeholder interviews in the study site reveal that people perceive the relative importance of water for various uses differently, as shown by the notable variability that existed across certain water uses. A retrospective analysis of groundwater threshold exceedance shows that, in recent decades, stakeholders experienced a wide range of likelihoods of exceeding relevant thresholds, and these corresponded to drought indices. These pieces of information are brought together through the PDAI. We find that for a given water use, drier conditions increase the frequency of exceeding the groundwater threshold and hence increase the PDAI. The PDAI is tied to the threshold selected for each water use: we find that the PDAI is higher for more moderate thresholds, i.e., thresholds that are exceeded more often. And conversely, as thresholds become more extreme, which can illustrate human adaptation to the new drought normal, the PDAI decreases. Finally, we find that for water uses where stakeholder values are diverse, the PDAI will be diverse as well, and this is exacerbated under drier conditions.
We can also ask why values might be diverse and what that might mean about how people are affected by water scarcity and how they will respond. To this end, the study also examined worldview, as measured by the CTR, which can help to diagnose why disagreement may arise over water management and point to some implications for water management policy. In the stakeholder sample, we found a diverse range of worldviews on the individualist and egalitarian spectrum. Further, for some water uses, the importance people attribute to water can be partially explained by worldview. This implies that there are two potential sources for disagreement over water management: first, where there is variability in people's perception of importance, there may be disagreement over whether or not a water resource needs to be managed (e.g., with water for recreation). Second, even where there is consensus on people's perceived importance, there is still potential for disagreement over how these water resources should be managed according to different preferences of worldviews (e.g., with drinking water). We are careful to say potential disagreement because (i) our analysis only investigates the CTR as one of the many factors explaining importance and (ii) by understanding stakeholder worldviews, potential disagreement across sectors can be predicted and ideally avoided. The latter finding suggests that water management policies will be more successful if they follow a strategy whereby elements of each worldview are represented in the solution (Verweij et al., 2006).
Although reducing disagreement is always important for promoting sustainability, it is particularly important for management planning under potentially increasing drought due to climate change, as has been predicted for this area (Towler et al., 2016; Liu et al., 2012). We examined this by examining possible adaptation to a new normal, where we illustrate how a more extreme threshold lowers the PDAI.
Although the methodology to develop the PDAI is experimental, we posit that explicit efforts to combine natural and human perspectives are critical to gaining a deeper and more nuanced understanding of drought feedbacks, and this paper provides a novel contribution to this end.
Groundwater data from the USGS Fittstown well (USGS 343457096404501) are available from the USGS National Water Information System Web Interface https://nwis.waterdata.usgs.gov/nwis/gw (last access: 22 August 2018). Drought index data for Oklahoma Climate Division 8 are available from http://www7.ncdc.noaa.gov/CDO/CDODivisionalSelect.jsp (last access: 22 August 2018).
Inquiries on the stakeholder data from the interviews can be sent to hlazrus@ucar.edu.
ET, HL, and DP collaborated to develop the main idea for the work. ET took the lead on all the analyses and manuscript preparation and revisions. HL contributed to the societal results and discussion.
The authors declare that they have no conflict of interest.
Thank you to community members in the Arbuckle-Simpson Aquifer area, Julie Demuth,
and Rebecca Morss. This study is supported by National Oceanic and
Atmospheric Administration grant NA11OAR4310205 and National Science
Foundation EASM grants AGS-1048829 and AGS-1419563. NCAR is sponsored by the
National Science Foundation.
Edited by: Nunzio Romano
Reviewed by: Anne Van Loon and two anonymous referees
Bachmair, S., Stahl, K., Collins, K., Hannaford, J., Acreman, M., Svoboda, M., Knutson, C., Helm Smith, K., Wall, N., Fuchs, B., Crossman, N. D., and Overton, I. C.: Drought indicators revisited: the need for a wider consideration of environment and society, Wiley Interdisciplinary Reviews: Water, https://doi.org/10.1002/wat2.1154, 2016.
Christenson, S., Osborn, N. I., Neel, C. R., Faith, J. R., Blome, C. D., Puckette, J., and Pantea, M. P.: Hydrogeology and simulation of groundwater flow in the Arbuckle-Simpson aquifer, south-central Oklahoma: U.S. Geological Survey Scientific Investigations Report 2011–5029, 104 pp., 2011.
Demuth, J. L., Morss, R. E., Palen, L., Anderson, K. M., Anderson, J., Kogan, M., Stowe, K., Bica, M., Lazrus, H., Wilhelmi, O., and Henderson, J.: Sometimes da #beachlife ain't always da wave”: Understanding People's Evolving Hurricane Risk Communication, Risk Assessments, and Responses Using Twitter Narratives, Weather Clim. Soc., 10, 537–560, https://doi.org/10.1175/WCAS-D-17-0126.1, 2018.
Dessai, S. and Sims, C.: Public perception of drought and climate change in southeast England, Environ. Hazards, 9, 340–357, https://doi.org/10.3763/ehaz.2010.0037, 2010.
Douglas, M.: Purity and Danger, Routledge, London, 1966.
Georgakakos, A., Fleming, P., Dettinger, M., Peters-Lidard, C., Richmond, T. C., Reckhow, K., White, K., and Yates, D.: chap. 3: Water resources, in: Climate change impacts in the United States: The third national climate assessment, edited by: Melillo, J. M., Richmond, T., and Yohe, G. W., US Global Change Research Program, 69–112, 2014.
Guttman, N. B. and Quayle, R. G.: A historical perspective of U.S. climate divisions, B. Am. Meteorol. Soc., 77, 293–303, https://doi.org/10.1175/1520-0477(1996)077<0293:AHPOUC>2.0.CO;2, 1996.
Jones, R. N.: An environmental risk assessment/management framework for climate change impact assessments, Nat. Hazards, 23, 197–230, 2001.
Jones, R. N. and Preston, B. L.: Adaptation and risk management, Wiley Interdiscip Rev: Clim. Chang., https://doi.org/10.1002/wcc.97, 2011.
Karl, T. R. and Koss, W. J.: Regional and National Monthly, Seasonal, and Annual Temperature Weighted by Area, 1895–1983, Historical Climatology Series 4–3, National Climatic Data Center, Asheville, NC, 38 pp., 1984.
Knutson, C. L., Hayes, M. J., and Philipps, T.: How to Reduce Drought Risk, Western Drought Coordination Council, Prepared- ness and Mitigation Working Group, Lincoln, 10 pp., available at: https://drought.unl.edu/archive/Documents/NDMC/Planning/risk.pdf (last access: 10 March 2019), 1998.
Lackstrom, K., Brennan, A., Ferguson, D., Crimmins, M., Darby, L., Dow, K., Ingram, K., Meadow, A., Reges, H., Shafer, M., and Smith, K.: The Missing Piece: Drought Impacts Monitoring, Report from a Workshop in Tucson, AZ, 2013.
Lazrus, H.: “Drought is a Relative Term:” Drought Risk Perceptions and Water Management Preferences among Diverse Community Members in Oklahoma, USA, Hum. Ecol., 44, 595–605, https://doi.org/10.1007/s10745-016-9840-y, 2016.
Liu, L., Hong, Y., Bednarczyk, C. N., Yong, B., Shafer, M. A., Riley, R., and Hocker, J. E.: Hydro-climatological drought analyses and projections using meteorological and hydrological drought indices: a case study in Blue River Basin, Oklahoma, Water Resour. Manag., 26, 2761–2779, https://doi.org/10.1007/s11269-012-0044-y, 2012.
Maggioni, E.: Water demand management in times of drought: What matters for water conservation, Water Resour. Res., 511, 125–139, 2015.
McKee, T. B., Doesken, N. J., and Kleist, J.: The relationship of drought frequency and duration to time scales, Preprints, 8th Conference on Applied Climatology, Am. Meteorol. Soc. Anaheim, California, 179–184, 1993.
McLeman, R., Dupre, J., Ford, L., Ford, J., Gajewski, K., and Marchildon, G.: What we learned from the Dust Bowl: lessons in science, policy, and adaptation, Popul. Environ., 35, 417–440, https://doi.org/10.1007/s11111-013-0190-z, 2014.
McNeeley, S. and Lazrus, H.: The Cultural Theory of Risk for Climate Change Adaptation, Weather Clim. Soc., 6, 506–519, 2014.
McNeeley, S. M., Tessendorf, S. A., Lazrus, H., Heikkila, T., Ferguson, I. M., Arrigo, J. S., Attari, S. Z., Cianfrani, C. M., Dilling, L., Gurdak, J. J., Kampf, S. K., Kauneckis, D., Kirchhoff, C. J., Lee, J., Lintner, B. R., Mahoney, K. M., Opitz-Stapleton, S., Ray, P., South, A. B., Stubblefield, A. P., and Brugger, J.: Catalyzing Frontiers in Water-Climate-Society Research: A View from Early Career Scientists and Junior Faculty, B. Am. Meteorol. Soc., 93, 477–484, https://doi.org/10.1175/BAMS-D-11-00221.1, 2011.
Mishra, A. K. and Singh, V. P.: A review of drought concepts, J. Hydrol., 391, 202–216, https://doi.org/10.1016/j.jhydrol.2010.07.012, 2010.
Mishra, A. K. and Singh, V. P.: Drought modeling – A review, J. Hydrol., 403, 157–175, https://doi.org/10.1016/j.jhydrol.2011.03.049, 2011.
NCDC: Billion-Dollar Weather and Climate Disasters, available at: http://www.ncdc.noaa.gov/billions (last access: 22 August 2019), 2015.
Oppenheimer, M., Campos, M., Warren, R., Birkmann, J., Luber, G., O'Neill, B., and Takahashi, K.: Emergent risks and key vulnerabilities, in: Climate Change 2014: Impacts, Adaptation, and Vulnerability, Part A: Global and Sectoral Aspects. Contribution of Working Group II to the Fifth Assessment Report of the Intergovernmental Panel on Climate Change, edited by: Field, C. B., Barros, V. R., Dokken, D. J., Mach, K. J., Mastrandrea, M. D., Bilir, T. E., Chatterjee, M., Ebi, K. L., Estrada, Y. O., Genova, R. C., Girma, B., Kissel, E. S., Levy, A. N., MacCracken, S., Mastrandrea, P. R., and White, L. L., Cambridge University Press, Cambridge, United Kingdom and New York, NY, USA, 1039–1099, 2014.
Ostrom, E.: Governing the commons: The evolution of institutions for collective action, Cambridge University Press, New York, NY, 1990.
Palmer, W. C.: Meteorological drought, Res Paper No. 45, Weather Bureau, Washington, DC, 1965.
Polsky, C. and Cash, D. W.: Drought, Climate Change, and Vulnerability: The Role of Science and Technology in a Multi-Scale, Multi-Stressor World, in: Drought and Water Crises: Science, Technology, and Management Issues, edited by: Wilhite, D. A., Taylor and Francis, Boca Raton, 2005.
Pulwarty, R.: Climate and Water in the West: Science, Information and Decision-making, Water Resour., 124, 4–12, 2003.
Shriver, T. E. and Peaden, C.: Frame Disputes in a Natural Resource Controversy: The Case of the Arbuckle Simpson Aquifer in South-Central Oklahoma, Soc. Natur. Resour., 22, 143–157, https://doi.org/10.1080/08941920801973789, 2009.
Silvis, V., McPherson, R. A., and Lazrus, H.: Climatology of the Arbuckle-Simpson Aquifer region: A report of the water decisions for sustainability of the Arbuckle-Simpson project, NCAR Technical Note NCAR/TN-510+STR, https://doi.org/10.5065/D6Z31WN9, 2014.
Sivapalan, M., Savenije, H. H. G., and Blöschl, G.: Socio-hydrology: A new science of people and water, Hydrol. Process, 26, 1270–1276, https://doi.org/10.1002/hyp.8426, 2012.
Smith, N. and Leiserowitz, A.: Role of emotion in global warming policy support and opposition, Risk Anal., 34, 937–948, https://doi.org/10.1111/risa.12140, 2014.
Stagge, J. H., Kohn, I., Tallaksen, L. M., and Stahl, K.: Modeling drought impact occurrence based on meteorological drought indices in Europe, J. Hydrol., 530, 37–50, https://doi.org/10.1016/j.jhydrol.2015.09.039, 2015.
Steinemann, A. and Cavalcanti, L.: Developing multiple indicators and triggers for drought plans, J. Water Res. Pl., 164–174, https://doi.org/10.1061/(ASCE)0733-9496(2006)132:3(164), 2006.
Steinemann, A. C. and Hayes, M. J.: Drought Indicators and Triggers, in: Drought and Water Crises: Science, Technology, and Management Issues, 71–92, 2005.
Steinemann, A. C, Iacobellis, S. F., and Cayan, D. R.: Developing and Evaluating Drought Indicators for Decision-Making, J. Hydrometeorol., 16, 1793–1803, https://doi.org/10.1175/JHM-D-14-0234.1, 2015.
Tarhule, A. and Bergey, E. A.: Springs in time: comparison of present and historical flows, Report to the Oklahoma Water Resources Institute, available at: http://citeseerx.ist.psu.edu/viewdoc/download?doi=10.1.1.922.2032&rep=rep1&type=pdf (last access: 13 March 2019), 2006.
Thompson, M., Ellis, R., and Wildavsky, A.: Cultural Theory, Westview Press, Boulder, 1990.
Tijdeman, E., Barker, L. J., Svoboda, M. D., and Stahl, K.: Natural and Human Influences on the Link Between Meteorological and Hydrological Drought Indices for a Large Set of Catchments in the Contiguous United States, Water Resour. Res., 54, 6005–6023, https://doi.org/10.1029/2017WR022412, 2018.
Towler, E. and Lazrus, H.: Increasing the usability of drought information for risk management in the Arbuckle Simpson Aquifer, Oklahoma, Clim. Risk Manage., 13, 64–75, https://doi.org/10.1016/j.crm.2016.06.003, 2016.
Towler, E., PaiMazumder, D., and Holland, G.: A framework for investigating large-scale patterns as an alternative to precipitation for downscaling to local drought, Clim. Dynam., 48, 881–892, https://doi.org/10.1007/s00382-016-3116-5, 2016.
Van Loon, A. F., Gleeson, T., Clark, J., Van Dijk, A. I. J. M., Stahl, K., Hannaford, J., Baldassarre, G. D., Teuling, A. J., Tallaksen, L. M., Uijlenhoet R., Hannah, D. M., Sheffield, J., Svoboda, M., Verbeiren, B., Wagener, T., Rangecroft, S., Wanders, N., and Van Lanen, H. A. J.: Drought in the Anthropocene, Nat. Geosci., 9, 89–91, https://doi.org/10.1038/ngeo2646, 2016a.
Van Loon, A. F., Stahl, K., Di Baldassarre, G., Clark, J., Rangecroft, S., Wanders, N., Gleeson, T., Van Dijk, A. I. J. M., Tallaksen, L. M., Hannaford, J., Uijlenhoet, R., Teuling, A. J., Hannah, D. M., Sheffield, J., Svoboda, M., Verbeiren, B., Wagener, T., and Van Lanen, H. A. J.: Drought in a human-modified world: reframing drought definitions, understanding, and analysis approaches, Hydrol. Earth Syst. Sci., 20, 3631–3650, https://doi.org/10.5194/hess-20-3631-2016, 2016b.
Verweij, M., Douglas, M., Ellis, R., Engel, C., Hendriks, F., Lohmann, S., Ney, S., Rayner, S., and Thompson, M.: Clumsy solutions for a complex world, Publ. Admin., 84, 847–843, 2006.
Vidal, J.-P., Martin, E., Kitova, N., Najac, J., and Soubeyroux, J.-M.: Evolution of spatio-temporal drought characteristics: validation, projections and effect of adaptation scenarios, Hydrol. Earth Syst. Sci., 16, 2935–2955, https://doi.org/10.5194/hess-16-2935-2012, 2012.
Wagener, T., Sivapalan, M., Troch, P. A., McGlynn, B. L., Harman, C. J., Gupta, H. V., and Wilson, J. S.: The future of hydrology: An evolving science for a changing world, Water Resour. Res., 46, W05301, https://doi.org/10.1029/2009WR008906, 2010.
Wanders, N., Wada, Y., and Van Lanen, H. A. J.: Global hydrological droughts in the 21st century under a changing hydrological regime, Earth Syst. Dynam., 6, 1–15, https://doi.org/10.5194/esd-6-1-2015, 2015.
Wilhite, D. A. and Buchanan-Smith, M.: Drought as Hazard: Understanding the Natural and Social Context, in: Drought and Water Crises: Science, Technology, and Management Issues, 2005.
Wilhite, D. A. and Glantz, M. H.: Understanding the drought phenomenon: The role of definitions, Water Int., 10, 111–120, 1985.
Wilhite, D. A., Hayes, M. J., and Knutson, C. L.: Drought Preparedness Planning: Building Institutional Capacity, in: Drought and Water Crises: Science, Technology, and Management Issues, 2005.
Wilhite, D. A., Hayes, M. J., Knutson, C., and Smith, K. H.: Planning for drought: Moving from crisis to risk management, J. Am. Water Resour. As., 36, 697–710, https://doi.org/10.1111/j.1752-1688.2000.tb04299.x, 2000.
Wilhite, D. A., Svoboda, M. D., and Hayes, M. J.: Understanding the complex impacts of drought: A key to enhancing drought mitigation and preparedness, Water Resour. Manag., 21, 763–774, https://doi.org/10.1007/s11269-006-9076-5, 2007.
We note that groundwater threshold levels are negative; so here we define “exceedance” as going below (more negative) than the threshold.