the Creative Commons Attribution 4.0 License.
the Creative Commons Attribution 4.0 License.
 | 29 Nov 2018
How does initial soil moisture influence the hydrological response? A case study from southern France
Magdalena Uber
Jean-Pierre Vandervaere
Isabella Zin
Isabelle Braud
Maik Heistermann
Cédric Legoût
Gilles Molinié
Guillaume Nord
The Cévennes–Vivarais region in southern France is prone to heavy rainfall that can lead to flash floods which are one of the most hazardous natural risks in Europe. The results of numerous studies show that besides rainfall and physical catchment characteristics the catchment's initial soil moisture also impacts the hydrological response to rain events. The aim of this paper is to analyze the relationship between catchment mean initial soil moisture and the hydrological response that is quantified using the event-based runoff coefficient ϕev in the two nested catchments of the Gazel (3.4 km2) and the Claduègne (43 km2). Thus, the objectives are twofold: (1) obtaining meaningful estimates of soil moisture at catchment scale from a dense network of in situ measurements and (2) using this estimate of to analyze its relation with ϕev calculated for many runoff events. A sampling setup including 45 permanently installed frequency domain reflectancy probes that continuously measure soil moisture at three depths is applied. Additionally, on-alert surface measurements at ≈10 locations in each one of 11 plots are conducted. Thus, catchment mean soil moisture can be confidently assessed with a standard error of the mean of ≤1.7 vol % over a wide range of soil moisture conditions.
The ϕev is calculated from high-resolution discharge and precipitation data for several rain events with a cumulative precipitation Pcum ranging from less than 5 mm to more than 80 mm. Because of the high uncertainty of ϕev associated with the hydrograph separation method, ϕev is calculated with several methods, including graphical methods, digital filters and a tracer-based method. The results indicate that the hydrological response depends on : during dry conditions ϕev is consistently below 0.1, even for events with high and intense precipitation. Above a threshold of vol % ϕev can reach values up to 0.99 but there is a high scatter. Some variability can be explained with a weak correlation of ϕev with Pcum and rain intensity, but a considerable part of the variability remains unexplained.
It is concluded that threshold-based methods can be helpful to prevent overestimation of the hydrological response during dry catchment conditions. The impact of soil moisture on the hydrological response during wet catchment conditions, however, is still insufficiently understood and cannot be generalized based on the present results.
- Article
(2076 KB) - Full-text XML
-
Supplement
(428 KB) - BibTeX
- EndNote


The Cévennes–Vivarais region in southern France is prone to intense rainfall that can lead to the occurrence of flash floods in catchments of various scales ranging from small headwater catchments to ones of several thousand kilometers squared (Boudevillain et al., 2011; Braud et al., 2014). Flash floods are one of the most destructive natural hazards in Europe, both in terms of number of fatalities and economic damage (Gaume et al., 2009). Striking examples are the October 2015 flash flood of the Brague river that hit the French Riviera and the 2002 flash flood of the Gard river with 23 deaths and an estimated direct tangible damage of EUR 1.2 billion (Huet et al., 2003).
Despite the recognition of their high damage potential, the hydrological processes leading to the generation of flash floods are still insufficiently understood at a scale that is important for prediction and management (Gaume et al., 2009; Braud et al., 2014). One of the main problems that hinders flash flood prediction is the ignorance of the water retention capacity of the soil (Creutin and Borga, 2003). Other issues concern the lack of high-resolution data measured during flash flood events as well as the variety of catchment characteristics that influence their occurrence. The high degree of nonlinearity in the hydrological response of catchments hinders the predictability of flash floods (Braud et al., 2014). This has motivated the installation of several measurement networks in first-order catchments, especially in the USA and Australia (Slaughter et al., 2001; Renard et al., 2008; Moran et al., 2008; Baffaut et al., 2013) and – at the mesoscale and in a Mediterranean context – the FloodScale project in the Cévennes–Vivarais region (Braud et al., 2014; Nord et al., 2017).
Flash floods are usually associated with intense rainfall of >100 mm in a few hours or long-lasting rainfall (≈24 h) with moderate intensities (Braud et al., 2014) often generated by mesoscale convective systems and/or orographic precipitation (Marchi et al., 2010; Molinié et al., 2012; Panziera et al., 2015). However, the hydrological response to rain events varies greatly between catchments and between events. It can be quantified using the event-based runoff coefficient ϕev, i.e., the ratio of event runoff volume to total event rainfall volume. The major drawback of this quantity is the lack of standard procedures for obtaining event runoff volumes and for defining the beginning and end of an event, which impedes comparisons between studies (Blume et al., 2007). Yet, event-based runoff coefficients of flash-flood events have been found to differ substantially, spanning nearly the full range of values from zero to one, with a high positive skewness in their frequency distribution (Merz et al., 2006; Blume et al., 2007; Norbiato et al., 2008; Merz and Blöschl, 2009; Marchi et al., 2010). They were shown to differ considerably between regions (Marchi et al., 2010), seasons (Li et al., 2012) and flood types (Merz et al., 2006); to increase with mean annual precipitation; and event rainfall depth (Merz et al., 2006; Norbiato et al., 2009) and to depend on rain intensity, soil types and antecedent soil moisture conditions (Wood et al., 1990; Crow et al., 2005; Marchi et al., 2010; Hrachowitz et al., 2011; Penna et al., 2011; Li et al., 2012; Huza et al., 2014). Furthermore, a multitude of catchment characteristics also determine runoff generation and concentration, namely topography, geology, hydraulic routing and geomorphological controls (Braud et al., 2014).
Soil moisture is known to govern overland flow generation (Zehe and Sivapalan, 2009). As it controls threshold behavior, it implies qualitative changes of hydrological processes and the hydrologic system's response to rain events (Zehe and Sivapalan, 2009; Hardie et al., 2011). Initial soil moisture θini, i.e., the soil water content at the onset of a rain event, is a crucial factor that influences the water storage capacity of the catchment as well as soil hydraulic properties and thus the hydrological response to rainfall events. It controls the soil moisture deficit and, consequently, in the interplay with rainfall forcing, it determines whether soil saturation and saturation excess overland flow (Dunne and Black, 1970) occur during a rain event or not. Moreover, soil moisture controls the unsaturated hydraulic conductivity and thus the occurrence of infiltration excess overland flow (Horton, 1933). Given the high spatial and temporal variability of soil moisture and the incoherence of scale of the measurements with the catchment size, it remains challenging to obtain meaningful estimates of θini at the catchment scale (Brocca et al., 2009a; Vereecken et al., 2014; Korres et al., 2015). There are multiple controls on soil moisture such as soil texture, topography and vegetation as well as small-scale random variability (Jawson and Niemann, 2007; Garcia-Estringana et al., 2013; McMillan and Srinivasan, 2015). This problem is addressed by Vachaud et al. (1985) by introducing the concept of temporal stability, based on the finding that deviations of point measurements from the catchment mean can be persistent in time. Thus, optimum sampling locations can be identified and the number of samples required can be reduced (e.g., Brocca et al., 2009a; Huza et al., 2014).
Several studies consider the impact of initial soil moisture on the hydrological response of catchments on heavy rain events.
Seasonality in the occurrence of flash floods (Gaume et al., 2009) and discharge magnitudes (Borga et al., 2007; Li et al., 2012) have been attributed to initial soil moisture conditions. Numerous modeling studies have shown the high sensitivity of the modeled runoff response to θini and the importance of estimates of θini at the catchment scale as initial conditions in event-based models (e.g., Castillo et al., 2003; Huang et al., 2007; Le Lay and Saulnier, 2007; Berthet et al., 2009; Brocca et al., 2009b; Tramblay et al., 2010, 2012; Li et al., 2012; Massari et al., 2014a, b, 2015; Grillakis et al., 2016). The dependence of catchment responses to initial soil moisture is also observed by Marchi et al. (2010) in a dataset comprising data for 25 flood events in 60 basins across Europe and on this study's site by Huza et al. (2014). This relationship is characterized by high nonlinearity and threshold effects (Zehe et al., 2005; Huza et al., 2014). There is no consent on the importance of initial soil moisture during extreme events. Wood et al. (1990) conclude that catchment characteristics are important only for flood events with a low return period (up to ca. 10 years), whereas rainfall characteristics dominate those with a higher return period. On the other hand this finding is rejected in analyses of historic flash floods (Gaume et al., 2004; Borga et al., 2007; Le Lay and Saulnier, 2007) or flash flood databases (Marchi et al., 2010) whose authors conclude that soil moisture plays an important role in the hydrological response, also under extreme conditions.
The aim of this study is to assess how soil moisture controls the hydrological response in a flash-flood-prone area in southern France. The study is conducted in the two nested catchments of the Claduègne (43 km2) and Gazel (3.4 km2), Ardèche, France. Thanks to an exceptionally good database, it is possible to obtain reliable estimates of the two catchments' initial soil moisture states for several rain events and to quantify the hydrological response with the event-based runoff coefficient. To this end, the spatiotemporal heterogeneity is assessed to obtain reliable estimates for mean initial soil moisture at the catchment scale as well as its uncertainty. Other studies results suggest a dependence of ϕev on initial soil moisture (e.g., Merz et al., 2006; Blume et al., 2007; Merz and Blöschl, 2009; Norbiato et al., 2009). However, most of these studies use indirect information such as remote sensing data, antecedent precipitation indices, initial baseflow, continuous soil moisture accounting models or the ratio of actual evaporation to precipitation. These approaches offer many advantages, such as the global availability of remote sensing data and the easier acquisition of these data (e.g., Brocca et al., 2009c). Numerous studies found good agreement of soil moisture data obtained from in situ measurements and remote sensing (e.g., Brocca et al., 2009c, 2013; Huza et al., 2014). Nonetheless, case studies are important to confirm the results obtained with indirect data as well as the results from modeling exercises and to thoroughly understand the hydrologic functioning of local sites. At this study's site the impact of θini on ϕev was already considered by Huza et al. (2014). However, these authors used soil moisture data obtained from ASCAT satellite data which is fitted to in situ measurements of topsoil moisture that were conducted on grasslands only. They considered five rain events only, so this relation could not be quantified unambiguously. Thus, this study's novelty is to analyze the relation between ϕev and θini when both are obtained from a comprehensive, high-resolution data set allowing the assessment of the uncertainty of the two variables. Relying solely on in situ data, we aim to (i) obtain a meaningful estimate of catchment-scale soil moisture and its uncertainty and (ii) answer the research question how does soil moisture at the event onset affect the hydrological response?
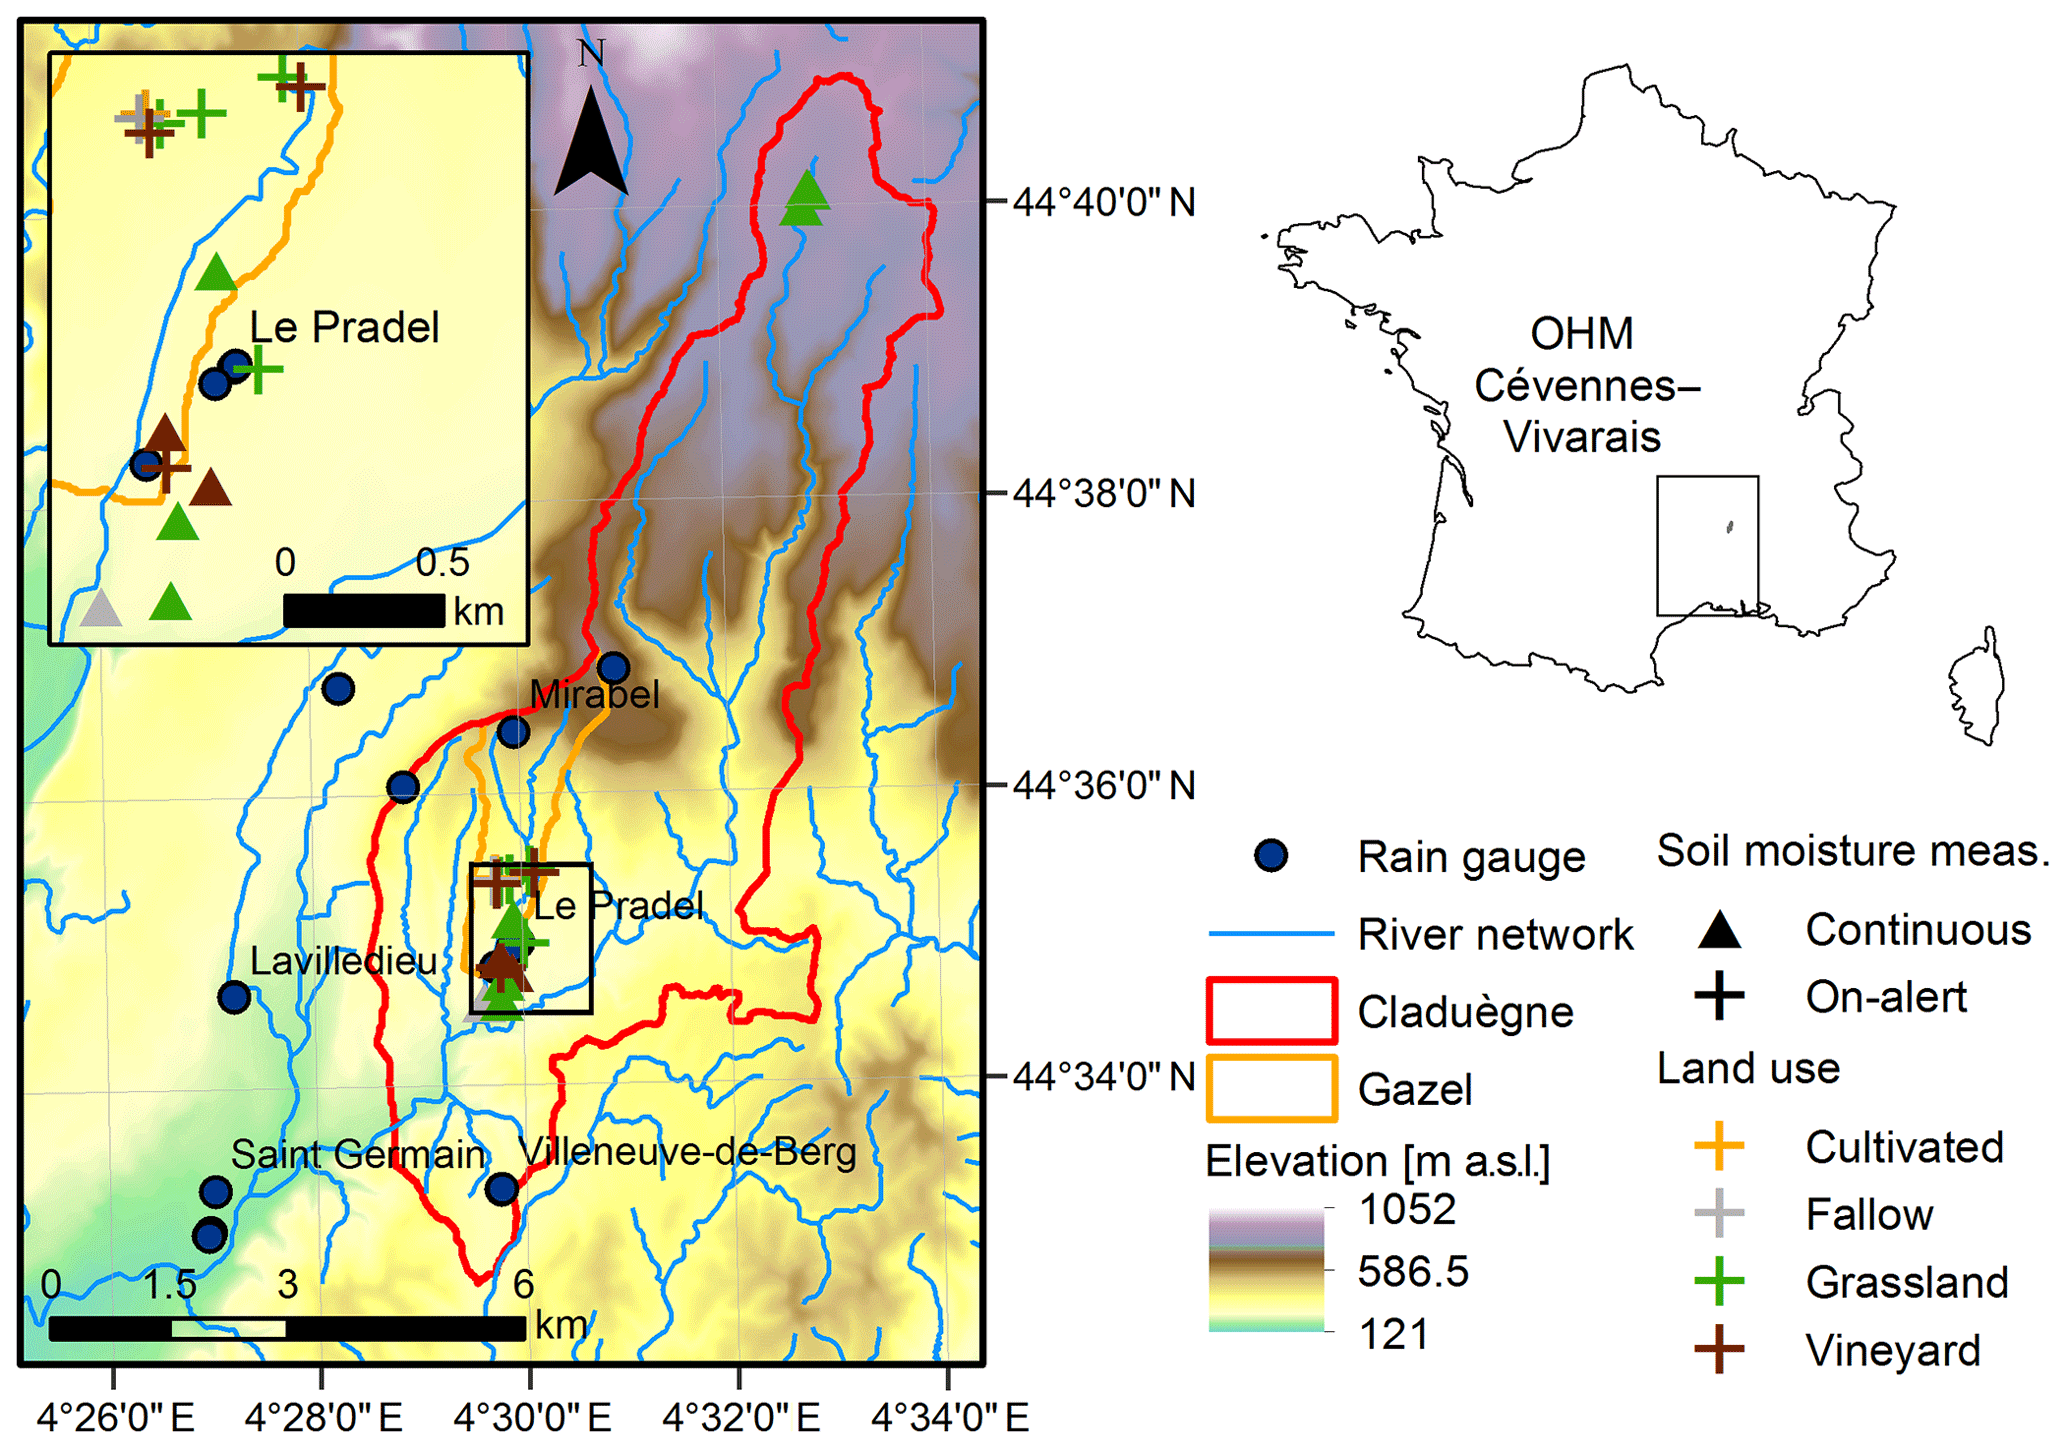
Figure 1Location of the study site and measurement network. At every on-alert site measurements were taken at about 10 randomly chosen locations. At every continuous measurement sites two sensors were installed at 10 cm depth, two sensors at 20–25 cm depth and one sensor at a depth of 33–50 cm.
2.1 Study site
For this study two nested subcatchments of the Ardèche river in the Cévennes–Vivarais region of southern France are considered: the catchments of the intermittent Gazel stream and the perennial Claduègne river, with areas of 3.4 and 43 km2 respectively (Fig. 1).
Both catchments can be clearly divided into two distinct geologies: the northern part is constituted by the Coiron basaltic plateau that is bounded by a steep cliff of basaltic columns in the south, whereas the southern part of both catchments is a landscape of piedmont hills underlain by sedimentary limestone lithology (Nord et al., 2017). The basaltic plateau covers 51 % of the Claduègne catchment, whereas its fraction of the Gazel catchment is only 23 %. Thus, the northern part is dominated by silty and stony soils on pebble deposit of basaltic component, while the soils in the southern part are predominantly rendzinas or other clay–stony soils, cultivated soils of loam and clay-loam and in the south of the Claduègne catchment lithosols and regosols (Nord et al., 2017). The terrain is hilly, and has a mean slope of about 20 %. The area is characterized by extensive agriculture and natural vegetation. Hence, the main land use and land cover types are grasslands, pastures, vineyards, forests and Mediterranean open woodlands. The vineyards are predominantly found on the finer textured soils in the southern part of the Claduègne catchment while the other land use types are found throughout the catchments. The average annual precipitation at Le Pradel at the outlet of the Gazel catchment is 1030 mm (Huza et al., 2014; original data: daily rain gauge data for 1958–2000 from Méteo-France). For further details see Nord et al. (2017).
2.2 Data availability
As part of the HyMex (Hydrological Cycle in the Mediterranean Experiment, Ducrocq et al., 2014) and FloodScale (Braud et al., 2014) projects and the Cévennes–Vivarais Mediterranean Hydrometeorological Observatory (OHM-CV; Boudevillain et al., 2011), the area is exceptionally well monitored; thus, high-resolution spatiotemporal data on rainfall, discharge and soil moisture is available. The data used for this study were published in Nord et al. (2017) and the link to download the data can be found at the publishers website: https://www.earth-syst-sci-data.net/9/221/2017/essd-9-221-2017-assets.html (last access: 19 November 2018).
2.2.1 Soil moisture θ
Two different sets of soil moisture data are available: continuous measurements and on-alert measurements. Soil moisture is continuously measured with 45 fixed soil moisture probes at nine plots (two vineyards, one fallow, six grasslands) within the Claduègne catchment since June 2013. Six of the plots are located in the piedmont hills and three on the basaltic plateau (Fig. 1). Concerning topography, most of the sensors are located on hillslopes which is the dominant topographic zone according to Savenije (2010) in the catchment. Only two plots are located in the riparian area and are potentially connected to the stream during rain events. At each plot, five frequency domain reflectometry (FDR) probes (Decagon 10HS soil moisture sensors) are installed at different depths: 10 cm (n=2), 20–25 cm (n=2) and in the subsoil (33–50 cm, n=1). The temporal resolution is 15–20 min (Nord et al., 2017). The sensors in the vineyards were installed between two vine plants in a row, which is a compromise between feasibility and representativeness of soil moisture in the vineyards, which is heterogeneous due to transpiration. The accuracy and the range of the probe as provided by the manufacturer are ±3 vol % and 0–57 vol %. The data are available from June 2013–November 2014 in the dataset (OHMCV, 2013) presented in Nord et al. (2017).
In addition, following forecasts of heavy rain events, on-alert measurements of soil moisture in 0–5 cm depth were conducted at 11 plots within the Gazel catchment with a hand-held FDR soil moisture sensor (Delta-T SM200). The accuracy and the range of the probe are ±3 vol % and 0–50 vol %. The plots comprised four vineyards, five grasslands, one fallow and one cultivated field. All of these sites are located on hillslopes. The sampling sites were selected for reasons of accessibility, congruence with other measurements conducted during the FloodScale project and representativeness of the catchments' landscapes. All on-alert measurements were conducted in about 1 h at ≈10 randomly chosen measurement points within each plot. The distance between the measurement points was at least 1 m to ensure spatial independence (Huza et al., 2014). In the vineyards the measurements were conducted in between the rows of vine plants because this is where surface runoff started (visual inspection). On-alert measurements were taken before and after 11 heavy rain events during the special observation periods of the HyMex Project in autumn (September–December) of the period 2012–2015. The dataset is found in the Supplement of this article (Supplement S1).
2.2.2 Precipitation P
Rainfall data were obtained from the HPiconet rain gauge network at a resolution of 1 min. The network consists of 19 tipping bucket rainfall gauges with a sampling surface of 1000 cm2 and a resolution of 0.2 mm, out of which 12 are located in the Claduègne catchment or its close vicinity (OHMCV, 2010; Nord et al., 2017, Fig. 1).
2.2.3 Discharge Q
Water level is continuously measured at the outlets of the two catchments with water level gauges at 2 min resolution (Gazel) and 10 min resolution (Claduègne) respectively (OHMCV, 2011; Nord et al., 2017). The water level is converted to discharge with a stage–discharge relationship established using the BaRatin framework (Le Coz et al., 2014) that also gives the uncertainty of the rating curve that is quantified as the 90 % confidence interval of discharge. The rating curve is based on numerous discharge measurements performed in 2012–2014 (Nord et al., 2017).
2.2.4 Additional data
Spatial data used for this study include a digital elevation model with a resolution of 5 m (Nord, 2015) and the Ardèche soil database by the French National Institute for Agricultural Research, Bureau de Recherches Géologiques et Minières and the French Department of Agriculture (Braud 2015; Nord et al., 2017). Furthermore, a 0.5 m resolution land use map of the Claduègne catchment based on QuickBird satellite images is available (Andrieu, 2015). Data on soil properties such as porosity, texture and saturated hydraulic conductivity were obtained during a measurement campaign in 2012 by Braud and Vandervaere (2015). Electrical conductivity (EC) of streamflow is continuously measured at the outlets of both catchments (OHMCV, 2011), and measurements of EC of overland flow from two runoff and erosion plots in a vineyard in the south of the Gazel catchment are available (OHMCV, 2009; Cea et al., 2015).
2.3 Precipitation data processing
The catchment mean hyetographs for both catchments are calculated from the HPiconet rain gauge data with the method of Thiessen polygons. Rain events are separated by using a threshold of 12 h without precipitation being recorded at any rain gauge. The onset of an event was defined as the first time rain occurred after a dry period of at least 12 h, the end as the last time with rain being recorded by at least one rain gauge before the next dry period. The threshold of 12 h provides a good compromise between having a high number of events and excluding two separate events that are not independent from each other. Averaged catchment rainfall is then summed over the whole period of the rain event to calculate cumulative event precipitation Pcum. Furthermore, mean rain intensity Iμ over the whole event as well as maximum rain intensity Imax at 2, 10, 20, 30 and 60 min are calculated using the averaged catchment rainfall.
Table 1Calculated measures of averaged soil moisture and its variability at different scales.
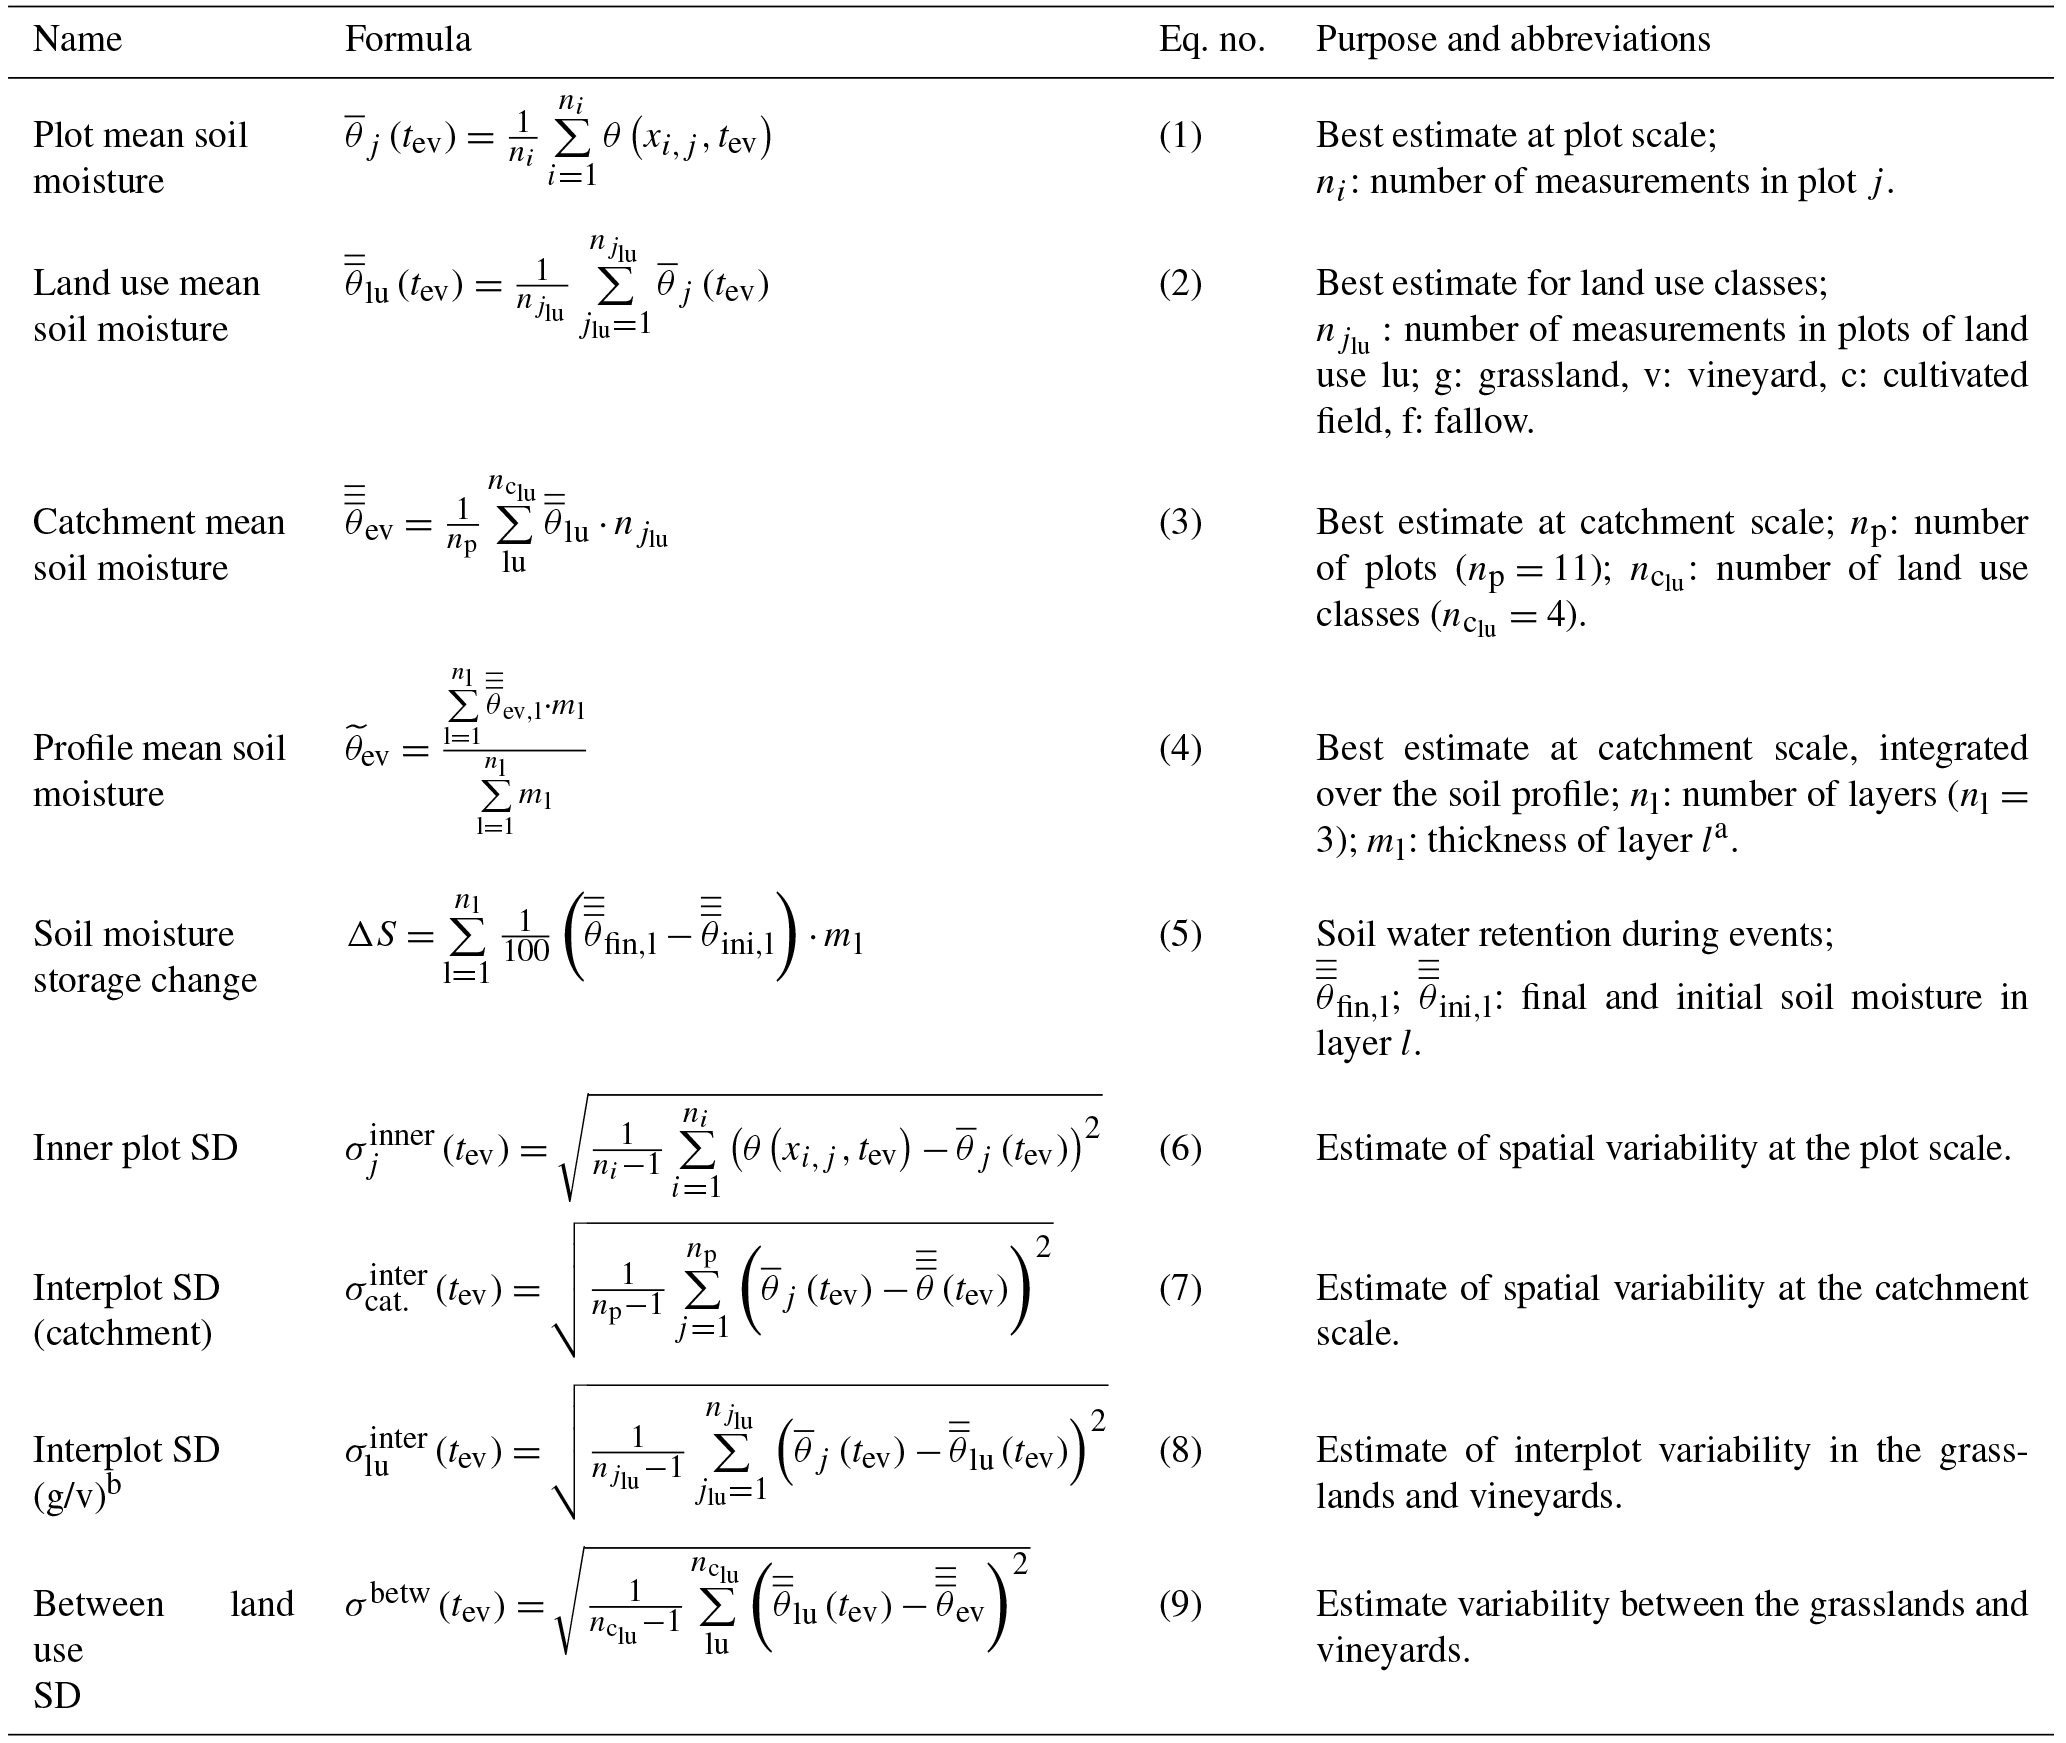
a Thicknesses of layers 1–3 are assumed to be 175, 150 and 275 mm. b Only calculated for grasslands and vineyards, because the number of plots is 1 for land use classes fallow and cultivated field.
2.4 Soil moisture analysis
From both data sets (continuous and on-alert measurements) plot and catchment mean values are calculated for the initial and final state of each rain event. From the continuous data, mean values are calculated for all three depths and the profile mean value is calculated.
) refers to a spatially and temporally discrete on-alert soil moisture measurement, with the subscript i denoting the index of the ni (usually 10) measurements within the plot, j denoting the plot and ev the event and the state (initial or final).
Mean soil moisture was calculated at the plot scale (), for each land use class () and at the catchment scale (). See Table 1 for the formulas. Plot means and catchment means obtained from the continuously measured data are computed for all three layers l. Here, the plot mean is obtained by averaging not only the probes installed at the same depth and the same location, but also all measurements in a dry period of 2 h before the onset or after the end of the rain event in order to diminish noise. The catchment mean averaged over the three layers , i.e., considering the topmost 60 cm, is calculated from the continuously measured data (Eq. 4, Table 1). Finally, for all events the soil moisture storage change ΔS (mm event−1) in the upper 60 cm is computed from the difference between initial and final soil moisture (Eq. 5, Table 1). It is assessed whether significant differences between the four land use classes exist by performing a visual inspection of box plots or histograms and Student t tests. Moreover, standard deviations σ as measures of spatial variability are calculated at the plot scale (, Eq. 6, Table 1) and at the catchment scale (, Eq. 7, Table 1). Furthermore, σ is calculated between plots of the same land use (, Eq. 8, Table 1) and between land use classes (σbetw(tev), Eq. 9, Table 1). As an estimate of the uncertainty of the calculated plot and catchment mean values, the standard error of the plot mean and the one of the catchment mean are calculated. It should be noted that is calculated from the on-alert measurements in the topsoil as well as from the continuous measurements over the soil profile, only from the on-alert measurements. The SEM is used as a measure of the confidence that the sample mean corresponds to the universal mean; it increases with the standard deviation and decreases with the number of sampling points.
Moreover, it is assessed whether temporal stability, i.e., consistency of soil moisture patterns at the catchment scale at different times of measuring (Vachaud et al., 1985), as reported by Huza et al. (2014) for six grassland plots in the Gazel catchment, is also found in the present on-alert data set: the relative spatial difference δj,ev of each plot corresponds to the relative difference between the plot mean and the catchment mean (Eq. 1); its temporal mean is calculated with Eq. (2):
The plot with the smallest δj,ev is the one that agrees best with the catchment mean at a given time of measurement. The temporal variability of the spatial difference serves as an auxiliary variable to assess whether this behavior is stable in time:
2.5 Hydrological response
2.5.1 Event-based runoff coefficients
In order to quantify the hydrological response of the catchment to different rainfall events, the dimensionless event-based runoff coefficient ϕev is calculated for all events:
To obtain cumulative event discharge Qev,cum, the time series of stream discharge Qtot has to be separated into baseflow Qb and event flow Qev. Qev is defined here to be the fast-responding part of discharge that occurs during or directly after the rain event. It usually encompasses surface runoff or overland flow and fast subsurface flow. Qb on the other hand is the slow responding part of discharge that lasts long after the rain event and feeds the stream between rain events. To obtain Qev,cum, Qev is summed up over the whole period of the event. The onset of a discharge event is defined as the first increase of discharge in response to a rain event. Defining the end of the eventdischarge is more complicated and depends on the hydrograph separation method (Blume et al., 2007). Usually, the end of the event flow is defined as the moment when Qb equals Qtot, but for some events the onset of a second event impedes this procedure which causes errors. Taking into consideration that there is no standard method for hydrograph separation and that results obtained with different methods can differ substantially (Blume et al., 2007), seven different hydrograph separation techniques are applied and compared (Sect. 2.5.2). The uncertainty of Qtot associated with the stage–discharge relation can be important, especially for high-flow conditions. This was taken into account by calculating ϕev with the upper and the lower limit of the 90 % confidence interval of discharge obtained with the BaRatin framework.
2.5.2 Hydrograph separation
Straight line method
The straight line (SL) method is a simple, graphical method where baseflow during the event is interpolated by connecting the point in the event hydrograph at which discharge first increases as a response to the rain event with the first point on the falling limb of the hydrograph with the same discharge value. As this condition is often never met, the end of the event flow is often determined by the onset of the next event or discharge below a threshold.
Constant-k method
The constant-k (CK) method proposed by Blume et al. (2007) is based on the assumption that baseflow recession behaves similarly to the outflow of a linear storage. Thus, baseflow at time step t can be described as exponential recession with the recession parameter k and initial flow Q0:
The value of k is calculated at each time step by differentiating Eq. (5) and division by Qb(t):
Event flow is assumed to terminate at time step te, which is defined as the end of the event runoff, once k becomes approximately constant. Baseflow is assumed to be equal to the discharge before the onset of event flow up to te when it equals Qtot.
Electrical conductivity method
Hydrograph separation is also conducted based on EC, which serves as a natural tracer (Miller et al., 2014; Pellerin et al., 2008). The method relies on the assumption that streamflow Qtot with electrical conductivity ECtot is a mixture of subsurface flow Qsb and surface flow Qs, which have significantly different EC signals ECsb and ECs (Nakamura, 1971):
Thus, with given values for ECsb (interpolated EC between values before the onset and after the end of the event discharge) and ECs (measured in overland flow collected at the outlet of four erosion plots representative of the signature of the rainfall flowing at the surface of soils developed on sedimentary rocks), a time series of Qsb can be calculated. As no ECs values were available for overland flow occurring on soils developed on basalts, covering half of the Claduègne catchment, the method could only be applied to the Gazel catchment, where the proportion of basaltic geology to total catchment surface is much smaller.
It should be noted that this method considers only the surficial part of event flow and is not able to separate the fast responding subsurficial flow occurring in the unsaturated zone. Thus, event flow is likely to be underestimated, especially in conditions under which the latter plays an important role.
Recursive digital filter
The RDF method proposed by Lyne and Hollick (1979) uses a low-pass filter to separate high-frequency event flow signals from low frequency baseflow signals:
where f(t) is filtered event flow at time t, a is a filter parameter that is usually in the range of (Nathan and McMahon, 1990) and Qtot(t) is original streamflow at time t. The data are passed through the filter several times, forwards and backwards. Recommendations for the number of passes vary depending on the temporal resolution of the discharge series (Ladson et al., 2013). The method is implemented in the R function BaseflowSeparation of the package EcoHydRology (Archibald, 2014).
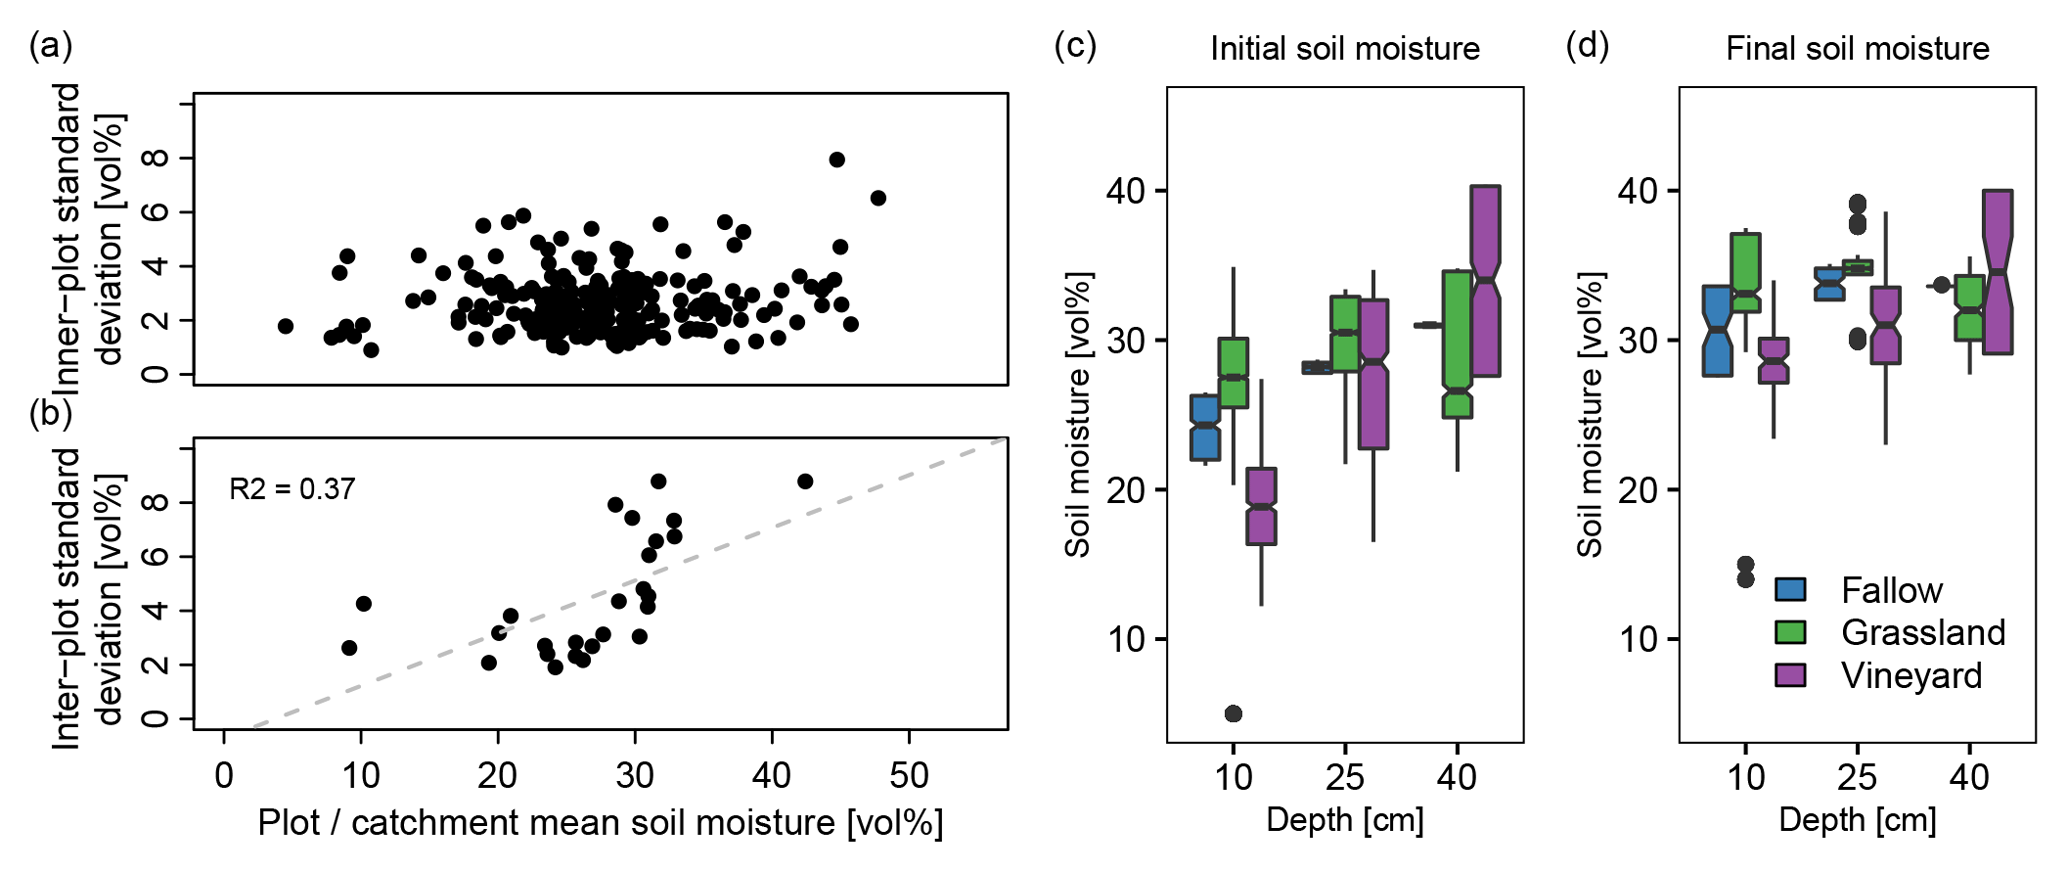
Figure 2(a) Relationship between plot mean soil moisture and inner-plot standard deviation , as calculated with Eqs. (1) and (6) in Table 1. Panel (b) shows the same at the catchment scale for catchment mean soil moisture and interplot standard deviation ) as calculated with Eqs. (3) and (7) in Table 1. The right panels show initial (c) and final (d) soil moisture profile in plots of different land use during event 27 (6–9 September 2013).
Hysep filters (HS1–HS3)
Three further filtering approaches are implemented in the Unites Stated Geological Survey's (USGS's) HySep program (Sloto and Crouse, 1996). It is based on finding minima in the discharge time series. The minima are determined either within fixed (HS1) or sliding (HS2) intervals or with a local minima algorithm (HS3). The interval width is adjusted according to Gonzales et al. (2009). It is applied using the R code of the USGS (2015).
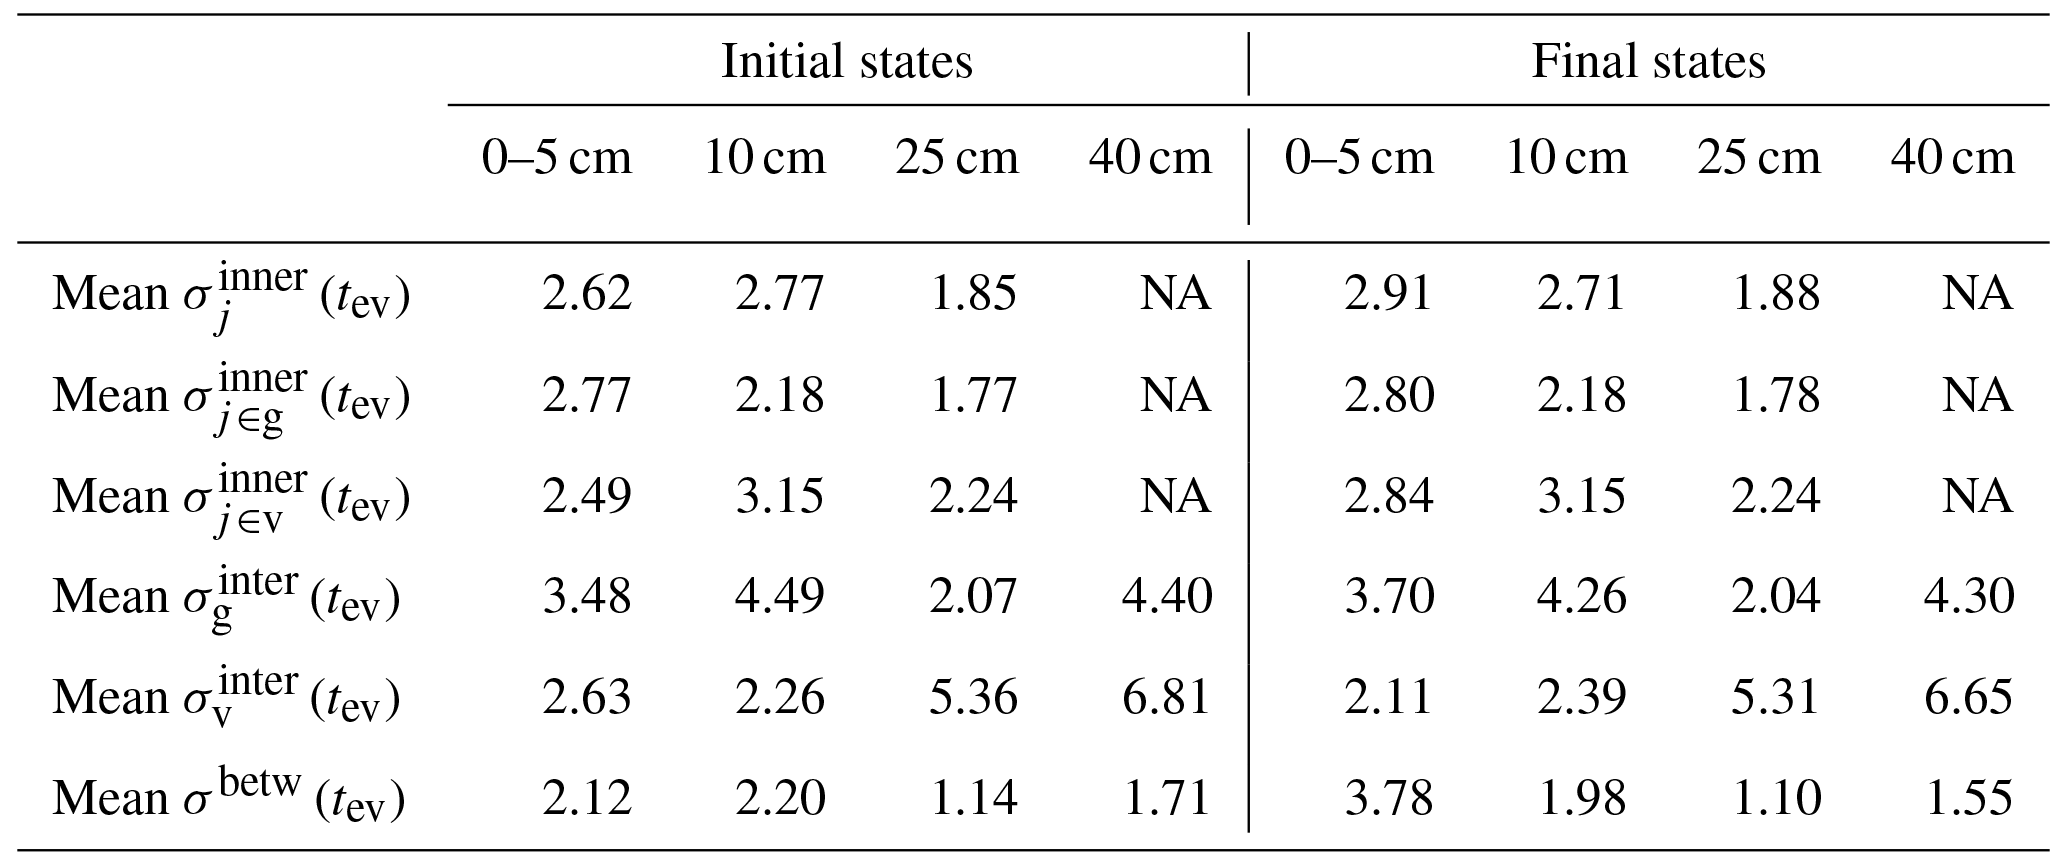
Table 2Spatial variability of soil moisture at the plot scale (mean of all events calculated for all plots: mean ; for the grassland plots: mean ; and the vineyard plots: mean calculated with Eq. 6 in Table 1) and at the catchment scale (mean interplot variability of the grassland plots: mean , and the vineyard plots: mean , calculated with Eq. 8 in Table 1 as well as between land use class variability mean σbetw.(tev), calculated with Eq. 7 in Table 1) determined at different depth with the two measuring schemes.
3.1 Spatial and temporal variability of soil moisture
The variability of soil moisture at the plot scale, determined from the on-alert measurements in the topsoil, is very high: the median range between the highest and the lowest measurement in one plot is 7.8 vol %, but maximum values can get up to >30 vol %. The mean of the inner-plot standard deviation ) is 2.7 vol %. Values range from 1 vol % to 8 vol % with no significant difference between the land use classes. There is no significant correlation between plot means and standard deviations (Fig. 2a). The inner-plot standard deviation in the deeper layers, determined with the continuously measuring probes, cannot be confidently assessed because of the low number of probes installed in each plot at the same depth. However, the difference of two sensors installed at the same depth indicate that the variability is in the order of the one derived from the on-alert measurements (Table 2).
The mean ) is 0.8 vol % with only 3 out of 228 data sets exceeding 2.0 vol %. Thus, the confidence that the population plot mean lies within the sample mean ) ±2.0 vol % is very high. This accuracy was achieved with about 10 measurements per plot. The variability at catchment scale is also high (Table 2), the catchment mean can be confidently assessed nonetheless. The mean of the standard error of the Claduègne catchment is 1.5 vol %, the maximum is 1.7 vol %. The mean of the Gazel catchment is 1.3 vol %, the maximum is 1.7 vol %.
Both the on-alert and the continuous measurements were analyzed for differences between the land use classes. In the present study site the plot means of grasslands, vineyards and a fallow are not significantly different from each other (Student t test, significance level α=0.05). Only in the cultivated field mean soil moisture is significantly and systematically different from the one in the grasslands. A comparison of the variability between the four land use classes expressed as σbetw(tev) to the one within land use classes or within plots also reveals that it is smaller than both other standard deviations (Table 2). The initial and final soil moisture profile of the first major event in 2013 (event 27) shows, nonetheless, that there are differences in the profile shape and in the wetting behavior between grasslands and vineyards (Fig. 2c and d). While the grasslands have a nearly homogenous profile before the rain event, the vineyards have a much more pronounced vertical soil moisture profile with higher values in the deeper layers. In response to the rain event, the profile of the grasslands shifts towards higher soil moisture, with similar differences in each depth. In the vineyards, mainly the moisture in the topmost layer increases, whereas soil moisture in the subsoil hardly changes.
Figure 3 shows the relative spatial difference δj,ev of all plots for all on-alert measurements conducted from 2012 to 2015. It can be seen that temporal stability is found to some degree. The mean values of some plots are (nearly) consistently below the catchment mean (v4, v3, g5, f1, c1), others above (g4, g3, g1). This is also the case if deviations were related to the land use mean instead of the catchment mean (see for example the noticeable difference between grasslands g2 and g5 on the one hand and g1, g3 and g4 on the other hand). However, there are also plots with above-average soil moisture for a certain period of time and below-average soil moisture during other periods, indicated by a change in signs of δj,ev between events (v1, v2, g2). The plots with the lowest mean spatial difference are v1, v2 and c1 (3 %, 4 % and 8 % respectively). The one with the lowest temporal variability of the relative spatial difference ( %) is the cultivated field c1.
Figure 4 shows the evolution of soil moisture in 10, 25 and 40 cm depth in autumn 2013. Due to several large rain events in July and August 2013 (not shown here), soil moisture at the beginning of the season is already relatively high. In the topsoil, however, soil moisture is much lower at the beginning of the season (Fig. 5). After the first major rain events, it remains constantly above 30 vol % at 10 cm depth and above 36 vol % in the deeper layers, with maximum values of around 42 vol % reached after major rain events. This value is not exceeded, even after rain events that occur during wet initial conditions.
Temporal variability of soil moisture varies considerably between wet and dry conditions. Soil moisture in all continuously sampled depths increases rapidly as a response to rain events (Fig. 4). Differences between initial and final state in the topsoil can be even larger (Fig. 5). The rapid response is evident from the small lag between the peak of rainfall and the peak of soil moisture (usually less than 2 h for all soil layers).
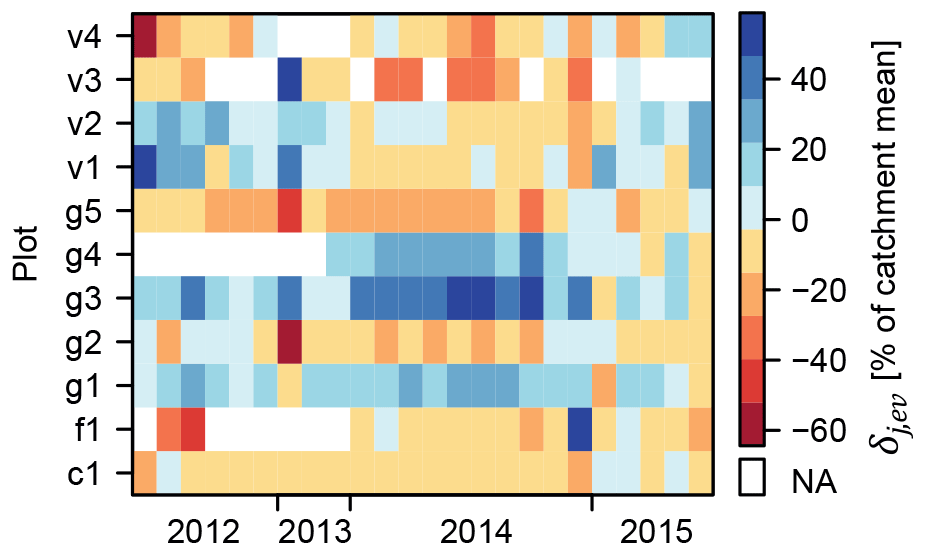
Figure 3Temporal stability (Vachaud et al., 1985): the relative difference between the plot mean and the catchment mean δj,ev for each on-alert measurement and each plot where on-alert measurements were conducted (four vineyards v1–v4, five grasslands g1–g5, one fallow f1 and one cultivated field c1). Note that the time axis represents a sequence of events, no equidistant time line. Blue squares show plots with plot means that exceed the catchment mean, red squares are those with plot means below the catchment mean, and white squares indicate plots that were not sampled during the respective measurement.
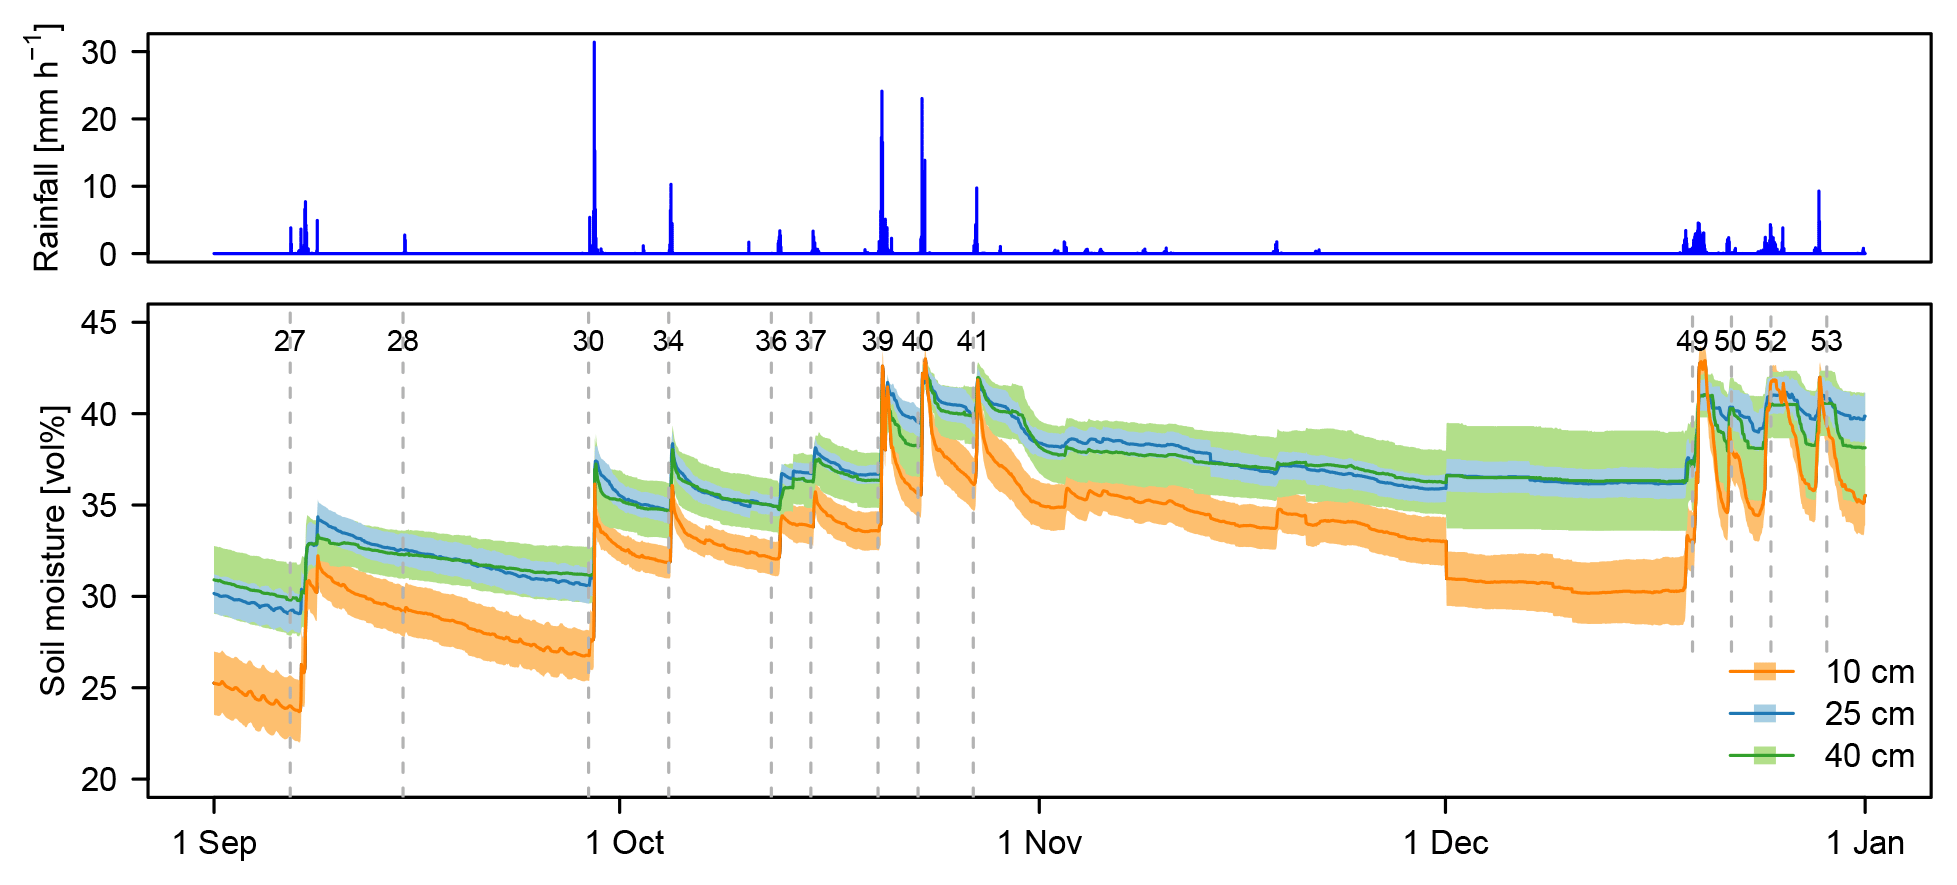
Figure 4Rainfall and soil moisture in autumn 2013 measured at 10, 25 and 40 cm depth. The line represents the catchment mean calculated with Eq. (3) in Table 1 in the respective depth and the shaded area the mean . The dashed lines represent the onsets of several rain events and the labels refer to the event numbers as in Tables 3 and 4. Note that on 27 November 2013 one of the probes stopped working, which is the reason for the step in the data and the higher .
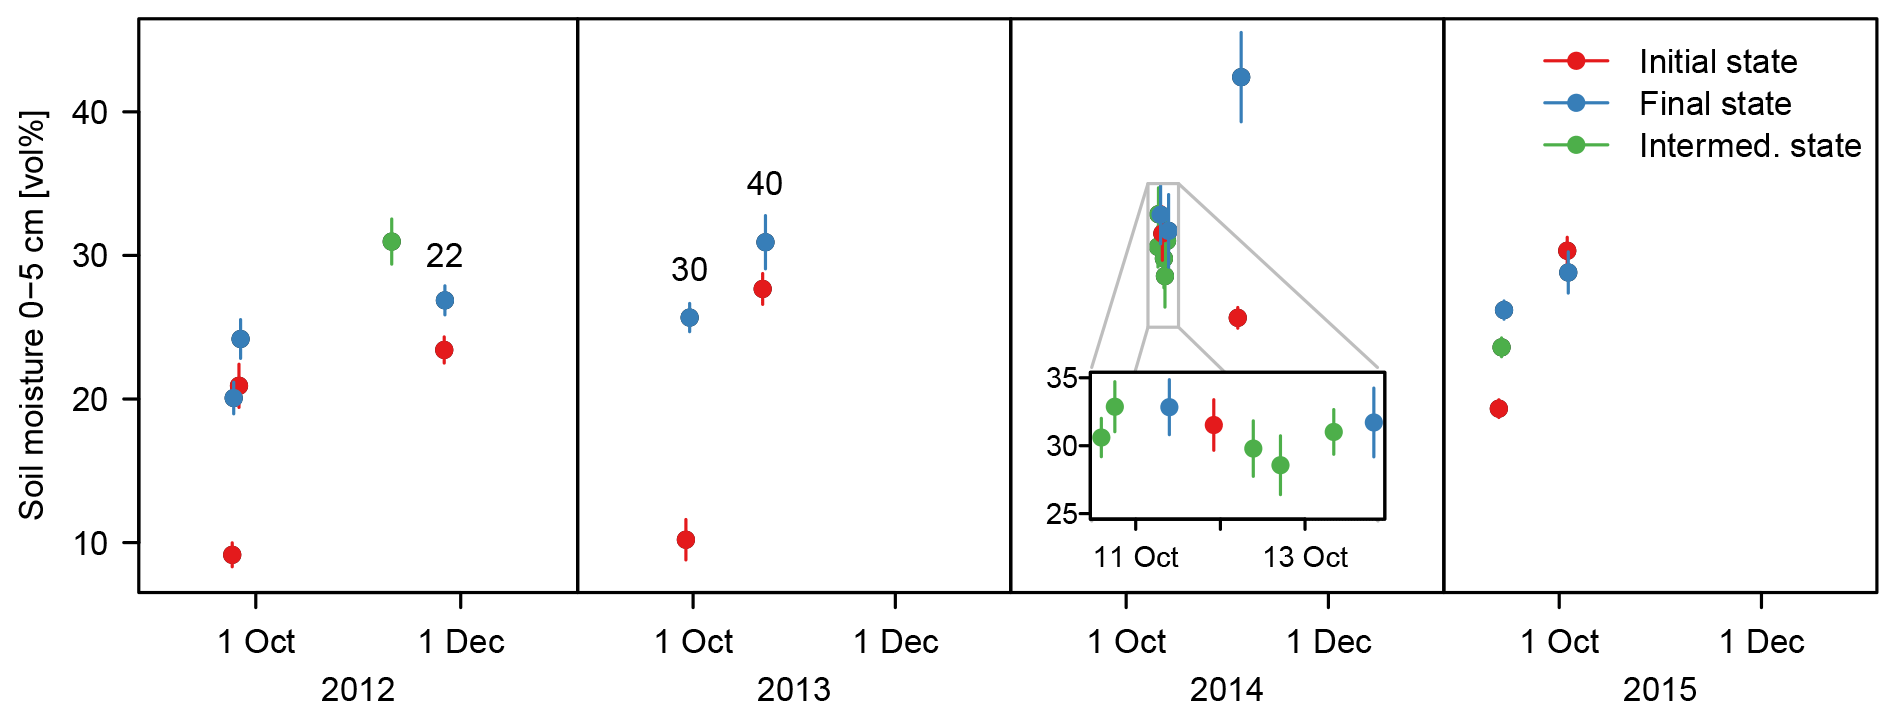
Figure 5Soil moisture in the topsoil (0–5 cm) measured on alert basis before and after major rain events in autumn seasons in 2012–2015. The points show catchment mean values, the lines the range of the mean . The numbers above selected events give the event number as in Tables 3 and 4 and as referred to in the text.
3.2 Event-based runoff coefficients
The event-based runoff coefficients ϕev calculated for the Gazel catchment with seven hydrograph separation methods for 54 events range from 0 to 0.99, with large differences between the methods and a high positive skewness (Fig. 6a). In the Claduègne catchment, ϕev was only calculated with the recursive digital filter method RDF and the HySep filter methods, but values still range from 0 to 0.97. The electric conductivity and constant-k methods result in the lowest values for ϕev while the three HySep filters yield considerably larger values than all other methods. Apart from the HySep filter methods, the other four methods correlate well with each other (Fig. 6b). The HySep filters correlate very well with each other (R2≥0.96 for all three pairs; not shown here), but to a lesser degree with the other methods (Fig. 6b). For the following sections, values of ϕev determined with the RDF method are used for reasons explained in the discussion (Sect. 4.4).
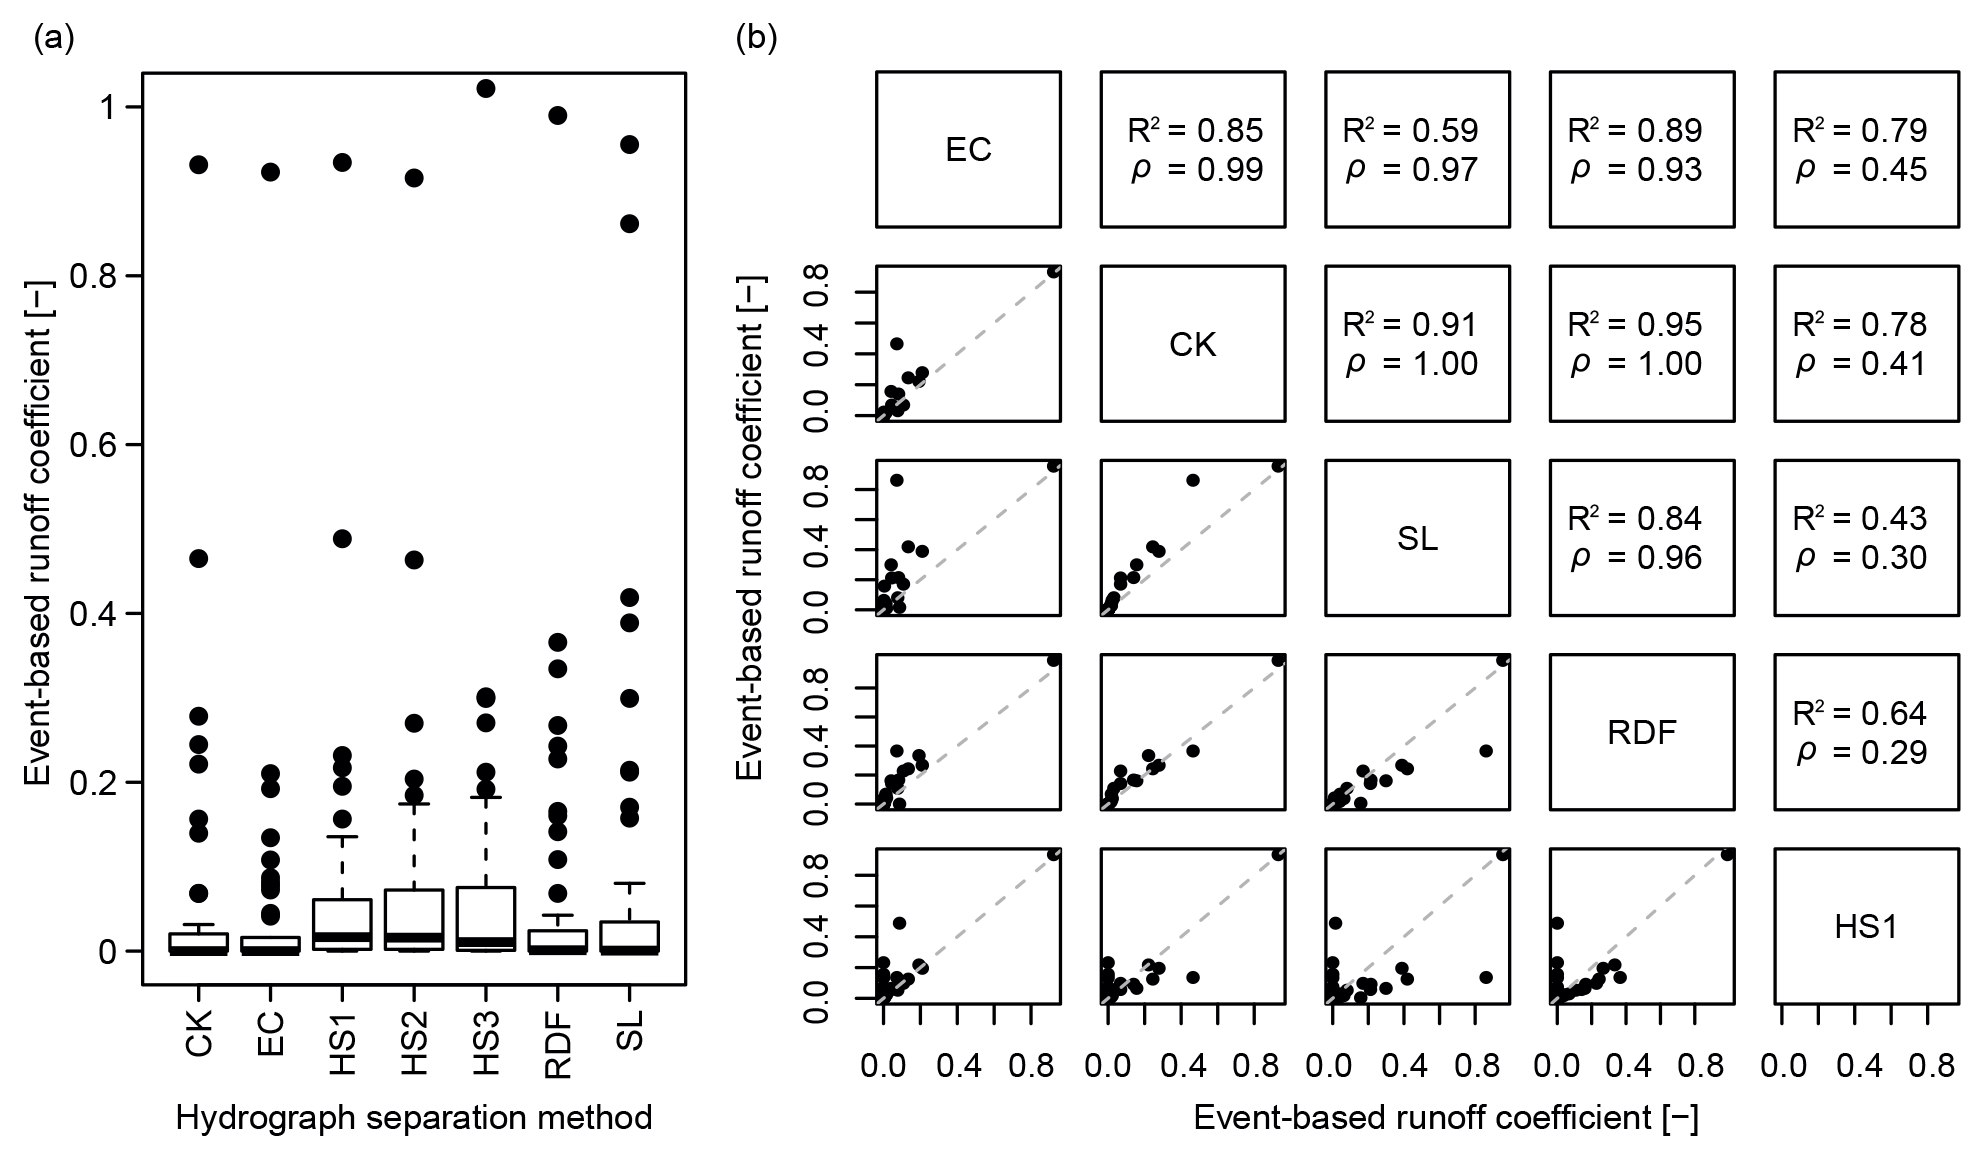
Figure 6(a) Differences of event-based runoff coefficients ϕev calculated for 54 rain events in the Gazel catchment in autumn 2012 and autumn 2013 derived with different methods for hydrograph separation. (b) Correlation between different methods. The upper panel gives the coefficient of determination (R2) and Spearman's rank correlation coefficient ρ, the dashed line in the lower panel is the line of identity. The methods used for hydrograph separation are described in Sect. 2.5.2: constant-k (CK), electric conductivity (EC), Hysep filter with fixed or sliding interval (HS1–HS2), Hysep filter with local minima algorithm (HS3), recursive digital filter (RDF) and straight line (SL).
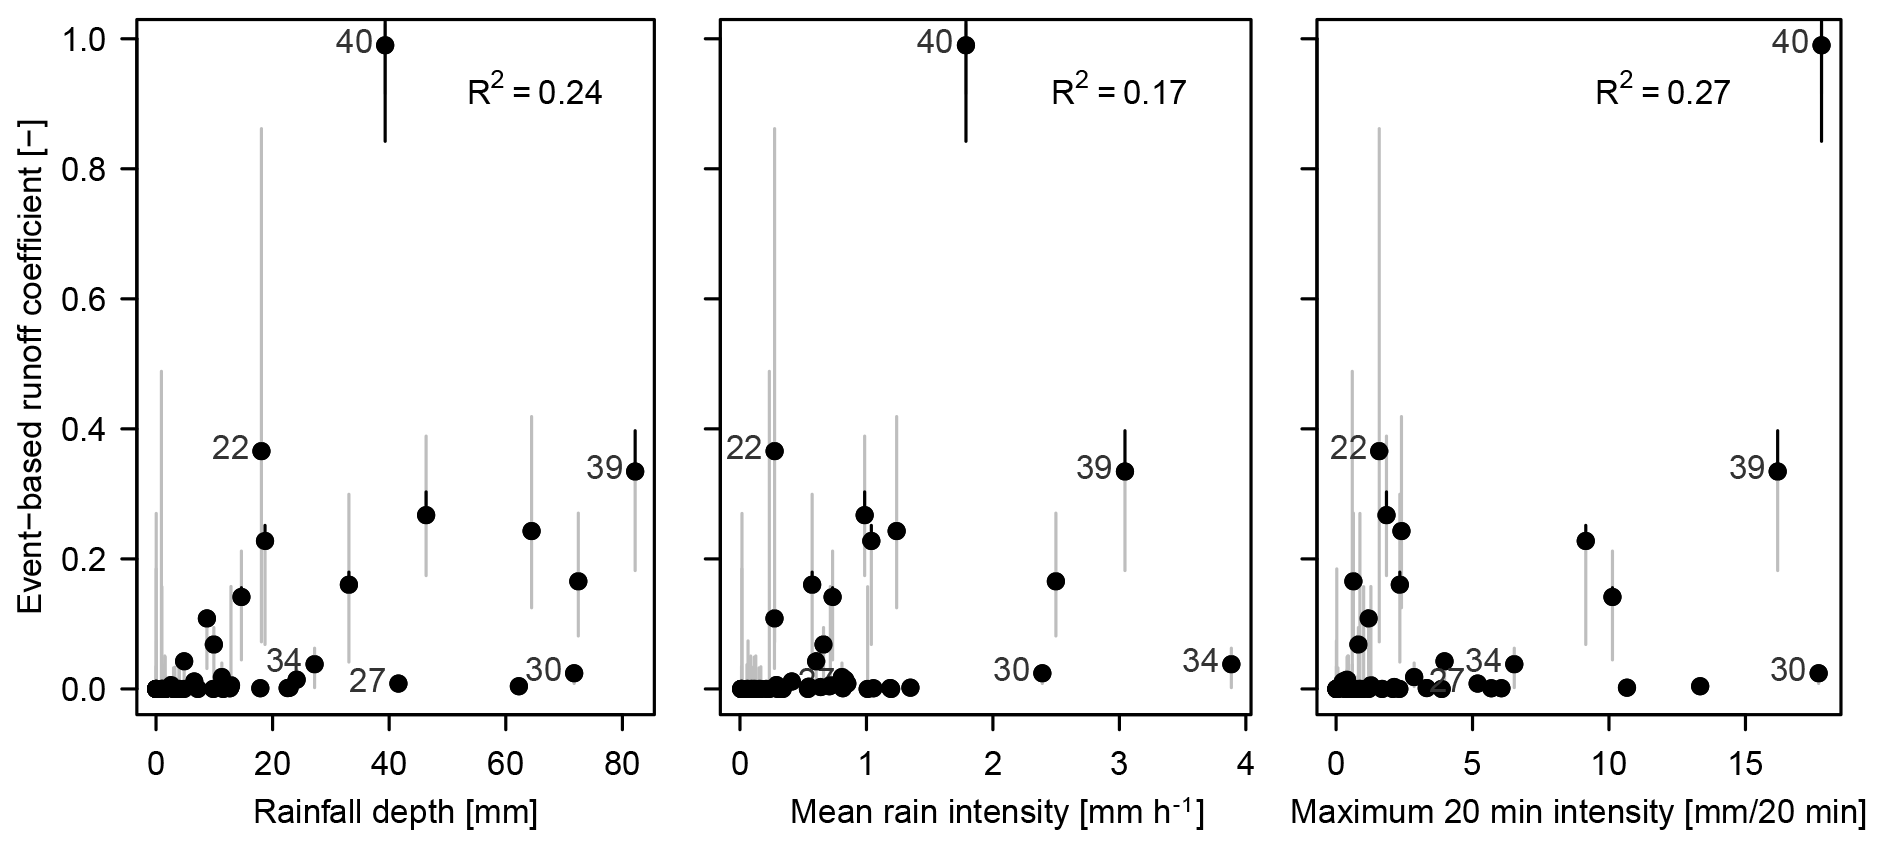
Figure 7Correlation of three variables describing meteorological forcing with event-based runoff coefficients ϕev of the Gazel catchment calculated with the recursive digital filter method. The lines represent the uncertainty associated with the hydrograph separation method (gray vertical lines: range of ϕev calculated with the seven different methods) and the stage–discharge relation (black vertical lines: range between ϕev calculated with the 5 % and the 95 % confidence interval of discharge obtained with the BaRatin framework). The point labels give the numbers of selected events as in Tables 3 and 4 and described in the text.
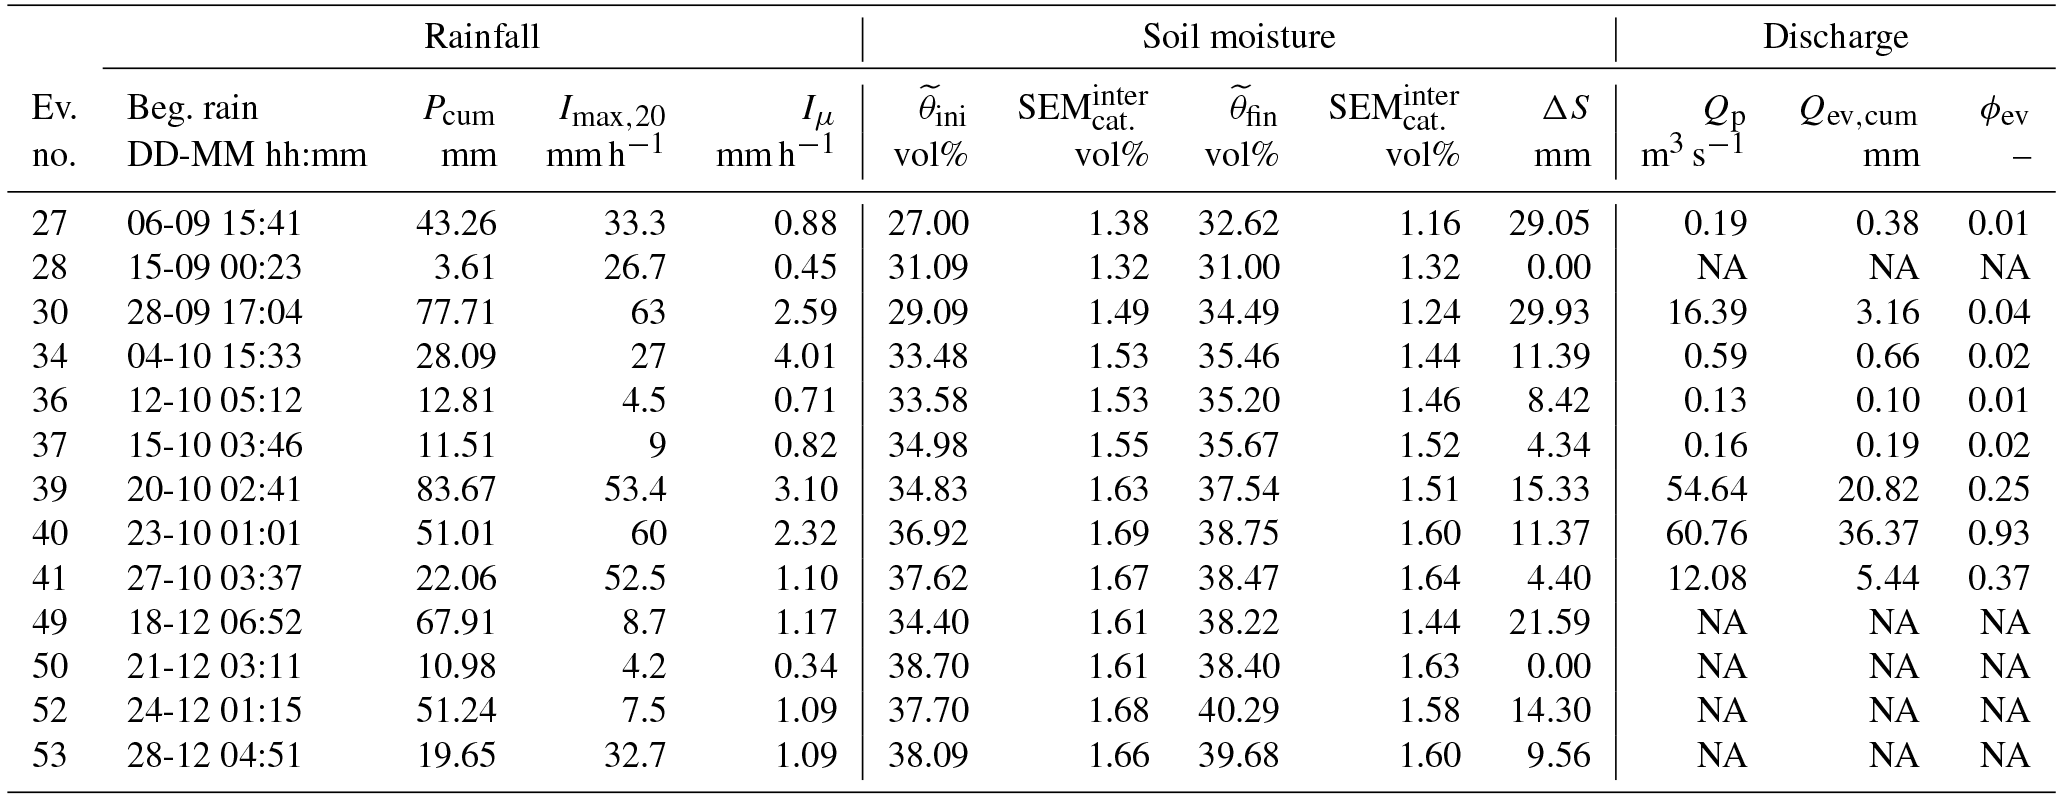
Table 3Rainfall, soil moisture and discharge characteristics of selected rain events in autumn 2013 in the Gazel catchment: beginning of the rain event, cumulative precipitation (Pcum), maximum 20 min rain intensity (), mean intensity (Iμ), initial soil moisture (), final soil moisture (), standard error of the catchment mean () during initial and final stage, soil storage change at depth 0–50 cm (ΔS), peak discharge (Qp), cumulative total discharge (Qtot,cum), cumulative event discharge (Qev,cum) and event-based runoff coefficient calculated with the recursive digital filter method (ϕev).

Table 4Rainfall, soil moisture and discharge characteristics of selected rain events in autumn 2013 in the Claduègne catchment; abbreviations as in Table 3.
The uncertainty of ϕev associated with the stage–discharge relation is shown in Fig. 7 as black vertical error bars. In both catchments this uncertainty is very small for events with low ϕev while it can get up to 0.28 (difference between ϕev calculated with the 5 % and the 95 % confidence interval of discharge) for event 40, which is the one with the highest ϕev and highest discharge in both catchments (Tables 3 and 4). The uncertainty due to different ϕev obtained by different hydrograph separation methods is visualized as gray vertical error bars in Fig. 7. It can be very high for any event regardless of the ϕev and is often due to the discordance of the HySep methods with the other methods. The mean standard deviation of ϕev calculated with different hydrograph separation methods is 0.03, when the HySep methods are excluded it decreases to 0.02. However, these measures are biased by the important positive skewness of the distribution of ϕev.

Figure 8Hyetographs, hydrographs of total discharge and evolution of soil moisture in the Gazel catchment during four different events in 2013. The event-based runoff coefficient ϕev is also given for all events. The representation of soil moisture gives the mean in the respective depth and that of discharge the best estimate ± the uncertainty of the stage–discharge relation.
Factors that are suggested to influence ϕev include rainfall depth and rain intensity. Figure 7 shows the correlation of the meteorological forcing quantified as cumulative catchment rainfall depth Pcum, mean rain intensity Iμ and maximum 20 min rain intensity with ϕev. In the present data set there is a weak correlation between ϕev and the meteorologic variables Pcum, Iμ and (Fig. 7). The correlations of ϕev with maximum rain intensity calculated at 2, 10, 30 and 60 min time steps were worse that the one at 20 min. None of these variables can, therefore, explain more than 30 % of the variability of ϕev. Figure 7 shows that events with similar rainfall characteristics (events 30 and 40, similar intensity) can have very different ϕev. Additionally, similar ϕev are obtained for events with very different rainfall characteristics (events 22 and 39). These striking differences in catchment behavior can partly be attributed to differences in initial soil moisture as shown in the following section.
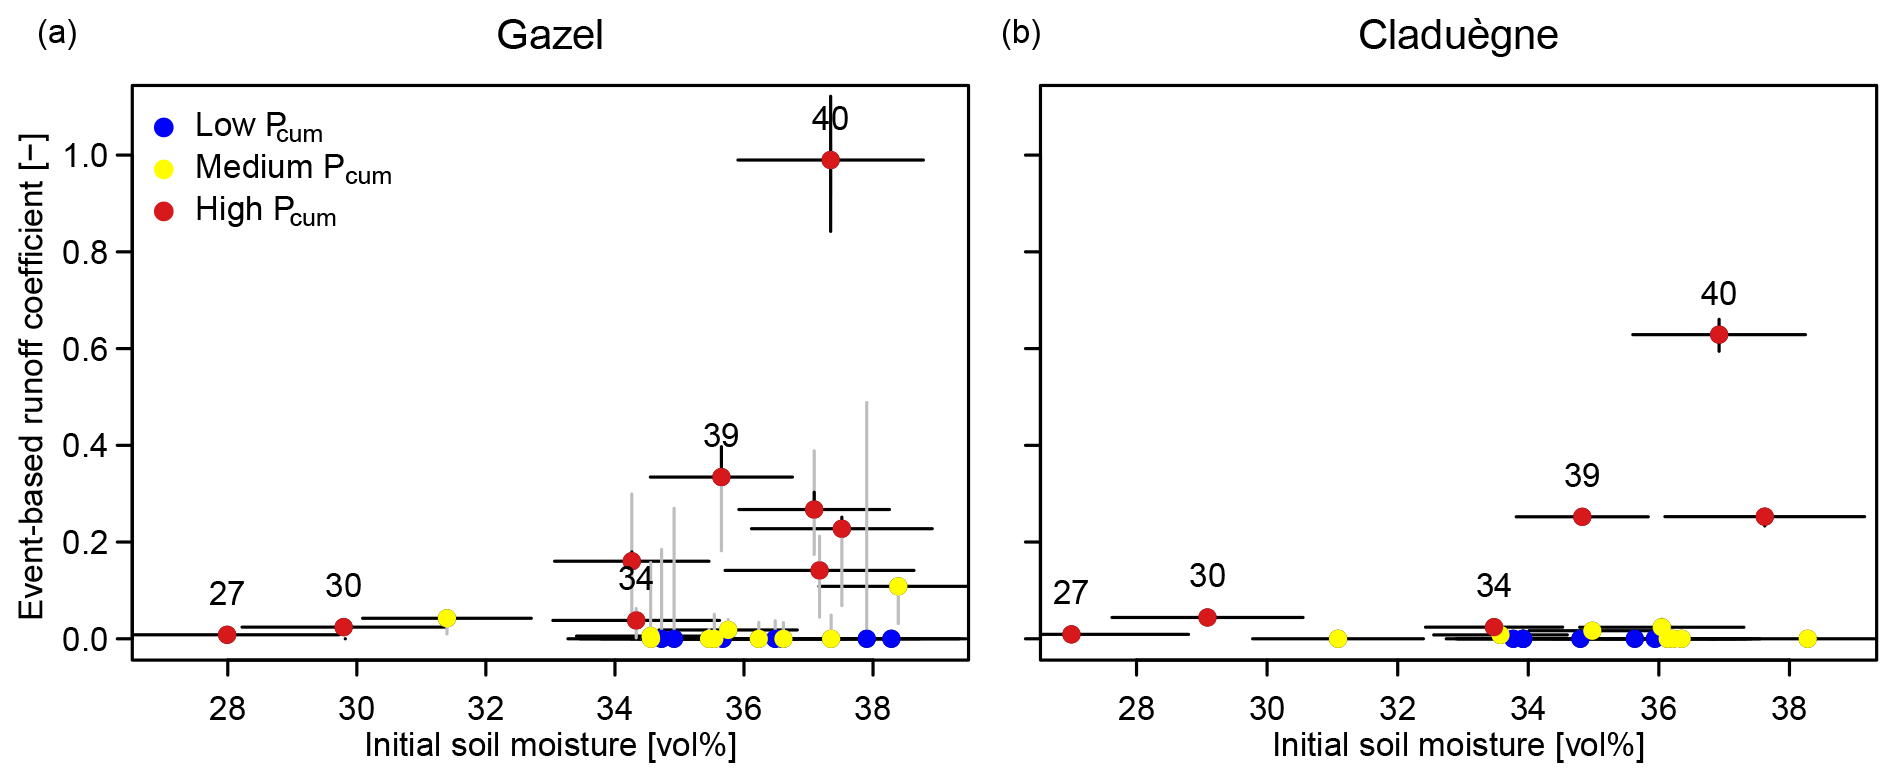
Figure 9Relationship between initial soil moisture and event-based runoff coefficients ϕev in the Gazel (a) and Claduègne (b) catchments. On the x axis the point represents the profile mean initial soil moisture and the horizontal line the range of the mean . On the y axis the point represents ϕev calculated with the recursive digital filter method and the line the uncertainty as in Fig. 7. The color of the points indicates whether cumulative precipitation is low (Pcum<1.5 mm), medium (1.5 mm mm) or high (Pcum>13 mm).
3.3 Soil moisture's impact on runoff generation
The hydrological responses concerning the temporal dynamics of soil moisture and discharge in reaction to rain events of the two catchments vary greatly. In Tables 3 and 4 the characteristics of all rain events in autumn 2013 that generate event flow at the river gauges of the Gazel and/or Claduègne are given. The hyetographs, hydrographs and time series of catchment mean soil moisture of four of these events with very different behavior are exemplarily shown in Fig. 8: event 27 and event 30 occur at the beginning of the season when soil moisture is still relatively low. Rainfall leads to a considerable increase in soil moisture in all three layers and to a storage change ΔS in the topmost 50 cm of the soil profile that constitutes a notable share of cumulative precipitation. For event 30 on-alert surface soil moisture measurements show a sharp increase from 10.2 vol % before the event to 25.7 vol % afterwards (Fig. 5). The runoff coefficients ϕev of both events are very low. The within-event temporal dynamic of rainfall, soil moisture and runoff during event 27 is also noteworthy: the discharge peak does not follow the rainfall peak, which is closely followed by the steepest increase in soil moisture, but the second rainfall pulse that occurs when soil moisture is considerably higher than at the beginning of the event. As a response to this much smaller rainfall impulse, soil moisture rises only slightly. This behavior is also observed during event 40, when the first rainfall impulse leads to a sharp increase in soil moisture and only a small discharge peak, while the second rainfall pulse generates a substantial discharge peak and only a slight increase in soil moisture. Event 40 and event 53 both occur during wet initial soil moisture conditions, but event 53 has a much smaller ϕev than event 40. During these two events an inversion of the vertical soil moisture profile, i.e., temporally higher soil moisture at the topsoil than in deeper layers, can also be observed at approximately the time of peak discharge. This inversion is an indicator of Hortonian overland flow. Overland flow was indeed observed during event 40 in vast areas in the north of the Claduègne catchment (Supplement S2).
The large range of ϕev of events with high can also be seen in Fig. 9. While the three events with low consistently have very low ϕev, above a threshold of approximately 34 vol %, ϕev can have a value anywhere between zero and one. An examination of Fig. 9 shows that both high and high Pcum are necessary but not sufficient criteria for high ϕev and that the relation between and ϕev is characterized by strong nonlinearity and threshold effects. This is observed in both catchments and the threshold value is very similar for the Gazel and the Claduègne catchment. Further analysis of the relation between and ϕev for events with high Pcum and high is limited because of the low number of events fulfilling these criteria and the uncertainty of both and ϕev.
Consideration of single events shows that can partly explain the high scatter in Fig. 7. The contrary behavior of events 30 and 40 can be explained by different initial soil moisture conditions. It can also be hypothesized that the high ϕev of event 22 despite low Pcum, Iμ and is due to high initial soil moisture. For this event, that started on 26 November, 2012, only on-alert soil moisture is available and initial topsoil moisture is relatively high at 23.5 vol %. The event occurred late in the season (26 November 2012, Fig. 5) 2 weeks after a heavy rain event with Pcum=72.5 mm. However, event 39, which has a similar ϕev higher Pcum, Iμ and , also occurred during high initial moisture conditions, which indicates that the relation between ϕev, and rainfall characteristics cannot easily be generalized.
4.1 Soil moisture estimation at the catchment scale
The sampling design applied in this project proved to be efficient to assess spatial variability of soil moisture across scales, as well as to document temporal dynamics. The on-alert measurements of soil moisture allow a good estimate of the plot mean, with a low mean of 0.8 vol % as well as an accurate estimate of the inner-plot variability, quantified as during wet and dry conditions. On the other hand, the continuous soil moisture measurements cover a larger extent of the two studied catchments and different depths in the soil profile. Due to the higher variability at the catchment scale, the mean is somewhat higher (1.5 vol %). The values obtained for and show that at an accepted uncertainty of the mean of ±2 vol %, the number of 10 measurements per plot is sufficient. This is consistent with the results of Zucco et al. (2014), who found a maximum number of 11 or 20 required samples at the plot scale and catchment scale respectively, and those of Molina et al. (2014), who concluded that plot mean soil moisture in a Mediterranean mountain area was well represented with nine probes. The review by Vereecken et al. (2014) shows that there is a wide range of estimates for these numbers and that they are site specific. The continuous measurements reveal the temporal evolution of soil moisture over the season and within events. The only drawback is the lack of continuous soil moisture estimates in the topsoil. The sampling at the plot scale and in nested catchments is considered to be a good approach to assess heterogeneity across scales and to cope with the change of scale problem (Braud et al., 2014).
In this study the interplot variability within one land use class usually exceeds the inner-plot variability . This is not consistent with findings of Huza et al. (2014), which may be due to different sampling strategies: whereas Huza et al. (2014) conducted measurements along 50 m transects, for this study random locations were sampled within one field in an area of ≈20 by 20 m. At scales larger than 10 m, they found a spatial structure revealed by a higher semi-variance at distances of more than 10 m in at least one of their transects.
The results of this study indicate differences between grasslands and vineyards in the vertical soil profile and in the response of the profile to rain events. These differences are most likely due to differences in soil texture, as vineyards are usually found on soils with higher clay content than the ones of the other land use types. However, there are no significant and systematic differences between the plot means of different land use classes. Thus, land use cannot be used as additional information to improve spatially distributed soil moisture estimation in the study site.
The cultivated field c1 shows a remarkable temporal stability of the difference of this plot's mean soil moisture and the catchment mean δj,ev. This suggests that if the catchment mean has to be approximated by measurements in just one field, this one is the best choice (Vachaud et al., 1985; Vanderlinden et al., 2012). Other fields show, however, that δj,ev is not consistent in time. The observation that several sites change the sign of δj,ev between measurements was also made at the plot scale on a grassland, a field cultivated with wheat and an olive grove by Vachaud et al. (1985) and at the catchment scale on grasslands by Huza et al. (2014). Here, notably the vineyards v1 and v2 are considerably wetter than the catchment mean throughout the autumn seasons of 2012 and 2013, dryer in 2014 and wetter again in 2015. Possible reasons include changes in cultivation. In particular, tillage practices play an important role in the vineyards (not shown here). Therefore, conclusions based on this finding should be considered carefully. Moreover, the choice of the plot which best represents the catchment mean should include the temporal variability of δj,ev and should not be solely based on the minimal mean difference , which is in this case that of v1 and v2.
4.2 Quantification of the hydrological response
The available precipitation and discharge data at a high spatiotemporal resolution is a major asset that is necessary to understand the hydrological processes at small scales and during short time spans that lead to flash flood generation (Nord et al., 2017). It allows the event-based runoff coefficient ϕev to be calculated and its uncertainty to be estimated. The main sources of its uncertainty are that of the stage–discharge relation, which is especially important for events with high discharge and which was assessed with the BaRatin framework; the uncertainty associated with the choice of the method used for hydrograph separation; and the uncertainty of the catchment mean precipitation. The latter source of uncertainty is not considered in this study. It stems from the rainfall measurements with tipping buckets and the interpolation between the rain gauges. Tipping buckets are known to underestimate precipitation at high intensities (Marsalek, 1981; Molini et al., 2005); thus, including radar data could improve the estimation of catchment mean rainfall even in relatively well-gauged catchments such as those of the Gazel and Claduègne (e.g., Creutin and Borga, 2003; Delrieu et al., 2014; Abon et al., 2015).
In this study, the uncertainty associated with the hydrograph separation method exceeds that of the stage–discharge relation. The high range and positive skewness of event-based runoff coefficients is consistent with the results of other studies (Merz et al., 2006; Blume et al., 2007; Merz and Blöschl, 2009; Norbiato et al., 2009; Marchi et al., 2010). The dependence of ϕev on rain characteristics suggested by other authors (Merz et al., 2006; Norbiato et al., 2009) was not entirely confirmed in this study, as none of the rain characteristics examined here (Pcum, Iμ, ) could explain more than 30 % of the variability in ϕev.
Each of the hydrograph separation methods used here has advantages and disadvantages. The method based on electric conductivity has a physically based foundation as it distinguishes components with different EC and represents subsurface flow dynamics. This method could not be applied to both catchments because values for surface flow ECs were only available from Le Pradel in the south of the Gazel catchment, and it is assumed that ECs on the basaltic plateau differs considerably as this geology accounts for a large part of the Claduègne catchment. Furthermore, it is not possible to conduct a three-component hydrograph decomposition with the available data, so unlike with the other methods, the fast reacting subsurface flow is considered to be baseflow. Thus, event discharge is underestimated.
Unlike the other methods, the CK method offers a physical explanation for the end of the event flow. The method builds on the assumption of baseflow behaving like the slow responding outflow of a linear reservoir. For the discharge data of the Gazel, this method could not always be applied because of the low discharge that results in “steps” in the data and high noise so the threshold for defining that k is constant as proposed by Blume et al. (2007) was never reached. An adjusted threshold yielded reasonable results for some but not all events.
The straight line method was rejected because it does not consider baseflow dynamics and the end of the event flow has to be determined arbitrarily. The filter methods have the advantage of being easy to apply to all data sets without further data treatment or demand of additional data, but these methods are very sensitive to parameters such as the interval width (HySep filters) or the number of passes (RDF). The HySep filters were discarded because of the disagreement with the other methods. Thus, the RDF method was used for all further analyses because it correlates well with the EC and CK methods and can easily be applied to all events and both catchments. The number of passes had to be calibrated, as suggested by Ladson et al. (2013), in such a manner that ϕev is below 1 for all cases and that it is slightly higher than the value obtained with the EC method in order to compensate for the underestimation of event discharge. Nonetheless, underestimation of event discharge is still a source of uncertainty.
4.3 The impact of initial soil moisture on the hydrological response
The relation between ϕev and is not as clear as one might have expected from other studies' results. Moreover, both variables are still subject to large uncertainties. Catchment mean initial soil moisture below a threshold of 34 vol % inhibits high ϕev. However, only three of the events considered here occur during such dry conditions, so further measurements would be useful to corroborate this finding. Threshold effects in the relation of ϕev and are also observed by other authors (e.g., McMillan et al., 2014; Hrachowitz et al., 2011). In the Mediterranean context, the thresholds obtained by Huza et al. (2014) in the Gazel catchment and Braud et al. (2014) in the Valescure catchment (22 vol % and 25 vol % respectively) are lower than the one obtained here. The threshold at 45 vol % observed by Penna et al. (2011) in a 1.9 km2 headwater catchment in the Italian Dolomites, on the other hand, is higher than the one obtained here. McMillan et al. (2014) show that thresholds in different subcatchments of a 50 km2 catchment in New Zealand are highly variable: they range between 27 vol % and 58 vol % and are more or less pronounced in different subcatchments. These differences might be due to different soil and land use features, climate, and sampling designs. The values for that Huza et al. (2014) used are obtained from satellite data, while this study uses in situ data from several land use classes. Moreover, a profile mean is considered here, while Huza et al. (2014) used only values of topsoil moisture. Furthermore, different methods were applied for hydrograph separation. Huza et al. (2014) used a method similar to the HySep 3 filter, which yielded different results than the other methods applied for this study.
The high range of ϕev obtained at high also agrees with findings of Huza et al. (2014). It indicates that the hydrological response is influenced by other factors as well. The parameters describing the impact of meteorological forcing (Pcum, Iμ and ) neither explain that variability. When only events with high cumulative precipitation are considered, the range is still very high. Results obtained in virtual experiments (Merz and Plate, 1997; Bronstert and Bárdossy, 1999; Zehe and Blöschl, 2004) showed that spatial patterns of soil moisture and threshold effects strongly impact the runoff response. The latter authors show that, especially during initial moisture conditions close to the threshold, the runoff response depends strongly on the resampling of spatially distributed soil moisture. Therefore, actual, small-scale soil moisture patterns that control connectivity of pathways but are not reflected in the catchment mean value are a possible explanation for the very diverse runoff behavior. On the other hand, Morbidelli et al. (2016) conclude that spatial heterogeneity of does not affect the runoff response for events that are associated with floods, so more research is needed on this topic. Additionally, subsurface flow along preferential flow paths can contribute to high ϕev and Hortonian overland flow is not directly related to but produces a substantial proportion of event flow.
The results of this study partly confirm the suggestions of other authors (i.e., Brocca et al., 2009b; Javelle et al., 2010; Grillakis et al., 2016) to consider estimates of initial soil moisture in flash flood warning based on the dependence of ϕev on . This offers high potential for predictions in poorly gauged or ungauged basins given the global availability of remote sensing soil moisture data (Crow et al., 2005; Beck et al., 2009; Brocca et al., 2009c; Massari et al., 2014a, b). Threshold-based warning systems are advocated, by Norbiato et al. (2008) for example. Including a threshold value for initial soil moisture could prevent false positive flash flood warnings in cases in which high precipitation is expected under dry initial catchment conditions, while above-threshold soil moisture in combination with high precipitation increases the likelihood of high runoff coefficients. This threshold seems not to be scale dependent. However, the threshold values differ between catchments and depend to a high degree on the methodology to determine it, as indicated by the different values in this study and that by Huza et al. (2014). Furthermore, there are high data requirements to determine such thresholds and it is not known whether they can be transferred from one catchment to another, so it is not applicable for operational flash-flood warning. Moreover, the high scatter of ϕev under high initial soil moisture conditions suggests that the relation between ϕev and is very complex and depends on other factors and processes that are still insufficiently understood. Thus, the impact of soil moisture on the hydrological response during wet catchment conditions cannot be generalized based on the results obtained here. Further research and instrumentation could include the installation of piezometers in the catchment to understand subsurficial flow in the catchment, using tracers other than EC to differentiate subsurficial stormflow as a third flow component during hydrograph separation as well as the application of multivariate regression analysis methods that systematically examine different controls on ϕev, such as meteorological forcing as well as and their interactions.
This study aimed at assessing the influence of initial soil moisture on the hydrological response in a flash-flood prone area in southern France. To this end, two issues were addressed and exemplarily examined in the nested Gazel (3.4 km2) and Claduègne (43 km2) catchments: (1) obtaining a meaningful estimate of soil moisture at the catchment scale and (2) analyzing the relation between initial soil moisture and the hydrological response quantified as the event-based runoff coefficient ϕev.
The main findings of this study related to the first objective are as follows:
-
Spatial variability of soil moisture at the plot scale and at the catchment scale is very high. There are differences between land use classes in the vertical soil moisture profile and in wetting behavior, but no significant and systematic differences in catchment mean soil moisture values between land use classes exist. Between land use standard deviation exceeds neither σinter nor σinner.
-
There is one plot, c1, with remarkable temporal stability of the spatial difference between plot mean and catchment mean. Thus, this field should be opted for, if the catchment mean has to be assessed from measurements in just one plot. However, not one of the other plots shows this temporal stability.
The sampling design applied for this study allowed a detailed characterization of soil moisture heterogeneity across scales as well as the assessment of temporal dynamics. The catchment mean soil moisture was derived with a mean standard error of the catchment mean of 1.3 vol % or 1.5 vol % for the Gazel and Claduègne catchments respectively.
Main findings concerning the impact of initial soil moisture on the hydrological response quantified with the event-based runoff coefficient ϕev are as follows:
-
The ϕev obtained with different hydrograph separation methods can differ considerably, but results obtained with EC, CK, SL and RDF methods correlate well. The RDF method was preferred for this study because it is easy to apply and because of the good correlation with the more physically based methods EC and CK, which could not be applied to all events and both catchments.
-
There is a weak correlation between ϕev and cumulative event precipitation Pcum, mean rain intensity Iμ and maximum 20 min rain intensity (R2=0.24, 0.17 or 0.27 respectively).
-
The hydrological response depends on initial soil moisture : below a threshold of 34 vol %, ϕev remains very low, even during high precipitation events. However, there is a large scatter in ϕev above that threshold, indicating that other factors and processes also have an important impact on ϕev. The threshold is identical for both catchments, which indicates that at this study's site it might be scale invariant.
-
Analysis of the seasonal and within-event evolution of soil moisture and discharge shows that discharge peaks of two considered events did not follow the peaks in rainfall, but a second, smaller rain impulse, while the rainfall peaks lead to a considerable refilling of soil water storage.
These results indicate that does impact the hydrological response. For single events ϕev can be attributed to , Pcum or . However, these results cannot be generalized and no systematic and unequivocal relationship between and ϕev was found. Even though the present data set is exceptionally detailed, there still is substantial uncertainty in the values for , Pcum and cumulative event flow Qev,cum.
The results of this study support suggestions by other authors to include estimates of initial soil moisture in flash flood warning, based on the dependence of ϕev on , by including a threshold that could prevent false positive flash flood warnings under dry initial conditions. Further research could focus on the role of subsurface flow and on elaborating multivariate regression analysis methods.
All data used for this study are publicly accessible. The data published by Nord et al. (2017) can be downloaded at https://www.earth-syst-sci-data.net/9/221/2017/essd-9-221-2017-assets.html (last access: 19 November 2018) and the on-alert soil moisture data can be found in the Supplement of this paper. For more details see Sect. 2.2.
The supplement related to this article is available online at: https://doi.org/10.5194/hess-22-6127-2018-supplement.
JPV and IZ conceptualized the study and MU carried out data analysis and its interpretation. JPV, IB, CL, GM and GN were principal investigators in the FloodScale project responsible for instrumentation and analyzed and provided the data used for this study. JPV, IZ and IB contributed to soil moisture analyses, MH, CL and GN to hydrograph separation, and GM to precipitation data processing. MU prepared the paper with contributions from all coauthors.
The authors declare that they have no conflict of interest.
This work was funded by the French National Research Agency (ANR) via the
FloodScale project under contract no. ANR 2011 BS56 027, which contributes to
the HyMeX program. OHM-CV is supported by the Institut National des Sciences
de l'Univers (INSU/CNRS), the French Ministry for Education and Research,
the Environment Research Cluster of the Rhône-Alpes Region, the
Observatoire des Sciences de l'Univers de Grenoble (OSUG) and the SOERE
Réseau des Bassins Versants (Alliance Allenvi) and belongs to the OZCAR
Reasearch Infrastructure. Magdalena Uber received financial support from
German Academic Exchange Service (DAAD). The authors want to thank Brice Boudevillain, Sahar Hachani, Simon Gérard and Cindy Nicoud for their
help during field work and Luca Brocca, Hongkai Gao and two anonymous
referees for their comments on earlier versions of this paper that were
very valuable to improve this paper.
Edited by: Roberto Greco
Reviewed by: Hongkai Gao and two anonymous referees
Abon, C., Kneis, D., Crisologo, I., Bronstert, A., David, C. P. C., and Heistermann, M.: Evaluating the potential of radar-based rainfall estimates for streamflow and flood simulations in the Philippines, Geomat. Nat. Haz. Risk, 7, 1–16, https://doi.org/10.1080/19475705.2015.1058862, 2015.
Andrieu, J.: Landcover map Claduègne catchment, ESPRI/IPSL, https://doi.org/10.14768/mistrals-hymex.1381, 2015.
Archibald, J.: BaseflowSeparation {EcoHydRology}, available at: https://cran.r-project.org/web/packages/EcoHydRology/ (last access: 19 November 2018), 2014.
Baffaut, C., Ghidey, F., Sudduth, K. A., Lerch, R. N., and Sadler, E. J.: Long-term suspended sediment transport in the Goodwater Creek Experimental Watershed and Salt River Basin, Missouri, USA, Water Resour. Res., 49, 7827–7830, https://doi.org/10.1002/wrcr.20511, 2013.
Beck, H. E., de Jeu, R. A. M., Schellekens, J., van Dijk, A. I. J. M., and Bruijnzeel, L. A.: Improving Curve Number Based Storm Runoff Estimates Using Soil Moisture Proxies, IEEE J. Sel. Top. Appl., 2, 250–259, https://doi.org/10.1109/JSTARS.2009.2031227, 2009.
Berthet, L., Andréassian, V., Perrin, C., and Javelle, P.: How crucial is it to account for the antecedent moisture conditions in flood forecasting? Comparison of event-based and continuous approaches on 178 catchments, Hydrol. Earth Syst. Sci., 13, 819–831, https://doi.org/10.5194/hess-13-819-2009, 2009.
Blume, T., Zehe, E., and Bronstert, A.: Rainfall–runoff response, event-based runoff coefficients and hydrograph separation, Hydrol. Sci. J., 52, 843–862, https://doi.org/10.1623/hysj.52.5.843, 2007.
Borga, M., Boscolo, P., Zanon, F., and Sangati, M.: Hydrometeorological Analysis of the 29 August 2003 Flash Flood in the Eastern Italian Alps, J. Hydrometeorol., 8, 1049–1067, https://doi.org/10.1175/JHM593.1, 2007.
Boudevillain, B., Delrieu, G., Galabertier, B., Bonnifait, L., Bouilloud, L., Kirstetter, P. E., and Mosini, M. L.: The Cévennes-Vivarais Mediterranean Hydrometeorological Observatory database, Water Resour. Res., 47, 1–6, https://doi.org/10.1029/2010WR010353, 2011.
Braud, I.: Soil properties Auzon catchment, https://doi.org/10.6096/MISTRALS-HyMeX.1385, 2015.
Braud, I. and Vandervaere, J. P.: Analysis of infiltration tests and performed in the Claduègne catchment in May–June 2012, Report to the FloodScale project, 66 pp., https://doi.org/10.6096/MISTRALS-HyMeX.1321, 2015.
Braud, I., Ayral, P.-A., Bouvier, C., Branger, F., Delrieu, G., Le Coz, J., Nord, G., Vandervaere, J.-P., Anquetin, S., Adamovic, M., Andrieu, J., Batiot, C., Boudevillain, B., Brunet, P., Carreau, J., Confoland, A., Didon-Lescot, J.-F., Domergue, J.-M., Douvinet, J., Dramais, G., Freydier, R., Gérard, S., Huza, J., Leblois, E., Le Bourgeois, O., Le Boursicaud, R., Marchand, P., Martin, P., Nottale, L., Patris, N., Renard, B., Seidel, J.-L., Taupin, J.-D., Vannier, O., Vincendon, B., and Wijbrans, A.: Multi-scale hydrometeorological observation and modelling for flash flood understanding, Hydrol. Earth Syst. Sci., 18, 3733–3761, https://doi.org/10.5194/hess-18-3733-2014, 2014.
Brocca, L., Melone, F., Moramarco, T., and Morbidelli, R.: Antecedent wetness conditions based on ERS scatterometer data, J. Hydrol., 364, 73–87, https://doi.org/10.1016/j.jhydrol.2008.10.007, 2009a.
Brocca, L., Melone, F., Moramarco, T., and Singh, V. P.: Assimilation of Observed Soil Moisture Data in Storm Rainfall-Runoff Modeling, J. Hydrol. Eng., 14, 153–165, https://doi.org/10.1061/(ASCE)1084-0699(2009)14:2(153), 2009b.
Brocca, L., Melone, F., Moramarco, T., and Morbidelli, R.: Soil moisture temporal stability over experimental areas in Central Italy, Geoderma, 148, 364–374, https://doi.org/10.1016/j.geoderma.2008.11.004, 2009c.
Brocca, L., Melone, F., Moramarco, T., Penna, D., Morga, M., Matgen, A., Gumuzzio, A., Martinez-Fernandez, J., and Wagner, W.: Detecting threshold hydrological response through satellite soil moisture data, Bodenkultur, 64, 7–12, 2013.
Bronstert, A. and Bárdossy, A.: The role of spatial variability of soil moisture for modelling surface runoff generation at the small catchment scale, Hydrol. Earth Syst. Sci., 3, 505–516, https://doi.org/10.5194/hess-3-505-1999, 1999.
Castillo, V. M., Gómez-Plaza, A., and Martínez-Mena, M.: The role of antecedent soil water content in the runoff response of semiarid catchments: A simulation approach, J. Hydrol., 284, 114–130, https://doi.org/10.1016/S0022-1694(03)00264-6, 2003.
Cea, L., Legout, C., Grangeon, T., and Nord, G.: Impact of model simplifications on soil erosion predictions: application of the GLUE methodology to a distributed event-based model at the hillslope scale, Hydrol. Process., 30, 1096–1113, https://doi.org/10.1002/hyp.10697, 2015.
Creutin, J. D. and Borga, M.: Radar hydrology modifies the monitoring of flash-flood hazard, Hydrol. Process., 17, 1453–1456, https://doi.org/10.1002/hyp.5122, 2003.
Crow, W. T., Bindlish, R., and Jackson, T. J.: The added value of spaceborne passive microwave soil moisture retrievals for forecasting rainfall-runoff partitioning, Geophys. Res. Lett., 32, 1–5, https://doi.org/10.1029/2005GL023543, 2005.
Delrieu, G., Wijbrans, A., Boudevillain, B., Faure, D., Bonnifait, L., and Kirstetter, P. E.: Geostatistical radar-raingauge merging: A novel method for the quantification of rain estimation accuracy, Adv. Water Resour., 71, 110–124, https://doi.org/10.1016/j.advwatres.2014.06.005, 2014.
Ducrocq, V., Braud, I., Davolio, S., Ferretti, R., Flamant, C., Jansa, A., Kalthoff, N., Richard, E., Taupier-Letage, I., Ayral, P. A., Belamari, S., Berne, A., Borga, M., Boudevillain, B., Bock, O., Boichard, J. L., Bouin, M. N., Bousquet, O., Bouvier, C., Chiggiato, J., Cimini, D., Corsmeier, U., Coppola, L., Cocquerez, P., Defer, E., Delanoe, J., Di Girolamo, P., Doerenbecher, A., Drobinski, P., Dufournet, Y., Fourrié, N., Gourley, J. J., Labatut, L., Lambert, D., Le Coz, J., Marzano, F. S., Molinié, G., Montani, A., Nord, G., Nuret, M., Ramage, K., Rison, W., Roussot, O., Said, F., Schwarzenboeck, A., Testor, P., Van Baelen, J., Vincendon, B., Aran, M., and Tamayo, J.: HyMeX-SOP1: The field campaign dedicated to heavy precipitation and flash flooding in the northwestern mediterranean, B. Am. Meteorol. Soc., 95, 1083–1100, https://doi.org/10.1175/BAMS-D-12-00244.1, 2014.
Dunne, T. and Black, R. D.: Partial Area Contributions to Storm Runoff in a Small New England, Water Resour. Res., 6, 1296–1311, 1970.
Garcia-Estringana, P., Latron, J., Llorens, P., and Gallart, F.: Spatial and temporal dynamics of soil moisture in a Mediterranean mountain area (Vallcebre, NE Spain), Ecohydrology, 6, 741–753, https://doi.org/10.1002/eco.1295, 2013.
Gaume, E., Livet, M., Desbordes, M., and Villeneuve, J. P.: Hydrological analysis of the river Aude, France, flash flood on 12 and 13 November 1999, J. Hydrol., 286, 135–154, https://doi.org/10.1016/j.jhydrol.2003.09.015, 2004.
Gaume, E., Bain, V., Bernardara, P., Newinger, O., Barbuc, M., Bateman, A., Blaškovičová, L., Blöschl, G., Borga, M., Dumitrescu, A., Daliakopoulos, I., Garcia, J., Irimescu, A., Kohnova, S., Koutroulis, A., Marchi, L., Matreata, S., Medina, V., Preciso, E., Sempere-Torres, D., Stancalie, G., Szolgay, J., Tsanis, I., Velasco, D., and Viglione, A.: A compilation of data on European flash floods, J. Hydrol., 367, 70–78, https://doi.org/10.1016/j.jhydrol.2008.12.028, 2009.
Gonzales, A. L., Nonner, J., Heijkers, J., and Uhlenbrook, S.: Comparison of different base flow separation methods in a lowland catchment, Hydrol. Earth Syst. Sci., 13, 2055–2068, https://doi.org/10.5194/hess-13-2055-2009, 2009.
Grillakis, M. G., Koutroulis, A. G., Komma, J., Tsanis, I. K., Wagner, W., and Blöschl, G.: Initial soil moisture effects on flash flood generation – A comparison between basins of contrasting hydro-climatic conditions, J. Hydrol., 541, 206–217, https://doi.org/10.1016/j.jhydrol.2016.03.007, 2016.
Hardie, M. A., Cotching, W. E., Doyle, R. B., Holz, G., Lisson, S., and Mattern, K.: Effect of antecedent soil moisture on preferential flow in a texture-contrast soil, J. Hydrol., 398, 191–201, https://doi.org/10.1016/j.jhydrol.2010.12.008, 2011.
Horton, R. E.: The rôle of infiltration in the hydrologic cycle, Eos, Trans. Am. Geophys. Union, 14, 446–460, 1933.
Hrachowitz, M., Bohte, R., Mul, M. L., Bogaard, T. A., Savenije, H. H. G., and Uhlenbrook, S.: On the value of combined event runoff and tracer analysis to improve understanding of catchment functioning in a data-scarce semi-arid area, Hydrol. Earth Syst. Sci., 15, 2007–2024, https://doi.org/10.5194/hess-15-2007-2011, 2011.
Huang, M., Gallichand, J., Dong, C., Wang, Z., and Shao, M.: Use of soil moisture data and curve number method for estimating runoff in the Loess Plateau of China, Hydrol. Process., 21, 1471–1481, https://doi.org/10.1002/hyp.6312, 2007.
Huet, P., Martin, X., Prime, J.-L., Foin, P., Laurain, C., and Cannard, P.: Retour D'Expérience des Crues de Septembre 2002 dans les Departements du Gard de l'Hérault, du Vaucluse, des Bouches-du-Rhône, de l'Ardèche et de la Drôme. Rapport Consolidé après Phase Contradictoire, Paris, available at: https://www.ladocumentationfrancaise.fr/var/storage/rapports-publics/034000547.pdf (last access: 19 November 2018), 2003.
Huza, J., Teuling, A. J., Braud, I., Grazioli, J., Melsen, L. A., Nord, G., Raupach, T. H., and Uijlenhoet, R.: Precipitation, soil moisture and runoff variability in a small river catchment (Ardèche, France) during HyMeX Special Observation Period 1, J. Hydrol., 516, 330–342, https://doi.org/10.1016/j.jhydrol.2014.01.041, 2014.
Javelle, P., Fouchier, C., Arnaud, P., and Lavabre, J.: Flash flood warning at ungauged locations using radar rainfall and antecedent soil moisture estimations, J. Hydrol., 394, 267–274, https://doi.org/10.1016/j.jhydrol.2010.03.032, 2010.
Jawson, S. D. and Niemann, J. D.: Spatial patterns from EOF analysis of soil moisture at a large scale and their dependence on soil, land-use, and topographic properties, Adv. Water Resour., 30, 366–381, https://doi.org/10.1016/j.advwatres.2006.05.006, 2007.
Korres, W., Reichenau, T. G., Fiener, P., Koyama, C. N., Bogena, H. R., Cornelissen, T., Baatz, R., Herbst, M., Diekkrüger, B., Vereecken, H., and Schneider, K.: Spatio-temporal soil moisture patterns – A meta-analysis using plot to catchment scale data, J. Hydrol., 520, 326–341, https://doi.org/10.1016/j.jhydrol.2014.11.042, 2015.
Ladson, A., Bronw, R., Neal, B., and Nathan, R.: A standard approach to baseflow separation using the Lyne and Hollick filter, Aust. J. Water Resour., 17, 25–34, https://doi.org/10.7158/W12-028.2013.17.1, 2013.
Le Coz, J., Renard, B., Bonnifait, L., Branger, F., and Le Boursicaud, R.: Combining hydraulic knowledge and uncertain gaugings in the estimation of hydrometric rating curves: A Bayesian approach, J. Hydrol., 509, 573–587, https://doi.org/10.1016/j.jhydrol.2013.11.016, 2014.
Le Lay, M. and Saulnier, G. M.: Exploring the signature of climate and landscape spatial variabilities in flash flood events: Case of the 8–9 September 2002 Cévennes-Vivarais catastrophic event, Geophys. Res. Lett., 34, 1–5, https://doi.org/10.1029/2007GL029746, 2007.
Li, H., Sivapalan, M., and Tian, F.: Comparative diagnostic analysis of runoff generation processes in Oklahoma DMIP2 basins: The Blue River and the Illinois River, J. Hydrol., 418–419, 90–109, https://doi.org/10.1016/j.jhydrol.2010.08.005, 2012.
Lyne, V. D. and Hollick, M.: Stochastic time-variable rainfall-runoff modeling, Institute of Engineers Australia National Conference Publications, Perth, 10, 89–92, 10–12 September 1979.
Marchi, L., Borga, M., Preciso, E., and Gaume, E.: Characterisation of selected extreme flash floods in Europe and implications for flood risk management, J. Hydrol., 394, 118–133, https://doi.org/10.1016/j.jhydrol.2010.07.017, 2010.
Marsalek, J.: Calibration of the tipping-bucket raingage, J. Hydrol., 53, 343–354, https://doi.org/10.1016/0022-1694(81)90010-X, 1981.
Massari, C., Brocca, L., Moramarco, T., Tramblay, Y., and Didon Lescot, J.-F.: Potential of soil moisture observations in flood modelling: Estimating initial conditions and correcting rainfall, Adv. Water Resour., 74, 44–53, https://doi.org/10.1016/j.advwatres.2014.08.004, 2014a.
Massari, C., Brocca, L., Barbetta, S., Papathanasiou, C., Mimikou, M., and Moramarco, T.: Using globally available soil moisture indicators for flood modelling in Mediterranean catchments, Hydrol. Earth Syst. Sci., 18, 839–853, https://doi.org/10.5194/hess-18-839-2014, 2014b.
Massari, C., Brocca, L., Ciabatta, L., Moramarco, T., Gabellani, S., Albergel, C., De Rosnay, P., Puca, S., and Wagner, W.: The Use of H-SAF Soil Moisture Products for Operational Hydrology: Flood Modelling over Italy, Hydrology, 2, 2–22, https://doi.org/10.3390/hydrology2010002, 2015.
McMillan, H. K., Gueguen, M., Grimon, E., Woods, R., Clark, M., and Rupp, D. E.: Spatial variability of hydrological processes and model structure diagnostics in a 50 km2 catchment, Hydrol. Process., 28, 4896–4913, https://doi.org/10.1002/hyp.9988, 2014.
McMillan, H. K. and Srinivasan, M. S.: Characteristics and controls of variability in soil moisture and groundwater in a headwater catchment, Hydrol. Earth Syst. Sci., 19, 1767–1786, https://doi.org/10.5194/hess-19-1767-2015, 2015.
Merz, B. and Plate, E. J.: An analysis of the effects of spatial variability of soil and soil moisture on runoff, Water Resour. Res., 33, 2909–2922, https://doi.org/10.1029/97WR02204, 1997.
Merz, R. and Blöschl, G.: A regional analysis of event runoff coefficients with respect to climate and catchment characteristics in Austria, Water Resour. Res., 45, 1–19, https://doi.org/10.1029/2008WR007163, 2009.
Merz, R., Blöschl, G., and Parajka, J.: Spatio-temporal variability of event runoff coefficients, J. Hydrol., 331, 591–604, https://doi.org/10.1016/j.jhydrol.2006.06.008, 2006.
Miller, M. P., Susong, D. D., Shope, Ch. L., Heilweil, V. M., and Stolp, B. J.: Continuous estimation of baseflow in snowmelt-dominated streams and rivers in the Upper Colorado River Basin: A chemical hydrograph separation approach, Water Resour. Res., 50, 6986–6999, https://doi.org/10.1002/2013WR014939, 2014.
Molina, A. J., Latron, J., Rubio, C. M., Gallart, F., and Llorens, P.: Spatio-temporal variability of soil water content on the local scale in a Mediterranean mountain area (Vallcebre, North Eastern Spain). How different spatio-temporal scales reflect mean soil water content, J. Hydrol., 516, 182–192, https://doi.org/10.1016/j.jhydrol.2014.01.040, 2014.
Molini, A., Lanza, L. G., and La Barbera, P.: The impact of tipping-bucket raingauge measurement errors on design rainfall for urban-scale applications, Hydrol. Process., 19, 1073–1088, https://doi.org/10.1002/hyp.5646, 2005.
Molinié, G., Ceresetti, D., Anquetin, S., Creutin, J. D., and Boudevillain, B.: Rainfall regime of a mountainous mediterranean region: Statistical analysis at short time steps, J. Appl. Meteorol. Clim., 51, 429–448, https://doi.org/10.1175/2011JAMC2691.1, 2012.
Moran, M. S., Holifield Collins, C. D., Goodrich, D. C., Qi, J., Shannon, D. T., and Olsson, A.: Long-term remote sensing database, Walnut Gulch Experimental Watershed, Arizona, United States, Water Resour. Res., 44, 1–8, https://doi.org/10.1029/2006WR005777, 2008.
Morbidelli, R., Saltalippi, C., Flammini, A., Corradini, C., Brocca, L., and Govindaraju, R. S.: An investigation of the effects of spatial heterogeneity of initial soil moisture content on surface runoff simulation at a small watershed scale, J. Hydrol., 539, 589–598, https://doi.org/10.1016/j.jhydrol.2016.05.067, 2016.
Nakamura, R.: Runoff analysis by electrical conductance of water, J. Hydrol., 14, 197–212, https://doi.org/10.1016/0022-1694(71)90035-7, 1971.
Nathan, R. J. and McMahon, T.: Evaluation of Automated Techniques for Base Flow and Recession Analyses, Water Resour. Res., 26, 1465–1473, https://doi.org/10.1029/WR026i007p01465, 1990.
Norbiato, D., Borga, M., Degli Esposti, S., Gaume, E., and Anquetin, S.: Flash flood warning based on rainfall thresholds and soil moisture conditions: An assessment for gauged and ungauged basins, J. Hydrol., 362, 274–290, https://doi.org/10.1016/j.jhydrol.2008.08.023, 2008.
Norbiato, D., Borga, M., Merz, R., Blöschl, G., and Carton, A.: Controls on event runoff coefficients in the eastern Italian Alps, J. Hydrol., 375, 312–325, https://doi.org/10.1016/j.jhydrol.2009.06.044, 2009.
Nord, G.: Digital Terrain Model (DTM) of the Auzon catchment region, https://doi.org/10.6096/MISTRALS-HyMeX.1389, 2015.
Nord, G., Boudevillain, B., Berne, A., Branger, F., Braud, I., Dramais, G., Gérard, S., Le Coz, J., Legoût, C., Molinié, G., Van Baelen, J., Vandervaere, J.-P., Andrieu, J., Aubert, C., Calianno, M., Delrieu, G., Grazioli, J., Hachani, S., Horner, I., Huza, J., Le Boursicaud, R., Raupach, T. H., Teuling, A. J., Uber, M., Vincendon, B., and Wijbrans, A.: A high space–time resolution dataset linking meteorological forcing and hydro-sedimentary response in a mesoscale Mediterranean catchment (Auzon) of the Ardèche region, France, Earth Syst. Sci. Data, 9, 221–249, https://doi.org/10.5194/essd-9-221-2017, 2017.
OHMCV: Runoff and erosion plots, Pradel, CNRS – OSUG – OREME, available at: http://mistrals.sedoo.fr/?editDatsId=1347 (last access: 19 November 2018), doi10.17178/OHMCV.ERO.PRA.10-13.1, 2009.
OHMCV: Hpiconet rain gauge network, CNRS – OSUG – OREME, available at: http://mistrals.sedoo.fr/?editDatsId=656 (last access: 19 November 2018), https://doi.org/10.17178/OHMCV.RTS.AUZ.10-14.1, 2010.
OHMCV: Gazel and Claduègne hydro-sedimentary stations, CNRS – OSUG – OREME, available at: http://mistrals.sedoo.fr/?editDatsId=993 (last access: 19 November 2018), https://doi.org/10.17178/OHMCV.HSS.CLA.11-14.1, 2011.
OHMCV: Soil moisture sensor network, Gazel and Claduègne catchments, CNRS – OSUG – OREME, available at: http://mistrals.sedoo.fr/?editDatsId=1350 (last access: 19 November 2018), https://doi.org/10.17178/OHMCV.SMO.CLA.13-14.1, 2013.
Panziera, L., James, C. N., and Germann, U.: Mesoscale organization and structure of orographic precipitation producing flash floods in the Lago Maggiore region, Q. J. Roy. Meteor. Soc., 141, 224–248, https://doi.org/10.1002/qj.2351, 2015.
Pellerin, B. A., Wollheim, W. M., Feng, X., and Vörösmarty, C. J.: The application of electrical conductivity as a tracer for hydrograph separation in urban catchments, Hydrol. Process., 22, 1810–1818, https://doi.org/10.1002/hyp.6786, 2008.
Penna, D., Tromp-van Meerveld, H. J., Gobbi, A., Borga, M., and Dalla Fontana, G.: The influence of soil moisture on threshold runoff generation processes in an alpine headwater catchment, Hydrol. Earth Syst. Sci., 15, 689–702, https://doi.org/10.5194/hess-15-689-2011, 2011.
Renard, K. G., Nichols, M. H., Woolhiser, D. A., and Osborn, H. B.: A brief background on the U.S. Department of Agriculture Agricultural Research Service Walnut Gulch Experimental Watershed, Water Resour. Res., 44, 1–11, https://doi.org/10.1029/2006WR005691, 2008.
Savenije, H. H. G.: HESS Opinions “Topography driven conceptual modelling (FLEX-Topo)”, Hydrol. Earth Syst. Sci., 14, 2681–2692, https://doi.org/10.5194/hess-14-2681-2010, 2010.
Slaughter, C. W., Marks, D., Flerchinger, G. N., Van Vactor, S. S., and Burgess, M.: Thirty-five years of research data collection at the Reynolds Creek Experimental Watershed, Idaho, United States, Water Resour. Res., 37, 2819–2823, https://doi.org/10.1029/2001WR000413, 2001.
Sloto, R. and Crouse, M. Y.: Hysep: a computer program for streamflow hydrograph separation and analysis, U.S. Geological Survey Water-Resources Investigations Report, 1996–4040, 46 pp., available at: https://pubs.er.usgs.gov/publication/wri964040 (last access: 19 November 2018), 1996.
Tramblay, Y., Bouvier, C., Martin, C., Didon-Lescot, J. F., Todorovik, D., and Domergue, J. M.: Assessment of initial soil moisture conditions for event-based rainfall-runoff modelling, J. Hydrol., 387, 176–187, https://doi.org/10.1016/j.jhydrol.2010.04.006, 2010.
Tramblay, Y., Bouaicha, R., Brocca, L., Dorigo, W., Bouvier, C., Camici, S., and Servat, E.: Estimation of antecedent wetness conditions for flood modelling in northern Morocco, Hydrol. Earth Syst. Sci., 16, 4375–4386, https://doi.org/10.5194/hess-16-4375-2012, 2012.
U.S. Geological Survey (USGS): hysep.R, GitHub Repository, available at: https://github.com/USGS-R/DVstats/blob/master/R/hysep.R (last access: 19 November 2018), 2015.
Vachaud, G., Passerat De Silans, A., Balabanis, P., and Vauclin, M.: Temporal Stability of Spatially Measured Soil Water Probability Density Function, Soil Sci. Soc. Am. J., 49, 822–828, https://doi.org/10.2136/sssaj1985.03615995004900040006x, 1985.
Vanderlinden, K., Vereecken, H., Hardelauf, H., Herbst, M., Martínez, G., Cosh, M. H., and Pachepsky, Y. A.: Temporal Stability of Soil Water Contents: A Review of Data and Analyses, Vadose Zone J., 11, 19, https://doi.org/10.2136/vzj2011.0178, 2012.
Vereecken, H., Huisman, J. A., Pachepsky, Y., Montzka, C., van der Kruk, J., Bogena, H., Weihermüller, L., Herbst, M., Martinez, G., and Vanderborght, J.: On the spatio-temporal dynamics of soil moisture at the field scale, J. Hydrol., 516, 76–96, https://doi.org/10.1016/j.jhydrol.2013.11.061, 2014.
Wood, E. F., Sivapalan, M., and Beven, K.: Similarity and Scale in Catchment Storm Response, Rev. Geophys., 28, 1–18, 1990.
Zehe, E. and Blöschl, G.: Predictability of hydrologic response at the plot and catchment scales: Role of initial conditions, Water Resour. Res., 40, 1–21, https://doi.org/10.1029/2003WR002869, 2004.
Zehe, E. and Sivapalan, M.: Threshold behaviour in hydrological systems as (human) geo-ecosystems: manifestations, controls, implications, Hydrol. Earth Syst. Sci., 13, 1273–1297, https://doi.org/10.5194/hess-13-1273-2009, 2009.
Zehe, E., Becker, R., Bárdossy, A., and Plate, E.: Uncertainty of simulated catchment runoff response in the presence of threshold processes: Role of initial soil moisture and precipitation, J. Hydrol., 315, 183–202, https://doi.org/10.1016/j.jhydrol.2005.03.038, 2005.
Zucco, G., Brocca, L., Moramarco, T., and Morbidelli, R.: Influence of land use on soil moisture spatial–temporal variability and monitoring, J. Hydrol., 516, 193–199, https://doi.org/10.1016/j.jhydrol.2014.01.043, 2014.