the Creative Commons Attribution 4.0 License.
the Creative Commons Attribution 4.0 License.
 | 21 Nov 2018
Why increased extreme precipitation under climate change negatively affects water security
Joris P. C. Eekhout
Johannes E. Hunink
Wilco Terink
Joris de Vente
An increase in extreme precipitation is projected for many areas worldwide in the coming decades. To assess the impact of increased precipitation intensity on water security, we applied a regional-scale hydrological and soil erosion model, forced with regional climate model projections. We specifically considered the impact of climate change on the distribution of water between soil (green water) and surface water (blue water) compartments. We show that an increase in precipitation intensity leads to a redistribution of water within the catchment, where water storage in soil decreases and reservoir inflow increases. This affects plant water stress and the potential of rainfed versus irrigated agriculture, and increases dependency on reservoir storage, which is potentially threatened by increased soil erosion. This study demonstrates the crucial importance of accounting for the fact that increased precipitation intensity leads to water redistribution between green and blue water, increased soil erosion, and reduced water security. Ultimately, this has implications for design of climate change adaptation measures, which should aim to increase the water holding capacity of the soil (green water) and to maintain the storage capacity of reservoirs (blue water), benefiting rainfed and irrigated agriculture.
- Article
(8656 KB) - Full-text XML
-
Supplement
(2701 KB) - BibTeX
- EndNote


For many areas worldwide, increased rainfall intensity and frequency of extreme weather events are projected for the coming decades (O'Gorman and Schneider, 2009; Sillmann et al., 2013; Sun et al., 2007). However, there is surprisingly little known about how this will affect water security at regional scales, most relevant for policy making (Nicholson et al., 2009). Water security is defined as a condition in which the population has access to adequate quantities of clean water to sustain livelihoods and is protected against water-related disasters (UN-Water, 2013). Accurate quantification of the impacts of climate change on water security is crucial for the design and evaluation of effective adaptation strategies and implementation of the Sustainable Development Goals (United Nations General Assembly, 2015), in particular SDG 6 (clean water and sanitation), SDG 13 (climate action) and SDG 15 (life on land). Previous impact studies have indicated how climate change may affect water availability, flood risk (Arnell and Gosling, 2013; Donnelly et al., 2017; Forzieri et al., 2014; Sperna Weiland et al., 2012; Thober et al., 2018) and soil erosion (Li and Fang, 2016), with positive and negative reported impacts. However, these estimates insufficiently account for actual impacts on the redistribution of water between soil and surface water compartments. While water storage potential in soils (green water) and reservoirs (blue water) is increasingly important for climate change adaptation, there is insufficient knowledge of how both are affected by increasing precipitation intensity and how this affects crucial aspects of water security such as plant water stress, reservoir inflow, soil erosion and reservoir storage potential.
The expected increase in extreme precipitation will have multiple impacts on urban, natural and arable environments, and may for example cause increased flood frequency (Thober et al., 2018). However, as a result of increased temperature and, consequently, increased evapotranspiration, antecedent soil moisture conditions may change and affect the impact of increased flood magnitude (Castillo et al., 2003; Ivancic and Shaw, 2015; Wasko and Sharma, 2017). In urban areas, an increase in extreme precipitation may affect inundation frequency and may pose challenges for stormwater infrastructure, which is often designed under the assumption of a stationary climate (Mishra et al., 2012). In natural environments, a combination of an increase in extreme precipitation and longer dry spells may cause an increase in stress conditions for natural vegetation (Fay et al., 2003; Knapp et al., 2008; León-Sánchez et al., 2018). Rainfall intensity is one of the main drivers of soil erosion (Nearing et al., 1990) and is one of the dominant processes that may affect soil erosion under future climate conditions (Nearing et al., 2004). In fact, both runoff and soil erosion are among the processes most sensitive to changes in rainfall intensity (Nunes et al., 2009b; Pruski and Nearing, 2002). Soil erosion of arable land and related loss of organic matter and nutrients are major threats to agricultural productivity, which is already under pressure from increasing food demands (Pimentel et al., 1995).
Hydrological and soil erosion studies on the impact of climate change are generally forced with future projected climate data from global circulation models (GCMs). To enhance accuracy and spatial resolution of climate projections, some studies adopt regional climate models (RCMs) to downscale GCM output (Jacob et al., 2014) and apply bias-correction methods to overcome the bias between historical observed and modelled data. While the change factor (or delta change) approach is the most popular bias-correction method, other bias-correction methods that consider the change in future precipitation distribution are needed to assess the effects of changes in frequency and intensity of extreme events (Li and Fang, 2016; Mullan et al., 2012). The selection of climate models, downscaling and bias-correction methods strongly affects the climate projections (Maraun et al., 2017) and consequently also the simulated hydrological and erosional response. Moreover, most global and regional studies only consider saturation excess surface runoff and disregard infiltration excess surface runoff, which may lead to an underestimation of the actual impact of extreme precipitation on surface runoff generation. Saturation excess and infiltration excess are the main mechanisms causing surface runoff. They may co-exist within a catchment and occur at different times or places due to differences in spatio-temporal conditions, i.e. antecedent soil moisture, soil characteristics or precipitation intensities (Beven, 2012). Infiltration excess surface runoff is mainly driven by precipitation intensity and is responsible for major parts of surface runoff generation in many parts of the world, such as the Mediterranean (Manus et al., 2009; Merheb et al., 2016) and semi-arid environments (García-Ruiz et al., 2013; Lesschen et al., 2009), due to steep slopes, low infiltration rates and frequent intense precipitation events. Considering the estimated future increase in extreme precipitation in many regions, infiltration excess surface runoff will become increasingly more important.
Climate change will affect soil erosion through changes in precipitation volume and intensity and through climate-change-induced changes in vegetation cover. Climate-change-induced increase in extreme precipitation is likely to be a dominant factor causing future increase in soil erosion (Nearing et al., 2004; Nunes et al., 2008), as was demonstrated in various hillslope-scale (Mullan et al., 2012; Routschek et al., 2014; Zhang et al., 2012) and catchment-scale event-based model studies (Baartman et al., 2012; Paroissien et al., 2015). Given the relevance of precipitation intensity, appropriate bias-correction methods and accounting for infiltration excess surface runoff are particularly important to assess the impact of climate change. However, large-scale assessments rarely consider the impact of increased extreme precipitation frequency on soil erosion rates. They are either applied at a low temporal resolution (e.g. monthly time steps), hence, focusing on changes in precipitation volume, or use bias-correction methods that do not consider changes in the frequency distribution (e.g. the delta change method), leading to strong underestimation of the impact of climate change. Furthermore, vegetation cover mitigates soil erosion through canopy interception and flow resistance (Nearing et al., 2004; Nunes et al., 2013). However, the interactions between reduced precipitation, increased temperature and changes in the vegetation cover are rarely assessed in soil erosion impact studies, while the change in vegetation cover may have a significant impact on hydrological and soil erosion processes (Nunes et al., 2009a).
Due to the inherent nature of the processes involved, such as infiltration excess surface runoff and soil erosion, the impact of extreme precipitation can only be assessed at a sufficiently detailed spatial and temporal scale. Therefore, the objective of this study was to examine the effect of climate change on water security through application of a spatially distributed hydrological model (Terink et al., 2015), which is coupled to a soil erosion model (Morgan and Duzant, 2008) and runs at a daily time step. The hydrological model simulates the main hydrological processes, including infiltration excess surface runoff. The model was applied to the Segura River catchment, a typical large Mediterranean river catchment, highly regulated by reservoirs. We applied the model to a reference scenario and four future climate scenarios, where we accounted for the multiple effects of climate change, including precipitation intensity, and seasonal and inter-annual vegetation development.
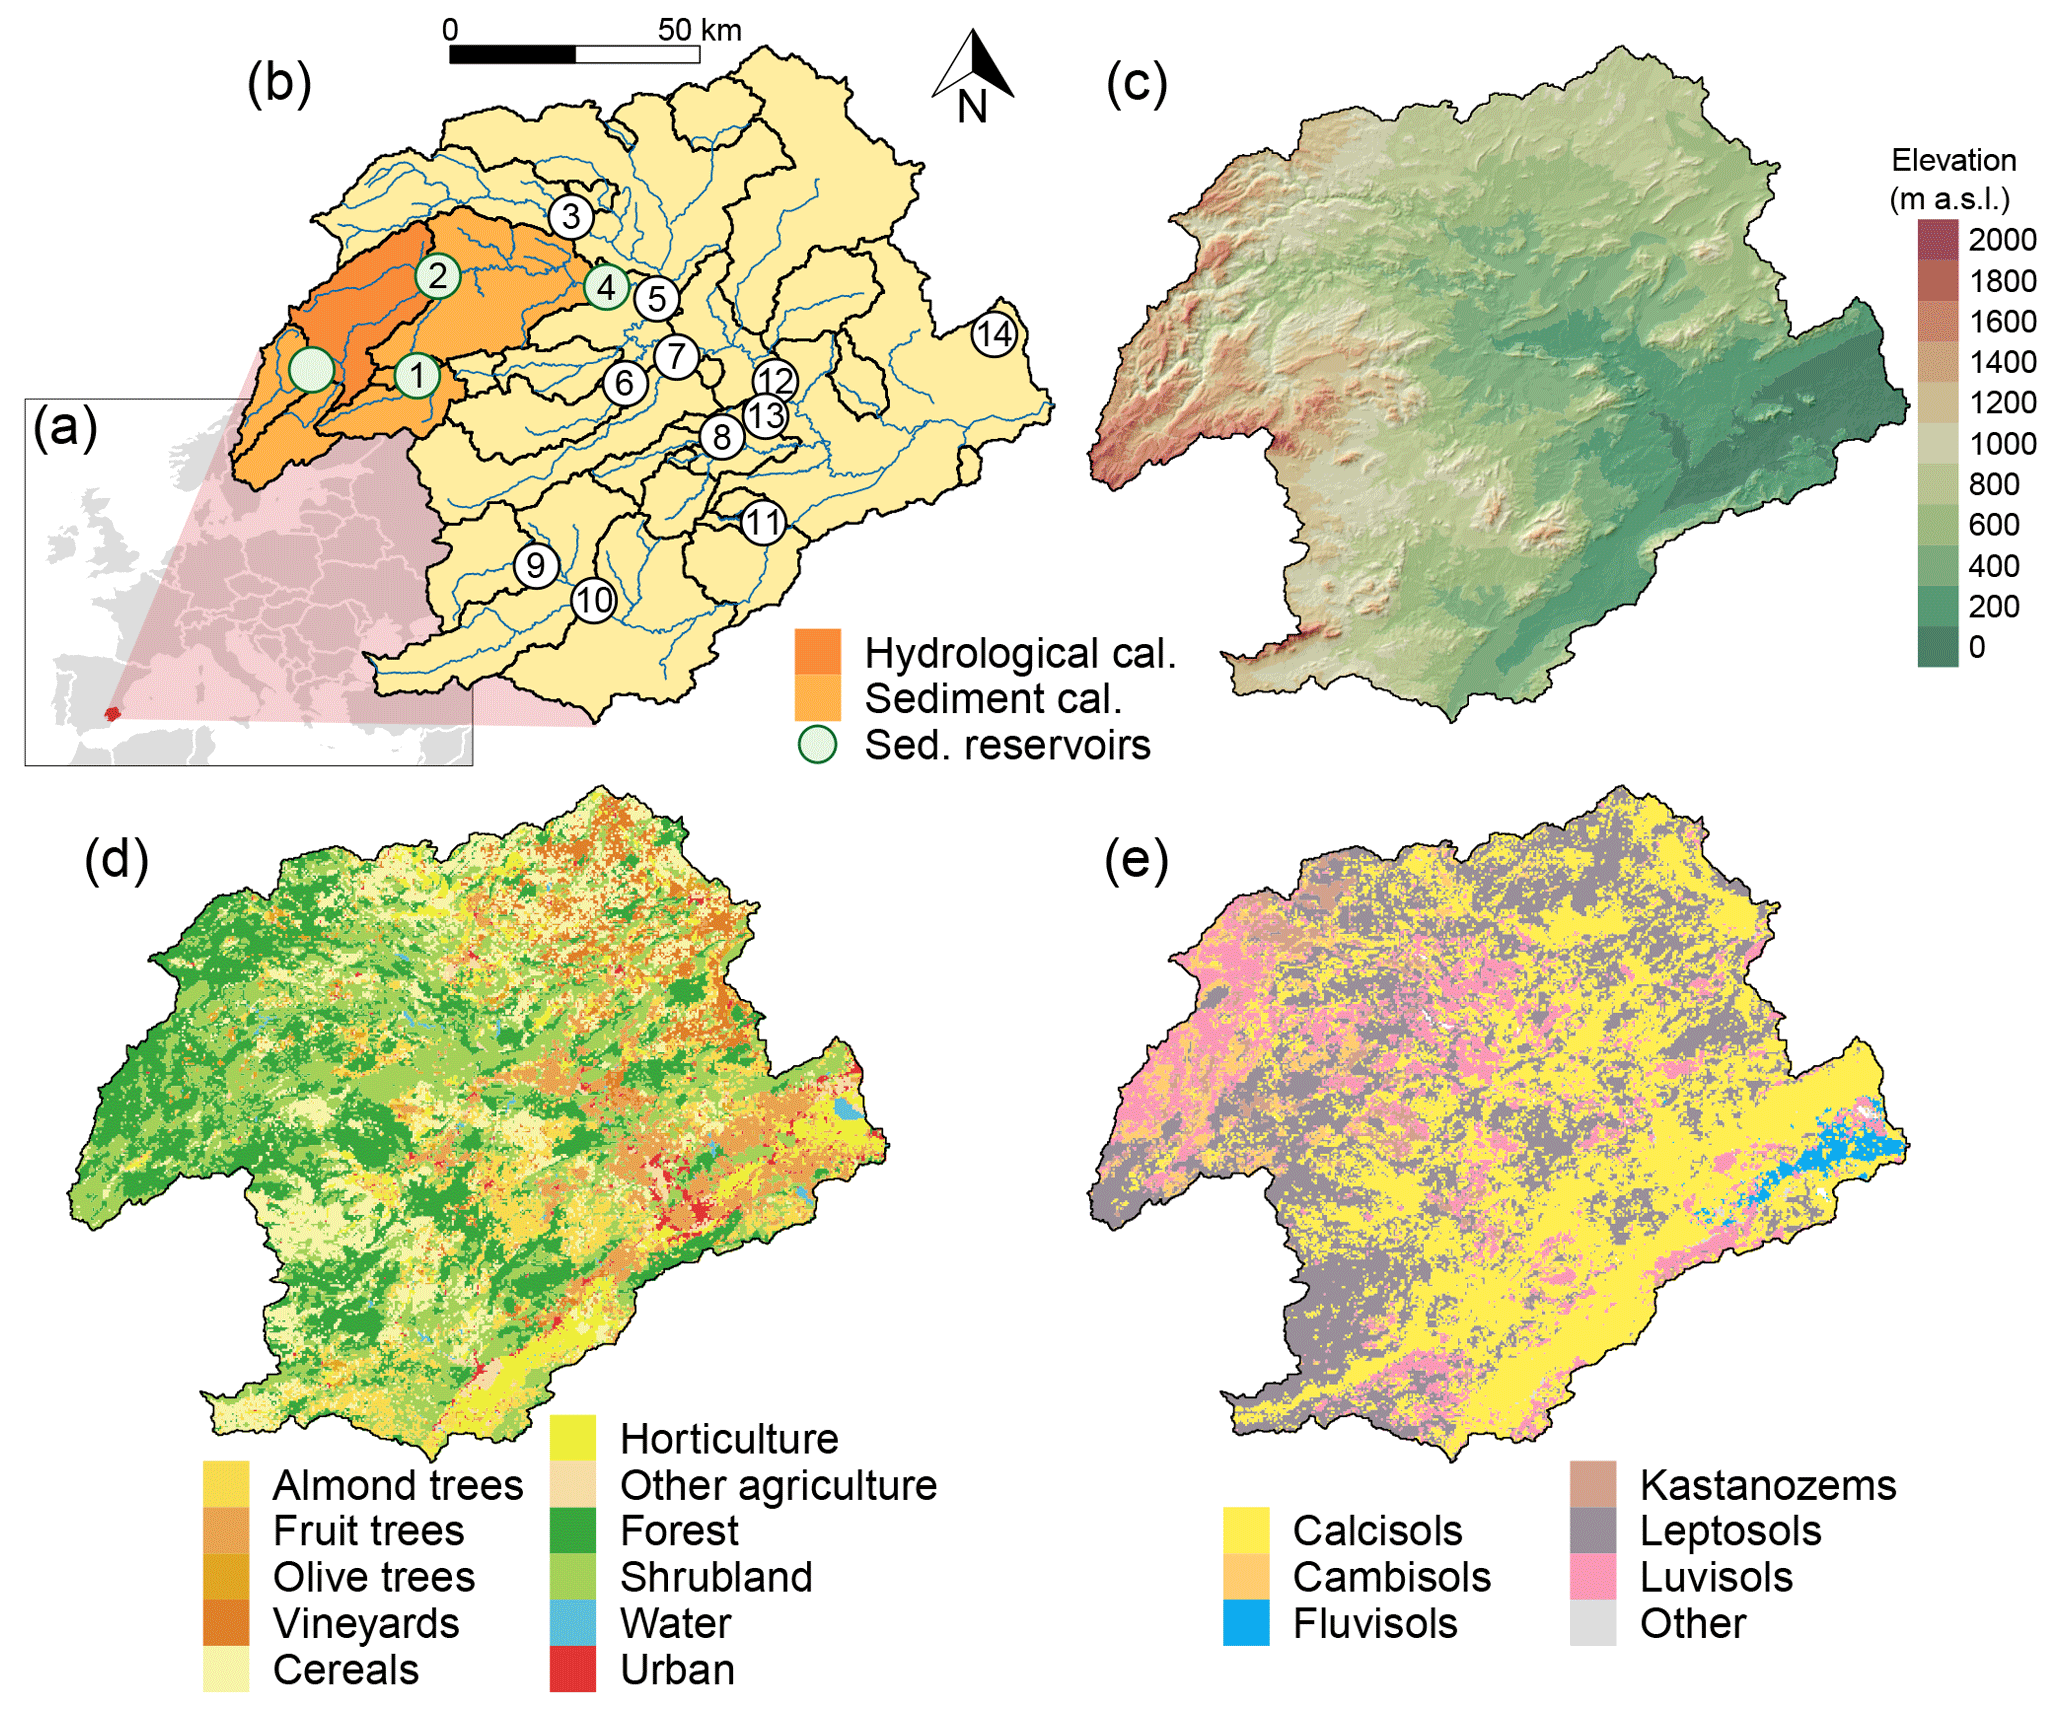
Figure 1Location and characteristics of the Segura River catchment: (a) location of the catchment within Europe, (b) location of the subcatchments (yellow), the hydrological calibration area (dark orange), the soil erosion calibration area (light orange), the channels (blue), the reservoirs (numbers 1–14), and the calibration reservoirs (green dots), (c) digital elevation model (Farr et al., 2007), (d) land-use map (MAPAMA, 2010), and (e) soil classification map (Hengl et al., 2017).
2.1 Study area
The study is performed in the Segura River catchment in the south-east of Spain (Fig. 1). The catchment area covers 15 978 km2 and has an elevation ranging between sea level and 2055 m a.s.l. (Fig. 1c). The climate in the catchment is classified as Mediterranean (Csa according to the Köppen–Geiger climate classification) in the headwaters (19 %) and semi-arid (BSk) in the rest of the catchment (81 %). Catchment-averaged mean annual precipitation amounts to 361 mm (for the period 1981–2000) and mean annual temperature ranges between 9.3 and 18.7 ∘C (1981–2000) in the headwaters and downstream area, respectively.
The main land-use types are shrubland (28 %), forest (26 %), cereal fields (14 %) and almond orchards (9 %) (Fig. 1d). Agriculture accounts for 44 % of the catchments surface area and can be subdivided into rainfed crops (31 %; cereal fields, almond orchards, vineyards and olive orchards), irrigated crops (12 %; fruit trees and horticulture) and other agriculture (1 %). The main soil classes are Calcisols (41 %), Leptosols (35 %), Luvisols (4 %) and Kastanozems (4 %) (Fig. 1e). There are 33 reservoirs in the catchment, from which 14 are allocated exclusively for irrigation purposes (Fig. 1b and Table S2) with a total capacity of 866 Hm3. The other reservoirs have mixed functions for electricity supply and flood prevention. Besides reservoirs, irrigation water demand is also met with water from deep aquifers and the Tagus–Segura water transfer. These additional water sources and the supply of water to irrigated agriculture are not accounted for in this study, not least because there is high uncertainty regarding the spatial and temporal variation of irrigated agriculture and reservoir operation. This means that our results on water availability include water available for irrigation purposes, irrespective of reservoir operation.
2.2 Model description
We applied the spatially distributed Spatial Processes in HYdrology model (Terink et al., 2015), coupled with the Morgan–Morgan–Finney soil erosion model (Morgan and Duzant, 2008), described in detail in Eekhout et al. (2018). The hydrological model simulates the most relevant hydrological processes, such as interception, evapotranspiration, dynamic evolution of vegetation cover, including seasonal patterns and response to climate change, surface runoff, and lateral and vertical soil moisture flow at a daily time step, here implemented at 200 m spatial resolution. The model simulates infiltration excess surface runoff based on an adaptation of the Green–Ampt equation (Heber Green and Ampt, 1911). The soil erosion model, based on the MMF model (Morgan and Duzant, 2008), runs at a daily time step and is fully coupled with the hydrological model. Soil detachment is determined as a function of raindrop impact and accumulated runoff. In-field deposition is a function of the abundance of vegetation and soil roughness. The remainder will go into transport, considering the transport capacity of the flow and a sediment trapping formula to account for the deposition of sediment in reservoirs. The model incorporates a vegetation module that considers inter- and intra-annual vegetation development and provides vegetation input to both the hydrological and the soil erosion model (see the Supplement and Eekhout et al., 2018, for a detailed description of the model, input data and calibration).
2.3 Climate scenarios
We applied four different future climate scenarios, divided over two future periods (i.e. 2031–2050 and 2081–2100) and two Representative Concentration Pathways (i.e. RCP4.5 and RCP8.5), describing an emission scenario peaking in 2040 followed by a decline (RCP4.5) and an emission scenario with continuous increase in emissions throughout the 21st century (RCP8.5). We obtained data from a total of nine climate models (Table S3) from the EURO-CORDEX initiative (Jacob et al., 2014), with a 0.11∘ resolution. Quantile mapping has been recognized as the empirical–statistical downscaling and bias-correction method that shows the best performance, particularly for the highest quantiles (Themeßl et al., 2011). Changes in extreme precipitation may have a large impact on the hydrological and soil erosion processes; therefore, quantile mapping was selected for the current study. Quantile mapping first determines the probability of occurrence of the future precipitation from the empirical cumulative density distribution function (ecdf) of the historical climate model output. Then a correction factor is determined by feeding this probability into the inverse ecdfs of the historical observed and historical climate model output. Finally, the correction factor is added to the future precipitation. We adopted the method proposed by Themeßl et al. (2012) that accounts for the dry-day frequency, which could lead to uncertainties when the dry-day frequency of the historical climate model output is greater than in the historical observations. Furthermore, this method accounts for new extremes, to correct for new extreme precipitation values that do not occur in the historical observations. Daily precipitation and temperature data for the reference scenario (1981-2000) were, respectively, obtained from the SPREAD dataset (Serrano-Notivoli et al., 2017), with a 5 km resolution, and the SPAIN02 dataset (Herrera et al., 2016), with a 0.11∘ resolution. The model simulations were performed consecutively and included 1 start-up year, which was sufficient to reach a dynamic equilibrium state for storage components (e.g. soil moisture compartments and reservoir storage).
2.4 Water security indicators
We evaluated the impact of climate change on water security using plant water stress, reservoir inflow, hillslope erosion and reservoir sediment yield as impact indicators. These indicators are specifically important for this study area, which is dominated by rainfed and irrigated agriculture. Changes in plant water stress and hillslope erosion may affect agricultural productivity, while changes in reservoir inflow and reservoir sediment yield affect water availability for irrigated agriculture and drinking water.
Plant water stress, defined as an indicator between no stress (0) and fully stressed (1), was determined by comparing the soil moisture content in the root layer with the plant-specific soil moisture content from which stress starts to occur and soil moisture at wilting point. Plant water stress is determined using the following equation (Porporato et al., 2001)):
where PWS is the dimensionless plant water stress, θ(t) is the soil moisture content at time step t after water has infiltrated into the soil, θPWS is the plant- and soil-specific soil moisture content from which plant water stress starts to occur and θPWP is the soil moisture content at permanent wilting point. PWS equals zero when θ(t)>θPWP. The value of θPWS is determined as follows (Allen et al., 1998):
where θFC is the soil moisture content at field capacity, and d is the depletion fraction. The depletion fraction is a plant-specific factor and is a function of the potential evapotranspiration (Allen et al., 1998):
where dtab is the tabular value of the depletion fraction and ETP is the potential evapotranspiration obtained from the hydrological model. Values for dtab were obtained from Allen et al. (1998). Allen et al. (1998) mainly focusses on agricultural crops. For natural vegetation, we adopted values for vegetation types that are most closely related to natural vegetation, i.e. conifer trees for forest and grazing pasture for shrubland.
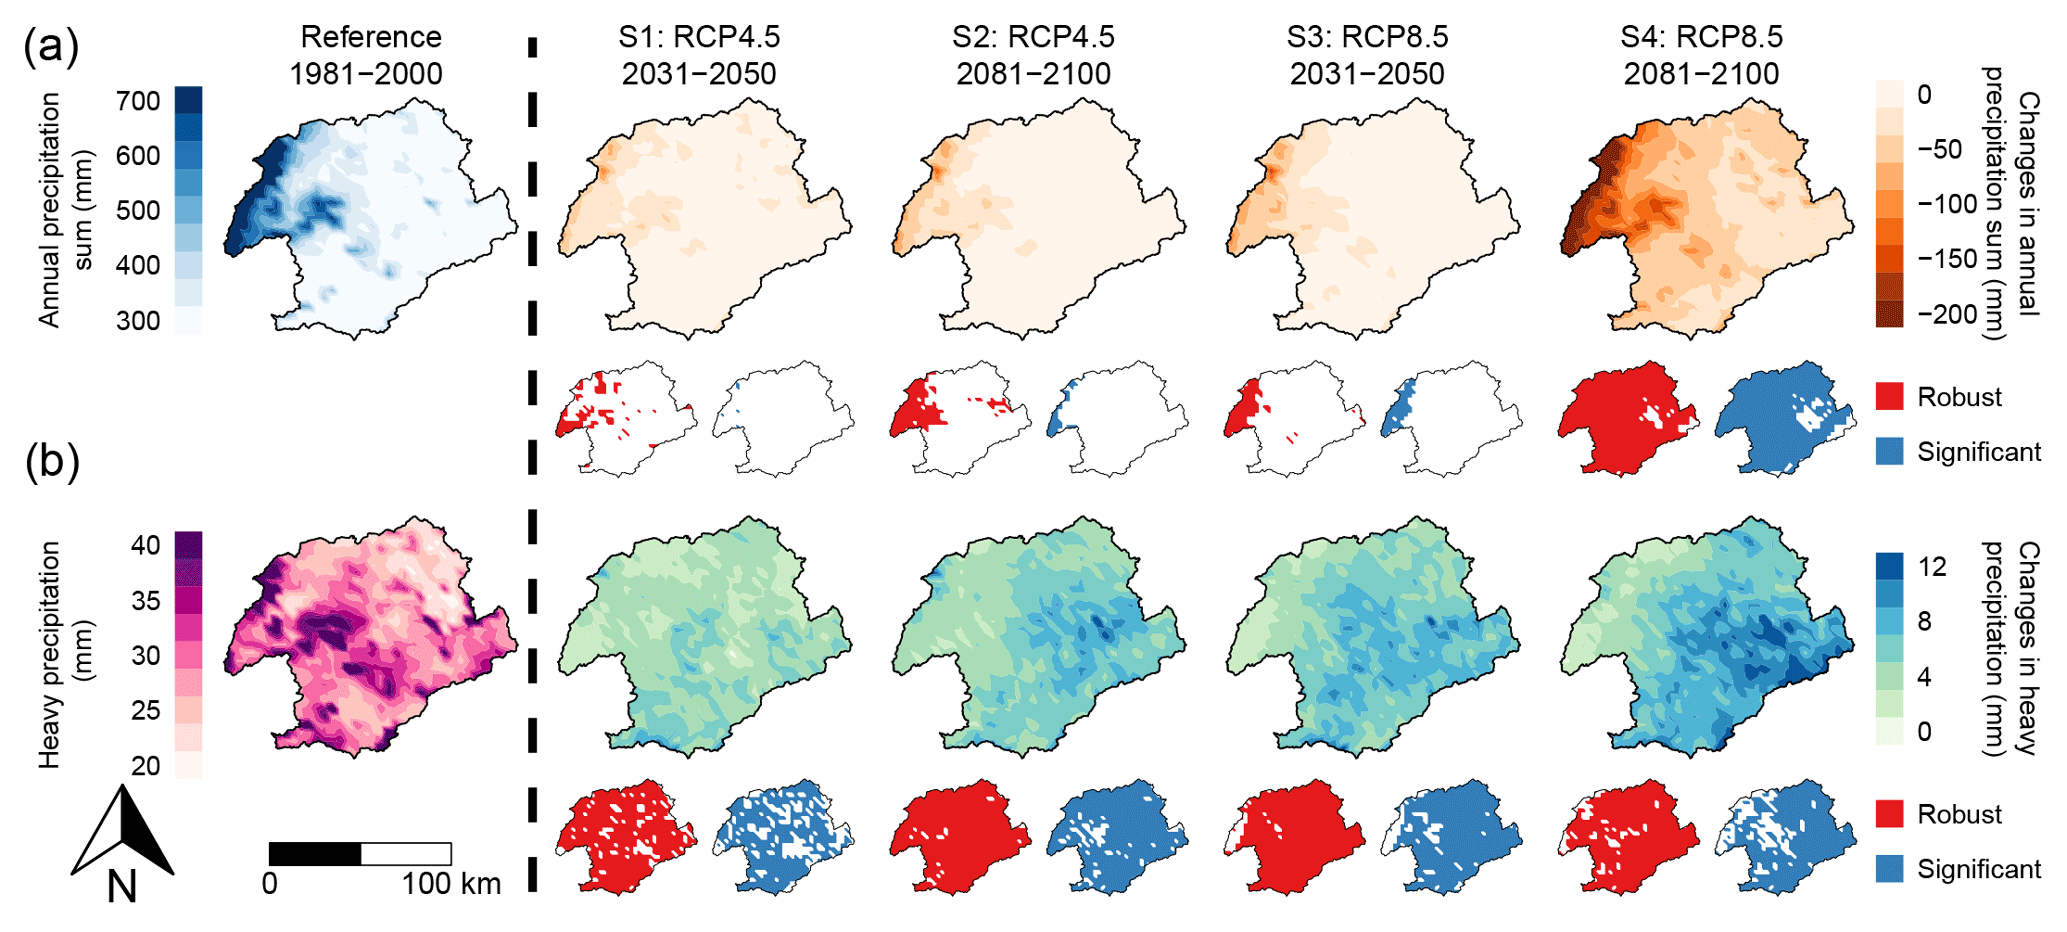
Figure 2Ensemble average annual precipitation sum (mm, a) and ensemble average heavy precipitation (mm, b) defined as the 95th percentile of daily precipitation, considering only rainy days Jacob et al. (2014), for the reference scenario (left panels) and changes between the reference scenario and the four future scenarios (right panels).
Reservoir inflow of the 14 reservoirs used for irrigation is defined as the cumulative discharge sum in the upstream area of a reservoir. In this calculation, only the area is considered that belongs to one reservoir. If the upstream area of a reservoir contains one or more other reservoirs, the discharge originating from these areas is omitted. Reservoir inflow is used to infer the impact on irrigation water demand. Hillslope erosion was determined from the long-term average soil erosion map. Per subcatchment we determined the average of all the cells with an upstream area smaller than 10 km2, representing hillslope erosion. Reservoir sediment yield was determined from the sediment yield time series obtained at each reservoir. Per reservoir we determined the average yearly sediment yield. From reservoir sediment yield we determined annual capacity loss by dividing the reservoir sediment yield by the storage capacity of the reservoir.
2.5 Uncertainty analysis
To account for uncertainty we evaluated the robustness and significance of the climate projections and the model predictions within the climate model ensemble of nine climate models. This only reflects climate model uncertainty, not the uncertainty related to other sources, such as the SPHY-MMF model. Robustness is defined as the agreement of the simulations in terms of the direction of change; i.e. changes in which more than 66 % of the models agree in the direction of change were called robust changes. A paired U-test (Mann–Whitney–Wilcoxon test, with a significance level of 0.05) was applied to test the significance of model outcomes for the nine climate models. The pairs consisted of the model output for (1) the reference scenario and (2) the nine climate models. The paired U-test is also applied to determine the significance of the catchment-averaged change with respect to the reference scenario.
3.1 Climate change signal
The future climate scenarios predict a significant 20–135 mm decrease in annual precipitation in the headwaters of the catchment, corresponding to a decrease of 3 % to 24 %, with respect to the reference scenario (Fig. 2 – upper row – and Fig. 3). Scenario S4 predicts significant decreases in the entire catchment, with a catchment-average decrease of 18 % (p<0.01). All future scenarios show a robust and significant increase in annual average temperature, with changes from 1.2 ∘C (scenario S1) to 3.9 ∘C (scenario S4) (Figs. 3 and S3).
Changes in the intensity and frequency of precipitation may be the most relevant climate signal affecting water security, which we assessed through the intensity of extreme precipitation and the duration of dry spells. Extreme precipitation is defined as the 95th percentile of daily precipitation, considering only rainy days (Jacob et al., 2014). Dry spells are defined as the 95th percentile of the duration of periods of at least 5 consecutive days with daily precipitation below 1 mm (Jacob et al., 2014). Under future climate conditions, extreme precipitation is likely to increase significantly in almost the entire catchment, with the largest increases found for scenario S4 (Fig. 2 – lower row – and Fig. 3). The duration of dry spells is likely to significantly increase by 7–9 days (catchment average, p<0.02) for scenarios S1–3 and by 26 days for scenario S4 (p<0.01) (Figs. 3 and S4). These results suggest a significant decrease in precipitation frequency in all four scenarios.
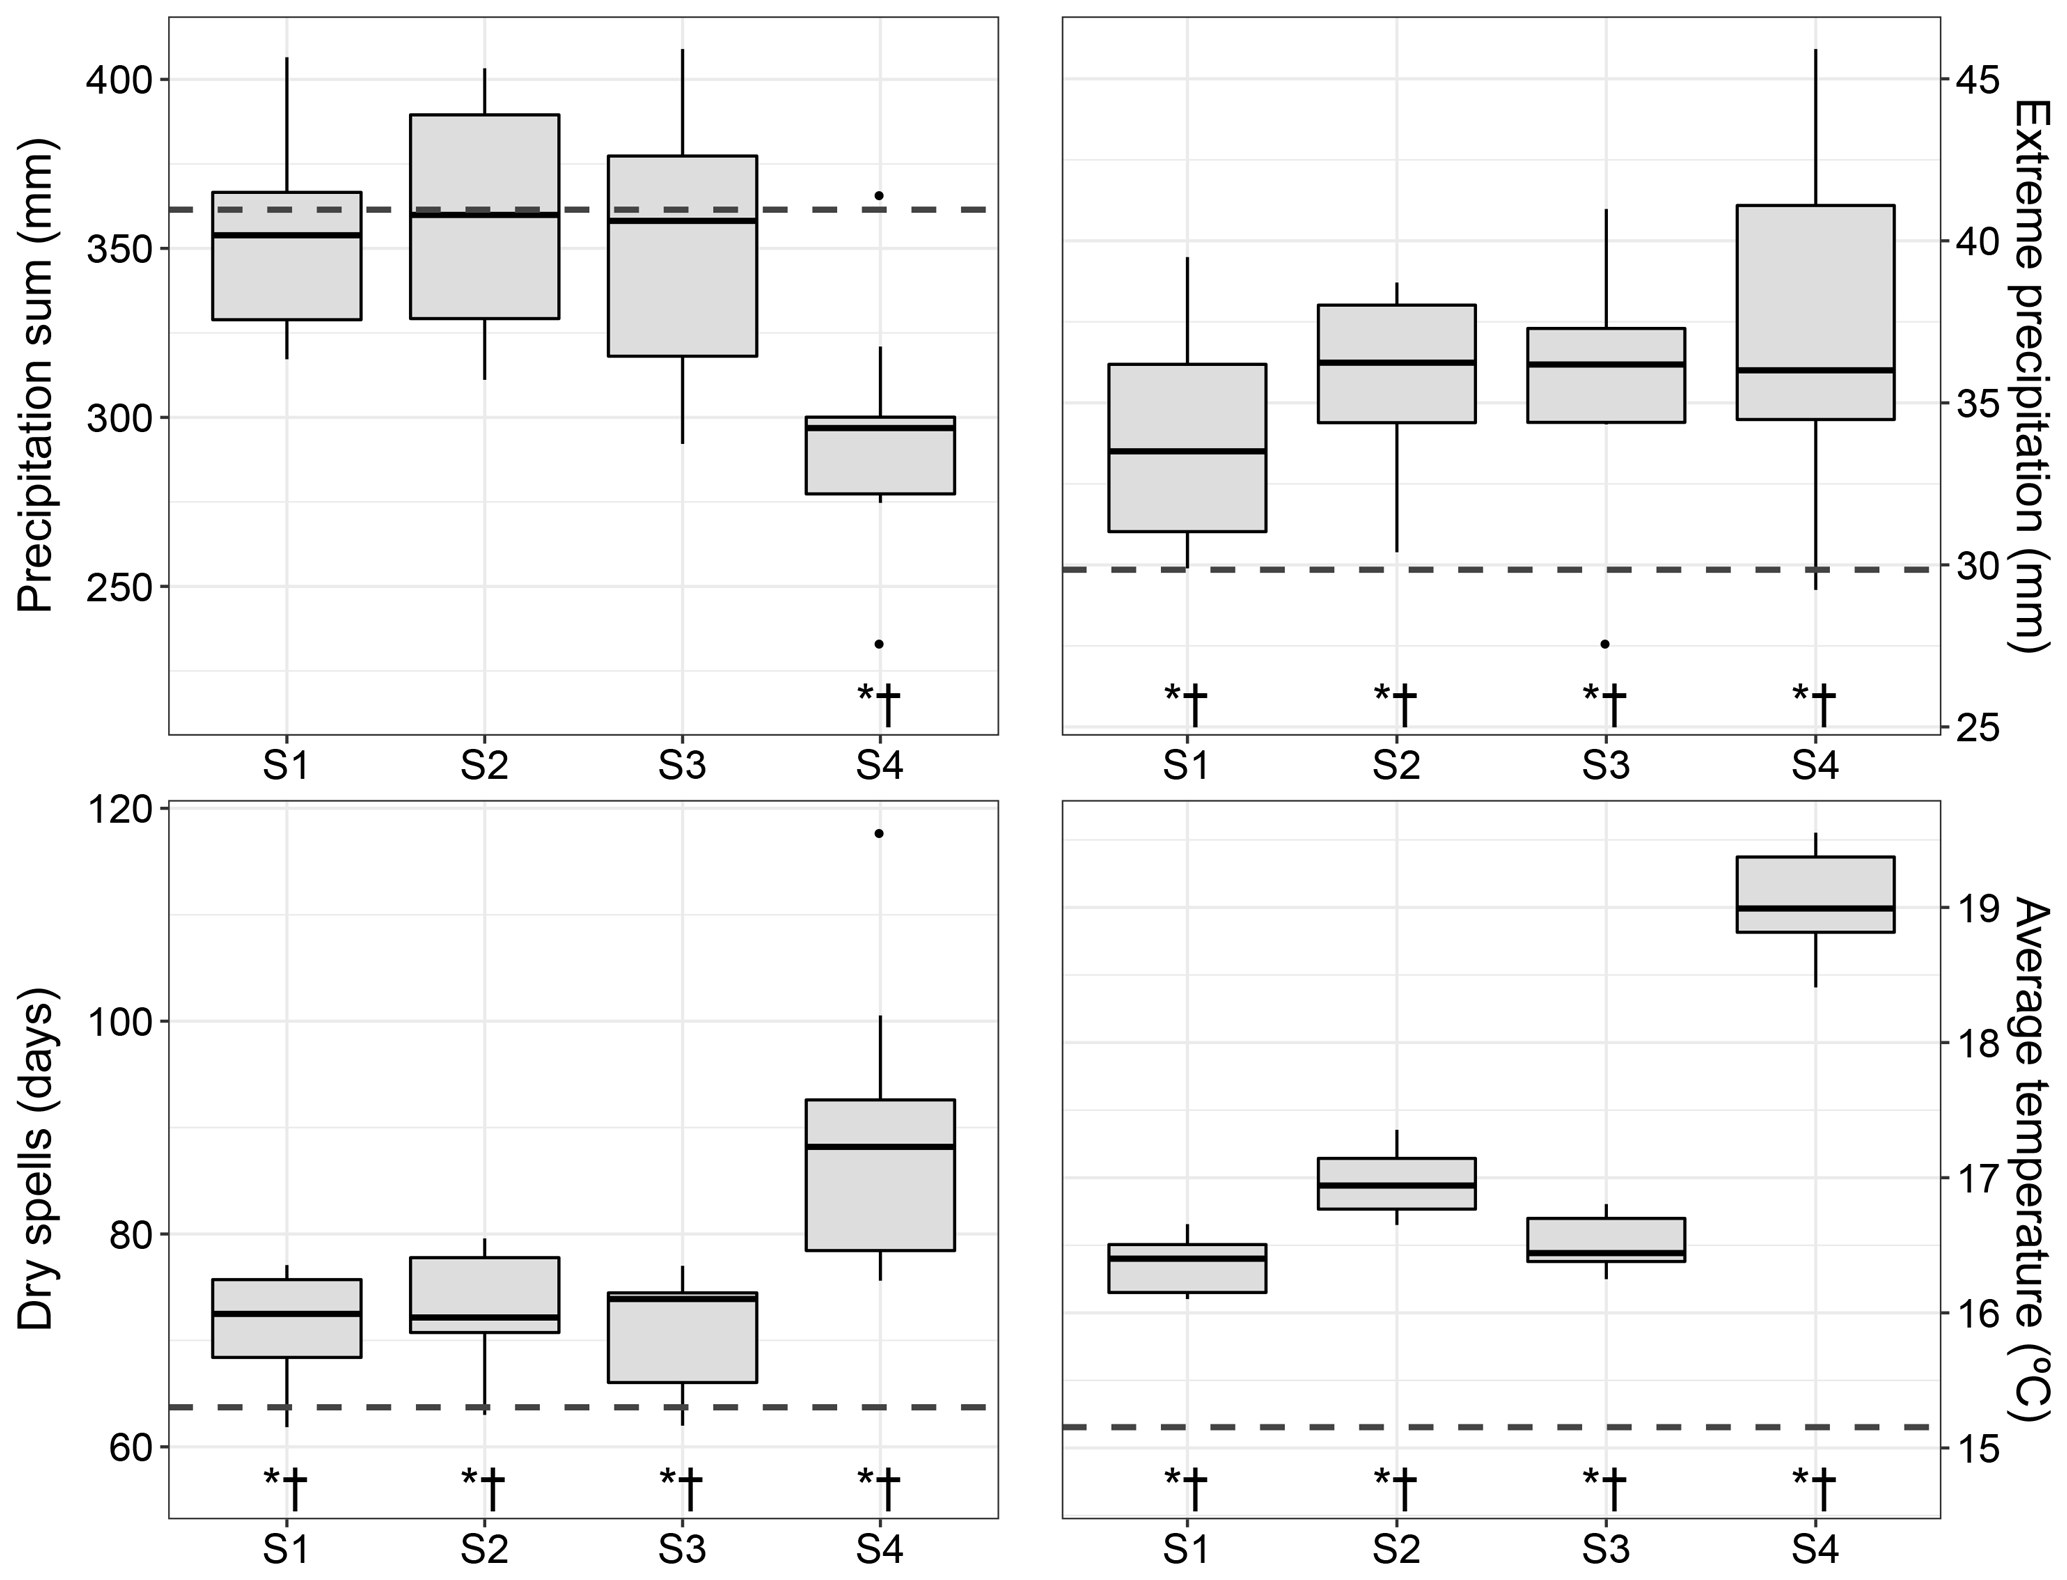
Figure 3Catchment-average climate signal indicators, i.e. precipitation sum (mm), extreme precipitation (mm), dry spells (days) and average temperature (∘C). The boxplots indicate the spread of the catchment average among the nine climate models. In each panel the horizontal dashed line represents the catchment-average value for the reference scenario. An asterisk (∗) indicates a robust change and a dagger (†) indicates a significant change (p<0.05). The hinges indicate the 25th and 75th percentiles, the thick horizontal line indicates the median, the whiskers indicate 1.5 times the inter-quantile range from each of the two hinges and the dots indicate outliers.
3.2 Impact on water security
In the reference scenario, water availability shows a distinct seasonal pattern (Figs. 4, S6 and S8). Reservoir inflow peaks in the autumn and winter months. The total annual reservoir inflow equals 400 Hm3, which is 46 % of the total capacity of the 14 reservoirs used for irrigation. In the autumn and winter months, the plant water stress is low, except in the downstream part of the catchment. In the spring and, more pronounced in the summer, reservoir inflow decreases and plant water stress increases. Plant water stress reaches a maximum in the summer, where the catchment average equals 0.88.
Changes in water availability under future climate conditions show a seasonal pattern as well. In the winter months (DJF) the catchment-total reservoir inflow decreases in all scenarios, up to 36 % (p<0.01) in scenario S4. Significant changes in plant water stress are projected for scenarios S2–S4 showing a catchment-average increase of 0.04 (p=0.03) to 0.11 (p<0.01). In contrast, reservoir inflow in spring (MAM) increases in all scenarios, most markedly in scenario S3 with an increase of 85 % (p=0.07). A small increase in plant water stress is observed in scenarios S1–3; however, scenario S4 shows a significant catchment-average increase of 0.09 (p<0.01).
Similar results are projected for the summer months, with significant changes in plant water stress in scenario S4, showing a catchment-average increase of 0.04 (p<0.01). Surprisingly, despite the decreasing annual precipitation, in the summer months (JJA) reservoir inflow increases, with a maximum of 119 % (scenario S3, p=0.01). In the autumn months (SON) catchment-average plant water stress increases most in all seasons, ranging from 0.05 to 0.11 (p<0.01). In autumn, reservoir inflow increases in all scenarios, with a maximum of 37 % (scenario S2, p=0.16). Overall, a significant yearly increase in reservoir inflow is projected for scenarios S1–3, with a maximum in scenario S3 of 28 % (p<0.01) with respect to the reference scenario (Table S4). The yearly catchment-average plant water stress increases significantly in all scenarios (p<0.01), ranging from 0.03 (scenario S1) to 0.09 (scenario S4), equivalent to a 5 %–14 % increase (Table S4).
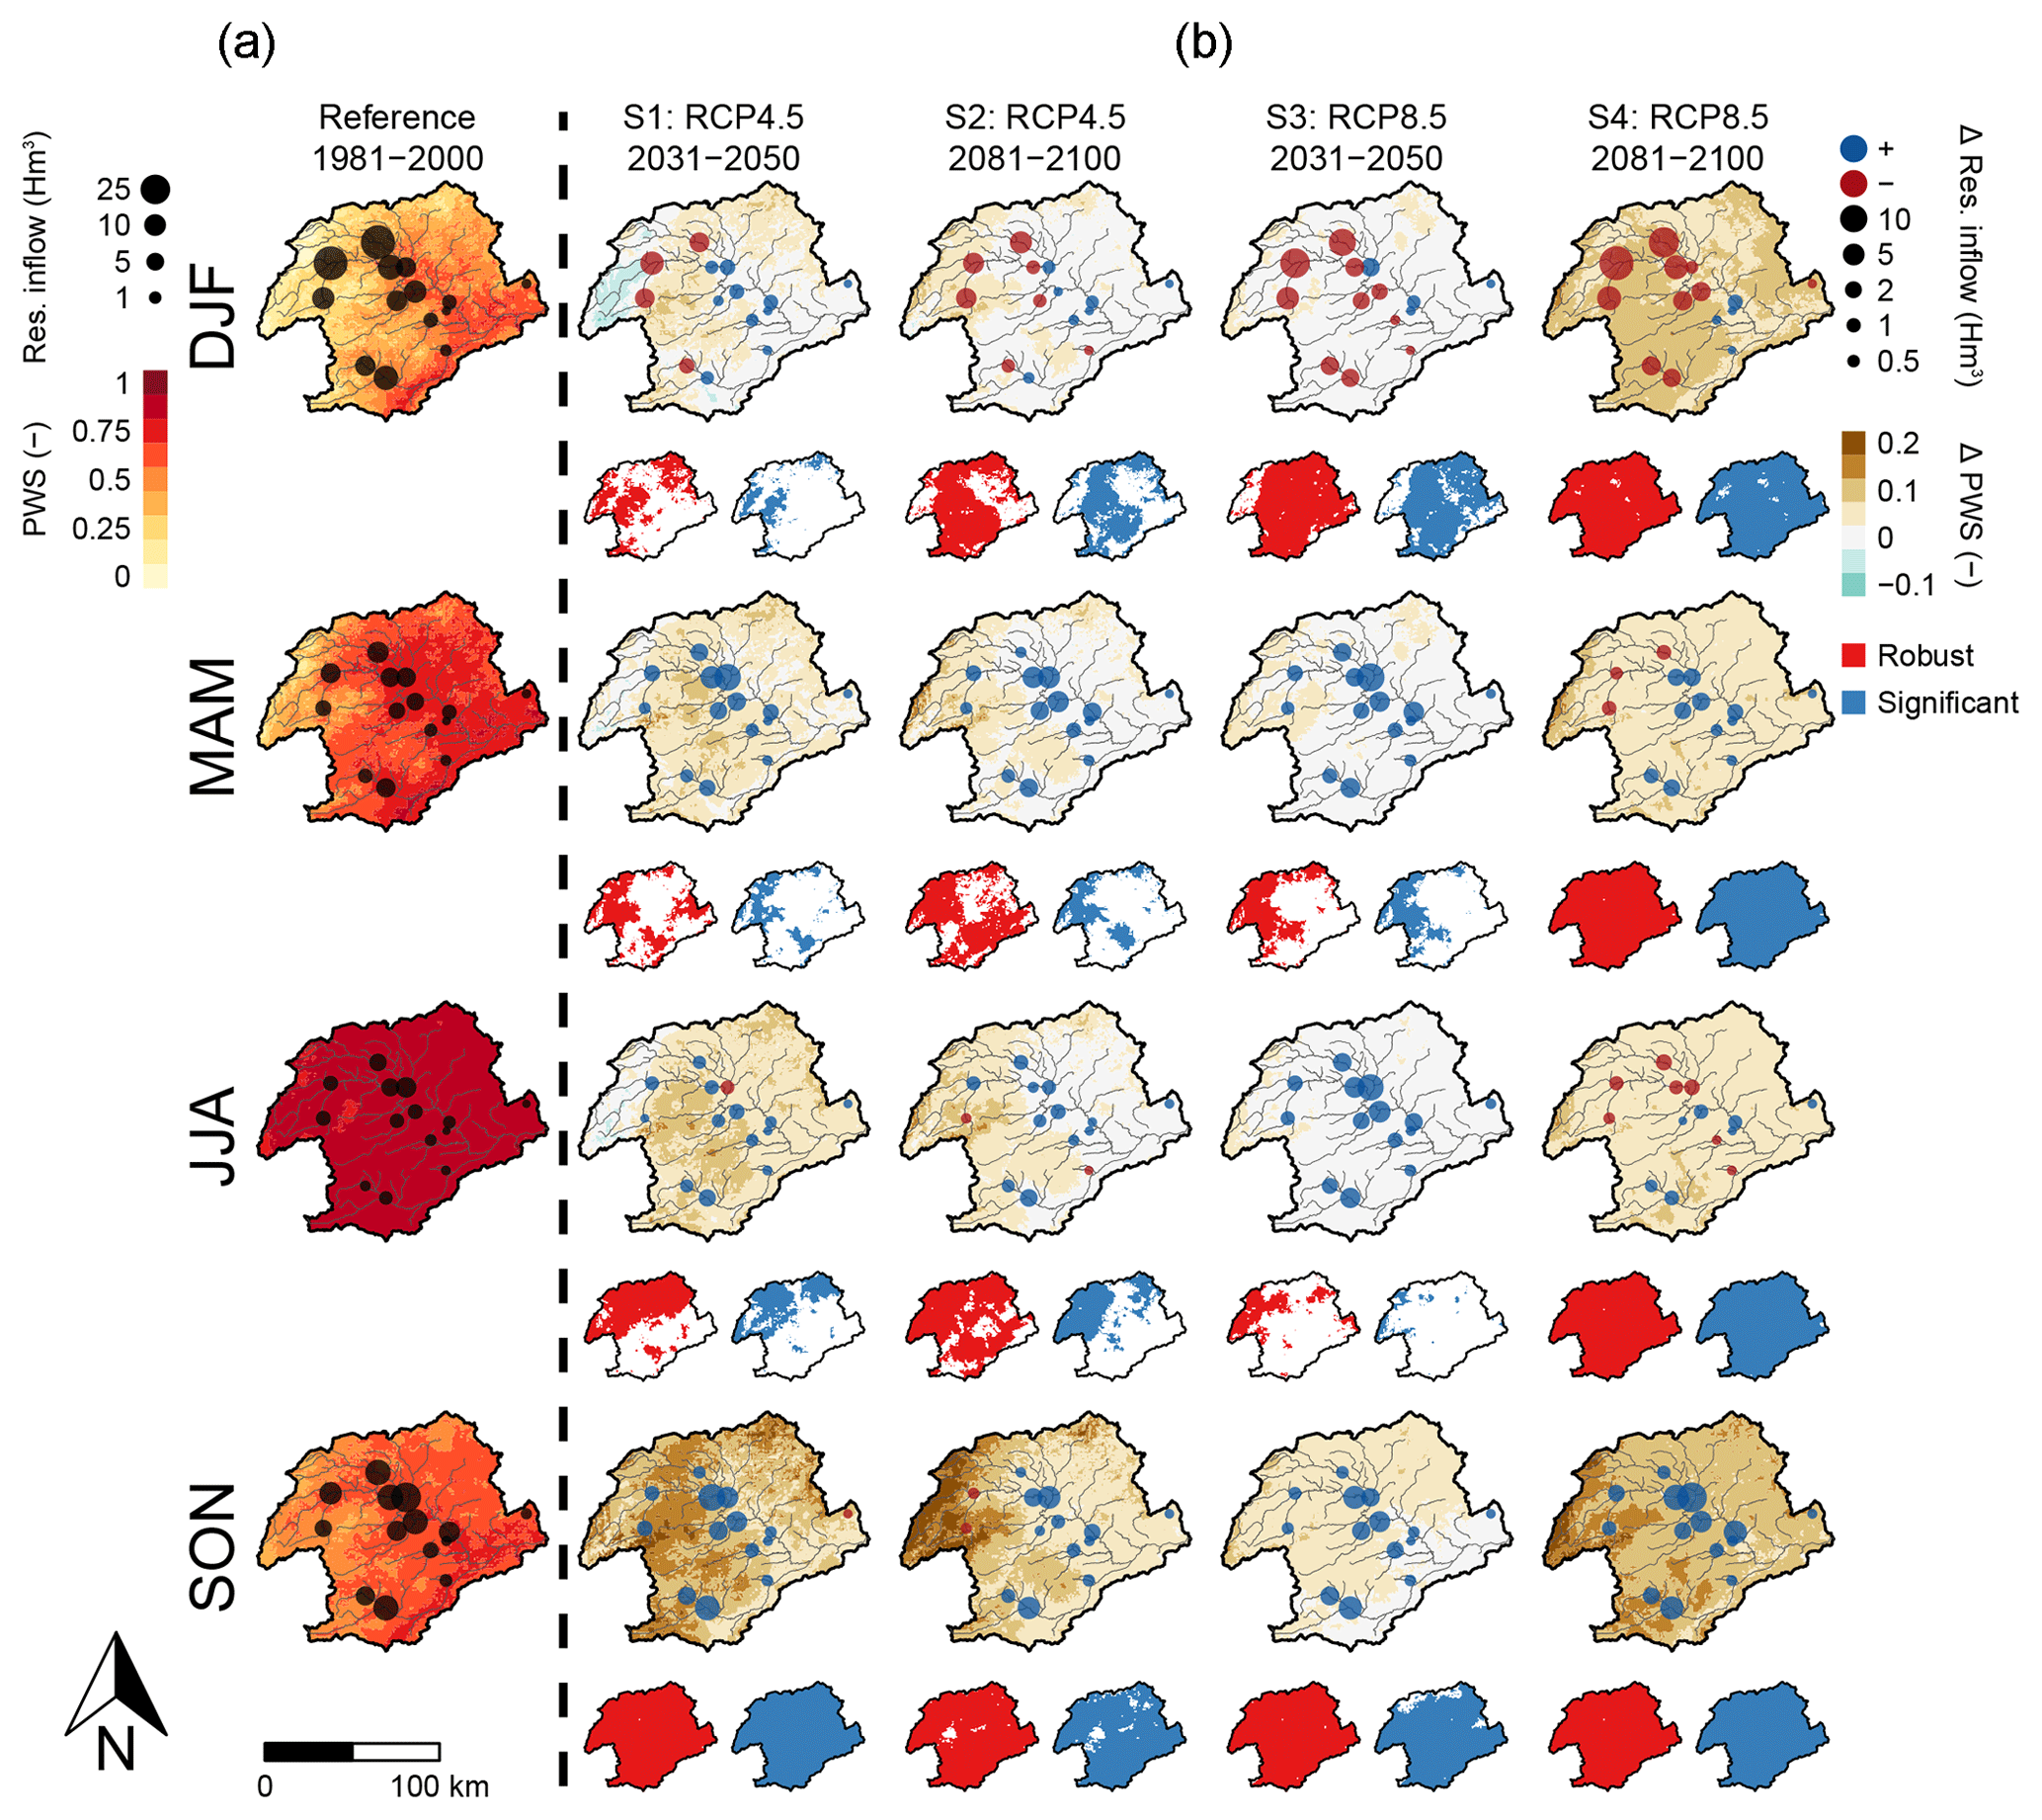
Figure 4Ensemble average seasonal reservoir inflow (dots, Hm3) and plant water stress (PWS) (–) for the reference scenario (a) and changes between the reference scenario and the four future scenarios (b), differentiated by season: winter (DJF), spring (MAM), summer (JJA), and autumn (SON). For the future scenarios, the reservoir inflow is presented as an increase (blue) or a decrease (red).
To understand water security and assess the potential for climate change adaptation, it is important to consider water storage capacity in reservoirs and storage capacity loss due to soil erosion. In the reference scenario, reservoir sediment yield (SY) corresponds to a total annual capacity loss of 0.11 % (Figs. 5 and S9). The average hillslope erosion (SSY) in the subcatchments ranges between 129 and 622 Mg km−2 yr−1. Under future climate conditions, an increase in hillslope erosion is observed in all scenarios (S1–4). Hillslope erosion mainly increases in the central and downstream located subcatchments. In the headwaters, hillslope erosion decreases due to a decrease in annual precipitation (Fig. 2) and an increase in vegetation cover (Fig. S5). The increase in catchment-average hillslope erosion ranges from 24 % (p=0.13) to 46 % (p=0.01). Reservoir sediment yield increases in scenarios S1–3 and decreases in scenario S4. However, significant changes in sediment yield are only observed in scenario S4, with a decrease of 33 % (p<0.01) due to decreasing sediment transport capacity in channels.
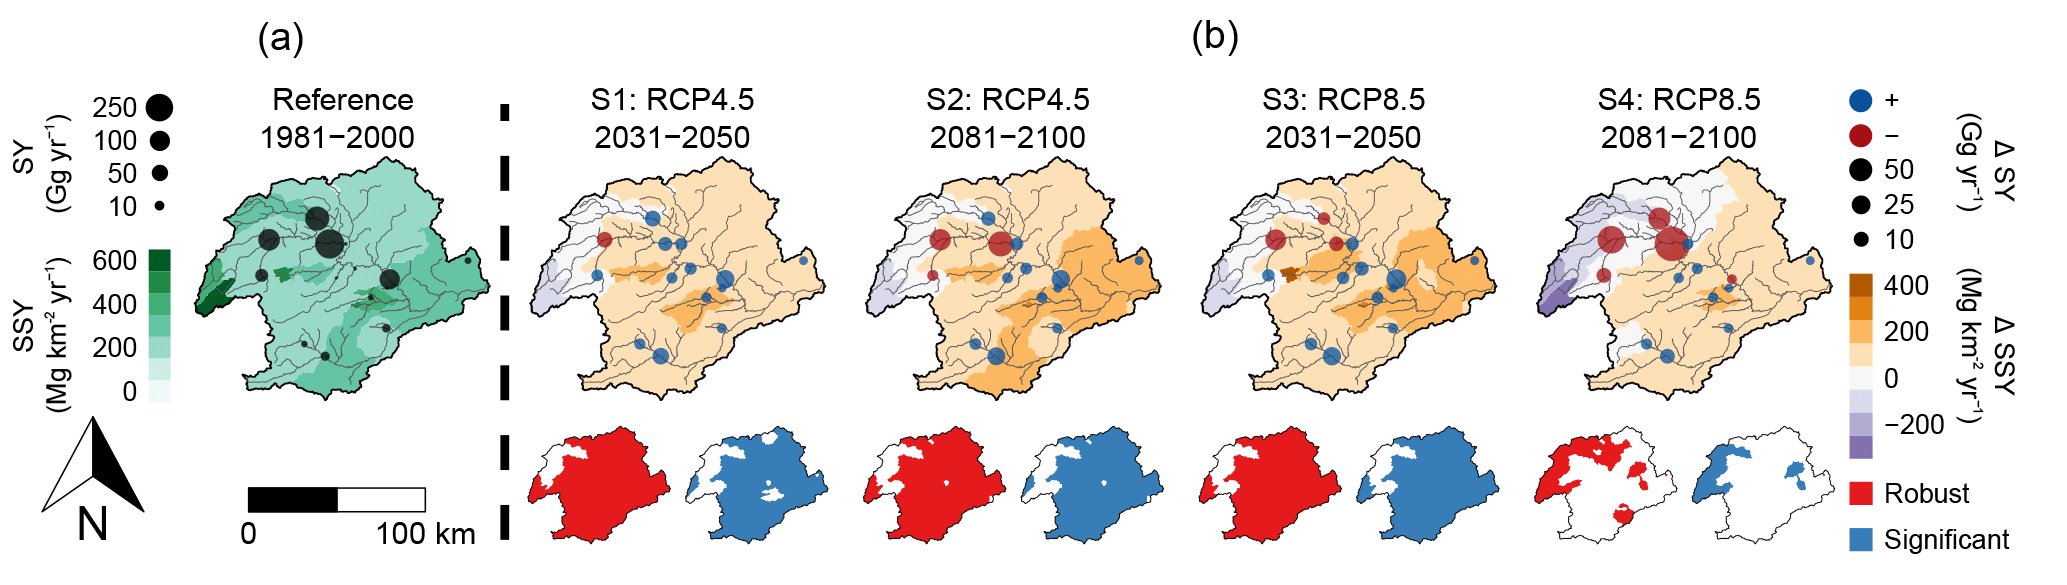
Figure 5Ensemble average sediment yield (SY) at the reservoirs (dots, Gg yr−1) and average hillslope erosion (SSY) per subcatchment (Mg km−2 yr−1) for the reference scenario (a) and changes between the reference scenario and the four future scenarios (b). For the future scenarios, the SY is presented as an increase (blue) or a decrease (red).
Previous studies concluded that climate change leads to reduced water availability in those areas where lower future annual precipitation sums are projected, evidenced by increased drought indices and reduced streamflow (Arnell and Gosling, 2013; Forzieri et al., 2014; Lopez-Bustins et al., 2013; Sperna Weiland et al., 2012). Our results confirm this, but more importantly we show a significant redistribution of water under future climate conditions, resulting in increased plant water stress due to a reduction of soil water content (green water), increased soil erosion and water inflow into streams and reservoirs (blue water), leading to an overall reduced water security. The redistribution of water is mainly driven by an increase in extreme precipitation and a decrease in precipitation frequency, and to a lesser extent by a change in annual precipitation volume (Figs. 2 and S4). The increase in extreme precipitation causes an increase in surface runoff and, subsequently, an increase in reservoir inflow and soil erosion. As such, climate change eventually leads to a reduction of infiltration into the soil, which negatively affects soil moisture content (Table S5) and, subsequently, leads to an increase in plant water stress (Fig. 4 and Table S4), which is a crucial impact indicator for agriculture and natural ecosystems, and may point towards reduced crop yield and natural vegetation cover (Allen et al., 1998).
The four climate change scenarios can be subdivided into moderate (scenarios S1–3) and extreme (scenario S4) climate conditions and related impacts. The moderate climate conditions are mainly characterized by limited reductions of annual precipitation sum and increased temperature (Fig. 3). This results in increased plant water stress, due to a decrease in (actual) evapotranspiration and soil moisture content (Table S5). The extreme climate conditions (scenario S4) are characterized by a significant decrease in precipitation and an increase in dry spells and average temperature (Fig. 3). An increase in temperature often leads to an increase in evapotranspiration; however, less water will infiltrate into the soil due to the significant decrease in precipitation and its increased intensity. As a result, actual evapotranspiration and soil moisture content significantly decrease under these extreme conditions (Table S5), leading to a significant increase in plant water stress in all seasons (Fig. 4).
Previous studies indicated that soil erosion can either decrease or increase under climate change due to the combined effect of decreasing precipitation, increasing intensity and changing vegetation cover (Li and Fang, 2016). Our results show an increase in hillslope erosion due to increased precipitation intensity in the majority of the subcatchments, leading to an increase in sediment yield in most reservoirs (Fig. 5). Increased soil erosion may affect water security directly due to its effect on soil depth, loss of soil organic matter content, and reduced water retention capacity. However, despite the increased soil erosion rates, the catchment-total reservoir sediment yield remains constant or even decreases, due to a decrease in the transport capacity of the flow resulting from a decrease in runoff in the headwaters, most pronounced in scenario S4. This further illustrates the importance of accounting for sediment transport capacity and the different response of hillslope erosion as compared to catchment sediment yield, which is still insufficiently accounted for in the current model and is one of the main challenges in soil erosion and sediment yield models (de Vente et al., 2013). So, although we did not find significantly increased reservoir storage capacity loss due to climate change in our study, loss of reservoir storage capacity is an important aspect affecting water security in many areas worldwide and requires attention when assessing water security (Wisser et al., 2013; de Vente et al., 2005).
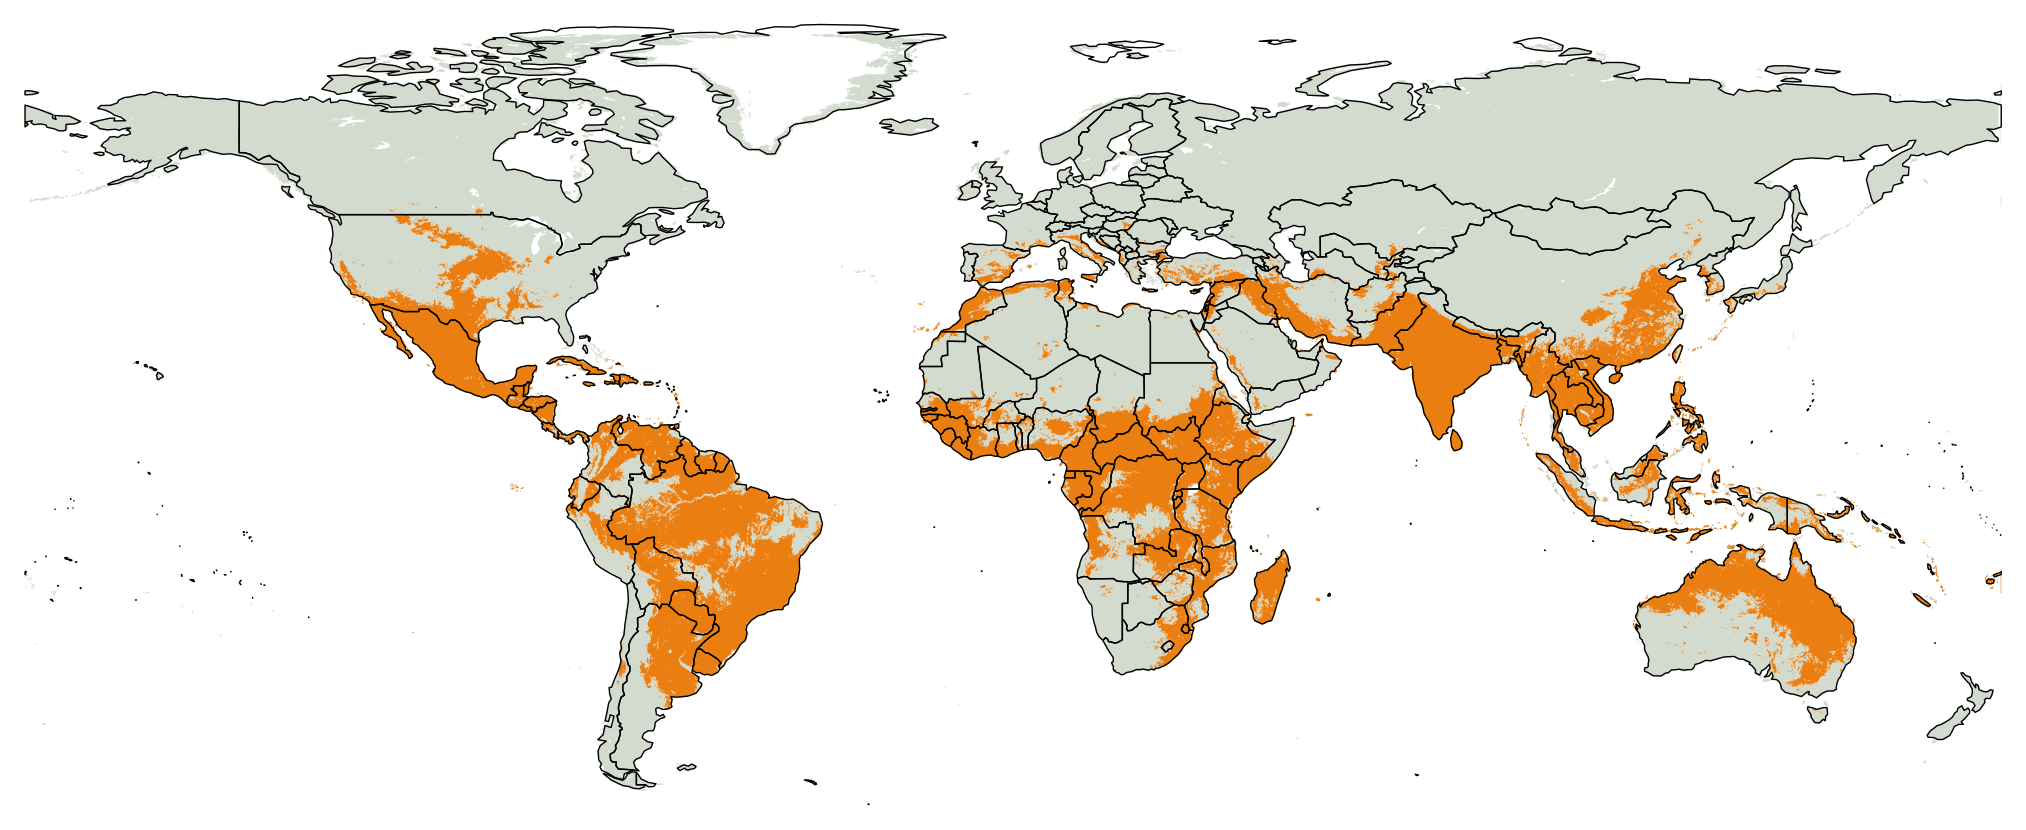
Figure 6Global map indicating the areas (in orange) prone to infiltration excess surface runoff, defined as those areas where extreme precipitation exceeds the infiltration rate (Fig. S2). See the Supplement for more details.
Increased precipitation intensity leads to increased surface runoff, soil erosion, and redistribution of water within the catchment. It is well established that extreme precipitation leads to surface runoff (Beven, 2012) and significantly contributes to soil erosion (Favis-Mortlock and Mullan, 2011); however, most large-scale impact assessments do not consider the most relevant process involved, i.e. infiltration excess surface runoff. A rough preliminary estimate indicates infiltration excess surface runoff actually plays a substantial role in about one-quarter of the global land surface (Fig. 6), where extreme precipitation intensity exceeds the infiltration capacity of the soil. Therefore, we argue that, to account for the impact of increased extreme precipitation on water security, it is crucial to consider infiltration excess surface runoff in hydrological and soil erosion assessments. Here, we introduced a new infiltration excess surface runoff equation (Eqs. S1–S3), which runs at a daily time step and meets the constraints of the available daily climate model output. The equation requires sub-daily precipitation data as input, i.e. the fraction of daily rainfall that occurs in the hour with the highest intensity, which we obtained from local hourly precipitation time series. While we show that extreme precipitation may increase under future climate change, the sub-daily precipitation distribution may change as well. Hence, the impact of extreme precipitation on water security may only be fully assessed when climate models also provide sub-daily precipitation data. Furthermore, we applied a bias-correction method (quantile mapping) that explicitly accounts for changes in the projected daily precipitation distribution. Many previous studies applied the change factor (or delta change) method, which does not fully account for the changes in rainfall intensity. Studies that apply this method often show that a change in annual rainfall leads to a similar direction of change in runoff and soil erosion (Correa et al., 2016; Shrestha et al., 2013). Therefore, future studies should consider bias-correction methods that account for changes in frequency and intensity of extreme events that affect both hydrology and soil erosion (Li and Fang, 2016; Mullan et al., 2012).
Our analysis further shows that, in general, plant water stress and reservoir inflow both increase under future climate conditions. For agriculture, which amounts to more than 40 % of the catchment surface area, this may have significant consequences. Rainfed crops (covering 31 % of the catchment) are most affected by increases in plant water stress (Fig. S7). Seasonal changes in plant water stress (i.e. increased plant water stress in autumn) will strongly affect the harvest and seeding period of the dominant rainfed crops, e.g. (winter) cereal and almonds, which may lead to decreasing crop yields (Allen et al., 1998). On the other hand, increased reservoir inflow may be beneficial for irrigated agriculture (covering 12 % of the catchment). The current annual irrigated water demand equals 1101 Hm3 (Confederación Hidrolgráfica del Segura, 2015). Hence, 36 %–46 % of the irrigated water demand can be met with the annual natural reservoir inflow under future climate conditions. However, an increase in plant water stress is also projected for irrigated crops (Fig. S7), which would lead to increasing water demand. In this study we did not account for additional water supply from deep aquifers and the Tagus–Segura water transfer, nor for the supply of water to irrigated agriculture. In this way, our results deliberately emphasize the changes in water availability that result from climate change and from changes in water demand from natural ecosystems and rainfed agriculture. Currently, irrigation water demand is partly met with water abstractions from deep aquifers and from the Tagus–Segura water transfer. Previous studies have shown that the deep aquifers in the study area are already overexploited (Pellicer-Martínez and Martínez-Paz, 2018; Rupérez-Moreno et al., 2017), which reduces the prospects for future irrigation water extraction. Furthermore, the already highly debated Tagus–Segura water transfer will most likely suffer from reduced water supply under future climate conditions (Lobanova et al., 2017). While increasing water supply from reservoirs is projected, the future sustainability of irrigated crops will most likely decrease due to increased plant water stress, depleted aquifers and reduced water supply from the Tagus–Segura water transfer.
These changes also have other long-term consequences. Increasing plant water stress in rainfed agriculture may cause a shift from rainfed to irrigated agriculture, a trend that is already taking place (Nainggolan et al., 2012) and that would increase the dependency on reservoir storage and irrigation infrastructure. Further land abandonment can be foreseen in areas without access to irrigation water, leading to an increase in shrubland and forest, with significant consequences for ecosystem functioning and rural livelihoods and possible decreased streamflow (Beguería et al., 2003; García-Ruiz et al., 2011). On the other hand, our findings illustrate that careful design of land management in rainfed areas can directly affect water availability for irrigated agriculture, i.e. water available in reservoirs. The design of climate change adaptation strategies should therefore consider their effect on the redistribution of water from green to blue water and the long-term socio-economic consequences. For example, sustainable land management can possibly form a more cost-effective adaptation option to increased extreme precipitation than investing in larger reservoirs and irrigation infrastructure (Sanz et al., 2017).
Overall, our results illustrate that representation of pertinent hydrological processes and suitable bias-correction methods are crucial for accurate climate change impact assessments. To increase water security under climate change we show there is a need for effective adaptation strategies that aim to increase the water holding capacity of the soil (green water) and to reduce soil erosion in order to enhance soil quality and maintain the storage capacity of reservoirs (blue water), benefiting rainfed and irrigated agriculture.
The model source code is available online: https://doi.org/10.5281/zenodo.1344534 (Eekhout et al., 2018). Precipitation data were obtained from the SPREAD dataset (Serrano-Notivoli et al., 2017) (https://doi.org/10.20350/digitalCSIC/7393). Temperature data were obtained from the SPAIN02 dataset (Herrera et al., 2016) (http://www.meteo.unican.es/es/datasets/spain02). Future climate projections were obtained from the EURO-CORDEX dataset (https://www.euro-cordex.net/). Land-use data were obtained from MAPAMA (2010). Soil data were obtained from the SoilGrids dataset (Hengl et al., 2017) (https://www.soilgrids.org). The DEM was obtained from the SRTM dataset (Farr et al., 2007). NDVI data were obtained from the MODIS dataset (https://modis.gsfc.nasa.gov/data/).
The supplement related to this article is available online at: https://doi.org/10.5194/hess-22-5935-2018-supplement.
JPCE, WT and JdV developed the model, JPCE and JdV applied the model, JPCE, JEH and JdV interpreted and discussed the results, and JPCE wrote the paper with contributions from the other authors.
The authors declare that they have no conflict of interest.
We acknowledge financial support from the “Juan de la Cierva” programme of
the Spanish Ministerio de Economía y Competitividad (FJCI-2016-28905),
the Spanish Ministerio de Economía y Competitividad (ADAPT project;
CGL2013-42009-R), the Séneca foundation of the regional government of
Murcia (CAMBIO project; 118933/JLI/13), and the European Union (Horizon 2020
IMPREX project; 641811). The authors thank AEMET and UC for the data provided
for this work (Spain02 v5 dataset, available at
http://www.meteo.unican.es/datasets/spain02, last access: 17 May 2015).
The authors thank Nunzio Romano (handling editor), Rens van Beek (Utrecht
University) and David Farnham for their constructive comments on the manuscript.
Edited by: Nunzio Romano
Reviewed by: David Farnham and Rens van Beek
Allen, R. G., Pereira, L., Raes, D., and Smith, M.: Crop evapotranspiration: Guidelines for computing crop requirements, Tech. Rep. 56, FAO, Rome, Italy, https://doi.org/10.1016/j.eja.2010.12.001, 1998. a, b, c, d, e, f
Arnell, N. W. and Gosling, S. N.: The impacts of climate change on river flow regimes at the global scale, J. Hydrol., 486, 351–364, https://doi.org/10.1016/j.jhydrol.2013.02.010, 2013. a, b
Baartman, J. E. M., Jetten, V. G., Ritsema, C. J., and de Vente, J.: Exploring effects of rainfall intensity and duration on soil erosion at the catchment scale using openLISEM: Prado catchment, SE Spain, Hydrol. Process., 26, 1034–1049, https://doi.org/10.1002/hyp.8196, 2012. a
Beguería, S., López-Moreno, J. I., Lorente, A., Seeger, M., and García-Ruiz, J. M.: Assessing the effect of climate oscillations and land-use changes on streamflow in the central Spanish Pyrenees, Ambio, 32, 283–286, 2003. a
Beven, K. J.: Rainfall-runoff modelling: the primer, John Wiley & Sons, Ltd, Chichester, UK, https://doi.org/10.1002/9781119951001, 2012. a, b
Castillo, V. M., Gómez-Plaza, A., and Martínez-Mena, M.: The role of antecedent soil water content in the runoff response of semiarid catchments: A simulation approach, J. Hydrol., 284, 114–130, https://doi.org/10.1016/S0022-1694(03)00264-6, 2003. a
Confederación Hidrolgráfica del Segura: Plan Hidrológico de la Cuenca del Segura. 2015–2021, Tech. rep., Confederación Hidrolgráfica del Segura, Murcia, Spain, 2015. a
Correa, S. W., Mello, C. R., Chou, S. C., Curi, N., and Norton, L. D.: Soil erosion risk associated with climate change at Mantaro River basin, Peruvian Andes, Catena, 147, 110–124, https://doi.org/10.1016/j.catena.2016.07.003, 2016. a
de Vente, J., Poesen, J., and Verstraeten, G.: The application of semi-quantitative methods and reservoir sedimentation rates for the prediction of basin sediment yield in Spain, J. Hydrol., 305, 63–86, https://doi.org/10.1016/j.jhydrol.2004.08.030, 2005. a
de Vente, J., Poesen, J., Verstraeten, G., Govers, G., Vanmaercke, M., Van Rompaey, A., Arabkhedri, M., and Boix-Fayos, C.: Predicting soil erosion and sediment yield at regional scales: Where do we stand?, Earth-Sci. Rev., 127, 16–29, https://doi.org/10.1016/j.earscirev.2013.08.014, 2013. a
Donnelly, C., Greuell, W., Andersson, J., Gerten, D., Pisacane, G., Roudier, P., and Ludwig, F.: Impacts of climate change on European hydrology at 1.5, 2 and 3 degrees mean global warming above preindustrial level, Climatic Change, 143, 13–26, https://doi.org/10.1007/s10584-017-1971-7, 2017. a
Eekhout, J. P. C., Terink, W., and de Vente, J.: Assessing the large-scale impacts of environmental change using a coupled hydrology and soil erosion model, Earth Surf. Dynam., 6, 687–703, https://doi.org/10.5194/esurf-6-687-2018, 2018a. a, b
Eekhout, J. P. C., Terink, W., and De Vente, J.: SPHY-MMF – Coupled Hydrology–Soil Erosion Model, https://doi.org/10.5281/zenodo.1344534, 2018b. a
Farr, T. G., Rosen, P. A., Caro, E., Crippen, R., Duren, R., Hensley, S., Kobrick, M., Paller, M., Rodriguez, E., Roth, L., Seal, D., Shaffer, S., Shimada, J., Umland, J., Werner, M., Oskin, M., Burbank, D., and Alsdorf, D.: The Shuttle Radar Topography Mission, Rev. Geophys., 45, RG2004, https://doi.org/10.1029/2005RG000183, 2007. a, b
Favis-Mortlock, D. and Mullan, D.: Soil erosion by water under future climate change, in: Soil hydrology, land use and agriculture: measurement and modelling, edited by: Shukla, M. K., CABI, Wallingford, UK, 384–414, https://doi.org/10.1079/9781845937973.0384, 2011. a
Fay, P. A., Carlisle, J. D., Knapp, A. K., Blair, J. M., and Collins, S. L.: Productivity responses to altered rainfall patterns in a C4-dominated grassland, Oecologia, 137, 245–251, https://doi.org/10.1007/s00442-003-1331-3, 2003. a
Forzieri, G., Feyen, L., Rojas, R., Flörke, M., Wimmer, F., and Bianchi, A.: Ensemble projections of future streamflow droughts in Europe, Hydrol. Earth Syst. Sci., 18, 85–108, https://doi.org/10.5194/hess-18-85-2014, 2014. a, b
García-Ruiz, J. M., López-Moreno, J. I., Vicente-Serrano, S. M., Lasanta-Martínez, T., and Beguería, S.: Mediterranean water resources in a global change scenario, Earth-Sci. Rev., 105, 121–139, https://doi.org/10.1016/j.earscirev.2011.01.006, 2011. a
García-Ruiz, J. M., Nadal-Romero, E., Lana-Renault, N., and Beguería, S.: Erosion in Mediterranean landscapes: Changes and future challenges, Geomorphology, 198, 20–36, https://doi.org/10.1016/j.geomorph.2013.05.023, 2013. a
Heber Green, W. and Ampt, G. A.: Studies on Soil Phyics, J. Agricult. Sci., 4, 1–24, https://doi.org/10.1017/S0021859600001441, 1911. a
Hengl, T., Mendes de Jesus, J., Heuvelink, G. B. M., Ruiperez Gonzalez, M., Kilibarda, M., Blagotić, A., Shangguan, W., Wright, M. N., Geng, X., Bauer-Marschallinger, B., Guevara, M. A., Vargas, R., MacMillan, R. A., Batjes, N. H., Leenaars, J. G. B., Ribeiro, E., Wheeler, I., Mantel, S., and Kempen, B.: SoilGrids250m: Global gridded soil information based on machine learning, PLOS One, 12, e0169748, https://doi.org/10.1371/journal.pone.0169748, 2017. a, b
Herrera, S., Fernández, J., and Gutiérrez, J. M.: Update of the Spain02 gridded observational dataset for EURO-CORDEX evaluation: assessing the effect of the interpolation methodology, Int. J. Climatol., 36, 900–908, https://doi.org/10.1002/joc.4391, 2016. a, b
Ivancic, T. J. and Shaw, S. B.: Examining why trends in very heavy precipitation should not be mistaken for trends in very high river discharge, Climatic Change, 133, 681–693, https://doi.org/10.1007/s10584-015-1476-1, 2015. a
Jacob, D., Petersen, J., Eggert, B., Alias, A., Christensen, O. B., Bouwer, L. M., Braun, A., Colette, A., Déqué, M., Georgievski, G., Georgopoulou, E., Gobiet, A., Menut, L., Nikulin, G., Haensler, A., Hempelmann, N., Jones, C., Keuler, K., Kovats, S., Kröner, N., Kotlarski, S., Kriegsmann, A., Martin, E., van Meijgaard, E., Moseley, C., Pfeifer, S., Preuschmann, S., Radermacher, C., Radtke, K., Rechid, D., Rounsevell, M., Samuelsson, P., Somot, S., Soussana, J.-F., Teichmann, C., Valentini, R., Vautard, R., Weber, B., and Yiou, P.: EURO-CORDEX: new high-resolution climate change projections for European impact research, Reg. Environ. Change, 14, 563–578, https://doi.org/10.1007/s10113-013-0499-2, 2014. a, b, c, d, e
Knapp, A. K., Beier, C., Briske, D. D., Classen, A. T., Luo, Y., Reichstein, M., Smith, M. D., Smith, S. D., Bell, J. E., Fay, P. A., Heisler, J. L., Leavitt, S. W., Sherry, R., Smith, B., and Weng, E.: Consequences of More Extreme Precipitation Regimes for Terrestrial Ecosystems, BioScience, 58, 811–821, https://doi.org/10.1641/B580908, 2008. a
León-Sánchez, L., Nicolás, E., Goberna, M., Prieto, I., Maestre, F. T., and Querejeta, J. I.: Poor plant performance under simulated climate change is linked to mycorrhizal responses in a semi-arid shrubland, J. Ecol., 106, 960–976, https://doi.org/10.1111/1365-2745.12888, 2018. a
Lesschen, J., Schoorl, J., and Cammeraat, L.: Modelling runoff and erosion for a semi-arid catchment using a multi-scale approach based on hydrological connectivity, Geomorphology, 109, 174–183, https://doi.org/10.1016/j.geomorph.2009.02.030, 2009. a
Li, Z. and Fang, H.: Impacts of climate change on water erosion: A review, Earth-Sci. Rev., 163, 94–117, https://doi.org/10.1016/j.earscirev.2016.10.004, 2016. a, b, c, d
Lobanova, A., Liersch, S., Tàbara, J. D., Koch, H., Hattermann, F. F., and Krysanova, V.: Harmonizing human-hydrological system under climate change: A scenario-based approach for the case of the headwaters of the Tagus River, J. Hydrol., 548, 436–447, https://doi.org/10.1016/j.jhydrol.2017.03.015, 2017. a
Lopez-Bustins, J. A., Pascual, D., Pla, E., and Retana, J.: Future variability of droughts in three Mediterranean catchments, Nat. Hazards, 69, 1405–1421, https://doi.org/10.1007/s11069-013-0754-3, 2013. a
Manus, C., Anquetin, S., Braud, I., Vandervaere, J.-P., Creutin, J.-D., Viallet, P., and Gaume, E.: A modeling approach to assess the hydrological response of small mediterranean catchments to the variability of soil characteristics in a context of extreme events, Hydrol. Earth Syst. Sci., 13, 79–97, https://doi.org/10.5194/hess-13-79-2009, 2009. a
MAPAMA: Mapa de Cultivos y Aprovechamientos de España 2000-2010 (1 : 50.000), available at: http://www.magrama.gob.es/es/cartografia-y-sig/publicaciones/agricultura/mac_2000_2009.aspx (last access: 17 March 2017), 2010. a, b
Maraun, D., Shepherd, T. G., Widmann, M., Zappa, G., Walton, D., Gutiérrez, J. M., Hagemann, S., Richter, I., Soares, P. M. M., Hall, A., and Mearns, L. O.: Towards process-informed bias correction of climate change simulations, Nat. Clim. Change, 7, 664–773, https://doi.org/10.1038/nclimate3418, 2017. a
Merheb, M., Moussa, R., Abdallah, C., Colin, F., Perrin, C., and Baghdadi, N.: Hydrological response characteristics of Mediterranean catchments at different time scales: a meta-analysis, Hydrolog. Sci. J., 61, 1–20, https://doi.org/10.1080/02626667.2016.1140174, 2016. a
Mishra, V., Dominguez, F., and Lettenmaier, D. P.: Urban precipitation extremes: How reliable are regional climate models?, Geophys. Res. Lett., 39, L03407, https://doi.org/10.1029/2011GL050658, 2012. a
Morgan, R. P. C. and Duzant, J. H.: Modified MMF (Morgan–Morgan–Finney) model for evaluating effects of crops and vegetation cover on soil erosion, Earth Surf. Proc. Land., 33, 90–106, https://doi.org/10.1002/esp.1530, 2008. a, b, c
Mullan, D., Favis-Mortlock, D., and Fealy, R.: Addressing key limitations associated with modelling soil erosion under the impacts of future climate change, Agr. Forest Meteorol., 156, 18–30, https://doi.org/10.1016/j.agrformet.2011.12.004, 2012. a, b, c
Nainggolan, D., de Vente, J., Boix-Fayos, C., Termansen, M., Hubacek, K., and Reed, M. S.: Afforestation, agricultural abandonment and intensification: Competing trajectories in semi-arid Mediterranean agro-ecosystems, Agr. Ecosyst. Environ., 159, 90–104, https://doi.org/10.1016/j.agee.2012.06.023, 2012. a
Nearing, M. A., Deer-Ascough, L., and Laflen, J. M.: Sensitivity analysis of the Wepp Hillslope profile erosion model, T. ASAE, 33, 0839–0849, https://doi.org/10.13031/2013.31409, 1990. a
Nearing, M. A., Pruski, F. F., and O'Neal, M. R.: Expected climate change impacts on soil erosion rates: A review, J. SoilWater Conserv., 59, 43–50, 2004. a, b, c
Nicholson, E., Mace, G. M., Armsworth, P. R., Atkinson, G., Buckle, S., Clements, T., Ewers, R. M., Fa, J. E., Gardner, T. A., Gibbons, J., Grenyer, R., Metcalfe, R., Mourato, S., Muûls, M., Osborn, D., Reuman, D. C., Watson, C., and Milner-Gulland, E. J.: Priority research areas for ecosystem services in a changing world, J. Appl. Ecol., 46, 1139–1144, https://doi.org/10.1111/j.1365-2664.2009.01716.x, 2009. a
Nunes, J. P., Seixas, J., and Pacheco, N. R.: Vulnerability of water resources, vegetation productivity and soil erosion to climate change in Mediterranean watersheds, Hydrol. Process., 22, 3115–3134, https://doi.org/10.1002/hyp.6897, 2008. a
Nunes, J. P., Seixas, J., Keizer, J. J., and Ferreira, A. J. D.: Sensitivity of runoff and soil erosion to climate change in two Mediterranean watersheds. Part I: model parameterization and evaluation, Hydrol. Process., 23, 1202–1211, https://doi.org/10.1002/hyp.7247, 2009a. a
Nunes, J. P., Seixas, J., Keizer, J. J., and Ferreira, A. J. D.: Sensitivity of runoff and soil erosion to climate change in two Mediterranean watersheds. Part II: assessing impacts from changes in storm rainfall, soil moisture and vegetation cover, Hydrol. Process., 23, 1212–1220, https://doi.org/10.1002/hyp.7250, 2009b. a
Nunes, J. P., Seixas, J., and Keizer, J. J.: Modeling the response of within-storm runoff and erosion dynamics to climate change in two Mediterranean watersheds: A multi-model, multi-scale approach to scenario design and analysis, Catena, 102, 27–39, https://doi.org/10.1016/j.catena.2011.04.001, 2013. a
O'Gorman, P. A. and Schneider, T.: The physical basis for increases in precipitation extremes in simulations of 21st-century climate change, P. Natl. Acad. Sci. USA, 106, 14773–14777, https://doi.org/10.1073/pnas.0907610106, 2009. a
Paroissien, J.-B., Darboux, F., Couturier, A., Devillers, B., Mouillot, F., Raclot, D., and Le Bissonnais, Y.: A method for modeling the effects of climate and land use changes on erosion and sustainability of soil in a Mediterranean watershed (Languedoc, France), J. Environ. Manage., 150, 57–68, https://doi.org/10.1016/j.jenvman.2014.10.034, 2015. a
Pellicer-Martínez, F. and Martínez-Paz, J. M.: Probabilistic evaluation of the water footprint of a river basin: Accounting method and case study in the Segura River Basin, Spain, Sci. Total Environ., 627, 28–38, https://doi.org/10.1016/j.scitotenv.2018.01.223, 2018. a
Pimentel, D., Harvey, C., Resosudarmo, P., Sinclair, K., Kurz, D., McNair, M., Crist, S., Shpritz, L., Fitton, L., Saffouri, R., and Blair, R.: Environmental and Economic Costs of Soil Erosion and Conservation Benefits, Science, 267, 1117–1123, https://doi.org/10.1126/science.267.5201.1117, 1995. a
Porporato, A., Laio, F., Ridolfi, L., and Rodriguez-Iturbe, I.: Plants in water-controlled ecosystems: active role in hydrologic processes and response to water stress, Adv. Water Resour., 24, 725–744, https://doi.org/10.1016/S0309-1708(01)00006-9, 2001. a
Pruski, F. F. and Nearing, M. A.: Runoff and soil loss responses to changes in precipitation: A computer simulation study, J. Soil Water Conserv., 57, 7–16, 2002. a
Routschek, A., Schmidt, J., and Kreienkamp, F.: Impact of climate change on soil erosion – A high-resolution projection on catchment scale until 2100 in Saxony/Germany, Catena, 121, 99–109, https://doi.org/10.1016/j.catena.2014.04.019, 2014. a
Rupérez-Moreno, C., Senent-Aparicio, J., Martinez-Vicente, D., García-Aróstegui, J. L., Calvo-Rubio, F. C., and Pérez-Sánchez, J.: Sustainability of irrigated agriculture with overexploited aquifers: The case of Segura basin (SE, Spain), Agr. Water Manage., 182, 67–76, https://doi.org/10.1016/j.agwat.2016.12.008, 2017. a
Sanz, M. J., de Vente, J., Chotte, J. L., Bernoux, M., Kust, G., Ruiz, I., Almagro, M., Alloza, J. A., Vallejo, R., Castillo, V., Hebel, A., and Akhtar-Schuster, M.: Sustainable Land Management contribution to successful land-based climate change adaptation and mitigation. A Report of the Science-Policy Interface, United Nations Convention to Combat Desertification (UNCCD), Tech. rep., UNCCD SPI, Bonn, Germany, 2017. a
Serrano-Notivoli, R., Beguería, S., Saz, M. Á., Longares, L. A., and de Luis, M.: SPREAD: a high-resolution daily gridded precipitation dataset for Spain – an extreme events frequency and intensity overview, Earth Syst. Sci. Data, 9, 721–738, https://doi.org/10.5194/essd-9-721-2017, 2017. a, b
Shrestha, B., Babel, M. S., Maskey, S., van Griensven, A., Uhlenbrook, S., Green, A., and Akkharath, I.: Impact of climate change on sediment yield in the Mekong River basin: a case study of the Nam Ou basin, Lao PDR, Hydrol. Earth Syst. Sci., 17, 1–20, https://doi.org/10.5194/hess-17-1-2013, 2013. a
Sillmann, J., Kharin, V. V., Zwiers, F. W., Zhang, X., and Bronaugh, D.: Climate extremes indices in the CMIP5 multimodel ensemble: Part 2. Future climate projections, J. Geophys. Res.-Atmos., 118, 2473–2493, https://doi.org/10.1002/jgrd.50188, 2013. a
Sperna Weiland, F. C., Van Beek, L. P. H., Kwadijk, J. C. J., and Bierkens, M. F. P.: Global patterns of change in discharge regimes for 2100, Hydrol. Earth Syst. Sci., 16, 1047–1062, https://doi.org/10.5194/hess-16-1047-2012, 2012. a, b
Sun, Y., Solomon, S., Dai, A., and Portmann, R. W.: How often will it rain?, J. Climate, 20, 4801–4818, https://doi.org/10.1175/JCLI4263.1, 2007. a
Terink, W., Lutz, A. F., Simons, G. W. H., Immerzeel, W. W., and Droogers, P.: SPHY v2.0: Spatial Processes in HYdrology, Geosci. Model Dev., 8, 2009–2034, https://doi.org/10.5194/gmd-8-2009-2015, 2015. a, b
Themeßl, M. J., Gobiet, A., and Leuprecht, A.: Empirical-statistical downscaling and error correction of daily precipitation from regional climate models, Int. J. Climatol., 31, 1530–1544, https://doi.org/10.1002/joc.2168, 2011. a
Themeßl, M. J., Gobiet, A., and Heinrich, G.: Empirical-statistical downscaling and error correction of regional climate models and its impact on the climate change signal, Climatic Change, 112, 449–468, https://doi.org/10.1007/s10584-011-0224-4, 2012. a
Thober, S., Kumar, R., Wanders, N., Marx, A., Pan, M., Rakovec, O., Samaniego, L., Sheffield, J., Wood, E. F., and Zink, M.: Multi-model ensemble projections of European river floods and high flows at 1.5, 2, and 3 degrees global warming, Environ, Res, Lett,, 13, 014003, https://doi.org/10.1088/1748-9326/aa9e35, 2018. a, b
United Nations General Assembly: Transforming our world: The 2030 agenda for sustainable development, Tech. Rep. October, United Nations, available at: http://unctad.org/meetings/en/SessionalDocuments/ares70d1_en.pdf (last access: 27 October 2017), 2015. a
UN-Water: Water Security & the Global Water Agenda – A UN-Water Analytical Brief, United Nations University, Hamilton, Canada, 2013. a
Wasko, C. and Sharma, A.: Global assessment of flood and storm extremes with increased temperatures, Scient. Rep., 7, 7945, https://doi.org/10.1038/s41598-017-08481-1, 2017. a
Wisser, D., Frolking, S., Hagen, S., and Bierkens, M. F. P.: Beyond peak reservoir storage? A global estimate of declining water storage capacity in large reservoirs, Water Resour. Res., 49, 5732–5739, https://doi.org/10.1002/wrcr.20452, 2013. a
Zhang, Y., Hernandez, M., Anson, E., Nearing, M. A., Wei, H., Stone, J. J., and Heilman, P.: Modeling climate change effects on runoff and soil erosion in southeastern Arizona rangelands and implications for mitigation with conservation practices, J. Soil Water Conserv., 67, 390–405, https://doi.org/10.2489/jswc.67.5.390, 2012. a