the Creative Commons Attribution 4.0 License.
the Creative Commons Attribution 4.0 License.
 | 13 Nov 2018
The PERSIANN family of global satellite precipitation data: a review and evaluation of products
Mohammed Ombadi
Soroosh Sorooshian
Kuolin Hsu
Amir AghaKouchak
Dan Braithwaite
Hamed Ashouri
Andrea Rose Thorstensen
Over the past 2 decades, a wide range of studies have incorporated Precipitation Estimation from Remotely Sensed Information using Artificial Neural Networks (PERSIANN) products. Currently, PERSIANN offers several precipitation products based on different algorithms available at various spatial and temporal scales, namely PERSIANN, PERSIANN-CCS, and PERSIANN-CDR. The goal of this article is to first provide an overview of the available PERSIANN precipitation retrieval algorithms and their differences. Secondly, we offer an evaluation of the available operational products over the contiguous US (CONUS) at different spatial and temporal scales using Climate Prediction Center (CPC) unified gauge-based analysis as a benchmark. Due to limitations of the baseline dataset (CPC), daily scale is the finest temporal scale used for the evaluation over CONUS. Additionally, we provide a comparison of the available products at a quasi-global scale. Finally, we highlight the strengths and limitations of the PERSIANN products and briefly discuss expected future developments.
- Article
(8280 KB) - Full-text XML
- BibTeX
- EndNote


1.1 Satellite-based estimation of precipitation
Precipitation is an integral part of the Earth's hydrologic cycle, playing the foremost role in its water and energy balance. Accurate, uninterrupted, and uniform observation of precipitation represents an important input for hydrologic research and operational applications. In essence, the resilience and capacity of societies to react and adapt to climate extremes such as storms, floods, and droughts are greatly enhanced with a long-term historical record of precipitation. Practical applications include using precipitation intensity–duration–frequency (IDF) information for infrastructure design and developing early warning systems and disaster management planning by utilizing near-real-time precipitation data. Moreover, the observation of precipitation is essential for understanding Earth's climate and its underlying variabilities and trends. In turn, climatic understanding can improve our ability to forecast extreme events and enables informative strategic planning and decision making on issues related to water supply, in both quantity and quality.
Precipitation measurement continues to represent a great challenge for the scientific community, mainly due to its spatiotemporal variations in intensity and duration (Sorooshian et al., 2011). The three primary instruments used for measurement of precipitation are gauges, radars, and satellites. Rain gauges provide direct measurement of precipitation; however, the method suffers from intermittent coverage over most continents. Radar technology is not available in many countries and, even in places where the technology is available, beam blockage by terrain is a major challenge. In addition, both rain gauges and radars do not provide measurements over oceans. On the other hand, satellite-based precipitation measurements seem to be the most promising method to accurately observe precipitation over both land and ocean.
Satellite-based precipitation estimation techniques are comprised of information from geostationary Earth orbiting (GEO) satellites and/or low Earth orbiting (LEO) satellites. GEO satellites are capable of providing images every 5–30 min in multiple spectral bands, but their spectral coverage is limited to visible and infrared wavelengths. On the other hand, LEO satellites are able to provide passive microwave (PMW) information about the hydrometeors directly relevant to surface precipitation rates. Early efforts for the development of techniques to estimate precipitation from satellites are briefly discussed in Hsu et al. (1997). These efforts include the analysis of individual pixel information (Meisner and Arkin, 1987) as well as the analysis of cloud image types and their variations in time (Scofield, 1987). The Tropical Rainfall Measurement Mission (TRMM), launched in 1997, marked the beginning of a new era for operational satellite-based precipitation products. It carried the first orbital rainfall radar, which was used to calibrate passive microwave sensors on other satellites, resulting in significant improvements in rainfall retrievals over the tropical regions of the globe (Kummerow et al., 1998, 2000; Simpson et al., 1988). After 17 years of continuous precipitation measurement, the TRMM came to an end and was followed by the Global Precipitation Measurement (GPM) mission, which deployed an enhanced dual-frequency radar sensor. The GPM program aims to combine observations from multiple passive microwave sensors mounted on both pre-existing and newly deployed satellites. The GPM satellite constellation has global coverage in the range (68∘ S–68∘ N) with a return interval of 3 h (Hou et al., 2014).
Today, several agencies and institutes provide satellite-based datasets, each derived using different algorithms. These products include the NOAA Climate Prediction Center (CPC) morphing technique CMORPH (Joyce et al., 2004), NASA TRMM Multi-Satellite Precipitation Analysis (TMPA) (Huffman et al., 2007), NASA Integrated Multi-satellitE Retrievals for GPM (IMERG) (Huffman et al., 2014), NRL-Blend satellite rainfall estimates from the Naval Research Laboratory (NRL) (Turk et al., 2010) and the Precipitation Estimation from Remotely Sensed Information using Artificial Neural Networks (PERSIANN) family of products (Hsu et al., 1997, 1999; Sorooshian et al., 2000).
1.2 PERSIANN family of satellite-based precipitation products
Over the last 2 decades, the PERSIANN suite of precipitation products has been developed at the Center for Hydrometeorology and Remote Sensing (CHRS) at the University of California, Irvine, in collaboration with NASA, NOAA, and the UNESCO program for the Global Network on Water and Development Information for Arid Lands (G-WADI). The PERSIANN family includes three satellite-based precipitation estimation products, namely PERSIANN, PERSIANN-CCS, and PERSIANN-CDR. The products are accessible through several web-based interfaces to serve the needs of researchers, professionals, and the general public. These interfaces provide different visualization, analysis, and download capabilities and are accessible at CHRS iRain (http://irain.eng.uci.edu, last access: 8 November 2018), Data Portal (http://chrsdata.eng.uci.edu, last access: 8 November 2018), and RainSphere (http://rainsphere.eng.uci.edu, last access: 8 November 2018).
PERSIANN products have been used frequently for different studies by researchers in the fields of hydrology, water resource management, and climate. Such studies include the evaluation of PERSIANN products against ground observations, other satellite-based products, and model simulations (Sorooshian et al., 2002; Yilmaz et al., 2005; Li et al., 2003; Miao et al., 2015; Nguyen et al., 2017; Mehran and AghaKouchak, 2014), application of PERSIANN products for modeling soil moisture (Juglea et al., 2010), prediction of runoff (Behrangi et al., 2011; Ashouri et al., 2016; Liu et al., 2017; AghaKouchak et al., 2010; Hsu et al., 2013), rainfall frequency analysis (Gado et al., 2017), tracking typhoons (Nguyen et al., 2014), monitoring drought (Katiraie-Boroujerdy et al., 2016; AghaKouchak and Nakhjiri, 2012), assimilation into climate models (Yi, 1996), precipitation forecasting (Zahraei et al., 2013), and trend analysis (Nguyen et al., 2016; Damberg and AghaKouchak, 2014).
The main objective of this article is to provide a concise and clear summary of the similarities and differences between the three products in terms of their attributes and algorithm structures. Moreover, the article aims to provide an evaluation of the performance of each product over the contiguous United States (CONUS) using the Climate Prediction Center (CPC) precipitation dataset as a baseline for comparison. In addition, we perform an assessment of the behavior of the PERSIANN family products over the globe (60∘ S–60∘ N) through an inter-comparison analysis. The subsequent sections of this paper are organized as follows: Sect. 2 presents a brief description and comparison of the algorithm and attributes of each product. Sections 3 and 4 provide the results of evaluation of the PERSIANN products over the CONUS and the globe, respectively. In Sect. 5, we provide conclusions to pinpoint future development areas.
Table 1Basic attributes of the PERSIANN, PERSIANN-CCS, and PERSIANN-CDR products.
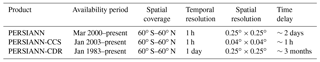
In this section, we provide a general description of the attributes and algorithm structures of the PERSIANN products. A comparison of the basic attributes of the three products is shown in Table 1, which demonstrates the differences between the products in spatial and temporal resolution, time delay, and record length. The three products are operationally available to address the diverse needs of end users. PERSIANN-CDR is a climate data record with a length of approximately 35 years, making it suitable for the investigation of statistical trends in hydrometeorological phenomena and frequency analysis studies. On the other hand, PERSIANN and PERSIANN-CCS are intended to serve the decision-making needs at short time lags (1 h–2 days). PERSIANN-CCS is available in near real time (e.g., ∼1 h time lag), which makes it suitable for applications such as monitoring the formation and development of hurricanes. Meanwhile, PERSIANN, available at a time lag of 2 days, is a product that incorporates quality controlled input data. It should be noted that the three products have missing data in some time intervals due to unavailability of input geostationary satellite data.
2.1 Precipitation Estimation from Remotely Sensed Information using Artificial Neural Networks (PERSIANN)
The PERSIANN algorithm, developed in 1997, is based on the synergy between the sparsely sampled information from LEO satellites and the high-frequency samples from GEO satellites. With regard to GEO imagery, PERSIANN originally used longwave infrared retrievals as the primary input to the algorithm; however, it was later extended to include daytime visible imagery as well. The passive microwave imagery from LEO satellites is used to continuously adapt the parameters of the model.
The PERSIANN algorithm is an artificial neural network (ANN) model based on a multilayer neural feedforward network (MFN) known as the Modified Counter Propagation Network (Hsu, 1996). This hybrid model consists of two processes. First, the infrared (10.2–11.2 µm) images are transformed into the hidden layer through an automatic clustering process to form what is known as a self-organizing feature map (SOFM). The purpose of this process is to detect and classify patterns in the input data. Then, the discrete SOFM clusters in the hidden layer are mapped to the continuous space of outputs (i.e., rainfall rate). Both processes of input-hidden and hidden-output transformations involve parameter estimation, which is routinely performed by incorporating passive microwave (PMW) rainfall from low Earth orbiting satellites. It is noteworthy that parameter estimation in each process can be performed separately by training the model for the former while a supervised learning strategy is used for the latter. PERSIANN data are available for public use through the CHRS Data Portal at http://chrsdata.eng.uci.edu (last access: 8 November 2018). For a comprehensive description of the original PERSIANN algorithm and the several enhancements added to it, interested readers should refer to Hsu et al. (1997, 1999, 2007) and Sorooshian et al. (2000, 2002).
2.2 PERSIANN-Cloud Classification System (PERSIANN-CCS)
PERSIANN-CCS (Hong et al., 2004) is an example of cloud-patch-based algorithms where the features are extracted from the cloud coverage under specified temperature thresholds. Earlier algorithms with a similar concept were developed, including the Griffith–Woodley technique (Griffith et al., 1978; Woodley et al., 1980), the convective-stratiform technique (Adler and Negri, 1988), and the method proposed by Xu et al. (1999). The PERSIANN-CCS algorithm utilizes more information from the infrared cloud images compared to PERSIANN by performing segmentation of the cloud image under different temperature thresholds. The algorithm involves four steps. First, the infrared cloud image is segmented based on different temperature thresholds using an incremental temperature threshold (ITT) approach. Next, features such as temperature, geometry, and texture are extracted from the segmented images in an attempt to distinguish between different cloud types and assign the cloud patch 1 of 400 classifications. In the third step, the SOFM clustering algorithm is used to classify the cloud extracted features into distinct categories. Finally, for each feature group resulting from the previous step, a relationship between brightness temperature and rainfall rate is developed using histogram matching and nonlinear exponential function fitting (Hong et al., 2004). A PMW rainfall calibrated PERSIANN-CCS algorithm was developed beginning in 2014 and has been implemented as part of the NASA GPM IMERG algorithm (Karbalaee et al., 2017). At this time, the PMW calibrated PERSIANN-CCS products are available after 2014. PERSIANN-CCS data are available for public use through the CHRS Data Portal http://chrsdata.eng.uci.edu (last access: 8 November 2018). For a comprehensive description of PERSIANN-CCS and PMW calibrated algorithms, interested readers should refer to Hong et al. (2004) and Karbalaee et al. (2017).
2.3 PERSIANN-Climate Data Record (PERSIANN-CDR)
PERSIANN-CDR uses a modified PERSIANN algorithm in order to produce a historical record of precipitation estimates dating back to 1983. The PERSIANN algorithm relies primarily on infrared imagery from GEO satellites as an input to the ANN model. Similarly, PERSIANN-CDR uses infrared imagery data from different international GEO satellites which are available starting from 1979 at 10 km spatial resolution and 3 h temporal resolution (Rossow and Schiffer, 1991; Rossow and Garder, 1993; Knapp, 2008) and maintained by NOAA under the International Satellite Cloud Climatological Project (ISCCP). However, unlike the PERSIANN algorithm, where passive microwave imagery is used to update the parameters of the network, PERSIANN-CDR alternatively uses the National Centers for Environmental Prediction (NCEP) Stage IV hourly precipitation to train the ANN model. Then, the algorithm is run with fixed parameters to estimate the historical data. An additional processing step is performed to reduce the bias in the PERSIANN-CDR estimates by incorporating Global Precipitation Climatology Project (GPCP) monthly 2.5∘ precipitation data. The resulting PERSIANN-CDR estimates maintain monthly total precipitation consistent with the GPCP data (Ashouri et al., 2015). PERSIANN-CDR data are available for public use through the NOAA National Centers for Environmental Information (NCEI) at https://www.ncdc.noaa.gov/cdr/atmospheric/precipitation-persiann-cdr (last access: 8 November 2018) and the CHRS Data Portal http://chrsdata.eng.uci.edu (last access: 8 November 2018). For a comprehensive description of the PERSIANN-CDR algorithm, interested readers should refer to Ashouri et al. (2015).
In this section, we present results of an evaluation over the CONUS for PERSIANN, PERSIANN-CCS, and PERSIANN-CDR from 2003 to 2015. The main dataset used as a reference for evaluation is NOAA Climate Prediction Center (CPC) Unified Gauge-Based Analysis of Daily Precipitation over the CONUS (retrieved from ftp://ftp.cdc.noaa.gov/datasets, last access: 8 November 2018), hereafter referred to as CPC. The CPC dataset was developed from a dense gauge network using the optimal interpolation (OI) method (Gandin, 1965); Chen et al. (2008) demonstrated that the OI algorithm is superior to common interpolation algorithms for precipitation interpolation over most regions of the globe, with a correlation of 0.811 with independent gauge observations over the US. For further validation results of the OI interpolation algorithm, interested readers should refer to Bussieres and Hogg (1989) and Creutin and Obled (1982). CPC data, with a spatial resolution of (0.25∘ × 0.25∘), were used as a baseline for evaluation in this study because they combine information from a dense gauge network over the CONUS of approximately 8500 stations with an average distance of 30 km between stations (Chen et al., 2008).
Table 2Algorithm attributes of the PERSIANN, PERSIANN-CCS, and PERSIANN-CDR products.
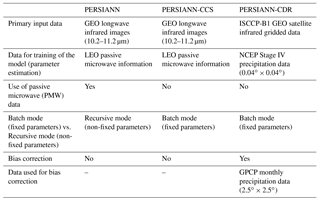

Figure 2Correlation (CORR), root mean square error (RMSE), and multiplicative bias of PERSIANN, PERSIANN-CCS, and PERSIANN-CDR against CPC for the period (2003–2015) over the CONUS.
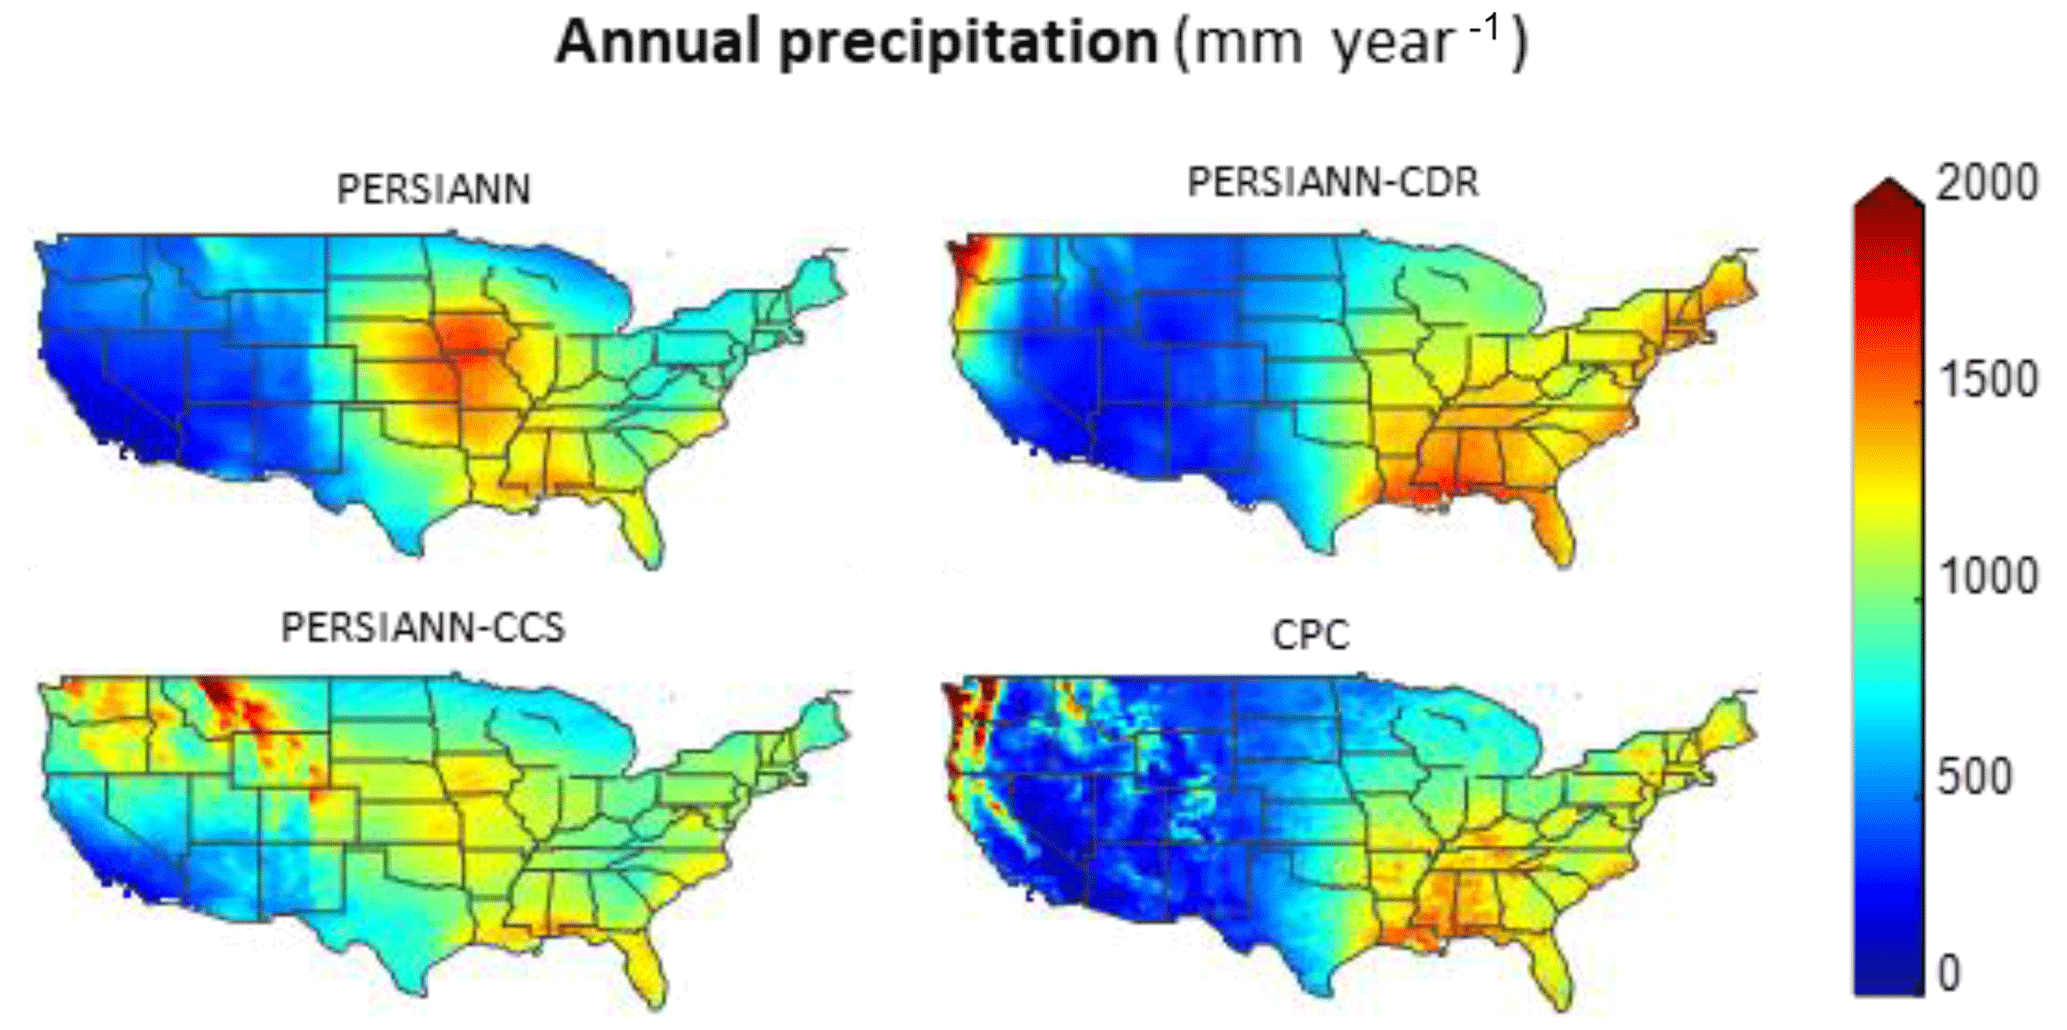
Figure 1 shows the average annual precipitation during 2003–2015 for the four datasets. The average annual precipitation of PERSIANN, PERSIANN-CCS, PERSIANN-CDR, and CPC over the CONUS in millimeters is 793, 979, 916, and 852, respectively. It can be clearly seen from Fig. 1 that PERSIANN-CDR better mirrors the precipitation patterns observed in the CPC data. This is not surprising since PERSIANN-CDR, as detailed in Table 2, is a bias-adjusted product utilizing the GPCP data. Over the gulf states, PERSIANN and PERSIANN-CCS both tend to underestimate the mean annual precipitation, whereas PERSIANN-CDR captures those patterns. The average annual precipitation of PERSIANN generally matches the pattern of PERSIANN-CDR and CPC, although an underestimation over the northwestern US (Washington, Oregon, and northern California) and a spurious overestimation in Midwestern states are observed. Underestimation over the northwestern states might be due to the challenges associated with satellite estimation of synoptic precipitation events during winter, which can either be in liquid or frozen form. An alternative plausible reason is that the PERSIANN algorithm is trained using PMW data (see Table 2) which has considerable underdetection during winter. With regard to PERSIANN-CCS, the pattern and values of average annual rainfall differ considerably from the other products.
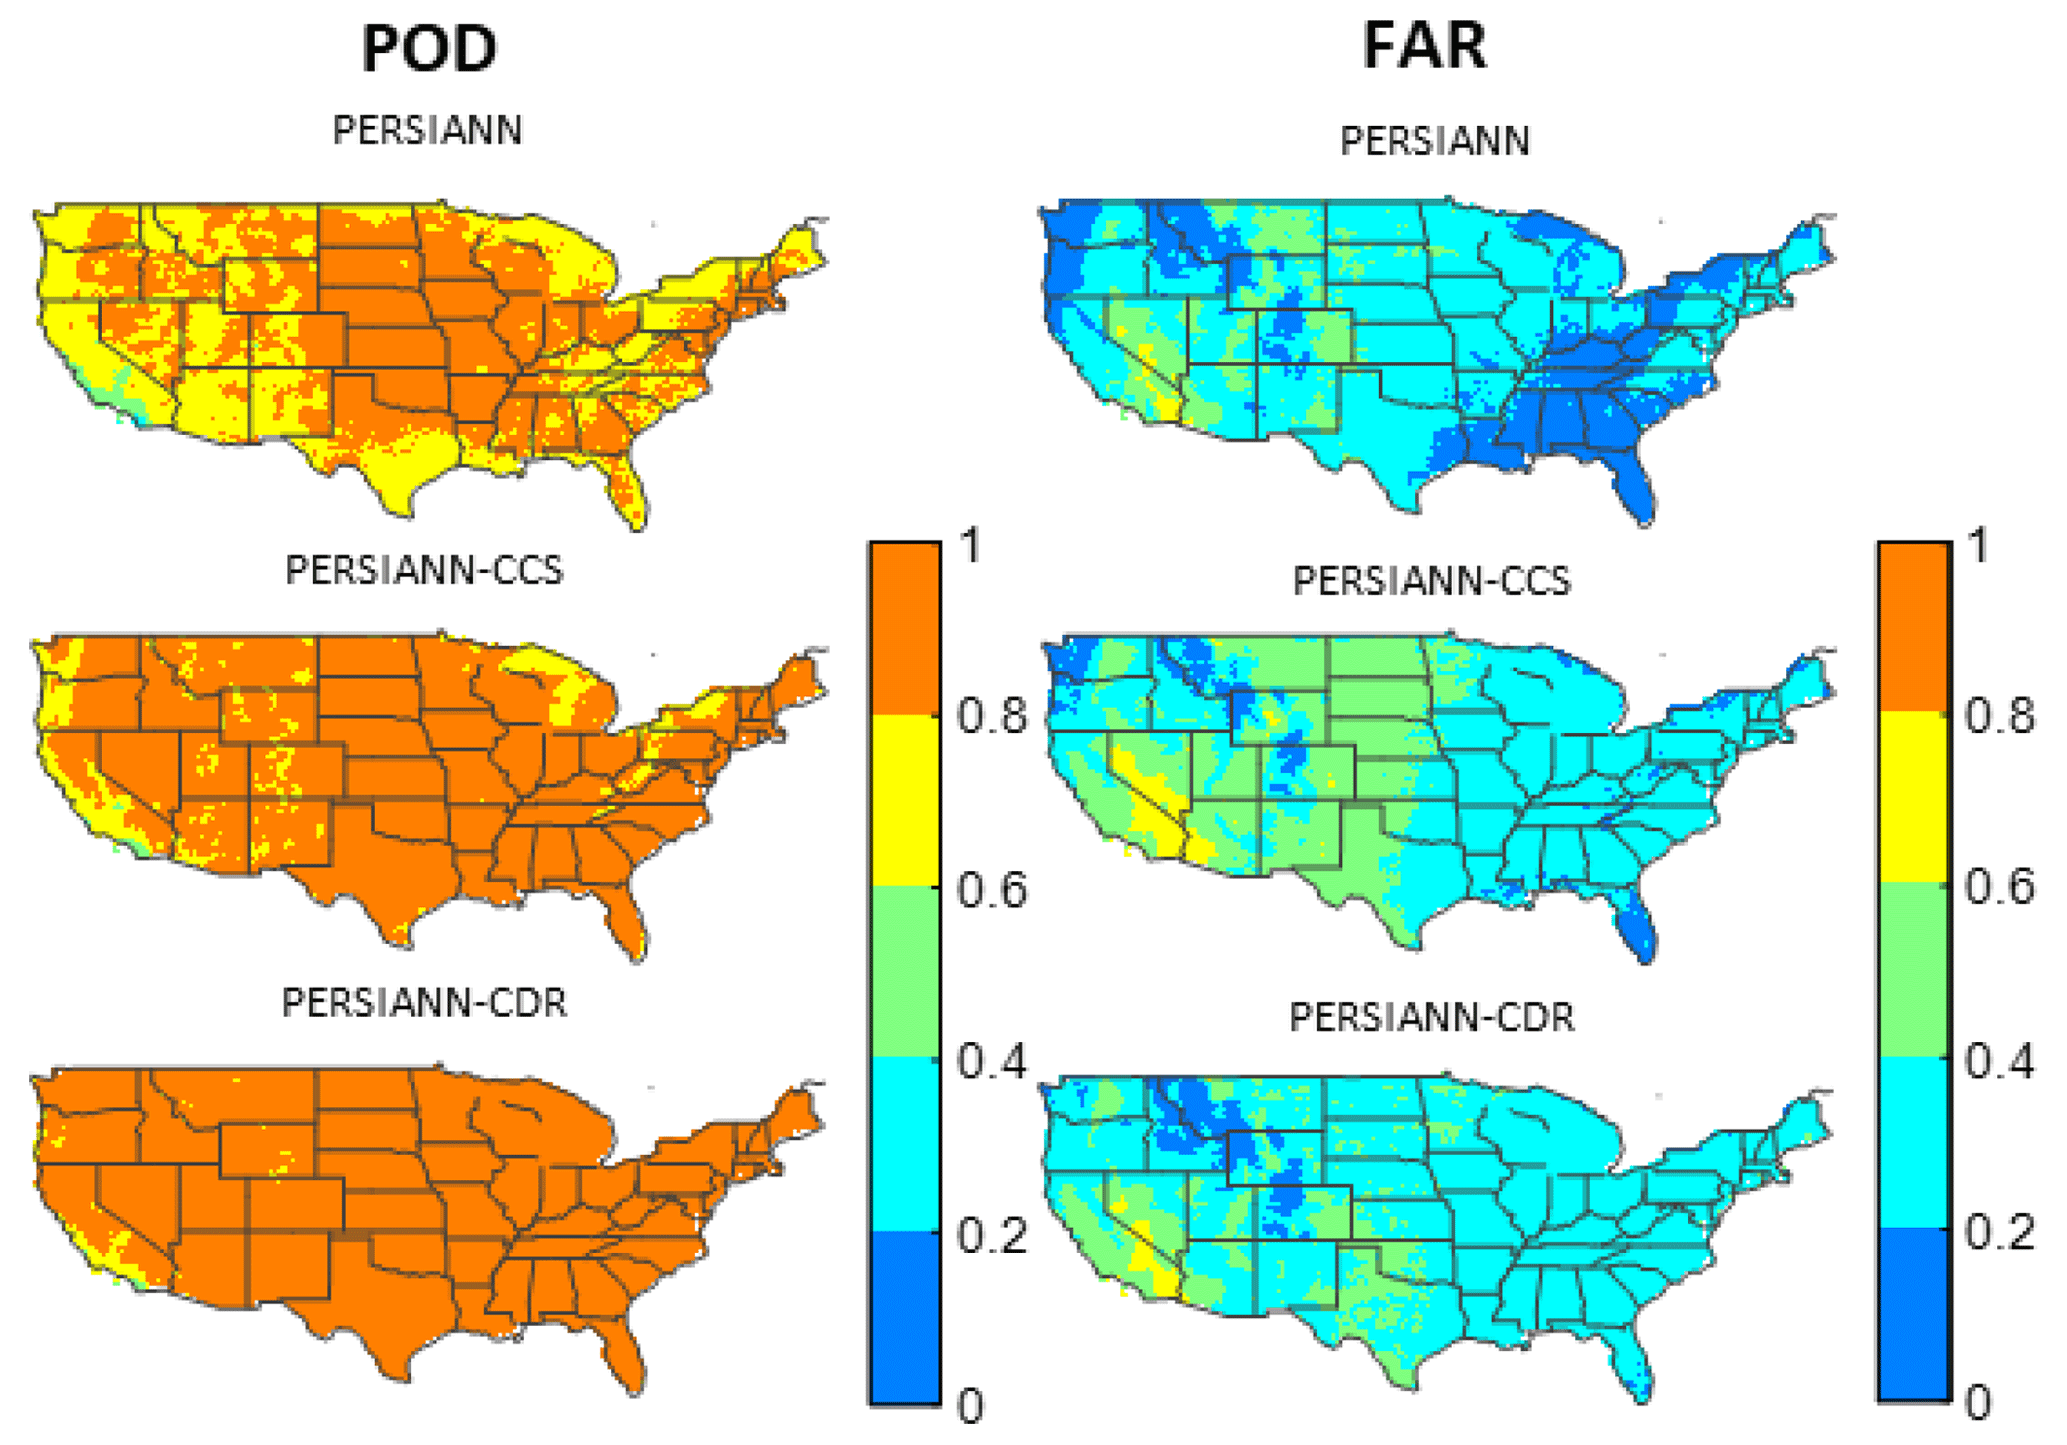
Figure 3Probability of detection (POD) and false alarm ratio (FAR) of PERSIANN, PERSIANN-CCS, and PERSIANN-CDR against CPC for the period (2003–2015) over the CONUS.
The aforementioned results represent a comparison over a large timescale and, as a result, errors in shorter timescales may cancel each other, possibly obscuring important information. Therefore, a comparison at the daily timescale is essential to obtain a more insightful view of the products' performances. In order to make PERSIANN data consistent with the CPC on a daily scale, we accumulated PERSIANN data from 12:00 to 12:00 UTC instead of the default (00:00 to 24:00 UTC) accumulation. Evaluation metrics include both continuous metrics (correlation coefficient – CORR, root mean squared error – RMSE, and bias), shown in Fig. 2, and categorical metrics (probability of detection – POD – and false alarm ratio – FAR), shown in Fig. 3. Overall, the results in Fig. 2 demonstrate the superiority of PERSIANN-CDR with higher CORR, and lower RMSE and bias over the CONUS compared to PERSIANN and PERSIANN-CCS. This highlights the ability of bias correction to improve the accuracy of satellite-based precipitation. In particular, the bias is almost zero across the country (except in some areas in Nevada and Washington, and parts of the Central Valley in California). As shown in Fig. 1, on average, heavier rainfall events occur over the gulf states and the states along the eastern coast. With that in mind and based on the statistics shown in Fig. 2, one can see that PERSIANN-CDR captures such patterns with a high correlation coefficient and a very low bias. In addition, Fig. 2 shows that the correlation coefficient varies geographically for the three products, with relatively low values over the western states and high values extending from the gulf states in the south toward the northern part of the country. By contrast, RMSE shows better (lower) values over the western US and poorer (higher) values over the gulf states and the eastern US. This geographical pattern in the evaluation metrics can be attributed to differences in climatic zones and average rainfall intensity. The western states on average receive less precipitation compared to the gulf and eastern states; consequently, RMSE will often have higher values where precipitation is higher. Moreover, it should be taken into consideration that results over the western US might have been affected by the lower density of rainfall gauges used in developing the CPC gridded product. Table 3 presents a summary of the continuous metrics values over the CONUS.
Table 3Summary of comparison metrics for the PERSIANN family of products against the CPC for the period (2003 to 2015) over the CONUS.
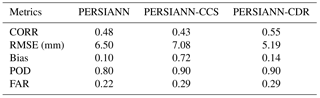
On the other hand, the categorical indices shown in Fig. 3 illustrate that PERSIANN has a lower FAR compared to PERSIANN-CCS and PERSIANN-CDR. However, this desirable pattern is offset by lower POD values compared to PERSIANN-CCS and PERSIANN-CDR. This can be attributed to the fact that the PERSIANN algorithm is trained using PMW data which suffer from underdetection of wintertime precipitation. As a result, the low capability in detecting rainfall leads to the improved values of FAR observed in PERSIANN data. The average values of the categorical indices over CONUS are presented in Table 3; average POD values are 0.8, 0.85 and 0.9; meanwhile, average FAR values are 0.26, 0.34, and 0.34 for PERSIANN, PERSIANN-CCS, and PERSIANN-CDR, respectively. We note that categorical indices do not distinguish between light and heavy rains. An alternative approach is to consider volumetric indices for evaluation of satellite products including Volumetric Hit Index (VHI) and Volumetric False Alarm (VFA) (AghaKouchak and Mehran, 2013). These indicators are based on volume of captured rain rather than counts. Previous studies showed that while PODs of PERSIANN products might be rather low in some regions, the VHI is much higher, indicating that PERSIANN products capture most of the volume of rain present in reference products (see AghaKouchak and Mehran, 2013).
Table 4Definition of extreme precipitation indices used in the analysis.
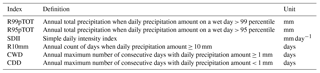
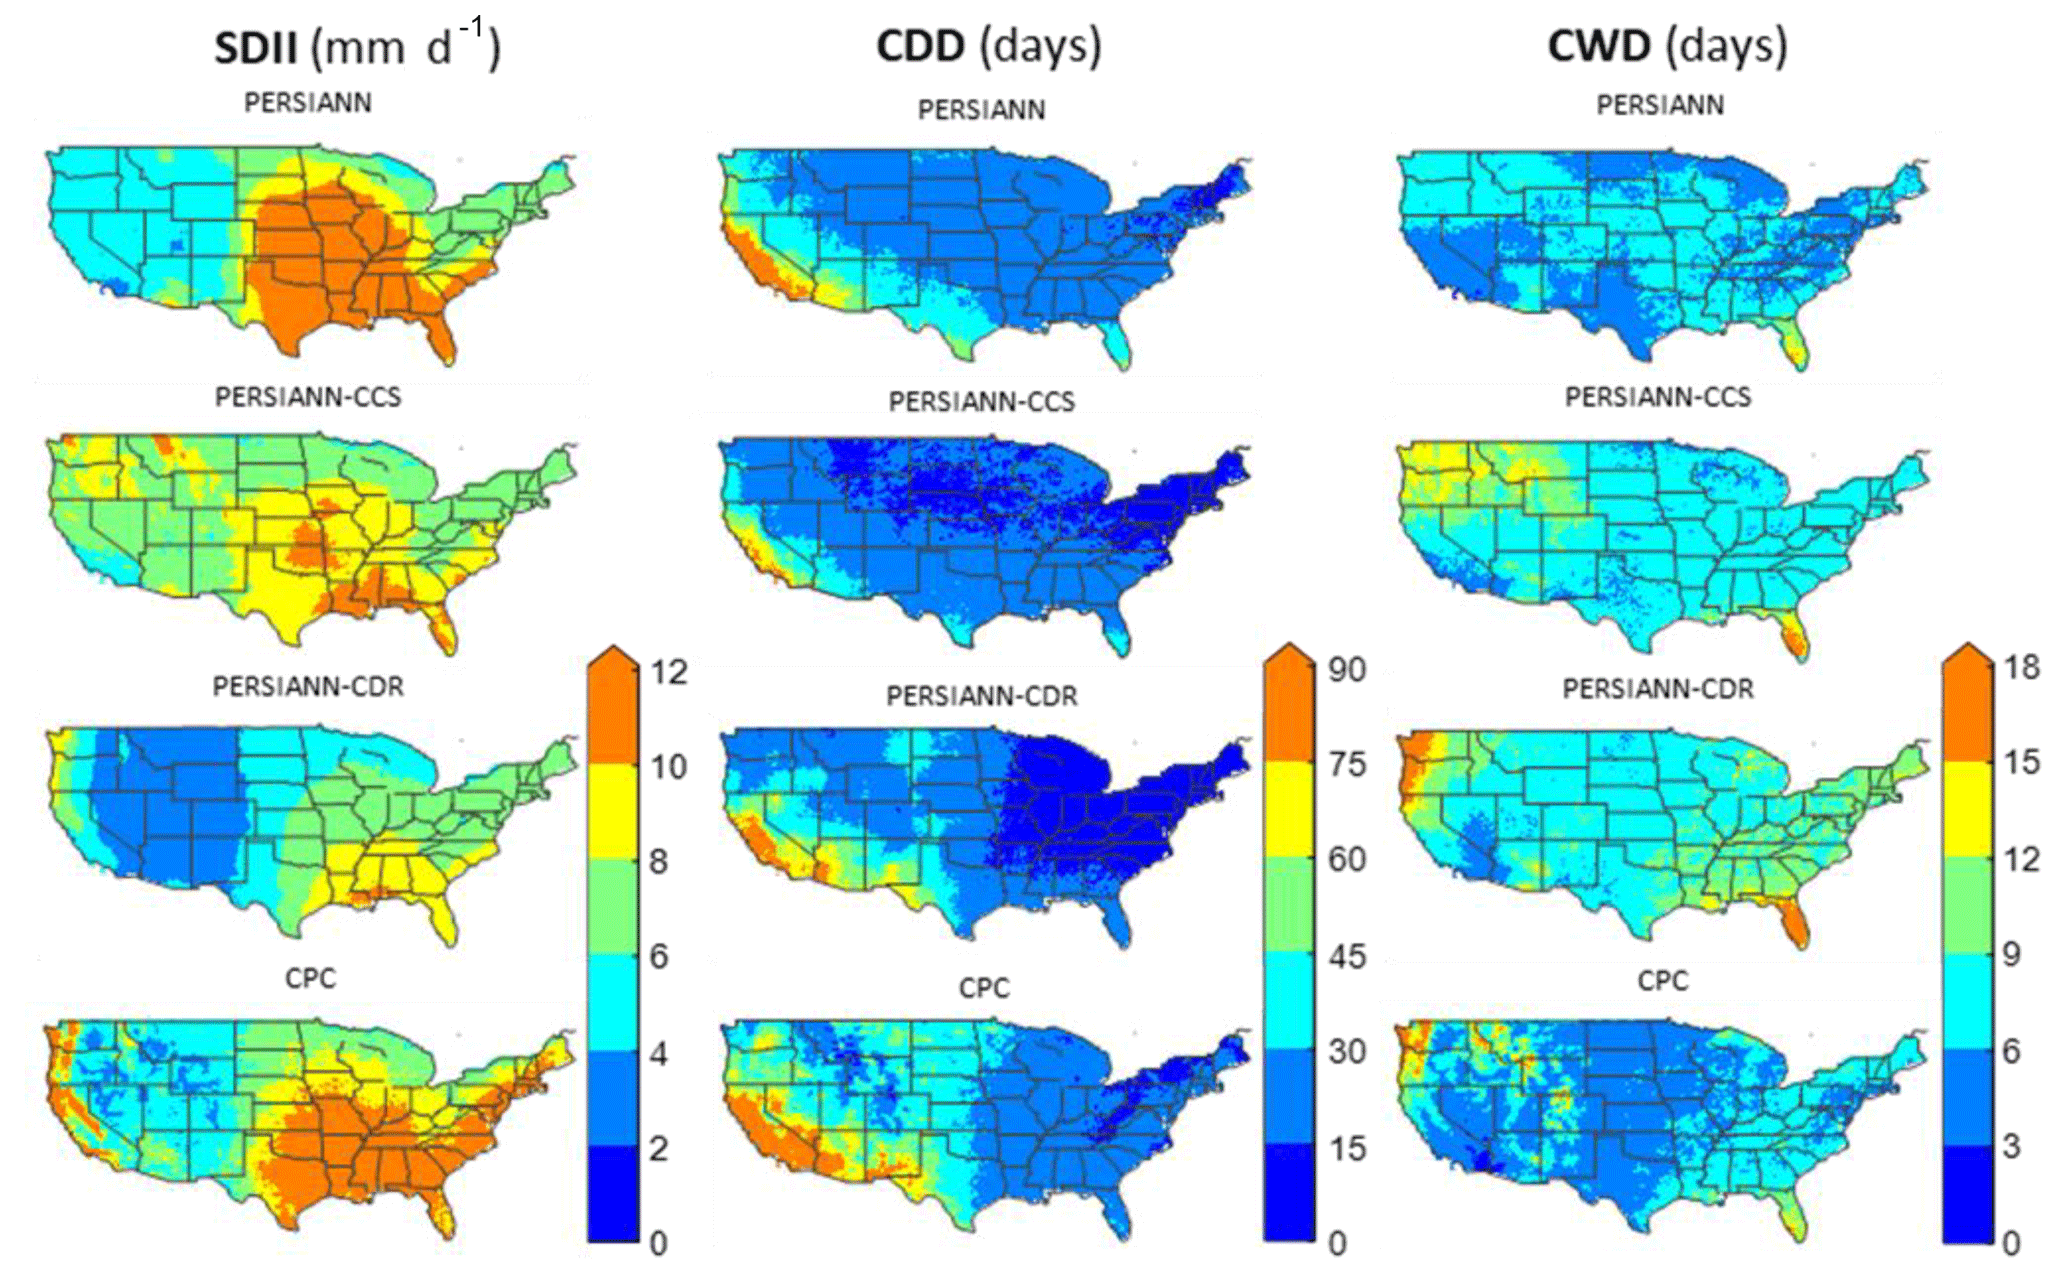
Figure 4Extreme precipitation indices (SDII, CDD, and CWD) for PERSIANN, PERSIANN-CCS, and PERSIANN-CDR over the CONUS (see Table 4 for definitions of the indices).
To further investigate the performance of the PERSIANN products, we narrowed down our analysis to extreme precipitation events. We looked at three classes of extreme indices, namely absolute threshold (R10mm, CWD and CDD), percentile (R99pTOT and R95pTOT), and maximum indices (SDII); these indices are defined in Table 4. Results for SDII, CDD and CWD are shown in Fig. 4. With regard to SDII, which is defined as the ratio of annual rainfall to the number of rainy days, PERSIANN and PERSIANN-CDR show close agreement with CPC over the western US except along the western coast and over the Sierra Nevada. Over the eastern US, PERSIANN-CCS and PERSIANN-CDR underestimate SDII values. This result is of particular interest to PERSIANN-CDR because it is bias adjusted using ground observations and, while it maintains the same patterns and quantities of rainfall as CPC data on large timescales (see Fig. 1), it overestimates the number of rainy days. It should be noted that PERSIANN captures SDII values over the gulf states but depicts a spurious overestimation over the central US. As for CDD, all three products reasonably mirror the patterns observed in CPC, with PERSIANN-CDR outperforming the other two products. CWD results were similar to those of CDD, with PERSIANN-CDR outperforming PERSIANN and PERSIANN-CCS while overestimating CWD over Florida and the Great Plains.
Table 5Statistics of the PERSIANN family of products for the period (2003 to 2015) over the CONUS.
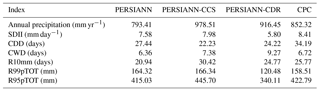
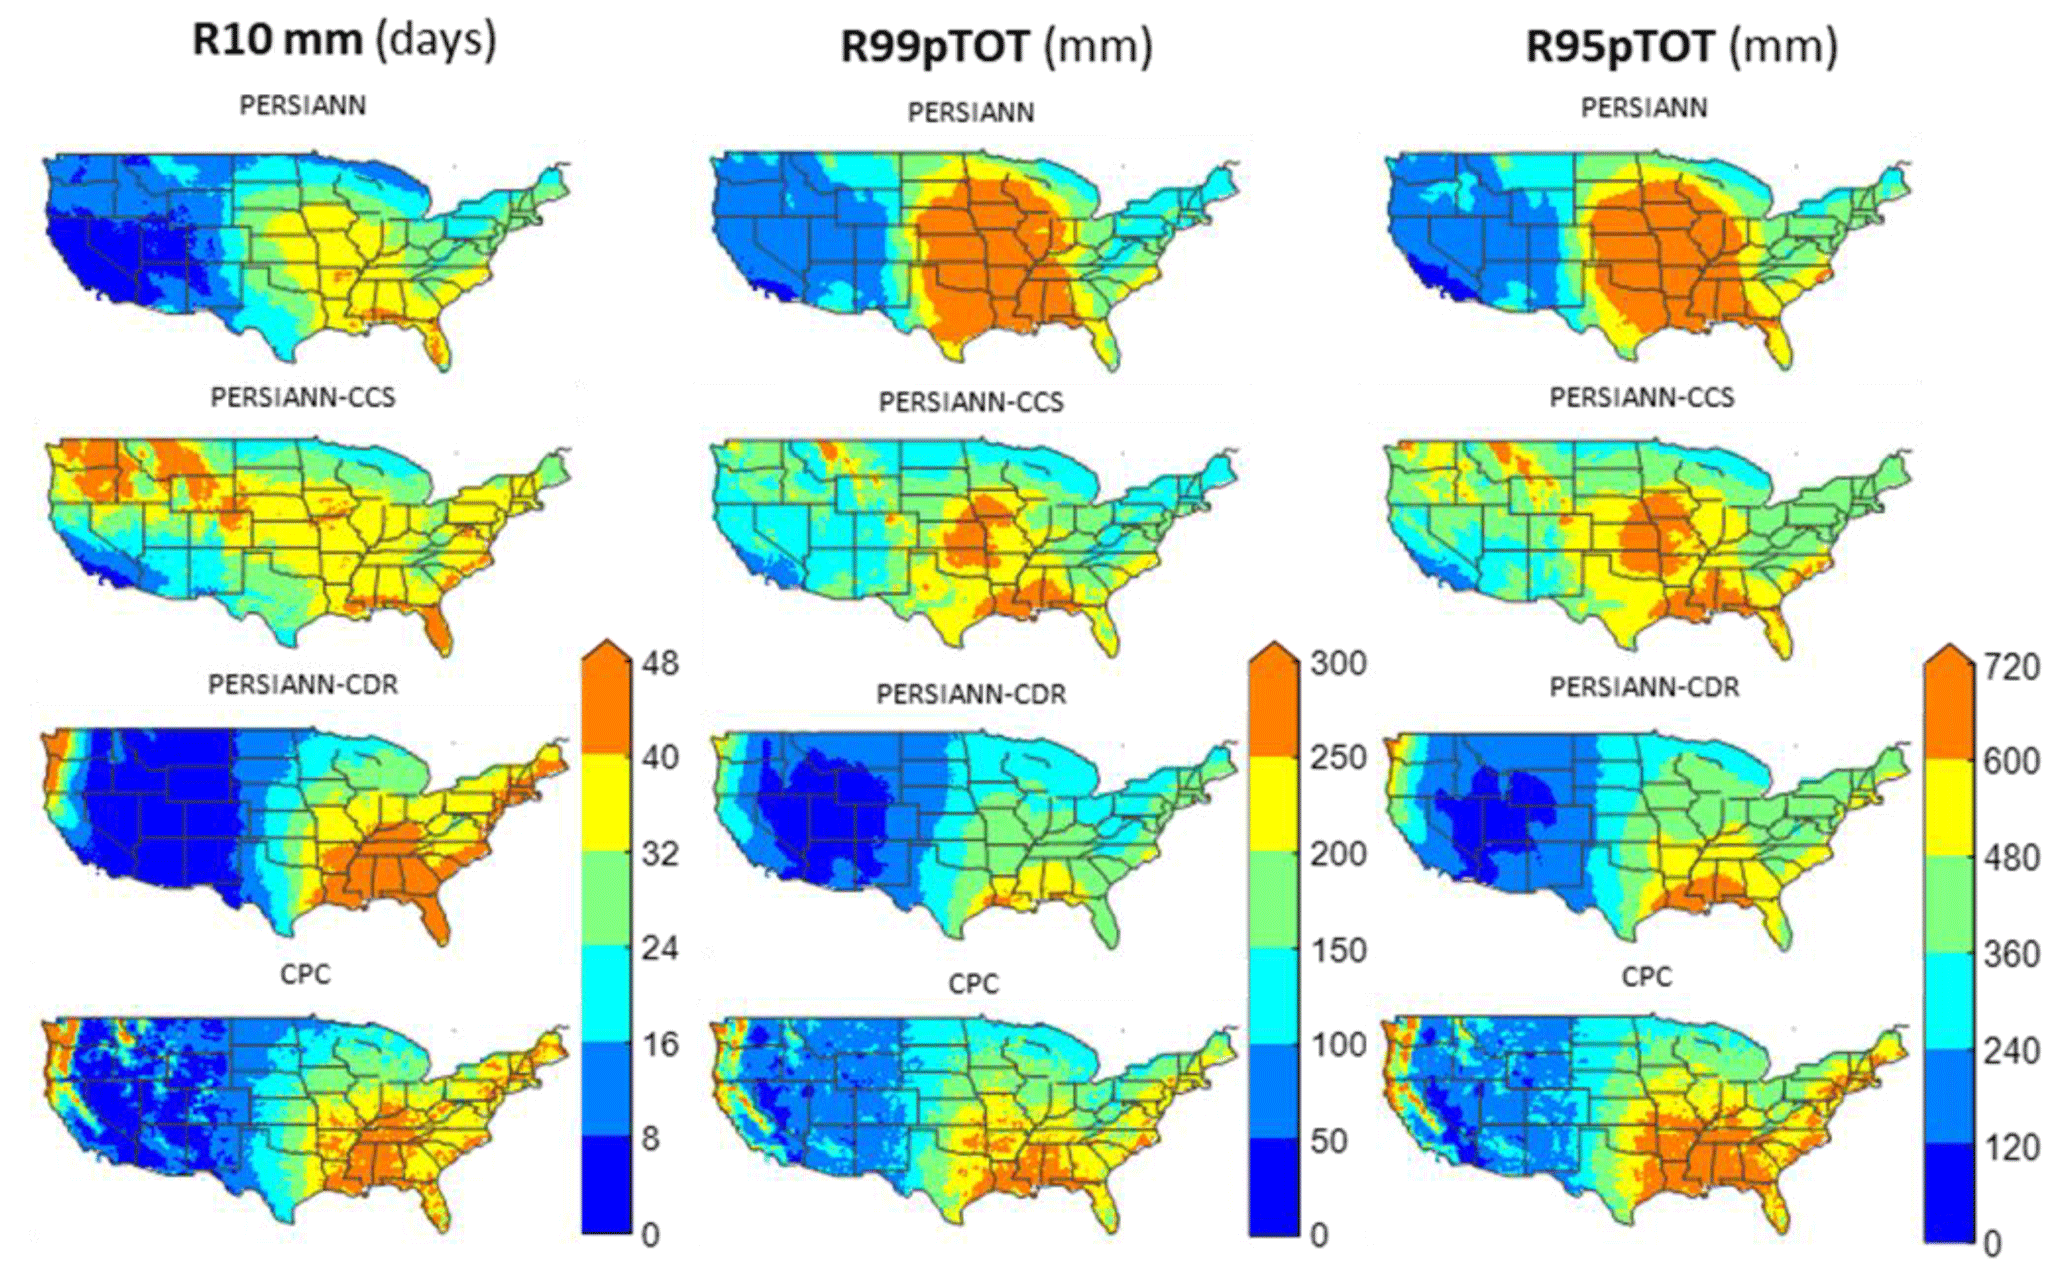
Figure 5Extreme precipitation indices (R10mm, R99pTOT and R95pTOT) for PERSIANN, PERSIANN-CCS, and PERSIANN-CDR over the CONUS (see Table 4 for definitions of the indices).
With respect to R10mm, PERSIANN-CDR outperforms PERSIANN and PERSIANN-CCS, mirroring the patterns observed in CPC. PERSIANN shows close performance to CPC but with underestimation. PERSIANN-CCS shows overestimation in R10mm over the northwestern states (Fig. 5). Results obtained for R99pTOT and R95pTOT are similar. PERSIANN shows an overestimation in the Midwestern states consistent with SDII. Among the three products, PERSIANN-CDR outperforms the others. While PERSIANN-CDR shows similar patterns compared to CPC, it does so with underestimation of magnitudes. It can be seen that PERSIANN-CDR underestimation in R10mm, R95pTOT, and R99pTOT is increasing as the quantile is increased. This behavior should be taken into consideration when using PERSIANN-CDR for extreme value analysis in engineering applications, especially in cases where rainfall at short timescales is considered. This is because previous studies showed that the capabilities of satellite precipitation datasets to estimate heavy precipitation rate deteriorate at lower temporal accumulations (Mehran and AghaKouchak, 2014). The results of extreme indices analysis are summarized in Table 5.
In recent years, several studies focused on the evaluation of the PERSIANN products against ground-based observations over different regions of the globe. Evaluation studies conducted over Iran show that PERSIANN adequately captures the precipitation patterns of mean annual and seasonal precipitation, although it underestimates the amount of rainfall (Jamli, 2015). An evaluation performed at a daily temporal scale (Katiraie-Boroujerdy et al., 2013) shows that PERSIANN and GPCP-adjusted PERSIANN exhibit good performance over the mountainous regions while underperforming over the coastal region of the Caspian Sea. A recent study (Alijanian et al., 2017), which was conducted over a longer time period (2003–2012), shows that PERSIANN-CDR outperforms other satellite-based products in detecting heavy rainfall events over Iran. Similar conclusions were reported from evaluation studies performed over China, which highlighted that PERSIANN-CDR accurately captures the spatial and temporal patterns of extreme rainfall, in particular over the eastern China monsoon region. However, it has been shown that PERSIANN-CDR underperforms in dry regions such as the Tibetan Plateau and the Taklamakan Desert (Miao et al., 2015).
Global assessment of satellite-based products is complicated primarily due to the non-existence of ground-based measurements over oceans. Additionally, the paucity of dense raingauge networks over land in many regions around the world is a major challenge given that precipitation varies significantly over land due to topographic effects. Therefore, unlike the previously mentioned studies where a specific PERSIANN product is evaluated against ground-based observations, this section aims to provide a comparison between the three PERSIANN products, PERSIANN, PERSIANN-CCS, and PERSIANN-CDR, over the (60∘ S–60∘ N) globe for the period (2003–2015). It should be noted that none of the products is used as a baseline for comparison, but rather we compare the performance of each product against the others in order to infer insightful conclusions about the properties of each product over different geographical and climatological regions.

Figure 7Mean annual zonal precipitation (mm yr−1) for PERSIANN, PERSIANN-CCS, and PERSIANN-CDR.
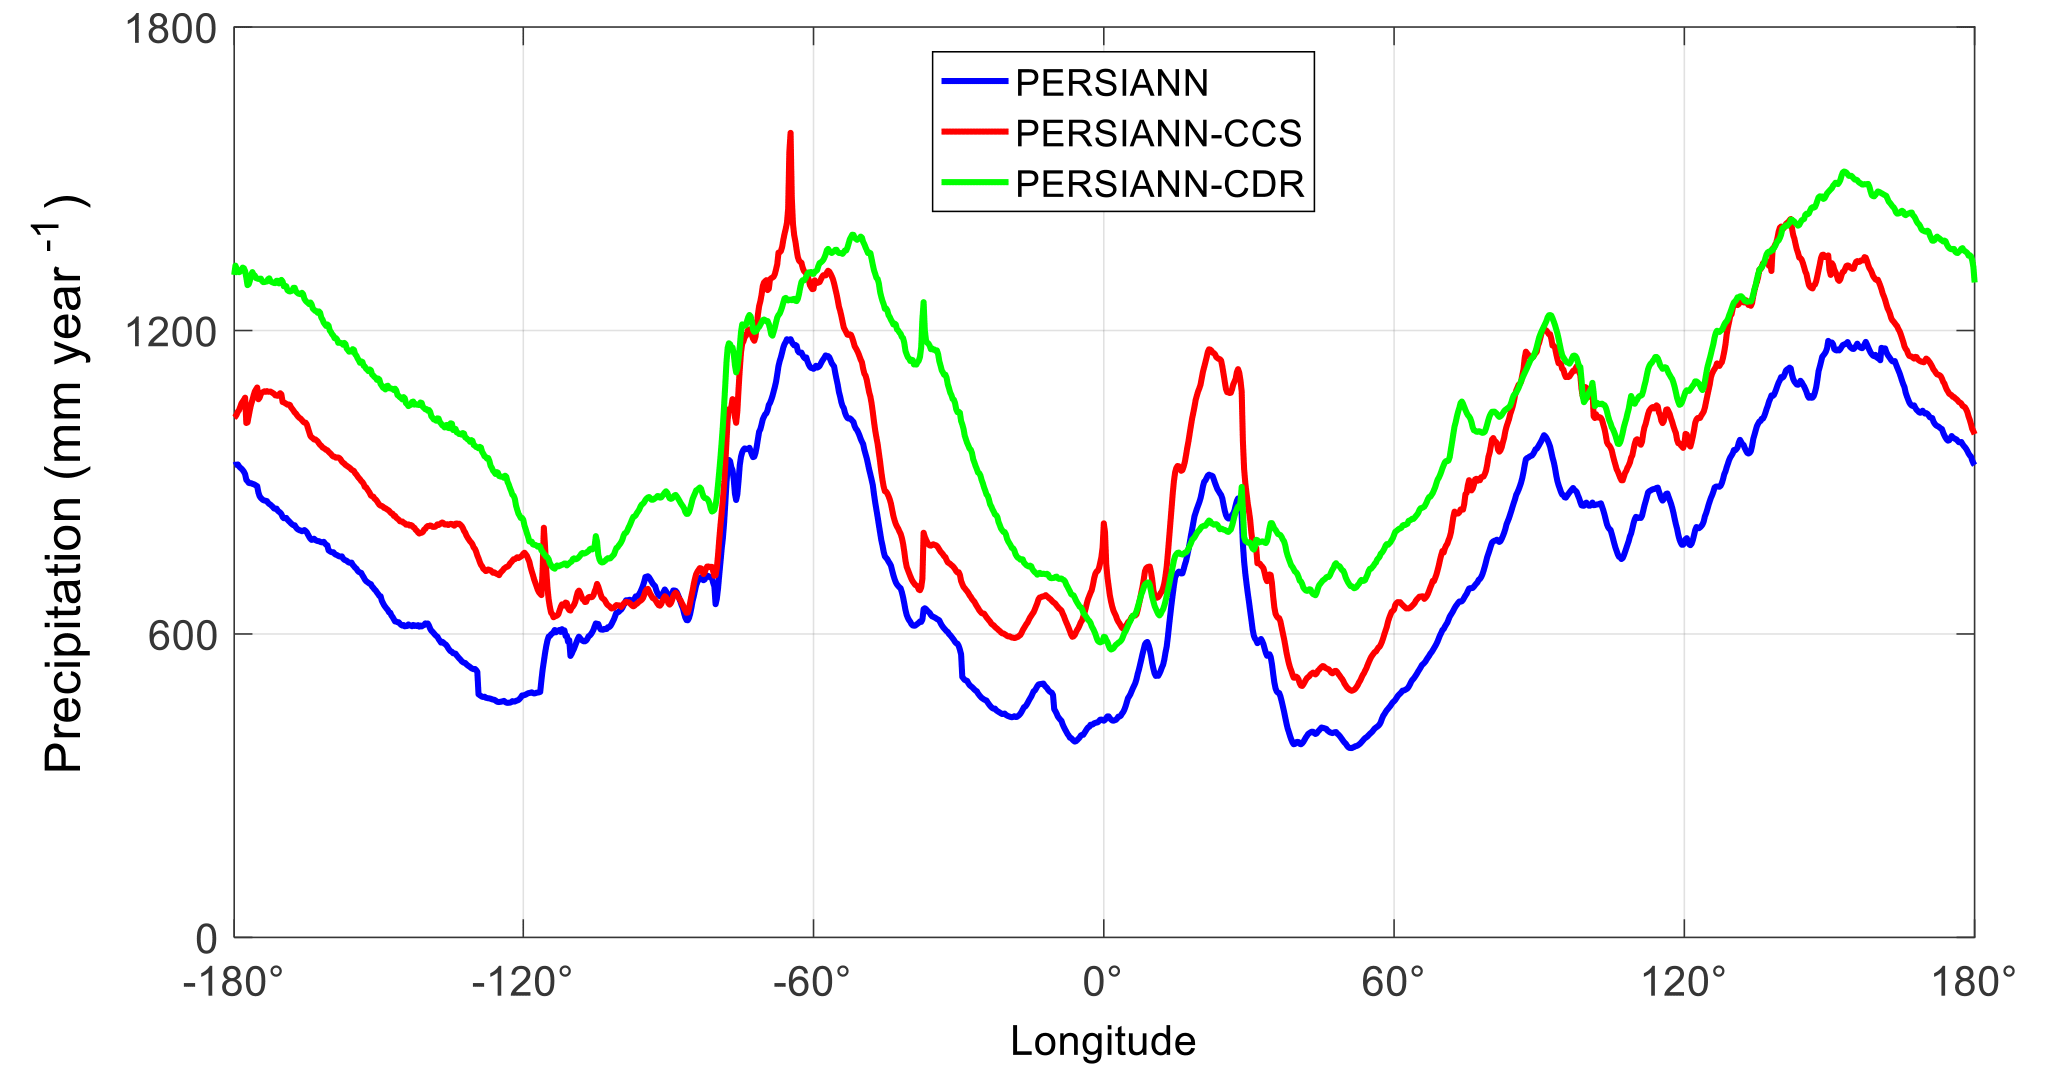
Figure 8Mean annual meridional precipitation (mm yr−1) for PERSIANN, PERSIANN-CCS, and PERSIANN-CDR.
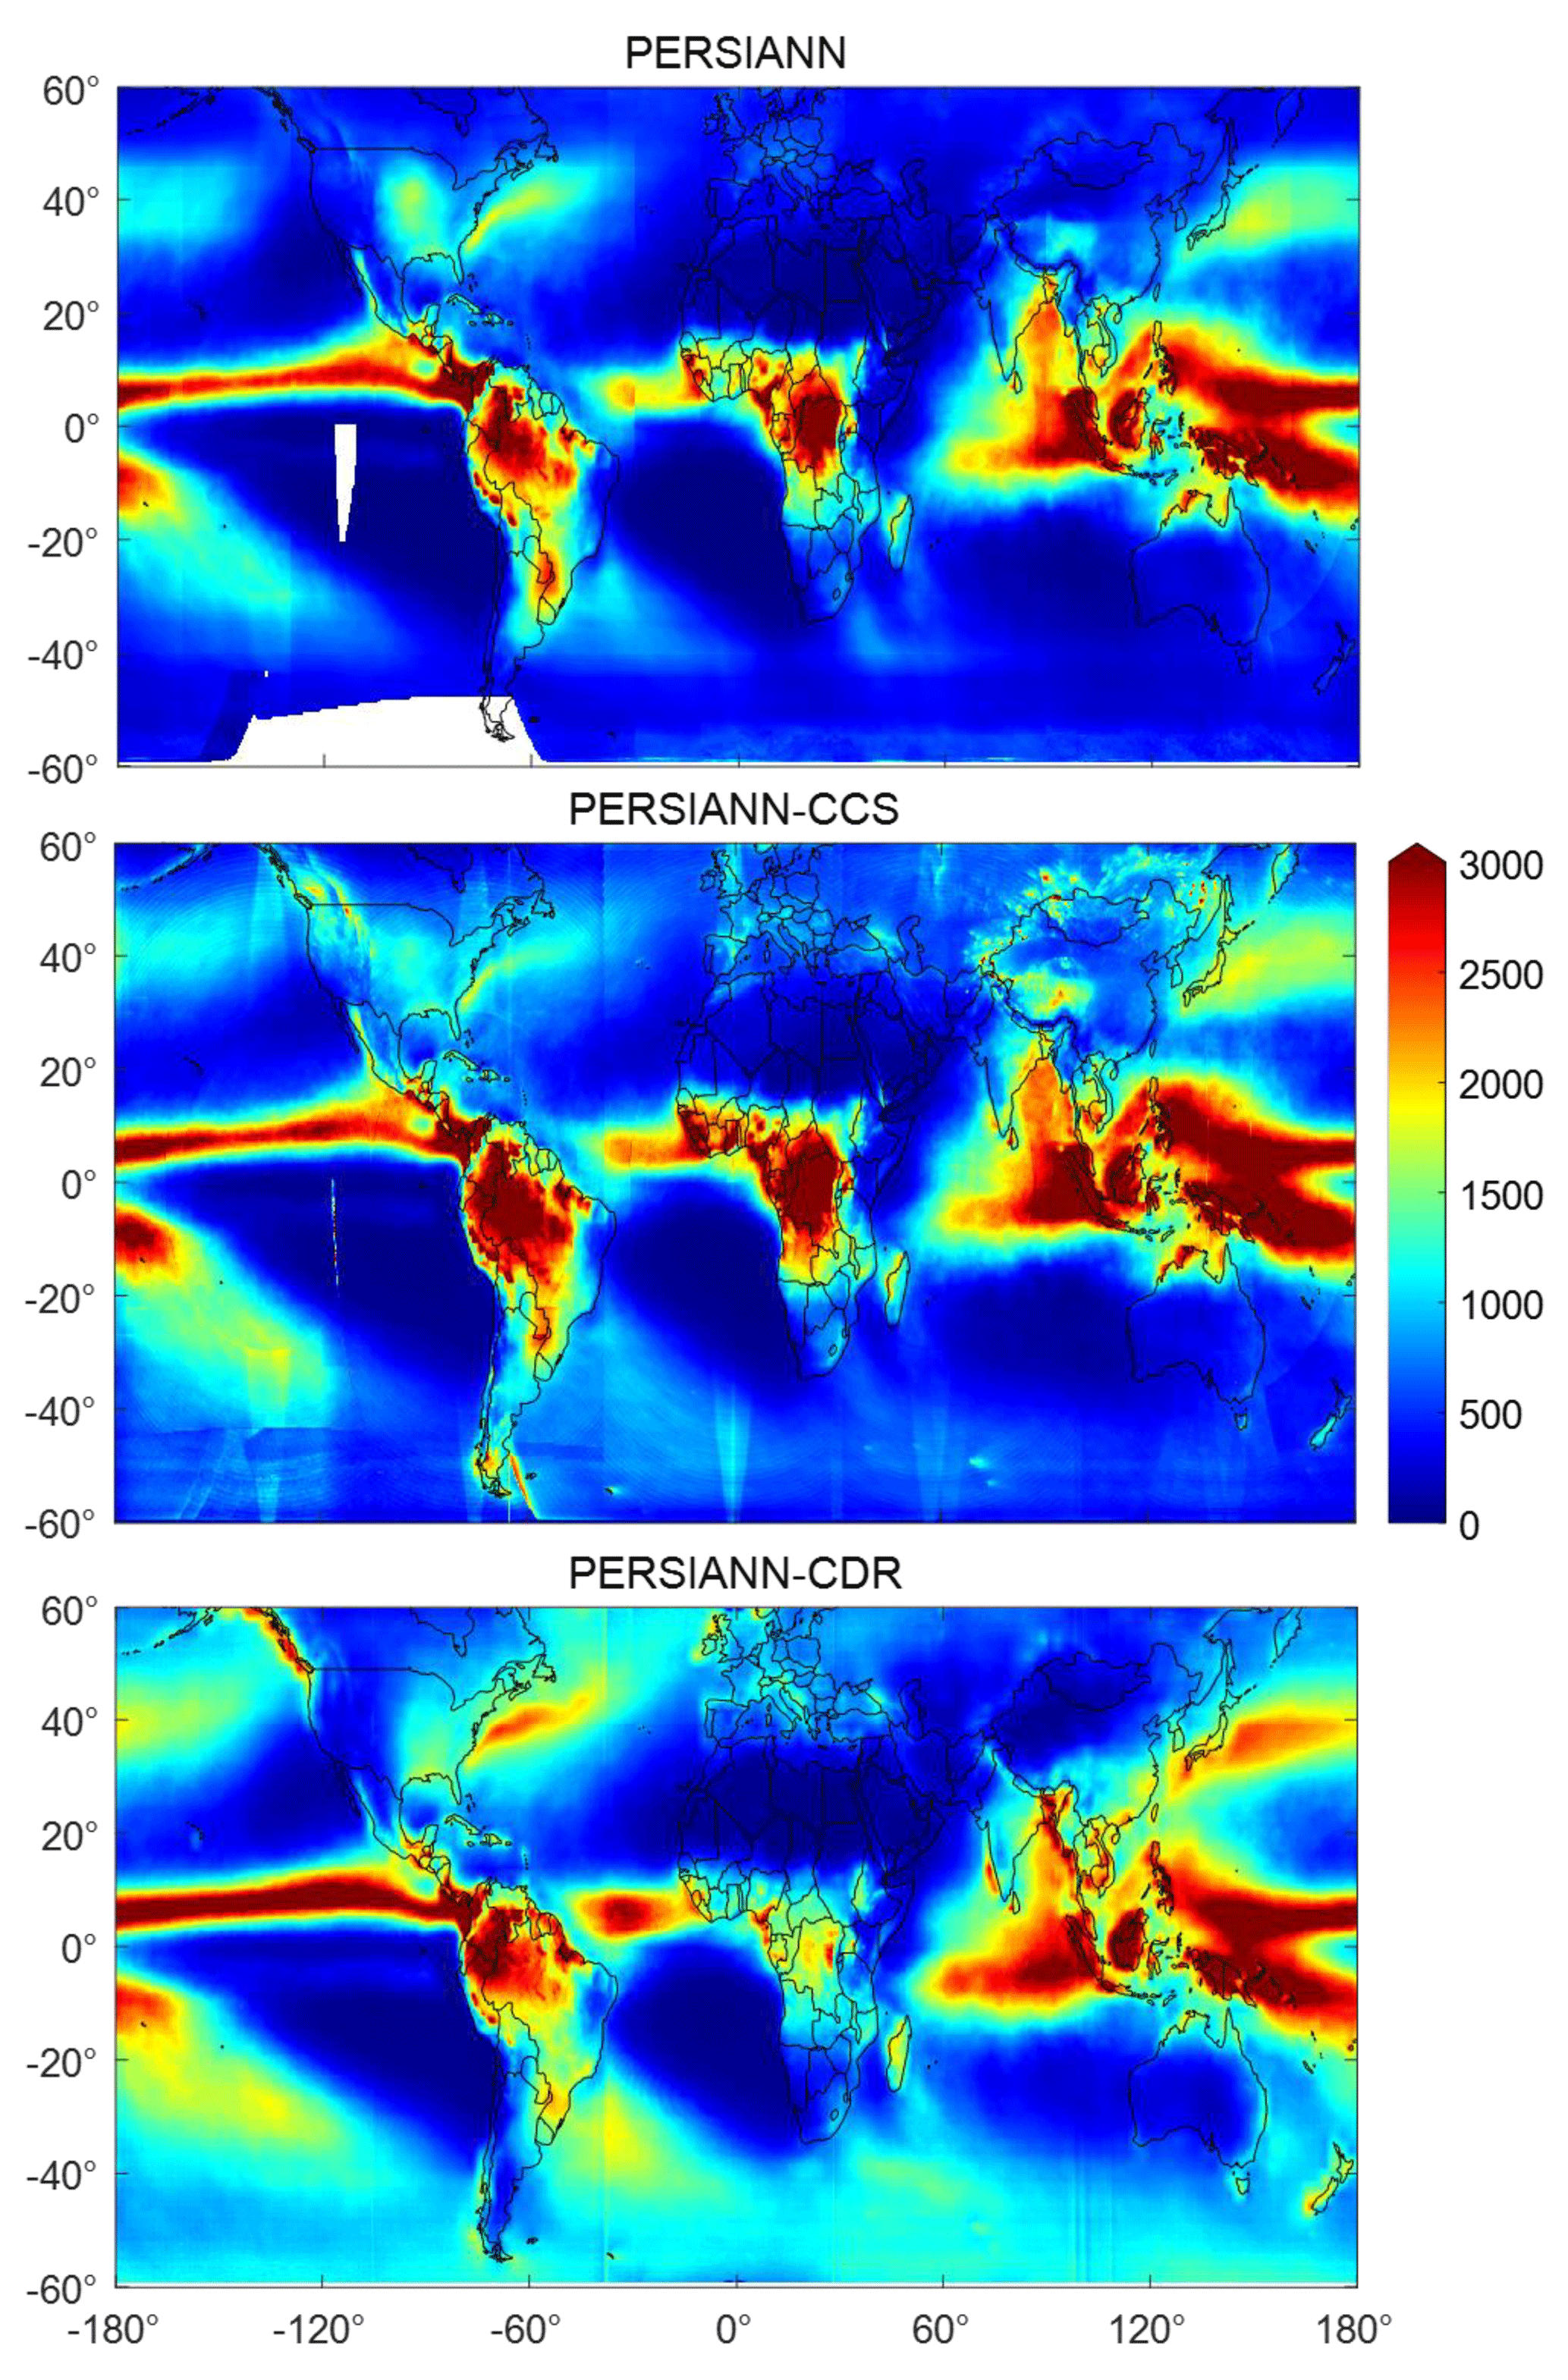
Figure 6 demonstrates that the PERSIANN products generally show similar global spatial distribution of mean annual precipitation. Generally, Fig. 6 shows that the equatorial Pacific Ocean, the eastern Indian Ocean, the Amazon, and western sub-Saharan Africa are the wettest parts of the globe. However, some differences are observed in the estimates from PERSIANN-CDR, which are substantially lower over western Africa compared to PERSIANN and PERSIANN-CCS. Less significant differences are also observed over the Amazon.
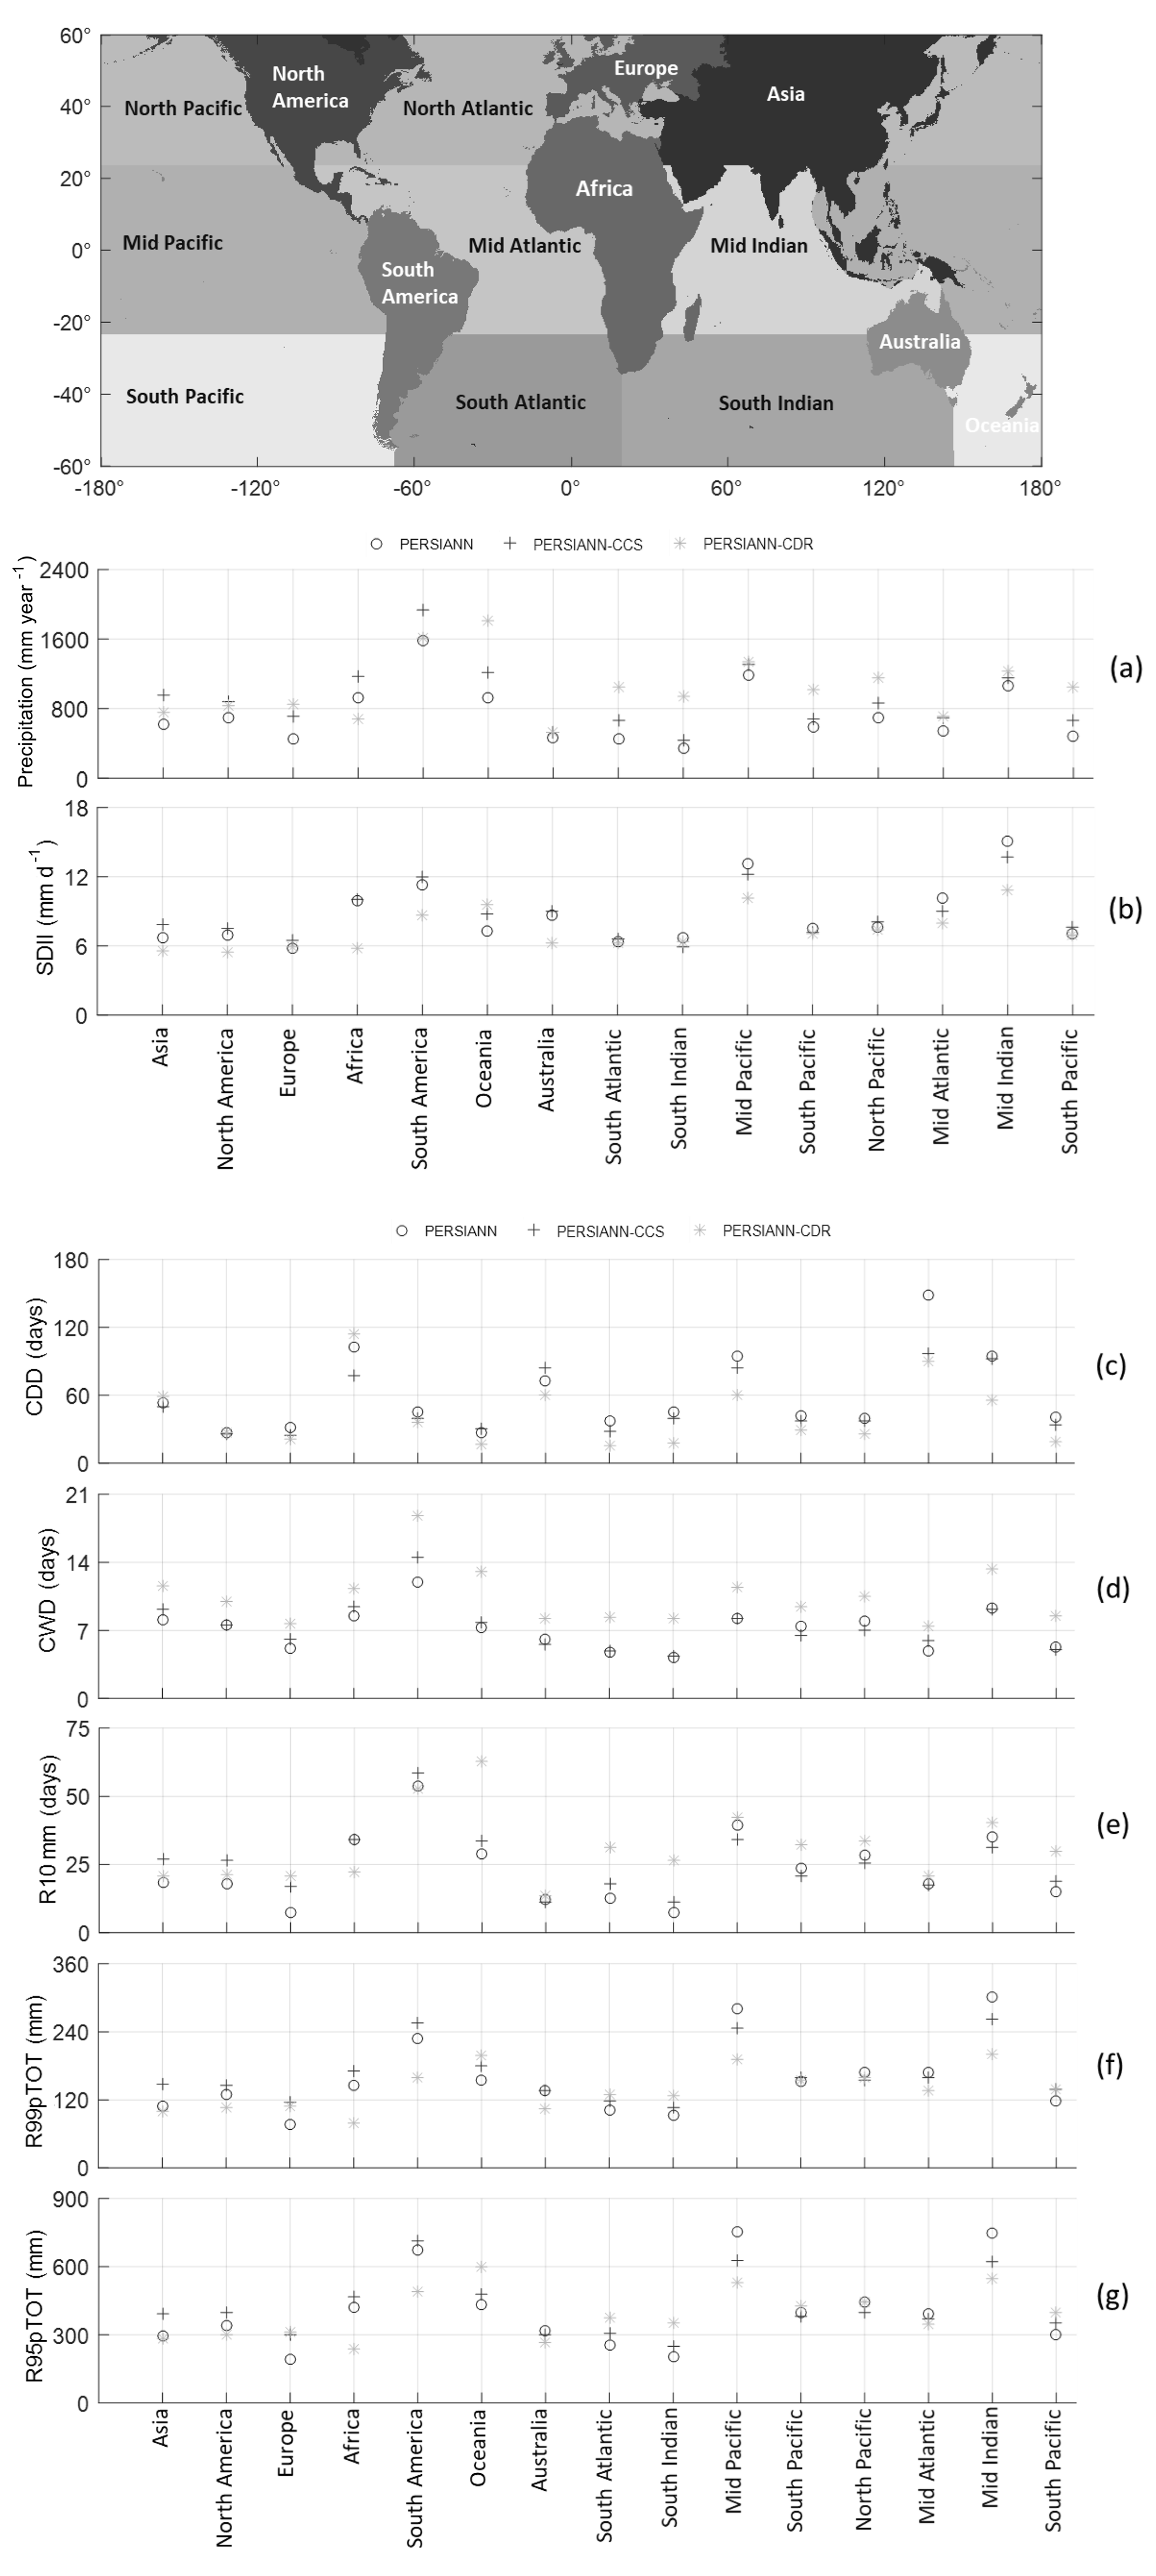
Figure 9Mean annual precipitation and extreme indices (SDII, CDD, CWD, R10mm, R99pTOT, and R95pTOT) over continents and oceans for PERSIANN, PERSIANN-CCS, and PERSIANN-CDR.
Figure 9a shows the average annual precipitation for the period (2003–2015) over continents and oceans as estimated by each of the three products. This comparison is intended to provide insightful conclusions about the (land vs. ocean) performance. As shown in Fig. 9, PERSIANN-CDR consistently estimates higher precipitation rates over the oceans than PERSIANN-CCS and PERSIANN. On the other hand, PERSIANN-CCS estimates higher precipitation rates than PERSIANN and PERSIANN-CDR over most continents except Oceania. Additionally, it is clear that PERSIANN consistently estimates lower precipitation rates than the other two products over both oceans and land with the exception of Africa. Figures 7 and 8 show the mean annual zonal precipitation, i.e., across latitudes (60∘ S–60∘ N), and the mean annual meridional precipitation, i.e., across longitudes (180∘ W–180∘ E). While Fig. 7 may demonstrate differences in the algorithms due to climatological variations across latitudes, Fig. 8 is a mere reflection of the observations in Fig. 9a as the proportion of land to ocean area varies greatly across longitudes. The two figures corroborate the results observed from Fig. 9. It can be seen that PERSIANN-CDR estimates are higher over latitudes where oceans represent a larger proportion than land mass such as (60–20∘ S) and similarly for longitudes such as (180–120∘ W). On the other hand, PERSIANN-CCS estimates are equivalent to or higher than PERSIANN-CDR across latitudes where land mass is larger than oceans such as (0–20∘ N) and similarly for longitudes such as (0–40∘ E). Moreover, it can be seen from Fig. 7 that the three products show an off-equatorial peak approximately at 8∘ N, which represents the mean location of the Intertropical Convergence Zone (ITCZ). Analysis of Global Precipitation Climatology Project (GPCP) zonal precipitation for the period (1979–2003) demonstrated similar results, with a peak rainfall to the north of the Equator approximately at 8∘ N (Gruber and Levizzani, 2008).
In order to provide better insight into the behavior of the PERSIANN algorithms over land and oceans, we examined the estimation of extreme precipitation events globally using the same group of extreme indices used for the evaluation over the CONUS (see Table 4). As shown in Fig. 9, the three products maintain a similar SDII, with PERSIANN-CDR exhibiting generally lower values than the other two. The largest divergence between the three products appears in the Mid Pacific and Mid Indian Ocean regions. Figure 10 maps the SDII index and shows this as well. For CDD, the three products largely agree over land areas, but begin to show differences over the oceans. They do show similar spatial patterns in terms of areas with the highest CDD values (Fig. 10), but PERSIANN tends to show more widespread areas of high CDD, followed by PERSIANN-CCS, and then PERSIANN-CDR. Perhaps not surprising, the inverse behavior is present for CWD (Figs. 9 and 10). The R10mm index (Fig. 11) shows PERSIANN-CDR with the highest values of the three products over the oceans, but lower values than the other two over land (with the exception of Oceania and Europe). The three products generally show agreement on the extreme precipitation total, percentile-based indices (R95pTOT and R99pTOT). The largest areas of disagreement over land appear over South America and Africa. For oceans, indices values are most dissimilar between products over the Mid Pacific and Indian Ocean regions.

Figure 10Extreme precipitation indices (SDII, CDD, and CWD) for PERSIANN, PERSIANN-CCS, and PERSIANN-CDR over the globe. (See Table 4 for definitions of the indices.)
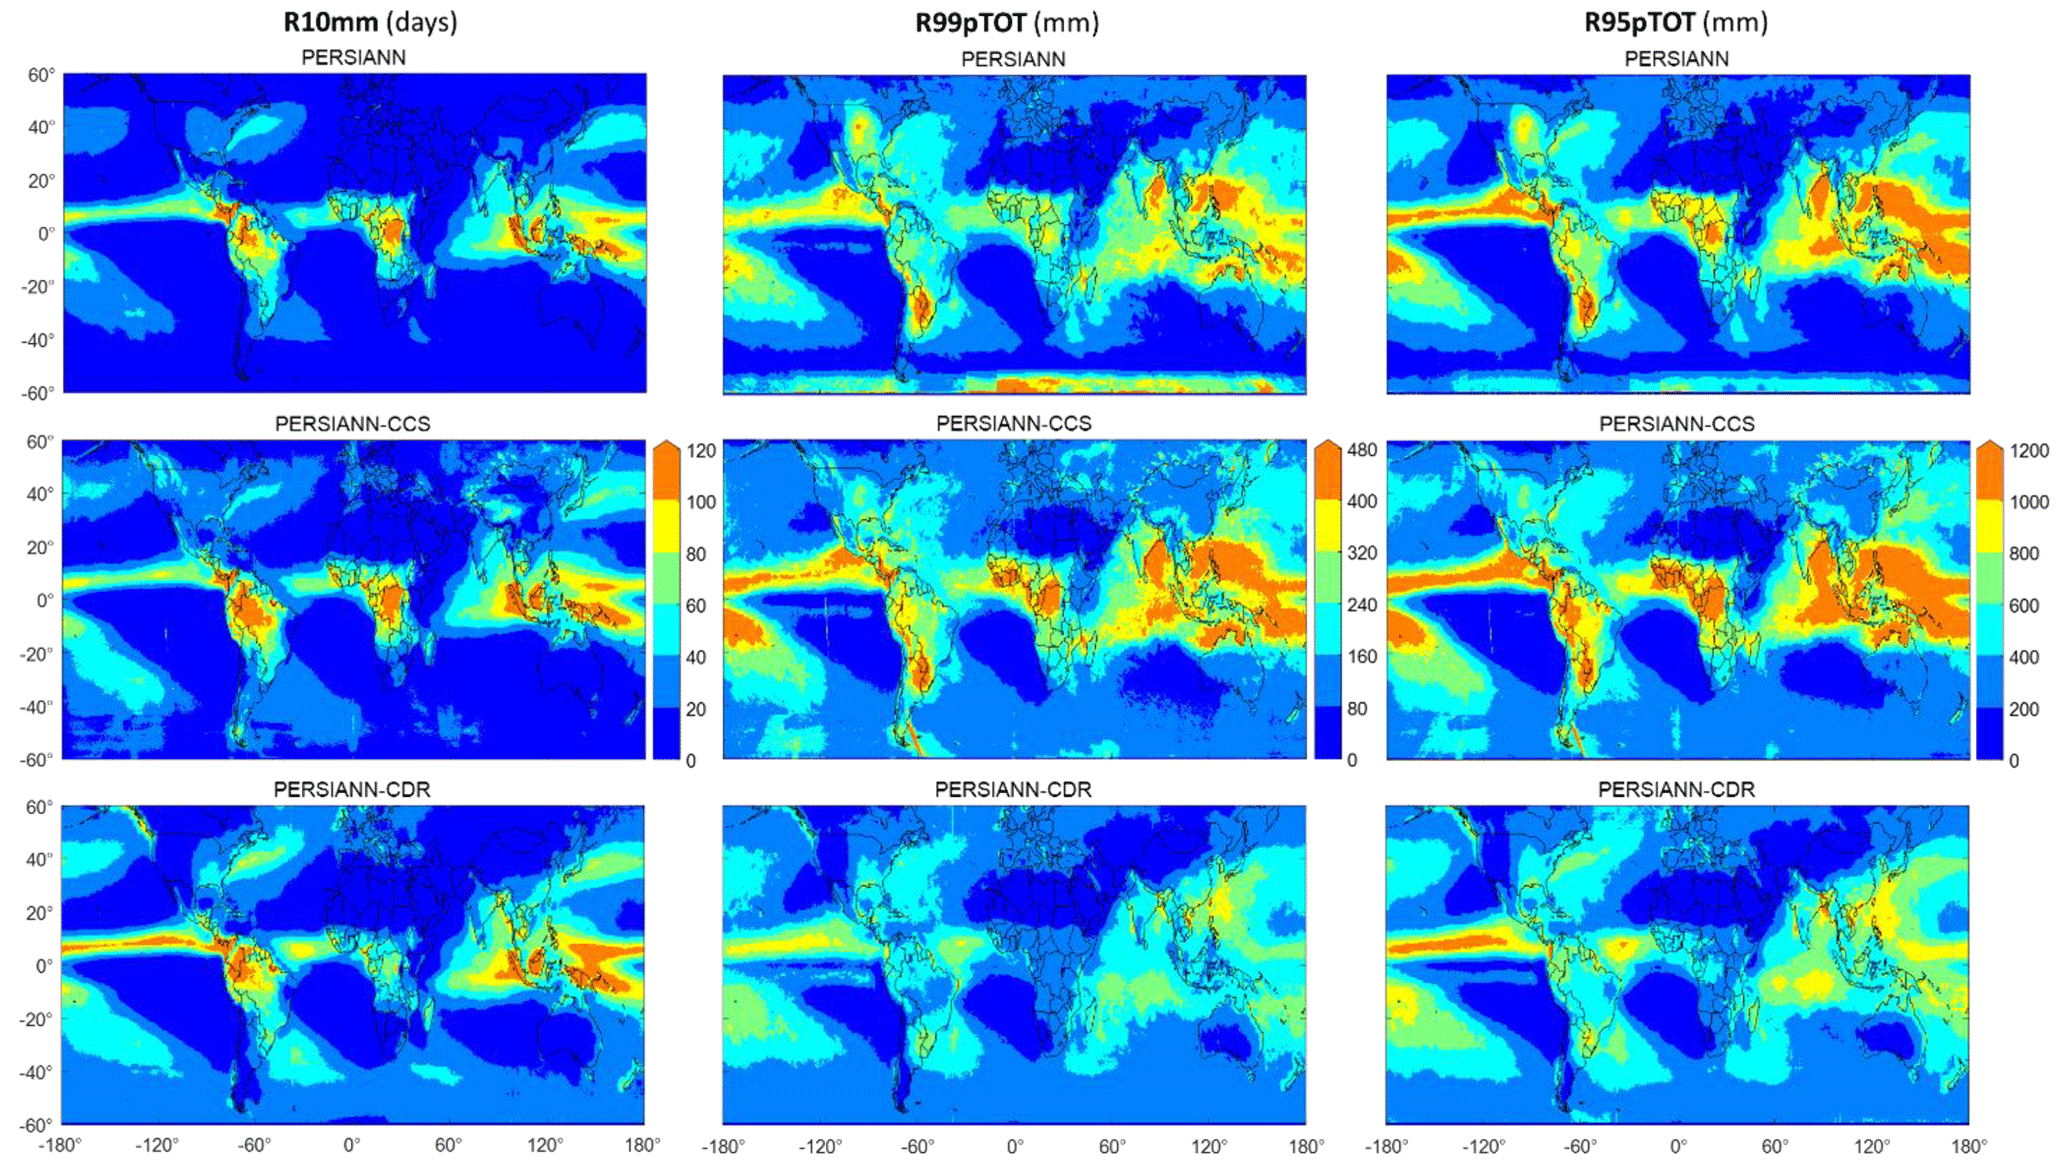
Figure 11Extreme precipitation indices (R10mm, R99pTOT, and R95pTOT) for PERSIANN, PERSIANN-CCS, and PERSIANN-CDR over the globe. (See Table 4 for definitions of the indices.)
The three PERSIANN products are intended to serve different hydrologic and climatological applications according to their distinct attributes of spatiotemporal resolution, time coverage, and time delays. As far as hydrologic applications are concerned, satellite-based precipitation datasets can be incorporated into studies such as rainfall runoff modeling for flood forecasting, reconstructing historical streamflow simulations, and rainfall frequency analysis for infrastructure design. The analysis results presented in this article shed light on the suitability of each product for potential hydrologic applications. Firstly, PERSIANN-CCS due to its short time lag (∼1 h) and high spatiotemporal resolution is well suited for flood forecasting and producing flood inundation maps. Nguyen et al. (2015) evaluated the accuracy of utilizing PERSIANN-CCS for flood forecasting by simulating the 2008 Iowa flood. The study demonstrated that the use of PERSIANN-CCS as forcing data compared to NEXRAD stage 2 data results in a better simulation of the hydrograph shape, however, with underestimation in the peak discharge. These conclusions are partially supported by the analysis results in this article; specifically, the correlation coefficient of PERSIANN-CCS is relatively high over the state of Iowa. However, Fig. 2 shows that the correlation varies significantly in different geographic locations over the CONUS. This highlights that while PERSIANN-CCS is well suited for flood forecasting applications, special attention should be paid when the catchment under study is in locations of low correlation coefficients for PERSIANN-CCS. Meanwhile, validation results of the products over the CONUS demonstrate the superiority of PERSIANN over PERSIANN-CCS with lower RMSE and bias across the CONUS. This highlights that the use of PERSIANN in flood modeling and production of flood inundation maps will lead to more accurate results due to its incorporation of quality-controlled input data. However, a trade-off exists between the accuracy of the product and the lag time for data availability; this lag time is approximately 2 days in the case of PERSIANN. This extended lag time for data availability renders PERSIANN more suitable for flood monitoring rather than forecasting.
PERSIANN-CDR, due to its long historical record, is inherently suitable for investigating statistical trends of historical extreme rainfall events and meteorological droughts as well as reconstructing historical streamflow observations. Liu et al. (2017) utilized the PERSIANN-CDR dataset as an input to a hydrologic model in order to simulate historical streamflow over two basins in the Tibetan Plateau. The results show that the simulated streamflow is more accurate than the use of interpolated data from the sparse network of ground rainfall gauges. Generally, the results over CONUS presented in this article demonstrate that PERSIANN-CDR has reasonable accuracy across different temporal and spatial scales. However, as shown in Fig. 5, PERSIANN-CDR exhibits underestimation of extreme rainfall events (i.e., higher than the 95th and 99th percentiles). This should be taken into consideration when the dataset is used for frequency analysis of extreme rainfall events to develop intensity–duration–frequency (IDF) curves. Ombadi et al. (2018) found that an annual maximum series extracted from PERSIANN-CDR over the CONUS exhibits underestimation; the study used bias adjustment prior to development of IDF curves. In contrast, analysis results over the CONUS highlight that the three products are well suited for studies on historical analysis of droughts and changes in seasonality of rainfall (i.e., onset and cessation of the rainfall season). This is supported by the fair resemblance of the three products to the patterns of CDD and CWD observed in CPC data (see Fig. 4).
The evaluation results of PERSIANN products over the CONUS indicate that the three products have generally good correlation with Climate Prediction Center (CPC) ground-based data, and high values of probability of detection (POD), with averages of 0.8, 0.9, and 0.9, for PERSIANN, PERSIANN-CCS, and PERSIANN-CDR, respectively. The false alarm ratios (FARs) of the three products are relatively low: 0.22 (PERSIANN), 0.29 (PERSIANN-CCS), and 0.29 (PERSIANN-CDR). PERSIANN-CDR surpasses the performance of the other two products in terms of replicating similar spatial precipitation patterns to those of CPC data. On the other hand, PERSIANN-CCS shows a slightly different pattern with overestimation in the northwestern states. PERSIANN both underestimates rainfall rates in Washington, Oregon, and northern California and overestimates them over the Midwest. The superiority of PERSIANN-CDR is attributed to the bias adjustment of PERSIANN-CDR on a monthly scale using GPCP data. However, it is important to mention that while the results demonstrate good performance of PERSIANN-CDR over long timescales compared to CPC, it tends to deviate (mostly underestimate) the amount of extreme rainfall on a daily scale. This emphasizes that careful attention must be paid to problems involving extreme value analysis using PERSIANN-CDR, in particular those related to engineering applications such as infrastructure design. Overall, it should be emphasized that the evaluation conducted in this study has been performed at the daily scale at the finest due to the coarse temporal resolution (i.e., daily) of the CPC dataset. While the evaluation results at the daily scale might shed the light on the superiority of each product compared to others at finer temporal scales, the values of evaluation metrics cannot be extrapolated to finer timescales. Thus, special attention and further evaluation must be performed prior to the use of PERSIANN and PERSIANN-CCS products for applications at the sub-daily scale.
A quasi-global comparison of precipitation products is important to assess the potential contrasts in products over land and ocean, and in different climatic zones. Overall, the results of global comparison indicate that the three products exhibit similar behavior in terms of mean annual zonal precipitation between latitudes 20∘ S–20∘ N but deviate from each other outside of this equatorial belt. As for the differences between the products over land and ocean, an interesting pattern is that in the context of mean annual rainfall PERSIANN-CDR estimates higher rainfall than the other products over the oceans, while PERSIANN-CCS estimates higher rainfall over continents except for Europe. Over both land and oceans, PERSIANN estimates of mean annual rainfall are the lowest. This comparison should not be considered an evaluation study, because while PERSIANN and PERSIANN-CCS are purely derived from satellite observations, PERSIANN-CDR is bias-adjusted using ground observations. This leads to expected deviations when comparing the products. The purpose of this inter-comparison was to highlight the discrepancies and differences in data products.
The PERSIANN algorithms continue to improve and evolve. Recent developments include integrating deep learning approaches, adding water vapor channel information (Tao et al., 2017), using PMW data for bias adjustment of PERSIANN-CCS (Karbalaee et al., 2017), incorporating MODIS and CloudSat information (Nasrollahi et al., 2013), and using probability matching methods to improve warm rainfall detection in PERSIANN-CCS. Preliminary results show that the application of deep learning techniques in precipitation estimation is enhancing the performance of the algorithm in the detection of rain/no rain events. Algorithm performance is further enhanced, especially during the winter season, by utilizing the water vapor channel as an additional input to the algorithm. As for the probability matching method, it is used to make bias corrections of PERSIANN-CCS estimates and improve warm rainfall detections. Results of this research indicate more significant improvement in high latitudes compared to low latitudes. Although not yet operational, these methods show potential for integration in the near-real-time PERSIANN products.
All data used in the analysis and validation are publicly available. PERSIANN data were retrieved from the Center for Hydrometeorology and Remote Sensing (CHRS), University of California Irvine, at http://chrsdata.eng.uci.edu (Hsu et al., 1997; Hong et al., 2004; Ashouri et al., 2015). CPC Unified Gauge-Based Analysis of Daily Precipitation data are available from the NOAA/OAR/ESRL PSD, Boulder, Colorado, USA, at https://www.esrl.noaa.gov/psd.
PN and MO jointly devised the idea. PN designed the analysis experiments and carried them out. MO prepared the manuscript with contributions from all coauthors. SS, KH and AAK reviewed the manuscript and provided important feedback.
The authors declare that they have no conflict of interest.
This research was partially supported by ICIWaRM of the US Army Corps of
Engineering, UNESCO's G-WADI program, the Cooperative Institute for Climate
and Satellites (CICS) program (NOAA prime award no. NA14NES4320003,
subaward no. 2014-2913-03) for an OHD-NWS student fellowship, the Army
Research Office (award no. W911NF-11-1-0422), the National Science Foundation
(NSF award no. 1331915), the Department of Energy (DoE prime
award no. DE-IA0000018), the California Energy Commission (CEC
award no. 300-15-005), and the University of California (no.
4600010378 TO no. 15 Am 22).
Edited by:
Remko Uijlenhoet
Reviewed by: three anonymous referees
Adler, R. F. and Negri, A. J.: A satellite infrared technique to estimate tropical convective and stratiform rainfall, J. Appl. Meteorol., 27, 30–51, https://doi.org/10.1175/1520-0450(1988)027<0030:ASITTE>2.0.CO;2, 1988.
AghaKouchak, A. and Mehran, A.: Extended Contingency Table: Performance Metrics for Satellite Observations and Climate Model Simulations, Water Resour. Res., 49, 7144–7149, https://doi.org/10.1002/wrcr.20498, 2013.
AghaKouchak, A. and Nakhjiri, N.: A Near Real-Time Satellite-Based Global Drought Climate Data Record, Environ. Res. Lett., 7, 044037, https://doi.org/10.1088/1748-9326/7/4/044037, 2012.
AghaKouchak, A., Bárdossy, A., and Habib, E.: Copula-based uncertainty modelling: application to multisensor precipitation estimates, Hydrol. Process., 24, 2111–2124, 2010.
Alijanian, M., Rakhshandehroo, G. R., Mishra, A. K., and Dehghani, M.: Evaluation of satellite rainfall climatology using CMORPH, PERSIANN-CDR, PERSIANN, TRMM, MSWEP over Iran, Int. J. Climatol., 37, 4896–4914, https://doi.org/10.1002/joc.5131, 2017.
Ashouri, H., Hsu, K., Sorooshian, S., Braithwaite, D., Knapp, K. R., Cecil, L. D., Nelson, B. R., and Prat, O. P.: PERSIANN-CDR: Daily Precipitation Climate Data Record from Multisatellite Observations for Hydrological and Climate Studies, B. Am. Meteorol. Soc., 96, 69–83, https://doi.org/10.1175/BAMS-D-13-00068.1, 2015.
Ashouri, H., Nguyen, P., Thorstensen, A., Hsu, K., Sorooshian, S., and Braithwaite, D.: Assessing the efficacy of High-Resolution Satellite-based PERSIANN-CDR Precipitation Product in Simulating Streamflow, J. Hydrometeorol., 17, 2061–2076, https://doi.org/10.1175/JHM-D-15-0192.1, 2016.
Behrangi, A., Khakbaz, B., Jaw, T. C., AghaKouchak, A., Hsu, K., and Sorooshian, S.: Hydrologic Evaluation of Satellite Precipitation Products at Basin Scale, J. Hydrol., 397, 225–237, https://doi.org/10.1016/j.jhydrol.2010.11.043, 2011.
Bussieres, N. and Hogg, W.: The objective analysis of daily rainfall by distance weighting schemes on a mesoscale grid, Atmos. Ocean, 27, 521–541, https://doi.org/10.1080/07055900.1989.9649350, 1989.
Chen, M., Shi, W., Xie, P., Silva, V. B., Kousky, V. E., Wayne Higgins, R., and Janowiak, J. E.: Assessing objective techniques for gauge-based analyses of global daily precipitation, J. Geophys. Res.-Atmos., 113, D04110, https://doi.org/10.1029/2007JD009132, 2008.
Creutin, J. D. and Obled, C.: Objective analyses and mapping techniques for rainfall fields: an objective comparison, Water Resour. Res., 18, 413–431, https://doi.org/10.1029/WR018i002p00413, 1982.
Damberg, L. and AghaKouchak, A.: Global Trends and Patterns of Droughts from Space, Theor. Appl. Climatol., 117, 441–448, https://doi.org/10.1007/s00704-013-1019-5, 2014.
Gado, T. A., Hsu, K., and Sorooshian, S.: Rainfall frequency analysis for ungauged sites using satellite precipitation products, J. Hydrol., 554, 646–655, https://doi.org/10.1016/j.jhydrol.2017.09.043, 2017.
Gandin, L. S.: Objective analysis of meteorological fields, Translated from the Russian, Jerusalem (Israel Program for Scientific Translations), Q. J. Roy. Meteorol. Soc., 92, 447–447, https://doi.org/10.1002/qj.49709239320, 1965.
Griffith, C. G., Woodley, W. L., Grube, P. G., Martin, D. W., Stout, J., and Sikdar, D. N.: Rain estimation from geosynchronous satellite imagery – Visible and infrared studies, Mon. Weather Rev., 106, 1153–1171, 1978.
Gruber, A. and Levizzani, V.: Assessment of Global Precipitation Products: A project of the World Climate Research Programme Global Energy and Water Cycle Experiment (GEWEX) Radiation Panel, WRCP, available at: http://www.gewex.org/gewex-content/uploads/2015/05/2008AssessmentGlobalPrecipitationReport.pdf (last access: 8 November 2018), 2008.
Hong, Y., Hsu, K., Gao, X., and Sorooshian, S.: Precipitation estimation from remotely sensed information using an artificial neural network – cloud classification system, J. Appl. Meteorol., 43, 1834–1852, 2004.
Hou, A. Y., Kakar, R. K., Neeck, S., Azarbarzin, A. A., Kummerow, C. D., Kojima, M., Oki R., Nakamura, K., and Iguchi, T.,: The Global Precipitation Measurement Mission, B. Am. Meteorol. Soc., 95, 701–722, 2014.
Hsu, K.: Rainfall estimation from satellite infrared imagery using artificial neural networks, PhD dissertation, Dept. of Hydrology and Water Resources, The University of Arizona, Tucson, Arizona, 1996.
Hsu, K., Gao, X., Sorooshian, S., and Gupta, H. V.: Precipitation estimation from remotely sensed information using artificial neural networks, J. Appl. Meteorol. Clim., 36, 1176–1190, https://doi.org/10.1175/1520-0450(1997)036<1176:PEFRSI>2.0.CO;2, 1997.
Hsu, K., Gupta, H. V., Gao, X., and Sorooshian, S.: Estimation of physical variables from multichannel remotely sensed imagery using a neural network: Application to rainfall estimation, Water Resour. Res., 35, 1605–1618, https://doi.org/10.1029/1999WR900032, 1999.
Hsu, K., Hong, Y., and Sorooshian, S.: Rainfall estimation using a cloud patch classification map, in: Measurement of Precipitation from Space: EURAINSAT and Future, edited by: Levizzani, V., Bauer, P., and Turk, F. J., Springer Publishing Company, Dordrecht, the Netherlands, 329–342, 2007.
Hsu, K., Sellars, S., Nguyen, P., Braithwaite, D., and Chu, W.: G-WADI PERSIANN-CCS GeoServer for Extreme Event Analysis, Sci. Cold Arid Reg., 5, 6–15, https://doi.org/10.3724/SP.J.1226.2013.00006, 2013.
Huffman, G. J., Bolvin, D. T., Nelkin, E. J., Wolff, D. B., Adler, R. F., Gu, G., Hong, Y., Bowman, K. P., and Stocker, E. F.: The TRMM Multisatellite Precipitation Analysis (TMPA): Quasi-global, multiyear, combined-sensor precipitation estimates at fine scales, J. Hydrometeorol., 8, 38–55, https://doi.org/10.1175/JHM560.1, 2007.
Huffman, G. J., Bolvin, D. T., Braithwaite, D., Hsu, K., Joyce, R., Kidd, C., Nelkin, E. J., and Xie, P.: NASA Global Precipitation Measurement (GPM) Integrated Multi-satellitE Retrievals for GPM (IMERG), Algorithm Theoretical Basis Document (ATBD), NASA/GSFC, Greenbelt, MD, USA, 2014.
Jamli, J. B.: Validation of satellite-based PERSIANN rainfall estimates using surface-based APHRODITE data over Iran, Earth Sci., 4, 150–160, https://doi.org/10.11648/j.earth.20150405.11, 2015.
Joyce, R. J., Janowiak, J. E., Arkin, P. A., and Xie, P.: CMORPH: A method that produces global precipitation estimates from passive microwave and infrared data at high spatial and temporal resolution, J. Hydrometeorol., 5, 487–503, https://doi.org/10.1175/1525-7541(2004)005<0487:CAMTPG>2.0.CO;2, 2004.
Juglea, S., Kerr, Y., Mialon, A., Lopez-Baeza, E., Braithwaite, D., and Hsu, K.: Soil Moisture Modeling of a SMOS Pixel, Interest of Using the PERSIANN Database over the Valencia Anchor Station, Hydrol. Earth Syst. Sci., 14, 1509–1525, https://doi.org/10.5194/hess-14-1509-2010, 2010.
Karbalaee, N., Hsu, K., Sorooshian, S., and Braithwaite, D.: Bias Adjustment of Infrared Rainfall Estimation Using Passive Microwave Satellite Rainfall Data, J. Geophys. Res.-Atmos., 122, 3857–3876, https://doi.org/10.1002/2016JD026037, 2017.
Katiraie-Boroujerdy, P. S., Nasrollahi, N., Hsu, K., and Sorooshian, S.: Evaluation of satellite-based precipitation estimation over Iran, J. Arid Environ., 97, 205–219, 2013.
Katiraie-Boroujerdy, P. S., Ashouri, H., Hsu, K., and Sorooshian, S.: Trends of Precipitation Extreme indices over a Subtropical Semi-Arid Area Using PERSIANN-CDR, Theor. Appl. Climatol., 130, 249–260, https://doi.org/10.1007/s00704-016-1884-9, 2016.
Knapp, K. R.: Scientific data stewardship of International Satellite Cloud Climatology Project B1 global geostationary observations, J. Appl. Remote Sens., 2, 023548, https://doi.org/10.1117/1.3043461, 2008.
Kummerow, C., Barnes, W., Kozu, T., Shiue, J., and Simpson, J.: The Tropical Rainfall Measuring Mission (TRMM) sensor package, J. Atmos. Ocean. Tech., 15, 809–817, 1998.
Kummerow, C., Simpson, J., Thiele, O., Barnes, W., Chang, A. T. C., Stocker, E., Adler, R. F., Hou, A., Kakar, R., Wentz, F., Ashcroft, P., Kozu, T., Hong, Y., Okamoto, K., Iguchi, T., Kuroiwa, H., Im, E., Haddad, Z., Huffman, G., Ferrier, B., Olson, W. S., Zipser, E., Smith, E. A., Wilheit, T. T., North, G., Krishnamurti, T., and Nakamura, K.: The status of the Tropical Rainfall Measuring Mission (TRMM) after two years in orbit, J. Appl. Meteorol., 39(12), 1965–1982, 2000.
Li, J., Gao, X., Maddox, R. A., Sorooshian, S., and Hsu, K.: Summer weather simulation for the semi-arid lower Colorado River basin: case tests, Mon. Weather Rev., 131, 521–541, 2003.
Liu, X., Yang, T., Hsu, K., and Sorooshian, S.: Evaluating the Streamflow Simulation Capability of PERSIANN-CDR Daily Rainfall Products in Two River Basins on the Tibetan Plateau, Hydrol. Earth Syst. Sci., 21, 169–181, https://doi.org/10.5194/hess-21-169-2017, 2017.
Mehran, A. and AghaKouchak, A.: Capabilities of Satellite Precipitation datasets to Estimate Heavy Precipitation Rates at Different Temporal Accumulations, Hydrol. Process., 28, 2262–2270, https://doi.org/10.1002/hyp.9779, 2014.
Meisner, B. N. and Arkin, P. A.: Spatial and annual variation in the diurnal cycle of large-scale tropical convective cloudiness and precipitation, Mon. Weather Rev., 115, 1009–1032, 1987.
Miao C., Ashouri, H., Hsu, K., Sorooshian, S., and Duan, Q.: Evaluation of the PERSIANN-CDR daily rainfall estimates in capturing the behavior of extreme precipitation events over China, J. Hydrometeorol., 16, 1387–1396, 2015.
Nasrollahi, N., Hsu, K., and Sorooshian, S.: An artificial neural network model to reduce false alarms in satellite precipitation products using MODIS and CloudSat observations, J. Hydrometeorol., 14, 1872–1883, 2013.
Nguyen, P., Sellars, S., Thorstensen, A., Tao, Y., Ashouri, H., Braithwaite, D., Hsu, K., and Sorooshian, S.: Satellites track precipitation of Super Typhoon Haiyan, EOS Trans., 95, 133–135, 2014.
Nguyen, P., Thorstensen, A., Sorooshian, S., Hsu, K., and AghaKouchak, A.: Flood forecasting and inundation mapping using HiResFlood-UCI and near-real-time satellite precipitation data: the 2008 Iowa flood, J. Hydrometeorol., 16, 1171–1183, 2015.
Nguyen P., Sorooshian, S., Thorstensen, A., Tran, H., Huynh, P., Pham, T., Ashouri, H., Hsu, K., AghaKouchak, A., and Braithwaite, D.: Exploring trends through “RainSphere”: Research data transformed into public knowledge, B. Am. Meteorol. Soc., 98, 653–658, https://doi.org/10.1175/BAMS-D-13-00068.1, 2016.
Nguyen, P., Thorstensen, A., Sorooshian, S., Zhu, Q., Tran, H., Ashouri, H., Miao, C., Hsu, K., and Gao, X.: Evaluation of CMIP5 model precipitation using PERSIANN-CDR, J. Hydrometeorol., 18, 2313–2330, https://doi.org/10.1175/JHM-D-16-0201.1, 2017.
Ombadi, M., Nguyen, P., Sorooshian, S., and Hsu, K. L.: Developing Intensity–Duration–Frequency (IDF) Curves From Satellite-Based Precipitation: Methodology and Evaluation, Water Resour. Res., 54, https://doi.org/10.1029/2018WR022929, 2018.
Rossow, W. B. and Garder, L. C.: Cloud detection using satellite measurements of infrared and visible radiances for ISCCP, J. Climate, 6, 2341–2369, https://doi.org/10.1175/1520-0442(1993)006<2341:CDUSMO>2.0.CO;2, 1993.
Rossow, W. B. and Schiffer, R. A.: ISCCP cloud data products, B. Am. Meteorol. Soc., 72, 2–20, https://doi.org/10.1175/1520-0477(1991)072<0002:ICDP>2.0.CO;2, 1991.
Scofield, R. A.: The NESDIS operational convective precipitation technique, Mon. Weather Rev., 115, 1773–1792, 1987.
Simpson, J., Adler, R. F., and North, G. R.: A proposed Tropical Rainfall Measurement Mission (TRMM) satellite, B. Am. Meteorol. Soc., 69, 278–295, 1987.
Sorooshian, S., Hsu, K., Gao, X., Gupta, H. V., Imam, B., and Braithwaite, D.: Evaluation of PERSIANN system satellite-based estimates of tropical rainfall, B. Am. Meteorol. Soc., 81, 2035–2046, https://doi.org/10.1175/1520-0477(2000)081<2035:EOPSSE>2.3.CO;2, 2000.
Sorooshian, S., Gao, X., Hsu, K., Maddox, R. A., Hong, Y., Gupta, H. V., and Imam, B.: Diurnal variability of tropical rainfall retrieved from combined GOES and TRMM satellite information, J. Climate, 15, 983–1001, 2002.
Sorooshian S., AghaKouchak, A., Arkin, P., Eylander, J., Foufoula-Georgiou, E., Harmon, R., Hendrickx, J. M. H., Imam, B., Kuligowski, R., Skahill, B., and Skofronick-Jackson, G.: Advanced Concepts on Remote Sensing of Precipitation at Multiple Scales, B. Am. Meteorol. Soc., 92, 1353–1357, https://doi.org/10.1175/2011BAMS3158.1, 2011.
Tao, Y., Gao, X., Ihler, A., Sorooshian, S., and Hsu, K.: Precipitation Estimation with Bi-spectral Satellite Information Using Deep Learning Approach, J. Hydrometeorol., 17, 1271–1283, https://doi.org/10.1175/JHM-D-16-0176, 2017.
Turk, J. T., Mostovoy, G. V., and Anantharaj, V.: The NRL-Blend High Resolution Precipitation Product and its Application to Land Surface Hydrology, in: Satellite Rainfall Applications for Surface Hydrology, edited by: Gebremichael, M. and Hossain, F., Springer, Dordrecht, the Netherlands, 85–104, https://doi.org/10.1007/978-90-481-2915-7_6, 2010.
Woodley, W. L., Griffith, C. G., Griffin, J. S., and Stroomatt, S. C.: The inference of GATE convective rainfall from SMS-1 imagery, J. Appl. Meteorol., 19, 338–408, 1980.
Xu, L., Sorooshian, S., Gao, X., and Gupta, H. V.: A cloud-patch technique for identification and removal of no-rain clouds from satellite infrared imagery, J. Appl. Meteorol., 38, 1170–1181, 1999.
Yi, H.: Assimilation of satellite-derived precipitation into the Regional Atmospheric Modeling System (RAMS) and its impact on the weather and hydrology in the southwest United States, PhD dissertation, Dept. of Hydrology and Water Resources, The University of Arizona, Tucson, Arizona, 1996.
Yilmaz, K. K., Hogue, T. S., Hsu, K., Sorooshian, S., Gupta, H. V., and Wagener, T.: Intercomparison of Rain Gauge, Radar, and Satellite-based Precipitation Estimates on Hydrologic Forecasting, J. Hydrometeorol., 6, 497–517, 2005.
Zahraei, A., Hsu, K., Sorooshian, S., Gourley, J. J., Hong, Y., and Behrangi, A.: Short-term Quantitative Precipitation Forecasting Using An Object-based Approach, J. Hydrol., 483, 1–15, https://doi.org/10.1016/j.jhydrol.2012.09.052, 2013.