the Creative Commons Attribution 4.0 License.
the Creative Commons Attribution 4.0 License.
 | 04 Oct 2018
Why has catchment evaporation increased in the past 40 years? A data-based study in Austria
Doris Duethmann
Günter Blöschl
Regional evaporation has increased in many parts of the world in the last decades, but the drivers of these increases are widely debated. Part of the difficulty lies in the scarcity of high-quality long-term data on evaporation. In this paper, we analyze changes in catchment evaporation estimated from the water balances of 156 catchments in Austria over the period 1977–2014 and attribute them to changes in atmospheric demand and available energy, vegetation, and precipitation as possible drivers. Trend analyses suggest that evaporation has significantly increased in 60 % of the catchments (p≤0.05) with an average increase of 29±14 mm yr−1 decade−1 (± standard deviation) or 4.9±2.3 % decade−1. Pan evaporation based on 24 stations has, on average, increased by 29±5 mm yr−1 decade−1 or 6.0±1.0 % decade−1. Reference evaporation over the 156 catchments estimated by the Penman–Monteith equation has increased by 18±5 mm yr−1 decade−1 or 2.8±0.7 % decade−1. Of these, 2.1 % are due to increased global radiation and 0.5 % due to increased air temperature according to the Penman–Monteith equation. A satellite-based vegetation index (NDVI) has increased by 0.02±0.01 decade−1 or 3.1±1.1 % decade−1. Estimates of reference evaporation accounting for changes in stomata resistance due to changes in the NDVI indicate that the increase in vegetation activity has led to a similar increase in reference evaporation as changes in the climate parameters. A regression between trends in evaporation and precipitation yields a sensitivity of a 0.22±0.05 mm yr−2 increase in evaporation to a 1 mm yr−2 increase in precipitation. A synthesis of the data analyses suggests that 43±15 % of the observed increase in catchment evaporation may be directly attributed to increased atmospheric demand and available energy, 34±14 % to increased vegetation activity, and 24±5 % to increases in precipitation.
- Article
(2561 KB) - Full-text XML
-
Supplement
(2801 KB) - BibTeX
- EndNote


Evaporation (E), which includes transpiration through plants, is an important process in the water, energy, and carbon cycles and directly controls agricultural productivity and water availability for human purposes. In the context of global climate change, regional E has increased in many parts of the world in the last decades (Huntington, 2006). However, due to the difficulty of measuring E, especially at large spatial scales, the drivers of changing E are still debated.
Decadal changes in catchment E may be inferred from the catchment water balance, as storage changes are usually small over decadal scales. Surprisingly few studies have investigated trends in water-balance-based evaporation (Ewb). Those studies that exist generally found increases in Ewb in the 20th century. Examples include large river basins in the US (Milly and Dunne, 2001; Walter et al., 2004; Kramer et al., 2015), the Tibetan Plateau (Zhang et al., 2007), and catchments in Switzerland (Spreafico et al., 2007). A study of 109 basins around the world in the period 1961–1999 found only few significant trends but a tendency towards positive trends in North and South America and Europe and a tendency towards negative trends in Africa and Siberia (Ukkola and Prentice, 2013).
Observed trends in catchment Ewb can be complemented by point measurements, although it is invariably difficult to link point and catchment scales. Lysimeter data from Rietholzbach, Switzerland, over 1976–2007 showed a decreasing trend in E in the first half of the period and an increasing trend in the second half (Teuling et al., 2009). Observations based on eddy covariance are usually too short for trend analyses (Wang and Dickinson, 2012), but they have been used to train models that use satellite and climate data at longer timescales and larger space scales (Jung et al., 2010; Wang et al., 2010; Zhang et al., 2010). While these studies generally agree on positive trends since the 1980s, they differ in the magnitude of the estimated trends (Dong and Dai, 2017). It has been noted, however, that the results of such models need to be treated with care, as they are sometimes inconsistent with trends from the water balance, particularly for wet basins (Zhang et al., 2012; Liu et al., 2016).
Potential drivers for changes in E are changes in available energy and atmospheric evaporative demand, which is driven by variations in wind, vapor deficit, and air temperature. Available energy and the evaporative demand of the atmosphere can be estimated based on climatic drivers or measured with evaporation pans. In many parts of the world (including North America, China, India), annual pan evaporation (Epan) has decreased in the second half of the 20th century with rates of 10–40 mm yr−1 decade−1 despite increases in air temperature (Peterson et al., 1995; Roderick et al., 2009; McVicar et al., 2012). In some instances, this decrease in Epan has been explained by decreases in net radiation and/or wind speed (Roderick and Farquhar, 2002; Roderick et al., 2007). In other instances, decreasing Epan has been interpreted as a consequence of increasing actual evaporation (Brutsaert and Parlange, 1998; Brutsaert, 2013). In Europe, most studies found increasing trends of Epan, e.g., in Ireland (1963–2005) (Stanhill and Möller, 2008), England (1957–2004 and 1986–2010) (Stanhill and Möller, 2008; Clark, 2013), Greece (1983–1999) (Papaioannou et al., 2011), and the Czech Republic (1968–2010) (Trnka et al., 2015). In this paper, we use the term atmospheric conditions to summarize the drivers available energy and atmospheric demand.
Other potential drivers are changes in land cover and vegetation (Piao et al., 2007). Rising atmospheric CO2 concentrations increase plant growth (Piao et al., 2007) and influence stomata closure (Gedney et al., 2006). Finally, changes in water availability resulting from changes in precipitation may contribute to changing E. For example, Jung et al. (2010) attributed the hiatus of the increasing trend in global terrestrial E during 1998–2008 to the limited moisture supply in the Southern Hemisphere.
Several global scale studies attributed modeled changes in E to their drivers. The land surface models of Douville et al. (2013) could only explain variations in E over 1950–2005 if natural forcings, enhanced greenhouse gas concentrations, and aerosols were considered. Based on an ensemble of land surface models that considered variations in climate, land cover, atmospheric CO2 concentration, and nitrogen deposition, Mao et al. (2015) found that E trends over 1982–2013 were dominantly driven by variations in climate, in particular precipitation. Miralles et al. (2014) showed that variations in E in the tropics were strongly influenced by variations in precipitation driven by El Niño–Southern Oscillations. In contrast, using a modified Penman–Monteith equation with detrended input variables, Zhang et al. (2015) concluded that the increase in global terrestrial E over 1982–2013 was largely driven by vegetation greening, while changes in global radiation, wind speed, air vapor pressure, air temperature, and atmospheric CO2 concentration had only minor effects. A full consensus regarding the drivers of the increasing E that has been observed does not seem to exist. The cited studies above looked at changes in modeled E at the global scale, based on globally available meteorological data. Complementary to these global studies, there is a need for data-based studies focusing on smaller regions with high-quality data.
The aim of this study is to (a) identify changes in catchment evaporation in the past 40 years and (b) identify the drivers of these changes. We use high-quality data sets of discharge, precipitation, and other climate variables from 156 catchments in Austria during the period 1977–2014. We analyze regional averages over these catchments in order to increase the robustness of the analysis. The potential drivers of changes in catchment evaporation examined are (i) the atmospheric conditions, quantified by reference evaporation (E0) and Epan, (ii) vegetation, quantified by a satellite-based vegetation index, and (iii) precipitation as a proxy for the available water.
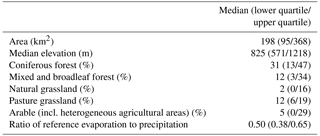
Table 1Characteristics of the 156 study catchments in Austria.
2.1 Water-balance data and water-balance estimates
2.1.1 Discharge data and catchment attributes
For the analysis of changes in the water-balance-based evaporation (Ewb), we identified all catchments in Austria where daily discharge data in the period 1977–2014 (hydrological years, November to October) with a maximum of 2 years missing were available. The beginning of the analysis period was set to 1977, because most discharge series in Austria start in the mid-1970s. Catchments with substantial anthropogenic influences from dams or water withdrawals (Viglione et al., 2013), catchments containing glaciers, and a few high-mountain catchments where observed discharge exceeded observed precipitation were excluded. This selection resulted in a total of 156 catchments (Fig. 1) ranging in size from 23 to 6214 km2 (average 316 km2). Land cover was derived from the Corine 2000 data (European Environment Agency, 2016). The land cover is largely dominated by forest and grassland (Table 1). Median catchment elevations were calculated from the SRTM digital elevation model (Jarvis et al., 2008). They range from 287 to 1920 m (average 910 m). All catchments have a ratio of reference evaporation to precipitation smaller than 1 and are thus classified as energy-limited or humid according to Budyko (1974). The catchments were assigned to regions with homogeneous variations in climate (Fig. 1) that were derived from a multi-variable (temperature, precipitation, sunshine duration, air pressure) principal component analysis (Matulla et al., 2003; Matulla, 2005; Auer et al., 2007).
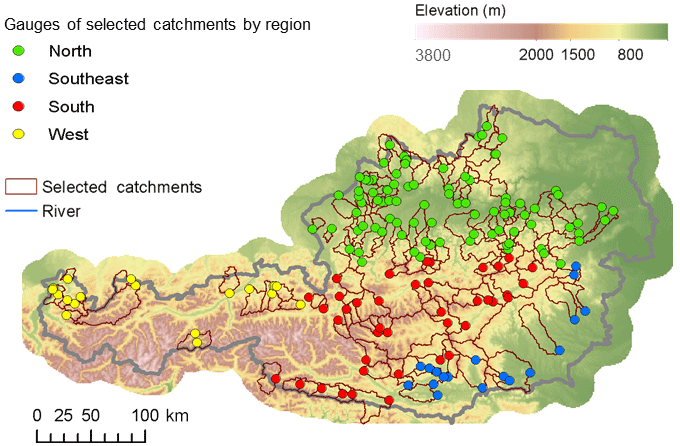
Figure 1Distribution of the study catchments in Austria and their association with one of four regions.
2.1.2 Catchment average meteorological data
Air temperature and precipitation were obtained from the gridded SPARTACUS data set (Hiebl and Frei, 2016, 2018). This data set has temporal and spatial resolutions of 24 h and 1 km, respectively, and was designed to be suitable for trend analyses. The interpolation method of minimum and maximum air temperature accounts for nonlinearities in the thermal profile and uses a constant station network of 150 stations. Precipitation is based on a two-step interpolation scheme, in which 1249 stations (including 119 totalizer precipitation gauges) were used for obtaining a daily background climatology for 1977–2006 and a constant number of 523 stations was used for interpolating ratios between the daily precipitation and the background climatology. To account for the systematic underestimation from gauge undercatch, we corrected the gridded precipitation data set for gauge undercatch using the following equation (Richter, 1995);
where Pcorr is undercatch corrected precipitation, Porig uncorrected precipitation, and b, e are coefficients that depend on precipitation type and wind exposure. We estimated the precipitation type as snow for mean air temperatures below −1 ∘C, as rain for mean air temperatures above 3 ∘C, and as mixed precipitation between −1 and 3 ∘C (ATV-DVWK, 2001). The coefficients of Richter (1995) for moderately sheltered locations were applied to all grid points.
Measurements of relative humidity at 07:00 and 14:00 LT and global radiation were provided by the Austrian Central Institute for Meteorology and Geodynamics (ZAMG). Stations with more than 5 % (15 % for global radiation) missing data during 1977–2014 (hydrological years, November to October) were excluded, which resulted in 125 and 6 stations for relative humidity and global radiation, respectively. Data gaps were filled using linear regression to the station with the highest correlation. The data were interpolated onto a 1 km2 grid using local ordinary least-squares regression with elevation. The local neighborhood was set to a default radius of 100 km for relative humidity and 200 km for global radiation. This was adjusted to include a minimum of 10 (global radiation 4) and a maximum of 40 stations. The grid values were aggregated to the catchment average series.
Trends in wind data were not included in the analysis, since station observations of wind speeds are known to be prone to inhomogeneities (Böhm, 2008), annual anomalies of wind speed data from 85 stations in Austria appear to be unrelated to each other (Fig. S1a in the Supplement), and temporal trends over 1977–2014 do not show any spatial pattern (Fig. S2a) (see Supplement S1). Furthermore, interpolating wind data in space results in high uncertainties. We therefore used uniform monthly wind speeds averaged over all years from all stations in Austria. The potential effect of changes in wind speed on evaporation is analyzed in Supplement S2.
2.1.3 Estimating evaporation from the water balance (Ewb)
The catchment water balance can be written as
where Ssnow is snow, Sice ice, Ssw surface water, Ssoil soil water, Sgw groundwater storage, P precipitation, and Q discharge. In order to be able to estimate E from the water balance, some assumptions on storage changes need to be made. Over periods of several years, we may assume that changes in surface water, soil, and snow storage are small. Studies on groundwater-level changes in Austria do not show large-scale groundwater changes over the study period (Blaschke et al., 2011; Neunteufel et al., 2017). Trends in annual mean groundwater levels at 2114 sites in Austria over 1976–2006 showed a heterogeneous picture, with decreasing trends (p≤0.05) at 18 % of the sites, increasing trends at 12 % of the sites, and insignificant trends at 70 % of the sites (Blaschke et al., 2011). We therefore assume that changes in groundwater storage (and changes in any groundwater fluxes) are small. Estimates of absolute values of Ewb (trends in Ewb are not affected) furthermore depend on the assumption that groundwater fluxes across the catchment boundaries can be largely neglected, which is supported by prior rainfall-runoff studies in the catchments that suggest that the water balance can be closed (Parajka et al., 2005). Catchments with glaciers have been excluded from the analysis. For the timescale of decades, catchment evaporation can therefore be estimated as . Since annual data of Ewb might be influenced by storage effects, we applied a Gaussian filter with a standard deviation of 2 years for the graphical presentation of variations of Ewb over the study period.
2.2 Pan evaporation data
Daily pan evaporation (Epan) data using the GGI-3000 evaporimeter were provided by the Central Hydrographical Bureau (HZB) in Vienna and by ZAMG in Vienna. Further monthly Epan data were obtained from the Meteorological Yearbook (ZAMG, 1977–1990). Coordinates, elevations, as well as means and standard deviations of the warm-season Epan of the stations are listed in the Supplement (Table S1). Missing values in the ZAMG data were replaced by estimates from an empirical Dalton-type formula with locally derived coefficients if wind speed and saturation deficit values were available (Neuwirth, 1978). Missing values in the HZB data were replaced by estimates from the climate factor method (Hydrographischen Zentralbüro, 1996) with locally derived coefficients if wind speed, air temperature, and relative humidity were available. Remaining negative values and values larger than 15 mm day−1 were considered erroneous and flagged as missing data. Gaps with a maximum gap size of four days were linearly interpolated. Totals over the summer half year (May to October) were calculated if more than 90 % of the daily values or all monthly values were available. Due to the uneven record lengths, we analyzed trends for three periods, 1979–2005 (13 stations), 1983–2014 (8 stations), and 1993–2014 (16 stations), which includes only series with a length of at least 20 years and 5 years or less missing from the record. Since trend analyses at individual stations did not show regional differences, normalized data of all series with a length of at least 20 years during 1977–2014 (24 stations) were pooled to a common series. The data were normalized by subtracting the mean over the overlapping period 1993–2005 excluding 1995 and 1998, which had many missing values at several stations. Summer Epan was upscaled to the full year by the average ratio of annual and summer reference evaporation (1.33) for comparison.
2.3 Estimation of reference evaporation
2.3.1 Reference evaporation
In order to examine the effects of changes in atmospheric conditions, we estimated reference evaporation (E0) by the Penman–Monteith equation for well-watered short grass vegetation (Allen et al., 1998). This is represented by
where Rn is the net radiation at the crop surface (MJ m−2 day−1), G is the soil heat flux density (MJ m−2 day−1), T is the mean air temperature at 2 m height (∘C), ra is the aerodynamic resistance (s m−1), rs is the surface resistance (s m−1), es is the saturation vapor pressure (kPa), ea is the actual vapor pressure (kPa), Δ is the slope of the vapor pressure curve (kPa ∘C−1), and γ is the psychrometric constant (kPa ∘C−1). According to the reference conditions of a vegetated surface with a height of 0.12 m, rs=70 s m−1 and , where u2 is the wind speed at 2 m height (m s−1) that was derived from the wind speed at 10 m height based on a logarithmic wind speed profile (Allen et al., 1998). The ground heat flux was neglected. The vapor pressure deficit es−ea was calculated as the average of the vapor pressure deficit at the minimum air temperature (using relative humidity at 07:00 LT) and at the maximum air temperature (using relative humidity at 14:00 LT). Rn was calculated from global radiation (Rs; MJ m−2 day−1), albedo (α; set to 0.23) and net longwave radiation (Rnl; MJ m−2 day−1), represented by the equation
where Rnl was estimated according to Allen et al. (1998) based on minimum and maximum air temperature, clear-sky solar radiation, measured Rs, and the mean daily vapor pressure. E0 was calculated on a daily basis on a 1 km2 grid and aggregated to catchment average annual values (hydrological years, November to October).
The average contributions of the input variables net radiation, air temperature, and vapor pressure deficit to the trend of E0 were evaluated using estimates of E0 with one or several of the input variables held fixed to a particular year. The year 1994 was selected, since annual mean values of E0 and its input variables were close to the mean value over the study period. For this analysis, the daily series of catchment evaporation were estimated from input data aggregated to catchment average daily values in order to reduce the computing time.
The contribution of variable i to the trend of E0 in catchment k was calculated as (see e.g., Galbraith et al., 2010)
where τc(k) is the trend of the control (where all input variables are kept to those of 1994), τi(k) is the trend of E0 calculated with only variable i varying over the study period (and all other inputs as for the control), and is the trend of E0 with all input variables varying. The two-way interaction effect of the variables i and j in catchment k was calculated as
where τi×j(k) is the trend of E0 calculated with variable i and j varying over the study period (and all other inputs as for the control). For average effects and their variability, we calculated averages and spatial standard deviations of and over all catchments.
2.3.2 Effect of changes in vegetation activity on reference evaporation
In order to examine changes in vegetation, we used the Normalized Difference Vegetation Index (NDVI) based on satellite data. Changes in vegetation activity as observed by the NDVI represent an integrated signal of changes in phenology, leaf area index, vegetation fraction, vegetation type, and land cover. Observed 15-day maximum value composite NDVI data at a resolution of 8 km from the Advanced Very High Resolution Radiometer (AVHRR) for 1982–2014 were obtained from Tucker et al. (2005). The NDVI data were aggregated to catchment averages and linearly interpolated to daily catchment average series.
In the Penman–Monteith equation, an increase of the vegetation activity reduces rs, which increases the potential evaporation. We calculated the reference evaporation considering a variable rs (E0v) using Eq. (3), applying a variable rs derived from the satellite data instead of a constant rs of 70 s m−1. The vegetation effect was estimated by calculating (i) E0v from the original NDVI series and (ii) E0c from a detrended NDVI series.
We applied two approaches for estimating rs from the NDVI to consider the uncertainty of these estimates. In the first approach, rs was estimated from the leaf area index (LAI) and the fraction of photosynthetically active radiation (FPAR). From Sellers et al. (1996), FPAR was estimated as
where S is a transformed NDVI value (1+ NDVI) NDVI) and Smin and Smax are the 5 % and 98 % quantiles of S for a given land cover class. The LAI was estimated from the FPAR (Sellers et al., 1996) as
where LAImax is the maximum LAI of a land cover class. In Eqs. (7) and (8), we applied the following coefficients for grassland: NDVImin=0.039, NDVImax=0.674, FPARmin=0.001, FPARmax=0.95, and LAImax=5 (Sellers et al., 1996). rs was estimated as , assuming a leaf stomata resistance rl of 100 s m−1 for well-watered grass (Allen et al., 1998).
In the second approach, we used the relationship between rs and the NDVI of Zhang et al. (2010), which is represented as
where b1=175 s m−1, b2=2000 s m−1, b3=6, and (coefficients for grass).
The average contributions of changes in atmospheric conditions and of changes in vegetation to the trend in E0v ( and ) averaged over all catchments and the two approaches for estimating rs from the NDVI were estimated as follows:
where k is the catchment index, n the total number of catchments, l refers to one of the two approaches for estimating rs from the NDVI, is the trend in E0c, and is the trend in E0v of catchment k when using approach l.
2.4 Trend analyses, regression analyses, and attribution of the trend in Ewb
Trends were estimated by the Sen's slope estimator (Sen, 1968). Trend significance was assessed by the nonparametric Mann–Kendall test (Mann, 1945; Kendall, 1975). The trend-free prewhitening technique was applied to remove lag-one serial correlation (Yue et al., 2002). Uncertainties in the trend magnitude were estimated using a bootstrapping approach. For this purpose, 1000 samples of size N were drawn, with replacement, from the record of length N years. The Sen's slope was calculated from each of the 1000 samples and the standard deviation was determined. The trends and the standard deviations were first calculated for each catchment and then averaged over the catchments to derive average trends and their uncertainties over a number of catchments.
The trends in Ewb in the individual catchments were related to the respective trends in E0, the NDVI, and mean annual precipitation by regression analysis in order to unravel the relation between changes in Ewb to changes in atmospheric conditions, changes in vegetation, and changes in precipitation.
The contributions of the different drivers to the increase in Ewb were estimated as follows. The sensitivity of the trend in Ewb to trends in precipitation was estimated based on the slope of the linear regression between trends in Ewb and trends in precipitation. Since Ewb is estimated from precipitation and discharge, trends in Ewb are not independent from trends in precipitation and the regression relationship may overestimate the effect of trends in precipitation on trends in Ewb. The magnitude of this overestimation was estimated by Monte Carlo simulations with correlated annual precipitation and discharge series generated according to the statistics of the data (see Supplement S3). The sensitivity of the trend in Ewb to trends in precipitation () was estimated as the slope of the linear regression between trends in Ewb and trends in precipitation corrected by the overestimation effect estimated by the Monte Carlo simulations. The average contribution of changes in precipitation to the trend in Ewb () was estimated as
where and are average trends over all catchments in precipitation and Ewb. The contributions of changes in atmospheric conditions and vegetation could not be estimated in a similar way, since the trends in E0 or in the NDVI were not related to the trends in Ewb (see Sect. 3.2.1 and 3.2.3). This is probably due to a relatively low spatial variability in changes in E0 and changes in the NDVI. While the spatial variability of changes in precipitation is relatively high, the spatial variability of changes in available energy, which is an important driver for changes in E0 and in the NDVI, is low.
A different approach was therefore used for estimating the average contributions of changes in atmospheric conditions and vegetation to the trend in Ewb ( and ). Assuming that the remainder of the trend in Ewb is caused by changes in atmospheric conditions and vegetation, their contributions were estimated according to the ratio of their effects on E0v, represented by
where and are the contributions of changes in atmospheric conditions and in vegetation to the trend in E0v (see Eq. 10) averaged over all catchments and both parameterizations for rs.
Uncertainties in the attribution estimate are based on the standard deviation of the regression slope of the trend in precipitation against the trend in Ewb, the standard deviations of and over all catchments as well as the two parameterizations for rs.
3.1 Changes in evaporation estimated from the water balance (trend detection)
Catchment Ewb trends increased significantly (p≤0.05) in 93 out of the 156 catchments (60 %) during 1977–2014. One catchment shows a significant decreasing trend. On average over all catchments, the annual Ewb increased with a rate of 29±14 mm yr−1 or 4.9 ±2.3 % per decade (± standard deviation of the trend; the standard deviation refers to the average uncertainties of the trend estimates). The increase was largest during 1980–1995 and flattened out later (Fig. 2a and d). The increase in Ewb is more consistent over space and time than the changes in precipitation and discharge (Table 2, Figs. 2b, c, and S6), which would be expected and adds credence to the estimates.
Annual precipitation trends increased significantly (p≤0.05) in 64 out of the 156 catchments (41 %), with an average increase of 32±23 mm yr−1 or 2.4±1.7 % per decade. Two catchments show significant decreasing trends. Increases were particularly large in the eastern Alpine region of the study domain and generally occurred in summer (Figs. S7 and S8).
Discharge trends increased significantly (p≤0.05) in 16 out of the 156 catchments (10 %) and decreased significantly in 9 catchments (6 %), resulting in an average trend of 2±23 mm yr−1 or 0.2±3.1 % per decade. Catchments with increasing discharge are located in the eastern Alpine region, where precipitation increased the most. Catchments with significant decreasing trends are located in the west of Austria, where precipitation did not change much (Fig. S6c). Interestingly, the decadal fluctuations of the discharge series within the study period are very similar to those of the precipitation series (Fig. 2b and c).
Table 2Means and trends of catchment evaporation estimated from the water balance (Ewb), precipitation, and discharge. Numbers given are the spatial averages over regions (and the entire study area) of the mean and the standard deviation.
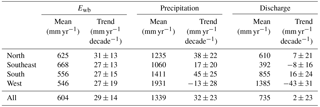
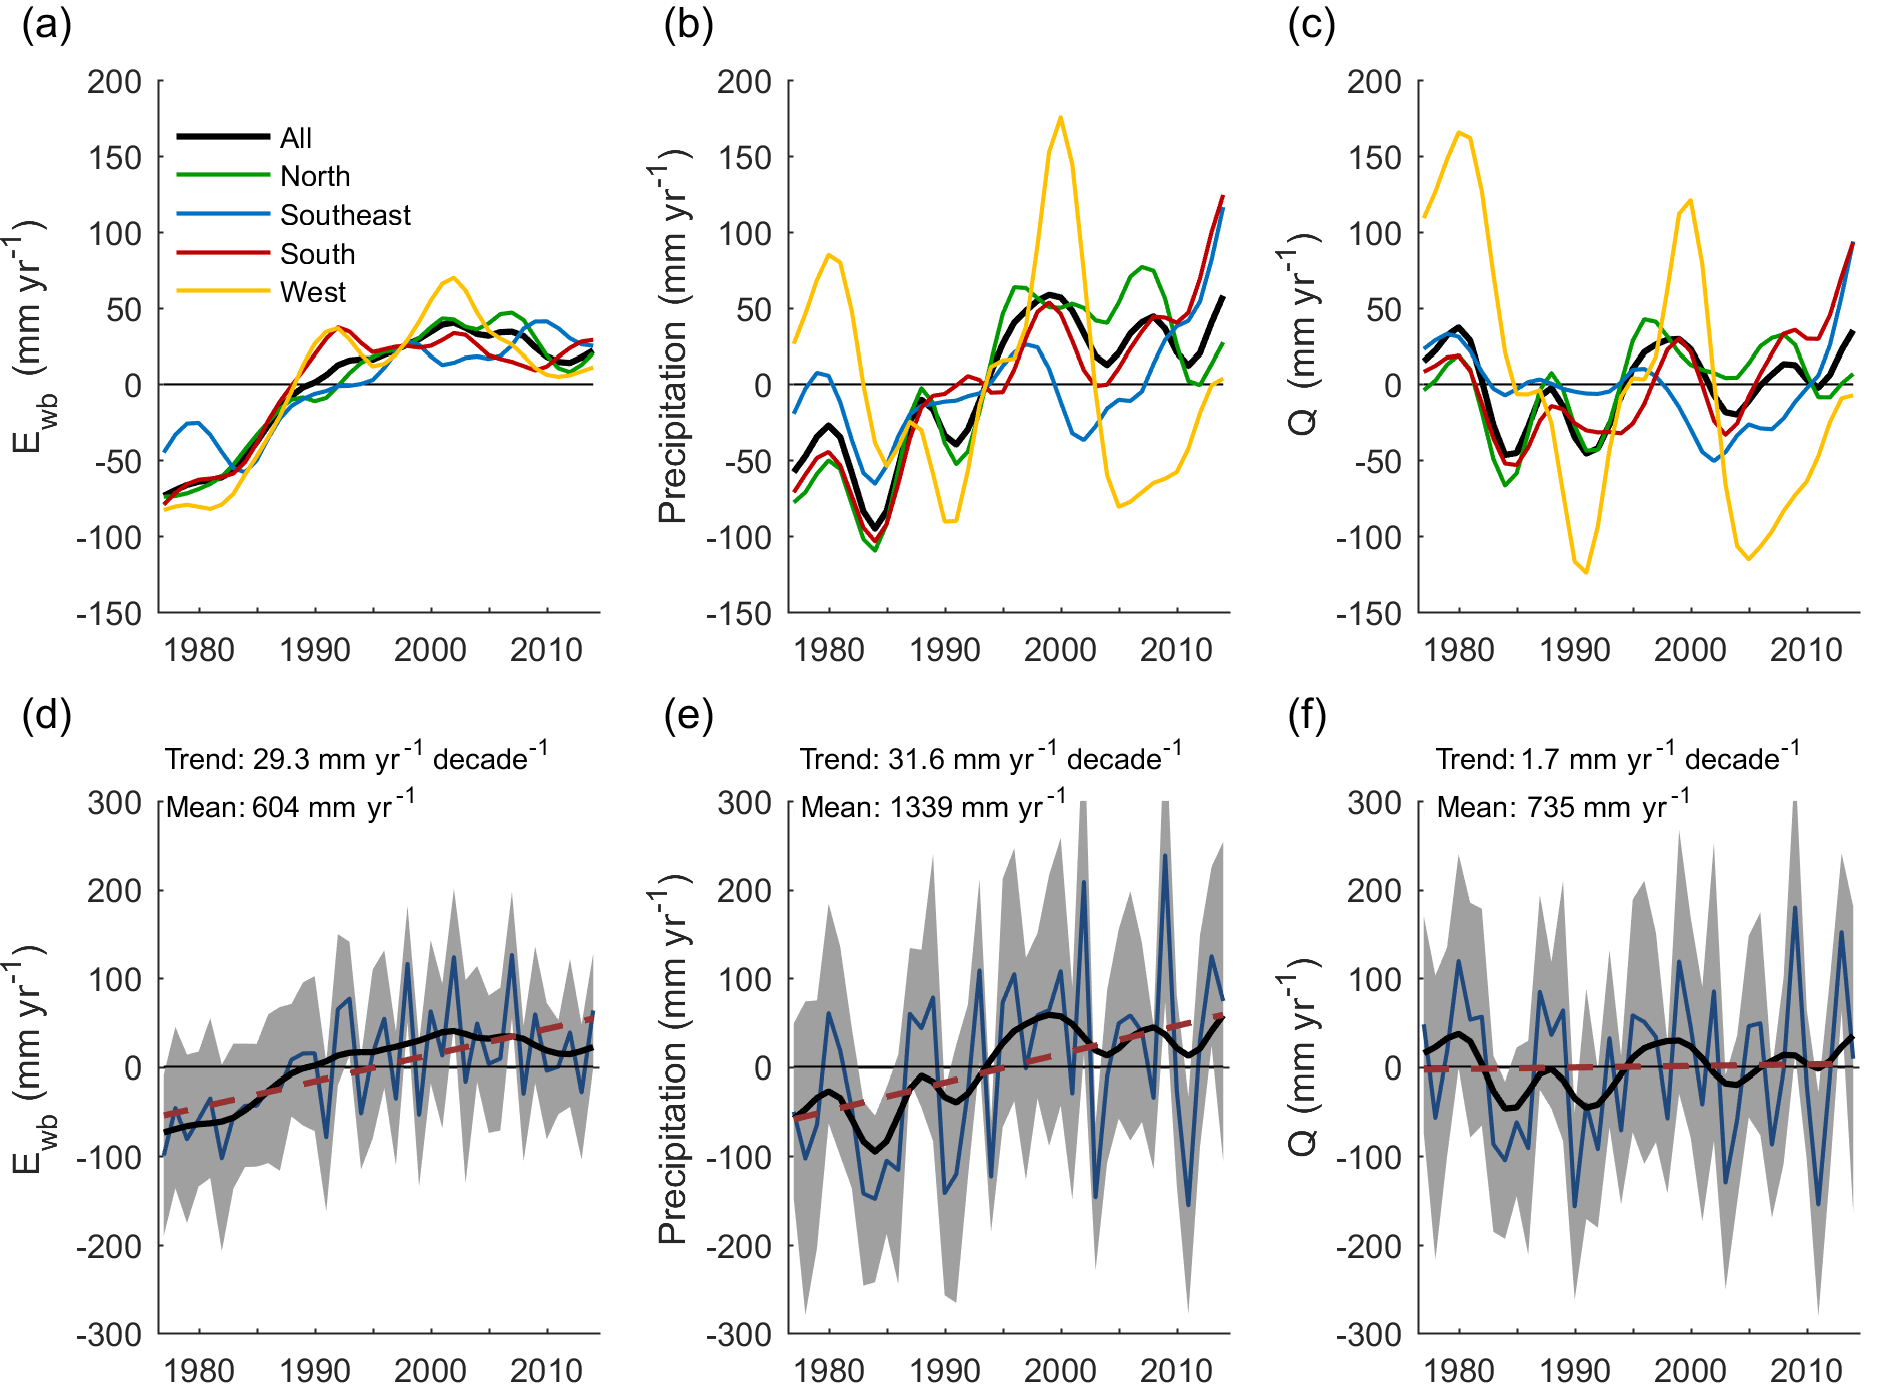
Figure 2Anomalies of (a, d) catchment evaporation estimated from the water balance (Ewb), (b, e) precipitation, and (c, f) discharge over 1977–2014. (a)–(c) Mean anomalies by region. Data smoothed using a Gaussian filter with a standard deviation of 2 years. (d)–(f) Mean anomalies over all catchments. The thin blue line shows the mean over all catchments, the grey shaded area the variability between catchments (±1 SD – standard deviation), the bold black line the smoothed mean, and the dashed red line the linear trend.
The analyses in this study are based on undercatch corrected precipitation using coefficients for moderately protected locations. In order to analyze the sensitivity of the correction assumption on the estimated trends in Ewb, we estimated trends in Ewb using uncorrected precipitation and undercatch corrected precipitation with correction parameters for unprotected locations. Without undercatch correction, estimates of average catchment precipitation would be 9 % lower and the resulting estimates of Ewb would be 20 % lower than with undercatch correction for moderately protected locations (Table 3). The percentage of catchments with significant increasing trends in Ewb would increase from 60 % to 65 %, and the average trend in Ewb would increase from 29 to 31 mm yr−1 or from 4.9 % to 6.4 % per decade. Using undercatch correction for wind-exposed stations has an effect of similar magnitude but of opposite direction. These results show that, while undercatch correction of precipitation has a strong effect on average Ewb, it only moderately affects its trends. Please note that in all figures and tables of this paper, with the exception of Table 3, the precipitation undercatch has been corrected.
Table 3Effect of undercatch correction on estimates of average precipitation (P), Ewb, and their trends (averages over all study catchments in 1977–2014, significant trends for p≤0.05).
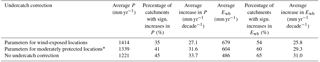
* Parameters for moderately protected locations are used for all other analyses in this paper.
The Ewb estimates were used to estimate ratios of actual E to Emax, the maximum possible evaporation under the actual vegetation when soils are wet. A ratio close to unity would suggest precipitation not to be a likely driver of increases in Ewb. Since the land cover in the study catchments is dominated by forest (average fraction over all study catchments of 0.52), Emax is likely much higher than E0 (e.g., Teuling, 2018). Analyses from non-weighable lysimeters suggest Emax to be 20 %–30 % higher than E0 for sites with pine forests at typical stand ages of 80–100 years compared to sites with grass (ATV-DVWK, 2001). We estimated Emax for each catchment as , where li is the fraction of land cover i and fi is the ratio of Emax∕E0 for land cover i, which was approximated as 1.2 for forests and 1 for all other land cover types. This results in median (upper/lower quantile) values for Ewb∕Emax of 0.84 (0.77/0.91), suggesting that in most catchments, Ewb is significantly lower than Emax. It has to be noted that these estimates are uncertain due to uncertainties in the factor f and the absolute estimates of Ewb.
3.2 Drivers of the increases in evaporation (attribution)
3.2.1 Changes in atmospheric conditions – reference evaporation
Changes in the atmospheric conditions were examined by analyzing E0 and Epan. Averaged over all catchments, annual E0 increased by 18±5 mm yr−1 or 2.8±0.7 % per decade during 1977–2014 (Fig. 3a). Spatial variations in the increase in E0 are small, and there is no significant correlation between trends in Ewb and trends in E0 (r2=0.02, p=0.09) (Fig. 8a). Partial correlations between trends in Ewb and E0 when trends in annual precipitation and the NDVI were accounted for are not significant either.
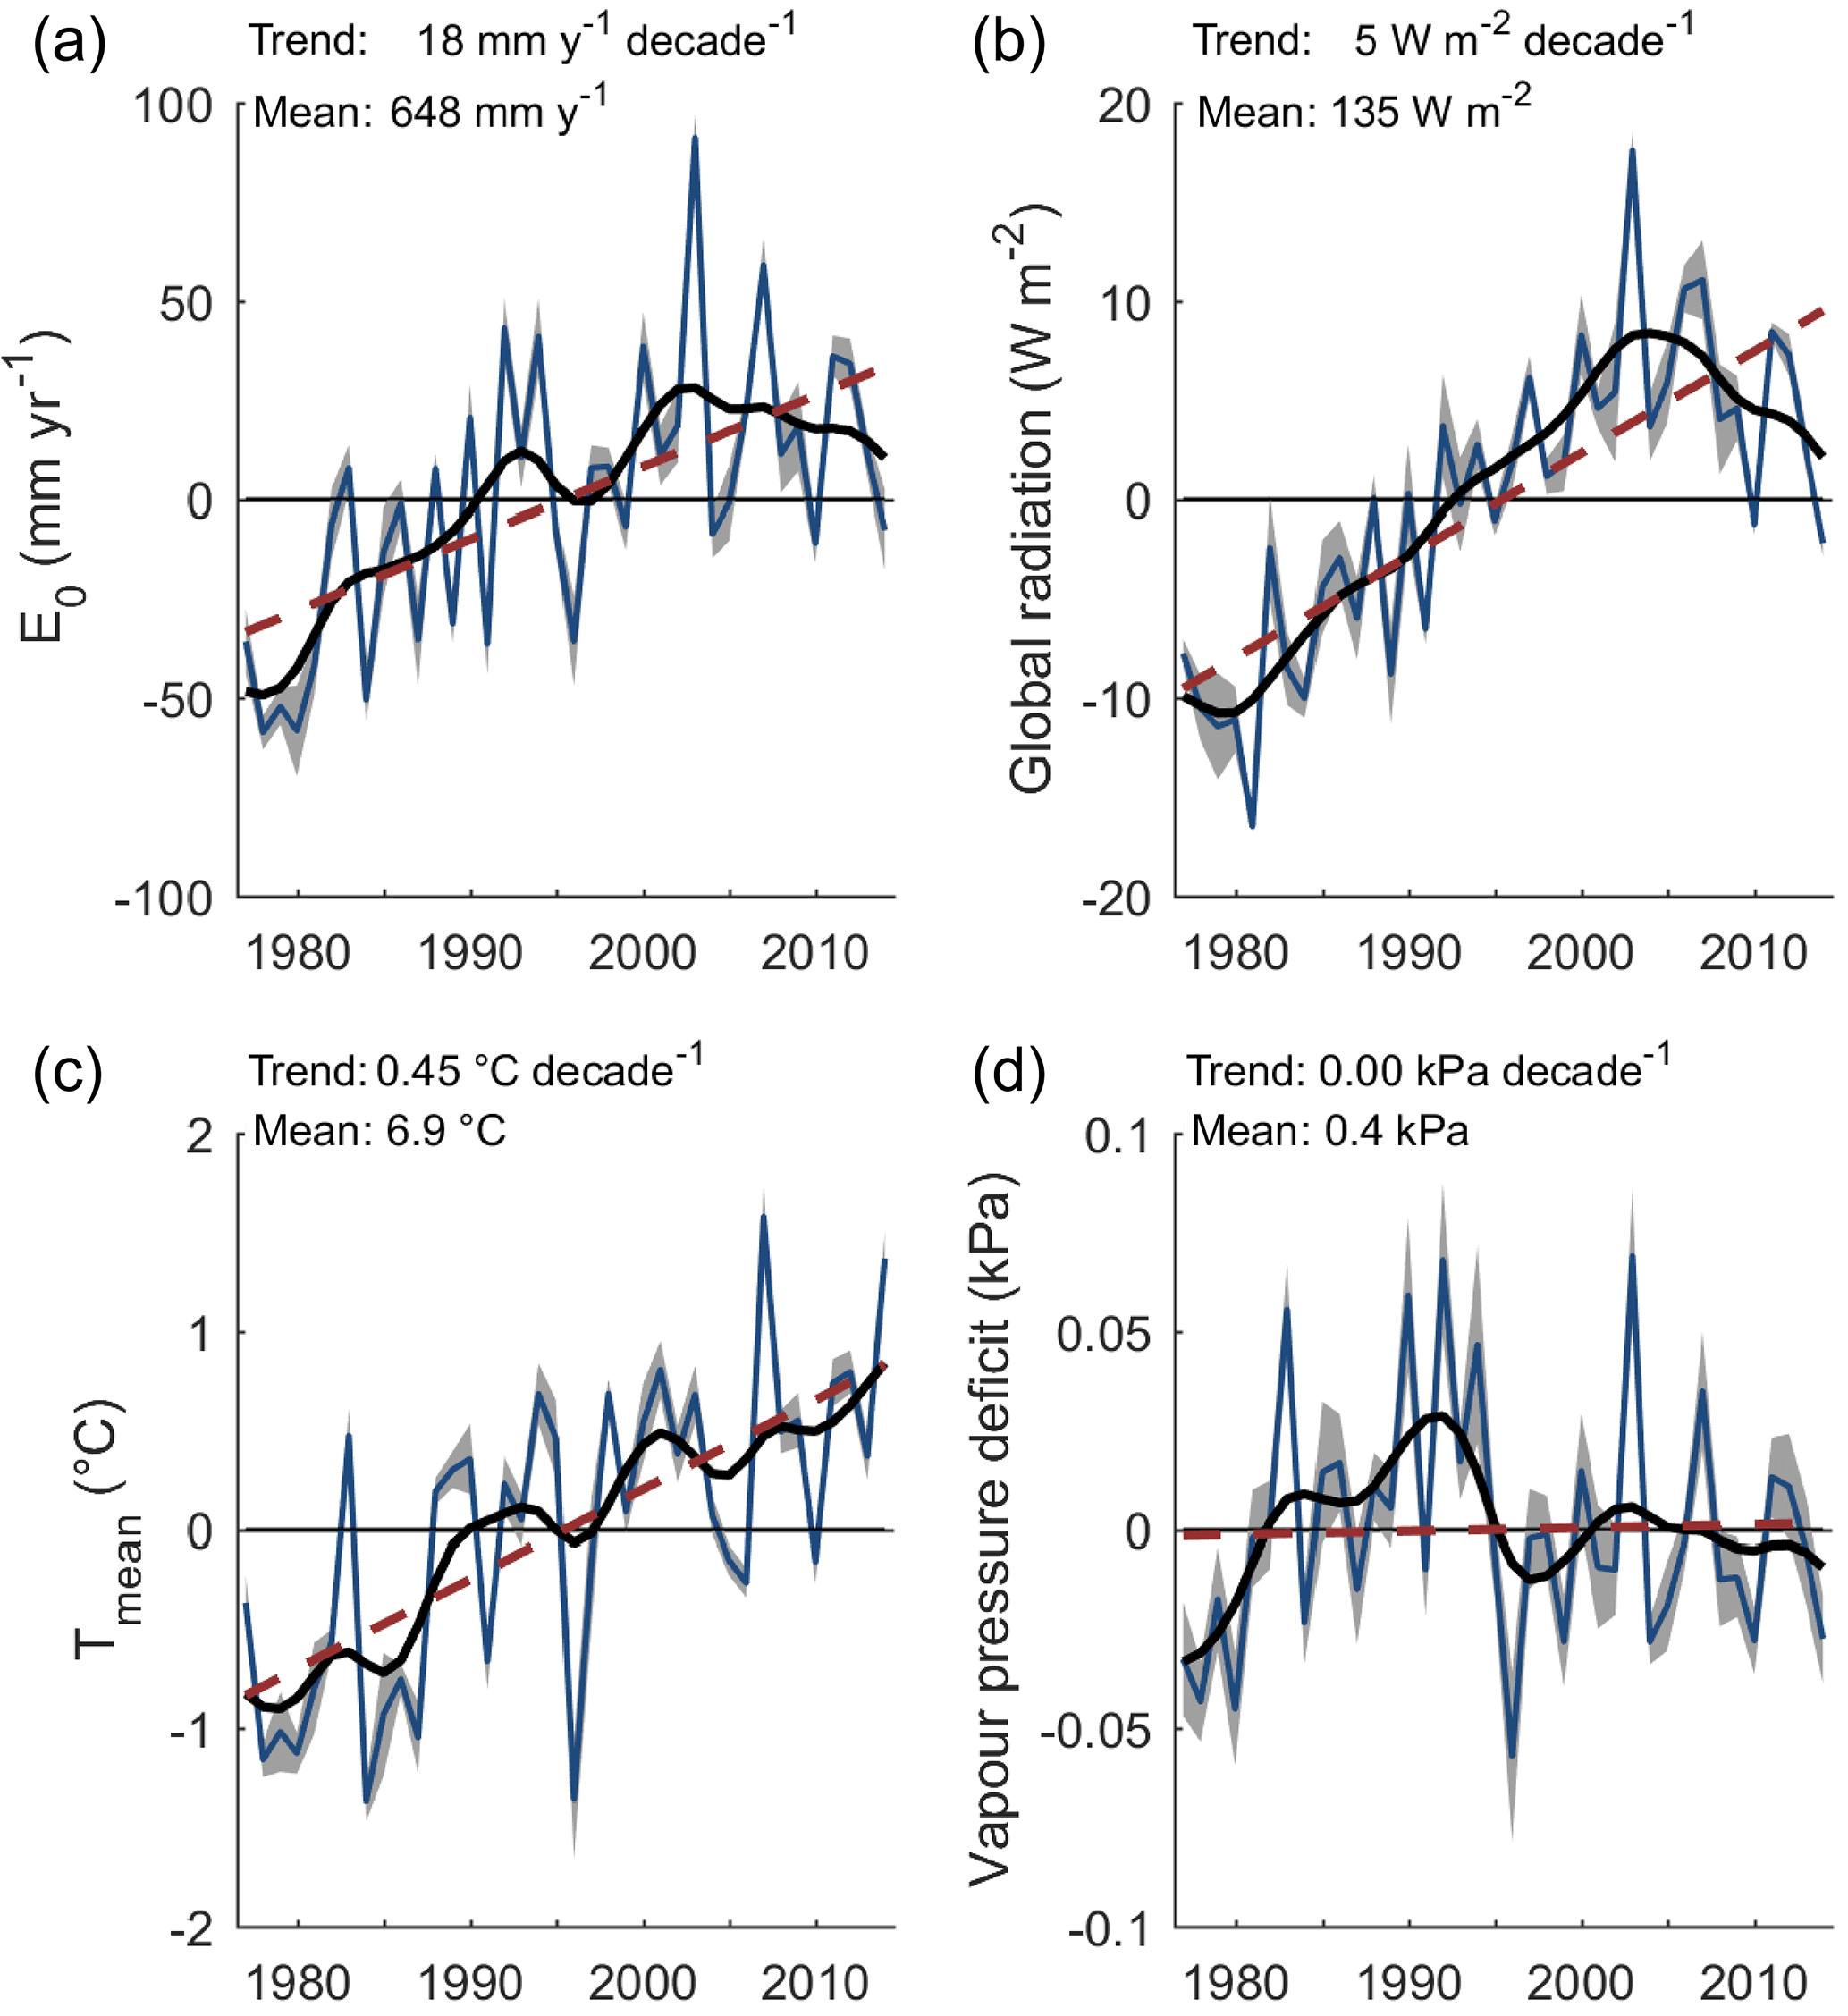
Figure 3Anomalies of (a) E0, (b) global radiation, (c) mean air temperature, (d) vapor pressure deficit over 1977–2014 and all study catchments. The thin blue line shows the mean over all catchments, the grey shaded area the variability between catchments (±1 SD), the bold black line the filtered mean (Gaussian filter with a standard deviation of 2 years), and the dashed red line the linear trend.
Over our study period, global radiation on average increased by 5.1±0.9 W m−2 or 3.8±0.7 % per decade (Fig. 3b). Mean air temperature (calculated as the average of minimum and maximum air temperatures) increased by 0.45±0.09 ∘C decade−1 (Fig. 3c), while vapor pressure deficit showed variations with higher values during the early 1990s but no trend over 1977–2014 (Fig. 3d). The analysis of the E0 estimates with one or several of the input variables held fixed to a particular year showed that the increase in E0 was largely driven by increasing net radiation, which contributed 76±8 % to the trend in E0, and increases in air temperature, which contributed 19±6 % to the trend in E0 (Fig. 4).
A trend analysis of wind speed observations shows large scatter between the stations. Averaged over all stations, wind speeds decreased by % per decade (see Supplement S3). According to a simple analysis, the average trend in E0 reduces to 2.4±0.7 % per decade when allowing for decreasing wind speeds, as compared to 2.8±0.7 % per decade when assuming no trends in wind speed. Thus, negative trends in wind speed probably slightly reduced the effects of the positive trends in global radiation and air temperature on E0.
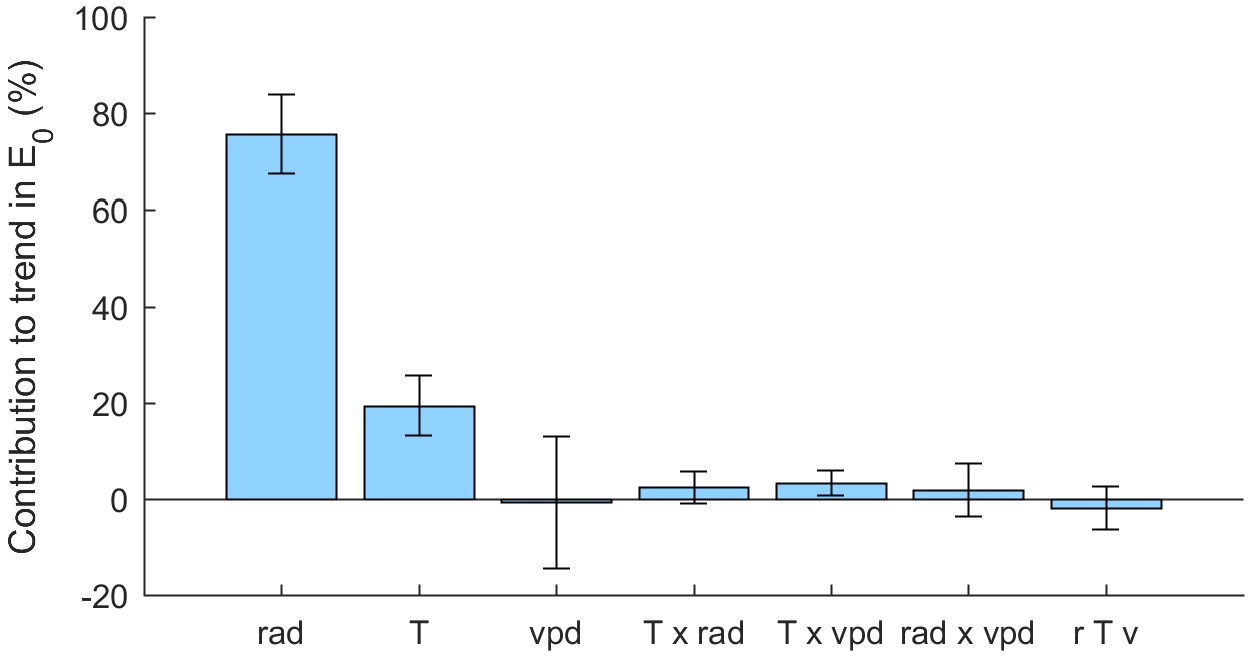
Figure 4Mean contributions of variations in net radiation (rad), air temperature (T) and vapor pressure deficit (vpd) and their two-way and three-way interaction effects on the trend in E0. Bars show means over all catchments and error bars show the standard deviation of the variation between catchments. Percent is relative to trends in E0.
3.2.2 Changes in atmospheric conditions – pan evaporation
Pan evaporation significantly (p≤0.05) increased at 5 of 13 stations over 1979–2005, at 4 of 8 stations over 1983–2014, and at 5 of 16 stations over 1993–2014; there are no significant negative trends (Fig. S9, Table S1) and the regional differences in the trends are small. The average normalized Epan series shows a highly significant (p≤0.01) increase of 29±5 mm yr−1 or 6.0±1.0 % decade−1 over 1977–2014 (Fig. 5).
3.2.3 Changes in vegetation activity
Catchment average NDVI shows a clear seasonal cycle with high values in summer and low values in winter (Figs. 6a and S10). Mean trends in the NDVI over all catchments for 15-day composites are positive nearly over the course of the entire year and are particularly strong during March/April and November/December (Fig. 6b). Timing of the trends is correlated to median catchment elevation. During October–March, positive trends are mostly observed in catchments with low median elevation, while during May–June, this reverses and stronger positive trends are observed in high elevation catchments (Fig. S11). The average and standard deviation over all catchments of the trend in the average annual NDVI is 0.02±0.01 decade−1 or 3.1±1.1 % decade−1.
To estimate the effect of these vegetation changes on E, we calculated E0v with rs estimated based on the original observed NDVI data and E0c with rs based on detrended NDVI data. E0v, which reflects changes in vegetation activity and atmospheric conditions, showed a stronger increase over the study period than E0c, which reflects changes in atmospheric conditions only (Fig. 7a and b). Estimated as average and standard deviation over all catchments and over both approaches for estimating rs, the contribution of changes in atmospheric conditions to the trend in E0v was 56±15 % and the contribution of changes in vegetation to the trend in E0v was 44±15 % (Fig. 7c).
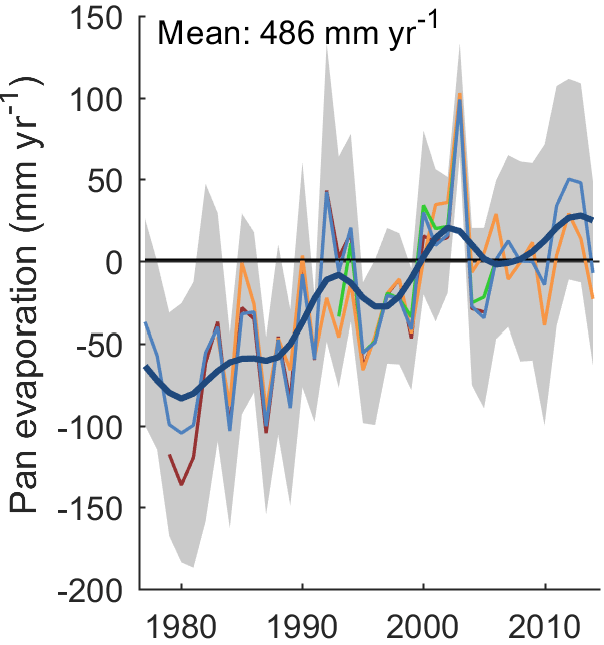
Figure 5Pan evaporation anomalies of 25 stations with a minimum of 20 years available data during 1977–2014. The thin blue line shows the mean, the grey area ±1 SD, and the thick blue line the filtered mean (Gaussian filter with a standard deviation of 2 years). The red (orange, green) lines show means for subsets of stations in 1979–2005 (1983–2014, 1993–2014; maximum of 5 years missing during the period).
Changes in annual cumulative NDVI are not correlated to changes in Ewb (r2=0.01, p=0.23) (Fig. 8b). This was also the case for partial correlations between trends in Ewb and the NDVI, when trends in annual precipitation or trends in E0 were taken into account.
3.2.4 Changes in precipitation
We used annual precipitation as a proxy for the water available for E. Trends in annual precipitation are described in Sect. 3.1. Higher increases in Ewb are observed in catchments with higher increases in annual precipitation (r2=0.24, p<0.0001; Fig. 8c). The trends in precipitation are not related to trends in the NDVI (, p=0.87), which suggests that the relationship between trends in Ewb and trends in precipitation does not include indirect effects of changes in precipitation on trends in Ewb through changes in vegetation activity. Trends in precipitation are also not related to trends in E0 (, p=0.14). A linear regression of the trend in Ewb against the trend in annual precipitation results in a slope of 0.30±0.04. This relationship may however overestimate the influence of changes in precipitation on changes in Ewb, since Ewb is derived from the water balance and trends in Ewb are thus not independent from trends in precipitation. The magnitude of this overestimation effect was estimated using Monte Carlo simulations as 0.08±0.03 (see Supplement S3) and the estimate for the sensitivity of trends in Ewb to trends in precipitation was therefore corrected to 0.22±0.05. This suggests that a 1 mm yr−2 increase in precipitation is associated with a 0.22±0.05 mm yr−2 increase in Ewb. Thus, with an average precipitation trend of 32 mm yr−1 decade−1, on average 6.9±1.6 mm yr−1 decade−1 (uncertainty derived from the standard deviation of the trend slope and the correction value) of the Ewb trend may be related to the increase in precipitation.
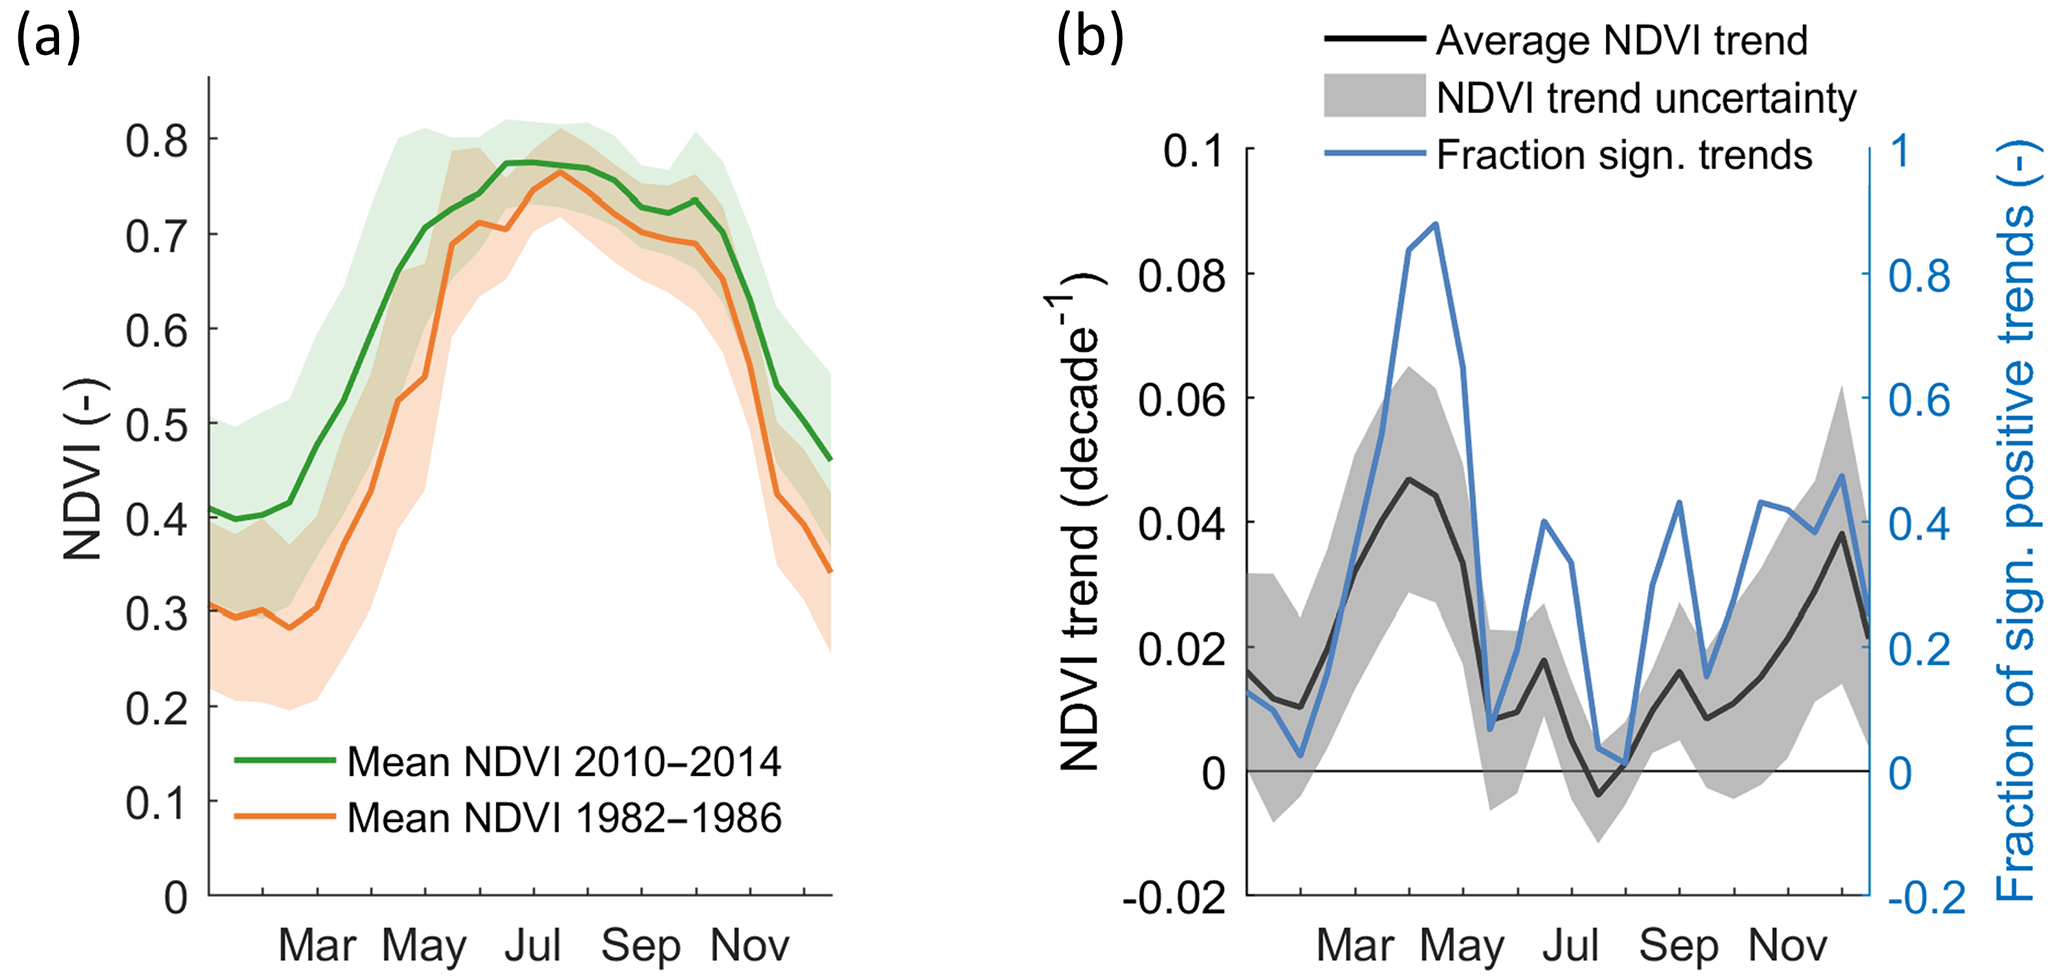
Figure 6Changes in NDVI. (a) Seasonal cycle of NDVI averaged over 1982–1986 and 2010–2014. Solid lines show averages over all catchments and shaded areas show ±1 SD. (b) Seasonal cycle of trends in catchment average NDVI values over 1982–2014. The solid line shows the mean NDVI trend over all catchments, the grey shaded area the spatial variability of the trends between catchments (±1 SD), and the blue line the fraction of significant positive trends (p≤0.05).
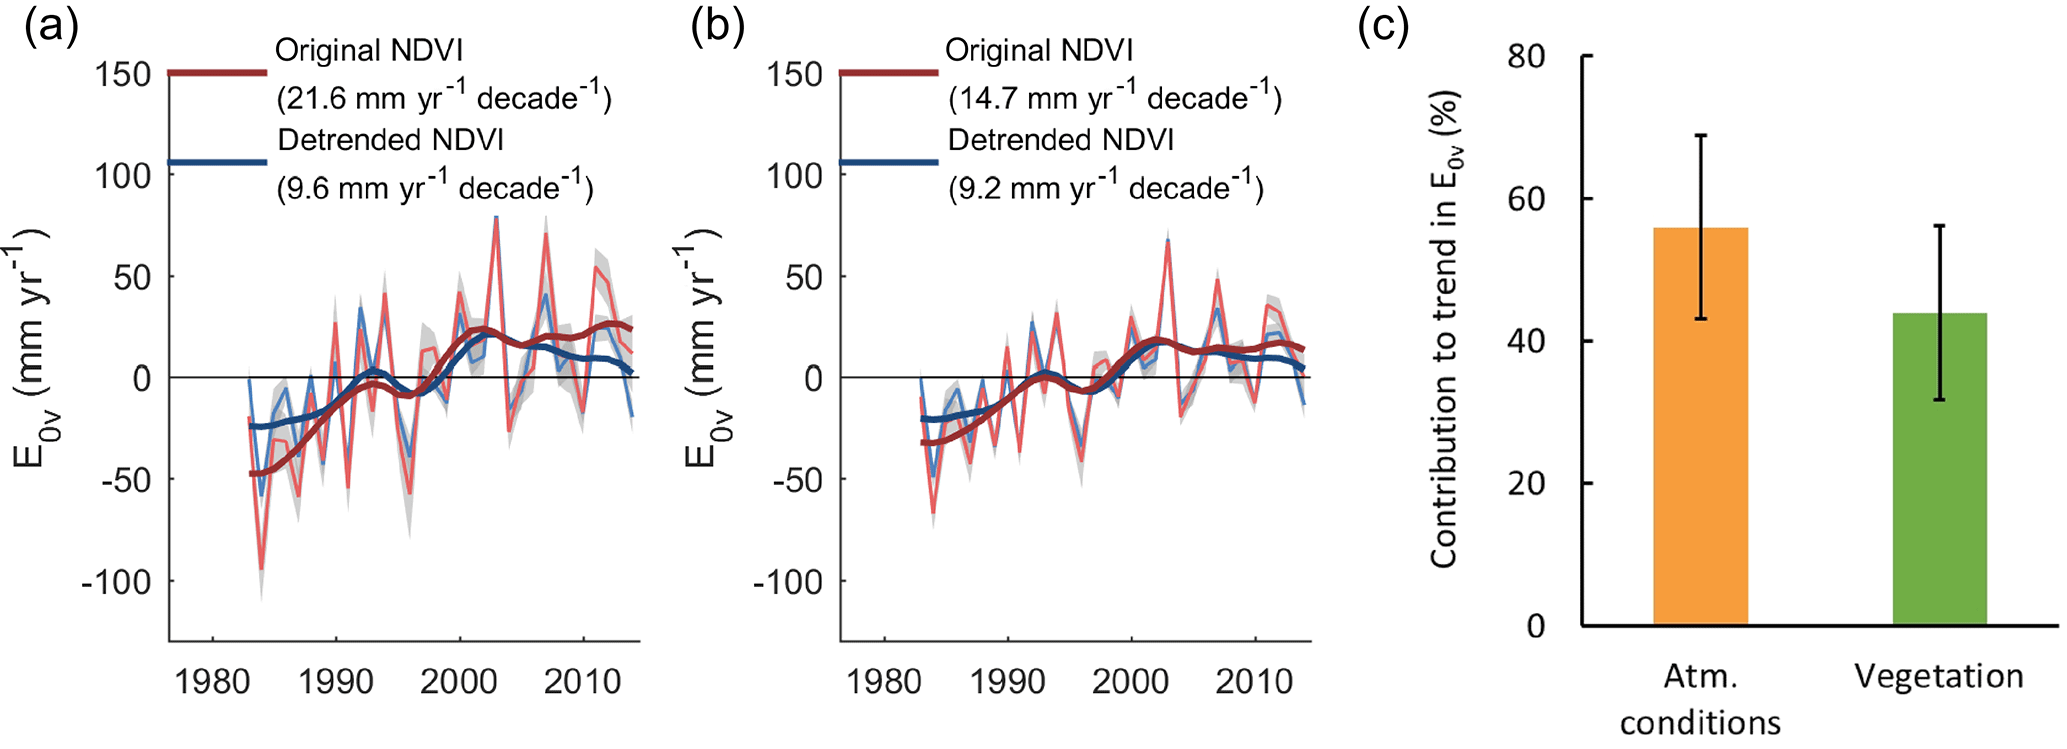
Figure 7Effect of variations in atmospheric conditions and vegetation on E0v. (a, b) Anomalies of E0v with rs estimated from original and detrended NDVI data, with (a) rs estimated based on Sellers et al. (1996) and (b) rs estimated based on Zhang et al. (2010). The thin line shows the mean over all catchments, the grey shaded area shows the variability between catchments (±1 SD), and the thick blue line shows the filtered mean (Gaussian filter with a standard deviation of 2 years). The number in brackets gives the trend estimate over 1982–2014. (c) Contributions of variations in atmospheric conditions and variations in vegetation to the trend in E0v. Bars show means over all catchments and over both approaches for estimating rs and error bars show the variability over all catchments and over both approaches for estimating rs (±1 SD). Percent is relative to trends in E0v.
3.3 Synthesis of attribution
We may now estimate the contributions of the different drivers to the increase in Ewb. The regression of the trend in Ewb against the trend in annual precipitation (Fig. 8c) suggests that, on average, 6.9±1.6 mm yr−1 decade−1 of the Ewb trend of 29.3 mm yr−1 decade−1 may be related to the increase in precipitation (Sect. 3.2.4). The relative contributions of atmospheric conditions and vegetation were assumed to conform to their relative effects on E0v (Sect. 3.2.3, Fig. 7c). Thus the remaining 22.4±1.6 mm yr−1 decade−1 are split at a ratio of 0.56±0.15 to 0.44±0.15 into being due to atmospheric conditions and vegetation, respectively. This results in a contribution of changes in atmospheric conditions of 12.5±4.2 mm yr−1 decade−1 and in a contribution of changes in vegetation of 9.8±4.0 mm yr−1 decade−1. In summary, the data suggest that changes in atmospheric conditions, vegetation activity, and precipitation have contributed 43±15 %, 34±14 %, and 24±5 %, respectively, to the average increase in Ewb in the study catchments (Fig. 9).
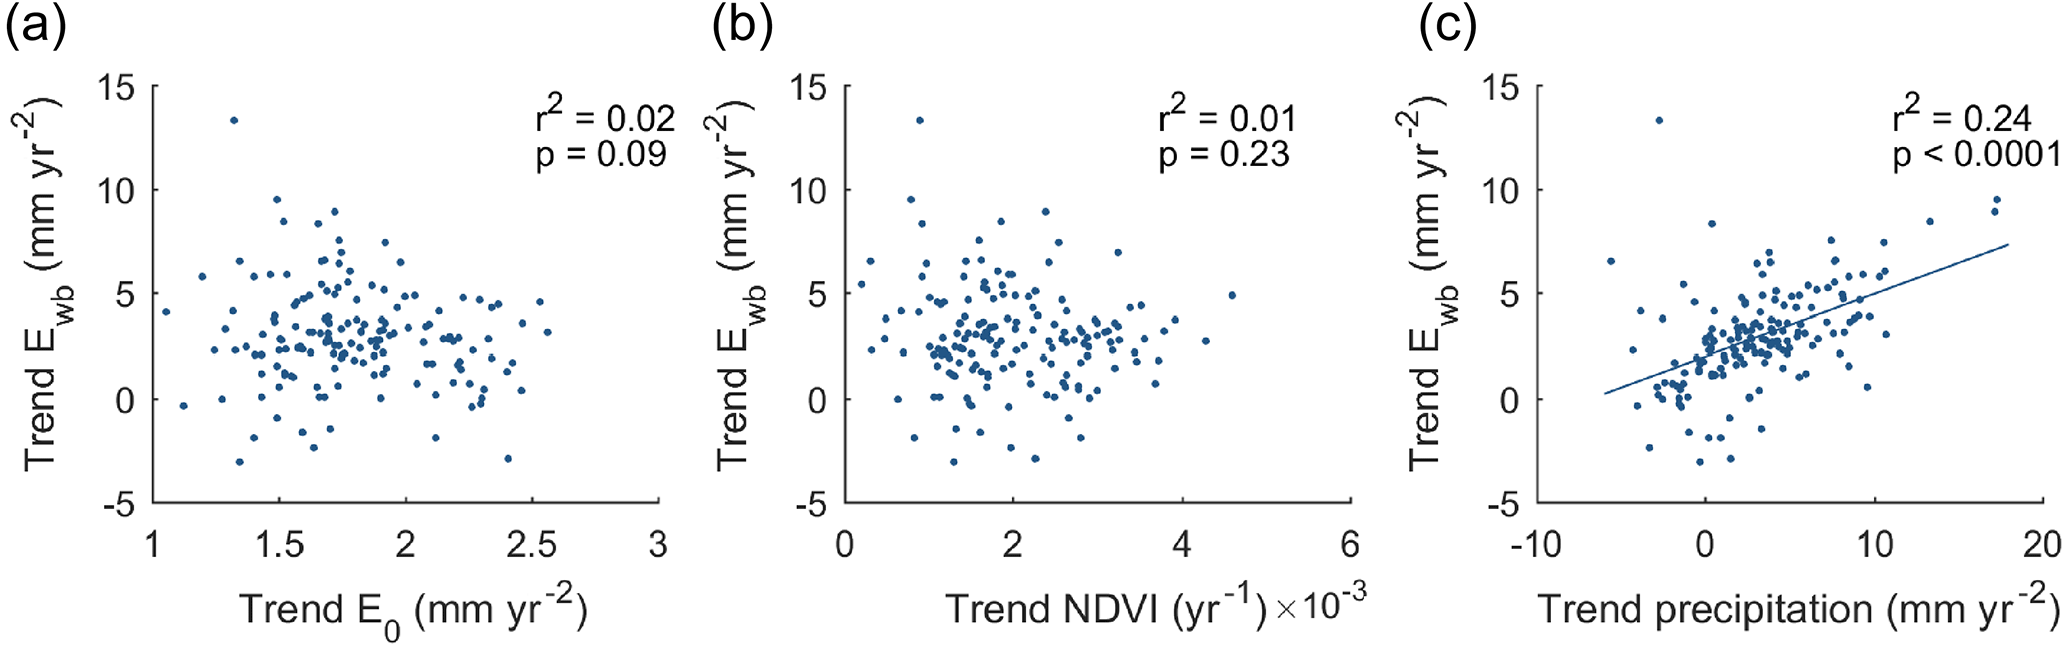
Figure 8Scatter plots of trends in (a) E0, (b) NDVI, and (c) annual precipitation against the trend in Ewb.

Figure 9Average contributions to the average trend of catchment evaporation estimated from the water balance (Ewb) from changes in atmospheric conditions, vegetation activity, and precipitation. Error bars relate to the standard deviation of the estimate. Percent relates to the total average trend of Ewb of 29 mm yr−1 decade−1.
4.1 Changes in catchment evaporation in Austria over the past four decades
Based on the analysis of the water balances, we found an average Ewb increase of 29±14 mm yr−1 decade−1, i.e., a total increase of 108±52 mm yr−1 or 18.0±8.5 % over 37 years. This increase is consistent between the different regions, which points to the importance of drivers with spatially consistent changes across the study region, i.e., global radiation or air temperature rather than changes in precipitation. The increase is strongest in the beginning of the study period and seems to have stopped around 2000. A similar pattern is observed for E0 and E0v (Figs. 3a and 7a, b), where the decreasing tendency in global radiation (Fig. 3b) appears to be the main cause for the decreasing tendency after 2000.
The Ewb estimates could potentially be influenced by changes in groundwater storage. Changes in groundwater storage were assumed small over timescales of decades. This assumption is supported by the absence of general trends in discharge together with the incoherent picture of trends in groundwater levels (Blaschke et al., 2011; Neunteufel et al., 2017), which makes it unlikely that groundwater storage changes have a big influence on the Ewb estimates.
Increases in Ewb of a similar magnitude have also been observed in Switzerland, where Ewb increased by ∼20 mm yr−1 decade−1 over 1977–2007 (Spreafico et al., 2007, from Fig. 1 on plate 6.6). Lower rates of increase in Ewb were observed in other regions and periods. Estimates based on the water balance were 10±5 mm yr−1 decade−1 in several large catchments across the conterminous US during 1950–2000 (Walter et al., 2004), 6±4 mm yr−1 decade−1 in catchments in the eastern US during 1901–2009 (Kramer et al., 2015), and 7 mm yr−1 decade−1 in 16 catchments on the Tibetan Plateau during 1966–2000 (Zhang et al., 2007). The larger increases of E in our study may be related to the large increases in air temperature and global radiation in the study region over the period considered.

4.2 Drivers of the observed changes in catchment evaporation
All three drivers investigated – changes in atmospheric conditions, changes in vegetation activity, and changes in precipitation – are found to be important for the observed increase in catchment evaporation. The drivers are closely interlinked (Fig. 10). For example, an increase in air temperature not only contributes directly to changes in E0 and thus E, but it also contributes indirectly through increases in the vegetation activity. Attributing changes in E to the drivers can therefore be done in different ways. While in this study, vegetation effects on E include land use changes and indirect effects via climate and atmospheric CO2 on vegetation, other studies have treated the indirect effects separately. Using a global biosphere model, Piao et al. (2007) attributed a global change in E of +0.3 mm yr−1 decade−1 during 1901–1999 to climate (+0.7 mm yr−1 decade−1; including indirect effects of climate on vegetation, atmospheric conditions, and precipitation) and land use changes (−0.8 mm yr−1 decade−1; mainly deforestation). Changes in atmospheric CO2 had a further positive effect of +0.4 mm yr−1 decade−1 through increasing the LAI and stomata resistance (Piao et al., 2007). Based on global land surface model simulations, Mao et al. (2015) found that climate effects (including indirect effects of climate on vegetation, atmospheric conditions and precipitation) on E were larger than the effects of land use, atmospheric CO2, and nitrogen deposition during 1982–2013, with precipitation being the most important climate variable. The latter finding is in line with several other studies (Jung et al., 2010; Miralles et al., 2014), although Zhang et al. (2015) found vegetation change (including indirect effects of climate on vegetation) to be more important.
In this study, increases in E driven by changes in atmospheric conditions have been identified by increases in E0 and Epan. The main driver for the increase in E0 in our study is an increase in global radiation of 5.1±0.9 W m−2 decade−1 on average with a further contribution from an increase in mean air temperature of 0.45±0.09 ∘C decade−1. Even though the scatter is large, the data suggest that the predominantly decreasing wind speeds have likely reduced the increase in E0. While attribution studies summarized in McVicar et al. (2012; Table 7) found trends in wind speed to be the most frequent dominant driver for changes in E0 and Epan (followed by air temperature), trends in wind speed play a minor role in our study region. Teuling et al. (2009) and Wang et al. (2010) reported a strong influence of global radiation on changes in E in Europe. Global radiation in Europe generally decreased during the 1960s–1980s (“global dimming”) and increased from the 1980s (“global brightening”) (Norris and Wild, 2007; Wild, 2009; Sanchez-Lorenzo et al., 2015). The magnitude of the increase in the present study (5.1±0.9 W m−2 decade−1) is slightly higher than those reported in other studies (2.0±1.2 W m−2 decade−1 in Central Europe during 1971–2012 found by Sanchez-Lorenzo et al., 2015, and 3.7 W m−2 decade−1 in Austria and Switzerland during 1985–2005 found by Wild et al., 2009). The increases in global radiation over Europe since the mid-1980s have mainly been attributed to the reduction in aerosols (Norris and Wild, 2007). The strong sensitivity of E0 to global radiation suggests that projected air temperature increases do not necessarily imply increased evaporation in the future.
The observed increase in Epan in our study is consistent with other European studies. In Greece, non-significant increases in Epan over 1983–1999 were observed in a pooled series from 14 stations (Papaioannou et al., 2011). Three out of eight sites in Ireland showed a significant increase in Epan over 1963–2005, and one site showed a significant decrease (Stanhill and Möller, 2008). In England, significant increases in Epan were observed at two stations over 1957–2004 and 1986–2010 (Stanhill and Möller, 2008; Clark, 2013), and in the Czech Republic April–June Epan significantly increased at three out of five stations during 1968–2010 (Trnka et al., 2015).
The NDVI data show a marked increase in vegetation activity in Austria, similar to many other studies in the Northern Hemisphere (Myneni et al., 1997; Slayback et al., 2003; Liu et al., 2015). Generally, increases in air temperature and precipitation and CO2 fertilization have been identified as drivers (Piao et al., 2006; Los, 2013). In the study area, trends in precipitation and trends in the NDVI show no significant relationship (), suggesting that increases in precipitation were not important for the changes in vegetation activity. We found strong increases in the NDVI in spring and autumn, indicating a lengthening of the active growing season, which has been noted by Myneni et al. (1997), for example. Increases in the NDVI may be further enhanced by land cover changes. In Austria, the forest area increased from 43 % to 47 % over 1977–2010 at the expense of cropland and extensive grassland (Krausmann et al., 2003; Gingrich et al., 2015), as agricultural land in remote areas with low productivity was abandoned due to economic pressure (Tasser and Tappeiner, 2002; Rutherford et al., 2008).
According to our study, the effect of increased vegetation activity on E0v is of a similar magnitude to the effect of changes in the atmospheric conditions. A strong influence of changes in vegetation activity on E was also suggested for the eastern US, based on correlations between the NDVI and Ewb (Kramer et al., 2015). In two forested catchments in the southern Appalachians, the indirect effects of climate on vegetation dynamics were found to be much more important drivers for long-term increases in E (plus potential storage changes) than direct climate impacts (Hwang et al., 2018). Using simulations from a global, coupled biosphere–atmosphere model, Bounoua et al. (2000) found an E increase of 43 mm yr−1 for an NDVI increase of 0.08, which is slightly higher than the average NDVI increase observed in this study of 0.06. Our study, however, does not account for the effect of increasing atmospheric CO2 concentrations on increasing stomata resistance, which means that the effect of vegetation might be overestimated. Stomata closure due to increased atmospheric CO2 may have reduced global E since 1960 by 1.6 to 2.0 mm yr−1 decade−1 (Gedney et al., 2006; Piao et al., 2007).
Even though the study area can generally be classified as humid, we found a strong influence of changes in precipitation on changes in E. E is generally energy-limited in the study region (Sect. 2.1.1). However, as indicated by Ewb∕Emax ratios smaller than unity, E may frequently be limited by available moisture, particularly interception and E from the soil and non-vegetated areas. Thus, an increase in precipitation can lead to an increase in E. One reason for the strong sensitivity of changes in E to the increases in annual precipitation is the seasonality of the observed changes in precipitation. Increases in precipitation were concentrated in the summer season and changes in summer precipitation are expected to contribute more strongly to changes in E, as this is the period when E is highest, whereas changes in winter precipitation more likely result in changes in discharge. It should be noted that the strength of the relationship between changes in E and changes in precipitation would be overestimated if there were artifacts in the trends of the precipitation data, due to inconsistent record lengths, for example. In this study, consistent record lengths were used. Several studies around the world, in particular in the tropics, identified precipitation as an important factor for changes in E (Jung et al., 2010; Miralles et al., 2014; Mao et al., 2015).
Over the past four decades (1977–2014), catchment evaporation increased on average over 156 study catchments in Austria by 29±14 mm yr−1 decade−1. This increase was attributed to changes in atmospheric demand and available energy (suggested to account for 12.5±4.2 mm yr−1 decade−1), changes in vegetation (9.8±4.0 mm yr−1 decade−1), and changes in precipitation (6.9±1.6 mm yr−1 decade−1).
E0 increased on average over all study catchments by 18±5 mm yr−1 decade−1. The increase in E0 was largely driven by the increase in global radiation with further contributions from increasing air temperature. Rising atmospheric demand and energy available for E was also revealed by increases in the available Epan data. Satellite-derived NDVI data for 1982–2014 indicate an increase in vegetation activity. This increase may have led to a similar increase of E0v as the increase due to the climate variables. A positive correlation between increases in E and increases in precipitation furthermore points to increases in water availability as a third driver for the increases in Ewb.
Over the study period, trends in annual discharge were close to zero, and increases in E were balanced by increases in precipitation. If the increase in precipitation had been lower and the increase in E had been similar as in this study, notable reductions in discharge would have been likely. A lower increase in precipitation would likely have reduced the increase in E as 24±5 % of the E increase was directly attributed to the increase in precipitation.
Estimates of future changes in E of climate impact assessments are often based on predicted air temperature and precipitation changes. This study clearly shows that, despite the large air temperature increase in the recent decades, global radiation was much more important for changes in E0 than air temperature. Potential future changes in global radiation, due to changes in cloud cover or air pollution, for example, should therefore explicitly be accounted for in climate impact studies on E. Furthermore, hydrologic models used in such studies should consider the effects of possible changes in vegetation on E, which result from a longer growing period, for example.
The discharge data can be accessed through https://ehyd.gv.at/ (last access: 26 September 2018). The meteorological data from ZAMG are currently not freely available; requests should be directed to klima@zamg.ac.at. The Corine land cover map can be downloaded from https://www.eea.europa.eu/data-and-maps/data/clc-2000-vector-6 (last access: 26 September 2018). The SRTM DEM can be obtained from http://srtm.csi.cgiar.org (last access: 26 September 2018).
The supplement related to this article is available online at: https://doi.org/10.5194/hess-22-5143-2018-supplement.
DD conceived and designed the study, performed the analyses, and prepared the manuscript. GB contributed to the study design, interpretation of the results, and writing of the manuscript.
The authors declare that they have no conflict of interest.
We gratefully acknowledge the financial support from the DFG (German Research
Foundation) through a research scholarship to Doris Duethmann (DU 1595/1-1).
We would like to thank the Austrian Hydrographic Services and the ZAMG for
providing the hydrographic and meteorological data and Juraj Parajka
for useful suggestions on processing the data. We would also
like to thank Axel Thomas, Ryan Teuling, and two anonymous referees, whose
comments improved the quality of the manuscript.
Edited by: Harrie-Jan Hendricks Franssen
Reviewed by: Ryan Teuling and two anonymous referees
Allen, R. G., Pereira, L. S., Raes, D., and Smith, M.: Crop evapotranspiration – Guidelines for computing crop water requirements, FAO Irrigation and drainage paper 56, FAO, Rome, 300, D05109, 1998.
ATV-DVWK: Verdunstung in Bezug zu Landnutzung, Bewuchs und Boden, GFA-Ges. zur Förderung d. Abwassertechnik e.V., Hennef, Germany, 2001.
Auer, I., Böhm, R., Jurkovic, A., Lipa, W., Orlik, A., Potzmann, R., Schöner, W., Ungersbock, M., Matulla, C., Briffa, K., Jones, P., Efthymiadis, D., Brunetti, M., Nanni, T., Maugeri, M., Mercalli, L., Mestre, O., Moisselin, J. M., Begert, M., Muller-Westermeier, G., Kveton, V., Bochnicek, O., Stastny, P., Lapin, M., Szalai, S., Szentimrey, T., Cegnar, T., Dolinar, M., Gajic-Capka, M., Zaninovic, K., Majstorovic, Z., and Nieplova, E.: HISTALP – historical instrumental climatological surface time series of the Greater Alpine Region, Int. J. Climatol., 27, 17–46, https://doi.org/10.1002/joc.1377, 2007.
Blaschke, A., Merz, R., Parajka, J., Salinas, J., and Blöschl, G.: Auswirkungen des Klimawandels auf das Wasserdargebot von Grund- und Oberflächenwasser, Österreichische Wasser-und Abfallwirtschaft, 63, 31–41, 2011.
Böhm, R.: Heisse Luft: Reizwort Klimawandel: Fakten, Ängste, Geschäfte, Va Bene, Wien, Klosterneuburg, 2008.
Bounoua, L., Collatz, G. J., Los, S. O., Sellers, P. J., Dazlich, D. A., Tucker, C. J., and Randall, D. A.: Sensitivity of climate to changes in NDVI, J. Climate, 13, 2277–2292, https://doi.org/10.1175/1520-0442(2000)013<2277:soctci>2.0.co;2, 2000.
Brutsaert, W.: Use of pan evaporation to estimate terrestrial evaporation trends: The case of the Tibetan Plateau, Water Resour. Res., 49, 3054–3058, https://doi.org/10.1002/wrcr.20247, 2013.
Brutsaert, W. and Parlange, M. B.: Hydrologic cycle explains the evaporation paradox, Nature, 396, p. 30, https://doi.org/10.1038/23845, 1998.
Budyko, M. I.: Climate and Life, Academic Press, New York, 1974.
Clark, C.: Measurements of actual and pan evaporation in the upper Brue catchment UK: the first 25 years, Weather, 68, 200–208, 2013.
Dong, B. and Dai, A. G.: The uncertainties and causes of the recent changes in global evapotranspiration from 1982 to 2010, Clim. Dynam., 49, 279–296, https://doi.org/10.1007/s00382-016-3342-x, 2017.
Douville, H., Ribes, A., Decharme, B., Alkama, R., and Sheffield, J.: Anthropogenic influence on multidecadal changes in reconstructed global evapotranspiration, Nat. Clim. Change, 3, 59–62, https://doi.org/10.1038/nclimate1632, 2013.
European Environment Agency: Corine Land Cover 2000 seamless vector data, Version 18.5, Kopenhagen, Denmark, 2016.
Galbraith, D., Levy, P. E., Sitch, S., Huntingford, C., Cox, P., Williams, M., and Meir, P.: Multiple mechanisms of Amazonian forest biomass losses in three dynamic global vegetation models under climate change, New Phytol., 187, 647–665, https://doi.org/10.1111/j.1469-8137.2010.03350.x, 2010.
Gedney, N., Cox, P. M., Betts, R. A., Boucher, O., Huntingford, C., and Stott, P. A.: Detection of a direct carbon dioxide effect in continental river runoff records, Nature, 439, 835–838, https://doi.org/10.1038/nature04504, 2006.
Gingrich, S., Niedertscheider, M., Kastner, T., Haberl, H., Cosor, G., Krausmann, F., Kuemmerle, T., Müller, D., Reith-Musel, A., and Jepsen, M. R.: Exploring long-term trends in land use change and aboveground human appropriation of net primary production in nine European countries, Land Use Policy, 47, 426–438, 2015.
Hiebl, J. and Frei, C.: Daily temperature grids for Austria since 1961 – concept, creation and applicability, Theor. Appl. Climatol., 124, 161–178, https://doi.org/10.1007/s00704-015-1411-4, 2016.
Hiebl, J. and Frei, C.: Daily precipitation grids for Austria since 1961 – development and evaluation of a spatial dataset for hydroclimatic monitoring and modelling, Theor. Appl. Climatol., 132, 327–345, https://doi.org/10.1007/s00704-017-2093-x, 2018.
Huntington, T. G.: Evidence for intensification of the global water cycle: Review and synthesis, J. Hydrol., 319, 83–95, https://doi.org/10.1016/j.jhydrol.2005.07.003, 2006.
Hwang, T., Martin, K. L., Vose, J. M., Wear, D., Miles, B., Kim, Y., and Band, L. E.: Nonstationary hydrologic behavior in forested watersheds is mediated by climate-induced changes in growing season length and subsequent vegetation growth, Water Resour. Res., 54, 1–17, https://doi.org/10.1029/2017WR022279, 2018.
Hydrographischen Zentralbüro: Anleitung zur Bearbeitung von meteorologischen Parametern zur Erfassung des Wasserkreislaufes im Rahmen des Hydrographischen Dienstes in Österreich, Vienna, 1996.
Jarvis, A., Reuter, H. I., Nelson, A., and Guevara, E.: Holefilled seamless SRTM data, 4th Edn., International Centre for Tropical Agriculture (CIAT), Cali, Colombia, 2008.
Jung, M., Reichstein, M., Ciais, P., Seneviratne, S. I., Sheffield, J., Goulden, M. L., Bonan, G., Cescatti, A., Chen, J. Q., de Jeu, R., Dolman, A. J., Eugster, W., Gerten, D., Gianelle, D., Gobron, N., Heinke, J., Kimball, J., Law, B. E., Montagnani, L., Mu, Q. Z., Mueller, B., Oleson, K., Papale, D., Richardson, A. D., Roupsard, O., Running, S., Tomelleri, E., Viovy, N., Weber, U., Williams, C., Wood, E., Zaehle, S., and Zhang, K.: Recent decline in the global land evapotranspiration trend due to limited moisture supply, Nature, 467, 951–954, https://doi.org/10.1038/nature09396, 2010.
Kendall, M. G.: Rank correlation methods, 4th Edn., Charles Griffin, London, 196 pp., 1975.
Kramer, R. J., Bounoua, L., Zhang, P., Wolfe, R. E., Huntington, T. G., Imhoff, M. L., Thome, K., and Noyce, G. L.: Evapotranspiration trends over the eastern United States during the 20th century, Hydrology, 2, 93–111, 2015.
Krausmann, F., Haberl, H., Schulz, N. B., Erb, K.-H., Darge, E., and Gaube, V.: Land-use change and socio-economic metabolism in Austria – Part I: driving forces of land-use change: 1950–1995, Land Use Policy, 20, 1–20, 2003.
Liu, W. B., Wang, L., Zhou, J., Li, Y. Z., Sun, F. B., Fu, G. B., Li, X. P., and Sang, Y. F.: A worldwide evaluation of basin-scale evapotranspiration estimates against the water balance method, J. Hydrol., 538, 82–95, https://doi.org/10.1016/j.jhydrol.2016.04.006, 2016.
Liu, Y., Li, Y., Li, S. C., and Motesharrei, S.: Spatial and temporal patterns of global NDVI trends: Correlations with climate and human factors, Remote Sensing, 7, 13233–13250, https://doi.org/10.3390/rs71013233, 2015.
Los, S. O.: Analysis of trends in fused AVHRR and MODIS NDVI data for 1982–2006: Indication for a CO2 fertilization effect in global vegetation, Global Biogeochem. Cy., 27, 318–330, https://doi.org/10.1002/gbc.20027, 2013.
Mann, H.: Non-parametric test against trend, Econometrica, 13, 245–259, 1945.
Mao, J. F., Fu, W. T., Shi, X. Y., Ricciuto, D. M., Fisher, J. B., Dickinson, R. E., Wei, Y. X., Shem, W., Piao, S. L., Wang, K. C., Schwalm, C. R., Tian, H. Q., Mu, M. Q., Arain, A., Ciais, P., Cook, R., Dai, Y. J., Hayes, D., Hoffman, F. M., Huang, M. Y., Huang, S., Huntzinger, D. N., Ito, A., Jain, A., King, A. W., Lei, H. M., Lu, C. Q., Michalak, A. M., Parazoo, N., Peng, C. H., Peng, S. S., Poulter, B., Schaefer, K., Jafarov, E., Thornton, P. E., Wang, W. L., Zeng, N., Zeng, Z. Z., Zhao, F., Zhu, Q. A., and Zhu, Z. C.: Disentangling climatic and anthropogenic controls on global terrestrial evapotranspiration trends, Environ. Res. Lett., 10, 1–13, https://doi.org/10.1088/1748-9326/10/9/094008, 2015.
Matulla, C.: Regional, seasonal and predictor-optimized downscaling to provide groups of local scale scenarios in the complex structured terrain of Austria, Meteorol. Z., 14, 31–45, https://doi.org/10.1127/0941-2948/2005/0014-0031, 2005.
Matulla, C., Penlap, E. K., Haas, P., and Formayer, H.: Comparative analysis of spatial and seasonal variability: Austrian precipitation during the 20th century, Int. J. Climatol., 23, 1577–1588, https://doi.org/10.1002/joc.960, 2003.
McVicar, T. R., Roderick, M. L., Donohue, R. J., Li, L. T., Van Niel, T. G., Thomas, A., Grieser, J., Jhajharia, D., Himri, Y., Mahowald, N. M., Mescherskaya, A. V., Kruger, A. C., Rehman, S., and Dinpashoh, Y.: Global review and synthesis of trends in observed terrestrial near-surface wind speeds: Implications for evaporation, J. Hydrol., 416, 182–205, https://doi.org/10.1016/j.jhydrol.2011.10.024, 2012.
Milly, P. C. D. and Dunne, K. A.: Trends in evaporation and surface cooling in the Mississippi River basin, Geophys. Res. Lett., 28, 1219–1222, https://doi.org/10.1029/2000gl012321, 2001.
Miralles, D. G., van den Berg, M. J., Gash, J. H., Parinussa, R. M., de Jeu, R. A. M., Beck, H. E., Holmes, T. R. H., Jimenez, C., Verhoest, N. E. C., Dorigo, W. A., Teuling, A. J., and Dolman, A. J.: El Nino-La Nina cycle and recent trends in continental evaporation, Nat. Clim. Change, 4, 122–126, https://doi.org/10.1038/nclimate2068, 2014.
Myneni, R. B., Keeling, C. D., Tucker, C. J., Asrar, G., and Nemani, R. R.: Increased plant growth in the northern high latitudes from 1981 to 1991, Nature, 386, 698–702, https://doi.org/10.1038/386698a0, 1997.
Neunteufel, R., Schmidt, B.-J., and Perfler, R.: Ressourcenverfügbarkeit und Bedarfsplanung auf Basis geänderter Rahmenbedingungen, Österreichische Wasser- und Abfallwirtschaft, 69, 214–224, 2017.
Neuwirth, F.: Die Bestimmung der Verdunstung freier Wasserflächen aus längerfristigen Mittelwerten, Arch. Met. Geoph. Biokl. Ser. B., 25, 337–344 1978.
Norris, J. R. and Wild, M.: Trends in aerosol radiative effects over Europe inferred from observed cloud cover, solar “dimming” and solar “brightening”, J. Geophys. Res.-Atmos., 112, D08214, https://doi.org/10.1029/2006jd007794, 2007.
Papaioannou, G., Kitsara, G., and Athanasatos, S.: Impact of global dimming and brightening on reference evapotranspiration in Greece, J. Geophys. Res.-Atmos., 116, D09107, https://doi.org/10.1029/2010jd015525, 2011.
Parajka, J., Merz, R., and Blöschl, G.: Regionale Wasserbilanzkomponenten für Österreich auf Tagesbasis, Österreichische Wasser- und Abfallwirtschaft, 57, 43–56, 2005.
Peterson, T. C., Golubev, V. S., and Groisman, P. Y.: Evaporation losing its strength, Nature, 377, 687–688, https://doi.org/10.1038/377687b0, 1995.
Piao, S. L., Friedlingstein, P., Ciais, P., Zhou, L. M., and Chen, A. P.: Effect of climate and CO2 changes on the greening of the Northern Hemisphere over the past two decades, Geophys. Res. Lett., 33, L23402, https://doi.org/10.1029/2006gl028205, 2006.
Piao, S. L., Friedlingstein, P., Ciais, P., de Noblet-Ducoudre, N., Labat, D., and Zaehle, S.: Changes in climate and land use have a larger direct impact than rising CO2 on global river runoff trends, P. Natl. Acad. Sci. USA, 104, 15242–15247, https://doi.org/10.1073/pnas.0707213104, 2007.
Richter, D.: Ergebnisse methodischer Untersuchungen zur Korrektur des systematischen Messfehlers des Hellmann-Niederschlagsmessers, Selbstverl. des Dt. Wetterdienstes, Offenbach, 1995.
Roderick, M. L. and Farquhar, G. D.: The cause of decreased pan evaporation over the past 50 years, Science, 298, 1410–1411, 2002.
Roderick, M. L., Rotstayn, L. D., Farquhar, G. D., and Hobbins, M. T.: On the attribution of changing pan evaporation, Geophys. Res. Lett., 34, L17403, https://doi.org/10.1029/2007gl031166, 2007.
Roderick, M. L., Hobbins, M., and Farquhar, G.: Pan evaporation trends and the terrestrial water balance. I. Principles and observations, Geogr. Compass, 3, 746–760, 2009.
Rutherford, G. N., Bebi, P., Edwards, P. J., and Zimmermann, N. E.: Assessing land-use statistics to model land cover change in a mountainous landscape in the European Alps, Ecol. Model., 212, 460–471, https://doi.org/10.1016/j.ecolmodel.2007.10.050, 2008.
Sanchez-Lorenzo, A., Wild, M., Brunetti, M., Guijarro, J. A., Hakuba, M. Z., Calbo, J., Mystakidis, S., and Bartok, B.: Reassessment and update of long-term trends in downward surface shortwave radiation over Europe (1939–2012), J. Geophys. Res.-Atmos., 120, 9555–9569, https://doi.org/10.1002/2015jd023321, 2015.
Sellers, P. J., Los, S. O., Tucker, C. J., Justice, C. O., Dazlich, D. A., Collatz, G. J., and Randall, D. A.: A revised land surface parameterization (SiB2) for atmospheric GCMs – 2. The generation of global fields of terrestrial biophysical parameters from satellite data, J. Climate, 9, 706–737, https://doi.org/10.1175/1520-0442(1996)009<0706:arlspf>2.0.co;2, 1996.
Sen, P. K.: Estimates of the regression coefficient based on Kendall's tau, J. Am. Stat. Assoc., 63, 1379-1389, 1968.
Slayback, D. A., Pinzon, J. E., Los, S. O., and Tucker, C. J.: Northern hemisphere photosynthetic trends 1982–99, Global Change Biol., 9, 1–15, https://doi.org/10.1046/j.1365-2486.2003.00507.x, 2003.
Spreafico, M., Weingartner, R., and Leibundgut, C.: Hydrologischer Atlas der Schweiz (Kartenmaterial), Bundesamt für Landestopografie swisstopo, Wabern, Switzerland, 2007.
Stanhill, G.,and Möller, M.: Evaporative climate change in the British Isles, Int. J. Climatol., 28, 1127–1137, https://doi.org/10.1002/joc.1619, 2008.
Tasser, E. and Tappeiner, U.: Impact of land use changes on mountain vegetation, Appl. Veg. Sci., 5, 173–184, https://doi.org/10.1658/1402-2001(2002)005[0173:ioluco]2.0.co;2, 2002.
Teuling, A. J.: A forest evapotranspiration paradox investigated using lysimeter data, Vadose Zone J., 17, 170031, https://doi.org/10.2136/vzj2017.01.0031, 2018.
Teuling, A. J., Hirschi, M., Ohmura, A., Wild, M., Reichstein, M., Ciais, P., Buchmann, N., Ammann, C., Montagnani, L., Richardson, A. D., Wohlfahrt, G., and Seneviratne, S. I.: A regional perspective on trends in continental evaporation, Geophys. Res. Lett., 36, L02404, https://doi.org/10.1029/2008gl036584, 2009.
Trnka, M., Brazdil, R., Balek, J., Semeradova, D., Hlavinka, P., Mozny, M., Stepanek, P., Dobrovolny, P., Zahradnicek, P., Dubrovsky, M., Eitzinger, J., Fuchs, B., Svoboda, M., Hayes, M., and Zalud, Z.: Drivers of soil drying in the Czech Republic between 1961 and 2012, Int. J. Climatol., 35, 2664–2675, https://doi.org/10.1002/joc.4167, 2015.
Tucker, C. J., Pinzon, J. E., Brown, M. E., Slayback, D. A., Pak, E. W., Mahoney, R., Vermote, E. F., and El Saleous, N.: An extended AVHRR 8-km NDVI dataset compatible with MODIS and SPOT vegetation NDVI data, Int. J. Remote Sens., 26, 4485–4498, https://doi.org/10.1080/01431160500168686, 2005.
Ukkola, A. M. and Prentice, I. C.: A worldwide analysis of trends in water-balance evapotranspiration, Hydrol. Earth Syst. Sci., 17, 4177–4187, https://doi.org/10.5194/hess-17-4177-2013, 2013.
Viglione, A., Parajka, J., Rogger, M., Salinas, J. L., Laaha, G., Sivapalan, M., and Blöschl, G.: Comparative assessment of predictions in ungauged basins – Part 3: Runoff signatures in Austria, Hydrol. Earth Syst. Sci., 17, 2263–2279, https://doi.org/10.5194/hess-17-2263-2013, 2013.
Walter, M. T., Wilks, D. S., Parlange, J. Y., and Schneider, R. L.: Increasing evapotranspiration from the conterminous United States, J. Hydrometeorol., 5, 405–408, https://doi.org/10.1175/1525-7541(2004)005<0405:ieftcu>2.0.co;2, 2004.
Wang, K. C. and Dickinson, R. E.: A review of global terrestrial evapotranspiration: observation, modeling, climatology, and climatic variability, Rev. Geophys., 50, RG2005, https://doi.org/10.1029/2011rg000373, 2012.
Wang, K. C., Dickinson, R. E., Wild, M., and Liang, S. L.: Evidence for decadal variation in global terrestrial evapotranspiration between 1982 and 2002: 2. Results, J. Geophys. Res.-Atmos., 115, D20113, https://doi.org/10.1029/2010jd013847, 2010.
Wild, M.: Global dimming and brightening: A review, J. Geophys. Res.-Atmos., 114, D00D16, https://doi.org/10.1029/2008jd011470, 2009.
Wild, M., Truessel, B., Ohmura, A., Long, C. N., Konig-Langlo, G., Dutton, E. G., and Tsvetkov, A.: Global dimming and brightening: An update beyond 2000, J. Geophys. Res.-Atmos., 114, D00D13, https://doi.org/10.1029/2008jd011382, 2009.
Yue, S., Pilon, P., Phinney, B., and Cavadias, G.: The influence of autocorrelation on the ability to detect trend in hydrological series, Hydrol. Process., 16, 1807–1829, 2002.
ZAMG: Jahrbücher der Zentralanstalt für Meteorologie und Geodynamik, Wien, 1977–1990.
Zhang, K., Kimball, J. S., Nemani, R. R., and Running, S. W.: A continuous satellite-derived global record of land surface evapotranspiration from 1983 to 2006, Water Resour. Res., 46, W09522, https://doi.org/10.1029/2009wr008800, 2010.
Zhang, K., Kimball, J. S., Nemani, R. R., Running, S. W., Hong, Y., Gourley, J. J., and Yu, Z. B.: Vegetation greening and climate change promote multidecadal rises of global land evapotranspiration, Scient. Rep.-UK, 5, 15956, https://doi.org/10.1038/srep15956, 2015.
Zhang, Y. Q., Liu, C. M., Tang, Y. H., and Yang, Y. H.: Trends in pan evaporation and reference and actual evapotranspiration across the Tibetan Plateau, J. Geophys. Res.-Atmos., 112, D12110, https://doi.org/10.1029/2006jd008161, 2007.
Zhang, Y. Q., Leuning, R., Chiew, F. H. S., Wang, E. L., Zhang, L., Liu, C. M., Sun, F. B., Peel, M. C., Shen, Y. J., and Jung, M.: Decadal trends in evaporation from global energy and water balances, J. Hydrometeorol., 13, 379–391, https://doi.org/10.1175/jhm-d-11-012.1, 2012.