the Creative Commons Attribution 3.0 License.
the Creative Commons Attribution 3.0 License.
Temperature signal in suspended sediment export from an Alpine catchment
Peter Molnar
Laura Stutenbecker
Maarten Bakker
Tiago A. Silva
Fritz Schlunegger
Stuart N. Lane
Jean-Luc Loizeau
Stéphanie Girardclos
Suspended sediment export from large Alpine catchments (> 1000 km2) over decadal timescales is sensitive to a number of factors, including long-term variations in climate, the activation–deactivation of different sediment sources (proglacial areas, hillslopes, etc.), transport through the fluvial system, and potential anthropogenic impacts on the sediment flux (e.g. through impoundments and flow regulation). Here, we report on a marked increase in suspended sediment concentrations observed near the outlet of the upper Rhône River Basin in the mid-1980s. This increase coincides with a statistically significant step-like increase in basin-wide mean air temperature. We explore the possible explanations of the suspended sediment rise in terms of changes in water discharge (transport capacity), and the activation of different potential sources of fine sediment (sediment supply) in the catchment by hydroclimatic forcing. Time series of precipitation and temperature-driven snowmelt, snow cover, and ice melt simulated with a spatially distributed degree-day model, together with erosive rainfall on snow-free surfaces, are tested to explore possible reasons for the rise in suspended sediment concentration. We show that the abrupt change in air temperature reduced snow cover and the contribution of snowmelt, and enhanced ice melt. The results of statistical tests show that the onset of increased ice melt was likely to play a dominant role in the suspended sediment concentration rise in the mid-1980s. Temperature-driven enhanced melting of glaciers, which cover about 10 % of the catchment surface, can increase suspended sediment yields through an increased contribution of sediment-rich glacial meltwater, increased sediment availability due to glacier recession, and increased runoff from sediment-rich proglacial areas. The reduced extent and duration of snow cover in the catchment are also potential contributors to the rise in suspended sediment concentration through hillslope erosion by rainfall on snow-free surfaces, and increased meltwater production on snow-free glacier surfaces. Despite the rise in air temperature, changes in mean discharge in the mid-1980s were not statistically significant, and their interpretation is complicated by hydropower reservoir management and the flushing operations at intakes. Overall, the results show that to explain changes in suspended sediment transport from large Alpine catchments it is necessary to include an understanding of the multitude of sediment sources involved together with the hydroclimatic conditioning of their activation (e.g. changes in precipitation, runoff, air temperature). In addition, this study points out that climate signals in suspended sediment dynamics may be visible even in highly regulated and human-impacted systems. This is particularly relevant for quantifying climate change and hydropower impacts on streamflow and sediment budgets in Alpine catchments.
- Article
(2536 KB) - Full-text XML
-
Supplement
(396 KB) - BibTeX
- EndNote


Erosion processes and sediment dynamics in Alpine catchments are determined by geological, climatic, and anthropogenic factors. Geological forcing is one of the main drivers of sediment production and landscape development, through crustal thickening, deformation and isostatic uplift, and glacier inheritance (e.g. England and Molnar, 1990; Schlunegger and Hinderer, 2001; Vernon et al., 2008). Glacier inheritance influences sediment production and transport as demonstrated by a strong spatial association between sediment yield and past and current glacial cover (Hinderer et al., 2013; Delunel et al., 2014). Almost continuous temperature-driven glacier recession in the European Alps since the late 19th century (Paul et al., 2004, 2007; Haeberli et al., 2007) has maintained large parts of the landscape in early stages of the paraglacial phase, where unstable or metastable sediment sources (Ballantyne, 2002; Hornung et al., 2010) can maintain high sediment supply rates. Anthropogenic impacts on sediment yields are more recent, and on a global scale largely related to land-cover change through intensified agriculture and the trapping of sediment in reservoirs (e.g. Syvitski et al., 2005). Land-use changes mainly impact fine-sediment production (e.g. Foster et al., 2003; Wick et al., 2003), while river channelization, flow regulation, water abstraction, and sediment extraction have caused a general reduction in sediment yield and consequently led to sediment-starved rivers worldwide (Kondolf et al., 2014). In Alpine catchments, in addition to trapping in reservoirs, sediment transfer is also disturbed by flow abstraction at hydropower intakes. The reduction of sediment transport capacity downstream of intakes and the periodic flushing of locally trapped sediment has severe impacts on the sediment budget (e.g. Anselmetti et al., 2007) and downstream river ecology (e.g. Gabbud and Lane, 2016).
Here we focus on the dominant role of climate in sediment production and transfer in Alpine environments (e.g. Huggel et al., 2012; Zerathe et al., 2014; Micheletti et al., 2015; Palazón and Navas, 2016; Wood et al., 2016). The premise behind this work is that to explain impacts of changes in climate on Alpine catchment suspended sediment yield, it is necessary to consider both transport capacity and sediment supply. Sediment supply depends on many factors, most importantly the spatial location of sediment sources (e.g. lithology, distance to outlet, connectivity) and the specific processes of sediment production (e.g. hillslope erosion, glacial erosion, release of subglacially stored sediment, channel bed and bank erosion, mass wasting events) and transport (e.g. hysteresis).
In this study we look at specific sediment sources and the hydroclimatic conditioning of their activation (e.g. precipitation, runoff, and air temperature) with a process-based perspective with the aim to infer the possible effects of changes in hydroclimate, such as increases in temperature and/or precipitation intensity on suspended sediment dynamics. We identify four main sediment sources typical of Alpine environments: glacial erosion, hillslope erosion, channel bed or bank erosion, and mass wasting events (e.g. rockfalls, debris flows). Climatic conditions, specifically precipitation and air temperature, contribute to the activation of these four sediment sources through different processes and at different rates. Erosive processes of abrasion, bed-rock fracturing, and plucking at the base of glaciers provide proglacial areas with large amounts of sediment (Boulton, 1974). Due to glacial erosion, discharge from subglacial channels has high suspended sediment concentrations (e.g. Aas and Bogen, 1988). Temperature-driven snow and ice melt in spring and summer, as well as intense rainfall on snow-free surfaces, may lead to entrainment from proglacial areas provided they are connected to the river network (Lane et al., 2016). Hillslope erosion driven by overland flow and rainfall erosivity may be exacerbated in Alpine catchments by permanently or partially frozen ground (Quinton and Carey, 2008). In summer and autumn, when Alpine catchments are largely free of snow, intense rainfall may erode large amounts of sediment and transport it in rills and gullies to the river network. Intense rainfall is also responsible for triggering mass wasting events, such as debris flows and landslides, where a large mass of sediment is delivered to the channel network instantaneously (e.g. Bennett et al., 2012). Flow conditions (e.g. shear stress, stream power) then determine the sediment transport capacity and in-stream sediment mobilization along rivers, and hence its transfer to downstream locations.
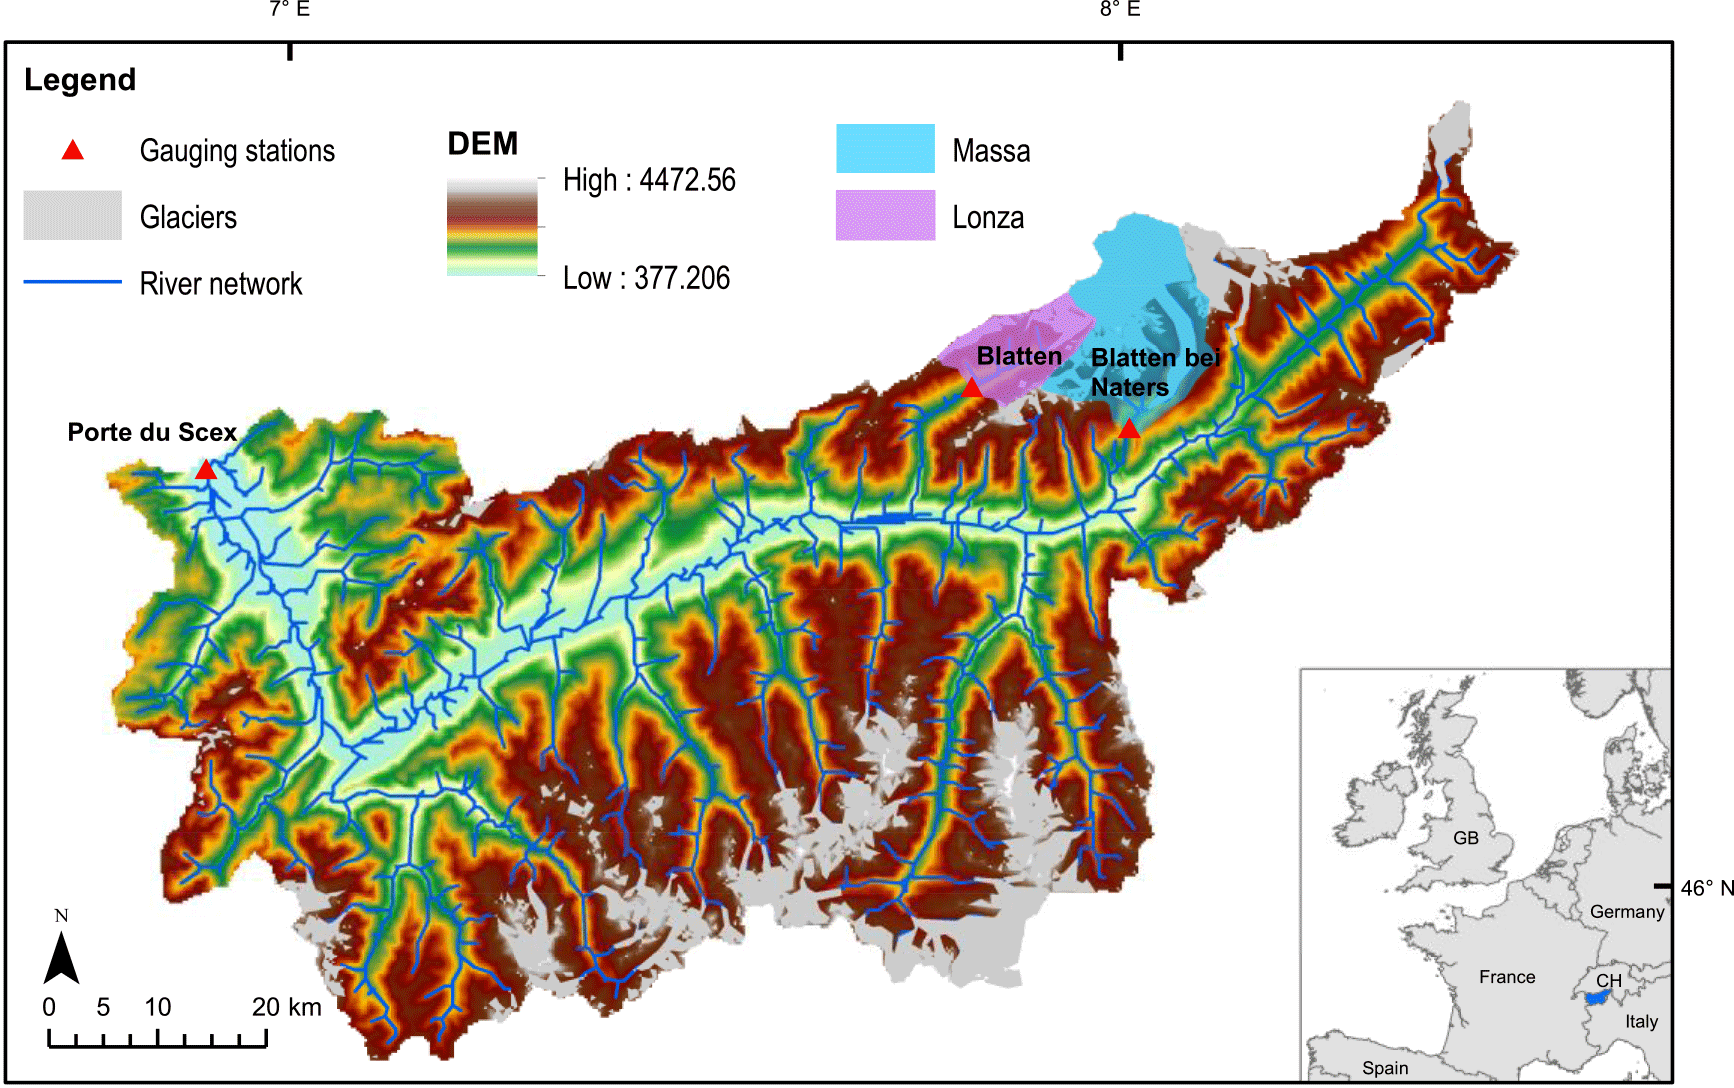
Figure 1Map of the upper Rhône Basin with topography (DEM resolution is 250 × 250 m), glacierized areas, and river network. The inset shows the position of the upper Rhône Basin in Europe (blue). Locations of gauging stations used in this analysis are shown as triangles. Massa and Lonza sub-basins used in the calibration and validation of the ice melting component are highlighted.
The close link between precipitation, air temperature, runoff, and the activation–deactivation of sediment sources in Alpine catchments becomes critical in the context of climate change. Alpine regions represent a sensitive environment in relation to current rapid warming. In Switzerland, together with glacier recession, a reduction in snow-cover duration and mean snow depth has been observed during the last 30 years (e.g. Beniston, 1997; Laternser and Schneebeli, 2003; Scherrer et al., 2004; Marty, 2008; Scherrer and Appenzeller, 2006). Although current effects of climate change are less clear for precipitation (Brönnimann et al., 2014) than for temperature, a sharp reduction in the number of snowfall days has been observed at many meteorological stations in Switzerland (Serquet et al., 2011).
The upper Rhône River Basin draining into Lake Geneva in Switzerland is at the centre of our investigation. The basin has experienced a rise in air temperature that coincided with a rise in suspended sediment concentrations in the mid-1980s. Our main objective is to explore the presence of the signal of a warmer climate in the suspended sediment dynamics of this regulated and human-impacted Alpine catchment. In this work, we refer to fine sediment as the sediment transported in suspension. To investigate the potential causes of the observed increase in suspended sediment concentration, we conceptualize the upper Rhône Basin as a series of spatially distributed sediment sources that are activated or deactivated by hydroclimatic forcing. In addition to discharge (transport capacity), we consider four main hydroclimatic variables: (a) ice melt runoff (IM), which evacuates accumulated fine sediment, the product of glacial erosion, through subglacial channels (e.g. Swift et al., 2005); (b) snow-cover fraction (SCF), which influences ice melting onset, impacts ice-melt efficiency through albedo, and may result in more rapid erosion and sediment production through an increased glacier basal velocity (e.g. Herman et al., 2015); (c) snowmelt runoff (SM) from snow-covered areas, which may generate downstream hillslope erosion and channel erosion (e.g. Lenzi et al., 2003); and (d) effective rainfall (ER), defined as liquid precipitation over snow-free areas, which leads to hillslope erosion, mass wasting, and also, due to enhanced discharge, channel erosion (e.g. Bennet et al., 2012; Meusburger and Alewell, 2014). Our aims are the following: (a) to estimate daily basin-wide ice melt, snow-cover fraction, snowmelt, and effective rainfall over the Rhône Basin for the last 40 years; and (b) to analyse these variables with the goal to provide statistical evidence for possible reasons for the rise in suspended sediment concentrations in the mid-1980s.
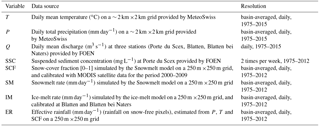
Table 1List of the variables analysed: observed SSC and hydroclimatic variables originating from measurements (Q), spatial interpolation of measurements (T, P), simulations of the snow and ice-melt model (SCF, SM, IM), or a combination thereof (ER). Information on the source and the spatial and temporal resolution are reported for each variable.
The upper Rhône Basin is located in the southwestern part of Switzerland, in the central Swiss Alps (Fig. 1). It has a total surface area of 5338 km2 and an altitudinal range of 372 to 4634 m a.s.l. About 10 % of the surface is covered by glaciers, which are mostly located in the eastern and southeastern part of the catchment (Stutenbecker et al., 2016). The Rhône River originates at the Rhône Glacier and flows for about 160 km through the Rhône valley before entering Lake Geneva a few kilometres downstream of the gauging station located at Porte du Scex (Fig. 1). Basin-wide mean annual precipitation is about 1400 mm yr−1 and shows strong spatial variability driven mostly by orography and the orientation of the main valley. The hydrological regime of the catchment, typical of Alpine environments, is strongly influenced by snow and ice melt with highest discharge in summer and lowest in winter. Mean annual discharge is 180 m3 s−1, which corresponds to about 1060 mm yr−1 and an annual runoff coefficient of 75 %.
The catchment has been strongly affected by anthropogenic impacts during the last century. The main course of the Rhône River has been extensively channelized for the purposes of flood protection: levees were constructed and the channel was narrowed and deepened in the periods 1863–1894 and 1930–1960 (first and second Rhône corrections). Due to the residual flood risk that affects the main valley, a third project was started in 2009 with the main objectives to increase channel conveyance capacity and river ecological rehabilitation (Oliver et al., 2009). In addition, significant gravel mining operations are carried out along the main channel and many tributaries. Since the 1960s, several large hydropower dams have been built in the main tributaries of the Rhône River. The total storage capacity of these reservoirs corresponds to about 20 % of the mean annual streamflow (Loizeau and Dominik, 2000). Flow impoundment, water abstraction, and diversion through complex networks of intakes, tunnels, and pumping stations have significantly impacted the flow and sediment regime of the catchment. Flow regulation due to hydropower production has resulted in a considerable decrease in discharge in summer and increase in winter (Loizeau and Dominik, 2000). That said, the construction of dams and the start of hydropower operation has coincided with a drop in the suspended sediment load of the main Rhône River measured at Porte du Scex in the 1960s (Loizeau et al., 1997; Loizeau and Dominik, 2000).
Two sub-catchments of the upper Rhône Basin are used for the calibration and validation of the ice-melt model: the Massa and the Lonza sub-catchments (Fig. 1). The Massa is a medium-sized basin (195 km2) with a mean elevation of 2945 m a.s.l. More than 60 % of the surface is glacierized, and the remaining surface is classified mostly as rock and firn (Boscarello et al., 2014). The basin includes the Aletsch Glacier, which is the largest glacier in the European Alps with a length (1973) of around 23.2 km and a surface area (1973) of approximately 86 km2 (Haeberli and Holzhauser, 2003). The Lonza is a relatively small basin located to the west of the Massa with an average elevation of 2630 m a.s.l. It has a total drainage area of roughly 77.8 km2 and almost 36 % of its surface (1991) is covered by glaciers.
Our objective is to explore the potential effect of climate on suspended sediment dynamics in the upper Rhône Basin during the period 1975–2015. To this end, we analyse observed and simulated hydroclimatic and sediment-transport variables as listed in Table 1: mean daily temperature T, total daily precipitation P, mean daily discharge Q, suspended sediment concentration SSC, daily snow-cover fraction SCF, snowmelt SM, ice melt IM, and effective rainfall over snow-free areas ER. Some variables originate from observations (Q, SSC) or spatial interpolation of observations (T, P), others from simulations by spatially distributed snow and ice-melt models (SCF, SM, IM), or from a combination thereof (ER). The snowmelt model is described in Sect. 3.1, the ice-melt model in Sect. 3.2, and their calibration in Sect. 3.3. We first interpolate the input datasets of precipitation and temperature on a 250 m ×250 m grid resolution by the nearest-neighbour interpolation method. Second we run the snow and ice-melt model on the daily timescale over the period 1975–2015. In a third step, we analyse the variables (Table 1) as mean monthly and mean annual values averaged over the basin area. To quantify changes in the hydroclimatic variables and in suspended sediment concentration, we apply standard statistical tests for change detection described in Sect. 3.4. A description of all datasets used in this analysis is reported in more detail in Sect. 4.
3.1 Snowmelt model
We use a snowmelt model to predict SM and SCF over the entire basin, because snow station measurements are sparsely and irregularly distributed and a physical consistency between precipitation and air temperature as climatic driving forces and snowmelt and snow cover as response variables is needed. The spatially distributed temperature index method (degree-day model) was used due to its simplicity, low data requirements, and demonstrated success on daily temporal scales over large basins (e.g. Hock, 2003; Boscarello et al., 2014). The degree-day approach also matches the coarse spatial (250 m × 250 m) and temporal (daily) resolution of our analysis and the areal averaging on the basin scale. Models based on energy balance, or enhancements of the degree-day approach, represent physical processes better and could be used when higher spatial and temporal resolution and accuracy are needed (e.g. Pellicciotti et al., 2005).
The snowmelt model includes snow accumulation and melt. On the grid scale, precipitation P (mm day−1) is first partitioned into solid and liquid form based on (a) daily minimum Tmin (∘C) and maximum air temperature Tmax (∘C) and (b) a rain–snow threshold temperature TRS (∘C). If minimum air temperature Tmin is above the threshold temperature TRS, all precipitation falls as rainfall R; if the maximum air temperature Tmax is below the threshold temperature TRS, all precipitation falls as snow S; otherwise precipitation is a mixture of solid and liquid form, partitioned proportionally to the temperature difference
where
The daily snowmelt rate SMi (mm day−1) is estimated from a linear relation with air temperature:
where Tmean (∘C) is the mean daily air temperature, TSM (∘C) is a threshold temperature for the onset of melt, and ksnow is a melt factor (mm day−1 ∘C−1). Snow depth (SD), in millimetres snow water equivalent, for time t is then simulated from a balance between accumulation and melt at every grid cell i:
The snow-cover fraction, SCF, for a chosen area containing grids is
where H is a unit step function: H=0 when SD=0 and H=1 when SD>0. The area of integration N can be the entire catchment, sub-basins, elevation bands, etc. For the entire catchment, we estimate mean daily snowmelt SM (mm day−1) as the arithmetic average over all grid melt rates:
The threshold temperatures for defining the precipitation type, TRS, and the onset of melt, TSM, depend on many factors such as atmospheric boundary layer conditions, temperature, and humidity, among others. Different parameterizations and temperature values are available in the literature (Wen et al., 2013). Depending on region, altitude, and modelling approach, rain–snow temperature thresholds show a range of variability from −5 ∘C (Collins et al., 2004) to more than 6 ∘C (Auer, 1974). For the upper Rhône Basin we assume a constant rain–snow temperature threshold TRS=1 ∘C, resulting from a calibration and validation of the physically based fully distributed hydrological model Topkapi-ETH in the catchment (Fatichi et al., 2015). To reduce degrees of freedom, the threshold temperature for the onset of melt TSM is set equal to 0 ∘C, which is a typical value for Alpine regions (e.g. Schaefli et al., 2005; Corbari et al., 2009; Boscarello et al., 2014). The calibration of the snowmelt model consists of estimating only the melt factor ksnow with methods described in Sect. 3.3. In addition, we apply a sensitivity analysis on the three parameters ksnow, TRS, and TSM, as described in the Supplement Sect. S1.
3.2 Ice-melt model
Similar to snowmelt, ice melt is also simulated with a temperature index (degree-day) model on grid cells that are identified as glacier covered. The daily ice melt IMi (mm day−1) on glacier surfaces that are snow-free is estimated as
where Tmean (∘C) is the mean daily air temperature, TIM (∘C) is a threshold temperature for the onset of ice melt, and kice (mm day−1 ∘C−1) is the ice-melt factor. For the entire catchment, we estimate mean daily ice melt IM (mm day−1) as the arithmetic average over all ice-covered grid cells as follows:
The threshold temperature for glacier melting TIM is set equal to 0 ∘C. Ice melt occurs only if the glacier cell is snow free. The snow cover simulated by the snowmelt model in Sect. 3.1 is thus essential for estimating ice melt. The calibration of the ice melt model consists of estimating only the melt factor kice as described in Sect. 3.3.
3.3 Calibration and validation of snowmelt and ice-melt models
We perform the calibration and validation of the snow and ice-melt model parameters in sequence, since the snow-covered surface is required for ice-melt estimation on glaciers. The snowmelt factor ksnow is calibrated based on comparisons with snow-cover maps. Snow-cover observations are split into two periods: 1 October 2000–30 September 2005 for calibration and 1 October 2005–31 December 2008 for validation, for a total number of 217 calibration and 143 validation days. Snow-cover maps at 500 m ×500 m resolution are distributed by proximal interpolation to the snowmelt model 250 m ×250 m computational grid. Maps of snow depth simulated with Eq. (4) are first transformed into simulated snow-cover fraction SCFsim with Eq. (5) and are afterwards compared with snow-cover fraction derived from the observations SCFobs.
The objective function for calibration is based on a combination of mean absolute error and true skill statistic. The mean absolute error MAE is estimated as
where n is the number of MODIS image maps. MAE captures the overall ability of the model to reproduce the snow-cover fraction accurately. The true skill statistic (TSS) is a spatial statistic that measures the grid-to-grid performance of the model in capturing snow–no-snow presence. It is computed as the sum of sensitivity SE (correct snow predictions) and specificity SP (correct no-snow predictions) computed from contingency tables (e.g. Wilks, 1995; Mason and Graham, 1999; Corbari et al., 2009) in each image j and averaged over the n MODIS maps in the simulation period:
Because TSS includes both sensitivity and specificity, it captures both predictions of snow-covered and snow-free areas. It takes on values between 0 and 1, where 1 indicates perfect performance, and is a widely applied metric for assessing spatial model performance (e.g. Begueria, 2006; Allouche et al., 2006). We combine both goodness-of-fit measures (MAE and TSS) into an objective function OF, by giving more weight to MAE. Finally, we evaluate the objective function OF over b=5 different elevation bands in order to better capture the topographic gradients in snowmelt distribution in the Rhône Basin:
This objective function is maximized in calibration. The rationale of using both MAE and TSS in evaluating performance is to give weight to both basin-integrated snow cover as well as to grid-based predictions. Indeed, the same value of snow-cover fraction can result in two different spatial arrangements of snow-covered pixels, and a correct spatial distribution of snow-covered and snow-free areas is relevant for this analysis insofar as it affects the activation and deactivation of specific sediment sources. The weights assigned to MAE and TSS in Eq. (11) are the outcome of sensitivity tests with the model. After calibration, we also estimate the Nash–Sutcliffe efficiency (NS; Nash and Sutcliffe, 1970) and the mean square error MSE to quantify the performance of the model:
where is the average observed snow-cover fraction during the calibration–validation period.
We calibrate the ice-melt factor kice with the data of the sub-basin of the river Massa (Fig. 1), on the basis of daily discharge measurements, and focusing only on months when the ice-melt contribution is not negligible (June–October). The gauging station is located upstream of the Gebidem dam, therefore discharge is not influenced by reservoir regulation and represents undisturbed natural flow. Calibration is performed on the period 1 January 1975–31 December 2005, while validation covers the remaining 10 years of available data, i.e. the period 1 January 2006–31 December 2015. We then validate the model on the Lonza sub-basin with the same procedures and goodness-of-fit measures.
The optimal value of kice is found by minimizing the mass balance error MBES computed for the period June–October:
where ny is the number of calibration years, and (mm year−1) are the observed and simulated discharge volumes per unit area reaching the outlet of the catchment during the period June–October of each calibration year i:
Here, nd is the number of observation days from June to October, (mm day−1) is the daily discharge per unit area observed at Blatten Bei Naters (Blatten), Rj, SMj, IMj are respectively the total daily rainfall, snowmelt, and ice melt aggregated over the Massa (Lonza) basin. Rainfall (R) and snowmelt (SM) are simulated with the snow accumulation and melt model in Sect. 3.1, while ice melt (IM) is simulated with the ice-melt model in Sect. 3.2.
It should be noted that in this study we neither consider glacier evolution, i.e. changes in ice thickness due to accumulation and melt, nor glacier ice flow. Neglecting glacier retreat raises the possibility that we overestimate the ice-melt contribution over the study period. To quantify the potential effect of glacier retreat, we compare our simulations with time series produced from the Global Glacier Evolution Model (GloGEM), a model accounting for both the mass balance and glacier evolution (Huss and Hock, 2015). For comparison, we use total monthly runoff generated from glacierized surfaces of the upper Rhône Basin, simulated with GloGEM for the period 1980–2010. GloGEM computes the mass balance for every 10 m elevation band of each glacier, by estimating snow accumulation, snow and ice melt, and refreezing of rain and melt water. The response of glaciers to changes in mass balance is modelled on the basis of an empirical equation between ice thickness changes and normalized elevation range parameterized as proposed by Huss et al. (2010). Normalized surface elevation changes Δhr are derived for each elevation band from mass balance changes (mass conservation). Starting from initial values derived by the method of Huss and Farinotti (2012), ice thickness is updated at the end of each hydrological year by applying the relation between normalized elevation range hr and normalized surface elevation change Δhr. The area of each glacier is finally adjusted by a parabolic cross-sectional shape of the glacier bed (Huss and Hock, 2015). GloGEM is calibrated and validated over the period 1980–2010 with estimates of glacier mass changes by Gardner et al. (2013) and in situ measurements provided by the World Glacier Monitoring Service.
3.4 Statistical testing for change
We use the non-parametric Pettitt test (Pettitt, 1979) for the detection of the time of change (year-of-change) in the air temperature data. We then test the other variables (SSC, P, Q, SM, SCF, IM, and ER) for changes in the mean (and variance) by splitting the time series into two periods before and after the identified year-of-change, and by applying two-sample two-sided t tests for the equality of the means (and variances). The null hypothesis of no change is tested at the 5 % significance level. The t test is a parametric test commonly used in hydrology to assess the validity of the null hypothesis of two samples having equal means and unknown unequal variances. We apply the t test to all hydroclimatic variables averaged on the annual and monthly timescales with the same year-of-change to determine which hydroclimatic variables, and therefore the activation or deactivation of which sediment sources, are possibly responsible for the observed changes in suspended sediment concentration.
In our catchment, SSC is sampled intermittently (twice per week). This might have an effect on the change detection analysis of the hydroclimatic variables. We estimate this potential effect by considering the hydroclimatic variables SM, IM, ER, and Q only on days corresponding to SSC-measurement days. We compare these new time series with the original ones by estimating the cumulative distribution functions of the variables and by testing changes of mean monthly and annual values over time. We consider only the positive (non-zero) part of the distributions. Results are reported in Sect. 5.4.
4.1 Precipitation and air temperature
For precipitation and air temperature we use spatially distributed datasets provided by the Swiss Federal Office of Meteorology and Climatology (MeteoSwiss). Total daily precipitation and mean, minimum, and maximum daily air temperature are available on a ∼ 2 km ×2 km resolution grid for Switzerland (MeteoSwiss, 2013a, b). All four datasets are developed by spatial interpolation of quality-checked data collected at MeteoSwiss meteorological stations (Frei et al., 2006; Frei, 2014). We apply the statistical analysis of change to basin-averaged values of precipitation and temperature and not to individual grid point values, which might be potentially affected by substantial interpolation errors. Moreover, the variability in time of the number of stations involved in the spatial interpolation may induce non-homogeneities in the datasets. This is particularly relevant when analysing long-term changes as in the case of this study. Therefore, we verify the effects of potential non-homogeneities by using an experimental dataset developed by MeteoSwiss specifically for this research, based on a constant number of stations (294 for precipitation and 48 for temperature) for the period 1971–2013. We applied the statistical tests for detecting changes both on the original and the experimental datasets of P and T. Results of the statistical tests on the two datasets coincide. This confirms that temporally variable number of meteorological stations employed to build the product does not influence the changes detected in the original dataset.
4.2 Discharge and suspended sediment concentration
We use daily discharge data measured by the Swiss Federal Office for the Environment (FOEN) at three gauging stations: Porte du Scex (available since 1905), Blatten Bei Naters (available since 1931) and Blatten (available since 1956) (Fig. 1). For suspended sediment concentration, two in-stream samples per week collected by FOEN at Porte du Scex are available since October 1964 (Grasso et al., 2012).
In this work, we focus on sediment transported in suspension. Previous analysis on the grain size distribution of suspended sediment at the outlet of the upper Rhône River reports a bimodal distribution, with mode diameters equal to 13.7 µm (silt) for the finer fraction and 39.6 µm (silt) for the coarser grains (Santiago et al., 1992). The composition of grains cover a wide range of values, including clay (16.9 %), silt (64.7 %), and sand (18.4 %). The mean suspended sediment size is reported to be equal to 17.7 µm (silt), and the largest grains transported in suspension during summer high-flow conditions are in the range of coarse sand (> 500 µm) (Santiago et al., 1992).
4.3 Snow cover and glacier data
We use snow-cover maps derived from satellite imagery for the upper Rhône Basin over the period 2000–2008 processed in previous research (Fatichi et al., 2015). We use the 8-day snow-cover product MOD10A2 retrieved from the Moderate Resolution Imaging Spectroradiometer (MODIS) (Dedieu et al., 2010) for the calibration and validation of the snowmelt model. MOD10A2 is provided at a 500 m ×500 m spatial resolution, where cells are classified as snow covered, snow free, inland water, or cloud covered. In order to reduce the impacts of clouds in estimating snow-cover fraction, maps with cloud cover greater than 30 % are excluded from the dataset, resulting in a total number of usable images equal to 360, i.e. on the average 40 days per year.
The surface covered by glaciers is assigned based on the GLIMS (Global Land Ice Measurements from Space) Glacier Database (Fig. 1). Ice-covered cells identified based on the GLIMS data of 1991 show that more than 10 % of the upper Rhône Basin as covered by ice with a total glacier surface of almost 620 km2.
4.4 Digital terrain model
We use a digital elevation model (DEM) with 250 m ×250 m resolution (85 409 cells in total; Fig. 1), obtained by resampling a finer model (25 m ×25 m) provided by SwissTopo in the ETH geodata portal (GeoVITe). The DEM is used as a mask for extracting climatic inputs and for elevation information in the snowmelt modelling.
5.1 Calibration of snowmelt and ice-melt models
The snowmelt factor, calibrated following the procedure described in Sect. 3.3, is ksnow=3.6 mm day−1 ∘C−1. The snowmelt model reproduces well the seasonal fluctuations of snow-cover fraction (SCF) in the basin, with Nash–Sutcliffe efficiencies (NS) close to 0.90 and low mean square errors (MSE). The model maintains good performances also in the validation period showing a slight reduction in the goodness-of-fit measures (Table 2). The temporal variability in SCF is also well simulated on the basin scale. Although the comparison between observed and simulated SCF is affected by the discontinuous nature of the MODIS data (8-day resolution), Fig. 2 shows that the model with a single constant ksnow for the entire catchment reproduces the snow-cover dynamics reasonably well for all of the studied elevation bands. At lower elevations, the model tends to slightly underestimate SCF in autumn and overestimate it in winter. The model performs better at higher elevation bands, even at the very highest elevations with permanent snow cover (Fig. 2; bottom). The spatial distribution of snow cover is satisfactory, with average values of sensitivity and specificity greater than 0.7 (Table 2). Goodness-of-fit measures indicate that, on average, more than 70 % of snow-covered and snow-free pixels are correctly identified. The true skill score, which combines both metrics, results in values around 0.5 (Table 2). Snow-cover-duration maps averaged over the period 2000–2008 for MODIS observations and simulations show a good spatial coherence (Fig. 3). In summary, we conclude that the snowmelt model represents the spatial and temporal dynamics of snow cover in the Rhône Basin satisfactorily. Results of the sensitivity analysis on ksnow, TRS, TSM are reported in the Supplement (Sect. S1).
Table 2(a) Calibrated snowmelt factor ksnow and goodness-of-fit measures for validation and calibration periods: Nash–Sutcliffe efficiency (NS), mean square error (MSE), true skill statistic (TSS), sensitivity (SE), and specificity (SP) for the entire upper Rhône Basin; and (b) calibrated ice-melt factor kice and goodness-of-fit measures: mass balance error computed on June–October (MBES) and on the entire year (MBEA) for the Massa and Lonza sub-basins.
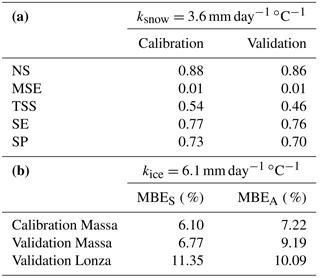
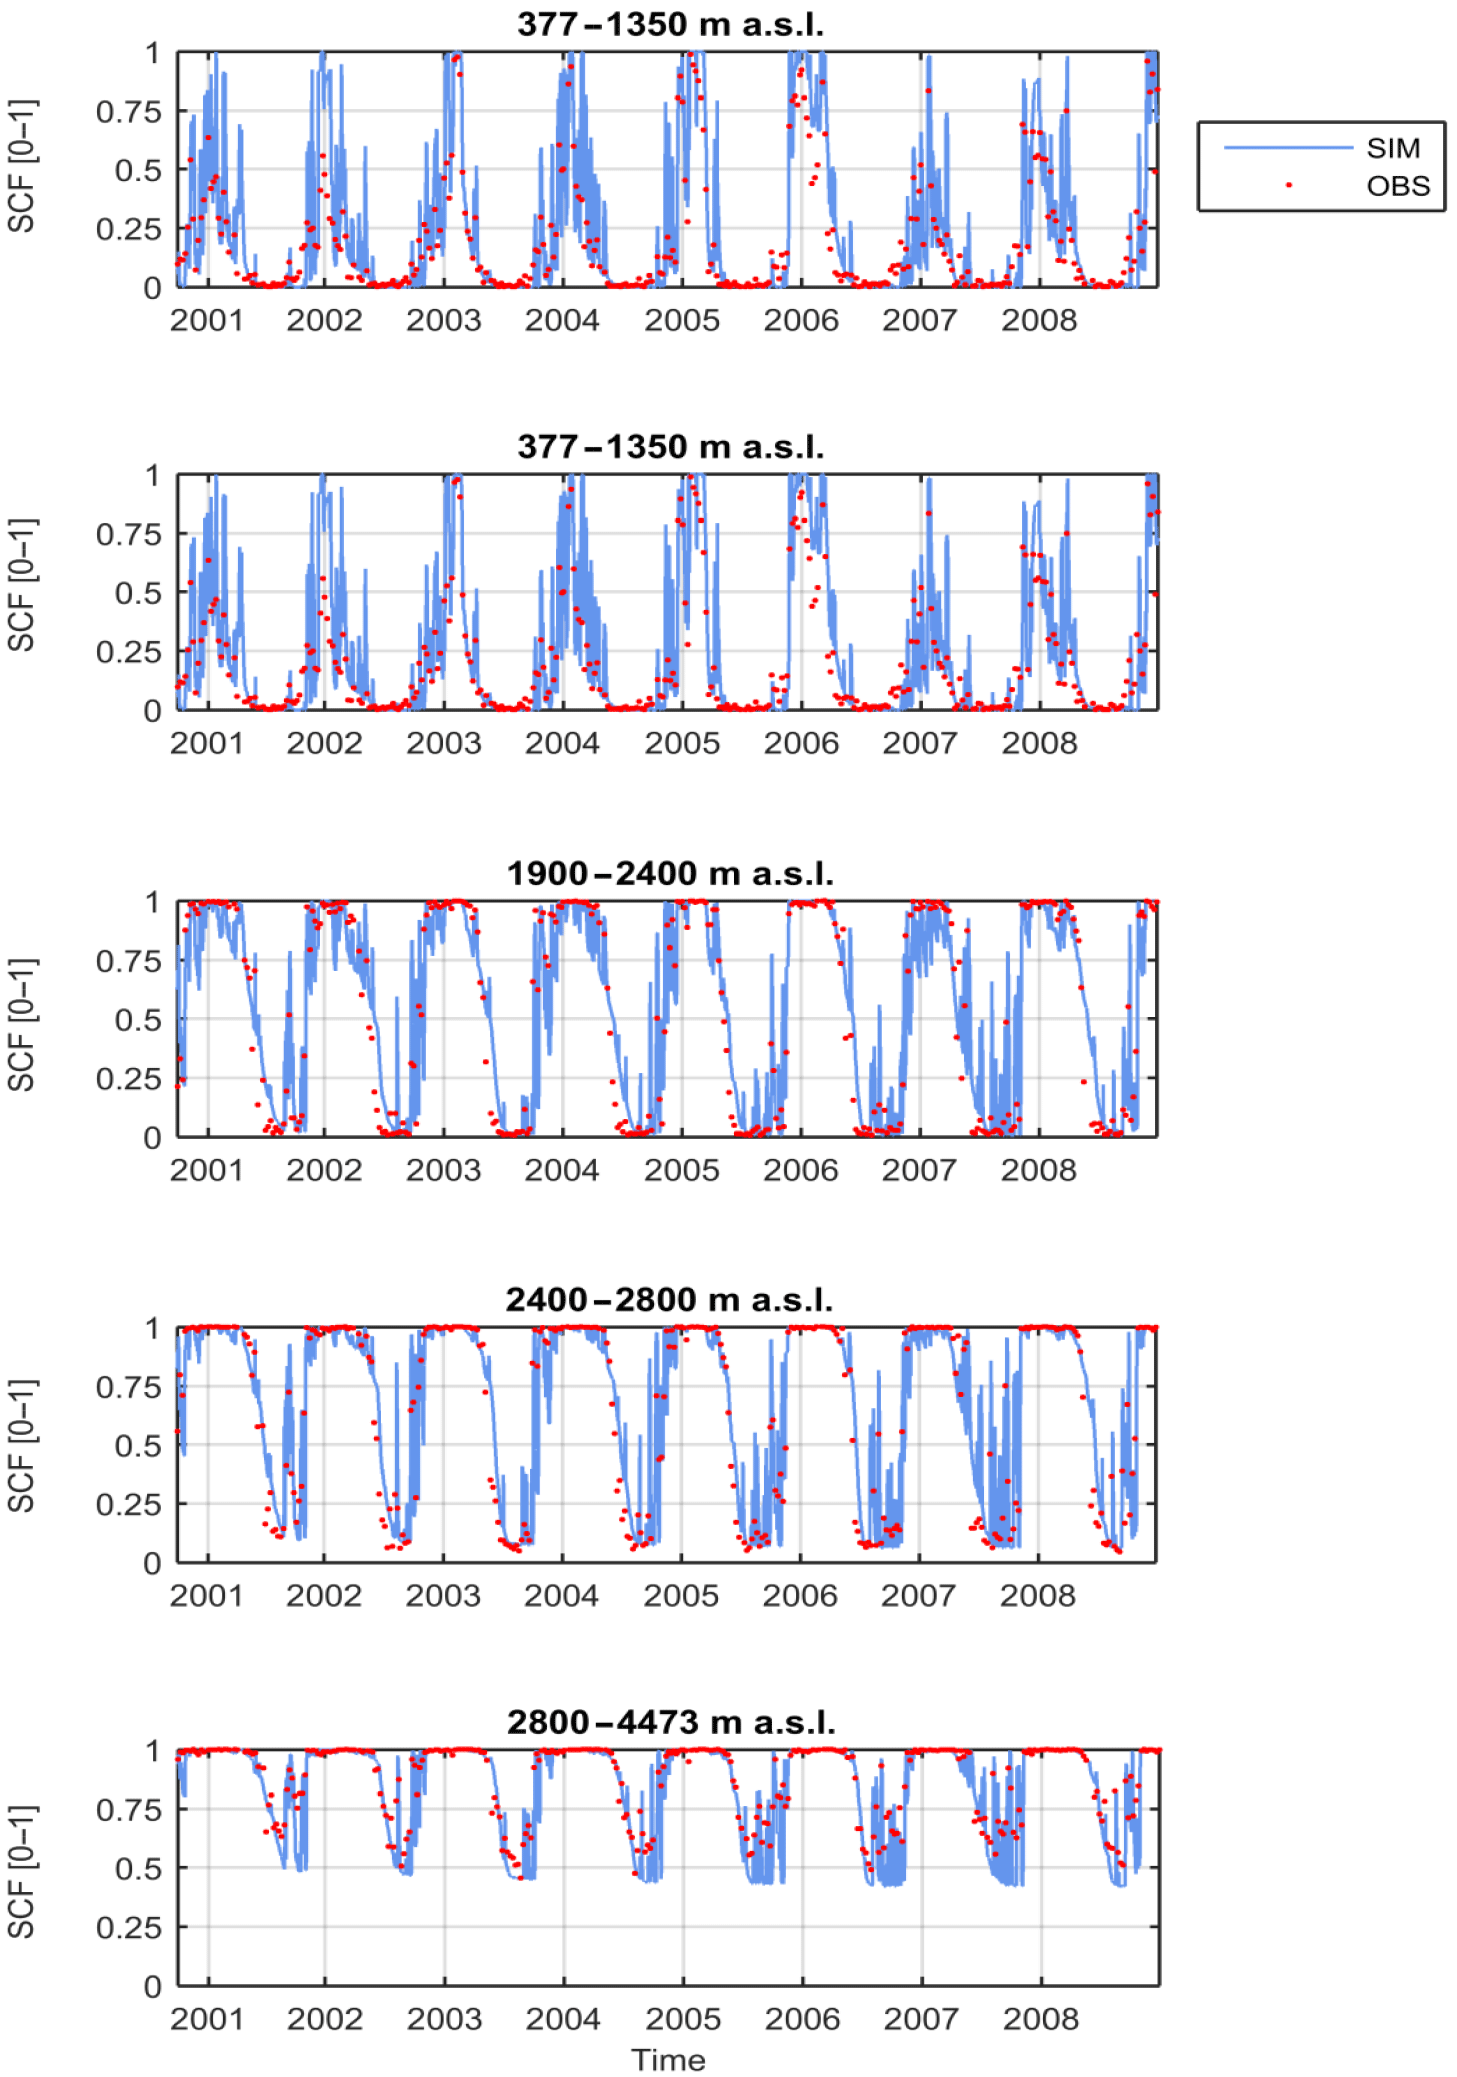
Figure 2Comparison between observed (red circles) and simulated (light blue lines) snow-cover fraction (SCF) of the upper Rhône Basin for five different elevation bands. Simulations are computed with calibrated snowmelt factor ksnow=3.6 mm day−1 ∘C−1.
The ice-melt factor, calibrated following the procedure described in Sect. 3.3, is kice=6.1 mm day−1 ∘C−1. Calibration and validation results are summarized in Table 2. In Fig. 4 we show the seasonal pattern of basin-averaged IM, SM, and R simulated with the calibrated snow and ice-melt model, together with discharge Q observed at the outlet of the two highly glacierized sub-catchments Massa (Fig. 4a) and Lonza (Fig. 4b). The fit of the simulated (computed as IM + SM + R) to the observed discharge is good, with mass balance errors about 7 % for the Massa and 8 % for the Lonza.
Although in our hydrological model we do not include glacier evolution, the annual runoff volumes (SM +IM + R) from glacierized areas during the period 1980–2010 correlate well with the results of GloGEM (Fig. 5a). Measures of performance confirm the agreement between the two models: the correlation coefficient is equal to 0.86 and the Nash–Sutcliffe efficiency is equal to 0.67. We also capture quite well the seasonal pattern of runoff generated from glacierized areas (Fig. 5b). Perhaps most importantly, GloGEM simulations show that total annual runoff is increasing throughout the period and there is no evidence for decreasing ice-melt rates. This confirms that, although glaciers of the upper Rhône Basin are retreating, melt-water discharges from glacierized and proglacial areas are increasing during the 1980–2010 period. As expected, total runoff from glacierized surfaces and ice melt is highly correlated (Fig. 5a; correlation coefficient = 0.95), thus indicating that the increase in total runoff is due to an increase of the ice-melt component. Indeed, non-parametric Mann–Kendall tests indicate an increasing trend with 5 % significant level. Trend slopes, estimated with the Theil–Sen estimator, confirm the agreement between the two models: we find a total increase of runoff of ∼ 27.65 millon m3 year−2 with GloGEM and ∼ 21.71 million m3 year−2 with our model. We also computed the basin-averaged mass balance accounting for snow accumulation and snow and ice melt for each hydrological year. The mean mass balance over the period 1980–2010 is equal to m year−1 of water equivalent, which is within the uncertainty range of recent studies (Fischer et al., 2015). In summary, although we do not account for glacier retreat, our model results agree well with state-of-the-art glaciological models that include glacier evolution. Both comparisons with GloGEM and our basin-averaged mass balance indicate that we are not significantly overestimating ice melt during the period 1975–2015.
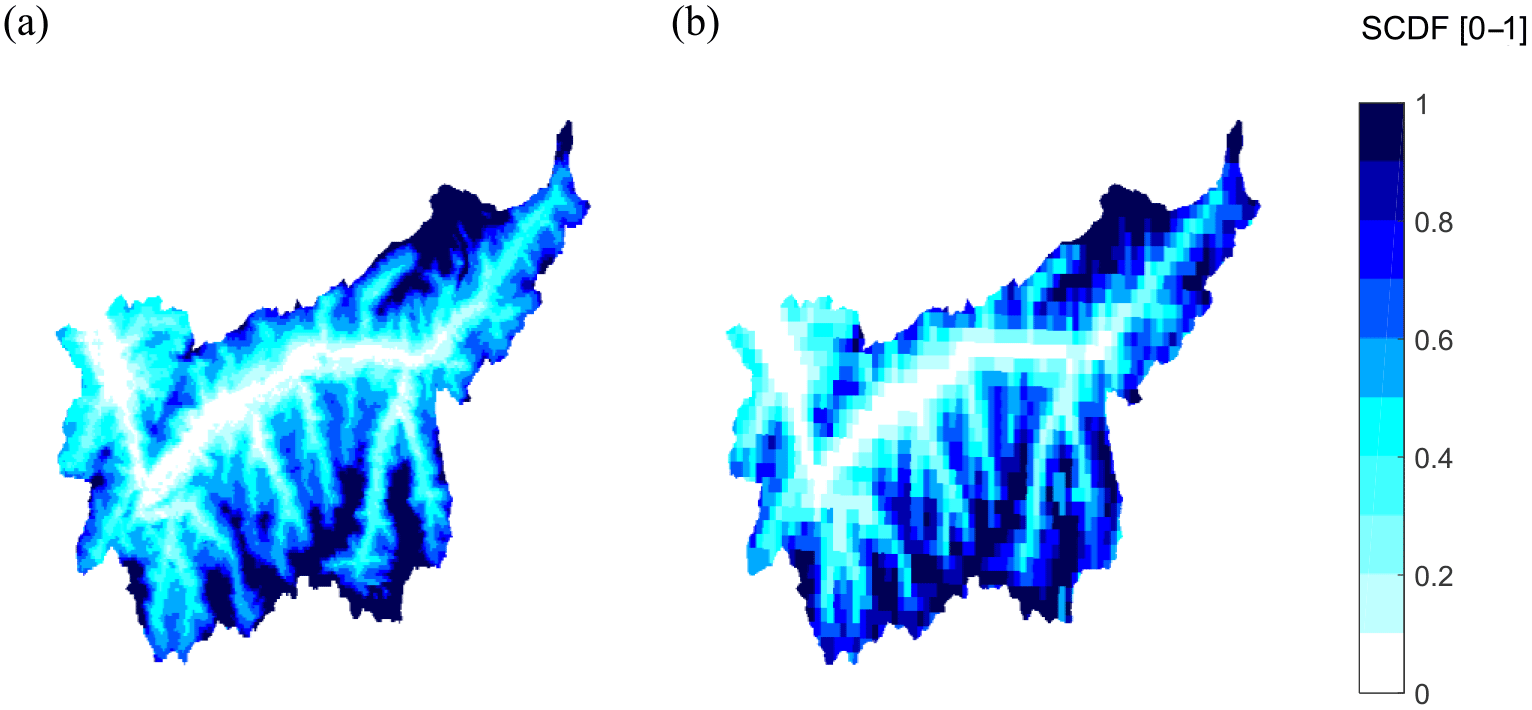
Figure 3Map of average snow permanence during the period 2000–2008, expressed as the fraction of time in which pixels are snow-covered (snow cover duration fraction, SCDF[0–1]): (a) observations (MODIS) and (b) simulations.
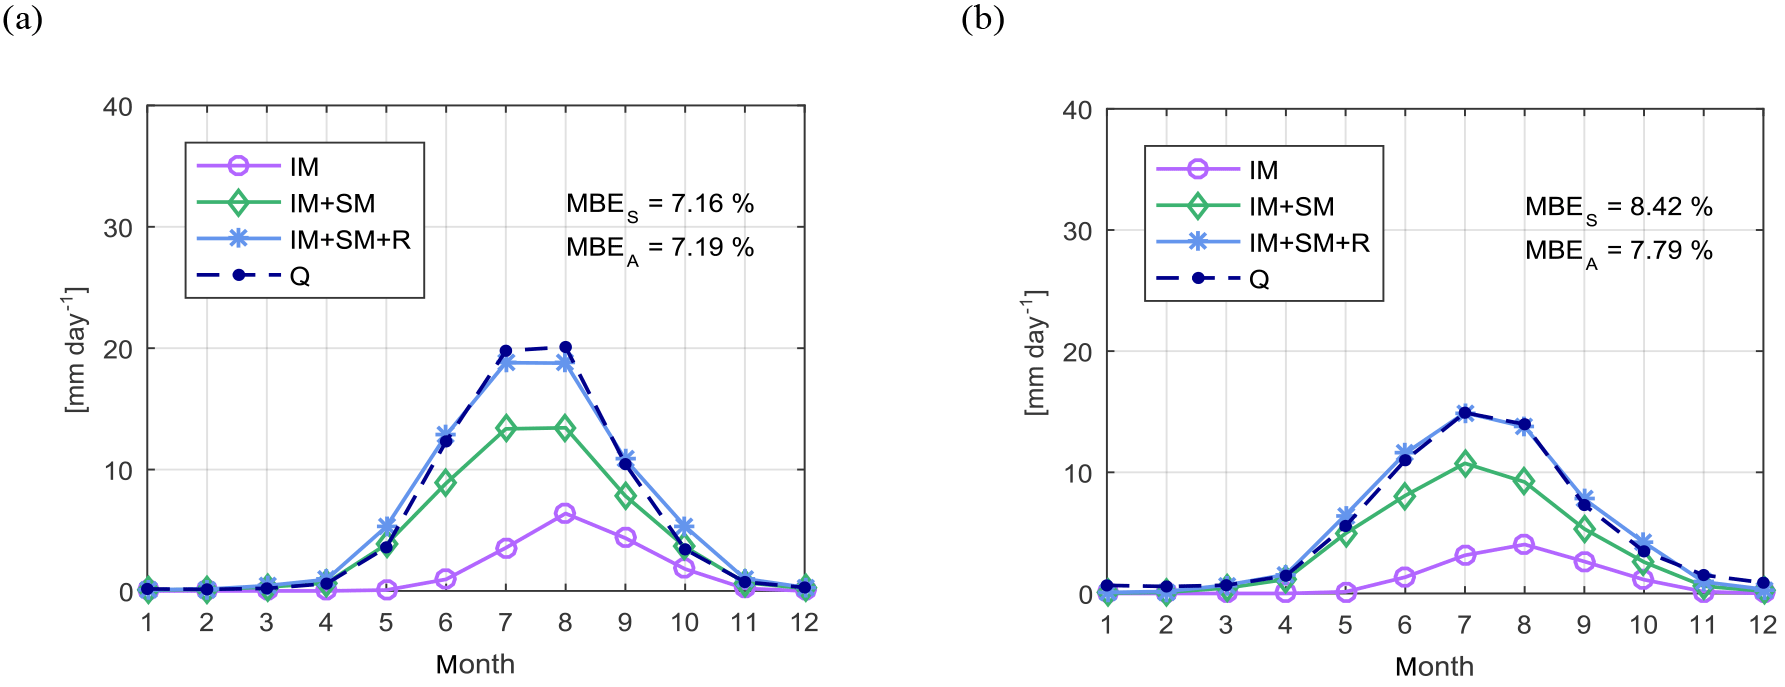
Figure 4Comparison of mean monthly observed (dark blue) and simulated (light blue) discharge for the period 1975–2015: (a) Massa basin and (b) Lonza basin. Simulated discharge is the sum of three components: ice melt (IM), snowmelt (SM), and rainfall (R).

Figure 5Runoff (snowmelt + ice melt + rainfall) generated from glacierized areas within the upper Rhône Basin, simulated with GloGEM and with the snowmelt and ice-melt models (degree-day) for the period 1980–2010: (a) total annual values; (b) mean monthly values. (a) also depicts the time series of total annual ice melt simulated with the ice-melt model.
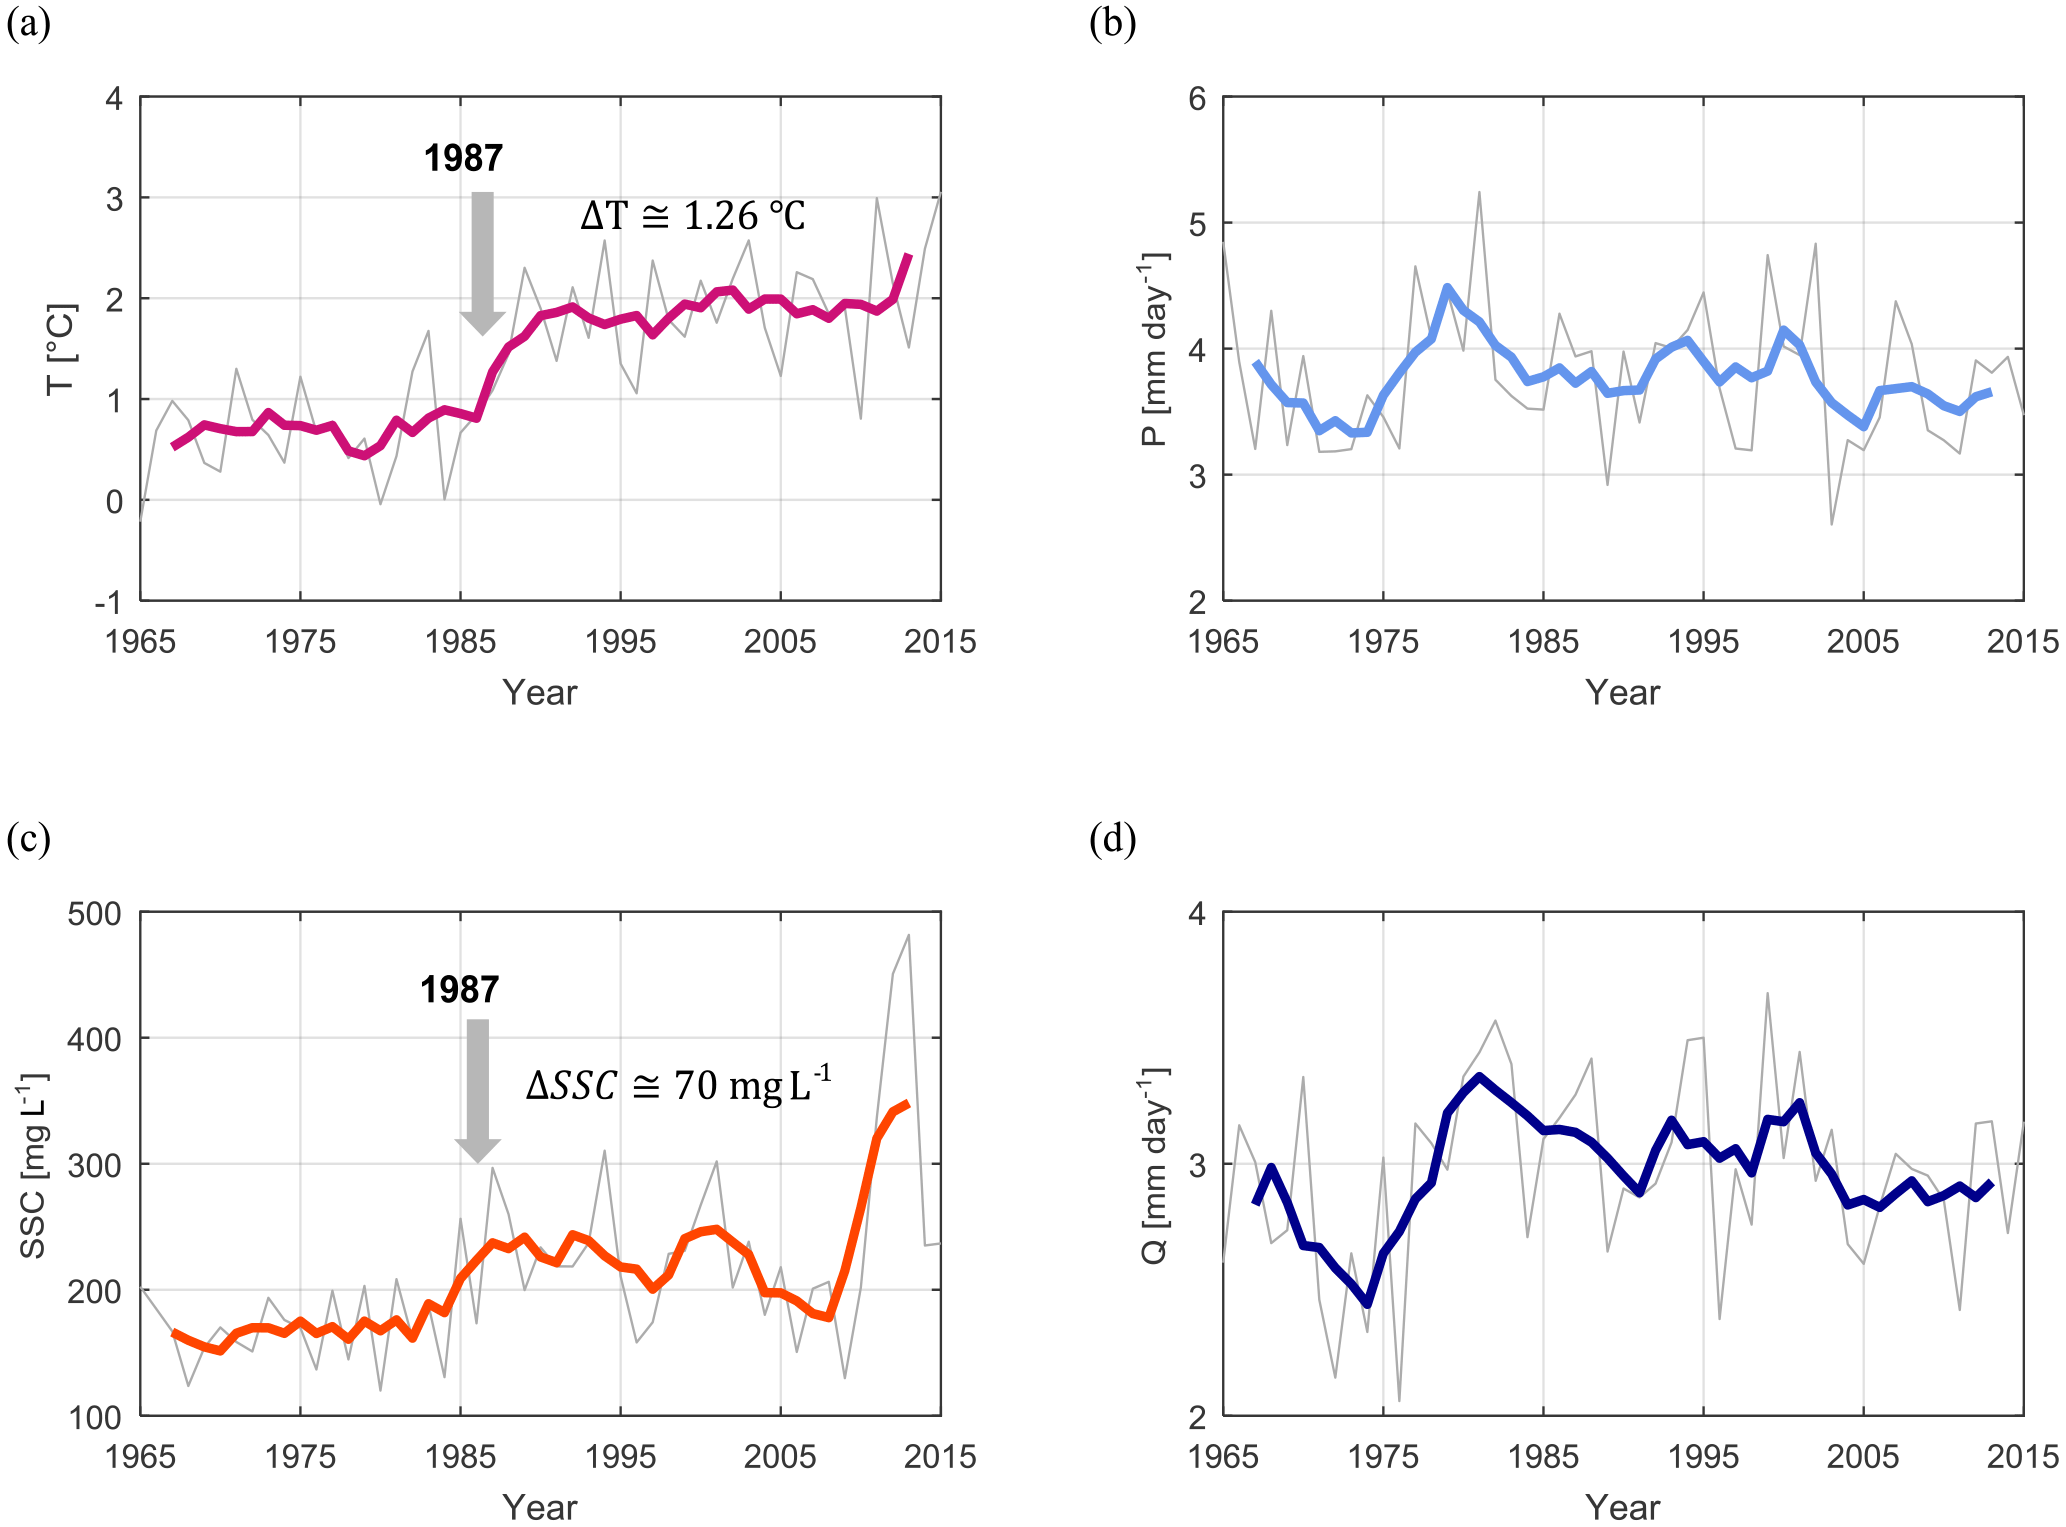
Figure 6Observations for the period 1965–2015 of (a) basin-averaged air temperature, (b) basin-averaged daily precipitation, (c) suspended sediment concentration measured at the outlet of the basin, and (d) daily discharge per unit area measured at the outlet of the basin. Mean annual values are shown in grey and the 5-years moving average is shown with a bold line.
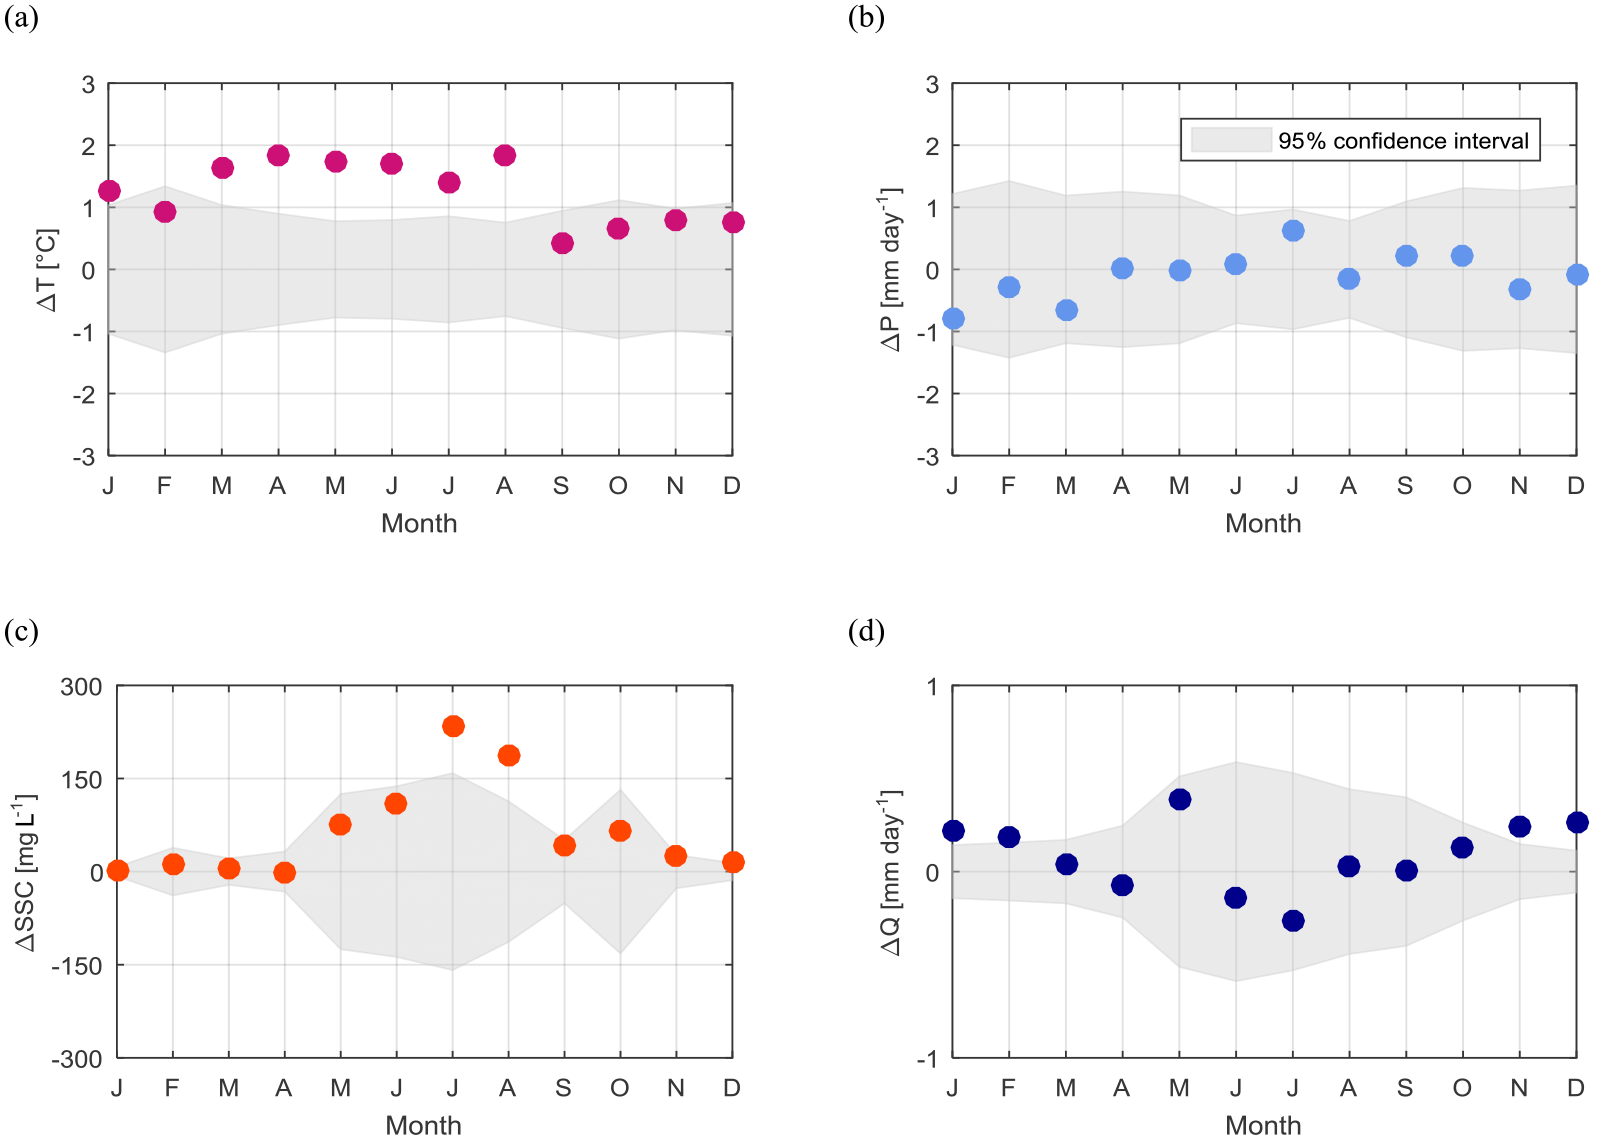
Figure 7Monthly differences between the period after and before the year-of-change (1987–2015 and 1965–1986) of: (a) basin-averaged air temperature, (b) basin-averaged daily precipitation, (c) mean suspended sediment concentration measured at the outlet of the basin, and (d) daily discharge per unit area measured at the outlet of the basin. Points outside the confidence interval (grey shaded area) represent statistically significant (5 % significance level) changes in the monthly mean.

Figure 8Simulations for the period 1975–2015 of mean annual variables: (a) snowmelt SM, (b) snow-cover fraction SCF, (c) ice melt IM, and (d) effective rainfall ER. Mean annual values are shown in grey and a 5-year moving average is shown with a thick line.
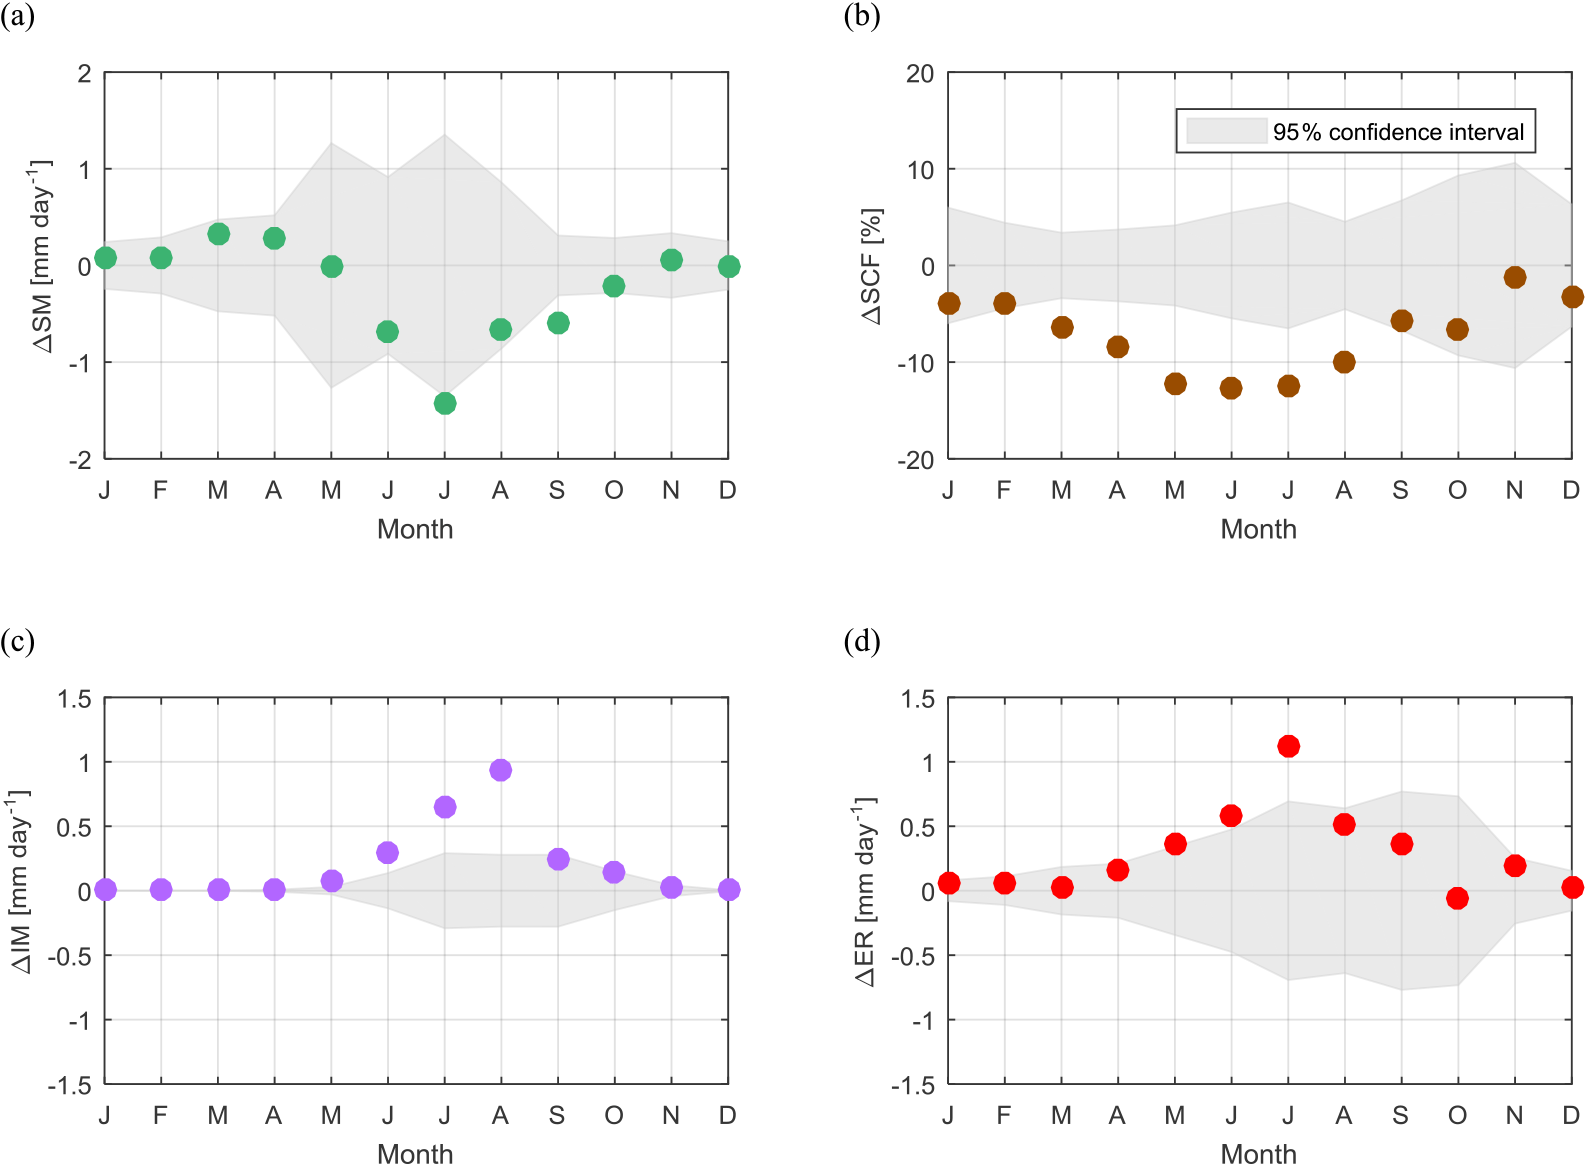
Figure 9Mean monthly differences (between 1987–2015 and 1975–1986) in variables (a) snowmelt SM, (b) snow-cover fraction SCF, (c) ice melt IM, and (d) effective rainfall ER. Points outside the confidence interval (grey shaded area) represent statistically significant (5 % significance level) changes in the monthly mean.
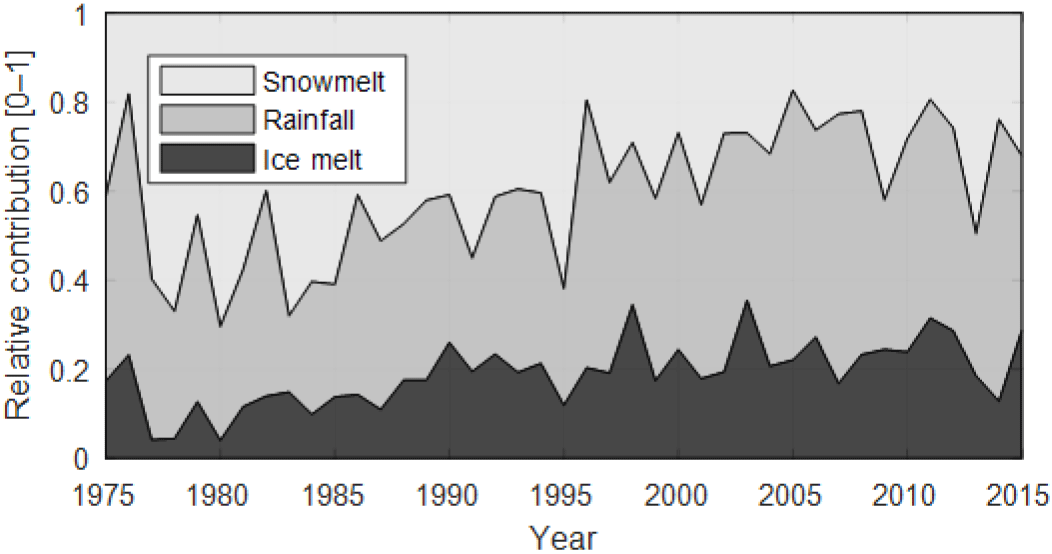
Figure 10Relative contribution of snowmelt (SM), rainfall (R), and ice melt (IM) for the summer months July–August, computed as the ratio between each component and their sum. Rainfall is extracted from observed precipitation by using a rain–snow temperature threshold, snow and ice melt are simulated with spatially distributed temperature-index models.
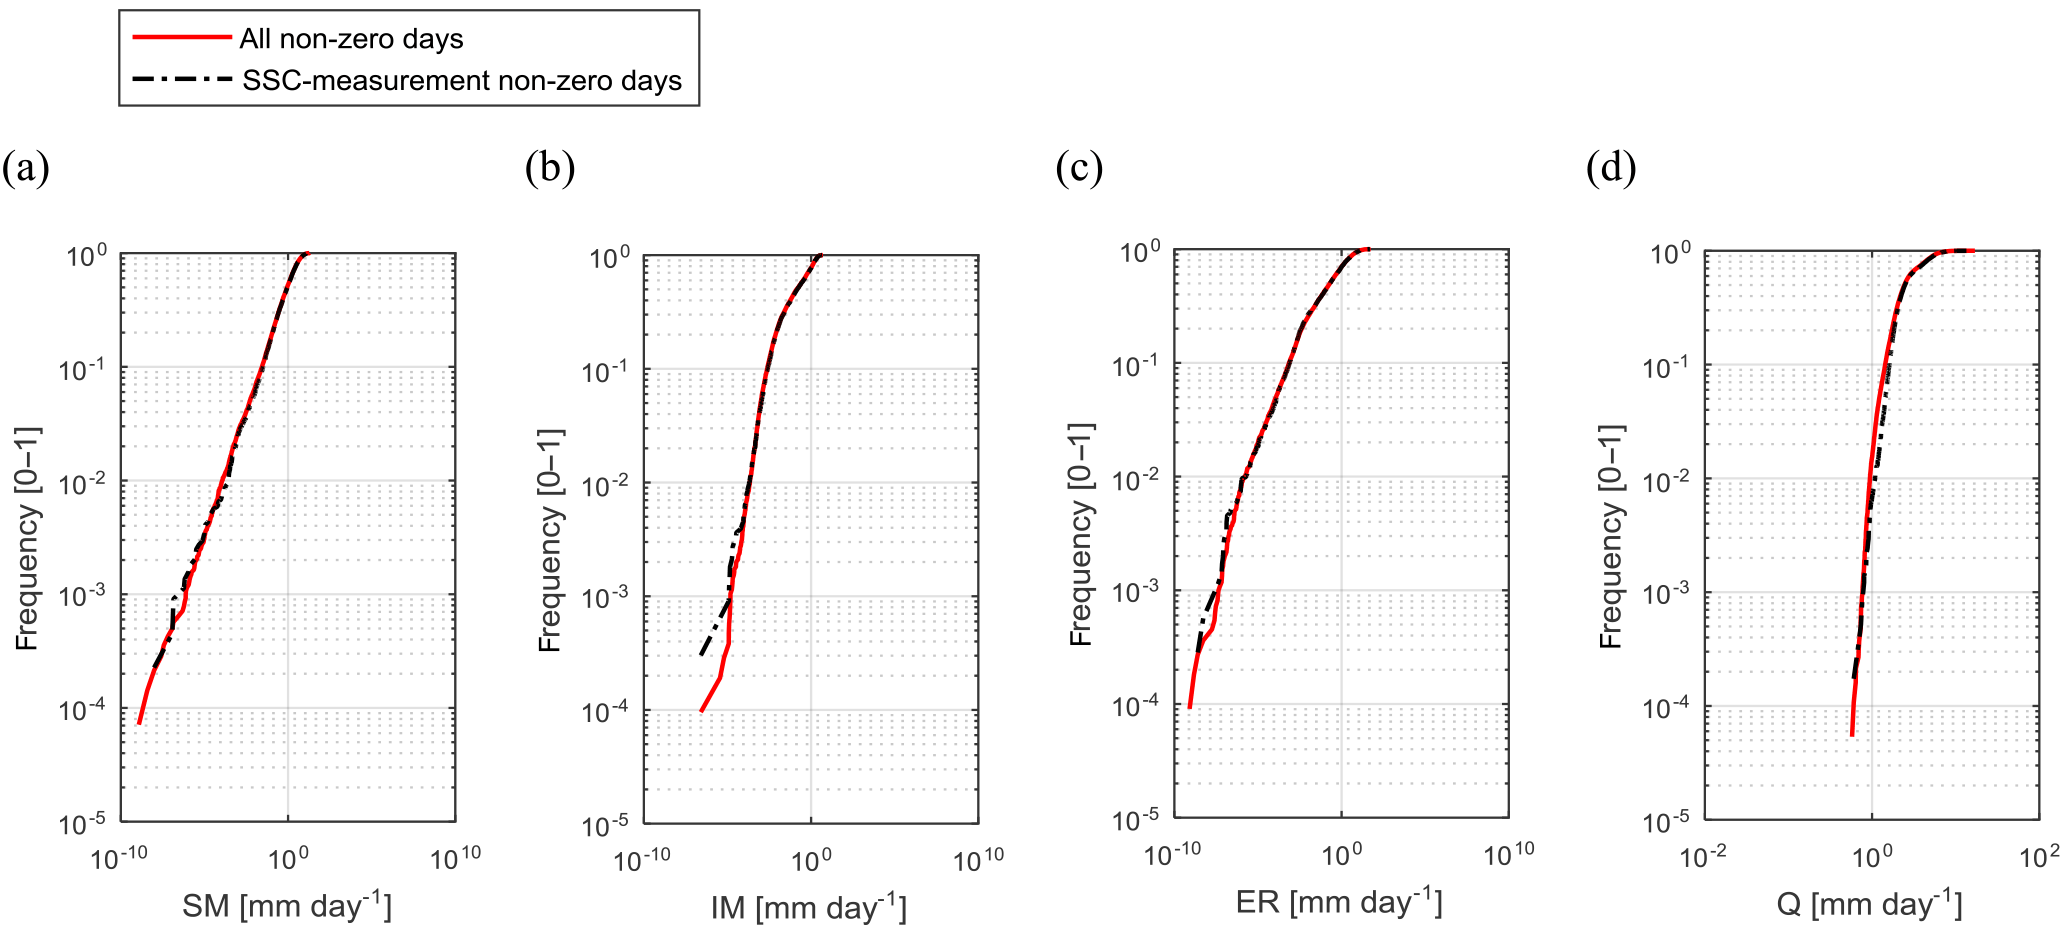
Figure 11Empirical cumulative distribution functions of total daily basin-averaged SM (a), IM (b), ER (c), and Q (d), computed on all days and only on days corresponding to SSC measurements. Only non-zero values of SM, IM and ER, are included.
5.2 Temperature, precipitation, discharge, and SSC in the Rhône Basin
Mean annual air temperature shows a clear and statistically significant increase in 1987 (p value < 0.01). A two-sample t test for equal means (p value < 0.01) confirms an increase in mean daily temperature greater than 1 ∘C (Fig. 6a). Statistical tests on monthly means reveal that the 1987 temperature jump is mainly in spring and summer months from March to August, while changes in the autumn and winter months are not statistically significant (Fig. 7a). For the period March–August, mean monthly temperatures have risen by about 1.7 ∘C on the average.
The change in air temperature around 1987 coincides with statistically significant changes in mean annual suspended sediment concentration (Fig. 6c). After the abrupt warming, mean annual suspended sediment concentrations are roughly 40 % larger than before: average values have risen from 172±6.86 mg L−1 before 1987 up to 242±14.45 mg L−1 after 1987, where the ranges express the standard error of the mean. This change can be ascribed to statistically significant (p value < 0.01) increases in summer (July–August) concentrations (Fig. 7c). Suspended sediment concentration is also characterized by much larger interannual variability after 1987 than before: the standard deviation of mean annual SSC increases from ∼ 32 mg L−1 before 1987 up to ∼ 78 mg L−1 after (Fig. 6c). A statistically significant increase in the variance is confirmed with a two-sample F test at 5 % significant level.
While the upper Rhône Basin underwent an abrupt warming around 1987, mean annual precipitation (Fig. 6b) and mean monthly precipitation (Fig. 7b) did not change significantly in time. Likewise, mean annual discharge does not show any statistically significant change in 1987 (Fig. 6d). Mean monthly discharge (Fig. 7d) is characterized by a small statistically significant increase in winter (November–February) runoff, most likely due to increased snowmelt and possibly changes in hydropower generation.
5.3 Hydroclimatic activation of sediment sources
Mean annual simulated snowmelt (SM) shows a decreasing tendency during the last 30 years (Fig. 8a). The reduction in snowmelt after 1987 occurs mostly in summer and early autumn (Fig. 9a) mainly due to poor snow cover (Fig. 9b). However, except July and September, the changes in all months are within the 95 % confidence interval. The increase in snowmelt in March and April is due to warmer temperatures in spring. Results are coherent with the temporal evolution of simulated snow-cover fraction, which is also gradually decreasing (Fig. 8b), especially in spring and summer (Fig. 9b). Statistical analysis reveals a step-like reduction of more than 10 % for mean annual values of snow-cover fraction in 1987 (p value < 0.01).
Although mean annual and monthly precipitation were shown not to change significantly in the mid-1980s, effective rainfall (ER) on snow-free areas has increased, especially in early summer (Figs. 8d, 9d). Effective rainfall increases in conjunction with decreases in snow-cover fraction, and a statistically significant jump is identified in 1987 (p value < 0.01) (Fig. 8d). However, although snow-cover fraction is significantly lower throughout the entire melting season, only June and especially July show statistically significant increases in ER after 1987 (Fig. 9d).
Our results show that the temporal evolution of ice melt is consistent with suspended sediment concentration rise. Although the change is rather gradual on the annual scale (Fig. 8c), the step-like increase in ice melt is evident in the ice-melting season (May–September) and reaches highest magnitudes in July and August (Fig. 9c) in conjunction with rises in suspended sediment concentration in those months (Fig. 7c).
The simultaneous increase in ice melt and decrease in snowmelt suggests that the abrupt warming has led to important alterations of the hydrological regime. To quantify this alteration, we compute the relative contribution of rainfall, snow, and ice melt on the sum of these three components in July and August. The average relative contribution of ice melt has almost doubled after 1987 (from ∼ 12 to ∼ 22 %; Fig. 10), while the relative contribution of snowmelt has reduced by more than 30 % (from ∼ 52.5 to ∼ 35 %; Fig. 10). This indicates the substantial effect of the sharp temperature rise on the basin hydrology.
5.4 Effect of intermittent SSC sampling
The empirical cumulative distribution functions of total daily basin-averaged SM, IM, ER, and Q, computed on all days (“all non-zero days”) and only on days corresponding to SSC measurements (“SSC-measurement non-zero days”) is shown in Fig. 11. Although extremely high and low values may indeed be missed by the non-continuous sampling, cumulative distributions of SM, IM, ER, and Q on “SSC-measurement non-zero days” and on “all non-zero days” are similar. This indicates that, although SSC is measured at a fixed interval, the sampling captures accurately the process variability. In addition, results of the statistical tests on mean monthly and mean annual values of all analysed hydroclimatic variables are unchanged. We therefore conclude that our results are not significantly influenced by the discontinuous nature of the SSC sampling.
6.1 Snowmelt and ice-melt models
The value of the snowmelt factor ksnow (3.6 mm day−1 ∘C−1) is in agreement with previous studies carried out in this region. In the upper Rhône Basin, Boscarello et al. (2014) found a snowmelt factor equal to 4.3 mm day−1 ∘C−1 based on previous studies on the Toce basin in Italy (Corbari et al., 2009). Calibration of a semi-lumped conceptual model for the three tributary catchments of the upper Rhône Basin – Lonza, Drance, and Rhône at Gletsch – led to snowmelt factors equal to 6.1, 4.5, and 6.6 mm day−1 ∘C−1, respectively (Schaefli et al., 2005). Differences in ksnow between this and previous studies are attributable to the different temporal resolution of models, lengths of calibration datasets, type and thresholds of precipitation partitioning, climatic inputs, threshold temperature for melt, and others. We highlight that the higher performance of the model in simulating snow cover at the highest elevations in our study, where most of the glaciers are located, is a prerequisite for successful ice-melt estimation. The underestimation of SCF in autumn and the overestimation in winter at lower elevations are likely related to errors in partitioning precipitation into solid and liquid form. One of the main problems of degree-day models is related to their poor performance in reproducing the spatial distribution of snow accumulation and melt in complex topography. The temperature-index approach does not take into account features that affect melting, such as topographic slope, aspect, surface roughness, and albedo (Pellicciotti et al., 2005). However, in our case, the spatial distribution of snow cover is satisfactory. Sensitivity and specificity are characterized by a strong seasonal signal. In summer, when a large part of the basin is snow-free, it is much easier for the model to capture snow-free pixels correctly than snow-covered pixels. In winter, when the basin is largely snow-covered, the situation is reversed. We account for this by computing the true skill score, which combines both sensitivity and specificity into a better representation of overall model performance.
Despite the large regional and temporal variability that characterizes ice-melt factors, comparison with previous studies confirms that the calibrated value (7.1 mm day−1 ∘C−1) is reasonable for the Alpine environment (e.g. Schaefli et al., 2005; Boscarello et al., 2014). A range from 5 to 20 mm day−1 ∘C−1 has been reported in the literature (e.g. Hock, 2003; Schaefli, 2005). It should be noted that, when calibrating the ice-melt factor, we neglect evaporation (evapotranspiration). However, evaporation indeed plays a secondary role in the long-term water balance in Alpine environments compared to precipitation and snowmelt (Braun et al., 1994; Huss et al., 2008b), especially at high elevations such as in the case of the Massa and Lonza sub-catchments.
Considering that the aim of this study is to evaluate long-term changes in hydro-climatology and sediment dynamics of the upper Rhône Basin and not the short-term variability in ice melt on the daily scale, we consider the snowmelt and ice-melt model performances as satisfactory. In addition, we show that although our model does not account for glacier retreat, it does not overestimate the ice-melt contribution during the period 1975–2015. However, considering climate projections further into the future, and glaciers that continue to retreat, the issue of future ice-melt contribution will need to be revised. Under climate change, even the largest glacier in the basin, the Aletsch Glacier, is expected to shrink at a rate where its ice-melt contribution would start decreasing before 2050 (Farinotti et al., 2012; FOEN, 2012; Brönnimann et al., 2014).
6.2 Changes in hydro-climatology and SSC
Abrupt temperature jumps, such as the one we observed in the upper Rhône basin, rather than gradual changes in air temperature have been observed globally (e.g. Jones and Moberg, 2003; Rebetez and Reinhard, 2008). Observations indicate that Switzerland has experienced two main rapid warming periods in the past, with the 1940s and 1980s being the warmest decades of the last century (Beniston et al., 1994; Beniston and Rebetez, 1996). The simultaneous increase in temperature and suspended sediment concentration indicates that changes in climatic conditions may effectively impact sediment dynamics, especially in Alpine environments where temperature-driven processes, like snow and ice-melt, have a strong influence on the basin hydrology. The statistically significant change in the SSC variance supports the finding that processes related to fine sediment regime of the upper Rhône Basin have been altered by changing climatic conditions, resulting in greater concentrations and higher variability of suspended sediment reaching the outlet of the basin.
Conversely, differences in precipitation before and after 1987 are within the 95 % confidence interval and are not statistically significant. Differences in discharge are also not statistically significant except in winter, when the suspended sediment concentration does not show changes. Therefore, it is very unlikely that the abrupt increase in suspended sediment concentration around mid-1980s in July and August is caused by changes in mean precipitation and/or discharge.
6.3 Hydroclimatic activation of sediment sources
Our simulations of snow cover and melt are in agreement with snow observations across Switzerland. The decreasing tendency in snow cover after the mid- or late 1980s has been demonstrated for the Swiss Alps (Beniston, 1997; Laternser and Schneebeli, 2003; Scherrer et al., 2004; Scherrer and Appenzeller, 2006; Marty, 2008). Snow depth, number of snowfall days, and snow cover show similar patterns during the last century: a gradual increase until the early 1980s, interrupted in late 1950s and early 1970s, and a statistically significant decrease afterwards (Beniston, 1997; Laternser and Schneebeli, 2003). Previous analyses also state that the reduction in snow cover after mid-1980s is characterized more by an abrupt shift than by a gradual decrease (Marty, 2008), in agreement with our simulations. The reduction in snow-cover duration, which is observed to be stronger at lower and mid-altitudes than at higher elevations, is mainly the result of earlier snow melting in spring due to warmer temperatures (Beniston, 1997; Laternser and Schneebeli, 2003; Marty, 2008). Moreover, by analysing 76 meteorological stations in Switzerland, Serquet et al. (2011) demonstrated a sharp decline in snowfall days relative to precipitation days, both for winter and early spring, showing the impact of higher temperature on reduced snowfall, independently of variability in precipitation frequency and intensity. Therefore, despite the high complexity that characterizes snow dynamics in the Alps (Scherrer et al., 2006, 2013), the dominant effect of temperature rise on snow-cover decline after the late 1980s has been clearly shown (Beniston, 1997; Marty, 2008; Serquet et al., 2011; Scherrer et al., 2004; Scherrer and Appenzeller, 2006).
The increase in potentially erosive rainfall is partially confirmed by recent observations. Rainfall erosivity, expressed by the R-factor of the Revised Soil Loss Equation (Wischmeier and Smith, 1978; Brown and Foster, 1987), computed on the basis of 10 min resolution precipitation data, was recently analysed for Switzerland. Although the upper Rhône Basin together with the eastern part of Switzerland was found to have relatively low rainfall erosivity (low R-factor) compared to the rest of the country, due to a lower frequency of thunderstorms and convective events (Schmidt et al., 2016), there is evidence of an increasing trend for the R-factor from May to October during the last 22 years (1989–2010; Meusburger et al., 2012). This suggests that the increase in effective rainfall on snow-free surfaces may have contributed to suspended sediment concentration rise, through a combination of reduced snow-cover fraction, increased rainfall–snowfall ratio, and possible increases in rainfall intensity on a sub-daily scale. However, simulations show a statistically significant jump in effective rainfall in June and July, while SSC is significantly larger in July and August. Therefore, we argue that erosive rainfall alone is unlikely to explain the abrupt jump in suspended sediment concentration observed around mid-1980s.
Enhanced ice melt is coherent with the observed acceleration of Alpine glacier retreat after the mid-1980s. Ground-based and satellite observations, combined with mass balance analysis, reveal that current rates of glacier retreat are consistently greater than long-term averages (Paul et al., 2004, 2007; Haeberli et al., 2007). Estimations of glacier area reduction rates indicate a loss rate for the period 1985–1999, which is 7 times greater than the decadal loss rate for the period 1850–1973 (Paul et al., 2004). Investigations with satellite data and in situ observations suggest that the volume loss of Alpine glaciers during the last 30 years is more attributable to a remarkable down-wasting rather than to a dynamic response to changed climatic conditions (Paul et al., 2004, 2007). Haeberli et al. (2007) estimated that glaciers in the European Alps lost about half of their total volume (roughly 0.5 % year−1) between 1850 and 1975, another 25 % (1 % year−1) between 1975 and 2000, and an additional 10–15 % (2–3 % year−1) in the period 2001 to 2005. The appearance of proglacial lakes and rock outcrops with lower albedo and high thermal inertia, separation of glaciers from the accumulation area, and general albedo lowering in the European Alps (Paul et al., 2005) are among the main positive feedbacks that accelerate glacier disintegration and make it unlikely to stop in the near future (Paul et al., 2007). Although glacier dynamics are quite complex and involve many variables and feedbacks, the dominant role played by temperature rise in glacier wasting has been clearly demonstrated (e.g. Oerlemans and Reichert, 2000). The major volume loss in the recent past in Swiss Alpine glaciers is attributable to negative mass balances during the ablation season rather than to a lower accumulation by precipitation (Huss et al., 2008a). For small high-altitude Alpine glaciers, Micheletti and Lane (2016) showed negligible ice-melt contributions to runoff between the mid-1960s and mid-1980s, after which contributions increased markedly.
Most importantly, runoff coming from glaciers is notoriously rich in sediments. Very fine silt-sized sediment resulting from glacier erosion is transported in suspension most often as wash load (Aas and Bogen, 1988). Proglacial areas generally represent rich sources of sediment due to active glacier erosive processes of abrasion, bed-rock fracturing, and plucking (Boulton, 1974; Hallet et al., 1996). Glacier retreat discloses a large amount of sediments available to be transported by proglacial streams. Moreover, change in climatic conditions and specifically temperature-driven glacier recession and permafrost degradation may initiate specific erosional processes that consequently enhance sediment supply in proglacial environments (Micheletti et al., 2015; Micheletti and Lane, 2016; Lane et al., 2016).
As shown in Sect. 5.3, the ice-melt increase is highest in July and August (Fig. 9c) in agreement with the jump in suspended sediment concentration (Fig. 7c), while ER rise occurred mainly in June and July (Fig. 9d). We then conclude that the significant increase in ice melt detected in the mid-1980s (Figs. 8c, 9c, 10) is likely to be the main cause of the sharp rise in suspended sediment concentration entering Lake Geneva; this occurs through a combination of (1) increased discharge originated in proglacial environments, which implies higher suspended sediment concentration; (2) a larger relative contribution of sediment-rich ice melt compared to snowmelt and precipitation fluxes; and (3) intensified sediment production and augmented sediment supply in proglacial areas due to rapid ice recession.
6.4 Anthropogenic factors and climate signals
The interpretation of increases in suspended sediment concentration may be complicated by anthropogenic drivers and changes in the mid-1980s. Three main anthropogenic activities may have potentially influenced the suspended sediment regime of the upper Rhône Basin: river channelization, construction of reservoirs and hydropower operations, and gravel extraction along the main stream and tributaries. However, the second and last large channelization project was completed in 1960 (Oliver et al., 2009), much earlier than the observed increase in SSC. Likewise, the largest reservoirs in the catchment have been in operation since 1975 (Loizeau and Dominik, 2000). Therefore, it is unlikely that these two anthropogenic factors have contributed to the SSC rise detected in the mid-1980s. The same holds for gravel mining activities. Annual volumes of gravel extracted from the Rhône, provided by the Valais Cantonal Authorities as differences from the average over the period 1989–2014, do not show any significant correlation with mean annual suspended sediment concentration (R2=0.08). Although gravel mining operation may perturb SSC for short periods after river bed disturbance by causing local pulses of fine sediments, this process does not significantly affect the suspended sediment load at the outlet of the basin on seasonal and annual timescales. A possibility still remains that changes in the hydropower operation itself, i.e. the distribution of flow responding to electricity demand, and the flushing of dams have increased SSC concentrations. We currently do not have any evidence for such changes; however, we think it is unlikely that they would have long-term effects on SSC.
Our results show that even in highly human-impacted and regulated catchments such as the Rhône Basin, a strong climatic signal in hydrological and sediment dynamics can persist. This also suggests that the decrease in fine-sediment load at the outlet of the upper Rhône Basin observed in the 1960s on the basis of sediment cores recovered in the Rhône delta region and reported by Loizeau et al. (1997), could be the result of a combined effect of hydropower system development, as it has been hypothesized (Loizeau et al., 1997; Loizeau and Dominik, 2000), but also reduced ice-melt loads due to colder temperatures at the time. The cooling period, which occurred between the 1950s and late the 1970s (e.g. Beniston et al., 1994) was characterized by colder and snowy winters (e.g. Laternser and Schneebeli, 2003) and has been accompanied by reduced ice-melt rates, glacier advance, and positive glacier mass balances (Zemp et al., 2008; VAW-ETH, 2015).
The climate signal in sediment dynamics takes on particular importance in the context of climate change projections into the future. Despite the large uncertainty, future projections under different climate change scenarios show a common tendency for Switzerland, characterized by a shift from snow-dominated to rain-dominated hydrological regime, reduced summer discharge, increased winter discharge, reduced snow cover, and enhanced glacier retreat (Bavay et al., 2009; Jouvet et al., 2011; Brönnimann et al., 2014; Fatichi et al., 2015; Huss and Fischer, 2016). In contrast to these hydrological predictions, changes in sediment fluxes are highly uncertain due to the complexity and feedbacks of the processes involved, inherent stochasticity in sediment mobilization and transport, and large regional variability in sediment connectivity across the Alpine landscape (Cavalli et al., 2013; Heckmann and Schwanghart, 2013; Bracken et al., 2015; Lane et al., 2017).
The aim of this research was to analyse changes in the hydroclimatic and suspended sediment regimes of the upper Rhône Basin during the period 1975–2015. We show an abrupt increase in basin-wide mean air temperature in the mid-1980s. The simultaneous step-like increase in suspended sediment concentration at the outlet of the catchment, detected in July and August, suggests a causal link between fine sediment dynamics and climatic conditions. Two main factors link warmer climate and enhanced SSC: increased transport capacity and increased sediment supply resulting from spatial and/or temporal activation–deactivation of sediment sources. Our results show that transport capacity, through discharge, is not likely to explain the increases in SSC because no statistically significant changes in the mid-1980s are present in Rhône Basin discharge, neither on the annual nor monthly timescales. The suggestion is that the impact of warmer climatic conditions acts on fine sediment dynamics through the activation and deactivation of different sediment sources and different sediment production and transport processes.
To understand sediment supply conditions, we analyse the temporal evolution of three main sediment fluxes: (1) sediments sourced and transported by snowmelt along hillslopes and channels; (2) sediments entrained and transported by erosive rainfall events over snow-free surfaces, including hillslope, channel bank erosion, and mass wasting events; and (3) fine sediment fluxes generated by glacier ice-melt. The fluxes of snow and ice melt together with snow-cover fraction and rainfall are analysed to detect changes in time and their coherence with changes in SSC.
Our results show that while mean annual precipitation does not show any evident change between the periods before and after the SSC jump in the mid-1980s, potentially erosive rainfall clearly increases over time especially in June and July, but not in August. On the other hand, ice melt has significantly increased due to temperature-driven enhanced ablation. Statistically significant shifts in ice melt were identified for summer, with highest increases in July and August, in accordance with the rise in SSC. Concurrently to the temperature and SSC rise, the relative contribution of ice melt to total annual runoff (sum of rainfall, snow, and ice-melt) presents a significant increase in the mid-1980s, substantially altering the hydrological regime of the Rhône Basin. Based on these results, we propose that climate has an effect on fine sediment dynamics by altering the three main fluxes of suspended sediment in the Rhône Basin, and that ice melt plays a dominant role in the suspended sediment concentration rise in the mid-1980s through (1) increased flow derived from sediment-rich subglacial and proglacial areas, (2) a larger relative contribution of sediment-rich ice melt compared to snowmelt and precipitation, and (3) increased sediment supply in hydrologically connected proglacial areas due to glacier recession. While snowmelt has decreased, the reduced extent and duration of snow cover may also have contributed to the suspended sediment concentration rise through enhanced erosion by heavy rainfall events over snow-free surfaces.
Because changes in SSC are not consistent with changes in discharge and transport capacity, our work emphasizes how the inclusion of sediment sources and their activation through different processes of production and transport is necessary for attributing change. This analysis also demonstrates that climate-driven changes in suspended sediment dynamics may be significantly strong even in highly regulated and human-impacted catchments such as the upper Rhône Basin, where sediment fluxes are affected by flow regulation due to hydropower production and by grain-size dependent trapping in reservoirs. This has consequences for climate change impact assessments and projections for Alpine catchments with hydropower systems, where climate change signals are sometimes thought to be secondary to human regulation. Although at this stage we cannot reliably conclude in which direction sediment fluxes will change in the future, our paper clearly shows that a more process-based understanding of the connections between hydrological change and the activation of sediment sources will provide us with a better framework for analysing and attributing changes in sediment yields in Alpine catchments in the future.
Data analysed in the current study are available from the Swiss Federal Office for the Environment (FOEN, streamflow and suspended sediment concentration), the Swiss Federal Office for Topography (Swisstopo, DEM), and the Swiss Federal Office of Meteorology and Climatology (MeteoSwiss, gridded datasets of temperature and precipitation). Daily catchment-averaged data (observed and simulated) used in the analysis are available from the author.
The supplement related to this article is available online at: https://doi.org/10.5194/hess-22-509-2018-supplement.
AC and PM designed the methodology. AC developed the code and carried out simulations and computations. AC prepared the manuscript with contributions from all co-authors.
The authors declare that they have no conflict of interest.
We thank Christoph Frei (Federal Office of Meteorology and Climatology
MeteoSwiss) for providing us with experimental temperature and precipitation
datasets and for suggestions on the right use of MeteoSwiss gridded data and
the application of statistical tests. We also thank Daniel Farinotti (Swiss
Federal Institute for Forest, Snow and Landscape Research WSL, Department of
Civil, Environmental and Geomatic Engineering ETH Zurich) for providing us
with GloGEM simulations, for the fruitful discussion on glacier retreat and
glacier dynamics and for kindly revising the manuscript. The Federal Office
of the Environment (FOEN) provided discharge and suspended sediment
concentration data. We thank Alessandro Grasso (FOEN) for the explanation on
the SSC data collection procedures. Finally, we would like to thank the
Valais Cantonal Authorities for supplying information on gravel mining
extraction. This research was supported by the Swiss National Science
Foundation Sinergia grant 147689 (SEDFATE).
Edited by: Laurent Pfister
Reviewed by: two anonymous
referees
Aas, E. and Bogen, J.: Colors of Glacier Water, Water Resour. Res., 24, 561–565, 1988.
Allouche, O., Tsoar, A., and Kadmon, R.: Assessing the accuracy of species distribution models: prevalence, kappa and the true skill statistic (TSS), J. Appl. Ecol., 43, 1223–1232, 2006.
Anselmetti, F. S., Bühler, R., Finger, D., Girardclos, S., Lancini, A., Rellstab, C., and Sturm, M.: Effects of Alpine hydropower dams on particle transport and lacustrine sedimentation, Aquat. Sci., 69, 179–198, 2007.
Auer, A. H.: The rain versus snow threshold temperatures, Weatherwise, 27, 67–67, https://doi.org/10.1080/00431672.1974.9931684, 1974.
Ballantyne, C. K.: A general model of paraglacial landscape response, Holocene, 12, 371–376, 2002.
Bavay, M., Lehning, M., Jonas, T., and Löwe, H.: Simulations of future snow cover and discharge in Alpine headwater catchments, Hydrol. Process., 23, 95–108, 2009.
Begueria, S.: Validation and Evaluation of Predictive Models in Hazard Assessment and Risk Management, Nat. Hazards, 37, 315–329, https://doi.org/10.1007/s11069-005-5182-6, 2006.
Beniston, M.: Variations of snow depth and duration in the Swiss Alps over the last 50 years: Links to changes in large-scale climatic forcings, Clim. Change, 36, 281–300, 1997.
Beniston, M. and Rebetez, M.: Regional behavior of minimum temperatures in Switzerland for the period 1979–1993, Theor. Appl. Climatol., 53, 231–243, 1996.
Beniston, M., Rebetez, M., Giorgi, F., and Marinucci, R.: An analysis of regional climate change in Switzerland, Theor. Appl. Climatol., 49, 135–159, 1994.
Bennett, G., Molnar, P., Eisenbeiss, H., and McArdell, B. W.: Erosional power in the Swiss Alps: characterization of slope failure in the Illgraben, Earth Surf. Proc. Land., 37, 1627–1640, https://doi.org/10.1002/esp.3263, 2012.
Boscarello, L., Ravazzani, G., Rabuffetti, D., and Mancini, M.: Integrating glaciers raster–based modelling in large catchments hydrological balance: the Rhône case study, Hydrol. Process., 28, 496–508, https://doi.org/10.1002/hyp.9588, 2014.
Boulton, G. S.: Processes and patterns of glacial erosion, in: Glacial Geomorphology, edited by: Coates, D. R., Springer, Dordrecht, 41–87, 1974.
Bracken, L. J., Turnbull, L., Wainwright, J., and Bogaart, P.: Sediment connectivity: a framework for understanding sediment transfer at multiple scales, Earth Surf. Proc. Land., 40, 177–188, 2015.
Braun, L. N., Aellen, M., Funk, M., Hock, R., Rohrer, M. B., Steinegger, U., Kappenberger, G., and Müller-Lemans, H.: Measurement and simulation of high alpine water balance components in the Linth- Limmern head watershed (north-eastern Switzerland), Z. Gletscherkunde Glazialgeologie, 30, 161–185, 1994.
Brown, L. C. and Foster, G. R.: Storm erosivity using idealized intensity distributions, T. ASAE, 30, 379–386, 1987.
Brönnimann, S., Appenzeller, C., Croci-Maspoli, M., Fuhrer, J., Grosjean, M., Hohmann, R., Ingold, K., Knutti, R., Liniger, M. A., Raible, C. C., Röthlisberger, R., Schär, C., Scherrer, S. C., Strassmann, K., and Thalmann. P.: Climate change in Switzerland: a review of physical, institutional, and political aspects, WIRES Clim. Change, 5, 461–481, https://doi.org/10.1002/wcc.280, 2014.
Cavalli, M., Trevisani, S., Comiti, F., and Marchi, L.: Geomorphometric assessment of spatial sediment connectivity in small Alpine catchments, Geomorphology, 188, 31–41, https://doi.org/10.1016/j.geomorph.2012.05.007, 2013.
Collins, W. D., Rasch, P. J., Boville, B. A., Hack, J. J., McCaa, J. R., Williamson, D. L., Kiehl, J. T., and Briegleb, B.: Description of the NCAR community atmosphere model (CAM3), Tech. Rep. NCAR/TN- 464+STR, 226 pp., 2004.
Corbari, C., Ravazzani, G., Martinelli, J., and Mancini, M.: Elevation based correction of snow coverage retrieved from satellite images to improve model calibration, Hydrol. Earth Syst. Sci., 13, 639–649, https://doi.org/10.5194/hess-13-639-2009, 2009.
Dedieu, J.-P., Boos, A., Kiage, W., and Pellegrini, M.: Snow cover retrieval over Rhône and Po river basins from MODIS optical satellite data (2000–2009), Geophys. Res. Abstracts, 12, 5532, EGU General Assembly 2010, 2010.
Delunel, R., van der Beek, P., Bourlès, D., Carcaillet J., and Schlunegger, F.: Transient sediment supply in a high-altitude Alpine environment evidenced through a 10Be budget of the Etages catchment (French Western Alps), Earth Surf. Proc. Land., 39, 890–899, https://doi.org/10.1002/esp.3494, 2014.
England, P. and Molnar, P.: Surface uplift, uplift of rocks, and exhumation of rocks, Geology, 18, 1173–1177, 1990.
Farinotti, D., Usselmann, S., Huss, M., Bauder, A., and Funk M.: Runoff evolution in the Swiss Alps: projections for selected high-alpine catchments based on ENSEMBLES scenarios, Hydrol. Process., 26, 1909–1924, 2012.
Fatichi, S., Rimkus, S., Burlando, P., Bordoy, R., and Molnar, P.: High-resolution distributed analysis of climate and anthropogenic changes on the hydrology of an Alpine catchment, J. Hydrol., 525, 362–382, 2015.
Fischer, M., Huss, M., and Hoelzle, M.: Surface elevation and mass changes of all Swiss glaciers 1980–2010, The Cryosphere, 9, 525–540, https://doi.org/10.5194/tc-9-525-2015, 2015.
FOEN: Auswirkungen der Klimaänderung auf Wasserressourcen und Gewässer. Synthesebericht zum Projekt “Klimaänderung und Hydrologie in der Schweiz” (CCHydro), Bundesamt für Umwelt, Bern, Umwelt-Wissen, 1217, 76 pp., 2012.
Foster, G. C., Dearing, R. A., Jones, R. T., Crook, D. S., Siddle, D. J., Harvey, A. M., James, P. A., Appleby, P. G., Thompson, R., Nicholson, J., and Loizeau, J.-L.: Meteorological and land use controls on past and present hydro-geomorphic processes in the pre-alpine environment: an integrated lake-catchment study at the Petit Lac d'Annecy, France, Hydrol. Process., 17, 3287–3305, 2003.
Frei, C.: Interpolation of temperature in a mountainous region using nonlinear profiles and non-Euclidean distances, Int. J. Climatol., 34, 1585–1605, 2014.
Frei, C., Schöll, R., Fukutome, S., Schmidli, J., and Vidale, P. L.: Future change of precipitation extremes in Europe: An intercomparison of scenarios from regional climate models, J. Geophys. Res., 111, D06105, https://doi.org/10.1029/2005JD005965, 2006.
Gabbud, C. and Lane, S. N.: Ecosystem impacts of Alpine water intakes for hydropower: the challenge of sediment management, WIRES Water, 3, 41–61, https://doi.org/10.1002/wat2.1124, 2016.
Gardner, A. S., Moholdt, G., Cogley, J. G., Wouters, B., Arendt, A. A., and Wahr, J.: A reconciled estimate of glacier contributions to sea level rise: 2003 to 2009, Science, 340, 852–857, https://doi.org/10.1126/science.1234532, 2013.
Grasso, A., Bérod, D., and Hodel, H.: Messung und Analyse der Verteilung von Schwebstoffkonzentrationen im Querprofil von Fliessgewässern, Wasser Energie Luft, 107, 61–65, 2012.
Haeberli, W. and Holzhauser, H.: Alpine glacier mass changes during the past two millennia, PAGES News, 11, 13–15, 2003.
Haeberli, W., Hoelzle, M., Paul, F., and Zemp, M.: Integrated monitoring of mountain glaciers as key indicators of global climate change: the European Alps, Ann. Glaciol., 46, 150–160, 2007.
Hallett, B., Hunter, L., and Bogen, J.: Rates of erosion and sediment evacuation by glaciers: A review of field data and their implications, Global Planet. Change, 12, 213–235, 1996.
Heckmann, T. and Schwanghart, W.: Geomorphic coupling and sediment connectivity in an alpine catchment – Exploring sediment cascades using graph theory, Geomorphology, 182, 89–103, 2013.
Herman, F., Beyssac, O., Brughelli, M., Lane, S. N., Leprince, S., Adatte, T., Lin, J. Y. Y., and Avouac, J. P.: Erosion by an Alpine glacier, Science, 350, 193–195, 2015.
Hinderer, M., Kastowski, M., Kamelger, A., Bartolini, C., and Schlunegger, F.: River loads and modern denudation of the Alps – A review, Earth-Sci. Rev., 118, 11–44, 2013.
Hock, R.: Temperature index melt modelling in mountain areas, J. Hydrol., 282, 104–115, 2003.
Hornung, J., Pflanz, D., Hechler, A., Beer, A., Hinderer, M., Maisch, M., and Bieg, U.: 3-D architecture, depositional patterns and climate triggered sediment fluxes of an alpine alluvial fan (Samedan, Switzerland), Geomorphology, 115, 202–14, 2010.
Huggel, C., Clague, J. J., and Korup, O.: Is climate change responsible for changing landslide activity in high mountains?, Earth Surf. Proc. Land., 37, 77–91, 2012.
Huss, M. and Farinotti, D.: Distributed ice thickness and volume of all glaciers around the globe, J. Geophys. Res., 117, F04010, https://doi.org/10.1029/2012JF002523, 2012.
Huss, M. and Fischer, M.: Sensitivity of Very Small Glaciers in the Swiss Alps to Future Climate Change, Front. Earth Sci., 4, 34, https://doi.org/10.3389/feart.2016.00034, 2016.
Huss, M. and Hock, R.: A new model for global glacier change and sea-level rise, Front. Earth Sci., 3, 54, https://doi.org/10.3389/feart.2015.00054, 2015.
Huss, M., Bauder, A., Funk, M., and Hock, R.: Determination of the seasonal mass balance of four Alpine glaciers since 1865, J. Geophys. Res.-Atmos., 113, F01015, https://doi.org/10.1029/2007JF000803, 2008a.
Huss, M., Farinotti, D., Bauder, A., and Funk, M.: Modelling runoff from highly glacierized alpine drainage basins in a changing climate, Hydrol. Process., 22, 3888–3902, 2008b.
Huss, M., Jouvet, G., Farinotti, D., and Bauder, A.: Future high-mountain hydrology: a new parameterization of glacier retreat, Hydrol. Earth Syst. Sci., 14, 815–829, https://doi.org/10.5194/hess-14-815-2010, 2010.
Jones, P. D. and Moberg, A.: Hemispheric and large-scale surface air temperature variations: an extensive revision and an update to 2001, J. Climate, 16, 206–223, 2003.
Jouvet, G., Huss, M., Funk, M., and Blatter, H.: Modelling the retreat of Grosser Aletschgletscher, Switzerland, in a changing climate, J. Glaciol., 57, 1033–1045, 2011.
Kondolf, G. M., Gao, Y., Annandale, G. W., Morris, G. L., Jiang, E., Zhang, J., Cao, Y., Carling, P., Fu, K., Guo, Q., Hotchkiss, R., Peteuil, C., Sumi, T., Wang, H.-W., Wang, Z., Wei, Z., Wu, B., Wu, C., and Yang, C. T.: Sustainable sediment management in reservoirs and regulated rivers: Experiences from five continents, Earths Future, 2, 256–280, https://doi.org/10.1002/2013EF000184, 2014.
Lane, S. N., Bakker, M., Gabbud, C., Micheletti, N., and Saugy, J. N.: Sediment export, transient landscape response and catchment-scale connectivity following rapid climate warming and Alpine glacier recession, Geomorphology, 277, 210–227, https://doi.org/10.1016/j.geomorph.2016.02.015, 2016.
Laternser, M. and Schneebeli, M.: Long-term Snow Climate Trends of the Swiss Alps (1931–99), Int. J. Climatol., 23, 733–750, 2003.
Lenzi, M. A., Mao, L., and Comiti, F.: Interannual variation of suspended sediment load and sediment yield in an alpine catchment, Hydrolog. Sci. J., 48, 899–915, https://doi.org/10.1623/hysj.48.6.899.51425, 2003.
Loizeau, J.-L. and Dominik J.: Evolution of the Upper Rhône River discharge and suspended sediment load during the last 80 years and some implications for Lake Geneva, Aquat. Sci., 62, 54–67, https://doi.org/10.1007/s000270050075, 2000.
Loizeau, J.-L., Dominik, J., Luzzi, T., and Vernet J.-P.: Sediment Core Correlation and Mapping of Sediment Accumulation Rates in Lake Geneva (Switzerland, France) Using Volume Magnetic Susceptibility, J. Great Lakes Res., 23, 391–402, 1997.
Marty, C.: Regime shift of snow days in Switzerland, Geophys. Res. Lett., 35, L12501, https://doi.org/10.1029/2008GL033998, 2008.
Mason, S. J. and Graham, N. E.: Conditional Probabilities, Relative Operating Characteristics, and Relative Operating Levels, Weather Forecast., 14, 713–725, 1999.
Meteoswiss, Federal Office of Meteorology and Climatology: Documentation of MeteoSwiss Grid-Data Products Daily Precipitation (final analysis): RhiresD, available at: http://www.meteoswiss.admin.ch/content/dam/meteoswiss/de/service-und-publikationen/produkt/raeumliche-daten-niederschlag/doc/ProdDoc_RhiresD.pdf, 2013a.
Meteoswiss, Federal Office of Meteorology and Climatology: Documentation of MeteoSwiss Grid-Data Products Daily Mean, Minimum and Maximum Temperature: TabsD, TminD, TmaxD, available at: https://www.ethz.ch/content/dam/ethz/special-interest/baug/ifu/hydrology-dam/documents/research-data/ifu-hydrologie-data-proddoctabsd.pdf, 2013b.
Meusburger K. and Alewell C.: Soil Erosion in the Alps. Experience gained from case studies (2006–2013), Federal Office for the Environment, Bern, Environmental studies no. 1408, 116 pp., 2014.
Meusburger, K., Steel, A., Panagos, P., Montanarella, L., and Alewell, C.: Spatial and temporal variability of rainfall erosivity factor for Switzerland, Hydrol. Earth Syst. Sci., 16, 167–177, https://doi.org/10.5194/hess-16-167-2012, 2012.
Micheletti, N. and Lane, S. N.: Water yield and sediment export in small, partially glacierized Alpine watersheds in a warming climate, Water Resour. Res., 52, 4924–4943, https://doi.org/10.1002/2016WR018774, 2016.
Micheletti, N., Lambiel, C., and Lane, S. N.: Investigating decadal-scale geomorphic dynamics in an alpine mountain setting, J. Geophys. Res.-Earth, 120, 2155–2175, https://doi.org/10.1002/2015JF003656, 2015.
Nash, J. E. and Sutcliffe, J. V.: River Flow Forecasting Through Conceptual Models Part 1 – A Discussion of Principles, J. Hydrol., 10, 282–290, 1970.
Oerlemans, J. and Reichert, B. K.: Relating glacier mass balance to meteorological data using a Seasonal Sensitivity Characteristic (SSC), J. Glaciol., 46, 1–6, 2000.
Oliver, J.-M., Carrel, G., Lamouroux, N., Dole-Oliver, M.-J., Malard, F., Bravard, J.-P., and Amoros, C.: The Rhône River Basin, in: Rivers of Europe, chap. 7, Academic Press, London, 247–295, 2009.
Palazón, L. and Navas, A.: Land use sediment production response under different climatic conditions in an alpine-prealpine catchment, Catena, 137, 244–255, 2016.
Paul, F., Kääb, A., Maisch, M., Kellenberger, T., and Haeberli, W.: Rapid disintegration of Alpine glaciers observed with satellite data, Geophys. Res. Lett., 31, L21402, https://doi.org/10.1029/2004GL020816, 2004.
Paul, F., Machguth, H., and Kääb, A.: On the impact of glacier albedo under conditions of extreme glacier melt: the summer of 2003 in the Alps, EARSeL eProceedings 4, 139–149, 2005.
Paul, F., Kääb, A., and Haeberli, W.: Recent glacier changes in the Alps observed from satellite: Consequences for future monitoring strategies, Global Planet. Change, 56, 111–122, 2007.
Pellicciotti, F., Brock, B., Strasser, U., Burlando, P., Funk, M., and Corripio, J.: An enhanced temperature-index melt model including the shortwave radiation balance: development and testing for Haut Glacier d'Arolla, Switzerland, J. Glaciol., 51, 573–587, 2005.
Pettitt, A. N.: A Non-parametric Approach to the Change-point Problem, Appl. Statist., 28, 126–135, 1979.
Quinton, W. L. and Carey, S. K.: Towards an energy-based runoff generation theory for tundra landscapes, Hydrol. Process., 22, 4649–4653, 2008.
Rebetez, M. and Reinhard, M.: Monthly air temperature trends in Switzerland 1901–2000 and 1975–2004, Theor. Appl. Climatol., 91, 27–34, https://doi.org/10.1007/s00704-007-0296-2, 2008.
Santiago, S., Thomas, R. L., McCarthy, L., Loizeau, J. L., Larbaigt, G., Corvi, C., Rossel, D., Tarradellas, J., and Vernet, J. P.: Particle Size Characteristics of Suspended and Bed Sediments in The Rhône River, Hydrol. Process., 6, 227–240, 1992.
Schaefli, B., Hingray, B., Niggli, M., and Musy, A.: A conceptual glacio-hydrological model for high mountainous catchments, Hydrol. Earth Syst. Sci., 9, 95–109, https://doi.org/10.5194/hess-9-95-2005, 2005.
Scherrer, S. C. and Appenzeller, C.: Swiss Alpine snow pack variability: major patterns and links to local climate and large-scale flow, Climate Res., 32, 187–199, 2006.
Scherrer, S. C., Appenzeller C., and Laternser, M.: Trends in Swiss Alpine snow days: the role of local- and large-scale climate variability, Geophys. Res. Lett., 31, L13215, https://doi.org/10.1029/2004GL020255, 2004.
Scherrer, S. C., Wüthrich, C., Croci-Maspoli, M., Weingartner, R., and Appenzeller, C.: Snow variability in the Swiss Alps 1864–2009, Int. J. Climatol., 33, 3162–3173, https://doi.org/10.1002/joc.3653, 2013.
Schlunegger, F. and Hinderer, M.: Crustal uplift in the Alps: why the drainage pattern matters, Terra Nova, 13, 425–432, 2001.
Schmidt, S., Alewell, C., Panagos, P., and Meusburger, K.: Regionalization of monthly rainfall erosivity patterns in Switzerland, Hydrol. Earth Syst. Sci., 20, 4359–4373, https://doi.org/10.5194/hess-20-4359-2016, 2016.
Serquet, G., Christoph, M., Dulex, J. P., and Rebetez, M.: Seasonal trends and temperature dependence of the snowfall/precipitation-day ratio in Switzerland, Geophys. Res. Lett., 38, L07703, https://doi.org/10.1029/2011GL046976, 2011.
Stutenbecker, L., Costa, A., and Schlunegger, F.: Lithological control on the landscape form of the upper Rhône Basin, Central Swiss Alps, Earth Surf. Dynam., 4, 253–272, https://doi.org/10.5194/esurf-4-253-2016, 2016.
Swift, D. A., Nienow, P. W., and Hoey, T. B.: Basal sediment evacuation by subglacial meltwater: suspended sediment transport from Haut Glacier d'Arolla, Switzerland, Earth Surf. Proc. Land., 30, 867–883, 2005.
Syvitski, J. P. M., Vörösmarty, C. J., Kettner, A. J., and Green, P.: Impact of Humans on the Flux of Terrestrial Sediment to the Global Coastal Ocean, Science, 308, 376–380, 2005.
VAW-ETH: The Swiss Glaciers, Yearbooks of the Cryospheric Commission of the Swiss Academy of Sciences (SCNAT) (1881–2016), Laboratory of Hydraulics, Hydrology and Glaciology (VAW), Glaciological reports no. 1–134, available at: http://swiss-glaciers.glaciology.ethz.ch/publications.html, last access: 10 January 2018.
Vernon, A. J., Van der Beek, P. A., Sinclair, H. D., and Rahn, M. K.: Increase in Late Neogene denudation of the European Alps confirmed by analysis of a fission-track thermochronology database, Earth Planet. Sci. Lett., 270, 316–329, 2008.
Wen, L. J., Nagabhatla, N., Lü, S. H., and Wang, S. Y.: Impact of rain snow threshold temperature on snow depth simulation in land surface and regional atmospheric model, Adv. Atmos. Sci., 30, 1449–1460, 2013.
Wick, L., Van Leeuwen, J. F. N., Van der Knaap, W. O., and Lotter, A. F.: Holocene vegetation development in the catchment of Sägistalsee (1935 m a.s.l.), a small lake in the Swiss Alps, J. Paleolimnol., 30, 261–272, 2003.
Wilks, D. S.: Statistical Methods in the Atmospheric Sciences, Academic Press, 467 pp., 1995.
Wischmeier, W. H. and Smith, D. D.: Predicting Rainfall Erosion Losses – A Guide to Conservation Planning, Supersedes Agriculture Handbook, No. 537, Washington DC, 58 pp., 1978.
Wood, J. L., Harrison, S., Turkington, T. A. R., and Reinhardt, L.: Landslides and synoptic weather trends in the European Alps, Clim. Change, 136, 297–308, 2016.
Zemp, M., Paul, F., Hoelzle, M., and Haeberli, W.: Glacier fluctuations in the European Alps, 1850–2000: an overview and spatio-temporal analysis of available data, in: Darkening Peaks: Glacier Retreat, Science, and Society, edited by: Orlove, B., Wiegandt, E., and Luckman, B. H., Berkeley, US, 152–167, 2008.
Zerathe, S., Lebourg, T., Braucher, R., and Bourles, D.: Mid-Holocene cluster of large-scale landslides revealed in the Southwestern Alps by Cl-36 dating. Insight on an Alpine-scale landslide activity, Quaternary Sci. Rev., 90, 106–127, 2014.