the Creative Commons Attribution 4.0 License.
the Creative Commons Attribution 4.0 License.
 | 26 Jul 2018
Riparian evapotranspiration is essential to simulate streamflow dynamics and water budgets in a Mediterranean catchment
Anna Lupon
José L. J. Ledesma
Susana Bernal
Riparian trees can regulate streamflow dynamics and water budgets by taking up large amounts of water from both soil and groundwater compartments. However, their role has not been fully recognized in the hydrologic literature and the catchment modeling community. In this study, we explored the influence of riparian evapotranspiration (ET) on streamflow by simulating daily stream water exports from three nested Mediterranean catchments, both including and excluding the riparian compartment in the structure of the PERSiST (Precipitation, Evapotranspiration and Runoff Simulator for Solute Transport) rainfall–runoff model. The model goodness of fit for the calibration period (September 2010–August 2012) significantly improved with the inclusion of the riparian compartment, especially during the vegetative period, when according to our simulations, the riparian zone significantly reduced the overestimation of mean daily streamflow (from 53 % to 27 %). At the catchment scale, simulated riparian ET accounted for 5.5 % to 8.4 % of annual water depletions over a 20-year reference period (1981–2000), and its contribution was especially noticeable during summer (from 8 % to 26 %). Simulations considering climate change scenarios suggest large increases in riparian ET during the dormant period (from 19 % to 46 %) but only small increases (from 1 % to 2 %) in its contribution to annual water budgets. Overall, our results highlight that a good assessment of riparian ET is essential for understanding catchment hydrology and streamflow dynamics in Mediterranean regions. Thus, the inclusion of the riparian compartment in hydrological models is strongly recommended in order to establish proper management strategies in water-limited regions.
- Article
(3276 KB) - Full-text XML
-
Supplement
(359 KB) - BibTeX
- EndNote


Precipitation and upland tree evapotranspiration (ET) are considered the two most important components controlling annual water budgets in catchment hydrology (e.g., Kampf and Burges, 2007; Ledesma and Futter, 2017). This conceptualization is supported by the fact that, in most regions, landscape compartments other than uplands (e.g., riparian zones) occupy a small percentage of the catchment area (<3 %) (Tockner and Stanford, 2002). However, empirical studies have shown that water storage and ET within riparian zones can influence seasonal streamflow dynamics by lowering groundwater levels and increasing groundwater residence times (Bernal et al., 2004; Burt et al., 2002). Moreover, water demand by riparian trees can drive diel fluctuations in streamflow by taking up water from both riparian groundwater and streams (Flewelling et al., 2014; Gribovszki et al., 2010). These empirical studies suggest that hydrological processes occurring in the riparian zone, and specifically those induced by riparian ET, can be critical to understanding streamflow dynamics at both daily and seasonal scales (e.g., Flewelling et al., 2014; Lupon et al., 2016; Rassam et al., 2006). However, there are few hydrological catchment models explicitly considering the riparian compartment, which ultimately limits our ability to quantify the influence of riparian zones on streamflow and catchment water exports across regions.
Riparian trees can play an important role in catchment water budgets because their water requirements are generally high compared to upland tree species (Baldocchi and Ryu, 2011; Doody and Benyon, 2011). However, the contribution of riparian ET to catchment annual water budgets varies widely among biomes (from 0 % to >30 %) depending on the amount of water available for vegetation (Dahm et al., 2002; Cadol et al., 2012; Contreras et al., 2011). In tropical systems, for instance, soil water content is usually high in both upland and riparian zones, and hence, these two compartments show similar ET rates (2–5 mm day−1; Cadol et al., 2012; da Rocha et al., 2004). Conversely, in arid systems, riparian zones stay relatively wet compared to upland areas and can support ET rates between 1 and 7 mm day−1, as much as 1 order of magnitude higher than those in the surrounding upland (0.1–0.4 mm day−1; Dahm et al., 2002; Kurc and Small, 2004). Moreover, relatively large water demands by riparian trees can contribute to disconnecting saturated soils from streams and promoting the displacement of stream water towards the riparian zone (Butturini et al., 2003; Lupon et al., 2016; Rassam et al., 2006). These studies suggest that the potential of riparian forests to shape water budgets likely increases with increasing water scarcity, and thus, resolving the role of riparian zones within catchment hydrology modeling is essential to properly manage current and future water resources.
Mediterranean catchments are unique natural laboratories for evaluating the influence of riparian ET on stream and catchment hydrology as well as for testing the response of riparian ET to changes in climatic drivers, namely temperature and precipitation. Mediterranean regions exhibit marked seasonal patterns in both hydrology and vegetative activity, and they hold an intermediate position in the climatic gradient, which makes them especially vulnerable to future changes in climate (IPCC, 2013). Furthermore, previous studies have shown that riparian ET causes abrupt changes in groundwater tables in summer, which are essential for predicting daily streamflow in Mediterranean areas (Lupon et al., 2016; Medici et al., 2008). Thus, hydrological models that consider the riparian compartment could be helpful to better understand the influence of riparian zones on catchment water budgets and water availability for both in- and off-stream uses.
The aim of this study was to explore the role of riparian ET in simulating present and future streamflow dynamics and catchment water exports in a Mediterranean forested headwater on a seasonal and annual basis. To do so, we used the PERSiST (Precipitation, Evapotranspiration and Runoff Simulator for Solute Transport; Futter et al., 2014) rainfall–runoff model to reproduce the observed stream hydrographs and ET rates at three nested catchments along which the area covered by riparian forests increased from 0 % to 10 %, both including and excluding the riparian compartment in the model structure. In addition, we simulated different climate scenarios for the region in order to explore changes in the relative contribution of riparian ET to future total catchment water budgets with increasing drying.
The Font del Regàs catchment is located in Montseny Natural Park, northeastern Spain (41∘50′ N, 2∘30′ E). The climate is subhumid Mediterranean, with mild winters, wet springs, and dry summers. Annual precipitation is 925±151 mm (mean ±SD), less than 1 % falling as snow. Mean annual temperature averages 12.1±2.5 ∘C (period 1940–2000, Catalan Metereological Service).
The total catchment area is 14.2 km2 and the altitude ranges from 500 to 1500 m a.s.l. (above sea level) (Fig. 1). The geology is dominated by biotitic granite and the topography includes steep slopes (28 %) (Institut Cartografic de Catalunya, 2010). Evergreen oak forests (Quercus ilex) cover the lower part of the catchment (54 % of the catchment area), whereas the upper part is covered mainly by deciduous European beech (Fagus sylvatica) forests and heathlands (38 and 2% of the catchment area, respectively) (Fig. 1). Soils of heathlands, oak, and beech forests are sandy, with a 3 cm deep O horizon followed by a 5–15 cm deep A horizon and >100 cm deep B horizons. Riparian forest covers 6 % of the total catchment area, and it is relatively flat (slope<10 %). Both riparian width and the total basal area of riparian trees markedly increase along the catchment (Table 1). Black alder (Alnus glutinosa), European ash (Fraxinus excelsior), black locust (Robinea pseudoacacia), and black poplar (Populus nigra) are the most abundant tree species in the riparian forest, with a basal area of 14, 4, 3, and 2 m2 ha−1, respectively. Riparian soils are sandy loam, with a 5 cm deep organic layer, followed by a 30 cm deep A horizon and a >90 cm deep B horizon.
Table 1Local catchment drainage area, percentage of evergreen oak, decidious beech, and riparian forest area, width of the riparian zone, and total basal area of riparian trees for the three nested catchments considered in this study.
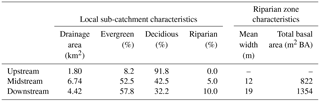
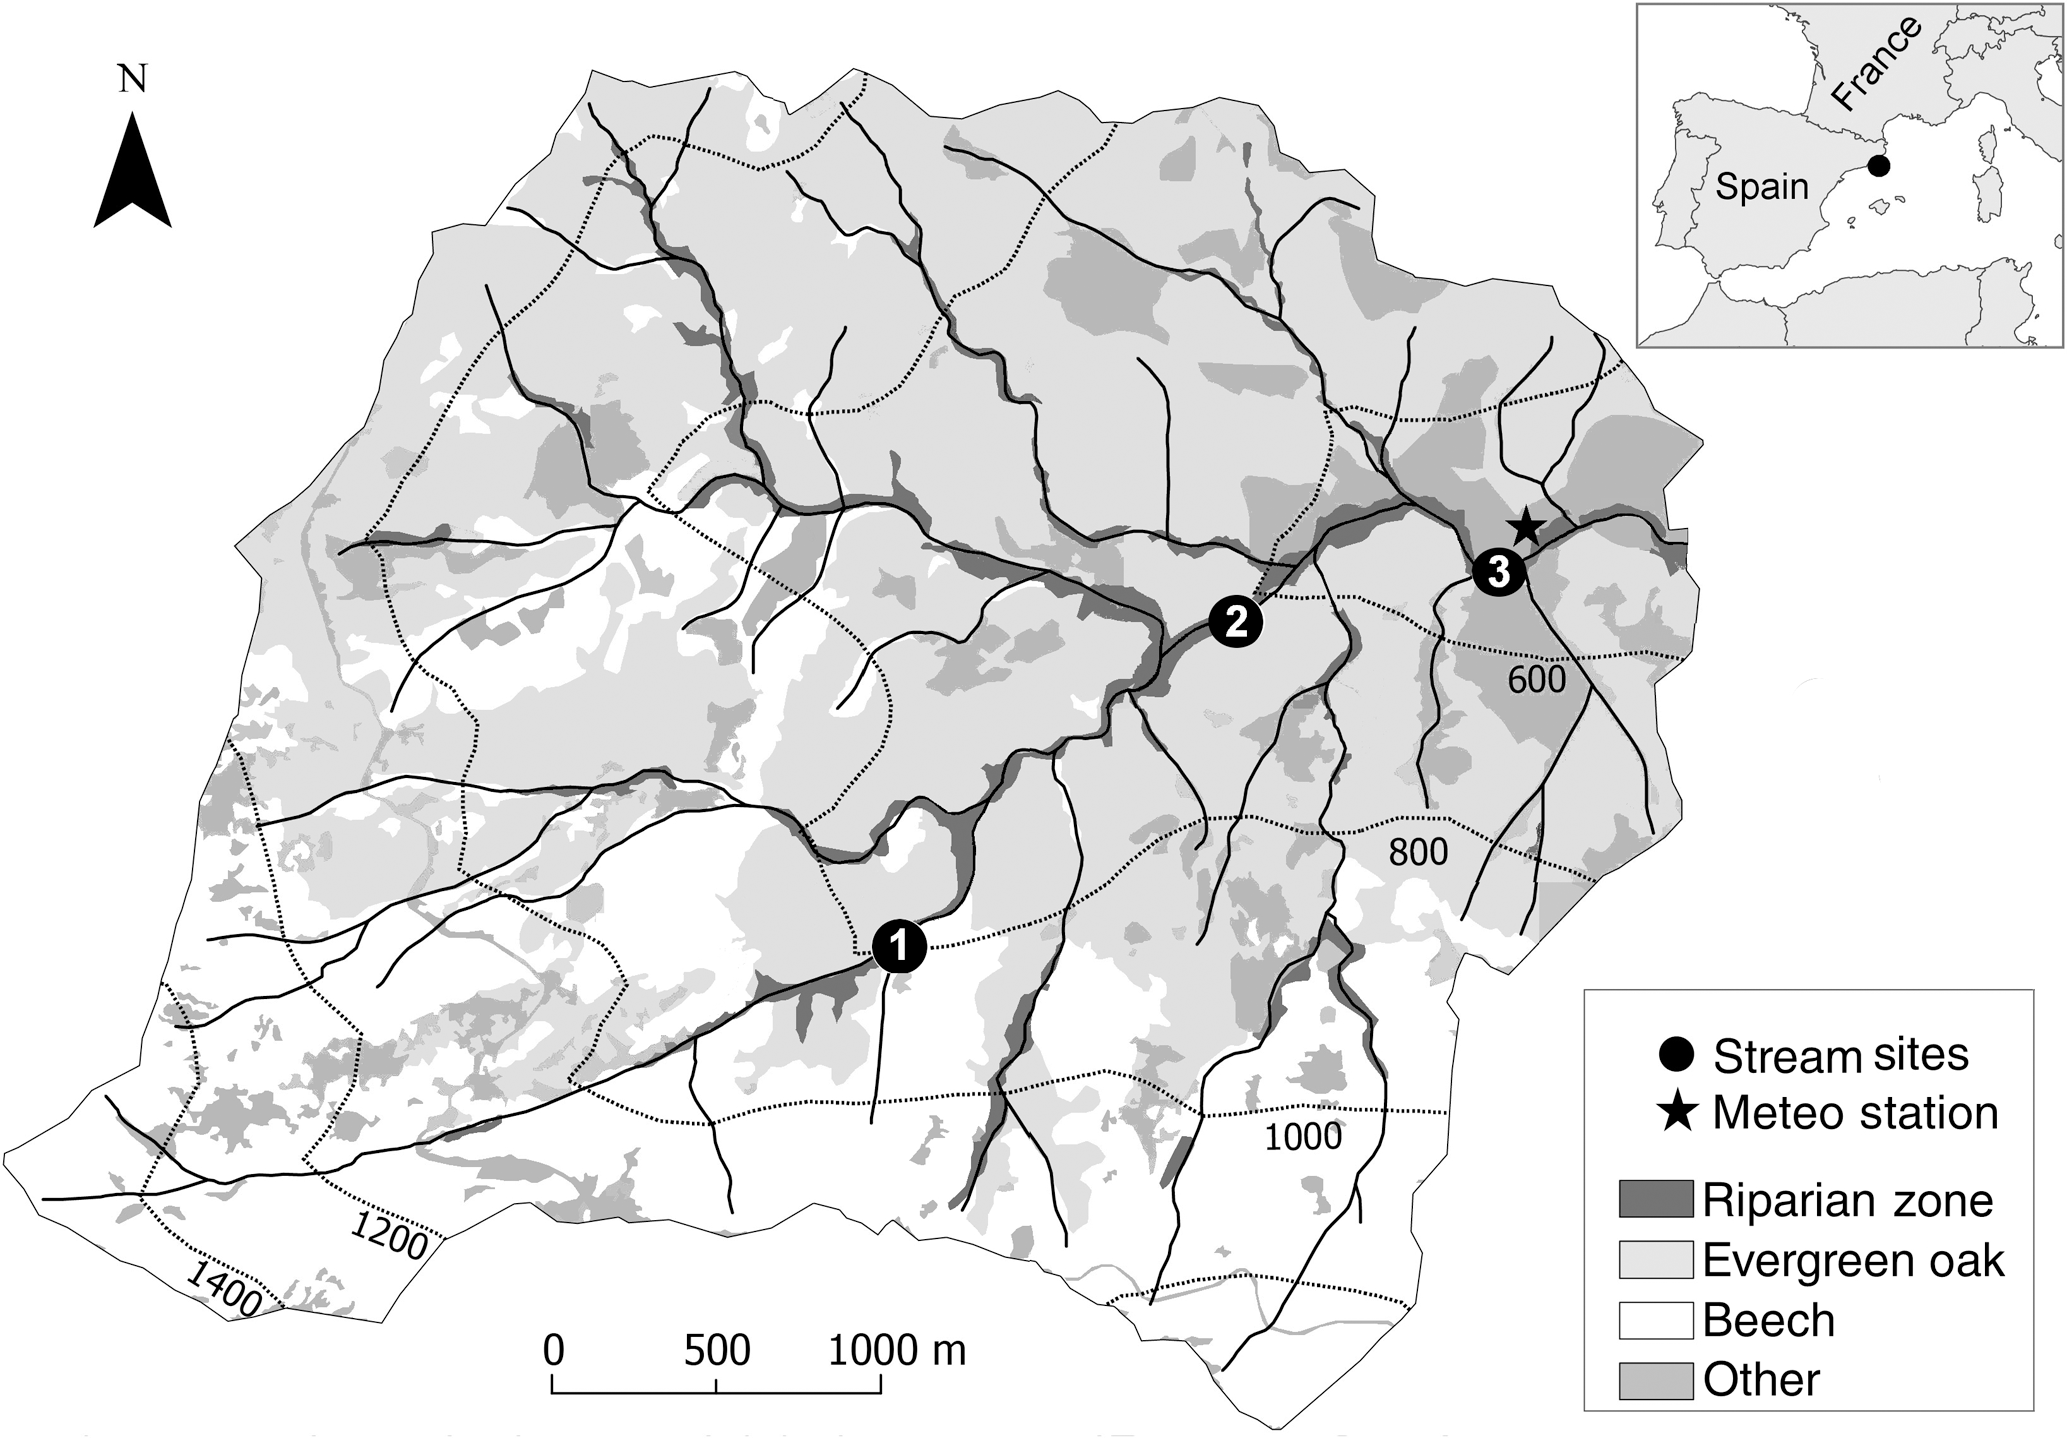
Figure 1Map of the Font del Regàs catchment showing the different land covers (landscape units), the catchment elevation (dotted lines, 500–1500 m), the location of the three nested stream sites (black circles; 1: upstream; 2: midstream; and 3: downstream), and the meteorological station where precipitation and temperature were measured (star). The location of the Font del Regàs catchment within Spain is shown in the inset.
For this study, we selected three nested catchments (total drainage area 12.96 km2) along a 5.6 km stretch of the Font del Regàs stream (Fig. 1). The upstream sub-catchment (800–1500 m a.s.l., local drainage area 1.8 km2) was mostly composed of beech forest (93 %) and had no riparian forest (Table 1). Vegetation in the midstream sub-catchment (650–800 m a.s.l., local drainage area 6.74 km2) included both oak (52.5%) and beech (42.5%) forests (Table 1). The stream in the midstream sub-catchment had a wetted width of 2–3 m and was flanked by a mixed riparian forest (5 %, 5–15 m wide) of Alnus glutinosa and Fraxinus excelsior. The downstream sub-catchment (500–650 m a.s.l., local drainage area 4.42 km2) was mainly covered by oak forest (58 %) and, to a lesser extent, by beech forest (32 %) (Table 1). The stream in the downstream sub-catchment had a wetted width of 3–3.5 m and was flanked by a well-developed riparian forest (10 %, 15–30 m wide) consisting mainly of Robinea pseudoacacia, Populus nigra, and Alnus glutinosa.
3.1 PERSiST model description
PERSiST is a conceptual, semi-distributed, bucket-type model that simulates daily catchment water fluxes (Futter et al., 2014). The flexible model framework allows representation of the runoff generation process as a specified number of vertically and horizontally interconnected buckets (representing soil boxes) within a mosaic of landscape units at daily time steps. In this way, PERSiST conceptualizes the landscape in four spatial levels: whole-catchment (level 1), sub-catchment (level 2), landscape unit (level 3), and bucket/soil box (level 4). The flexible framework allows differentiation of the riparian compartment (or “bucket”) from other catchment water compartments (such as uplands or streams) (Supplement 1).
In short, the model works as follows. Rainfall can be intercepted by canopy or directed to a “quick bucket”, which in its turn can route the water to the stream via overland flow or infiltrate it to an upper soil box. From the upper soil box, water can infiltrate to lower soil boxes (e.g., groundwater), move laterally to the riparian zone or the stream, or return to the atmosphere via ET (Supplement 1). Landscape unit-specific square matrixes are used to specify the fraction of water moving between contiguous soil layers and with the stream at every time step. Water movement is also controlled by field capacities, hydrological connectivity, and landscape unit-specific parameters related to both infiltration and ET (Supplement 2). Finally, catchment and landscape unit-specific rain multipliers are used to correct for potential rainfall measurement biases. A more detailed description of the water fluxes considered within the model as well as physical parameters controlling water movement between contiguous soil layers and towards the stream can be found in Supplement 2.
3.2 Model data and configuration
We calibrated PERSiST to match streamflow data for two complete hydrological years (September 2010–August 2012) at the outlet of the upstream, midstream, and downstream sub-catchments (Fig. 1). At each outlet, streamflows were measured in situ with water pressure sensors (Teledyne Isco, Model 1612; Lupon et al., 2016). To run the model, we used time series of daily precipitation (mm) and mean daily air temperature (∘C) as input data. Both precipitation and temperature were recorded at 15 min intervals at a meteorological station located at the valley bottom of the catchment (Fig. 1) and converted to daily values for model simulation. Model simulation was started in January 2010 to have an 8-month warm-up period prior to the calibration period. A list of all input, output, and calibration data of the model is provided in Supplement 2.
We calibrated the model for the three sub-catchments (referred as to “stream sites” hereafter) both including and excluding the riparian compartment in the model structure (Supplement 1). In the first model configuration (i.e., not including the riparian zone), we used a simple one-compartment approach to represent the catchment area in all three sub-catchments. For each sub-catchment, the upland compartment was categorized into two landscape units representing evergreen and deciduous forests in appropriate proportions (Table 1), and the soil was divided into three buckets representing quick, soil, and groundwater strata (Supplement 1). In the second model configuration (i.e., including the riparian zone), a riparian compartment was added for the midstream and downstream sub-catchments within their respective evergreen and deciduous landscape units to make up 5 % and 10 % of local drainage area, respectively (Table 1, Supplement 1). In this configuration, the riparian soil layer could receive water inputs from precipitation, the upland soil layer, and the groundwater, the latter being shared between both the upland and riparian compartments. Areal normalized ET was simulated from uplands and riparian soil boxes separately, thus obtaining simulated values of ET for evergreen upland, deciduous upland, evergreen riparian, and deciduous riparian landscape units. The evergreen and deciduous riparian ET values were combined and averaged in appropriate proportions to obtain a single value of riparian ET at daily time steps. Following knowledge of the area, overland flow was not used in any of the model configurations, and thus all water entering the quick bucket was routed directly to the upper soil box layer (upland or riparian).
3.3 Calibration procedure
Model calibration was done manually for all six model instances (3 sub-catchments × 2 model configurations) in order to (i) match ET values reported in the literature for the different forest types (“soft calibration”) and (ii) optimize a combination of statistical metrics (i.e., model efficiency) that compare simulated and observed flows (“hard calibration”). Manual calibration has been proven as a robust method for obtaining acceptable simulations within the Integrated Catchment (INCA) family of models (Cremona et al., 2017; Futter et al., 2014; Ledesma et al., 2012), of which PERSiST is the common hydrological model.
For the soft calibration, the parameterization of both upland (evergreen and deciduous) and riparian ET was adjusted to obtain values of water demand within the ranges reported for evergreen forest (i.e., evergreen oak; 550–650 mm yr−1), deciduous forest (i.e., beech; 600–750 mm yr−1), and riparian forests (i.e., poplar, alder, and ash; 750–1000 mm yr−1) at Montseny or nearby (<50 km) mountains (Àvila et al., 1996; Folch and Ferrer, 2015; Llorens and Domingo, 2007; Sabater and Bernal, 2011). We calibrated the model assuming (i) a higher ET from evergreen forest than from deciduous and riparian forests during the dormant period and (ii) a higher riparian ET than evergreen and deciduous ET during the vegetative period. The first assumption was based on the premise that deciduous trees cannot transpire during the dormant period, while the second assumption was based on the idea that riparian trees are closer to water sources, and thus, they are not as water-limited as upland trees (both evergreen oak and deciduous beech) in summer. Other parameterization requirements during soft calibration included matching reported annual canopy rainfall interception values for similar forest types (Àvila et al., 1996; Terradas, 1984; Terradas and Savé, 1992) and a rainfall correction for south- and north-facing slopes which roughly corresponded to evergreen and deciduous forests, respectively (Piñol et al., 1992).
For the hard calibration, all model parameters were adjusted to optimize the Nash–Sutcliffe (NS, Nash and Sutcliffe, 1970) efficiency index (important to fit high flows), the log(NS) (important to fit low flows), the relative volume differences of observed versus simulated streamflow (RVD) (important to maintain the water balance), and the overall graphical fit between observed and simulated hydrographs (Oni et al., 2016). For both NS and log(NS), higher values indicate a better goodness of fit, with a potential maximum of 1 for a perfect fit. For RVD, positive and negative values indicate that the model underestimated and overestimated the streamflow, respectively.
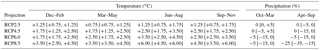
Table 2Representative concentration pathway (RCP) projections for Mediterranean zones for 2081–2100 as compared with the reference period 1981–2000. RCP values are indicated for each season for temperature and for each semester for precipitation. Values are medians and interquartile ranges [25th, 75th percentiles] (IPCC, 2013).
The importance of the riparian compartment in simulating stream water flow and catchment water budgets was determined by comparing the specific statistical metrics of goodness of fit from the two model configurations (including and excluding the riparian compartment). We compared the two model configurations for the overall calibration period as well as for the vegetative and dormant periods separately because the hydrological processes by which riparian zones influence streamflow may differ between the two periods. We considered that the vegetative period expanded between the beginning of the riparian leaf-out (April) and the peak of leaf litter fall (October), which coincides with the onset and offset of riparian tree ET, respectively (Nadal-Sala et al., 2013).
3.4 Model validation and sensitivity analysis
To validate the model, we compared monthly mean values of areal-normalized riparian ET simulated with PERSiST (output of the model) with those obtained empirically from daily streamflow variations. Daily variations of streamflow can be used as a proxy for ET from near-stream zones (Cadol et al., 2012; Flewelling et al., 2014; Gribovszki et al., 2010) and they correlate well with direct sap flow measurements at the study site (Lupon et al., 2016). Daily streamflow variations measured at one particular point integrate riparian ET upstream from that point. Thus, we assumed that differences in specific daily streamflow variations between the upstream and midstream sites, and the midstream and downstream sites, were comparable to the specific riparian ET simulated with PERSiST for the midstream and downstream sub-catchments, respectively.
To test the sensitivity of the model to the parameters related to ET, we compared model efficiencies (i.e., log(NS)) obtained from two sets of Monte Carlo (MC) analyses. In the first set, all model parameters potentially influencing streamflow were allowed to vary by ±25 % with respect to the best performing parameter set from manual calibration (non-fixed ET analysis). In the second set, ET-related parameters (i.e., degree day rates, threshold temperatures, and ET adjustments) were kept constant, while the other parameters were allowed to vary by ±25 % (fixed ET analysis). We used a Tukey HSD test to compare the model efficiencies between fixed and non-fixed ET analyses obtained for the downstream sub-catchment during the overall calibration period as well as during the vegetative and dormant periods separately. We interpreted a decrease in the goodness of fit (i.e., lower values of log(NS)) for the fixed ET analysis as an indication that the outputs of the model were sensitive to ET. A more detailed description of the sensitivity analyses can be found in Supplement 3.
3.5 Modeling future projections of water budgets
The best manual parameterization of the model configuration including the riparian compartment was used to simulate future changes in catchment water budgets and to explore the contribution of riparian ET to these changes. We calculated future water balances considering predicted changes in climate for 2081–2100. Temperature and precipitation for the reference period (1981–2000) and the future period (2081–2100) at Font del Regàs were inferred by using daily meteorological data for the period 1981–2000 from Turó de l'Home (Meteocat, http://www.meteocat.cat, last access: 1 February 2018), a meteorological station located <10 km from the study site (Supplement 4). Although Turó de l'Home is usually colder and wetter than Font del Regàs, monthly precipitation and temperature showed a strong correlation between the two stations for the period 2010–2014 (in the two cases: linear regression (l.r.) R2>0.90, p<0.001, n>53, Supplement 4). Linear regression models for these two sites were used to construct daily time series of temperature and precipitation at Font del Regàs for both the reference period (1981–2000) and the future period (2081–2100) based on representative concentration pathway (RCP) projections.
RCP projections provided by IPCC (2013) are based on the reference period 1986–2005. We assumed similar projection values for our reference period (1981–2000), which was the one for which data at Turó de l'Home were available. We applied the 2.5, 4.5, 6.0, and 8.5 RCP scenarios for Mediterranean zones including percentiles 0.25, 0.50, and 0.75 (IPCC, 2013). In general, RCP scenarios forecast an increase in temperature all year round, but more pronounced in summer than in winter. Precipitation is predicted to decrease in April–September, while small changes are expected in October–March (Table 2).
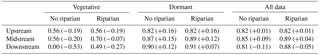
Table 3Comparison between model calibrations including and excluding the riparian compartment. Log-transformed Nash–Sutcliffe (NS) model efficiency coefficient and relative volume differences (RVDs in %) of observed versus simulated streamflow (in parentheses) at the upstream, midstream, and downstream sites for vegetative, dormant, and whole calibration periods (September 2010–August 2012). Negative RVD values indicate an overestimation of modeled flow volumes compared to observed flow volumes, while positive RVD values indicate the opposite. The NS model efficiency values are not shown because they were similar to log(NS) values.
For each year and RCP scenario, we calculated (i) the Aridity Index (AI) as a proxy of water availability (UNEP, 1992) and (ii) the relative contribution of simulated riparian ET to annual water catchment depletions at the whole catchment level, which was calculated as the sum of total simulated ET (upland and riparian at the three sub-catchments) and streamflow at the downstream site (i.e., catchment outlet). The AI relates annual precipitation and potential ET (PET), which was estimated using the Penman–Monteith equation on daily time steps (Allen et al., 1998). We assumed constant wind velocity (1 m s−1) and relative humidity (75 %). These values were based on a 5-year time series from the Font del Regàs meteorological station (period 2010–2014; wind m s−1; relative %). We examined the relationship between the relative contribution of riparian ET to annual water catchment depletions and AI by fitting a two-segment piecewise linear regression model. All statistical analyses were carried out with the R 3.3.0 statistical software (R Core Team, 2012).
4.1 Data–model fusion
For the calibration period (September 2010–August 2012), mean annual flow was 23±17, 82±66, and 105±113 L s−1 at the upstream, midstream, and downstream sites, respectively. The three sites showed the same seasonal pattern, characterized by high flows during rain events and low flows in summer (Fig. 2). The model configuration excluding the riparian compartment successfully reproduced the seasonal pattern of streamflow at the three sampling sites (Table 3 and Fig. 2). However, there were mismatches between simulated and observed values, especially during the vegetative period, when streamflows were overestimated (RVD<0, Table 3). The mismatches were especially noticeable in the downstream site, where simulated values were, on average, 53 % higher than observed ones in the vegetative period (Table 3). During the dormant period, the model slightly underestimated streamflow at the three sampling sites (+12 % %, Table 3).
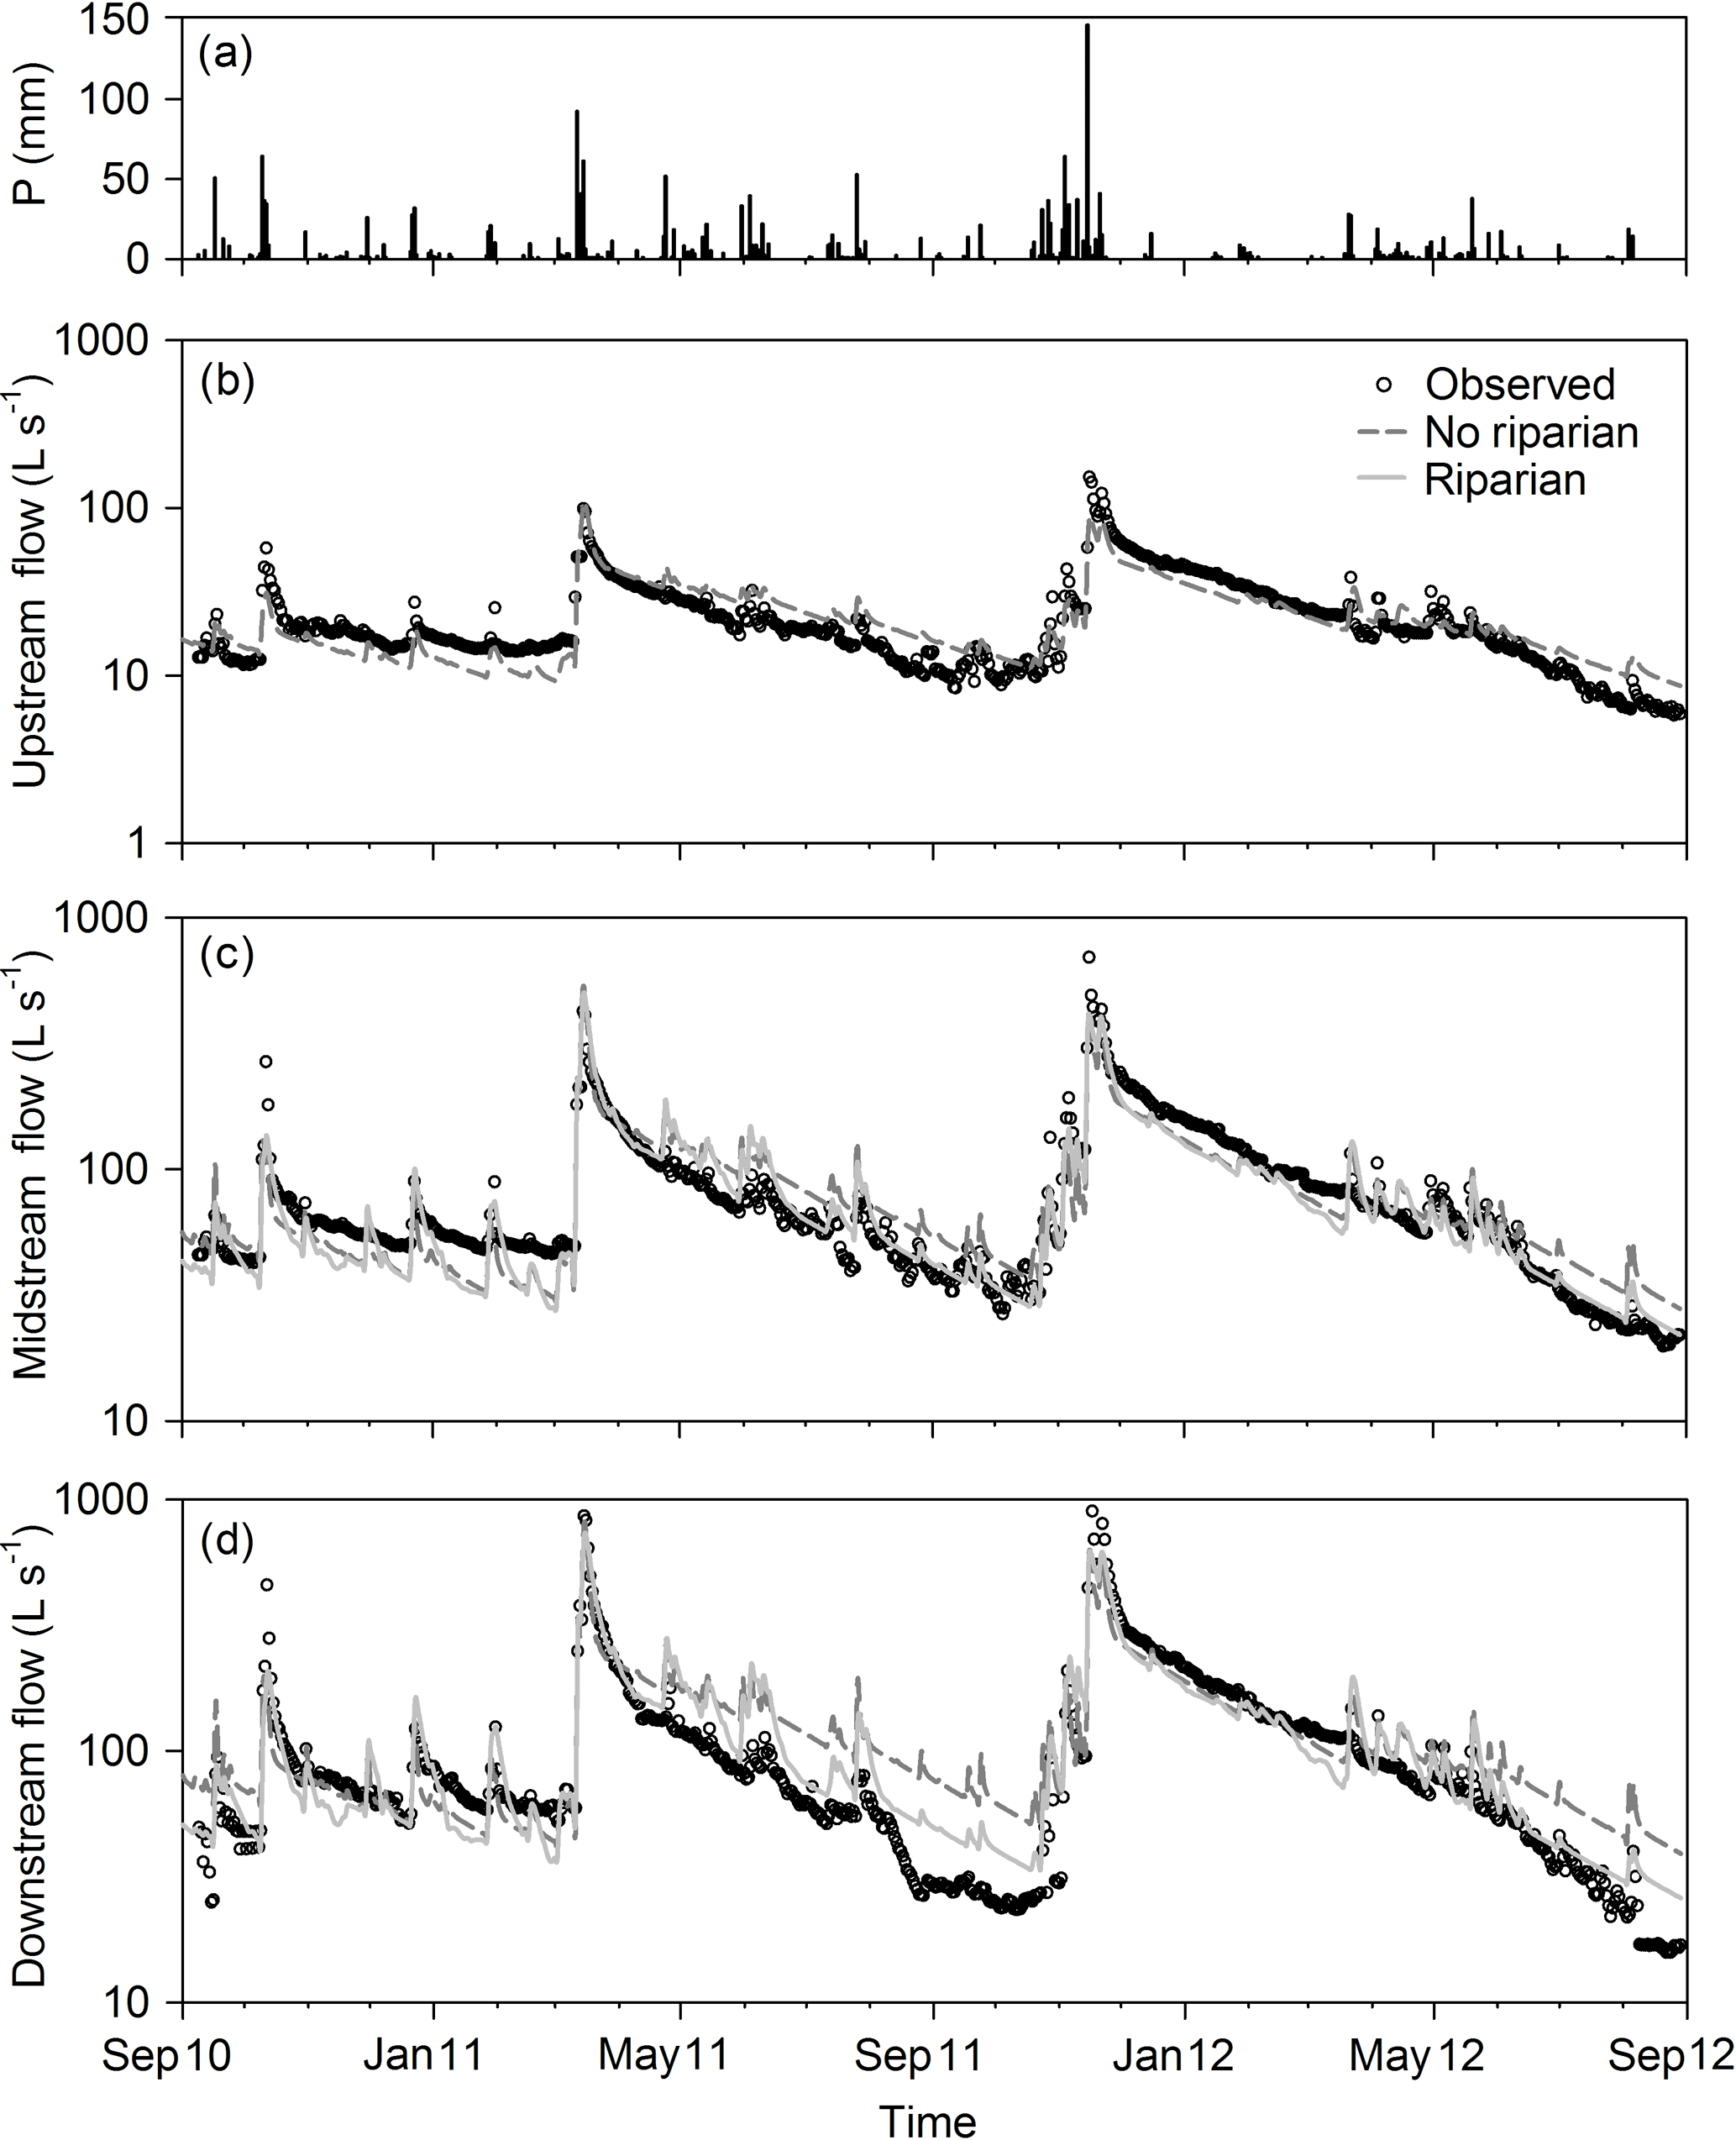
Figure 2Temporal pattern of (a) precipitation and streamflow for the (b) upstream, (c) midstream, and (d) downstream sites during the study period. Open circles represent observed values, while lines are simulated values excluding (dashed) and including (solid) the riparian compartment in the model configuration. Note that the upstream sub-catchment had no riparian forest, and therefore, simulations with and without the riparian zone are equal.
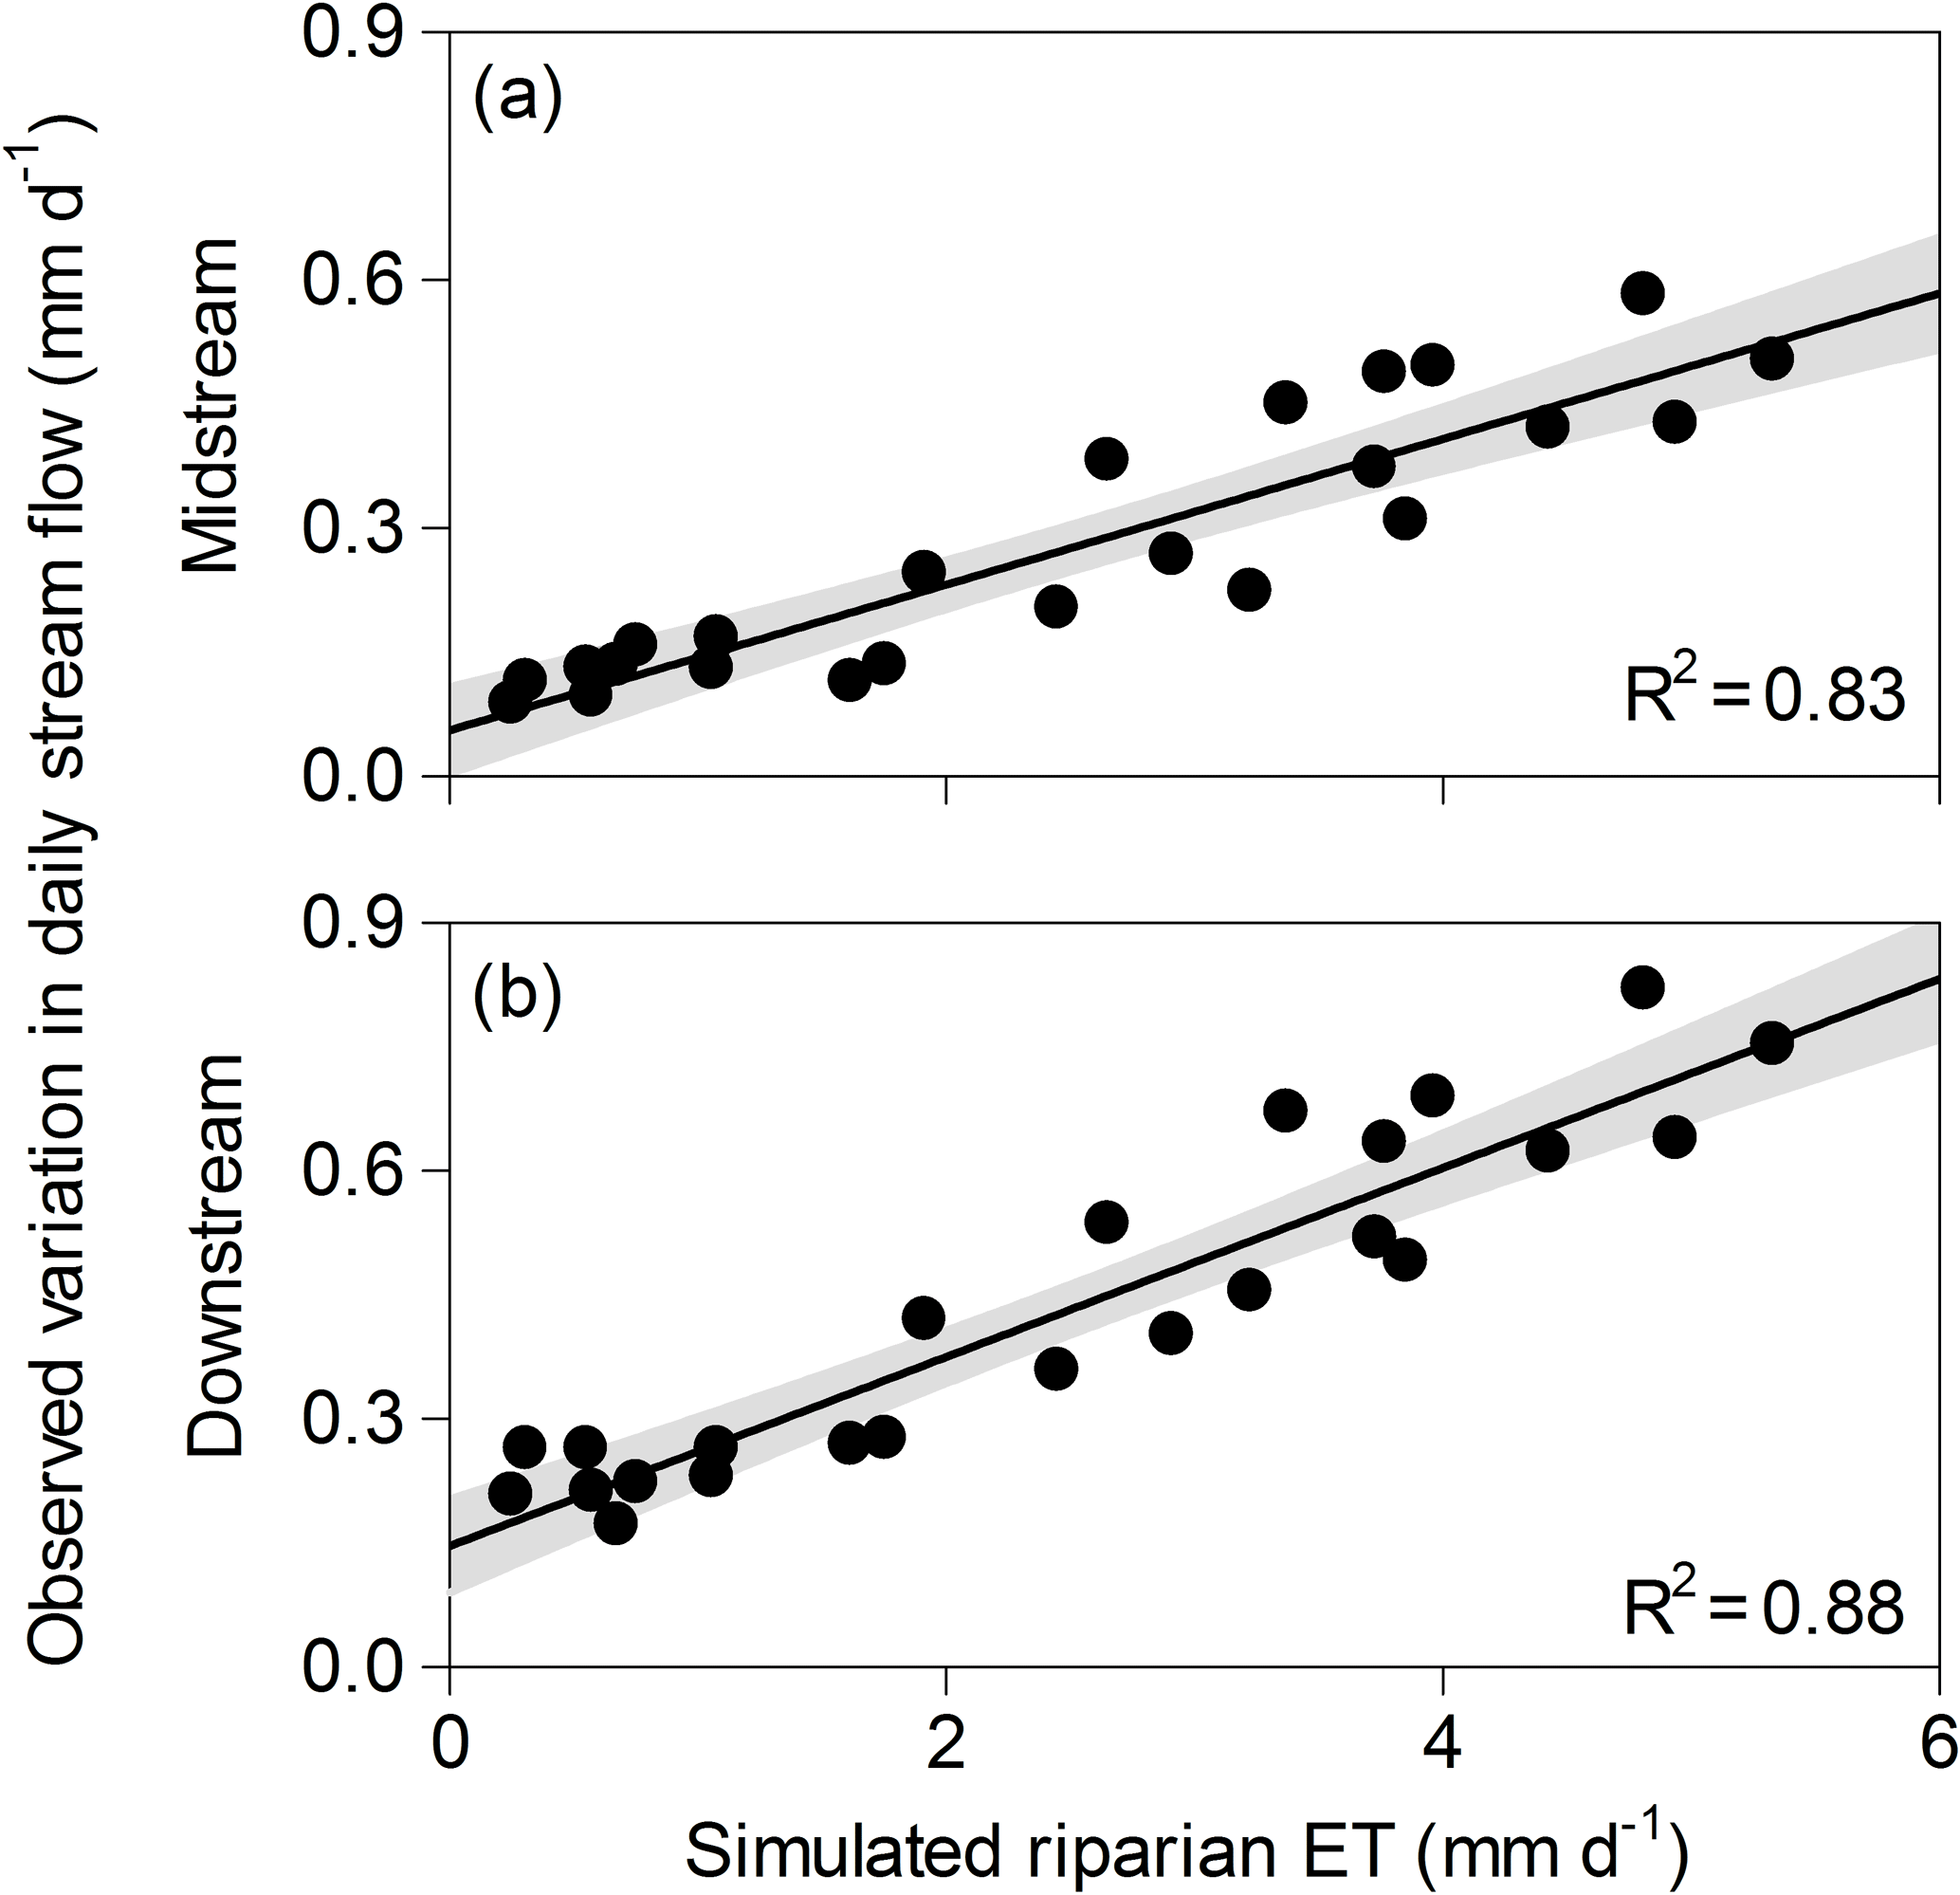
Figure 3Relationship between monthly mean values of simulated daily riparian evapotranspiration (ET) and observed daily streamflow variations (used here as an independent proxy of riparian ET) for the (a) midstream and (b) downstream sub-catchments for the calibration period (September 2010–August 2012). Note that simulated riparian ET is equivalent in both cases as values are normalized by area (i.e., in mm). The linear regression and the 95 % confidence interval are also shown. For both midstream and downstream sites: p-value<0.001, n=24. The upstream sub-catchment had no riparian forest and it is not shown.
The efficiency indexes indicated that the inclusion of the riparian compartment was essential to improve the fit between simulated and observed flows at the midstream and downstream sites. The model including the riparian compartment showed higher NS and log(NS) metric values and RVD values closer to 0 (more accurate stream water volumes) than the one without the riparian compartment (Table 3). Moreover, the model structure including the riparian compartment captured both the magnitude and seasonal pattern exhibited by streamflow, even during low-flow periods (August–October), especially in 2012 (Fig. 2). On average, the inclusion of the riparian compartment reduced daily streamflow overestimations from 53 % to 27 % during the vegetative period at the downstream site (Table 3). The improvement of the model was less noticeable during the dormant period, when the inclusion of the riparian compartment reduced the underestimations of streamflow from 12 % to 7 %.
4.2 Model validation and sensitivity analysis
There was a good agreement between simulated daily rates of riparian ET and those obtained independently of model outputs for both the midstream and downstream sub-catchments (Fig. 3). Simulated rates of riparian ET were lower during the dormant (0.89±0.97 mm day−1) than during the vegetative period (3.7±1.3 mm day−1). The lowest simulated ET values occurred in January and February (0.1–0.3 mm day−1), while June and August showed the highest ones (5–7 mm day−1) (Supplement 5). The daily variation of streamflow followed a seasonal pattern similar to that exhibited by simulated daily riparian ET. Consequently, there was a strong and positive relationship between monthly mean values of simulated daily riparian ET and measured daily streamflow variations for both the midstream sub-catchment (l.r., R2=0.83, p<0.001, n=24) and the downstream sub-catchment (l.r., R2=0.88, p<0.001, n=24) (Fig. 3).
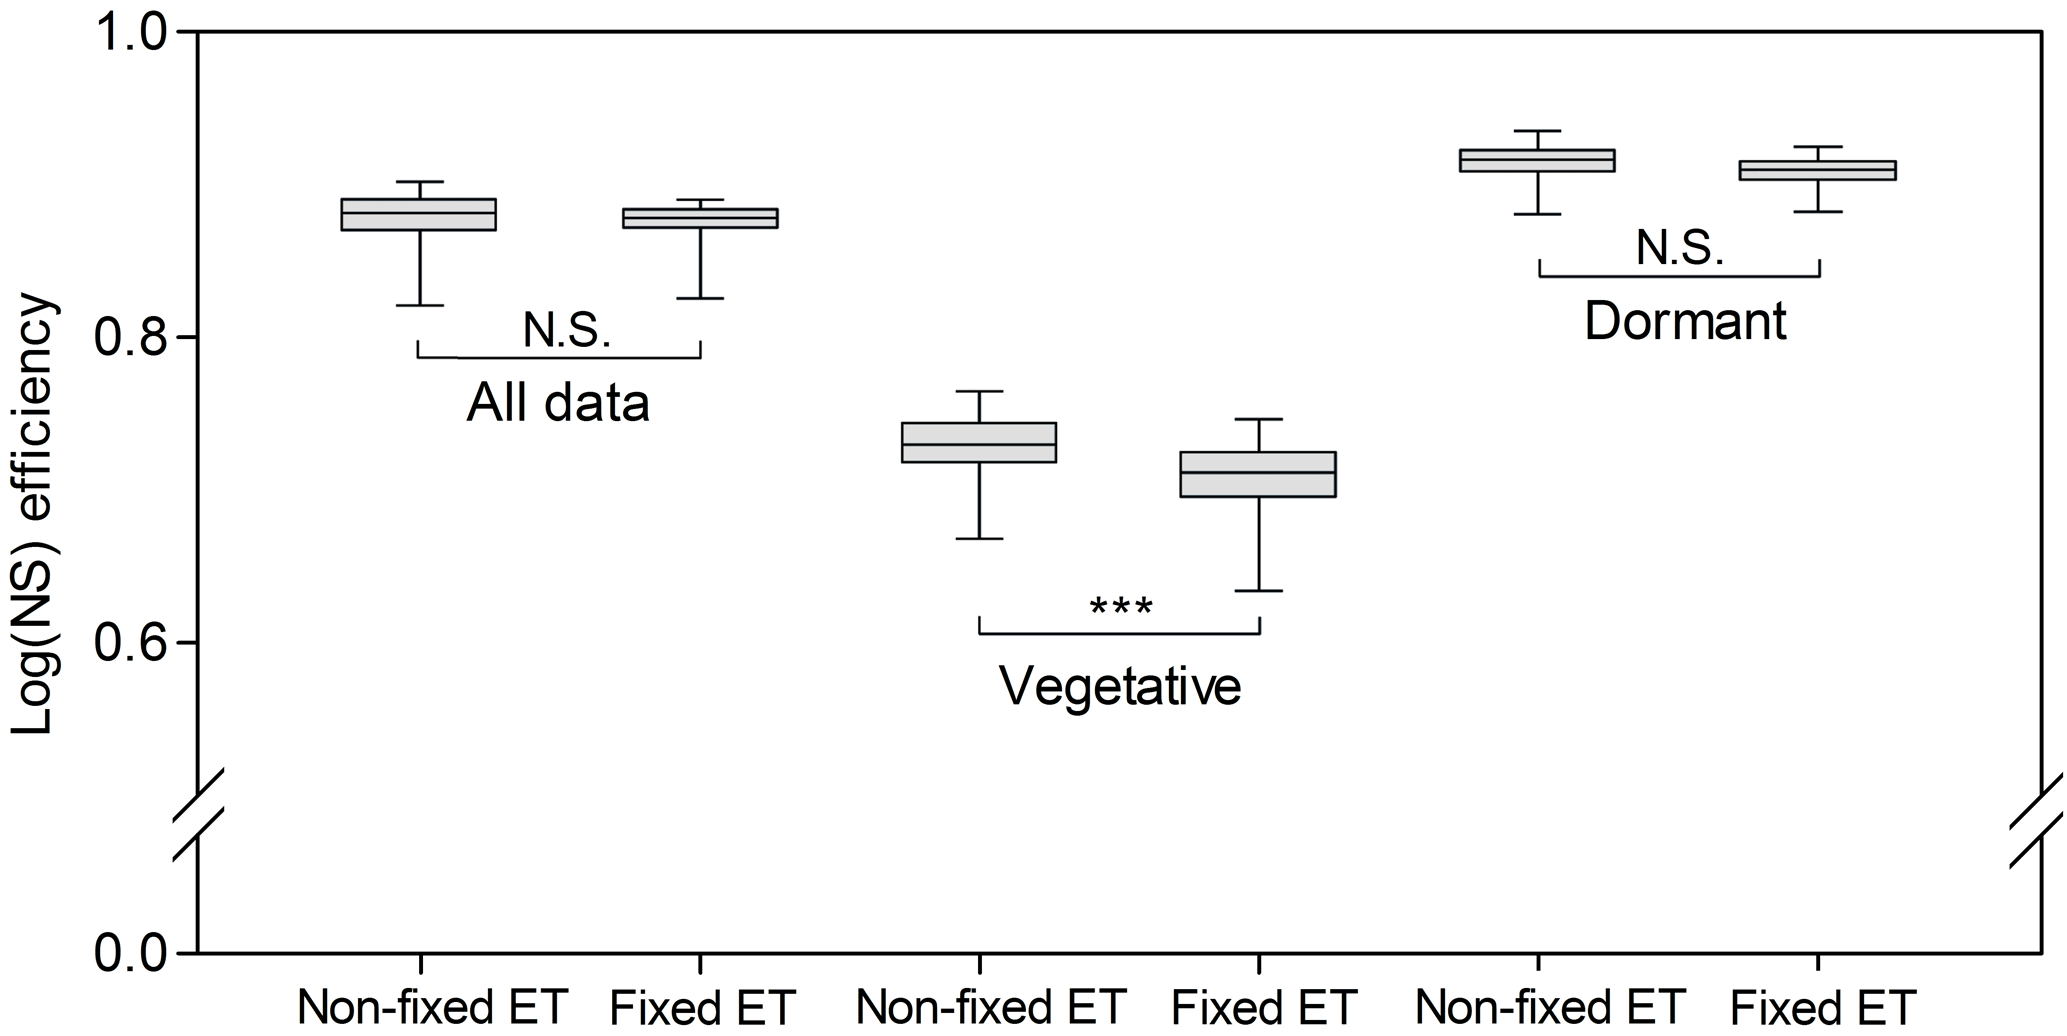
Figure 4Box plot of the 100 best log(NS) efficiencies obtained with the Monte Carlo (MC) simulations using the model configuration that included the riparian compartment at the downstream site. MC analyses were performed using first all potentially sensitive parameters (non-fixed ET), and second fixing evapotranspiration-related parameters (fixed ET), for all data, and for the vegetative and dormant periods separately. Means of corresponding distribution pairs were compared using Tukey's honestly significant difference tests. “N.S.” indicates no significant difference and indicates a statistically significant difference (p<0.0001).
The sensitivity analysis showed no differences in log(NS) values between the analysis with fixed and non-fixed ET parameters for the whole calibration period (Fig. 4). The same occurred when comparing fixed and non-fixed ET simulations for the dormant period. For the vegetative period, the simulation of streamflow worsened when the ET parameters were fixed as indicated by the decrease in log(NS) efficiencies (Fig. 4), suggesting that the model was sensitive to the ET parameters. Similar results were obtained for the NS metric (not shown).
4.3 Present and future contribution of riparian ET to catchment water budgets
Simulated rates of riparian ET averaged 931 mm yr−1 for the calibration period and contributed 5.91 % to annual water losses. This contribution falls within the range of simulated values (5.54 %–8.42 %) obtained for the reference period (1981–2000; mean annual riparian mm). During both the calibration and reference periods, the contribution of riparian ET to water catchment depletion was maximal from July to September, when it accounted for 8 %–26 % of water catchment losses.
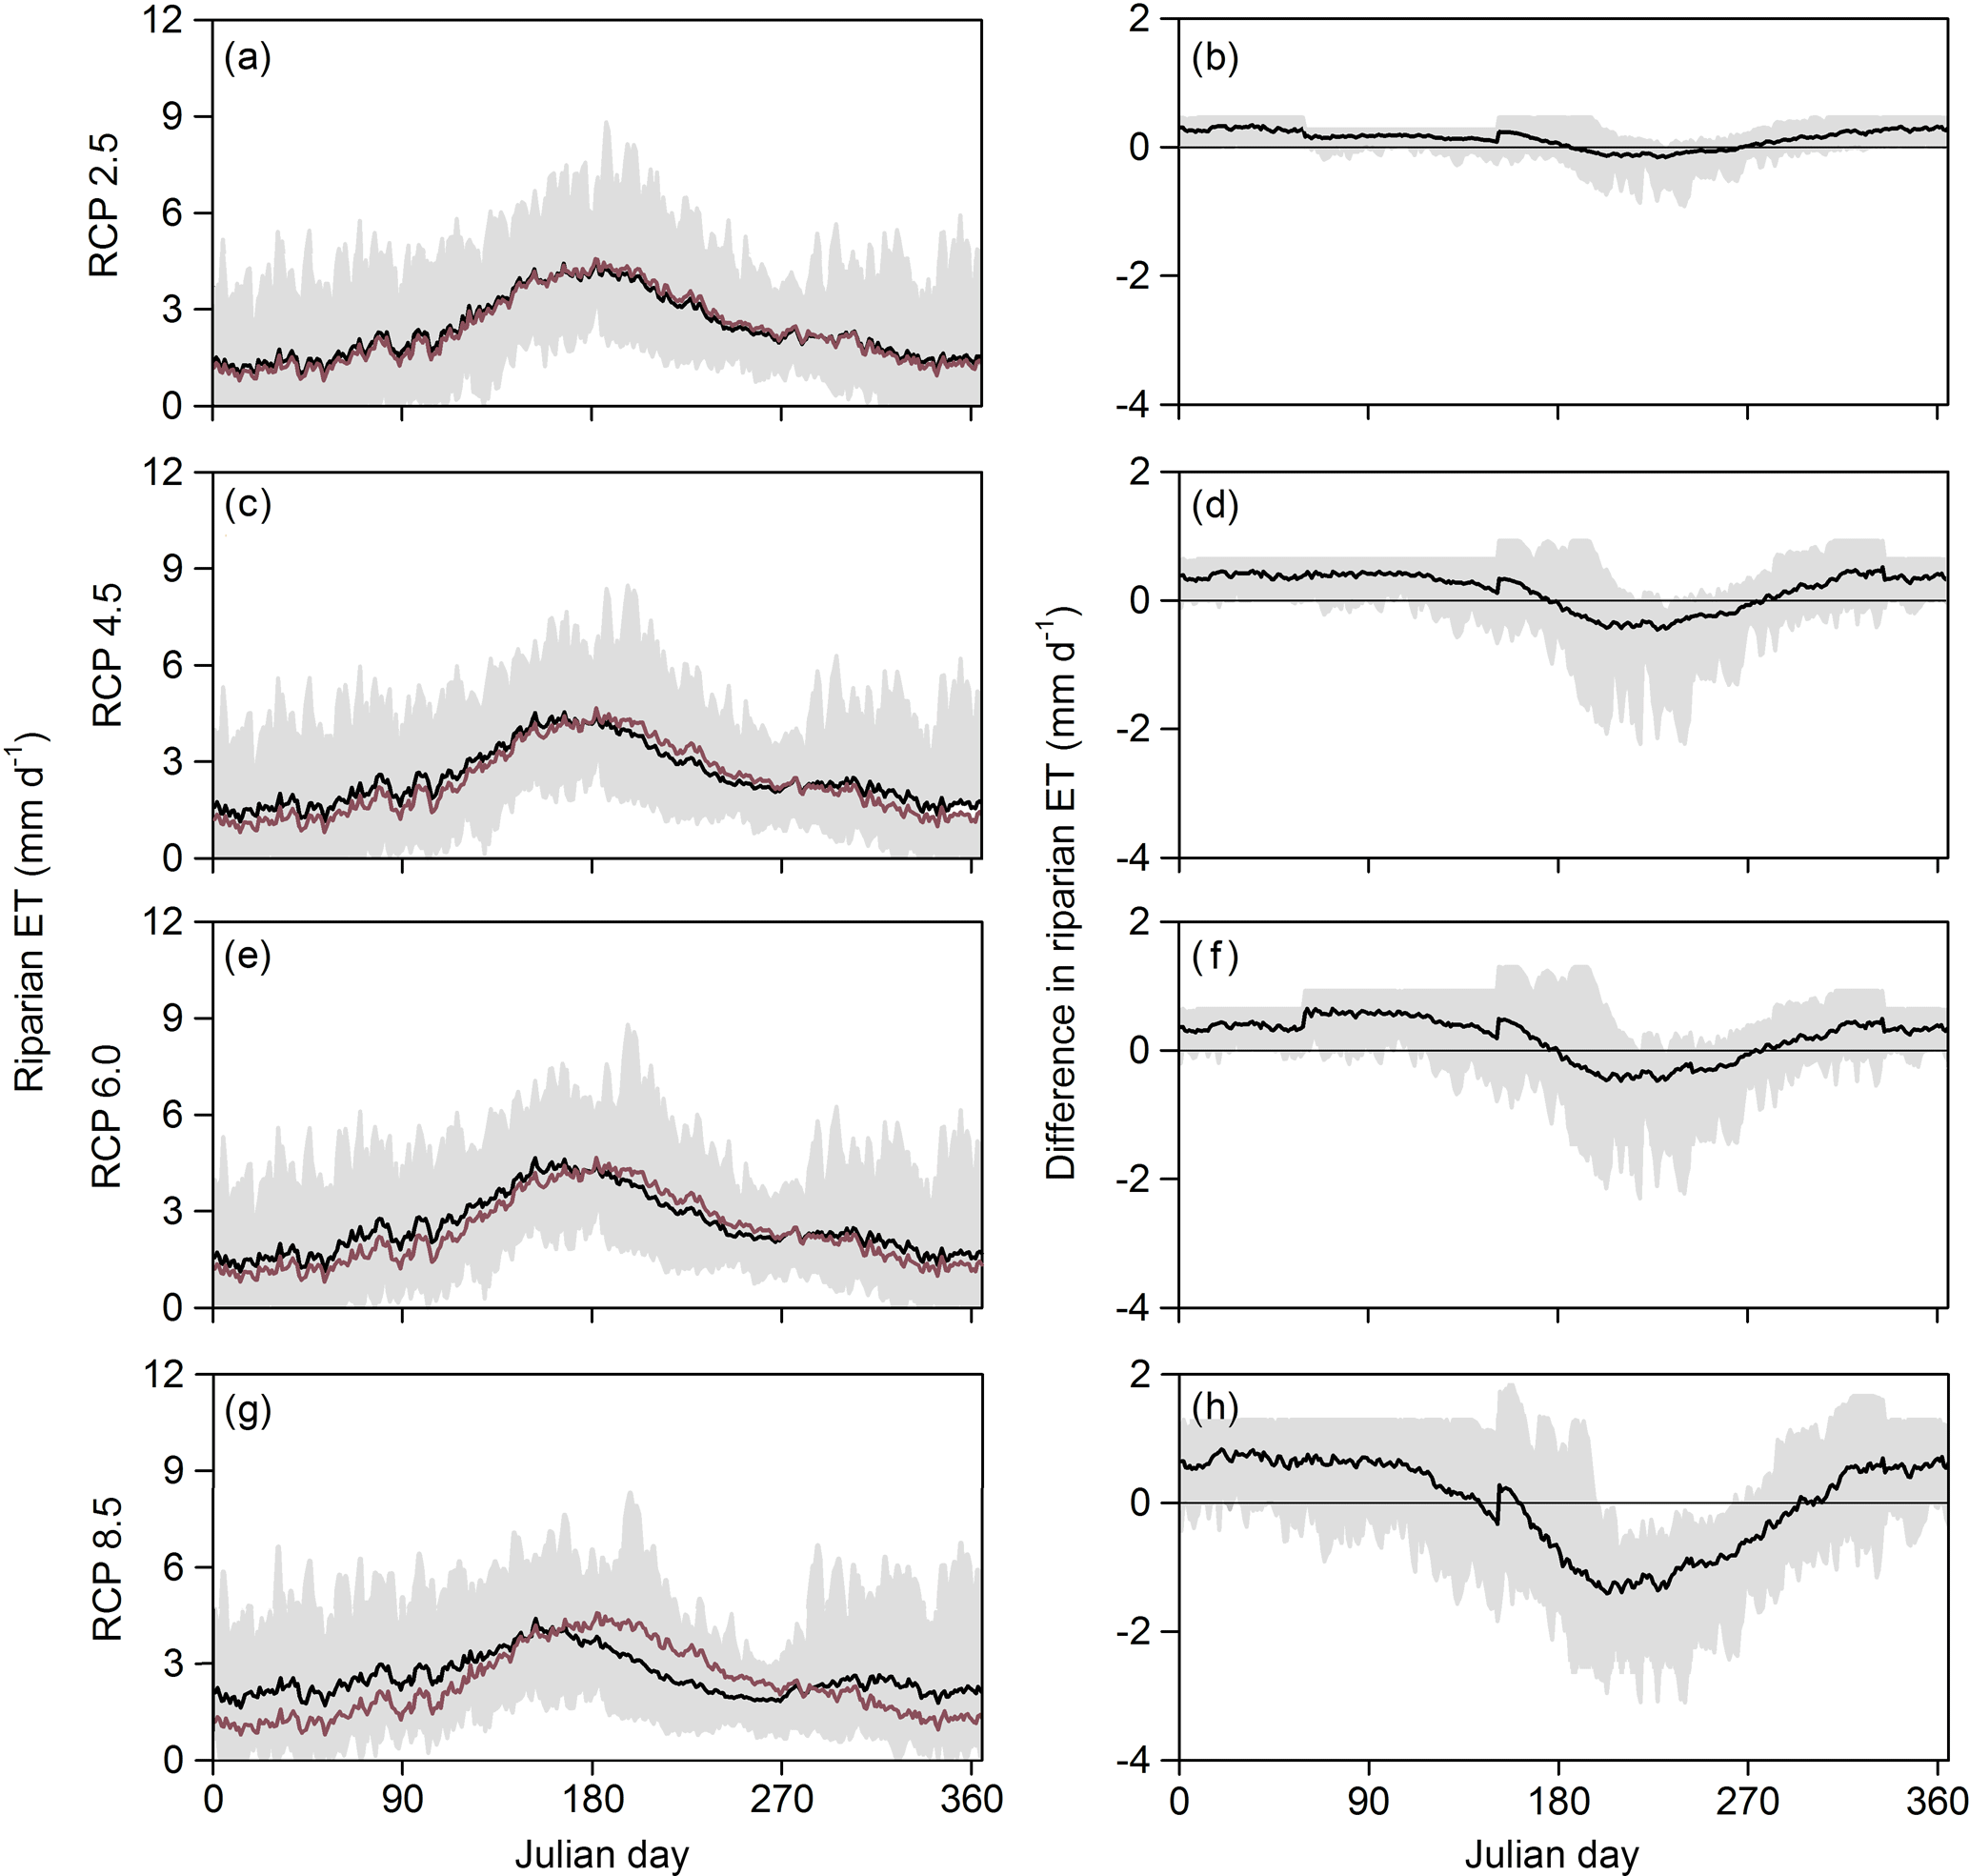
Figure 5Seasonal pattern of (a, c, e, g) daily riparian evapotranspiration rates simulated for different climate change scenarios and (b, d, f, h) difference in the simulated values of daily riparian evapotranspiration between the reference period (1981–2000) and future climate scenarios (2081–2100). All the climate change scenarios were based on the RCP projections provided by the IPCC (2013) for the period 2081–2100 (Table 2): (a, b) percentile 0.25 of RCP2.5 (the most moderate scenario), (c, d) percentile 0.5 of RCP4.5, (e, f) percentile 0.5 of RCP6.0, and (g, h) percentile 0.75 of RCP8.5 (the most extreme scenario). Black lines are mean values and grey shadows indicate the maximum–minimum range of values simulated for the 20-year period. The red line in the left panels is the mean daily values of riparian ET for the reference period. The horizontal line in the right panel is shown as a reference.
According to our simulations, mean annual riparian ET in the future will range between 826 mm yr−1 (scenario RCP6.0 percentile 0.25) and 977 mm yr−1 (scenario RCP4.5 percentile 0.75). These values represent a relatively small change in mean riparian ET (from −4 % to +13 %) compared to the reference period. Moreover, future climate change scenarios predict that upland ET would increase from 4 % to 11 % compared to the reference period, while streamflow would decrease from 3 % to 13 %. As a result, the mean annual contribution of riparian ET to catchment water budgets could increase from 7.1 % (reference period) to 8.3 % (scenario RCP8.5 percentile 0.25) (Table 4). Future increases in warming and drying will smooth the seasonality of riparian ET and increase the number of days with ET rates>0 mm day−1 by 6–106 days (depending on the scenario and year).
In the most moderate scenario (RCP2.5 percentile 0.25), mean daily riparian ET values increased by 0.3±0.1 mm day−1 during the dormant period, which represents an increase of 19 %±7 % compared to the reference period. During the vegetative period, the projected changes in mean daily riparian ET were smaller ( mm day−1) and represent a small fraction compared to the reference period () (Fig. 5a and b). The most extreme scenario (RCP8.5 percentile 0.75) simulated high riparian ET rates (>2 mm day−1) during most of the year. For this scenario, riparian ET rates increased by 0.6±0.1 mm day−1 during the dormant period, which represents an increase of 46 %±16 % compared to the reference period. During the vegetative period, riparian ET rates decreased by mm day−1. This is a decrease of 11 %±22 % compared to the reference period (Fig. 5g and h).
The AI decreased from 0.65±0.18 to 0.45±0.15 between the reference and most extreme climate scenarios (RCP8.5, percentile 0.75). The contribution of riparian ET to catchment water budgets was low (6.40 %±0.35 %) and unrelated to AI for AI>0.83. Below this threshold, the contribution of riparian ET to catchment water budgets increased linearly with decreasing AI. This dual behavior was well captured by a two-segment linear regression relating AI and riparian ET contribution to catchment water depletion with a break point at AI=0.83 (R2=0.77, p<0.001, n=260) (Fig. 6).
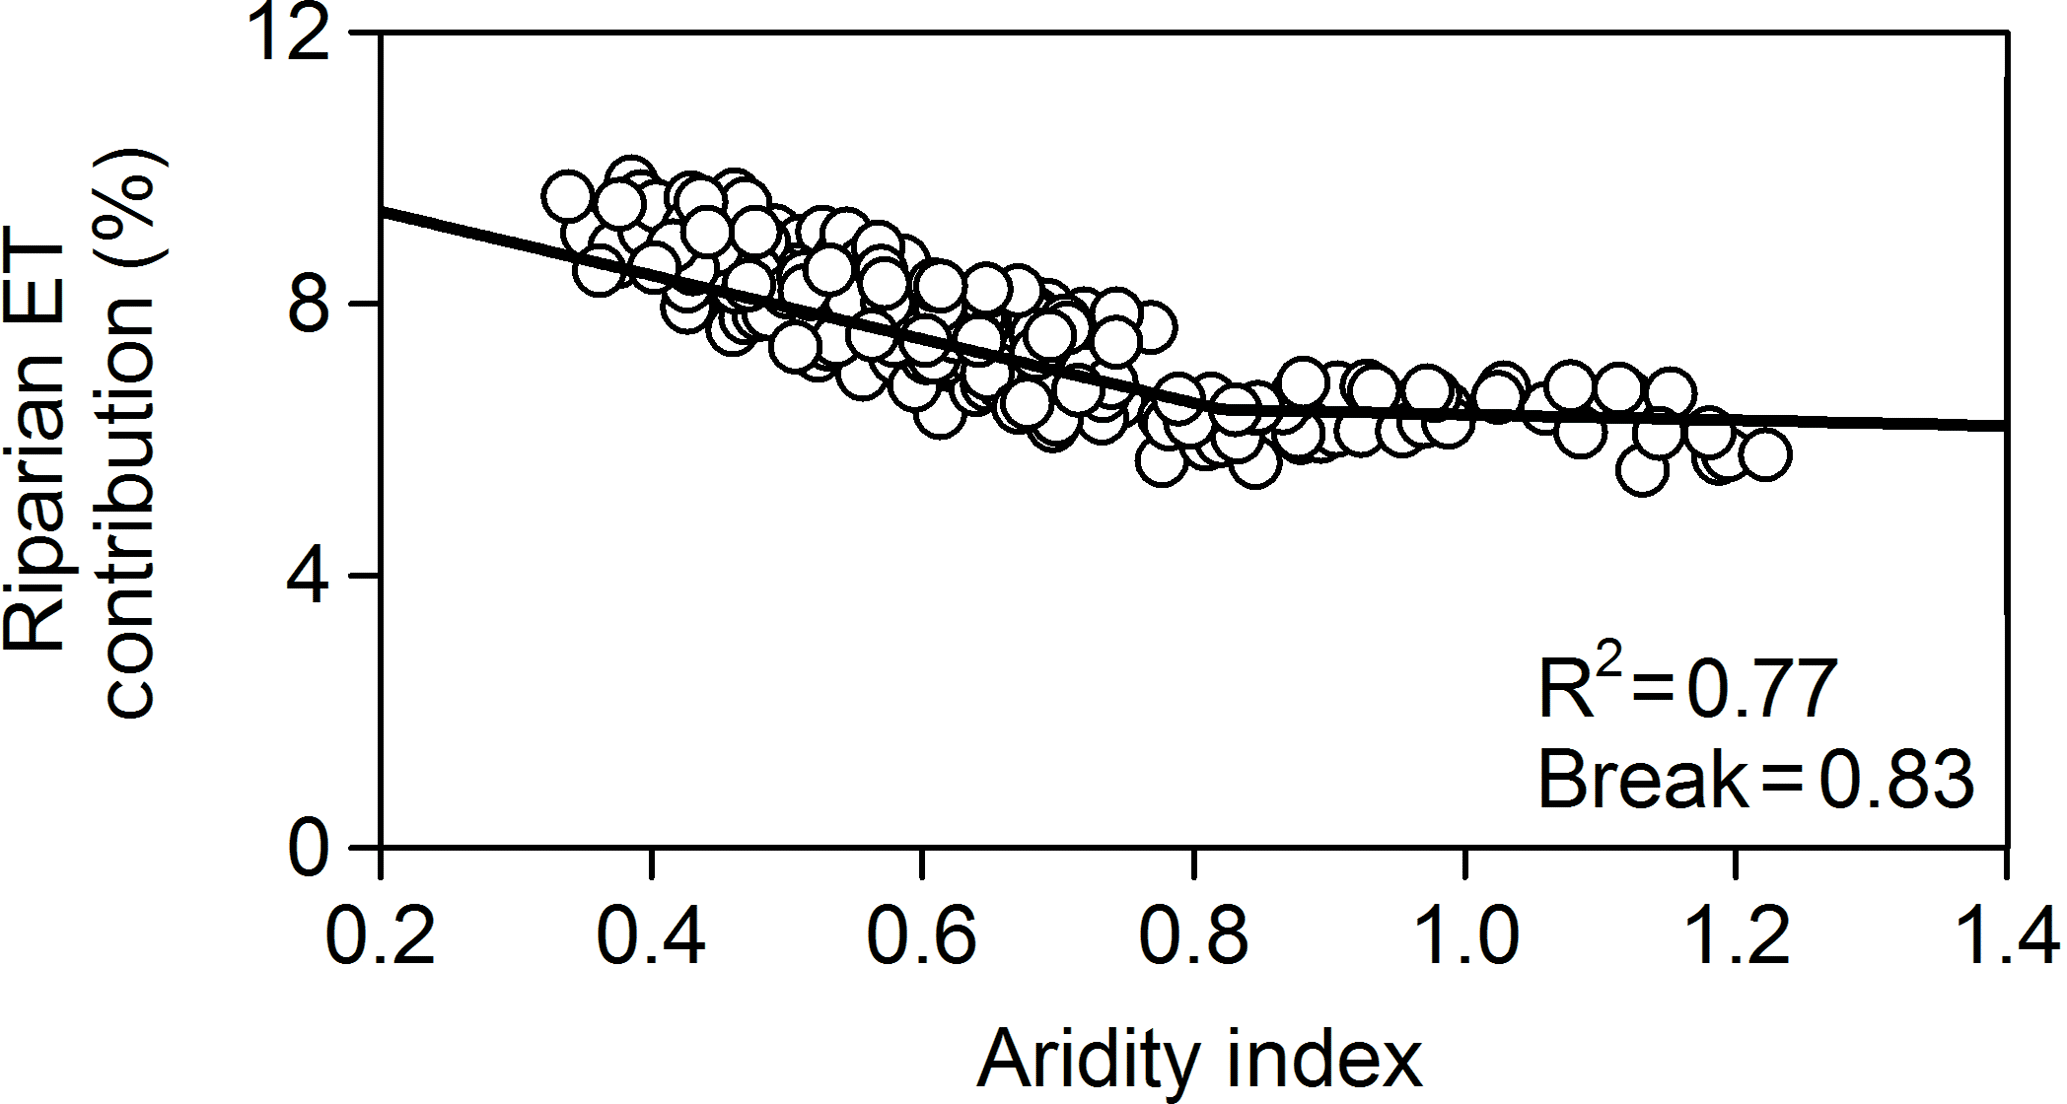
Figure 6Relationship between the relative contribution of riparian evapotranspiration (ET) to annual catchment water depletions and the aridity index for all the projections simulated with PERSiST as well as for the reference period. Total water output fluxes from the catchment (water depletions) are the sum of streamflow, upland ET, and riparian ET. The aridity index is the ratio between annual precipitation and potential evapotranspiration (P∕PET). The goodness of fit of the two-segment linear model and the break point is also shown.
5.1 Relevance of the riparian zone to simulate streamflow and catchment water budgets
This study shows that the riparian zone was an important model component when simulating water exports and budgets at the Font del Regàs catchment. The inclusion of the riparian compartment in the PERSiST model structure improved the efficiency of the simulations, especially at the downstream site, which integrates the hydrological processes occurring at the whole-catchment scale. These results support the idea that riparian zones are especially important in shaping streamflow dynamics at the valley bottom of mountainous catchments, likely due to the combination of lower catchment connectivity (i.e., lower water inputs from uplands) (Bernal et al., 2012; Covino and McGlynn, 2007) and greater water demand by riparian trees (Lupon et al., 2016).
Our results showed that the contribution of the riparian zone in simulating streamflow dynamics varied between seasons. During the dormant period, the inclusion of the riparian compartment helped to improve the simulation of streamflow volumes at the downstream site, with RVD values changing from +12 % (riparian zone excluded) to +7 % (riparian zone included). This increase in model efficiency suggests that the riparian zone can be important for shaping streamflows during wet conditions, likely because it contributes to increasing water storage and thus water residence time within the catchment. During the vegetative period, the role of the riparian zone in simulating streamflows was even more evident. The inclusion of the riparian compartment notably improved the log(NS) index, which is a proxy of the goodness of fit during low-flow conditions. The riparian compartment was essential for simulating low flows at the downstream site, reducing the overestimation of stream volumes from 53 % (riparian zone excluded) to 27 % (riparian zone included) (Table 3). Altogether, these results suggest that riparian zones contribute to drying up the stream in summer.
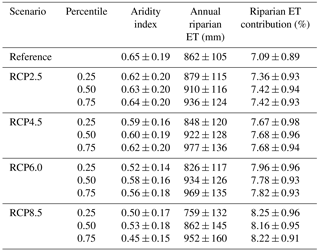
Table 4Aridity index, annual riparian evapotranspiration (ET) rates, and relative contribution of riparian ET to annual catchment water depletions (i.e., upland flow) for the reference period (1981–2000) and for each RCP scenario during the future period (2081–2100). Values are mean ± standard deviation.
Although the inclusion of the riparian compartment contributed to significantly improving the goodness of fit, the model was not able to fully capture the lowest flows at the end of the vegetative period (August–October). Hydrological processes not included so far in the PERSiST structure, such as uptake of water by trees directly from the stream (Gribovszki et al., 2010; Tabacchi et al., 2000) or reverse flux of water from the stream towards the riparian zone (Butturini et al., 2003; Rassam et al., 2006), could contribute to drop-down streamflow at Font del Regàs, and therefore to the mismatches between observed and simulated flows. These hydrological processes have been shown to be relevant for reproducing streamflow dynamics in Mediterranean and semiarid areas (e.g., Medici et al., 2008), and thus PERSiST could improve its ability to simulate streamflows in water-limited catchments if these processes would be implemented in the model structure.
On an annual basis, our simulations indicate that riparian ET can account for ∼7 % of annual catchment depletions at Font del Regàs (Table 4). The contribution of riparian ET to water budgets was especially noticeable during the dry period of the year, when it contributed as much as 26 % to daily catchment depletions. These values are similar to those estimated for other catchments with AI=0.6–0.8 (Folch and Ferrer, 2015; Tsang et al., 2014; Wine and Zou, 2012; Yeh and Famiglietti, 2008) and suggest that computations of catchment water budgets neglecting riparian ET will overestimate catchment water resources. Moreover, our results suggest that the hydrological processes occurring in the riparian compartment, including ET, could reduce daily streamflow by 48 % during the vegetative period. This value is consistent with empirical studies showing that riparian ET can reduce the amount of water entering to streams by 30–100 % (Dahm et al., 2002; Folch and Ferrer, 2015; Kellogg et al., 2008; Lupon et al., 2016). Altogether, these findings indicate that riparian ET can shape the connectivity between uplands and streams and support the idea that transpiration from riparian zones can be essential to successfully representing the streamflow in water-limited catchments (Medici et al., 2008; Tsang et al., 2014).
Despite the importance that riparian zones can have in shaping streamflow dynamics in regions experiencing some degree of water limitation, there are still few hydrological models considering riparian zones as specific components of catchment water budgets. Our results show that the PERSiST model is able to successfully simulate streamflow dynamics in Mediterranean catchments. Moreover, the validation analysis supported the simulation results because the model successfully captured both the magnitude and temporal patterns of riparian water demand estimated with an independent empirical approach (Fig. 3). Therefore, hydrological models such as PERSIST can be useful not only for understanding catchment hydrology, but also for exploring how specific hydrological processes, such as riparian ET, influence stream hydrology under different climatic conditions and future scenarios.
5.2 Future changes in riparian ET
Our simulations suggest that changes in climate will influence both the magnitude and temporal pattern of riparian ET rates in Font del Regàs. Riparian ET rates will decrease in June–September and increase in November–May. Simulated decreases in riparian ET during the vegetative period were related to lower soil water availability as a consequence of lower precipitation in summer. In concordance, other studies in water-limited regions have shown that low ET rates in summer could result from the disconnection between the water table and the active root zone depth (Baird and Maddock, 2005; Serrat-Capdevila et al., 2007), which can accelerate leaf litter fall (Rood et al., 2008; Sabater and Bernal, 2011) and promote stream desiccation (Medici et al., 2008; Serrat-Capdevila et al., 2007). On the other hand, the overall warmer temperatures predicted for winter months explain the projected increase in riparian ET during this period. According to our simulations, the number of days with ET>0 mm day−1 will increase by 6–106 days (depending on the applied scenario and year), mostly due to an increase in the number of days with temperatures above the model “growing degree threshold” (Supplement 2), especially in spring. This result suggests a potential enlargement of the vegetative period, an idea that is consistent with observations showing that climate change can affect riparian tree phenology by promoting the advancement of the riparian leaf out period (Perry et al., 2012; Serrat-Capdevila et al., 2007). The simulated increase in ET induced by the future lengthening of the vegetative period could be higher than the reduction of ET rates during summer, which ultimately could increase annual riparian water use up to 13 %. This warming-induced pattern is concordant with that reported for water-limited riparian forests in the southern USA (Bunk, 2012; Serrat-Capdevila et al., 2011).
Finally, we found that increases in annual riparian ET under a warmer climate may have a small effect on the relative contribution of riparian ET to annual catchment water budgets (1–2 %). The small effect predicted by the model was likely because warming also induced higher ET from upland forests (4–11 %). However, our hydrological model does not account for changes in vegetation community induced by warming, a phenomenon that is expected to occur in areas experiencing increases in water stress (Benito-Garzón et al., 2008; García-Arias et al., 2014; Peñuelas and Boada, 2003; Walther et al., 2002). If water becomes limiting, especially in the upland environments, species capable of better adjusting their evapotranspirative demand may be favored and become dominant (Engelbrecht et al., 2007), which would lead to decreases in ET from uplands compared to riparian zones. In fact, empirical studies suggest that the contribution of riparian ET to catchment water depletion can increase disproportionally with water limitation, and that a threshold exists at intermediate arid positions (i.e., AI=0.8) (Lupon et al., 2016). Below this threshold, the contribution of riparian ET to water budgets can markedly increase up to 40 % even when riparian zones usually occupy <10 % of the total catchment area (Tockner and Stanford, 2002). Our simulations are in line with this idea and suggest that riparian forests could switch from energy-limited to water-limited systems as warming and drying increase in the future (Budyko, 1974; Creed et al., 2014).
This study indicates that riparian zones and, in particular, riparian ET, are important for simulating streamflow dynamics and water budgets in Mediterranean catchments. Moreover, our results highlight the importance of including the riparian compartment within catchment hydrological models. For the PERSiST model, the inclusion of the riparian zone improved model efficiencies and led to a more accurate simulation of streamflow dynamics, especially during summer. The model allowed us to quantify the relative contribution of riparian ET to catchment water depletion: from 5.5 to 8.4 % on an annual basis, and from 8 to 26 % during summer months. Our results add to the growing body of knowledge showing that riparian hydrology is essential for understanding and forecasting streamflow dynamics and water budgets in catchments, especially when water is limiting. Moreover, our climate simulations indicated that the importance of riparian ET in catchment water budgets could increase as water scarcity increases in the future. At Font del Regàs, for instance, projected decreases in annual streamflow by the end of this century (from 3 to 13 %) could be accompanied by increases in riparian ET on the same order (from −4 to +13 %). Similar predictions have been made for other water-limited catchments of America and Europe (Christensen et al., 2004; Rood et al., 2008; Serrat-Capdevila et al., 2007), forewarning the potential increase in ecological issues related to water scarcity in regions that are already water-limited. Overall, this study highlights that the ecohydrology of riparian zones needs to be considered for responsible management and conservation of water resources in Mediterranean catchments.
The data sets used in this paper are available at https://doi.org/10.6084/m9.figshare.6850748.v1 (Lupon et al., 2018).
The supplement related to this article is available online at: https://doi.org/10.5194/hess-22-4033-2018-supplement.
AL and SB designed the experiment. AL and SB carried it out. AL performed all laboratory analysis. JLJL performed all model simulations. AL and JLJL analyzed the data set. AL prepared the manuscript with contributions from JLJL and SB.
The authors declare that they have no conflict of interest.
We are thankful to Sílvia Poblador, Andrew Wade, and Martin Erlandsson
for their invaluable field and modeling
assistance. Special thanks are extended to Martyn Futter, Francesc Sabater,
and three anonymous reviewers for their inspirational contributions.
Financial support was provided by the Spanish Government through projects
MONTES-Consolider (CSD2008-00040-MONTES), MEDFORESTREAM (CGL2011-30590), and
MEDSOUL (CGL2014-59977-C3-2). Anna Lupon was supported by a Kempe Foundation
stipend (Sweden). José L. J. Ledesma was funded by the Swedish Research
Council (Svenska Forskningsrådet Formas, grant/award number 2015-1518).
Susana Bernal's work was funded by European Social Funds (FSE) and the NICUS
(CGL-2014-55234-JIN) project.
Edited by: Nunzio Romano
Reviewed by: Aaron Mills and two anonymous referees
Allen, R. G., Pereira, L. S., Raes, D., and Smith, M.: Crop evapotranspiration – Guidelines for computing crop water requirements, FAO Irrig. Drain. Pap. 56, FAO, Rome, 1–15, 1998.
Àvila, A., Neal, C., and Terradas, J.: Climate change implications for streamflow and streamwater, J. Hydrol., 177, 99–116, https://doi.org/10.1016/0022-1694(95)02789-0, 1996.
Baird, K. J. and Maddock, T.: Simulating riparian evapotranspiration: a new methodology and application for groundwater models, J. Hydrol., 312, 176–190, https://doi.org/10.1016/j.jhydrol.2005.02.014, 2005.
Baldocchi, D. D. and Ryu, Y.: A synthesis of forest evaporation fluxes – from days to years – as measured with Eddy covariance, in Forest Hydrology and Biogeochemistry, edited by: Levia, D. F., Carlyle-Moses, D., and Tanaka, T., Springer Netherlands, Dordrecht, 101–116, 2011.
Benito-Garzón, M., Sánchez de Dios, R., and Sainz-Ollero, H.: Effects of climate change on the distribution of Iberian tree species, Appl. Soil Ecol., 11, 169–178, https://doi.org/10.3170/2008-7-18348, 2008.
Bernal, S., Butturini, A., Riera, J. L., Vázquez, E., and Sabater, F.: Calibration of the INCA model in a Mediterranean forested catchment: the effect of hydrological inter-annual variability in an intermittent stream, Hydrol. Earth Syst. Sci., 8, 729–741, https://doi.org/10.5194/hess-8-729-2004, 2004.
Bernal, S., von Schiller, D., Martí, E., and Sabater, F.: In-stream net uptake regulates inorganic nitrogen export from catchments under base flow conditions, J. Geophys. Res.-Biogeo., 117, 1–10, https://doi.org/10.1029/2012JG001985, 2012.
Budyko, M. I. (Ed.): Climate and Life, in: Vol. 8, Academic Press, New York, 1974.
Bunk, D.: Changing demands from riparian evapotranspiration and free-water evaporation in the lower Colorado River basin under different climate scenarios, Doctoral Thesis, University of Nevada, Las Vegas, 2012.
Burt, T. P., Pinay, G., Matheson, F. E., Haycock, N. E., Butturini, A., Clément, J.-C., Danielescu, S., Dowrick, D. J., Hefting, M. M., Hillbricht-Ilkowska, A., and Maître, V.: Water table fluctuations in the riparian zone: Comparative results from a pan-European experiment, J. Hydrol., 265, 129–148, https://doi.org/10.1016/S0022-1694(02)00102-6, 2002.
Butturini, A., Bernal, S., Nin, E., Hellin, C., Rivero, L., Sabater, S., and Sabater, F.: Influences of the stream groundwater hydrology on nitrate concentration in unsaturated riparian area bounded by an intermittent Mediterranean stream, Water Resour. Res., 39, 1–13, https://doi.org/10.1029/2001WR001260, 2003.
Cadol, D., Kampf, S., and Wohl, E.: Effects of evapotranspiration on baseflow in a tropical headwater catchment, J. Hydrol., 462–463, 4–14, https://doi.org/10.1016/j.jhydrol.2012.04.060, 2012.
Christensen, N. S., Wood, A. W., Voisin, N., Lettenmaier, D. P., and Palmer, R. N.: The effects of climate change on the hydrology and water resources of the Colorado River Basin, Cliamtic Change, 62, 337–363, 2004.
Contreras, S., Jobbágy, E. G., Villagra, P. E., Nosetto, M. D., and Puigdefábregas, J.: Remote sensing estimates of supplementary water consumption by arid ecosystems of central Argentina, J. Hydrol., 397, 10–22, https://doi.org/10.1016/j.jhydrol.2010.11.014, 2011.
Covino, T. P. and McGlynn, B. L.: Stream gains and losses across a mountain-to-valley transition: Impacts on watershed hydrology and stream water chemistry, Water Resour. Res., 43, W10431, https://doi.org/10.1029/2006WR005544, 2007.
Creed, I. F., Spargo, A. T., Jones, J. A., Buttle, J. I. M. M., Mary, B., Beall, F. D., Booth, E. G., Campbell, J. L., Clow, D., Elder, K., Green, M. B., Grimm, N. B., and Miniat, C.: Changing forest water yields in response to climate warming: results from long-term experimental watershed sites across North America, Global Change Biol., 20, 3191–3208, https://doi.org/10.1111/gcb.12615, 2014.
Cremona, F., Vilbaste, S., Couture, R.-M., Nõges, P., and Nõges, T.: Is the future of large shallow lakes blue-green? Comparing the response of a catchment-lake model chain to climate predictions, Climatic Change, 141, 347–361, https://doi.org/10.1007/s10584-016-1894-8, 2017.
Dahm, C. N., Cleverly, J. R., Coonrod E. Allred, J., Thibault, J. R., McDonnell, D. E., and Gilroy, D. J.: Evapotranspiration at the land/water interface in a semi-arid drainage basin, Freshwater Biol., 47, 831–844, 2002.
da Rocha, H. R., Goulden, M. L., Miller, S. D., Menton, M. C., Pinto, L. D. V. O., de Freitas, H. C., and Silva Figueira, A. M.: Seasonality of water and heat fluxes over a tropical forest in eastern Amazonia, Ecol. Appl., 14, 22–32, 2004.
Doody, T. and Benyon, R.: Quantifying water savings from willow removal in Australian streams, J. Environ. Manage., 92, 926–935, https://doi.org/10.1016/j.jenvman.2010.10.061, 2011.
Engelbrecht, B. M. J., Comita, L. S., Condit, R., Kursar, T. A., Tyree, M. T., Turner, B. L., and Hubbell, S. P.: Drought sensitivity shapes species distribution patterns in tropical forests, Nat. Lett., 447, 80–83, https://doi.org/10.1038/nature05747, 2007.
Flewelling, S. A., Hornberger, G. M., Herman, J. S., Mills, A. L., and Robertson, W. M.: Diel patterns in coastal-stream nitrate concentrations linked to evapotranspiration in the riparian zone of a low-relief, agricultural catchment, Hydrol. Process., 28, 2150–2158, https://doi.org/10.1002/hyp.9763, 2014.
Folch, A. and Ferrer, N.: The impact of poplar tree plantations for biomass production on the aquifer water budget and base flow in a Mediterranean basin, Sci. Total Environ., 524–525, 213–224, https://doi.org/10.1016/j.scitotenv.2015.03.123, 2015.
Futter, M. N., Erlandsson, M. A., Butterfield, D., Whitehead, P. G., Oni, S. K., and Wade, A. J.: PERSiST: a flexible rainfall-runoff modelling toolkit for use with the INCA family of models, Hydrol. Earth Syst. Sci., 18, 855–873, https://doi.org/10.5194/hess-18-855-2014, 2014.
García-Arias, A., Francés, F., Moreales-de la Cruz, M., Real, J., Vallés-Morán, F., Garófano-Gómez, G., and Martínez-Capel, F.: Riparian evapotranspiration modelling: Model description and implementation for predictiong vegetation spatial distribution in semi-arid environments, Ecohydrology, 7, 659–677, https://doi.org/10.1002/eco.1387, 2014.
Gribovszki, Z., Szilágyi, J., and Kalicz, P.: Diurnal fluctuations in shallow groundwater levels and streamflow rates and their interpretation – A review, J. Hydrol., 385, 371–383, https://doi.org/10.1016/j.jhydrol.2010.02.001, 2010.
Institut Cartografic de Catalunya: Orthophotomap of Catalunya 1:25 000, Generalitat de Catalunya, Departament de Política Territorial i Obres, Barcelona, 2010.
IPCC: Summary for Policymakers, in: Climate Change 2013: The Physical Science Basis., edited by: Stocker, T. F., Qin, D., Plattner, G.-K., Tignor, M., Allen, S. K., Boschung, J., Nauels, A., and Xia, Y., Cambridge University Press, Cambridge, UK, 2013.
Kampf, S. K. and Burges, S. J.: A framework for classifying and comparing distributed hillslope and catchment hydrologic models, Water Resour. Res., 43, W05423, https://doi.org/10.1029/2006WR005370, 2007.
Kellogg, D. Q., Gold, A. J., Groffman, P. M., Stolt, M. H., and Addy, K.: Riparian groundwater flow patterns using flownet analysis: evapotranspiration-induced upwelling and implications for N removal, J. Am. Water Resour. Assoc., 44, 1024–1034, https://doi.org/10.1111/j.1752-1688.2008.00218.x, 2008.
Kurc, S. A. and Small, E. E.: Dynamics of evapotranspiration in semiarid grassland and shrubland ecosystems during the summer monsoon season, central New Mexico, Water Resour. Res., 40, W09305, https://doi.org/10.1029/2004WR003068, 2004.
Ledesma, J. L. J. and Futter, M. N.: Gridded climate data products are an alternative to instrumental measurements as inputs to rainfall-runoff models, Hydrol. Process., 31, 3283–3293, https://doi.org/10.1002/hyp.11269, 2017.
Ledesma, J. L. J., Köhler, S. J., and Futter, M. N.: Long-term dynamics of dissolved organic carbon: Implications for drinking water supply, Sci. Total Environ., 432, 1–11, https://doi.org/10.1016/j.scitotenv.2012.05.071, 2012.
Llorens, P. and Domingo, F.: Rainfall partitioning by vegetation under Mediterranean conditions. A review of studies in Europe, J. Hydrol., 335, 37–54, https://doi.org/10.1016/j.jhydrol.2006.10.032, 2007.
Lupon, A., Bernal, S., Poblador, S., Martí, E., and Sabater, F.: The influence of riparian evapotranspiration on stream hydrology and nitrogen retention in a subhumid Mediterranean catchment, Hydrol. Earth Syst. Sci., 20, 3831–3842, https://doi.org/10.5194/hess-20-3831-2016, 2016.
Lupon, A., Ledesma, J. L. J., and Bernal, S.: Dataset of “Riparian evapotranspiration is essential to simulate streamflow dynamics and water budgets in a Mediterranean catchment”, Figshare, Dataset, https://doi.org/10.6084/m9.figshare.6850748.v1, 2018.
Medici, C., Butturini, A., Bernal, S., Vázquez, E., Sabater, F., Vélex, J. I., and Francés, F.: Modelling the non-linear hydrological behaviour of a small Mediterranean forested catchment, Hydrol. Process., 3828, 3814–3828, https://doi.org/10.1002/hyp.6991, 2008.
Nadal-Sala, D., Sabaté, S., Sánchez-Costa, E., Boumghar, A., and Gracia, C. A.: Different responses to water availability and evaporative demand of four co-occurring riparian tree species in NE Iberian Peninsula. Temporal and spatial sap flow patterns, Acta Hortic., 991, 215–222, 2013.
Nash, J. E. and Sutcliffe, J. V.: River flow forecasting through conceptual models. Part 1: A discussion of principles, J. Hydrol., 10, 282–290, 1970.
Peñuelas, J. and Boada, M.: A global change-induced biome shift in the Montseny mountains (NE Spain), Global Change Biol., 9, 131–140, 2003.
Oni, S., Futter, M., Ledesma, J. L. J., Teutschbein, C., Buttle, J., and Laudon, H.: Using dry and wet year hydroclimatic extremes to guide future hydrologic projections, Hydrol. Earth Syst. Sci., 20, 2811–2825, https://doi.org/10.5194/hess-20-2811-2016, 2016.
Perry, L. G., Andersen, D. C., Reynolds, L. V., Nelson, S. M., and Shafroth, P. B.: Vulnerability of riparian ecosystems to elevated CO2 and climate change in arid and semiarid western North America, Global Change Biol., 18, 821–842, https://doi.org/10.1111/j.1365-2486.2011.02588.x, 2012.
Piñol, J., Àvila, A., Escarré, A., Lledó, M. J., and Rodà, F.: Comparison of the hydrological characteristics of three small experimental holm oak forested catchments in NE Spain in relation to larger areas, Vegetatio, 99–100, 169–176, 1992.
Rassam, D. W., Fellows, C. S., De Hayr, R., Hunter, H., and Bloesch, P.: The hydrology of riparian buffer zones; two case studies in an ephemeral and a perennial stream, J. Hydrol., 325, 308–324, https://doi.org/10.1016/j.jhydrol.2005.10.023, 2006.
R Core Team: R: A language and environment for statistical computing, available at: http://www.r-project.org/ (last access: 1 February 2018), 2012.
Rood, S. B., Pan, J., Gill, K. M., Franks, C. G., Samuelson, G. M., and Shepherd, A.: Declining summer flows of Rocky Mountain rivers: Changing seasonal hydrology and probable impacts on floodplain forests, J. Hydrol., 349, 397–410, https://doi.org/10.1016/j.jhydrol.2007.11.012, 2008.
Sabater, F. and Bernal, S.: Keeping healthy riparian and aquatic ecosystems in the Mediterranean: challenges and solutions through riparian forest management, in: Water for forests and people in the Mediterrane, edited by: Boirot, Y., Gracia, C., and Palahí, M., European Forest Institute, Joensuu, Finland, 151–155, 2011.
Serrat-Capdevila, A., Valdés, J. B., González-Pérez, J., Baird, K., Mata, L. J., and Maddock, T.: Modeling climate change impacts – and uncertainty – on the hydrology of a riparian system: The San Pedro Basin (Arizona/Sonora), J. Hydrol., 347, 48–66, https://doi.org/10.1016/j.jhydrol.2007.08.028, 2007.
Serrat-Capdevila, A., Scott, R. L., Shuttleworth, W. J., and Valdés, J. B.: Estimating evapotranspiration under warmer climates: Insights from a semi-arid riparian system, J. Hydrol., 399, 1–11, https://doi.org/10.1016/j.jhydrol.2010.12.021, 2011.
Tabacchi, E., Lambs, L., Guilloy, H., Planty-Tabacchi, A.-M., Muller, E., and Décamps, H.: Impacts of riparian vegetation on hydrological processes, Hydrol. Process., 14, 2959–2976, 2000.
Terradas, J.: Introducció a la ecologia del faig en el Montseny, Diputació de Barcelona, Barcelona, 1984.
Terradas, J. and Savé, R.: The influence of summer and winter stress and water relationship on the distribution of Quercus ilex L., Vegetatio, 99–100, 137–145, 1992.
Tockner, K. and Stanford, J. A.: Riverine flood plains: present state and future trends, Environ. Conserv., 29, 308–330, https://doi.org/10.1017/S037689290200022X, 2002.
Tsang, Y., Hornberger, G., Kaplan, L. A., Newbold, J. D., and Aufdenkampe, A. K.: A variable source area for groundwater evapotranspiration: impacts on modeling stream flow, Hydrol. Process., 28, 2439–2450, https://doi.org/10.1002/hyp.9811, 2014.
UNEP – United Nations Environtment Programme: World Atlas of Desertification, Edward Arnorld Press, London, UK, 69 pp., 1992.
Walther, G., Post, E., Convey, P., Menzel, A., Parmesan, C., Beebee, T. J. C., Fromentin, J. I. O. H., and Bairlein, F.: Ecological responses to recent climate change, Nature, 416, 389–395, 2002.
Wine, M. L. and Zou, C. B.: Long-term streamflow relations with riparian gallery forest expansion into tallgrass prairie in the Southern Great Plains, USA, Forest Ecol. Manage., 266, 170–179, https://doi.org/10.1016/j.foreco.2011.11.014, 2012.
Yeh, J.-F. and Famiglietti, J.: Regional groundwater evapotranspiration in Illinois, J. Hydrometeorol., 10, 464–478, https://doi.org/10.1175/2008JHM1018.1, 2008.