the Creative Commons Attribution 4.0 License.
the Creative Commons Attribution 4.0 License.
 | 13 Jun 2018
Regional co-variability of spatial and temporal soil moisture–precipitation coupling in North Africa: an observational perspective
Chiel C. van Heerwaarden
Cathy Hohenegger
Françoise Guichard
The magnitude and sign of soil moisture–precipitation coupling (SMPC) is investigated using a probability-based approach and 10 years of daily microwave satellite data across North Africa at a 1∘ horizontal scale. Specifically, the co-existence and co-variability of spatial (i.e. using soil moisture gradients) and temporal (i.e. using soil moisture anomaly) soil moisture effects on afternoon rainfall is explored. The analysis shows that in the semi-arid environment of the Sahel, the negative spatial and the negative temporal coupling relationships do not only co-exist, but are also dependent on one another. Hence, if afternoon rain falls over temporally drier soils, it is likely to be surrounded by a wetter environment. Two regions are identified as SMPC “hot spots”. These are the south-western part of the domain (7–15∘ N, 10∘ W–7∘ E), with the most robust negative SMPC signal, and the South Sudanese region (5–13∘ N, 24–34∘ E). The sign and significance of the coupling in the latter region is found to be largely modulated by the presence of wetlands and is susceptible to the number of long-lived propagating convective systems. The presence of wetlands and an irrigated land area is found to account for about 30 % of strong and significant spatial SMPC in the North African domain. This study provides the first insight into regional variability of SMPC in North Africa, and supports the potential relevance of mechanisms associated with enhanced sensible heat flux and mesoscale variability in surface soil moisture for deep convection development.
- Article
(2342 KB) - Full-text XML
- BibTeX
- EndNote


Soil moisture can affect the state of the lower atmosphere through its impact on evapotranspiration and surface energy flux partitioning (Eltahir, 1998; Klüpfel et al., 2011). Especially in the “hot spots” of soil moisture–precipitation coupling (SMPC), like the semi-arid Sahel (Koster et al., 2004; Miralles et al., 2012; Taylor et al., 2012), soil moisture exerts strong control on evapotranspiration (Dirmeyer, 2011; Lohou et al., 2014; Timouk et al., 2009), influencing the development of the daytime planetary boundary layer (BL), and hence convective initiation and precipitation variability. Most of the physical understanding of how soil moisture could alter BL properties and affect development of convection comes from 1-D to 3-D model analyses (Nicholson, 2015; Seneviratne et al., 2010). Observational evidence of the SMPC largely relies on the measurements of recent field campaigns (Goutorbe et al., 1994; Redelsperger et al., 2006), and hence is often limited to a short spatio-temporal scale. Such observational analyses present unique evidence of environmental conditions preceding convection development (Lothon et al., 2011) and can be further used as a testing ground to evaluate and improve the physical parametrizations of models (Couvreux et al., 2013). Both observational and modelling studies agree reasonably well on the effect of soil moisture availability and heterogeneity on the lower atmospheric stability (Kohler et al., 2010) and convective initiation at the mesoscale (Birch et al., 2013; Taylor, 2010). However, the impact of soil moisture on convective precipitation remains more uncertain. At the mesoscale, there is a disagreement in the sign of the SMPC between observations and models which use parametrizations of deep convection (Hohenegger et al., 2009; Taylor et al., 2012, 2013). Recent satellite-based analysis has demonstrated that the choice of soil moisture parameter itself (temporal anomaly or spatial gradient) and related differences in physical mechanisms have a direct effect on the resulting sign of the coupling. Guillod et al. (2015) found a positive temporal (i.e. using the soil moisture anomaly) but negative spatial (i.e. using the spatial soil moisture gradient) SMPC over most of the globe at a 5∘ horizontal scale. Our study addresses the question of co-existence of spatial and temporal SMPC on a finer 1∘ × 1∘ horizontal grid. Specifically, we use 10-year satellite records of daily soil moisture from the AMSR-E and 3-hourly TMPA precipitation product to investigate spatio-temporal co-variability of observed coupling relationships in the region of North Africa.
Both modelling and observational studies reported the possibility of negative as well as positive SMPC (Nicholson, 2015). Spatial gradients in soil moisture can affect BL state and convection initiation through thermally induced mesoscale circulations on 10 to 100 km scales (Rochetin et al., 2017; Taylor and Ellis, 2006; Taylor et al., 2007). In association with this mechanism and under favourable thermodynamic conditions, convection is likely to be initiated over spatially drier soils, indicating a negative SMPC (Garcia-Carreras et al., 2011; Taylor et al., 2011). However, whether the further development and propagation of moist convection will occur over drier or wetter soils remains less clear. The modelling study of Froidevaux et al. (2014) suggested that negative SMPC is possible under very weak surface wind conditions, and is associated with stationarity of convective systems once initiated. The opposite sign is expected under a stronger horizontal advection, which will support propagation of the developing moist convection downwind, i.e. from dry to wet soils, and its further amplification over wetter areas. Another important factor is related to the life cycle of mesoscale convective systems (MCSs) and thus their organization in space and time (Mathon et al., 2002). Small-scale convective systems are expected to be particularly sensitive to surface moisture variability and will propagate preferentially towards spatially drier soil, bounded by wetter surroundings (Taylor and Ellis, 2006). Alternatively, larger organized systems have been found to evolve towards wetter soils – areas of increased latent heat flux, convective available potential energy (CAPE) and moist static energy (MSE) (Clark et al., 2003; Taylor and Lebel, 1998). Hence, these systems are expected to be more sensitive to soil moisture availability.
The impact of temporal anomalies of soil moisture on the atmospheric BL and moist convection is largely governed by thermodynamical processes, and may likewise result in a coupling of both signs. Wet soils are expected to lead to an increase of boundary layer MSE or similarly equivalent potential temperature, through a decreased boundary layer height and subsequent less vigorous entrainment (Alonge et al., 2007; Eltahir, 1998). The enhanced MSE over wet soils is favourable for convective rainfall formation. Dry soils, on the contrary, are associated with a reduced MSE and thus provide lower potential for convection development and may even suppress the existing MCS (Gantner and Kalthoff, 2010) or deviate its propagation direction (Wolters, 2010). However, modelling and observational evidence indicates that both dry and wet soils can favour moist convection, depending on the morning stratification of the lower atmosphere (Findell and Eltahir, 2003a, b) into which the daytime convective BL is growing (Couvreux et al., 2012; Ek and Mahrt, 1994; van Heerwaarden and Guerau de Arellano, 2008).
The relevance of mesoscale spatial heterogeneity of soil moisture in favouring moist convection over wet and dry temporal soil moisture anomalies was demonstrated by e.g. Clark et al. (2003) and Taylor and Ellis (2006) respectively. However, until recently no attempts had been made to directly compare the temporal and spatial aspects. The first comparison of the spatial and temporal effects of soil moisture on precipitation was presented by the study of Guillod et al. (2015) (hereafter, G15) at a 5∘ horizontal scale. Applying the probability-based approach of Taylor et al. (2012) (hereafter, T12) to 10 years of global satellite-based soil moisture and precipitation data, they demonstrated that a negative spatial (rain over spatially drier soils) and a positive temporal (rain over temporally wetter soils) SMPC dominate over most of the globe and are not mutually exclusive of one another. G15 suggested that the two effects might be interconnected through spatial coupling mechanisms, in which adjacent precipitation would provide required moisture to enhance convection development over spatially but not temporally drier soil. Using multiple data sets, G15 showed that the signal is robust across different input data sets. However, in a few regions, including the Sahel in Africa, an opposite temporal relationship was revealed: spatially and temporally negative coupling was found to co-exist in contrast to the global relationship.
In this study, we further explore spatial and temporal SMPC as well as their co-existence in the North African region using the T12 method on a finer 1∘ × 1∘ horizontal grid. Furthermore, we provide insight into the regional co-variability of the spatial and temporal effects on afternoon rainfall. The analysis is realized following two main steps.
-
Identification of the factors that influence the magnitude and variability of the spatial SMPC measure. By doing so we address the following question: which physical processes likely underlie the observed spatial SMPC relationship, if any?
-
Analysis of the link between the spatial and temporal effects of soil moisture on precipitation. This part addresses the two following questions: are spatial and temporal negative coupling relationships independent, and if not, how do they inter-relate?
We reproduce and apply the probability-based approach of T12 to 10 years of daily AMSR-E soil moisture and 3-hourly TMPA precipitation records. In contrast to the previous studies, we estimate the temporal and spatial coupling effects at a finer 1∘ horizontal scale, which reveals previously hidden smaller scale effects of land cover features on the SMPC relationship.
The first part of the study (Sect. 4) includes an analysis of the regional variability and robustness of the observed spatial SMPC at varying horizontal scales i.e. from the original 5 to 2.5∘ and 1∘. Identification of the factors relevant for the observed spatial SMPC distribution includes a sensitivity analysis of the spatial coupling measure to the presence of soil moisture parameter extremes (Sect. 4.3) and to the MCS life cycle (Sect. 4.4). The link between the temporal and spatial SMPC is assessed using correlation analysis in Sect. 5.1. The summary and discussion in Sect. 6 is delivered in two parts. Section 6.1 provides main conclusions on the potential physical mechanisms which likely underlie the observed coupling relationships. Section 6.2 reviews the reasons behind the opposite sign of the temporal coupling identified in the North African region as compared to the dominantly positive relationship identified in G15 over the globe. The paper concludes with more general discussion of the SMPC hot spots and conclusions in Sect. 7.
2.1 Study domain
We focus our analyses on the North African region (5–20∘ N, 20∘ W–40∘ E) (Fig. 1, dashed rectangle) during the summer period (JJAS). This region has been repeatedly pointed out as a hot spot of land–atmosphere interactions (Dirmeyer, 2011; Gallego-Elvira and Taylor, 2016; Miralles et al., 2012), and one of the most vulnerable regions with respect to climate change (Dirmeyer and Wang, 2014; Dirmeyer et al., 2012). A major feature affecting the Sahelian climate is the West African monsoon (Janicot and Thorncroft, 2008), which is associated with high precipitation variability (Nicholson, 2013). During the monsoon, soil moisture fluctuations are strongly influenced by precipitation at a large range of spatial and temporal scales. Atmospheric and surface fields display strong meridional gradients between 10 and 20∘ N (Fig. 1, zonal plot), shaped by the migration of the summer time rain belt, also referred to as the intertropical convergence zone (ITCZ). Wind convergence at the surface is observed further north, around 18–20∘ N, along the intertropical discontinuity (ITD), where the cool and moist monsoon flow meets hot and dry Saharan air. Associated with the meridional heat gradient, the monsoon circulation and related large-scale structures like the African easterly jet (AEJ), as well as synoptic disturbances like the African easterly waves (AEWs), largely modulate convection activity over the region (Duvel, 1990; Mohr and Thorncroft, 2006). Additionally, evidence supporting a significant role of the surface state in the triggering of deep precipitating convection is steadily growing (Nicholson, 2015).

Figure 1JJAS TMPA precipitation (shading), mean surface (red streamline) and 700 hPa (black streamline) ERA-Interim (1979–present, Dee et al., 2011) wind climatology averaged over the 2002–2011 period. The black thick line shows the mean location of the African easterly jet (AEJ). The inset plot to the left shows zonal means of daily AMSR-E soil moisture (red) and TMPA precipitation (blue) climatology calculated over the study domain (dashed rectangle, 5–20∘ N, 20∘ W–40∘ E).
The conditions in mid-July to August may be less favourable for a strong surface influence on convection. Compared to the drier early and late monsoon months of June and September, the wetter period – from July through August – is characterized by a typically lower level of free convection (LFC) (Guichard et al., 2009; Taylor et al., 2011) and less pronounced spatial contrast between fluxes due to more dense vegetation (Kohler et al., 2010; Lohou et al., 2014). In our study, the role of the monsoon dynamics is not addressed to preserve maximum sample size for the sake of statistical significance.
We intentionally extend our analysis further eastwards. Despite the inherent zonal symmetry of surface and atmospheric parameters (as in precipitation in Fig. 1), considerable differences exist in rainfall and large-scale circulation regimes between east and west. Distinct orography, intensity of surface and upper level jets and wave disturbances are likely to bring dissimilarities in the sensitivity of convection to the surface state between the two regions. The eastern African domain can also remotely influence convection in the western part of the region via the genesis of westward-propagating AEWs (Laing and Carbone, 2008) and long-lived MCSs (Laing et al., 2012). However, notably few studies have investigated land–atmosphere interactions in the eastern Sahel.
2.2 AMSR-E soil moisture
Soil moisture (SM) data from the Advanced Microwave Scanning Radiometer – Earth Observing System (AMSR-E, June 2002–October 2011) are analysed in this study. The AMSR-E unit is carried on board the polar orbiting AQUA satellite, measuring brightness temperatures in 12 channels, at 6 different frequencies (6.9–89 GHz) (Njoku and Jackson, 2003). Soil moisture derived from the lowest C-band frequency of 6.9 GHz is used here, as lower frequencies experience less signal contamination from vegetation and surface roughness, and are able to receive emission information from deeper soil layers (Owe et al., 2008). The AQUA orbit is sun-synchronous, with typically one overpass per pixel per day at either 13:30 or 01:30 local solar time (LST). In order to capture the surface moisture state shortly before afternoon convection activity, only data of ascending day orbit, i.e. 13:30 LST, are used here. It is important to note that the day overpass is prone to higher biases compared to the night overpass because of the greater temperature differences between the surface and canopy involved in the physics algorithm (Njoku and Jackson, 2003).
We utilize the Level 3 estimates of AMSR-E soil moisture derived with the Land Parameter Model (Owe et al., 2008) for JJAS 2002–2011. The product is available at a 0.25∘ × 0.25∘ spatial resolution. The LPRM is not valid for dense vegetation and water bodies. Therefore pixels with an optical depth > 0.8 are excluded. Water body and soil moisture quality masks were adopted from the materials of T12. Accordingly, pixels containing more than 5 % water are excluded, using water body classification of the 1 km Global Land Cover 2000 data set (available online at http://forobs.jrc.ec.europa.eu/products/glc2000/products.php, last access: September 2017). Application of the soil moisture quality mask, based on the correlation analysis between precipitation and soil moisture data sets, is intended to reduce the number of pixels covered with wetlands (for details, see the supplement in T12).
Many days (40–50 %) do not contain soil moisture information due to satellite revisit times. Over a given longitude per day the number of overpasses below 40∘ N does not exceed one, with occasionally daily sampling or sampling every third day (Njoku and Jackson, 2003). The latter significantly reduces the size of the collected rainfall event sample available for the analyses. The AMSR-E instrument is chosen because it documents a relatively long period and performs better than ASCAT (Dorigo et al., 2010) over sparsely vegetated and deserted areas. The AMSR-E product also proved to be accurate at the precipitation event scale in capturing rain-related soil moisture variability and timing, when compared with in situ data in the Sahel (Gruhier and Rosnay, 2008).
2.3 TMPA-v7 precipitation
The Tropical Rainfall Measuring Mission (TRMM) Multi-satellite Precipitation Analysis (TMPA) represents a partial-global coverage (50∘ S–50∘ N) product of combined precipitation estimates. Three-hourly precipitation time series of the TMPA product (Huffman et al., 2007) at 0.25∘ × 0.25∘ horizontal resolution are used to estimate locations of afternoon convective precipitation events in the study.
The TMPA algorithm (Huffman et al., 2007) involves the following steps: (1) the merging of multiple independent passive microwave sensors, (2) their inter-calibration to the TRMM Combined Instrument (TCI) precipitation estimates, (3) further blending with preliminary calibrated infrared products from geostationary satellites and finally, (4) the scaling of the estimates to match monthly accumulated Global Precipitation Climatology Center (GPCC) rain gauge data.
In this study we utilize the product version 7 (TRMM-3B42), which includes several modifications to the algorithm and additional satellite data (Huffman and Bolvin, 2014). Consistent with the soil moisture record, only 10 years (2002–2011) of JJAS precipitation data are used. To ensure similar solar forcing on the surface and boundary layer, the 3 h precipitation time series for the present application are adjusted to LST (based on longitude) by taking the closest 3 h UTC time step. It is important to note that any 3 h TMPA value does not refer directly to its nominal hour, but it represents the average of the “best” overpass data within a 3-hourly window, centred around the nominal hour, i.e. ±90 min range. Variable time of the TMPA best data average is not expected to significantly affect our SMPC results.
3.1 Description of statistical framework
The SMPC in this study is referred to as the relationship between the afternoon convective rainfall and the antecedent soil moisture conditions. Using the method of T12, we examine first whether afternoon rainfall is more likely over soils that are untypically (relative to its climatology) drier or wetter than their surroundings. Next, following the definition of G15, we assess whether afternoon rainfall is more likely on days when soils are untypically drier or wetter than their temporal mean. Subsequently, the probability of convective rainfall events to occur over spatially drier or wetter soils being higher than expected is referred to as spatial SMPC, while the likelihood of convective rain events to occur over temporally wetter or drier soils being higher than expected is described by temporal SMPC. The following paragraph describes criteria which are used to define a convective precipitation event and evaluate soil moisture statistics antecedent to every event. The framework algorithm implemented in this study largely follows the method of T12 and is summarized in Fig. 2.
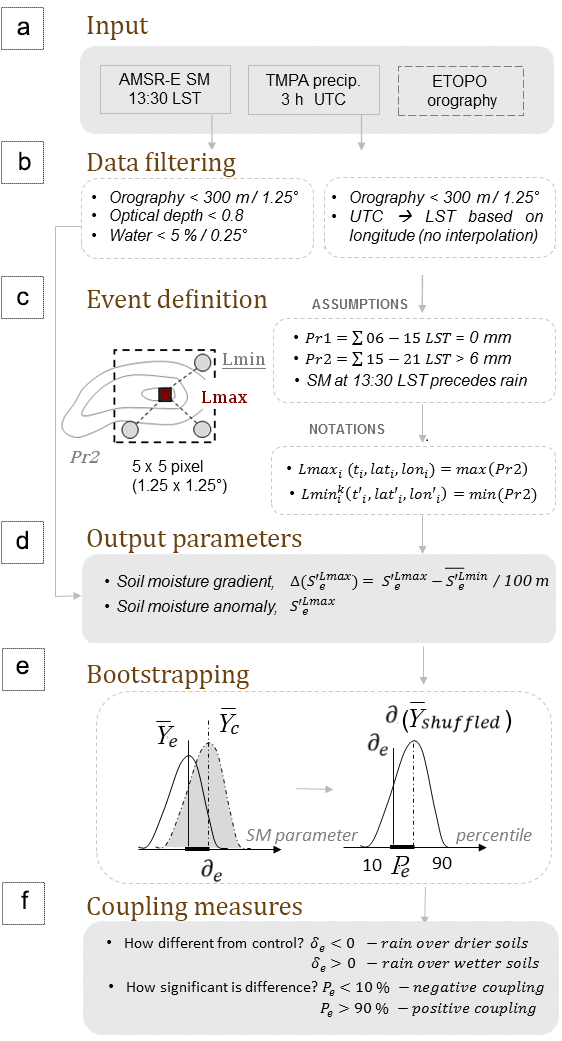
Figure 2Schematic of data post-processing and statistical framework protocol implemented in the study.
3.1.1 Definition of convective rainfall event (Fig. 2c)
We define a convective event location, Lmax, as the location where accumulated afternoon precipitation between 15:00 and 21:00 LST exceeds a threshold of 6 mm. Then, locations of afternoon accumulated precipitation minima, Lmin, are identified within a 5 × 5 pixel box (1.25∘ × 1.25∘)1 centred at Lmax (Fig. 2c). The choice of a later accumulation time than in T12 (i.e. 15:00–21:00 LST instead of 12:00–21:00 LST) ensures that the soil moisture measurement at 13:30 LST precedes precipitation without introducing additional filters. The afternoon accumulated rainfall threshold that is twice larger than in T12 yields qualitatively similar results, though it leads to a slightly higher mean SMPC significance over the domain. According to additional sensitivity tests, the choice of higher threshold values in the method mostly influences the number of significant grid boxes linked to a reduction in the event sample size, yet it does not qualitatively affect the dominant preference of the afternoon rainfall over specific soil moisture conditions (Petrova, 2017).
The following set of assumptions is used to improve the accuracy of the convective event sample. If one of the conditions is not fulfilled, an event is excluded from further calculation.
-
Accumulated precipitation in the preceding hours (06:00–15:00 LST) in the entire 1.25∘ × 1.25∘ box must be zero.
-
The elevation height difference within the event box must not exceed 300 m. This is done to minimize the effect of orographic uplifting on the rainfall variability. The resulting distribution of the orography mask is shown in Fig. 3a.
-
The number of identified Lmin locations within one box must be three or more (for averaging reasons). In that case, all Lmin locations will have the same afternoon accumulated precipitation value, which will most often be zero.
-
If boxes overlap, the event with larger afternoon accumulated precipitation value is retained.
3.1.2 Soil moisture statistics in event locations (Fig. 2d–e)
Once events are identified, the soil moisture anomaly, S′, measured prior to the precipitation event (at 13:30 LST) at Lmax, or any combination of the two is stored and analysed. represents an average value of S′ measured in every identified Lmin location within a 1.25∘ × 1.25∘ event box. S′ has its climatological mean subtracted, calculated as linear averaging within a 21-day moving window centred on the particular day and across the entire multi-year record. To exclude the contribution of a rain event from the anomaly values, the year of the event is excluded from the climatological mean calculation. To estimate whether soils were anomalously dry or wet in the location of maximum rain (Lmax) compared to the expected range (climatology) for that location, we store the pre-event soil moisture anomaly at Lmax, i.e. Ye: (Fig. 2d). To investigate whether soils in the location of maximum rain (Lmax) were drier than in the neighbour region(s) where it rained less or did not rain (Lmin), we calculate the pre-event soil moisture gradient between Lmax and scaled per 100 m, i.e. Ye: – with the dimension of m3 m−3 100 m−1, where Δ stands for the gradient.
For each Ye parameter we define the control sample Yc, represented by an array of corresponding Y values measured in the same Lmax and Lmin event locations in the same calender month, but on the non-event years. The measure of coupling is then quantified by the magnitude of the difference between mean statistics of the event and control samples, δe= mean(Ye)− mean(Yc), and the measure of δe significance (Fig. 2e). Significance is represented by a percentile, Pe, of the observed δe in a bootstrapped sample of δ values that is observed by chance. For that, Ye and Yc are pooled together and resampled without replacement 5000 times.
3.1.3 Definition of temporal and spatial SMPC (Fig. 2f)
Parameters of δe and Pe calculated for the soil moisture gradients prior to the event quantify the preference of rain to occur over soils drier (δe < 0, Pe ≤ 10 %) or wetter (δe > 0, Pe ≥ 90 %) than their 1.25∘ × 1.25∘ environment, and are referred to as negative or positive spatial SMPC respectively. The same parameters estimated for the temporal soil moisture anomaly instead specify the expressed preference of rain to occur over soils drier or wetter than their temporal mean, i.e. negative or positive temporal SMPC, accordingly.
In this study, estimation of δe and its significance Pe for the spatial and temporal coupling is realized over 5∘ × 5∘, 2.5∘ × 2.5∘ and 1∘ × 1∘ boxes. Aggregation of event statistics at a higher resolution than used in the global studies of T12 and G15 results in a smaller event sample size per grid box, yet allows a reduction of the potential influence of meridional or zonal gradient in the parameter statistics; i.e. it makes the spread in underlying surface and atmospheric moisture conditions across the box latitudes smaller (Sect. 4.2). The latter is valuable for the interpretation of obtained statistics in terms of land cover and atmospheric state. Hence, most of the study focuses on the smallest 1∘ × 1∘ spatial grid.
3.2 Statistics of convective events
Application of the algorithm to the 10 years of JJAS AMSR-E soil moisture and TMPA precipitation time series yields 10 131 afternoon rainfall events. The distribution of identified events over the domain at 5∘ × 5∘ and 1∘ × 1∘ grid is shown in Fig. 3b and c respectively. The signature of orography and large-scale dynamic effects on event occurrence becomes more evident at the finer event-aggregation scale, thus giving an advantage to the highest horizontal resolution. Figure 3c shows that most events occur between 10 and 18∘ N, and the occurrence maxima are zonally aligned. Two maxima are found over the central Sahel, covering the area between 10∘ W and 15∘ E – aligned with the mean position of the AEJ core (Fig. 1b). Another two maxima are evident at about 22 and 30∘ E. Overall, the obtained distribution of identified rain events at 1∘ × 1∘ grid resolution is consistent with the observed distribution of intense MCSs over the region (Mathon and Laurent, 2001).
4.1 SMPC at a 5∘ horizontal scale: comparison with previous studies
We start our assessment by investigating the spatial soil moisture–precipitation coupling relationship. In agreement with the global-scale studies of T12 and G15, we find a dominantly negative spatial SMPC in the North African domain on the 5∘ × 5∘ grid, i.e. a strong preference for convective rainfall events to occur over spatially drier soils (Fig. 4a). The majority of the 5∘ × 5∘ boxes (72 %) have percentile values Pe lower than 10 %, implying a significant negative difference in the mean magnitude of soil moisture gradients prior to the events relative to their typical (non-event) state. No significant positive difference between event and non-event conditions is found at the 5∘ scale (Table 1).

Figure 3(a) Elevation map based on 1 arcmin Global Relief Model data ETOPO1 (Amante and Eakins, 2009) (grey shading) and the orography mask used in the study (red dots). The main orographic features of the region are the AM – Air Mountains, DM – Darfur Mountains, EH – Ethiopian Highlands, CM – Cameroon Mountains, JF – Jos Plateau and GH – Guinea Highlands. (b–c) Number of events in every (b) 5∘ × 5∘ and (c) 1∘ × 1∘ box (gray shading) and the applied orography mask at a 0.25∘ horizontal resolution (red dots).
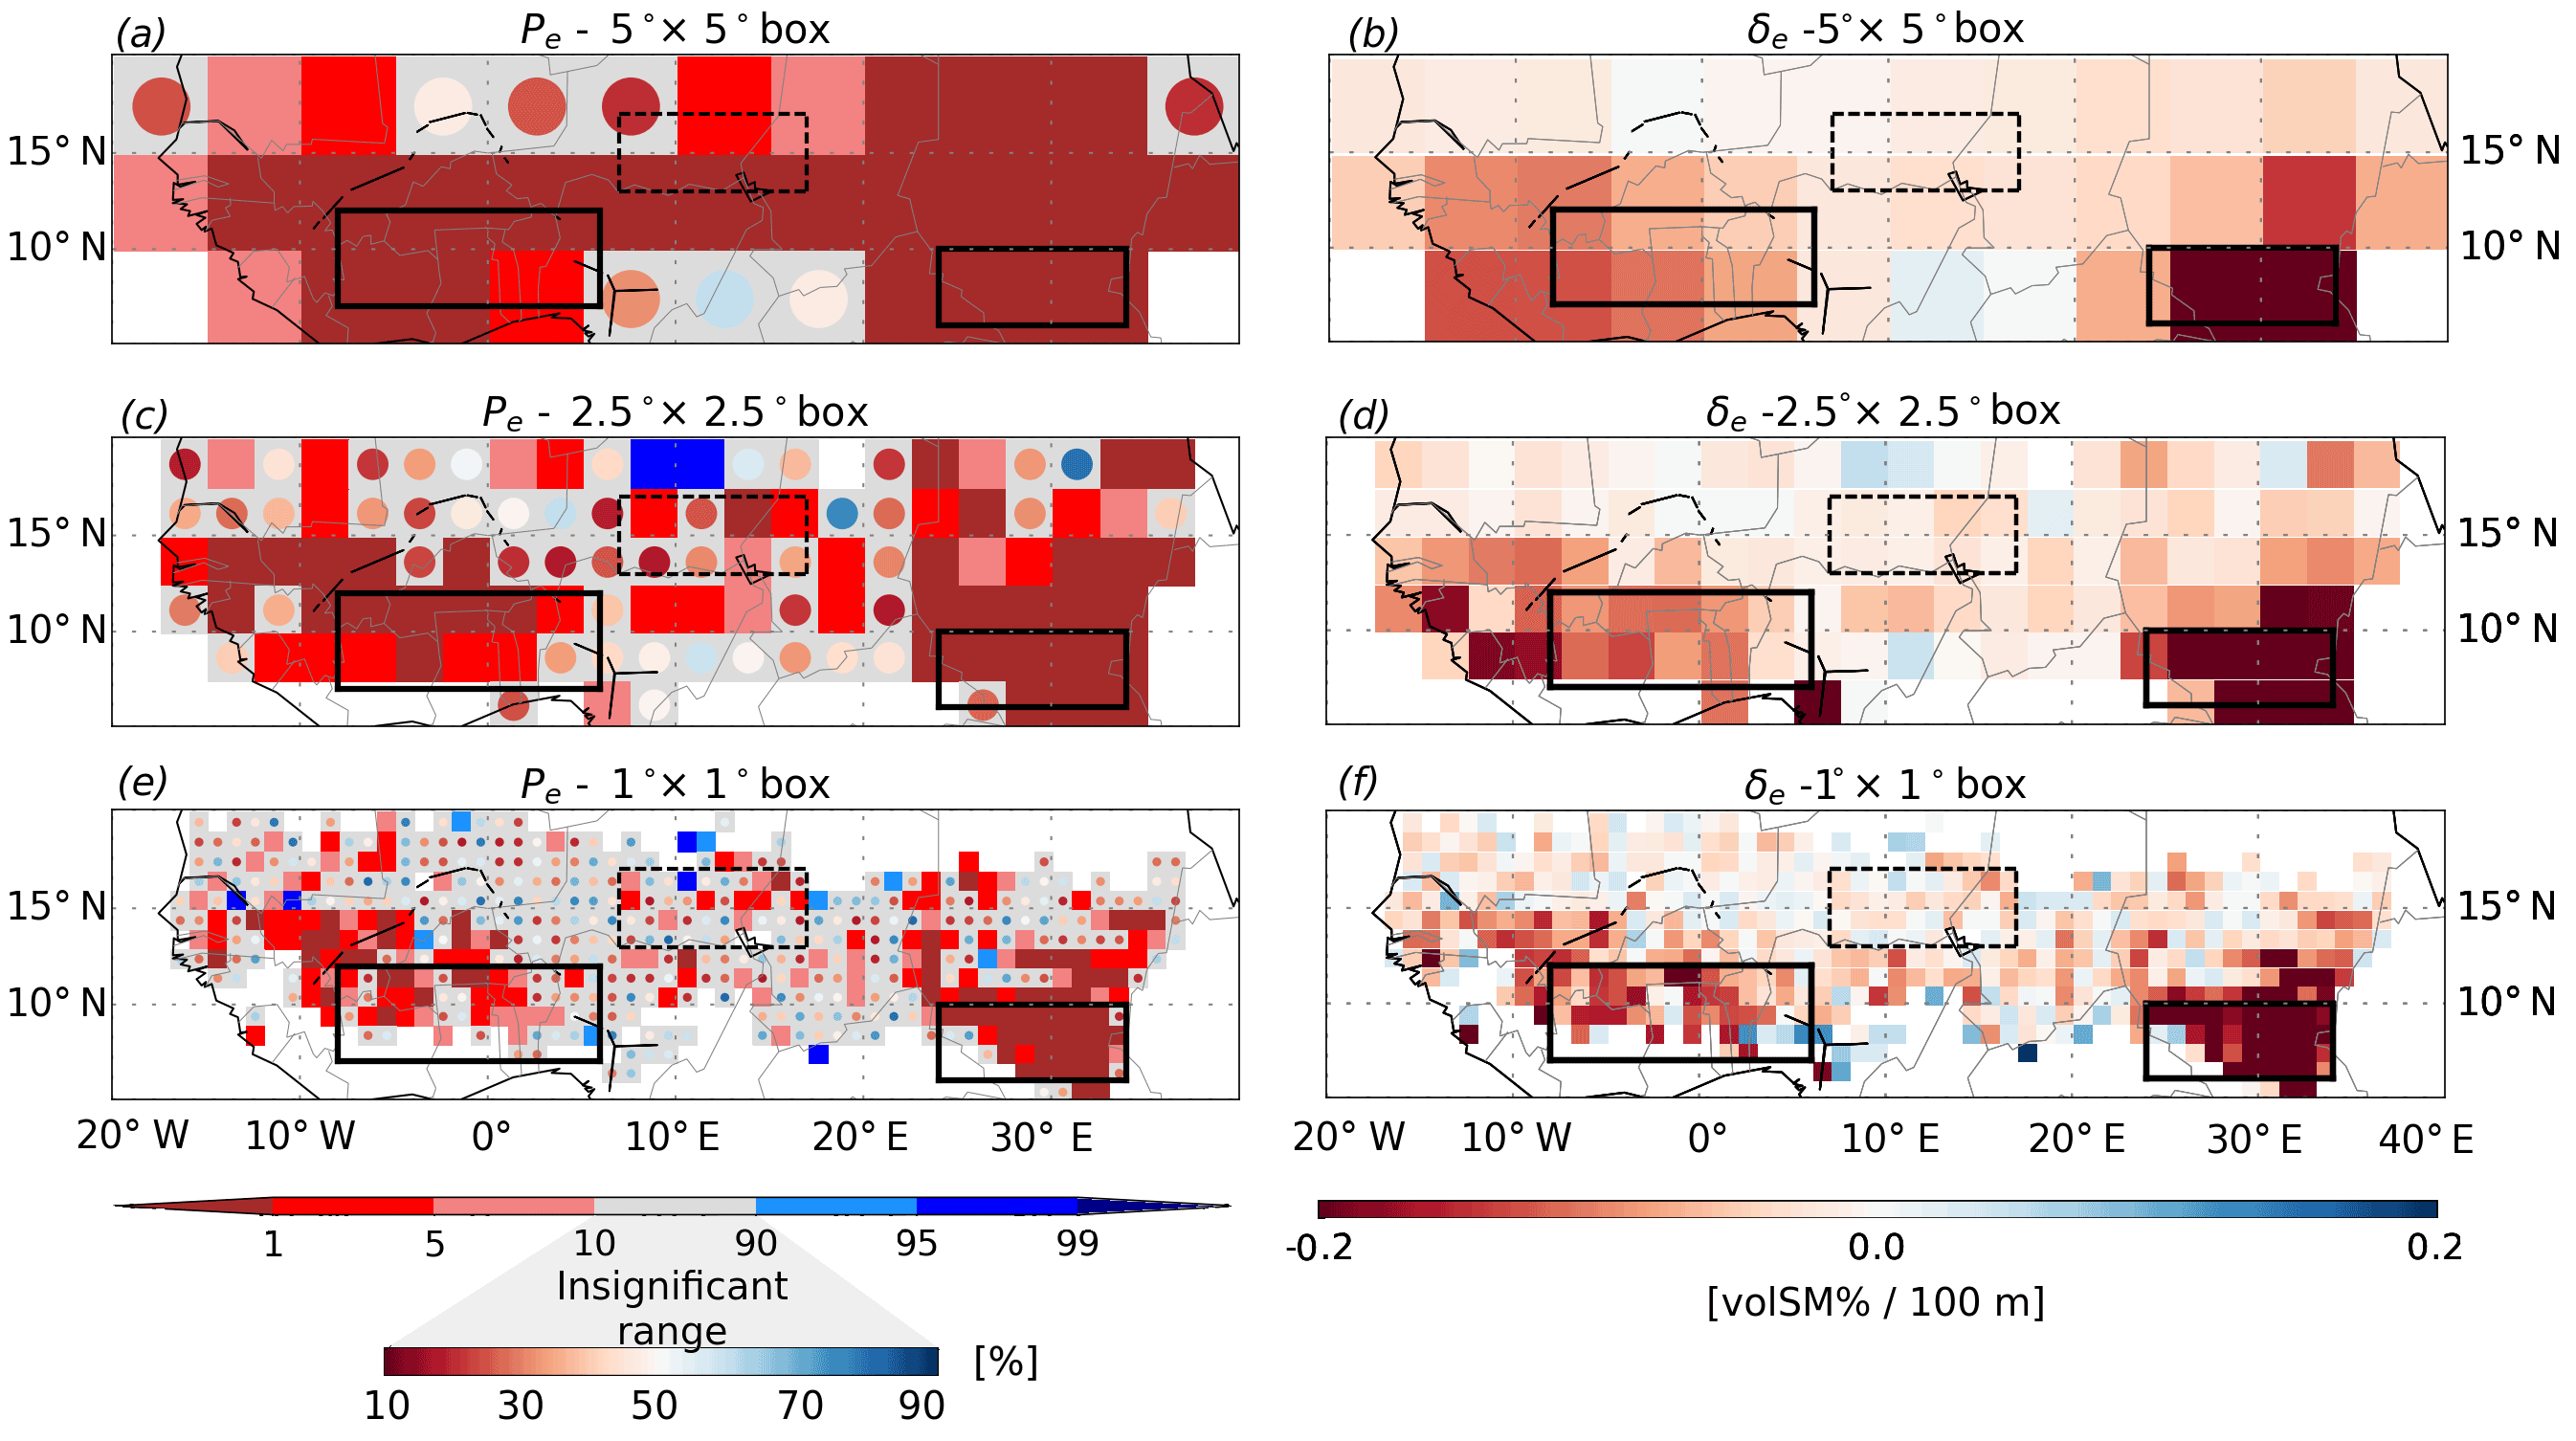
Figure 4Distribution of percentiles Pe (a, c, e) of the observed δe difference (b, d, f), estimated over (a–b) 5∘ × 5∘, (c–d) 2.5∘ × 2.5∘ and (e–f) 1∘ × 1∘ boxes. Percentiles < 10 % indicate significant negative coupling, i.e rain over spatially drier soils, and percentiles > 90 % – significant positive coupling, i.e. rain over spatially wetter soils. The percentile values lying outside the significance range (i.e. between 10 and 90 % percentiles) are illustrated by circles. Black rectangles on the maps indicate featured domains selected for an in-depth analysis.
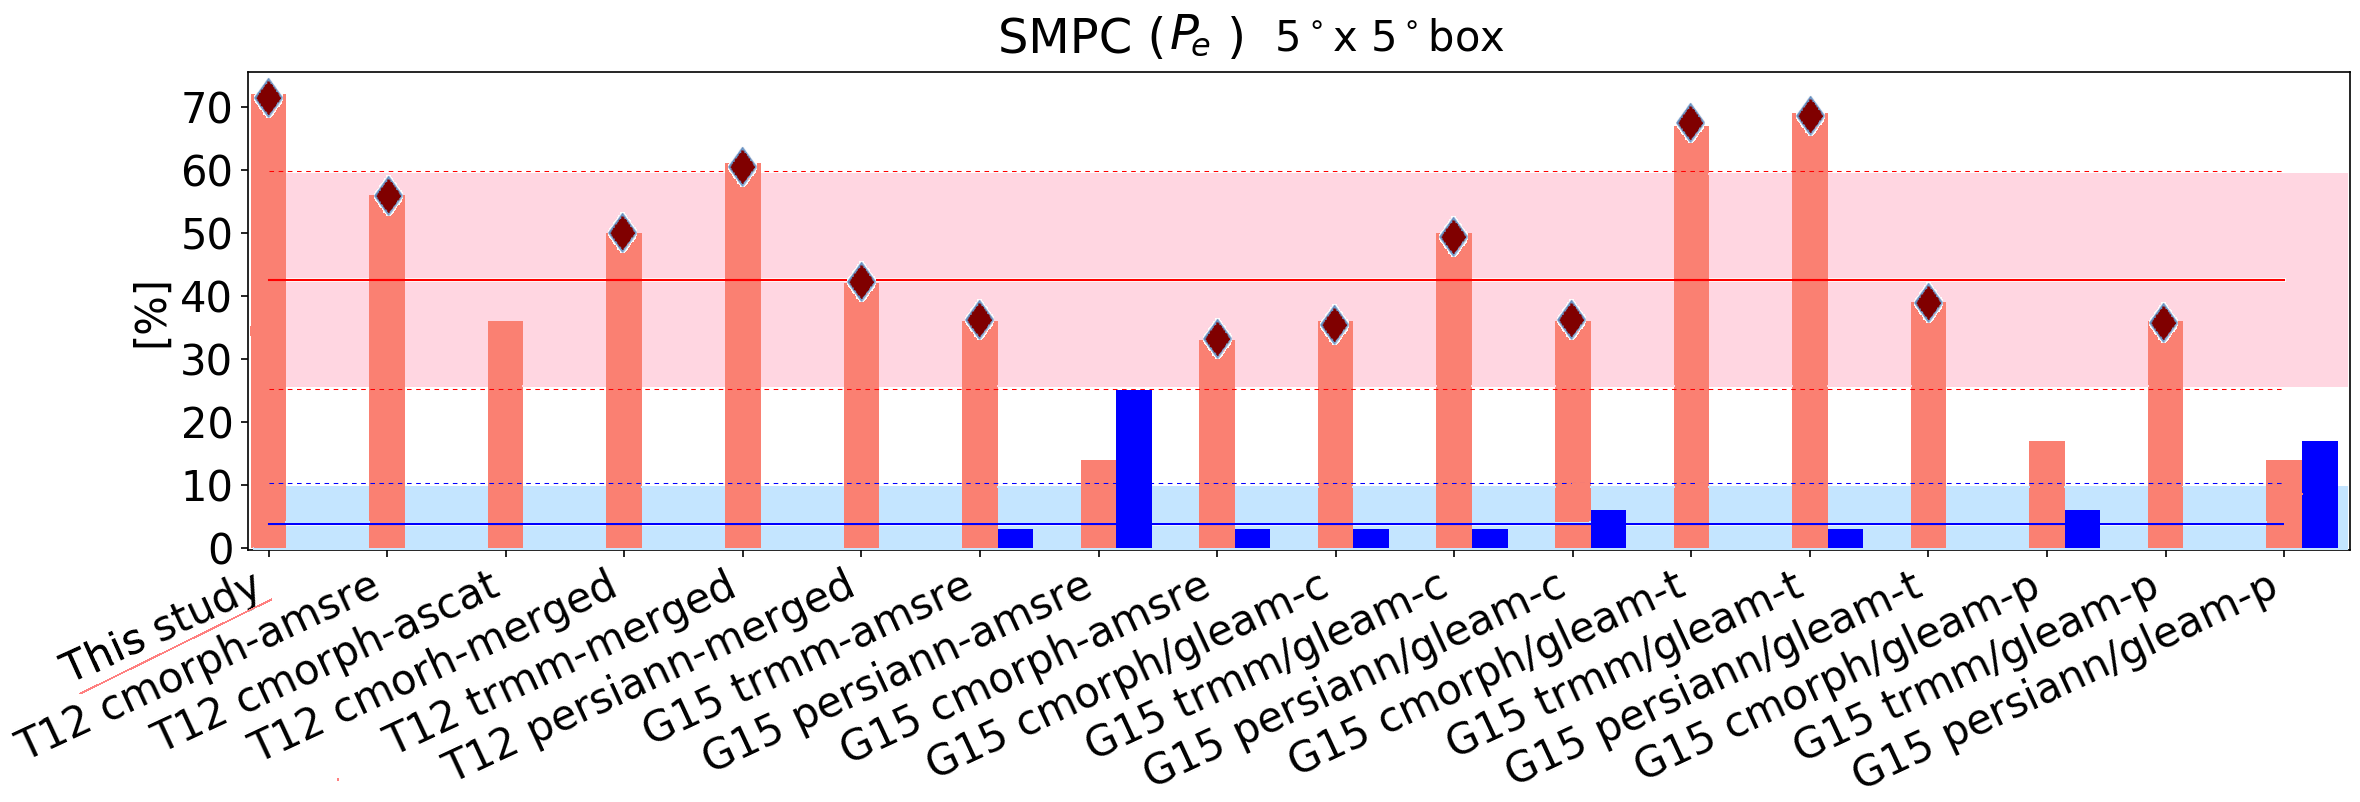
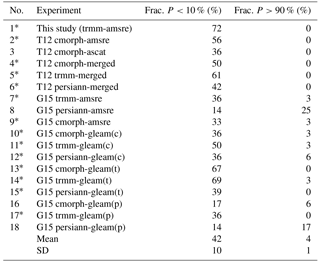
Figure 5Percentage of 5∘ × 5∘ grid boxes with significantly negative (Pe < 10 %, in red) and positive (Pe > 90 %, in blue) spatial SMPC over the North African domain in this study and previous studies of T12 and G15. Different data set combinations used in T12 and G15 are listed. Mean and SD of the negative (positive) SMPC fractions across the experiments are shown as a red (blue) solid line and shading accordingly. Following visual inspection, the experiments, in which a significant negative SMPC relationship exists in the western region of the North African domain, are marked with a rhomb.
Table 1General statistics of the average event number and percentile Pe and δe difference estimated at various scales for three soil moisture parameters: soil moisture gradient , temporal soil moisture anomaly and (not presented in the methodology) soil moisture variance over the 1.25∘ box . Percentiles Pe < 10 % (> 90 %) indicate a significant negative (positive) δe difference, and hence a negative (positive) SMPC relationship.
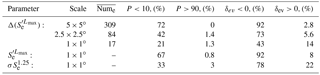
Figure 5 further compares the percentage of the domain area with significant negative and positive coupling identified in our study and in the previous studies of T12 and G15 (see also Table A1 in the Appendix). The differences arise due to disparities in the data sets and methodologies. The weakest negative and the strongest positive coupling signals correspond to the estimates based on the PERSIANN (Precipitation Estimation from Remotely Sensed Information using Artificial Neural Networks; Hsu et al., 1997) data set from G15. This is possibly linked to the lower consistency between the PERSIANN precipitation and soil moisture variability in time (T12). On average, results based on different data set combinations summarized in Fig. 5 agree that afternoon precipitation occurs more often than expected over spatially drier soils in 42 % of the 5∘ × 5∘ boxes, compared to only 4 % with a preference over spatially wetter soils (red and blue lines in Fig. 5 respectively).
The variability of spatial SMPC patterns among different data set combinations has shown to be quite strong over the globe and was not analysed further in G15. We find, however, that in the North African domain, areas of significant negative spatial coupling are fairly consistent. One of the most robust negative spatial SMPC signals is found in the south-western part of the domain (Fig. 4a, b). A total of 14 out of 18 data set combinations summarized in Fig. 5, including this study, locate the cluster of the lowest percentiles roughly between 5–15∘ N and 10∘ W–10∘ E (Fig. 5, rhombs). This region occupies a relatively vast and flat area, associated with a reduced orographic forcing on convection development compared to the east, and a regional minimum in cold cloud occurrence (Laing and Carbone, 2008). The effect of large-scale structures like AEWs and the AEJ on convection, on the contrary, is expected to be stronger in the western Sahel than further east. However, this does not exclude and may even favour higher sensitivity of convection triggering to soil moisture heterogeneities (Adler et al., 2011; Gantner and Kalthoff, 2010). Overall, the identified negative spatial SMPC relationship in the region is consistent with the recent observation-based (Lothon et al., 2011; Taylor, 2010; Taylor and Ellis, 2006) and model-based (Birch et al., 2013; Gantner and Kalthoff, 2010; Garcia-Carreras et al., 2011; Taylor et al., 2013) studies in the western Sahel.
Another cluster of the lowest percentiles and the largest differences in soil moisture state between event and non-event days δe is identified in the south-east of the domain (Fig. 4a, b). The proximity to the Ethiopian Highlands and the presence of extensive seasonally flooded regions in this area makes it generally difficult to isolate the effect of the surface state on convection. This also possibly led to less agreement in the spatial SMPC estimates identified in our study, G15 analyses and T12 analyses (not shown). Unlike in the western Sahel, no accurate estimates of the SMPC exist in this eastern region.
4.2 Robustness of the negative SMPC at finer 2.5 and 1∘ scales
To identify factors and potential physical mechanisms that influence the magnitude and variability of the SMPC we reduce the event-aggregation scale to a finer 2.5∘ × 2.5∘ and 1∘ × 1∘ horizontal grid2. In particular, aggregation of the convective rainfall events and corresponding soil moisture statistics over the smallest 1∘ × 1∘ grid boxes reveal more details on the effects of land surface conditions on the SMPC.
The percentile maps obtained for the finer scales are presented in Fig. 4c and e. Despite the reduction in the number of significant δe values, largely due to the decreased number of events in every box, negative spatial SMPC relationships remain dominant at the finer scales, and exhibit a similar spatial pattern as on the 5∘ × 5∘ grid. The featured regions of significant negative coupling now scale down to the territories of Burkina Faso, Benin, parts of Côte d'Ivoire, Ghana and Mali (7–15∘ N, 10∘ W–7∘ E) in the west, as well as South Sudan (5–13∘ N, 24–34∘ E) in the east (Fig. 4e). In total, 42 % (21 %) of the boxes reveal significant negative difference δe for the 2.5∘ (1∘) scale, versus an initial 72 % at the 5∘ × 5∘ grid (Table 1).
The overall distribution of the difference δe does not change at the finer scales (Fig. 4d, f). However, multiple pixels with a positive δe emerge. For example, a small region enclosed between the Cameroon mountains and Jos Plateau (7∘ N, 8∘ E; Fig. 4f) now indicates a higher likelihood of rainfall to occur over spatially wetter soils. The relationship, though non-significant, is plausible. This area includes part of the Niger River valley and represents a prominent location of intense convection and a local maximum of the cold cloud occurrence, linked to the initiation of convection at the lee side of the high terrain (Laing and Carbone, 2008). The potential link between the land surface characteristics and SMPC parameter is explored in more detail in the following section. In total, 14 % of the 1∘ × 1∘ boxes reveal a positive δe shift, compared to less than 6 and 3 % for coarser 2.5∘ × 2.5∘ and 5∘ × 5∘ grids respectively.

Figure 6(a) Schematic box plot illustrating the quantile range (Q25–1.5 × IQR, Q75 + 1.5 × IQR) used to identify extreme values. Here, Q75 and Q25 are the third and first quartiles respectively, and the interquartile range (IQR) is the difference between them. (b) Natural wetland fraction from Matthews and Fung (1987) on a 1∘ × 1∘ grid (adopted from Fig. 3 in Prigent et al., 2007). Names of major wetland and river locations are marked with a number. (c) Distribution of soil moisture gradient extremes in the corresponding event sample of a 1∘ × 1∘ box (colour). is considered to be an extreme if it lies outside the (Q25–1.5 × IQR, Q75 + 1.5 × IQR) range. If more than one extreme is found in one grid box, then its average value is shown. Black crosses indicate boxes containing Lmin locations, in which climatology of daily soil moisture drying rates does not vary much with different absolute soil moisture values. This relationship is equivalent to low soil moisture variability in time and is representative of a wet (flooded) locations. For detailed algorithms, the reader is referred to Fig A1. The distribution of identified potentially flooded locations is consistent with the natural wetland fraction (b).
4.3 Evidence of a “wetland breeze” mechanism in the SMPC statistics
In areas like the Cameroon Mountains, where orography or floodplains have an effect on deep convection development, persistent wet and dry surface moisture patterns may pre-exist or develop, and therefore, lead to the occurrence of spatial soil moisture gradients that are stronger than usual. In the SMPC statistics, such gradients occur as extremes in a given distribution of soil moisture gradients within a 1∘ × 1∘ box. Here, we define a gradient to be an extreme if it lies outside the following range: (Q25–1.5 × IQR) to (Q75 + 1.5 × IQR), where Q75 and Q25 are the third and first quartiles respectively, and the interquartile range (IQR) is the difference between them (Fig. 6a).
The distribution and magnitude of the extreme soil moisture gradients identified in the domain are shown in Fig. 6 (color shading). We find that 28 % of all valid 1∘ × 1∘ boxes contain extreme . Most of the extreme soil moisture gradients are located in the regions of significant negative coupling in the west and east. In these areas, extreme values lead to an overestimation of the sample mean and therefore, δe magnitude. As a result, extreme gradients appear to predefine SMPC significance. Removal of extremes leads to a decrease in the number of boxes with significant negative spatial coupling by 30 %. However, in most cases the sign of the coupling remains unchanged (not shown).
Further analysis shows that extremes tend to cluster around major rivers and wetland areas in the east and west (Fig. 6b, c). Regional distribution of extreme is consistent with the distribution of natural wetland fraction, presented earlier by Matthews and Fung (1987) and shown in Fig. 6b, and more recent estimates of inundation regions identified by Prigent et al. (2007). Strong positive soil moisture gradients are found around the Senegal River close to the coast, and on the lee side of the Cameroon Mountains. Strong negative soil moisture gradients are more numerous and seen all along the western flow of the Niger River, downwind of the permanent wetlands of Ez Zeraf Game Reserve and irrigated lands of the Gezira Scheme in Sudan. The scatter of the extremes in the east is likely related to the recurrent floods of the White Nile River. The reason for the absence of extremes around the Logone floodplains is obscure.
To verify the link between the location of extreme soil moisture gradients and flooded areas, we additionally identify 1∘ × 1∘ boxes with the events, of which Lmin pixels were likely covered with a wetland or a floodplain, and hence were wetter than the neighbouring Lmax location (Fig. 6c, crosses). This is done by calculating a linear regression function between the climatology of 1-day soil moisture drying rate (i.e. difference in soil moisture on the event day 0 and on day −1) and the climatology of initial soil moisture value (i.e. soil moisture on day −1)3 (Appendix Fig. A1). We consider the Lmin location to be likely flooded, if (a) all initial soil moisture values are high, and (b) climatological values of drying rate are always small and do not vary much with the initial soil moisture (regression slope is close to zero). For details the reader is referred to Appendix A and Fig. A1. From Fig. 6c it is seen that the distribution of grid boxes with the potentially flooded Lmin locations conforms with the distribution of the natural wetland fraction in Fig. 6b and includes the majority of extreme locations. This result supports the presence of the link between the afternoon rainfall maximum and flooded areas.
The identified sensitivity of the afternoon rainfall to the strong negative soil moisture gradients around water bodies is in agreement with the results of the observational-based study of Taylor (2010). Analysing 24 years of Meteosat brightness temperatures over the Inner Niger Delta, he found that convection was initiated more often over and to the east of the wetland in the morning hours. However, later in the day, mesoscale convective systems tended to develop and propagate away from the wet areas towards drier soils, suggesting the formation of deep convection and afternoon precipitation over negative soil moisture gradients. Similarly, observed by Alter et al. (2015), enhancement of rain to the east of irrigated land at 14∘ N, 33∘ E and its suppression over the Gezira Scheme itself is consistent with the location of negative (positive) extreme soil moisture gradients to the west (east) of the irrigated region (Fig. 6c). All the above supports the consistency of the observed afternoon rainfall intensification over the drier soils adjacent to flooded areas with a wetland breeze mechanism. The ability of the method to capture these effects is also noteworthy.
4.4 Effect of propagation of deep convective events on the SMPC statistics in eastern and western domains
Another physical effect that may influence the SMPC relationship is related to the propagation and evolution of mesoscale convective systems (not accounted for by the current algorithm). Previous studies indicate that an opposite SMPC relationship might be expected at early versus late stages of MCS development (Alonge et al., 2007; Clark et al., 2003; Gantner and Kalthoff, 2010; Taylor and Ellis, 2006; Taylor and Lebel, 1998; Taylor et al., 2010). In this respect, a distinct strength or even sign of the spatial SMPC measure may result from separation of the rainfall events into those formed by weaker and smaller MCSs – mostly found in the early afternoon – or by long-lived and organized MCSs – dominant during late afternoon hours (Mathon and Laurent, 2001). Differences in the SMPC response to the MCS life cycle are also expected to exist between the two regions of significant negative coupling, in the east and west. To characterize these differences, we analyse precipitation diurnal cycles averaged over event days in the east and west first (Fig. 7), and then estimate sensitivity of the spatial SMPC to varying rainfall accumulation times (Fig. 8).
The Hovmöller diagram of rainfall averaged over 1000 event days in the western domain (black rectangle in Fig. 4) shows that intensification of the moist convection in the region is generally concentrated around main orographical features (Fig. 7a, c). The peak in precipitation occurs at similar times across the domain, and thereby does not reveal the expressed signature of the system propagation. Most of the MCSs are therefore expected to be shorter lived and smaller, as their dissipation locations would be found close to their initiation (Mathon and Laurent, 2001).
In the east, on the contrary, the strong south-western propagation component of moist convection dominates the zonal progression of the most intense rainfall during the diurnal cycle averaged over 754 event days (Fig. 7d). A large number of MCSs initiate at the lee side of the Ethiopian Highlands and propagate westward, undergoing cycles of regeneration and growing into mature and organized MCSs (Laing and Carbone, 2008; Laing et al., 2012). The emergence of an absolute rain rate maximum downwind of the permanent wetlands of the Ez Zeraf Game Reserve (at 30∘ E) during afternoon hours supports an influence of the flooded areas on moist convection intensification in the region (Fig. 7d, f). Consistent with the results of Taylor (2010) obtained for the Niger Inland Delta, the presence of wetlands in the eastern domain is expected to increase the number of organized and long-lived propagating MCSs in the late afternoon, originating from either locally triggered MCSs, i.e. formed at the dry land–wetland boundary, or from re-intensified pre-existing westward propagating systems. We may therefore expect a greater sample of long-lived and organized propagating MCSs to be found in the late afternoon hours in the Eastern than in the western domain. Accordingly, the response of the SMPC statistics to propagating MCSs is expected to be stronger in the east compared to the west. Figure 8, which shows the change of the SMPC parameter between different rainfall accumulation time periods, confirms this hypothesis. For this assessment an additional area in the north is considered (dashed rectangle in Fig. 4), as representative of a region where large-scale atmospheric and surface conditions differ from those of the east and west domains.
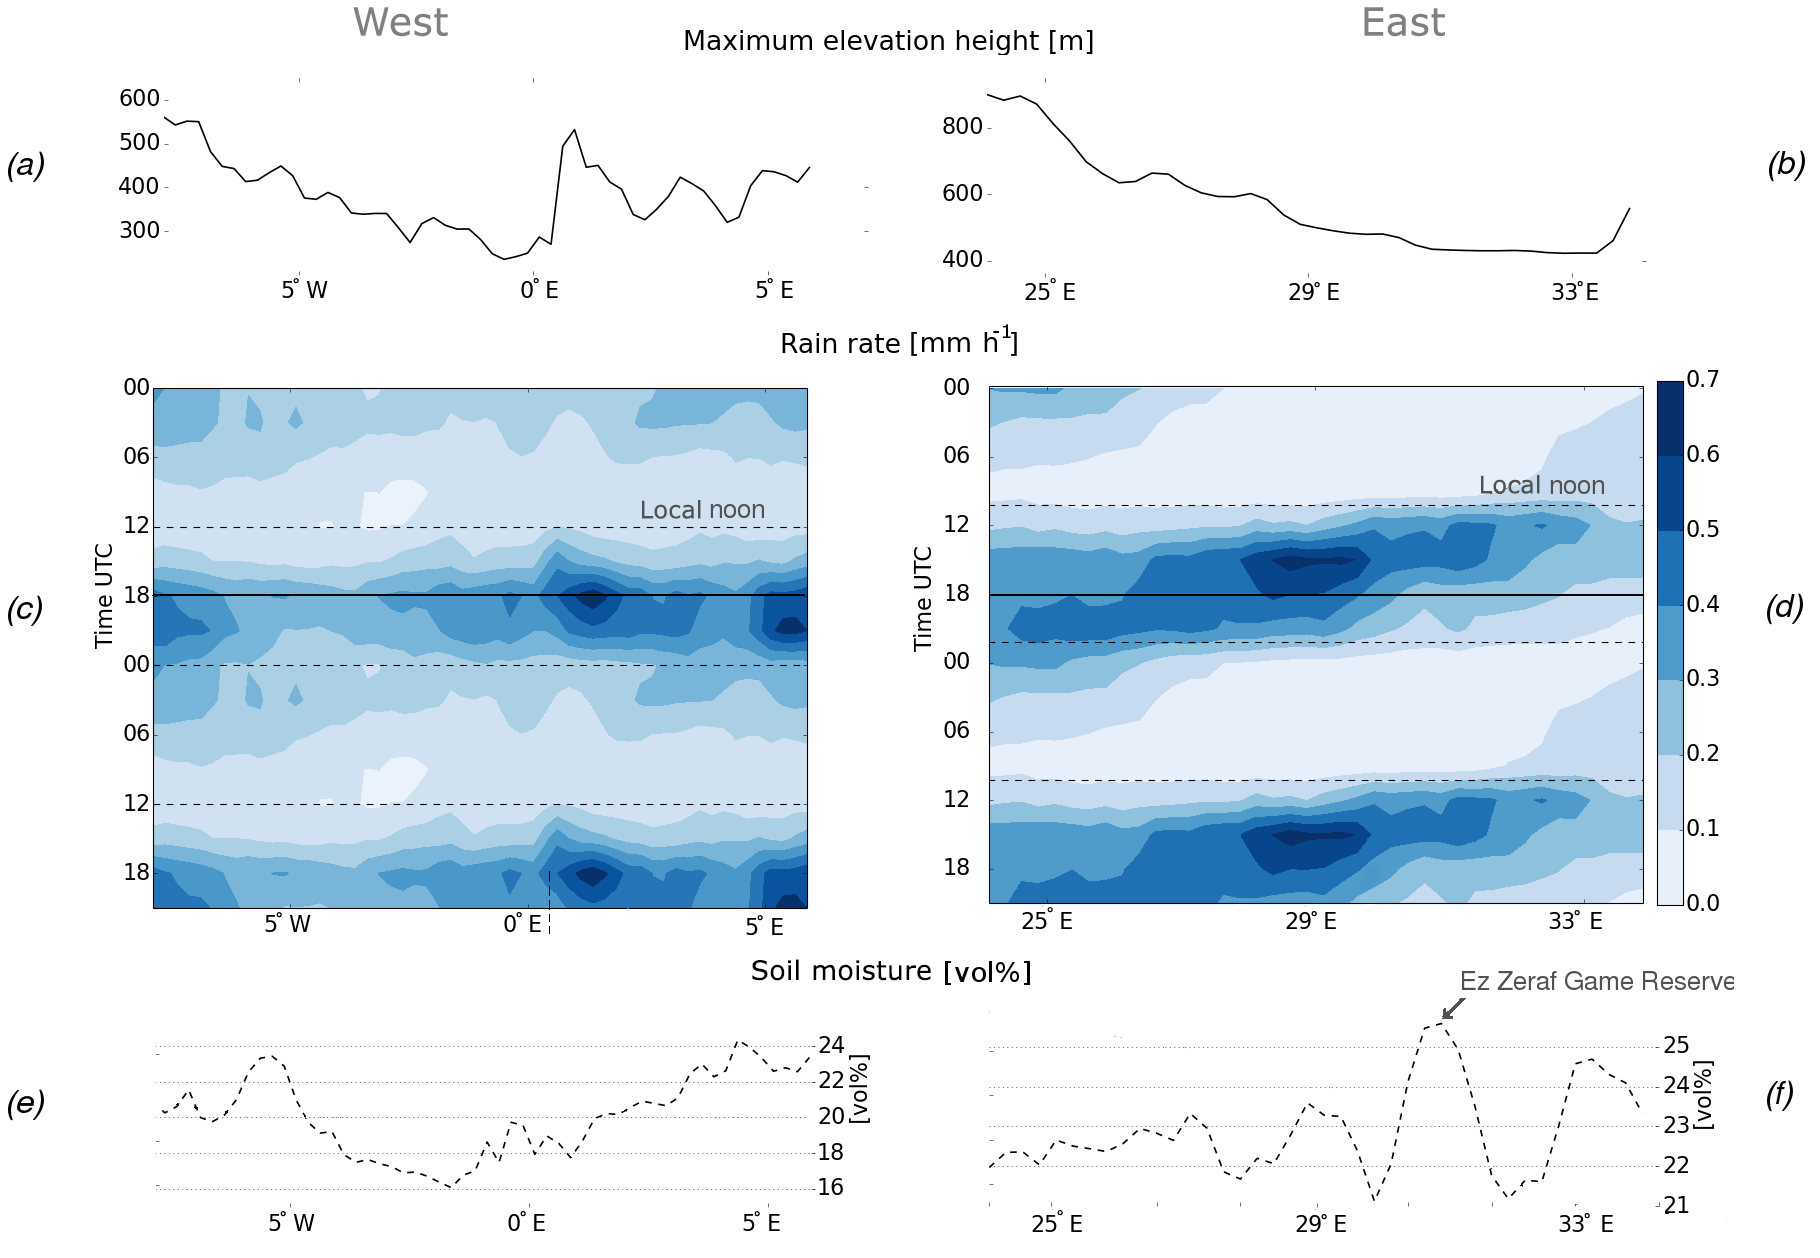
Figure 7(a, b) Longitudinal cross-sections of maximum elevation height in the western and eastern domains respectively, (c, d) diurnal cycles of the rain rate averaged over event days and domain latitudes and (e, f) longitudinal cross section of soil moisture averaged over domain latitudes. Location of the Ez Zeraf Game Reserve permanent wetlands is marked by an arrow. All the times are given in UTC. Note the UTC+2 h difference to LST in the east.
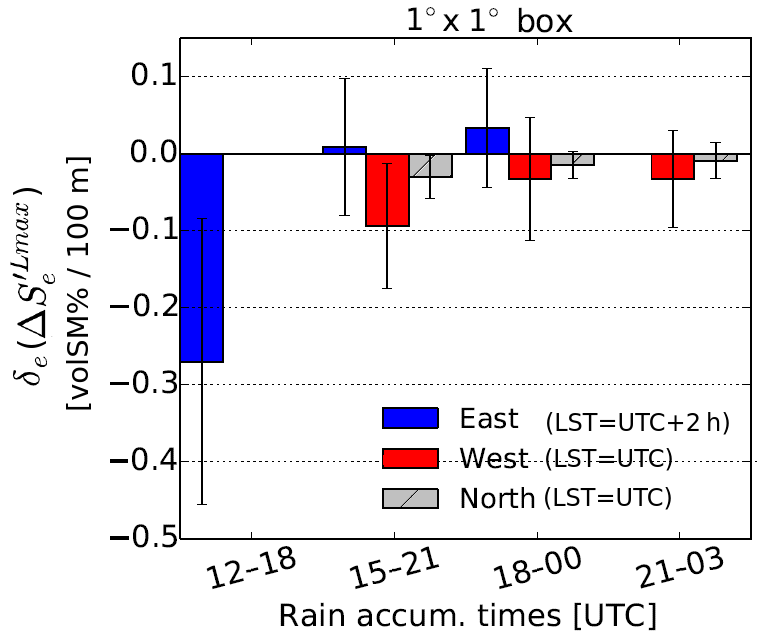
Figure 8Value of the spatial coupling measure δe calculated for various afternoon rainfall accumulation times, and averaged over selected domains, i.e east (6–10∘ N, 24–34∘ E), west (7–12∘ N, 8∘ W–6∘ E) and north (14–17∘ N, 7–14∘ E). Locations of the domains are shown in Fig. 4. Error bars indicate one SD of δe values in every domain. Note that all times are indicated in UTC.
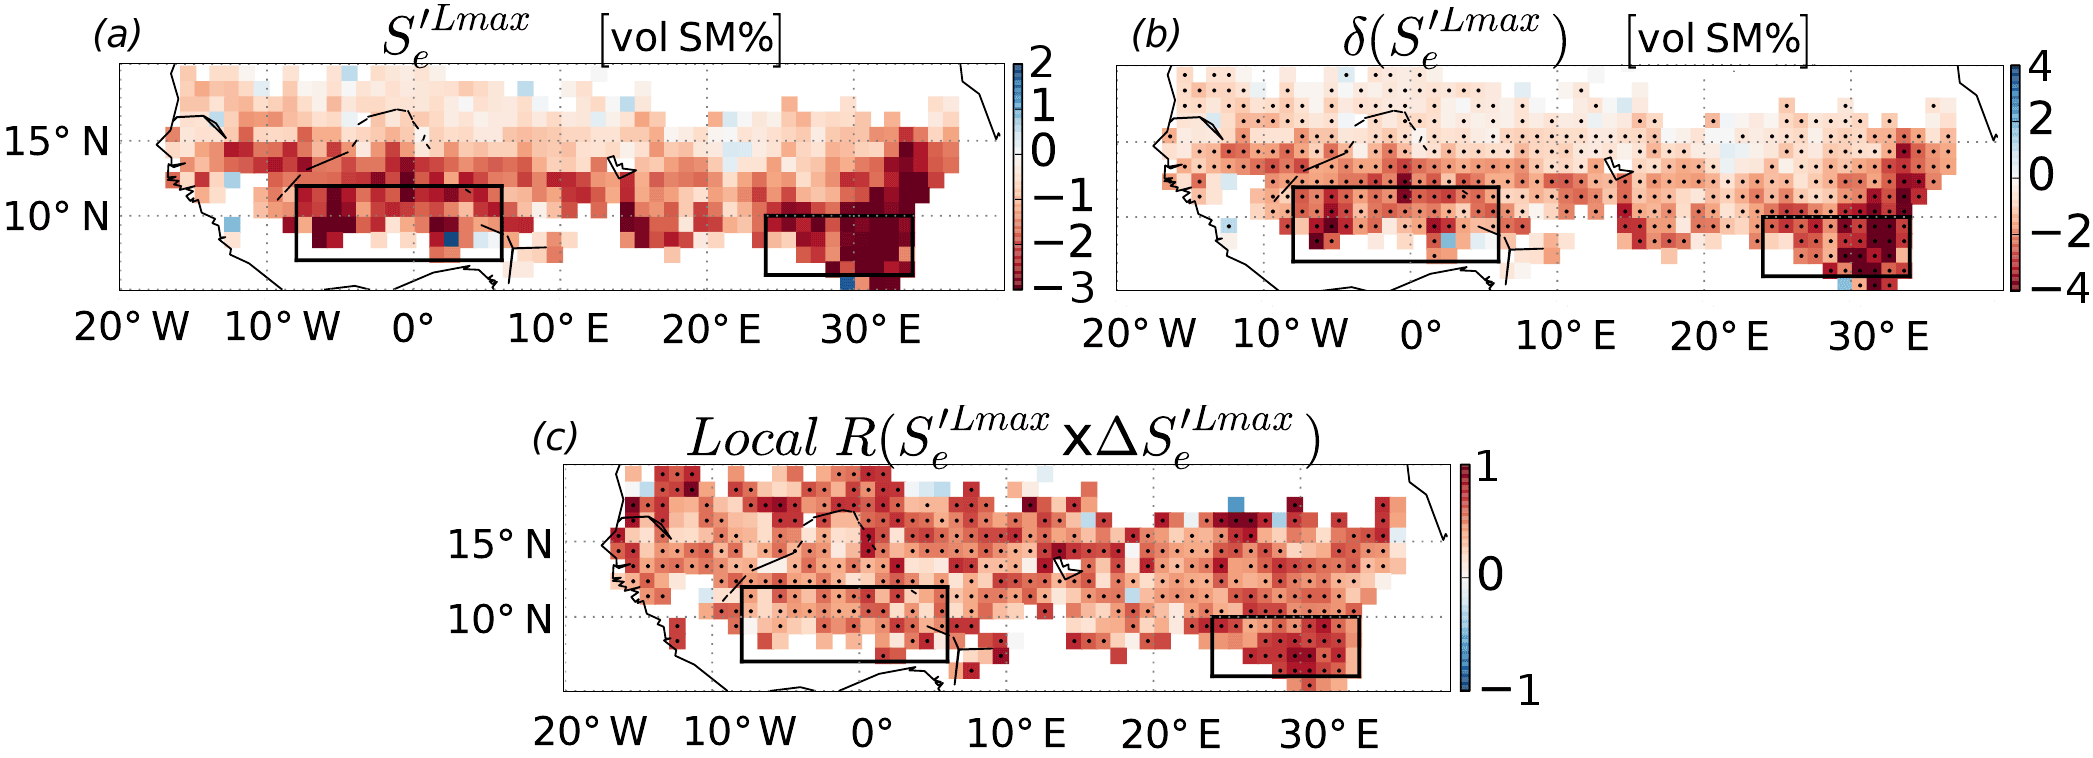
Figure 9Distribution of the (a) pre-event soil moisture anomaly value in event locations and (b) its departure from the typical non-event conditions, δe, averaged over 1∘ × 1∘ boxes; and (c) local Spearman rank correlation coefficient calculated event-wise between the soil moisture anomaly and the spatial soil moisture gradients in every 1∘ box. Significant δe values with percentiles Pe below 10 % (above 90 %) and correlation coefficients with p values lower than 0.05 are indicated by black dots.
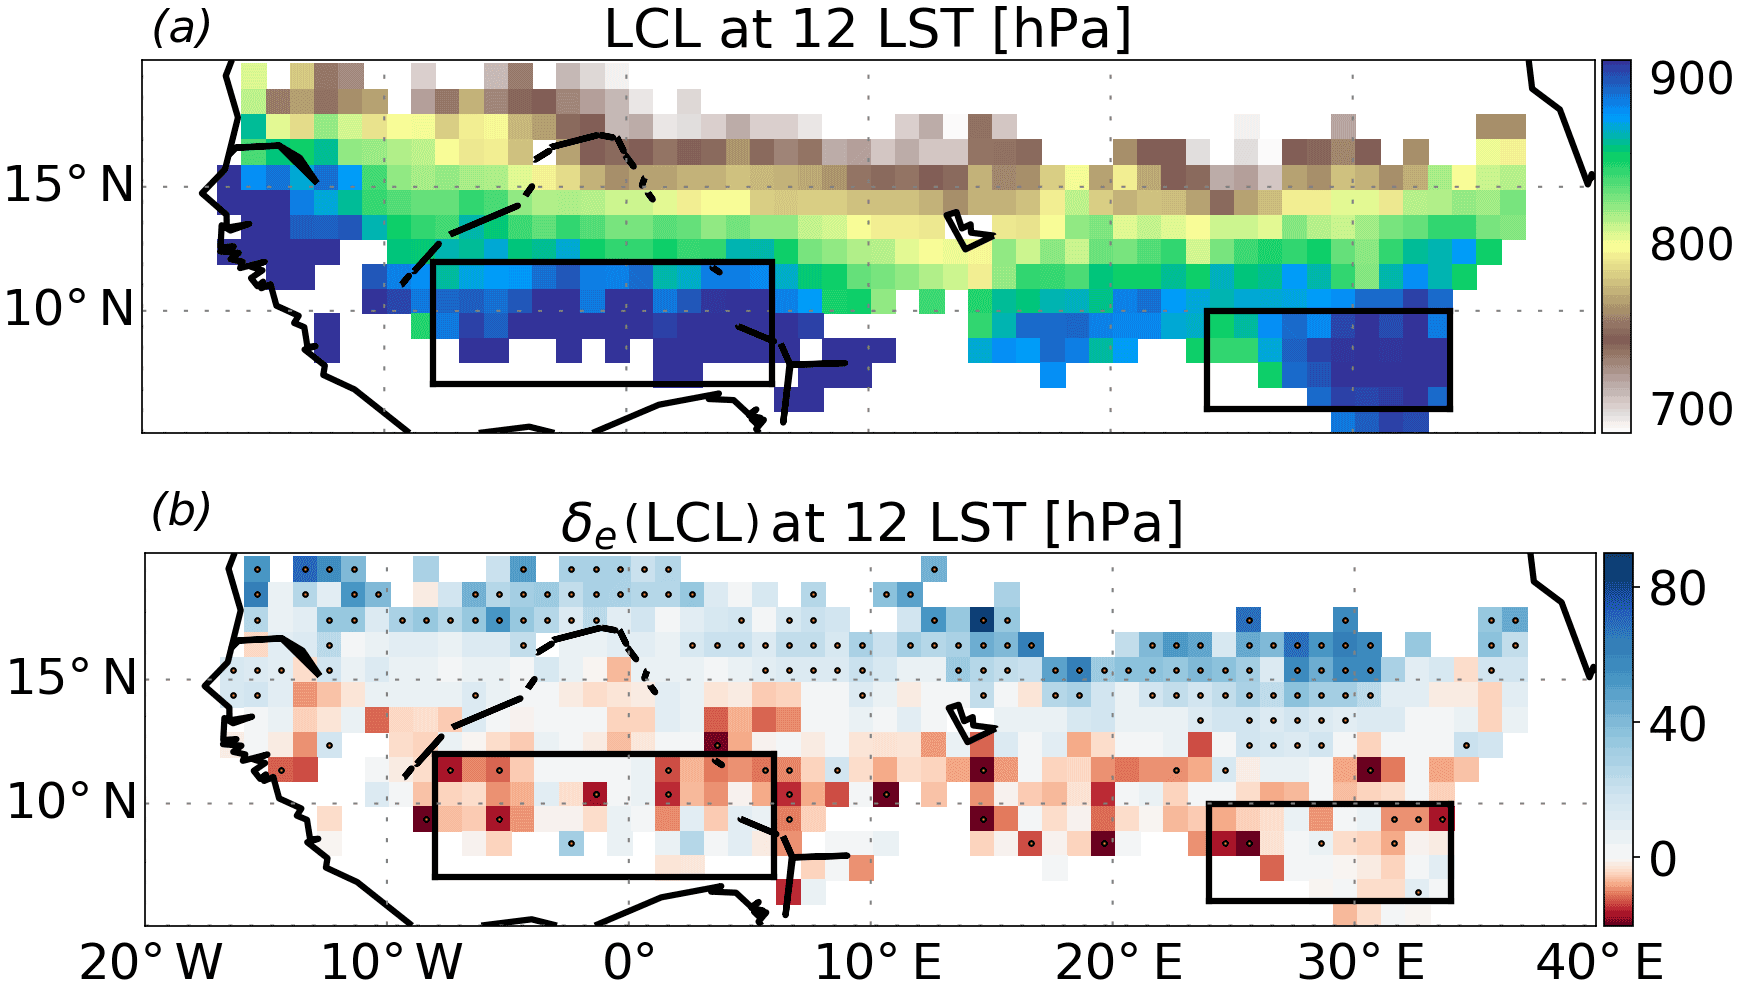
Figure 10(a) Lifting condensation level (LCL) value derived from the 6-hourly ERA-Interim temperature, specific humidity profile and surface pressure data on event days at 12:00 LST and averaged over the 1∘ × 1∘ box. (b) Corresponding δe difference of the mean LCL prior to the events relative to their typical state (climatology). The dot indicates significant δe values with percentiles Pe below 10 % (above 90 %). The positive (negative) δe values indicate an LCL that is lower (higher) than usual (relative to the ground level).
From Fig. 8 it is seen that the earlier rainfall accumulation time periods, i.e. 12:00–18:00 UTC in the east and 15:00–21:00 UTC in the west and north, result in the strongest negative δe difference, and hence spatial SMPC relationship in all three domains. No positive δe values are found for these time periods, and the fraction of negative soil moisture gradients preceding rainfall events is relatively high, i.e. 62, 57 and 55 % for east, west and north accordingly. Later accumulation times lead to a decrease in the magnitude and significance of the coupling parameter δe, and an increase in its spatial variability across the domains. These changes are associated with an increase in the amount of the positive soil moisture gradients in the regions (not shown).
Despite the similarities, differences in the SMPC response exist between the domains. In the east, the spatial SMPC shows the strongest sensitivity to the rainfall accumulation time and switches the sign to a positive one for the 18:00–24:00 UTC period. In accordance with Fig. 7d, the 18:00–24:00 UTC period reflects the afternoon progression of the mature MCS formed during early afternoon hours at the Ethiopian Highlands and around wetlands. According to Taylor and Lebel (1998) and Taylor et al. (2010), large and organized MCSs are expected to be more efficient in developing over wetter soils, associated with a well expressed BL moisture anomaly and higher MSE and CAPE and, at the same time, might get suppressed over drier surfaces (Clark et al., 2003). These observations are consistent with the increase in fraction of positive in all the domains towards late afternoon hours and the strongest SMPC response in the east identified here.
Additional analysis reveals that the majority of large and negative soil moisture gradients in all domains are linked to the rainfall events that are identified during the first afternoon time step (i.e 12:00 and 15:00 UTC for the east and west respectively) (not shown), and are therefore likely linked to weaker MCSs at the early stage of their development. The smaller and less organized MCSs have shown to be more sensitive to the thermally induced surface convergence zones and are likely to develop over spatially drier soils, adjacent to the strong gradients (Gantner and Kalthoff, 2010). This knowledge is consistent with the strongest negative δe difference identified here and hence with the prominent negative SMPC relationship observed during early afternoon times in all three domains.
5.1 Co-variability of the spatial and temporal SMPC
To further explore the consistency of the identified negative spatial SMPC with the physical effects we analyse the temporal SMPC relationship. By analogy to the spatial SMPC, we compute the soil moisture anomaly prior to the event and its difference δe to the typical state. Analysis of and its δe indicates a strong preference for rainfall events to occur over soils that are drier than their temporal mean (Fig. 9a) and drier than usual (Fig. 9b). The percentile values Pe lower than 10 % are found in 67 % of the studied 1∘ × 1∘ boxes (Table 1). This implies that a temporally negative SMPC dominates over the domain, which reaffirms the co-existence of the negative spatial and temporal coupling identified by G15, but at a finer 1∘ horizontal scale.
The question remains as to whether the two coupling relationships are independent of one another. To answer this question we calculate the Spearman rank correlation coefficient4 event-wise between the soil moisture anomaly and soil moisture gradients in every 1∘ × 1∘ box. The correlation map in Fig. 9c shows that a high and significant correlation exists between and anywhere in the domain. The mean correlation of 0.47 over the domain supports the existence of a relatively strong and positive monotonic relationship between the magnitude of the spatial soil moisture gradient and the soil moisture anomaly measured in Lmax. For comparison, the mean correlation estimated between soil moisture gradients and the mean soil moisture anomaly over the 1.25∘ event box is small (0.13). All the above suggests that in the North African region the spatial and temporal SMPC relationships, as defined by the current framework, are not independent of each other.
The strong and positive correlation (in time) identified between the soil moisture anomalies and gradients also yields a regional co-variability of the SMPC patterns. The spatial correlation between the two coupling distributions is high (0.64). The largest magnitudes of both and parameters and their corresponding δe measures are found in the southern part of the domain. These regions are generally characterized as the areas of higher BL moisture and rainfall frequency, and therefore higher variability of soil moisture in time and space.
Mechanistically, the presence of the temporally negative SMPC in the areas of the highest BL moisture in the domain (or lowest lifting condensation level (LCL); Fig. 10a) is consistent with a higher relevance of mechanisms associated with the BL growth for convection initialization in regions of higher CAPE and lower convective inhibition (CIN) (Adler et al., 2011; Gantner and Kalthoff, 2010; Klüpfel et al., 2011). In this way, larger negative deviations of the soil moisture amount from its climatological mean, i.e. δe, would lead to thermals that are stronger than usual, which can more easily overcome CIN and release CAPE (Klüpfel et al., 2011).
Moreover, in combination with strong negative spatial gradients, these strong thermals can initiate breeze-like circulations, creating more favourable conditions for bringing the BL up to the LFC, especially over the southern regions, where BL moisture is in abundance. The relevance of drier surface conditions for moist convection development on event days over the wetter latitudes is supported by the observed significant increase of the LCL height (decrease in pressure) in the south on event days compared to the typical state (Fig. 10b, red shading). The higher LCL is associated with a decrease of BL relative and specific humidity (not shown) and supports the relevance of drier surface conditions for convection intensification as opposed to variations in BL water vapour amount prior to the events.
A different picture is observed over the drier latitudes of northern Sahel at the Sahara margin. There, the pre-event LCLs are found to be significantly lower (higher pressure) compared to its typical (climatological) state. This suggests a higher amount of water vapor in the BL (not shown) on the event days over the dry regions (Fig. 10b, blue shading). This result is consistent with the previously reported decisive role of low-level moisture on MCS evolution in the drier Sahelian regions (Klüpfel et al., 2012). At these latitudes the northward excursion of moist monsoon air has been shown to favour convective activity (Barthe et al., 2010; Cuesta et al., 2010).
Considering also the relatively large number of dry days (10 days on average) preceding rain events in the north, it is less likely that underlying surface heterogeneity caused by a previous rainfall could have an influence on convection development on the event day. In the case study of Klüpfel et al. (2012) an MCS was initiated due to the arrival of the cold pool and convergence zone emanated by a remote convective system hundreds of kilometres away. Similar mechanisms may play a role in moist convection development in northern Sahel.
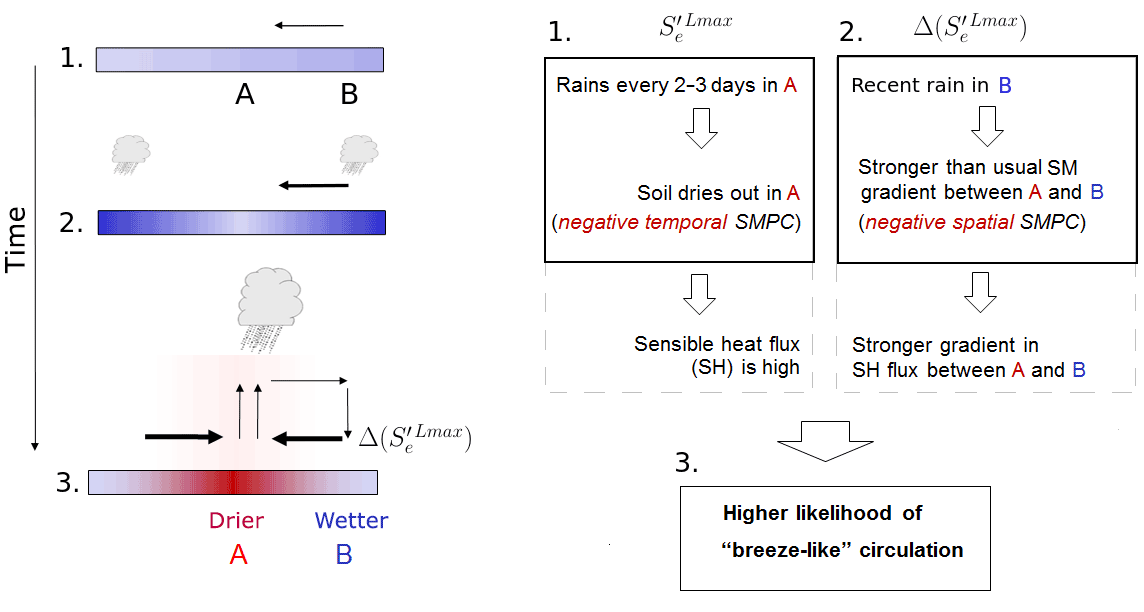
Figure 11Conceptual diagram, illustrating intensification of moist convection by the initiated “breeze-like” circulations under favourable conditions of co-existing negative spatial and negative temporal SMPC effects. On the one hand, typically observed 2- to 4-day periodicity of rainfall in western Africa leads to a strong drying of the upper soil layer in the location A prior to the rain, and therefore increases sensible heat and buoyancy flux locally. Simultaneously, recent rainfall in B produces wet soils – a potential moisture supply area for the location A. Strong spatial gradients in soil moisture between locations A and B together with a relatively strong buoyancy flux in A can favour formation of thermally induced circulations under benign wind conditions. Considering a relatively weak mean surface wind of 2–3 m s−1 observed prior to the rainfall events over southern latitudes, the mesoscale circulations are likely to be initiated.
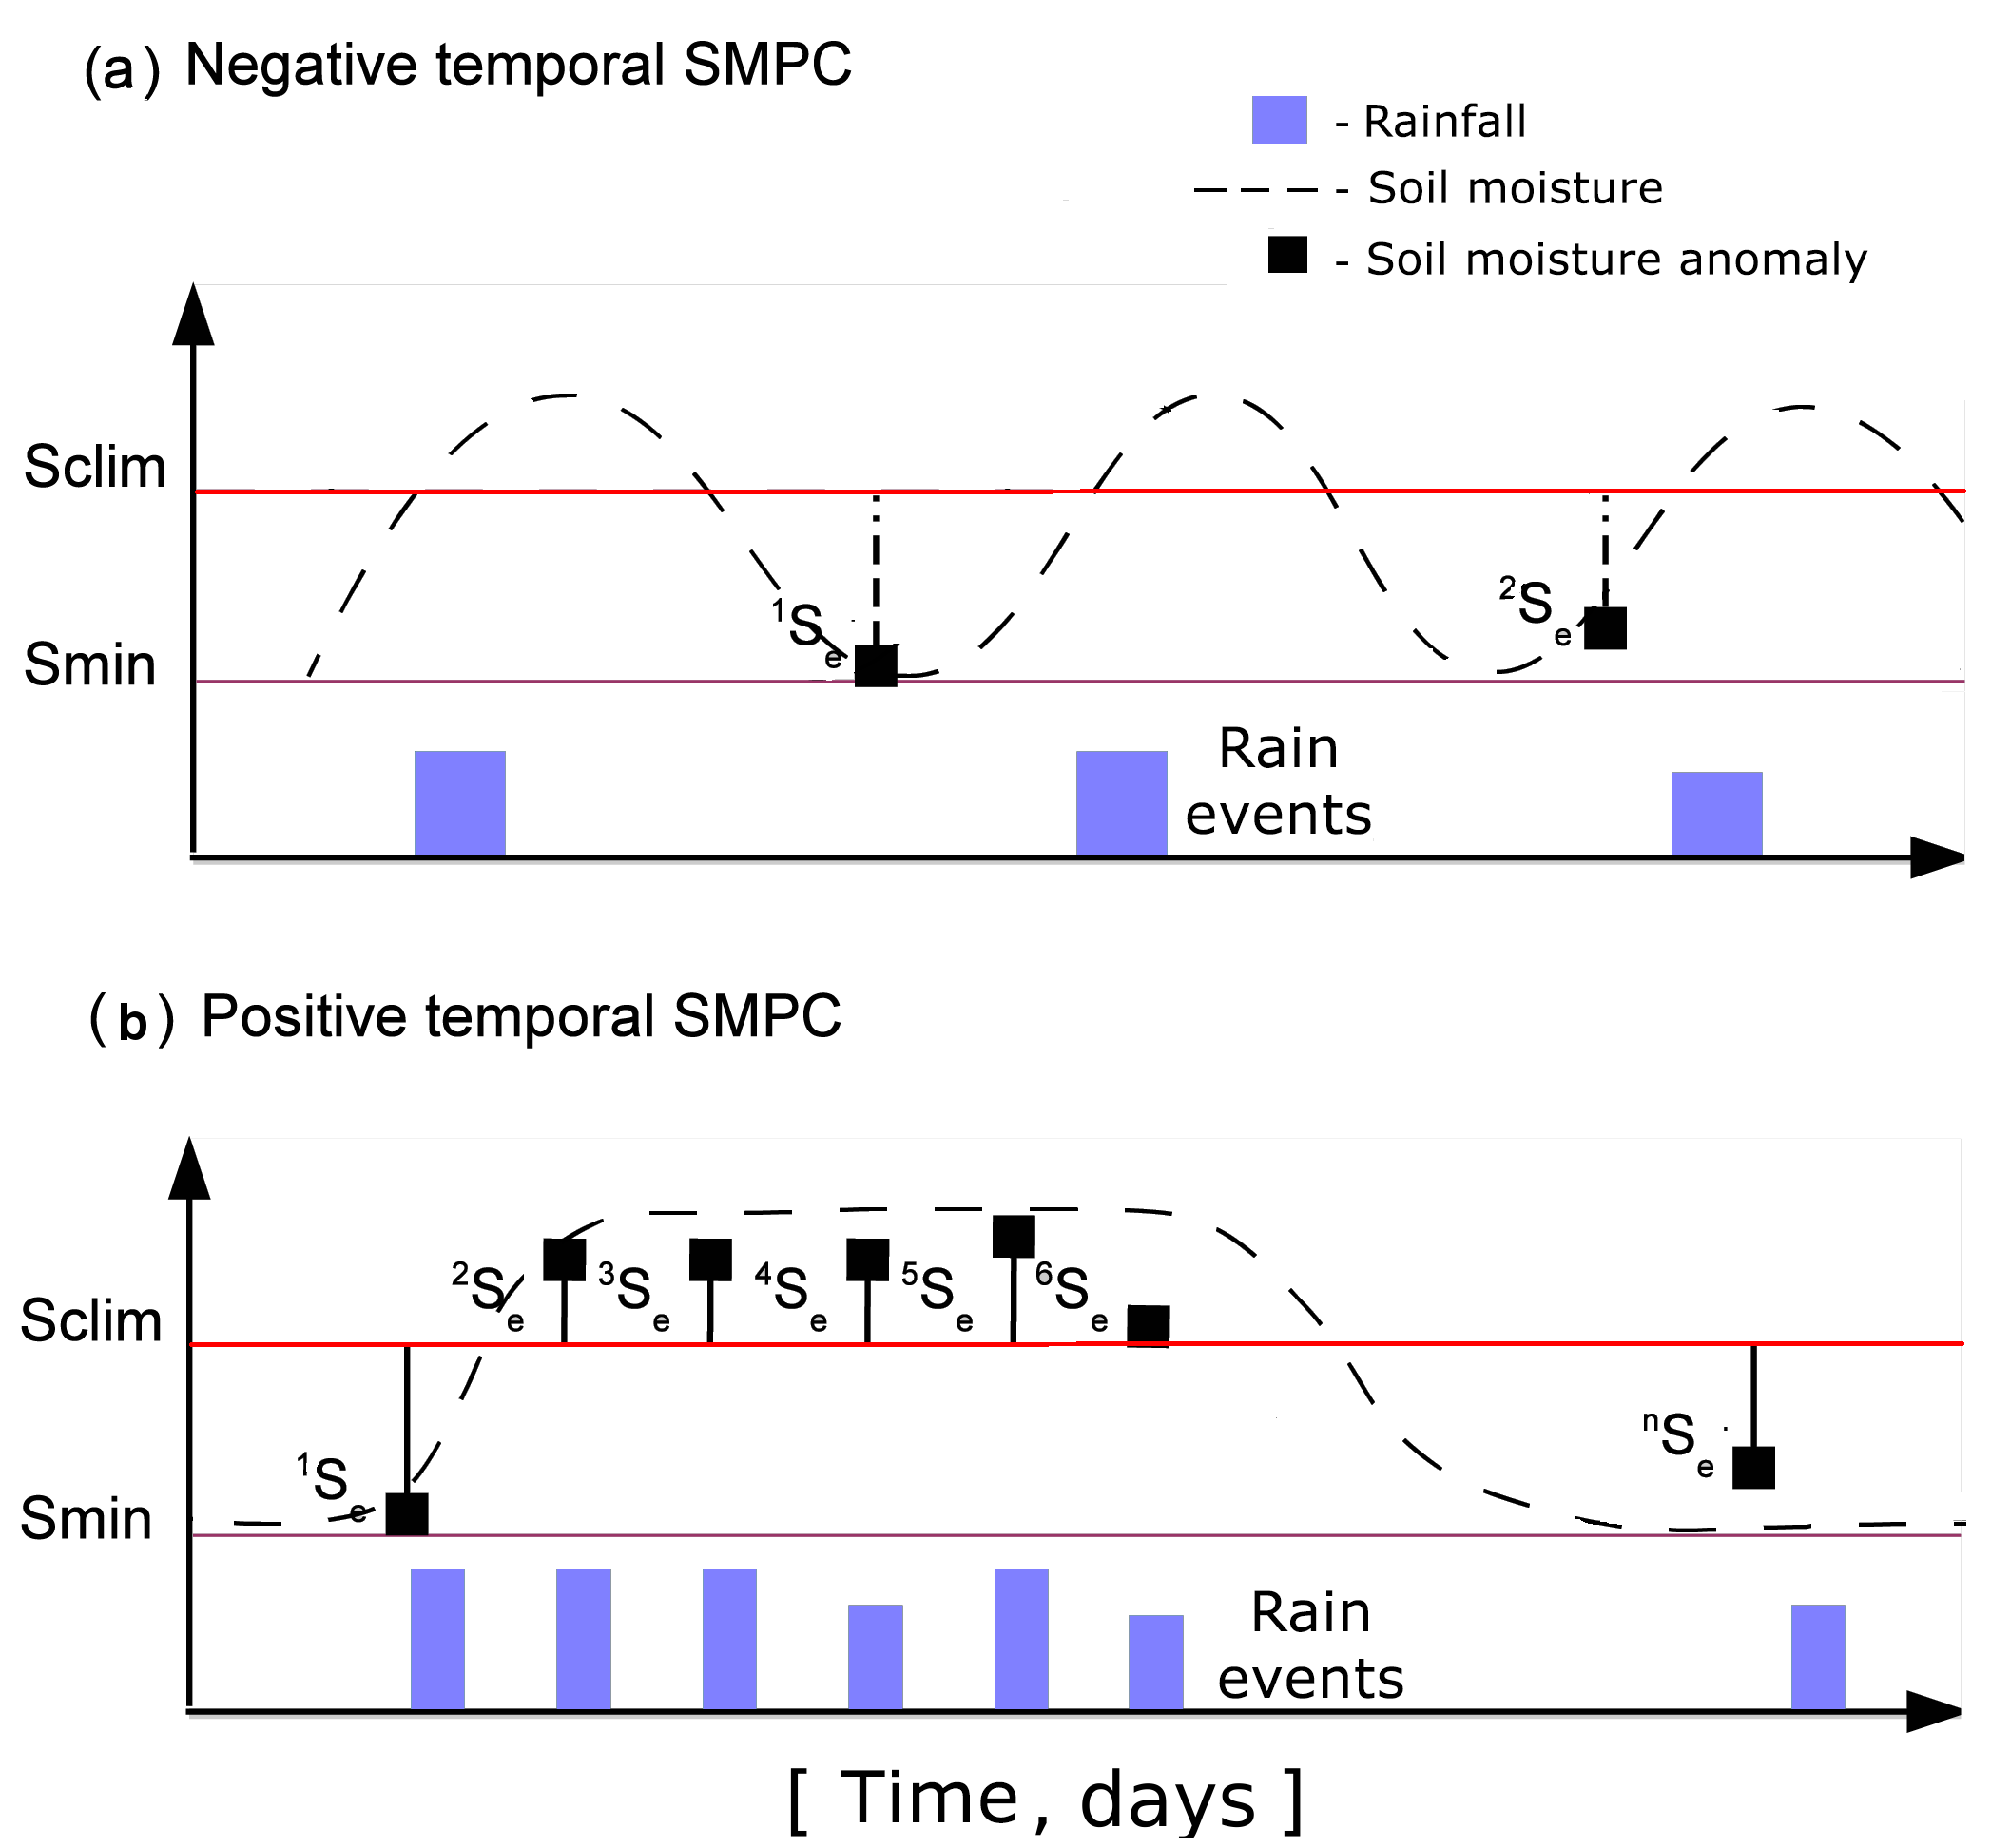
Figure 12Conceptual diagrams of the relationship between daily rainfall occurrence and the surface moisture variability associated to it, in time, as representative of (a) West Africa and temporally negative SMPC and (b) central and northern Europe and positive temporal SMPC.
6.1 Role of thermally induced circulations in moist convection development
The dominant negative spatial SMPC relationship observed over the North African region agrees on the sign of the SMPC suggested by previous case studies and modelling studies (e.g. Birch et al., 2013; Froidevaux et al., 2014; Taylor and Ellis, 2006), and reconciles a number of physical effects. Following the sensitivity analyses, the two main factors are identified, which directly influence the magnitude and significance of the negative spatial SMPC relationship. These are the time of the afternoon rainfall accumulation and the extreme soil moisture gradients. Our results show that the observed relationship between the spatial SMPC measure and the time of rainfall accumulation conforms well with the varying sensitivity of rainfall to the underlying soil moisture conditions for different stages of MCS development (Alonge et al., 2007; Clark et al., 2003; Taylor and Ellis, 2006; Taylor and Lebel, 1998; Taylor et al., 2010). This further suggests potentially higher relevance of drier soils and soil moisture heterogeneity for rainfall when the rain systems are smaller and at an early stage of their development, consistent with results of e.g. Gantner and Kalthoff (2010). All the above also emphasizes the importance of considering the MCS properties as an additional factor in the analysis of the SMPC (Ford et al., 2015).
Extreme soil moisture gradients are found to predefine the significance of the negative spatial coupling in 30 % of the domain grid boxes. Concurrently, the extremes tend to cluster in the direct vicinity of major flooded areas and the irrigated land. The identified sensitivity of the afternoon rainfall to the strong soil moisture gradients adjacent to wetland areas shows consistency with the role of a wetland breeze mechanism in convection intensification over spatially drier soils. If this is true, our results demonstrate for the first time that the wetland breeze mechanism could be a systematic feature in the North African region, with further implications for the rainfall predictability.
This observed sensitivity of the SMPC measure to the flooded areas and to the MCS life cycle complies well with the potential role of thermally induced circulations in afternoon rainfall development over strong negative soil moisture gradients. Moreover, the identified preference of rainfall to occur simultaneously over temporally drier soils (negative temporal SMPC) and strong negative soil moisture gradients (negative spatial SMPC) might be considered as the most effective combination to initiate thermal circulations. This would imply a presence of a higher buoyancy and moisture flux at the event location, and hence a higher probability of convection development. Schematic representation of the deep convection initiation by the breeze-like circulations formed under the co-existence of the two SMPC effects is illustrated in Fig. 11.
6.2 Role of rainfall persistence
In the context of this study, the drying of the soil prior to the rainfall events might be considered as the primary process that underlies the magnitude of both SMPC relationships, and helps to explain the opposite sign of the temporal coupling identified in the North African region as compared to the temperate latitudes and wet climates (G15).
Consistent with the observed 2- to 4-day periodicity of rainfall in Western Africa (Laing et al., 2012; Taylor and Lebel, 1998), 2 to 3 dry days (rain < 1 mm) on average are found to precede each convective event day over southern latitudes, suggesting a strong drying of the upper soil layer in the event locations prior to the rain. The number of dry days reaches 10 over the dry and deserted regions in the north. Following the analysis of Schwendike et al. (2010), an almost complete recovery of the pre-rainfall surface moisture conditions may be expected in 2–3 days following the rainfall. Schematically, this typical variability of rainfall and soil moisture might be illustrated as a sequence of daily rain events separated by the periods of drying (Fig. 12a). From the figure it is seen that prior to the rain events the soil dries out, and soil moisture reaches a certain minimum value Smin. The climatology value Sclim of soil moisture in the same location, however, is expected to be higher than any Smin in most of the cases, as it includes all dry and wet event days. Hence, when subtracted from the climatological value, a soil moisture value measured prior to the event will very likely yield a negative anomaly – , especially when averaged over many events. Therefore, a negative correlation between the soil moisture anomaly and rainfall might be expected. Though discussed in the framework of North Africa, similar behaviour might be expected in other water-limited regions of the world.
A different situation might occur in the wet temperate latitudes, where the variability of rainfall is to a large extent linked to fluctuations between the passage of a cyclone and a blocking situation (Schär et al., 1999). Such a behaviour might be illustrated as a multi-day sequence of rain events, associated with precipitation persistence as defined by the persistence in the weather regimes (Fig. 12b; see also Fig. 2 in Hohenegger et al., 2009). During these periods soil moisture increases and remains relatively high. Hence, a higher fraction of events might be expected to occur over soils that are wetter than usual, resulting in a positive soil moisture anomaly prior to the event. The above relationship is consistent with the positive temporal SMPC, identified in G15. It is important to note, however, that the rainfall persistence may not be solely atmospherically driven, but may also reflect effects of the land surface (Guillod et al., 2014; Salvucci et al., 2002; Seneviratne et al., 2010).
The modulation of the SMPC sign depending on the large-scale weather regime was studied e.g. by Boé (2012) over France. The analysis showed that the synoptic blocking situations generally associated with drier conditions lead to a negative SMPC, while a positive correlation of rainfall to drier soil conditions was observed in a wet weather regime. Similarly, the most pronounced effect of negative soil moisture gradients on convection initiation over Europe and a higher correlation of the gradients to land surface temperatures was observed for the period with less antecedent rainfall (Taylor, 2015).
In this study, we revisit the negative spatial and negative temporal SMPC relationships identified earlier by T12 and G15 on the 5∘ × 5∘ horizontal grid. We use the probability-based approach of T12 and 10 years of satellite-based soil moisture and precipitation data (i) to identify the potential link of the observed statistical relationships to the physical mechanisms and (ii) to study the regional co-variability of the SMPC effects.
We find that the negative spatial coupling dominates over the region of North Africa. The result is independent of the choice of the observational data sets and is robust with respect to the event aggregation (spatial) scale. Compared to the coarser 5∘ × 5∘ grid previously used, the appeal of the finest considered 1∘ × 1∘ event-aggregation scale is that it reveals links to the wetland areas and rivers which can not be captured at the coarser scale.
The co-variability analysis of the two SMPC relationships indicates that spatial and temporal effects of soil moisture on afternoon precipitation in the North African region do not only co-exist but are also dependent on one another. The latter suggests that if rain falls over temporally drier soils, it is likely to be surrounded by a wetter environment. This combination is consistent with the relevance of processes associated with the dominance of the sensible heat flux and boundary layer growth on convection initiation, and supports the role of mesoscale variability in surface soil moisture for deep convection development.
The identified negative sign of the temporal coupling in the semi-arid conditions of the Sahelian environment is not unexpected. The drying of the soil for several days prior to the rainfall events is likely to underlay the preference of rain to occur over temporally drier soils. This additionally may play a role in the opposite sign of the temporal coupling in the North African region as compared to the positive relationship identified in wetter climates by G15. For the same reason, the predictability potential of the temporal effect on rainfall in the North African region is expected to be lower compared to the spatial effect.
Analysis of the spatial SMPC measure and factors which can influence its magnitude and variability in particular reveals two hot spot regions, where predictability skill of spatial soil moisture variability on rainfall might be higher. These are the western African domain (7–15∘ N, 10∘ W–7∘ E) and South Sudan in the east (5–13∘ N, 24–34∘ E). In the Western domain, the negative spatial SMPC signal is indicated to be more robust. In the east, the spatial coupling is found to be largely modulated by the presence of wetlands and is susceptible to the number of longer lived propagating MCSs. The analysis of the BL moisture conditions (here, LCL) preceding the rainfall events further supports the potential relevance of spatially and temporally drier soils for convection development in the south of the domain, where BL moisture is in abundance. In the drier northern latitudes the variability of BL moisture, associated with intrusions of moisture from the south, seems to be more important.
Following our analysis, a number of potential improvements to the framework might be summarized. Apparent non-local effects of water bodies, which are originally excluded by the method, hint towards the potential gaps in the filtering procedure and emphasize the potential role of moist convection evolution and propagation that are neglected by the method. The presence of wetland regions themselves, as we have shown, complicates the interpretation of the SMPC relationships. The uncertainty estimates of the soil moisture parameter derived over the recursively flooded regions are still missing. In the future, dynamical wetland products like the Global Inundation Extent from Multi-Satellites (GIEMS, Prigent et al., 2007, 2012) may be used to better isolate the effect of water bodies on moist convection development.
Notwithstanding these limitations, the present study demonstrates the ability of probability-based methods to identify characteristic features of physical effects. Considering continuous increase in the availability, time span and quality of satellite data, development of similar statistical methods should be valuable. The region of the strong negative SMPC identified in the east would highly benefit from more modelling and observational analysis in the eastern Sahel. The knowledge on the regional variability of the SMPC presented here can be further explored in drought and climate change research and observational campaigns and used for the validation of global climate models.
The observational datasets used in this analysis are publically available and can be downloaded as follows:
-
AMSR-E soil moisture (version 2), available at https://hydro1.gesdisc.eosdis.nasa.gov/data/s4pa/WAOB/LPRM_AMSRE_A_SOILM3.002/ (last access: September 2017);
-
TRMM3B42 3-hourly precipitation, available at https://pmm.nasa.gov/data-access/downloads/trmm (last access: September 2017);
-
ERA-Interim 6-hourly surface pressure, temperature and specific humidity profile data, available at http://apps.ecmwf.int/datasets/data/interim-full-daily/levtype=sfc/ (last access: September 2017).
A1 Method used for identification of potentially flooded locations
The following paragraph describes the methodology used to identify events in which Lmin locations are likely flooded. Following this methodology, a climatology of soil moisture drying rates is computed in every Lmin location first. Climatology is calculated from values measured in the same Lmin location, in the same month as the event but during the non-event years. Soil moisture drying rate is computed as the difference between soil moisture at 13:30 LST on the event day 0 and the previous day −1. Days with non-zero precipitation between two soil moisture measurements are excluded.
As a next step, we compute a climatology of soil moisture values on the day −1 to estimate a potential range of soil moisture conditions in every Lmin location. Finally, for every Lmin location we identify a linear regression function which fits best into a scatter plot relationship between drying rates and initial soil moisture values. Based on the slope of the linear regression and a climatological range of drying rates we stratify Lmin locations as being potentially “always dry”, “normal” or “always wet” (Fig. A1). Locations which are potentially always dry may be representative of rocky sand areas and hence will most often show low soil moisture values and drying rates close to zero. The cases of soil being always wet should indicate mostly high soil moisture values, but at the same time small drying rates, on the condition that a water supply is present. The “normal” case is expected to show a clear relationship between the drying rate and initial soil moisture content. The higher the soil moisture is, the larger the drying rate is expected to be.
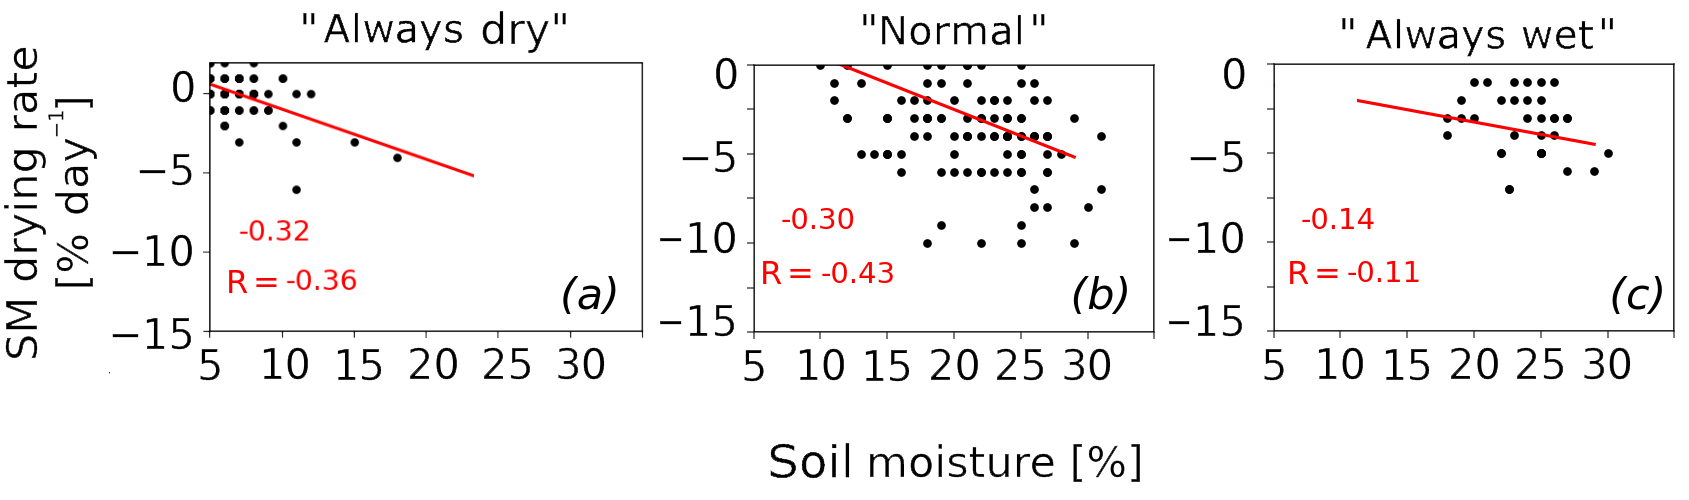
Figure A1Examples of three possible relationships between climatology of soil moisture drying rate and absolute soil moisture in Lmin locations. The red numbers indicate values of a slope and Spearman correlation respectively.
Because the identification procedure requires selection of thresholds, the distribution of the potentially flooded locations will slightly vary depending on the selected threshold of the regression slope, minimum drying rate value or minimum absolute soil moisture. For the calculation of the potential wetland locations presented in Fig. 6c we chose two thresholds: the slope had to be larger than −0.15 and the soil moisture values had to be larger than 20 %.
Table A1Percentage of 5∘ × 5∘ grid boxes with significantly negative (Pe < 10 %) and positive (Pe > 90 %) spatial SMPC over the North African domain in this study and previous studies of T12 and G15. Different data set combinations used in T12 and G15 are listed. “Merged” represents an integrated product composed of grid boxes in which either the AMSR-E or the ASCAT soil moisture data set was identified to be the best following a quality-control check. Following visual inspection, the experiments in which a significant negative SMPC relationship exists in the western region of the Sahelian domain are indicated with a * sign. For more details on various data set combinations, the reader is referred to the original papers.
The authors declare that they have no conflict of interest.
The authors would like to thank the Max Planck Institute for Meteorology (MPI-M)
and the International Max Planck Research School (IMPRS) for providing
facilities, material and scientific support which made publication of this
paper possible. The authors would like to acknowledge Christopher Taylor,
Benoît Guillod and Alexander Mahura for helpful comments on the study, and
Stephan Kern for data support. We also thank George Huffman and Robert
Parinussa for their clarifications related to TMPA and AMSR-E data products
respectively.
The article processing charges for this open-access
publication were covered by the Max Planck Society.
Edited by: Pierre Gentine
Reviewed by: Benoît Guillod and two anonymous referees
Adler, B., Kalthoff, N., and Gantner, L.: The impact of soil moisture inhomogeneities on the modification of a mesoscale convective system: An idealised model study, Atmos. Res., 101, 354–372, 2011. a, b
Alonge, C. J., Mohr, K. I., and Tao, W.-K.: Numerical studies of wet versus dry soil regimes in the West African Sahel, J. Hydrometeorol., 8, 102–116, 2007. a, b, c
Alter, R., Im, E., and Eltahir, E.: Rainfall consistently enhanced around the Gezira Scheme in East Africa due to irrigation, Nat. Geosci., 8, 763–767, 2015. a
Amante, C. and Eakins, B.: ETOPO1 1 arc-minute global relief model: procedures, data sources and analysis, available at: https://www.ngdc.noaa.gov/mgg/global/relief/ETOPO1/docs/ETOPO1.pdf (last access: September 2017) 2009. a
Barthe, C., Asencio, N., Lafore, J.-P., Chong, M., Campistron, B., and Cazenave, F.: Multi-scale analysis of the 25–27 July 2006 convective period over Niamey: Comparison between Doppler radar observations and simulations, Q. J. Roy. Meteor. Soc., 136, 190–208, 2010. a
Birch, C. E., Parker, D. J., O'Leary, A., Marsham, J. H., Taylor, C. M., Harris, P. P., and Lister, G. M. S.: Impact of soil moisture and convectively generated waves on the initiation of a West African mesoscale convective system, Q. J. Roy. Meteor. Soc., 139, 1712–1730, 2013. a, b, c
Boé, J.: Modulation of soil moisture–precipitation interactions over France by large scale circulation, Clim. Dynam., 40, 875–892, 2012. a
Clark, D. B., Taylor, C. M., Thorpe, A. J., Harding, R. J., and Nicholls, M. E.: The influence of spatial variability of boundary-layer moisture on tropical continental squall lines, Q. J. Roy. Meteor. Soc., 129, 1101–1121, 2003. a, b, c, d, e
Couvreux, F., Rio, C., Guichard, F., Lothon, M., Canut, G., Bouniol, D., and A., G.: Initiation of daytime local convection in a semi-arid region analyzed with Large-Eddy Simulations and AMMA observations, Q. J. Roy. Meteor. Soc., 138, 56–71, 2012. a
Couvreux, F., Guichard, F., Gounou, a., Bouniol, D., Peyrillé, P., and Köhler, M.: Modelling of the thermodynamical diurnal cycle in the lower atmosphere: A Joint evaluation of four contrasted regimes in the tropics over land, Bound.-Lay. Meteorol., 150, 185–214, https://doi.org/10.1007/s10546-013-9862-6, 2013. a
Cuesta, J., Lavaysse, C., Flamant, C., Mimouni, M., and Knippertz, P.: Northward bursts of the West African monsoon leading to rainfall over the Hoggar Massif, Algeria, Q. J. Roy. Meteor. Soc., 136, 174–189, 2010. a
Dee, D. P., Uppala, S. M., Simmons, A. J., Berrisford, P., Poli, P., Kobayashi, S., Andrae, U., Balmaseda, M. A., Balsamo, G., Bauer, P., Bechtold, P., Beljaars, A. C. M., van de Berg, L., Bidlot, J., Bormann, N., Delsol, C., Dragani, R., Fuentes, M., Geer, A. J., Haimberger, L., Healy, S. B., Hersbach, H., Hólm, E. V., Isaksen, L., Kå llberg, P., Köhler, M., Matricardi, M., McNally, A. P., Monge-Sanz, B. M., Morcrette, J.-J., Park, B.-K., Peubey, C., de Rosnay, P., Tavolato, C., Thépaut, J.-N., and Vitart, F.: The ERA-Interim reanalysis: configuration and performance of the data assimilation system, Q. J. Roy. Meteor. Soc., 137, 553–597, 2011. a
Dirmeyer, P.: The terrestrial segment of soil moisture-climate coupling, Geophys. Res. Lett., 38, L16702, https://doi.org/10.1029/2011GL048268, 2011. a, b
Dirmeyer, P. and Wang, Z.: Intensified land surface control on boundary layer growth in a changing climate, Geophys. Res. Lett., 45, 1290–1294, 2014. a
Dirmeyer, P., Cash, B. A., Kinter, J. L., Stan, C., Jung, T., Marx, L., Towers, P., Wedi, N., Adams, J. M., Altshuler, E. L., Huang, B., Jin, E. K., and Manganello, J.: Evidence for enhanced land–atmosphere feedback in a warming climate, J. Hydrometeorol., 13, 981–995, 2012. a
Dorigo, W. A., Scipal, K., Parinussa, R. M., Liu, Y. Y., Wagner, W., de Jeu, R. A. M., and Naeimi, V.: Error characterisation of global active and passive microwave soil moisture datasets, Hydrol. Earth Syst. Sci., 14, 2605–2616, https://doi.org/10.5194/hess-14-2605-2010, 2010. a
Duvel, J.: Convection over tropical Africa and the Atlantic Ocean during northern summer. Part II: Modulation by easterly waves, Mon. Weather Rev., 118, 1885–1868, 1990. a
Ek, M. and Mahrt, L.: Daytime evolution of relative humidity at the boundary layer top, American Meteorological Society, 122, 2709–2721, 1994. a
Eltahir, E. A. B.: A soil moisture-rainfall feedback mechanism: 1. Theory and observations, Water Resour. Res., 34, 765–776, 1998. a, b
Findell, K. and Eltahir, E.: Atmospheric controls on soil moisture-boundary layer interactions. Part II: Feedbacks within the continental United States, J. Hydrometeorol., 4, 570–583, 2003a. a
Findell, K. and Eltahir, E.: Atmospheric controls on soil moisture-boundary layer interactions. Part I: Framework development, J. Hydrometeorol., 4, 552–569, 2003b. a
Ford, T. W., Rapp, A. D., Quiring, S. M., and Blake, J.: Soil moisture–precipitation coupling: observations from the Oklahoma Mesonet and underlying physical mechanisms, Hydrol. Earth Syst. Sci., 19, 3617–3631, https://doi.org/10.5194/hess-19-3617-2015, 2015. a
Froidevaux, P., Schlemmer, L., Schmidli, J., Langhans, W., and Schär, C.: Influence of the background wind on the local soil moisture-precipitation feedback, J. Atmos. Sci., 17, 782–799, 2014. a, b
Gallego-Elvira, B. and Taylor, C.: Global observational diagnosis of soil moisture control on the land surface energy balance, Geophys. Res. Lett., 43, 2623–2631, 2016. a
Gantner, L. and Kalthoff, N.: Sensitivity of a modelled life cycle of a mesoscale convective system to soil conditions over West Africa, Q. J. Roy. Meteor. Soc., 136, 471–482, 2010. a, b, c, d, e, f, g
Garcia-Carreras, L., Parker, D. J., and Marsham, J. H.: What is the mechanism for the modification of convective cloud distributions by land surface–induced flows?, J. Atmos. Sci., 68, 619–634, 2011. a, b
Goutorbe, J.-P., Lebel, T., Tinga, A., Bessemoulin, P., Brouwer, J., Dolman, A. J., Engman, E. T., Gash, J. H. C., Hoepffner, M., Kabat, P., Kerr, Y. H., Monteny, B., Prince, S., Said, F., Sellers, P., and Wallace, J. S.: HAPEX-Sahel: a large-scale study of land-atmosphere interactions in the semi-arid tropics, Ann. Geophys., 12, 53–64, https://doi.org/10.1007/s00585-994-0053-0, 1994. a
Gruhier, C. and Rosnay, P. D.: Evaluation of AMSRE soil moisture product based on ground measurements over temperate and semiarid regions, Geophys. Res. Lett., 35, 2–7, 2008. a
Guichard, F., Kergoat, L., Mougin, E., and Timouk, F.: Surface thermodynamics and radiative budget in the Sahelian Gourma: Seasonal and diurnal cycles, J. Hydrol., 375, 161–177, 2009. a
Guillod, B. P., Orlowsky, B., Miralles, D. G., Teuling, A. J., and Seneviratne, S. I.: Reconciling spatial and temporal soil moisture effects on afternoon rainfall, Nat. Commun., 6, 1–6, 2015. a, b
Guillod, B. P., Orlowsky, B., Miralles, D., Teuling, A. J., Blanken, P. D., Buchmann, N., Ciais, P., Ek, M., Findell, K. L., Gentine, P., Lintner, B. R., Scott, R. L., Van den Hurk, B., and I. Seneviratne, S.: Land-surface controls on afternoon precipitation diagnosed from observational data: uncertainties and confounding factors, Atmos. Chem. Phys., 14, 8343–8367, https://doi.org/10.5194/acp-14-8343-2014, 2014. a
Hohenegger, C., Brockhaus, P., Bretherton, C. S., and Schär, C.: The soil moisture–precipitation feedback in simulations with explicit and parameterized convection, J. Climate, 22, 5003–5020, 2009. a, b
Hsu, K.-l., Gao, X., Sorooshian, S., and Gupta, H. V.: Precipitation estimation from remotely sensed information using artificial neural networks, J. Appl. Meteorol., 36, 1176–1190, 1997. a
Huffman, G. J. and Bolvin, D. T.: TRMM and other data precipitation data set documentation, Tech. Rep. May, Mesoscale Atmospheric Processes Laboratory, NASA Goddard Space Flight Center, available at: https://pmm.nasa.gov/sites/default/files/document_files/3B42_3B43_doc_V7.pdf (last access: September 2017), 2014. a
Huffman, G. J., Bolvin, D. T., Nelkin, E. J., Wolff, D. B., Adler, R. F., Gu, G., Hong, Y., Bowman, K. P., and Stocker, E. F.: The TRMM multisatellite precipitation analysis (TMPA): quasi-global, multiyear, combined-sensor precipitation estimates at fine scales, J. Hydrometeorol., 8, 38–55, 2007. a, b
Janicot, S., Thorncroft, C. D., Ali, A., Asencio, N., Berry, G., Bock, O., Bourles, B., Caniaux, G., Chauvin, F., Deme, A., Kergoat, L., Lafore, J.-P., Lavaysse, C., Lebel, T., Marticorena, B., Mounier, F., Nedelec, P., Redelsperger, J.-L., Ravegnani, F., Reeves, C. E., Roca, R., de Rosnay, P., Schlager, H., Sultan, B., Tomasini, M., Ulanovsky, A., and ACMAD forecasters team: Large-scale overview of the summer monsoon over West Africa during the AMMA field experiment in 2006, Ann. Geophys., 26, 2569–2595, https://doi.org/10.5194/angeo-26-2569-2008, 2008. a
Klüpfel, V., Kalthoff, N., Gantner, L., and Kottmeier, C.: Evaluation of soil moisture ensemble runs to estimate precipitation variability in convection-permitting model simulations for West Africa, Atmos. Res., 101, 178–193, 2011. a, b, c
Klüpfel, V., Kalthoff, N., Gantner, L., and Taylor, C. M.: Convergence zones and their impact on the initiation of a mesoscale convective system in West Africa, Q. J. Roy. Meteor. Soc., 138, 950–963, 2012. a, b
Kohler, M., Kalthoff, N., and Kottmeier, C.: The impact of soil moisture modifications on CBL characteristics in West Africa: A case-study from the AMMA campaign, Q. J. Roy. Meteor. Soc., 136, 442–455, 2010. a, b
Koster, R. D., Dirmeyer, P. A., Guo, Z., Bonan, G., Chan, E., Cox, P., Gordon, C. T., Kanae, S., Kowalczyk, E., Lawrence, D., Liu, P., Lu, C.-H., Malyshev, S., McAvaney, B., Mitchell, K., Mocko, D., Oki, T., Oleson, K., Pitman, A., Sud, Y. C., Taylor, C. M., Verseghy, D., Vasic, R., Xue, Y., and Yamada, T.: Regions of strong coupling between soil moisture and precipitation, Science, 305, 1138–40, 2004. a
Laing, A. and Carbone, R.: The propagation and diurnal cycles of deep convection in northern tropical Africa, Q. J. Roy. Meteor. Soc., 109, 93–109, 2008. a, b, c, d
Laing, A. G., Trier, S. B., and Davis, C. A.: Numerical simulation of episodes of organized convection in tropical Northern Africa, Mon. Weather Rev., 140, 2874–2886, 2012. a, b, c
Lohou, F., Kergoat, L., Guichard, F., Boone, A., Cappelaere, B., Cohard, J.-M., Demarty, J., Galle, S., Grippa, M., Peugeot, C., Ramier, D., Taylor, C. M., and Timouk, F.: Surface response to rain events throughout the West African monsoon, Atmos. Chem. Phys., 14, 3883–3898, https://doi.org/10.5194/acp-14-3883-2014, 2014. a, b
Lothon, M., Campistron, B., Chong, M., Couvreux, F., Guichard, F., Rio, C., and Williams, E.: Life cycle of a mesoscale circular gust front observed by a C-band Doppler radar in West Africa, Mon. Weather Rev., 139, 1370–1388, 2011. a, b
Mathon, V. and Laurent, H.: Life cycle of Sahelian mesoscale convective cloud systems, Q. J. Roy. Meteor. Soc., 127, 377–406, 2001. a, b, c
Mathon, V., Laurent, H., and Lebel, T.: Mesoscale convective system rainfall in the Sahel, J. Appl. Meteorol., 41, 1081–1092, 2002. a
Matthews, E. and Fung, I.: Methane emission from natural wetlands: Global distribution, area, and environmental characteristics of sources, Global Biogeochem. Cy., 1, 61–86, 1987. a, b
Miralles, D. G., van den Berg, M. J., Teuling, A. J., and de Jeu, R. A. M.: Soil moisture-temperature coupling: A multiscale observational analysis, Geophys. Res. Lett., 39, L21707, https://doi.org/10.1029/2012GL053703, 2012. a, b
Mohr, K. and Thorncroft, C.: Intense convective systems in West Africa and their relationship to the African easterly jet, Q. J. Roy. Meteor. Soc., 132, 163–176, 2006. a
Nicholson, S. E.: The West African Sahel: A review of recent studies on the rainfall regime and its interannual variability, ISRN Meteorology, 2013, 1–32, 2013. a
Nicholson, S. E.: Evolution and current state of our understanding of the role played in the climate system by land surface processes in semi-arid regions, Global Planet. Change, 133, 201–222, 2015. a, b, c
Njoku, E. and Jackson, T.: Soil moisture retrieval from AMSR-E, IEEE T. Geosci. Remote, 41, 215–229, 2003. a, b, c
Owe, M., de Jeu, R., and Holmes, T.: Multisensor historical climatology of satellite-derived global land surface moisture, J. Geophys. Res., 113, F01002, https://doi.org/10.1029/2007JF000769, 2008. a, b
Petrova, I.: Understanding soil moisture – precipitation coupling on mesoscales using observations over North Africa, Reports on Earth System Science/Max Planck Institute for Meteorology, 191, 2017. a
Prigent, C., Papa, F., Aires, F., Rossow, W. B., and Matthews, E.: Global inundation dynamics inferred from multiple satellite observations, 1993–2000, J. Geophys. Res.-Atmos., 112, D12107, https://doi.org/10.1029/2006JD007847, 2007. a, b, c
Prigent, C., Papa, F., Aires, F., Jimenez, C., Rossow, W. B., and Matthews, E.: Changes in land surface water dynamics since the 1990s and relation to population pressure, Geophys. Res. Lett., 39, L08403, https://doi.org/10.1029/2012GL051276, 2012. a
Redelsperger, J.-L., Thorncroft, C. D., Diedhiou, A., Lebel, T., Parker, D. J., and Polcher, J.: African Monsoon Multidisciplinary Analysis: An international research project and field campaign, B. Am. Meteorol. Soc., 87, 1739–1746, 2006. a
Rochetin, N., Couvreux, F., and Guichard, F.: Morphology of breeze circulations induced by surface flux heterogeneities and their impact on convection initiation, Q. J. Roy. Meteor. Soc., 143, 463–478, 2017. a
Salvucci, G. D., Saleem, J. A., and Kaufmann, R.: Investigating soil moisture feedbacks on precipitation with tests of Granger causality, Adv. Water Resour., 25, 1305–1312, 2002. a
Schär, C., Lüthi, D., and Beyerle, U.: The soil-precipitation feedback: A process study with a regional climate model, J. Climate, 12, 722–741, 1999. a
Schwendike, J., Kalthoff, N., and Kohler, M.: The impact of mesoscale convective systems on the surface and boundary-layer structure in West Africa: Case-studies from the AMMA campaign 2006, Q. J. Roy. Meteor. Soc., 136, 566–582, 2010. a
Seneviratne, S. I., Corti, T., Davin, E. L., Hirschi, M., Jaeger, E. B., Lehner, I., Orlowsky, B., and Teuling, A. J.: Investigating soil moisture-climate interactions in a changing climate: A review, Earth-Sci. Rev., 99, 125–161, 2010. a, b
Taylor, C. M.: Feedbacks on convection from an African wetland, Geophys. Res. Lett., 37, L05406, https://doi.org/10.1029/2009GL041652, 2010. a, b, c, d
Taylor, C. M.: Detecting soil moisture impacts on convective initiation in Europe, Geophys. Res. Lett., 42, 4631–4638, 2015. a
Taylor, C. M. and Ellis, R. J.: Satellite detection of soil moisture impacts on convection at the mesoscale, Geophys. Res. Lett., 33, L03404, https://doi.org/10.1029/2005GL025252, 2006. a, b, c, d, e, f, g
Taylor, C. M. and Lebel, T.: Observational evidence of persistent convective-scale rainfall patterns, Mon. Weather Rev., 126, 1597–1607, 1998. a, b, c, d, e
Taylor, C. M., Parker, D. J., and Harris, P. P.: An observational case study of mesoscale atmospheric circulations induced by soil moisture, Geophys. Res. Lett., 34, L15801, https://doi.org/10.1029/2007GL030572, 2007. a
Taylor, C. M., Harris, P. P., and Parker, D. J.: Impact of soil moisture on the development of a Sahelian mesoscale convective system: a case-study from the AMMA Special Observing Period, Q. J. Roy. Meteor. Soc., 136, 456–470, 2010. a, b, c
Taylor, C. M., Gounou, A., Guichard, F., Harris, P. P., Ellis, R. J., Couvreux, F., and De Kauwe, M.: Frequency of Sahelian storm initiation enhanced over mesoscale soil-moisture patterns, Nat. Geosci., 4, 430–433, 2011. a, b
Taylor, C. M., de Jeu, R. A. M., Guichard, F., Harris, P. P., and Dorigo, W. A.: Afternoon rain more likely over drier soils, Nature, 489, 423–426, 2012. a, b, c
Taylor, C. M., Birch, C. E., Parker, D. J., Dixon, N., Guichard, F., Nikulin, G., and Lister, G. M. S.: Modeling soil moisture-precipitation feedback in the Sahel : Importance of spatial scale versus convective parameterization, Geophys. Res. Lett., 40, 6213–6218, 2013. a, b
Timouk, F., Kergoat, L., Mougin, E., Lloyd, C., Ceschia, E., Cohard, J.-M., de Rosnay, P., Hiernaux, P., Demarez, V., and Taylor, C.: Response of sensible heat flux to water regime and vegetation development in a central Sahelian landscape, J. Hydrol., 375, 178–189, 2009. a
van Heerwaarden, C. C. and Guerau de Arellano, J. V.: Relative humidity as an indicator for cloud formation over heterogeneous land surfaces, J. Atmos. Sci., 65, 3263–3277, 2008. a
Wolters, D.: Effects of soil moisture gradients on the path and the intensity of a West African squall line, Q. J. Roy. Meteor. Soc., 136, 2162–2175, 2010. a
Following T12, a box size of 1.25∘ × 1.25∘ is selected as minimum possible size to resolve soil moisture variability around the centre of the box, taking into account the 50 km footprint of the AMSR-E soil moisture.
The SMPC statistic for the finer scales is calculated if at least eight events in a box are present.
The climatologies are calculated for every Lmin location, for the same month as the event but for the non-event years.
Spearman correlation is a measure of the monotonic relationship. Therefore, a zero or low correlation value does not imply a zero relationship between two variables.