the Creative Commons Attribution 3.0 License.
the Creative Commons Attribution 3.0 License.
Grey water footprint reduction in irrigated crop production: effect of nitrogen application rate, nitrogen form, tillage practice and irrigation strategy
Abebe D. Chukalla
Maarten S. Krol
Arjen Y. Hoekstra
Grey water footprint (WF) reduction is essential given the increasing water pollution associated with food production and the limited assimilation capacity of fresh water. Fertilizer application can contribute significantly to the grey WF as a result of nutrient leaching to groundwater and runoff to streams. The objective of this study is to explore the effect of the nitrogen application rate (from 25 to 300 kg N ha−1), nitrogen form (inorganic N or manure N), tillage practice (conventional or no-tillage) and irrigation strategy (full or deficit irrigation) on the nitrogen load to groundwater and surface water, crop yield and the N-related grey water footprint of crop production by a systematic model-based assessment. As a case study, we consider irrigated maize grown in Spain on loam soil in a semi-arid environment, whereby we simulate the 20-year period 1993–2012. The water and nitrogen balances of the soil and plant growth at the field scale were simulated with the Agricultural Policy Environmental eXtender (APEX) model. As a reference management package, we assume the use of inorganic N (nitrate), conventional tillage and full irrigation. For this reference, the grey WF at a usual N application rate of 300 kg N ha−1 (with crop yield of 11.1 t ha−1) is 1100 m3 t−1, which can be reduced by 91 % towards 95 m3 t−1 when the N application rate is reduced to 50 kg N ha−1 (with a yield of 3.7 t ha−1). The grey WF can be further reduced to 75 m3 t−1 by shifting the management package to manure N and deficit irrigation (with crop yield of 3.5 t ha−1). Although water pollution can thus be reduced dramatically, this comes together with a great yield reduction, and a much lower water productivity (larger green plus blue WF) as well. The overall (green, blue and grey) WF per tonne is found to be minimal at an N application rate of 150 kg N ha−1, with manure, no-tillage and deficit irrigation (with crop yield of 9.3 t ha−1). The paper shows that there is a trade-off between grey WF and crop yield, as well as a trade-off between reducing water pollution (grey WF) and water consumption (green and blue WF). Applying manure instead of inorganic N and deficit instead of full irrigation are measures that reduce both water pollution and water consumption with a 16 % loss in yield.
- Article
(1885 KB) - Full-text XML
- BibTeX
- EndNote
Crop yields depend on anthropogenic addition of nitrogen (N). But using N fertilizers inevitably results in some N leaching and runoff, which results in the pollution of groundwater and surface water. Fresh water dilutes pollutant loads entering a water body, which can be interpreted as an appropriation of fresh water (Postel et al., 1996; Falkenmark and Lindh, 1974; Chapagain et al., 2006; Hoekstra, 2008). The amount of fresh water appropriated to assimilate the load of pollutants in order to meet ambient water quality standards is called the grey water footprint (WF) (Hoekstra et al., 2011). For crop production, the grey WF can be expressed as the volume of water per hectare or per tonne (m3 ha−1 or m3 t−1). Global crop production makes three quarters of the total N-related grey WF in the world (Mekonnen and Hoekstra, 2015). Anthropogenic N application in agriculture and the resulting fresh water pollution is expected to increase with the growing production of food, feed, fibre and biofuel in the world, driven by population growth and improving living standards. The assimilation capacity of fresh water, however, is limited, which calls for appropriate management practices that limit the grey WF per tonne of crop production.
Factors that influence the grey WF include the N application rate, the form of N applied (particularly inorganic N versus manure or organic N), and the tillage and irrigation practice. A low N application rate will hamper plant growth and reduce crop yield (Raun et al., 2002). The low N application rate will result in relatively little water pollution per hectare, but, because of the low yield per hectare, it may cause relatively high water pollution per unit of crop produced. A high N application rate will result in a high crop yield, but with high water pollution per hectare and per tonne of crop as well. The reason for the high water pollution per tonne of crop is that there is a threshold for the N application rate beyond which yield does not respond (Zhou et al., 2011), while the surplus N contributes to pollution (Carpenter et al., 1998; Vitousek et al., 2009). The form of N applied is another important factor affecting N losses. Inorganic N is readily available for uptake by crops (Haynes, 2012), whereas the organic N contained in manure becomes available only gradually, as it should first be converted (mineralized) to the inorganic form (Ketterings et al., 2005). The mobile nature of nitrate makes it susceptible to a higher risk of leaching (Yanan et al., 1997), while the slow disappearance of manure makes it susceptible to N losses through runoff before being taken up by the crop (Withers and Lord, 2002). Field operation practices such as tillage affect the water holding capacity of the soil, the movement of moisture and nutrients in the soil, surface runoff, and eventually crop yield and nutrient load to fresh water. There are various good reasons why conventional tillage is being practiced: it mixes fertilizer, organic matter and oxygen in the soil; breaks up surface soil crusts; and reduces weeds (Horowitz, 2011). However, conventional tillage disrupts aggregates within the soil and life cycles of beneficial organisms, increases soil erodability, and results in soil compaction and tillage-pan formation (Triplett and Dick, 2008); tillage pan is a formation of compacted soil layer caused by repeated ploughing using heavy weight tillage machineries (Podder et al., 2012). Alternatively, no-tillage maintains the crop residue that serves as mulch cover, improves the soil water holding capacity (Dangolani and Narob, 2013) and increases hydraulic conductivity (Azooz and Arshad, 1996; Triplett and Dick, 2008). The irrigation practice primarily influences the water balance of the soil, but as a side effect it influences nutrient movement in the soil. The advantage of deficit irrigation compared to full irrigation is that there may be less leaching and runoff of nutrients (Withers and Lord, 2002). The disadvantage of deficit irrigation is that it may result in reduced crop N demand (N uptake) as crop growth diminishes due to water stress and in reduced N supply as N transporting agent is reduced (Gonzalez-Dugo et al., 2010).
Various studies show how increasing N application rates results in both increased crop yield and N leaching (Berenguer et al., 2009; Rong and Xuefeng, 2011; Valero et al., 2005; Zhou et al., 2011; Cooper et al., 2012; Good and Beatty, 2011). Pittelkow et al. (2015) analysed the effect of tillage practices on crop yield, Yu et al. (2016) explored the effect of different combinations of tillage practice and N fertilizer form on crop yield, Huang et al. (2017) and Yanan et al. (1997) considered the effect of manure versus inorganic N fertilizer application on nitrate leaching, and Huang et al. (2015) analysed the effect of different tillage practices and N application rates on yield and N leaching. Furthermore, there are quite a few studies on the relation between rates of irrigation and N application and crop yield (Yin et al., 2014; Al-Kaisi and Yin, 2003; Rimski-Korsakov et al., 2009). These earlier studies provide insight in the effects of individual management practices on yield, water productivity or leaching; however, most of the studies vary only by one or two management practices, not considering the combined effect of N application rate, N form, tillage practice and irrigation strategy. In addition, none of these studies consider the effect on the pollutant load per unit of crop obtained or the effect on the grey WF per tonne.
It is challenging to conduct field experimental studies and even more laborious and expensive to study the effects of a comprehensive list of different combinations of management practices. In addition, leaching and runoff of N from fields is difficult to determine through field experiments; N that can be measured in groundwater and streams originates from different sources and cannot easily be attributed to an experimental field. An alternative approach avoiding these downsides is to use modelling (Chukalla et al., 2015; Ragab, 2015).
The objective of this study is to explore the effect of nitrogen application rate, nitrogen form, tillage practice and irrigation strategy on the nitrogen load to groundwater and surface water, crop yield and the N-related grey water footprint of crop production by a systematic model-based assessment. We apply the Agricultural Policy Environmental eXtender (APEX) model, which simulates nutrient and water balances of the soil and plant growth, is able to simulate the effect of a wide variety of agricultural management practices and has been applied for a wide variety of cases (Wang et al., 2012; Gassman et al., 2010; Liu et al., 2016; Clarke et al., 2017; Chen et al., 2017). As a case study, we simulate irrigated-maize growth for 20 years (1993–2012) at Badajoz in Spain on loam soil in a semi-arid environment.
Franke et al. (2013) distinguish three tiers to estimate grey WFs from diffuse pollution, from tier 1 to tier 3, ordered in the direction of increasing level of advancement. The tier-1 approach, which is the simplest but also least data demanding, is based on expert-based assumptions on which fractions of applied or surplus N in the soil will leach or run off given contextual factors. It provides a first rough estimate of the N load without describing the interaction and transformation of different chemical substances in the soil or along its flow pathways (see for instance Mekonnen and Hoekstra, 2011, and Brueck and Lammel, 2016). The more advanced tier-2 approach for estimating grey WFs from diffuse pollution is based on an annual N mass balance approach (see for example Mekonnen and Hoekstra, 2015, and Liu et al., 2012). This approach ignores soil organic matter build-up and decomposition as well as nitrogen transformations such as mineralization, immobilization and nitrification, which all affect the N uptake and N load to fresh water. The current study is the first one to apply the tier-3 approach, which explicitly considers daily physical and biochemical processes using an advanced water and nutrient balance model (the APEX model). As an additional component of the current study, we will compare the N leaching–runoff fractions that result from the APEX simulations with the leaching–runoff fractions estimated with the simpler tier-1 approach, in order to find out the added value of employing the advanced model approach.
2.1 Modelling the soil water and nitrogen balances and crop growth
The effect of various combinations of management practices on water flows (like soil evaporation, crop transpiration, percolation and runoff), N flows (like N uptake by plants, leaching and runoff) and crop growth are simulated using the APEX model, a dynamic, deterministic and process-based model with a daily time step (Williams and Izaurralde, 2006). Below we briefly summarize the processes simulated in the model. More detailed descriptions of the processes and the equations to simulate these processes can be found in the documentation of APEX (Williams et al., 2008).
The water balance component of APEX encompasses key processes that impact the soil water compartment in the hydrologic cycle. Initially, incoming inputs such as precipitation, snowmelt or irrigation are partitioned between surface runoff and infiltration. Surface runoff volume is simulated using a modified Soil Conservation Service curve number technique described by Williams et al. (2008). Infiltrated water can be stored in the soil profile, be lost via evapotranspiration (ET), percolate vertically to groundwater or flow laterally as subsurface flow, with a quick and slow component. Reference ET is calculated using the Penman–Monteith method. The actual ET, an important variable in estimating green and blue WF of crop production, is computed by simulating evaporation from the soil and transpiration from plants separately, considering the soil moisture status and how agricultural management practices affect the root zone. Percolation and lateral flow are computed using storage routing and pipe flow equations described by Gassman et al. (2010). A deep groundwater table is assumed and thus capillary rise, which APEX would simulate using storage routing (Gassman et al., 2010), is not considered in the water balance.
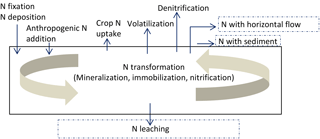
The N balance of the soil in APEX is computed based on inputs and outputs and conversion processes (Fig. 1). N is added to the soil–plant system through natural and anthropogenic pathways. Natural N inputs include wet and dry deposition (Anderson and Downing, 2006) and N fixation, through lightning and through biological fixation by legume plants (Carpenter et al., 1998). Anthropogenic input occurs when inorganic or organic N fertilizers are applied (Vitousek et al., 2009). N outputs include N uptake by crops (partly harvested and removed later on), denitrification, volatilization, nitrate-N losses through leaching, horizontal losses of organic N with eroded sediments, and horizontal losses of inorganic N through surface runoff, or lateral subsurface flow. N transformation includes mineralization, immobilization and nitrification.
APEX simulates the growth of annual and perennial crops based on the EPIC model (Williams et al., 1989), an energy-driven crop growth model using a radiation-efficiency approach to simulate the generation of biomass. Potential biomass production is derived as function of leaf area index and climatic variables (solar radiation, CO2, air humidity and temperature). Phenological development of the crop is based on heat unit accumulation measured in growing degree days. Annual crops grow from planting date to harvest date or until the accumulated heat units equal the potential heat units for the crop (Steduto, 1997). Daily potential growth is lowered to actual growth using the most limiting stress factor, considering stresses caused by water, nutrients (N and P), temperature and aeration, which are evaluated by assigning stress factors (from 0, high stress, to 1, no stress). Root growth is constrained based on the most limiting stress caused by soil strength and temperature. Total biomass is partitioned to root and above-ground biomass, and from the above-ground biomass the economic yield is partitioned using the harvest index.
2.2 The grey water footprint of growing crops
The grey water footprint (WF), an indicator of appropriated pollution assimilation capacity, is calculated following the Global Water Footprint Standard (Hoekstra et al., 2011), which means that the total pollutant load entering fresh water (groundwater or surface water) is divided by the difference between the maximum acceptable concentration for that pollutant and the natural background concentration for that pollutant. The grey WF can be expressed in two different ways, either as a water volume per ha or as a water volume per tonne of crop:
where L (kg ha−1 yr−1) is the pollutant load to surface water and groundwater, Cmax and Cnat are the maximum acceptable and natural concentrations (kg m−3), and Y is the crop yield (t ha−1 yr−1).
The total N load to fresh water (L, in kg N ha−1 yr−1) is calculated as the sum of the N load in surface runoff, the N in quick subsurface flow, the N in slow subsurface flow, the N adsorbed to eroded sediments and the N in percolation. Each of these N loads are simulated separately in APEX.
A maximum acceptable N concentration of 50 mg nitrate-N L−1 (or 11.3 mg N L−1) is adopted, based on the EU Nitrates Directive (Monteny, 2001). The natural concentration was considered to be 0.5 mg N L−1, following for example de Miguel et al. (2015).
Next to the grey WF, the green and blue WFs of crop production are calculated as well, again using the Global WF standard (Hoekstra et al., 2011). The green WF refers to the rainwater consumed (water evaporated or incorporated into the crop), while the blue WF refers to the irrigation water consumed (which comes from surface water or groundwater). Together, the green and blue WFs are called the consumptive WF. The consumptive WF per tonne of crop is calculated by dividing the ET over the growing period by the crop yield.
2.3 Leaching–runoff fraction
As an additional component of the current study, we will compare the N leaching–runoff fraction simulated through APEX (tier-3 level estimation) with the leaching–runoff fraction estimated with the simpler estimation approach (tier 1) as applied in previous studies, in order to find out when the simple tier-1 approach suffices and when it does not.
The leaching–runoff fraction can be defined in two ways (Franke et al., 2013). In the first definition, the leaching–runoff fraction, called α, is defined as the percentage of the amount of chemical applied to the field as fertilizer that is lost to groundwater through leaching or to surface water through runoff. In the second definition, the leaching–runoff fraction, now called β, is defined as the percentage of the amount of “surplus chemical” in the soil that is transported to groundwater by leaching or to surface water by runoff. The surplus chemical in the soil is defined as the amount of chemical applied minus the uptake of the chemical by the crop.
where α and β are the leaching–runoff fractions, and where L (kg N ha−1 yr−1) is the N load to fresh water bodies due to the anthropogenic N addition, Appl (kg N ha−1 yr−1) the N fertilizer applied, and Surplus (kg N ha−1 yr−1) the N applied but not taken up by the plant.
At the tier-3 level, the fractions α and β are not used in the calculations, but they can easily be calculated afterwards, based on the outputs of the model. At the tier-1 level, α and β can be estimated using Eqs. (4) and (5) following the guidelines of Franke et al. (2013). According to these guidelines, the leaching–runoff fractions lie between a minimum and a maximum value (0.01 to 0.25 for α and 0.08 to 0.8 for β). The precise value is estimated based on context-specific environmental and management factors, using the following equations:
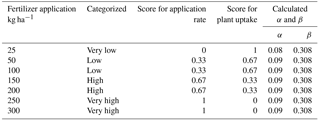
where si is the score for the leaching–runoff potential for environmental or management factor i, and wi is the weight of that factor. Corresponding to a certain state of factor, i, a score s is assigned between 0 and 1: scores of 0, 0.33, 0.67 and 1 refer to a very low, low, high and a very high leaching–runoff potential, respectively. A weight w per factor i denotes the importance of the factor. The weights given to the separate influencing factors add up to a total of 100.
2.4 Simulation set-up
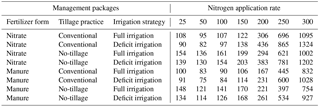
We carry out model simulations with APEX for 56 management packages, whereby each management package consists of a certain combination of management practices. We consider all possible combinations of seven N application rates, two N forms, two tillage practices and two irrigation strategies (Table 1). As a reference management package, we assume the use of inorganic N fertilizer (nitrate) in combination with conventional tillage and full irrigation. Conventional tillage is the most widespread tillage practice in the EU (EUROSTAT, 2013) and full irrigation is the most common irrigation practice, aimed at achieving maximum yield.
Table 1Research set-up: the APEX model is used to simulate the effect of 56 management packages (combinations of different management practices) on ET; crop yield; nitrogen load to fresh water; and green, blue and grey WF.

The EU Nitrate Directive legally restricts annual farm application of manure in EU member states to 170 kg N ha−1 yr−1, or in the case of derogation up to 250 kg N ha−1 yr−1 (Amery and Schoumans, 2014; van Grinsven et al., 2012). Surveys in Spain, however, show that application rates of 300–350 kg N ha−1 yr−1 are common to cultivate maize in the Ebro Valley (Berenguer et al., 2009) and up to 300 kg N ha−1 yr−1 in La Mancha (Valero et al., 2005). As the upper value for the N application rate in our simulations we apply 300 kg N ha−1 yr−1.
The fertilization is assumed to be performed in two splits (30 % in a first round, at planting for mineral fertilizer and 15 days before planting for manure; 70 % in a second round, 1 month after planting). In the first round of application, inorganic fertilizer is assumed to be nitrate-N and applied through broadcasting while manure is assumed to be injected. Manure injection is getting recognition in the EU and in the world due to its many advantages, including reduction of N losses to fresh water and to the atmosphere and bad odour (Van Dijk et al., 2015; van den Pol-van Dasselaar et al., 2015). In the second round, both the manure and nitrate-N fertilizers are added as side dressing.
As for the inorganic N applied, we assume that the N is 100 % in the form of nitrate. Manure is generally contained of mostly organic N and a smaller amount of inorganic N (Ketterings et al., 2005; Pratt and Castellanos, 1981). In this study, we assume the manure composition as in the APEX database: 91.67 % organic N, 8.33 % inorganic N (0.23 % nitrate and 8.10 % ammonium N). In addition, the current study assumes that other nutrients (P, K and micro nutrients) do not to constrain crop production.
We simulate conventional tillage in APEX as ploughing two times to a depth of 20 cm at 30 and 15 days before sowing date and harrowing one time following the emergence of the seed. Ploughing two times is the average of what is most common, namely tilling one to three times (Nagy and Rátonyi, 2013; FAO, 2016). With the tillage depth of 20 cm we follow the average estimate reported by Townsend et al. (2015) and FAO (2016). No-tillage, a form of conservation tillage that is strongly encouraged by the EU agricultural policy (De Vita et al., 2007), is simulated as no soil disturbance; the stubble of the previous crop is kept on the field.
We simulate full irrigation in APEX by irrigating up to field capacity as soon as the soil water content would otherwise drop below a level at which water stress occurs. Deficit irrigation is simulated to allow for 20 % plant water stress, a deficit level that can achieve 61–100 % of full ET (Fereres and Soriano, 2007). With this irrigation strategy, average water productivity is higher than in the case of full irrigation (Chukalla et al., 2015). We assume the use of furrow irrigation, the irrigation technique that covered the largest irrigated area in the EU in 2010, particularly in the eastern and Mediterranean regions of Europe (EUROSTAT, 2016).
2.5 Data
The model experiment is carried out at the field scale for a place near Badajoz in Spain, in the Guadiana river basin, which has a semi-arid climate and faces water scarcity during part of the year, particularly in summer when water is needed for irrigation (Hoekstra et al., 2012).
The following climatic and soil data have been collected for Badajoz in Spain (38.88∘ N, −6.83∘ E; 185 m above mean sea level). Daily observed rainfall and temperature data (for the period 1993–2012) are extracted from the European Climate Assessment and Dataset (Klein Tank et al., 2002). These data have been subject to homogeneity testing and missing data have been filled with observations from nearby stations (Klein Tank, 2007). Mean monthly solar radiation, relative humidity and wind speed data are taken from the FAO CLIMWAT database (Smith, 1993). Daily reference evapotranspiration is calculated using the Penman–Monteith equation, as implemented in APEX (Williams et al., 2008). The average monthly climatic and reference evapotranspiration data are shown in Table A1 in the Appendix.
Using the soil texture triangle hydraulic properties calculator from Saxton et al. (1986), we identified the soil at our location as loam soil. The physical and chemical characteristics of the soil and nutrient content in the soil (nitrogen, phosphorus, carbon) that are used in APEX are extracted from the 1 × 1 km2 resolution European Soil Database (Hannam et al., 2009). We use a soil albedo of 0.13 for a loam soil at its field capacity (Sumner, 1999).
Regarding crop parameters, we use the default values from the APEX model. The effects of stresses related to weed, pest and diseases on crop growth are not considered; we simulate the effect of stresses from excess and limitation of water, from limitation of nitrogen, and from very high or very low temperature.
Soil moisture content is initialized using the standard procedure in APEX, which is based on average annual rainfall within the period considered (1993–2012). We adjust initial organic N content for each simulation so that the N build-up in the soil over the 20-year period is zero. We apply the graphical time-series inspection method (Robinson, 2002) to determine the warm-up period, i.e. the period in which simulation results are still affected by the model initialization. We find that we best exclude the first 5 years of the simulation; thus, we show results for the period 1998–2012.
3.1 Pollutant loads and grey WF for the reference management package
N outfluxes from the soil for maize production under the reference management package (inorganic N, conventional tillage, full irrigation) for different N application rates are shown in Fig. 2. The N outfluxes are denitrification and volatilization to the atmosphere, N harvested with the crop, and N loads to fresh water adhered to sediment and dissolved in percolation and runoff. All of these N outfluxes increase with the N application rate and with the N surplus in the root zone (N application minus crop uptake). For all N application rates the N harvested with the crop is the main share of the N outflux. For larger N application rates, the share of N leaching increases substantially. For all application rates, N leaching to groundwater constitutes at least 95 % of the total N load to fresh water and the N flux to surface water (N dissolved in runoff plus N in eroded sediments) 5 % at most.
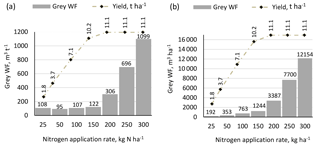
Crop yields increase with the N application rate as a result of reduced N stress. Yields stabilize at larger N application rates. The yield increase, however, comes at a price: the N load to fresh water, through leaching, runoff and eroded sediment, increases exponentially. As a result, large N application rates result in a large grey WF (Fig. 3). At lower N application rates, crop yields decline as a consequence of N stress. While the grey WF in m3 ha−1 keeps on declining with lower N application rates, the grey WF in m3 t−1 starts increasing again at very low N application rate (in our case when the N application rate drops below 50 kg N ha−1). The smallest grey WF per tonne can be found at an N application rate of 50 kg N ha−1, where yield is substantially lower than the maximum, but where additional N application goes along with increasing N load per unit of crop yield gain, thus with increasing grey WF per tonne.
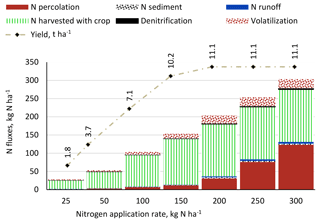
Figure 2Nitrogen outfluxes and yield for an irrigated maize field for a range of N application rates under the reference management package (inorganic N, conventional tillage, full irrigation).
3.2 Effect of fertilizer form, tillage practice and irrigation strategy on grey WF
Figure 4 shows that, at a given N application rate, the grey WF in m3 t−1 can be higher or lower than for the reference management package, by changing to manure, no-tillage or deficit irrigation, or a combination of those. Across the whole range of N application rates, the use of manure results in a smaller grey WF per tonne than the use of nitrate fertilizer. The effect of the tillage practice and irrigation strategy on the grey WF depends on the N application rate. We can identify three ranges for the application rate, each with a different management package resulting in the smallest grey WF per tonne.
- i.
Application rates up to 125 kg N ha−1: the grey WF is smallest for manure with conventional tillage and deficit irrigation.
- ii.
Application rates between 125 and 225 kg N ha−1: the grey WF is smallest for manure with conventional tillage and full irrigation.
- iii.
Application rates above 225 kg N ha−1: the grey WF is smallest for manure with no-tillage and full irrigation.
At low and intermediate N application rates (ranges i–ii), the advantage of conventional tillage over no-tillage is that it decreases the hydraulic conductivity of the soil (because of the removal of fine cracks in the soil), which reduces percolation and thus N leaching. At high N application rates (range iii), no-tillage appears to be better. The disadvantage of increased hydraulic conductivity is now compensated by another effect: no-tillage results in improved soil texture – the soil remains intact, which in combination with the build-up of organic content creates favourable conditions for soil organisms that help to glue the soil particles and increase the number of micropores and macropores in the soil. This increases the soil water holding capacity and thus N holding capacity of the soil, resulting in lower N leaching (by 30 %) and higher yield (by 3.6 %).
At low application rates (range i), deficit irrigation decreases the amount of water available for percolation and thus reduces N leaching as well. At intermediate and higher N application rates (ranges ii–iii), full irrigation has a smaller grey WF per tonne as compared to deficit irrigation because of the higher crop yield. With the absence of water stress and the higher yield, the N uptake by the crop is higher, resulting in a lower N surplus in the root zone and decreased N leaching.
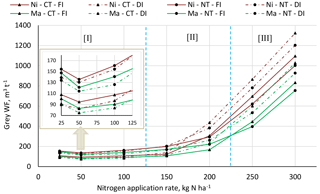
Figure 4The effect of N application rate, N form, tillage practice and irrigation strategy on grey WF per tonne. Considering which management package gives the lowest grey WF, three ranges can be distinguished: (i) N application rates up to 125 kg N ha−1, (ii) N application rates between 125 and 225 kg N ha−1, and (iii) N application rates above 225 kg N ha−1. Red lines refer to nitrate (Ni); green lines refer to manure (Ma). Circular markers refer to no-tillage (NT); triangular markers refer to conventional tillage. Dashed lines refer to deficit irrigation (DI); solid lines refer to full irrigation (FI).
The smallest grey WFs per tonne are found for an N application rate of 50 kg N ha−1. Taking the reference management package with an N application rate of 300 kg N ha−1 as a starting point, one can reduce the grey WF per tonne of crop production by reducing the N application rate while keeping the management package fixed, by shifting the management package to one with a smaller grey WF, or both (Table A2). Reducing the N application rate from 300 kg N ha−1 to the optimum of 50 kg N ha−1 under the reference management package will reduce the grey WF by 91 % (from around 1100 to 95 m3 t−1), but the crop yield will reduce by two thirds (from 11.1 to 3.7 t ha−1). At the application rate of 50 kg N ha−1, shifting from the reference management package to organic N and deficit irrigation, one can further reduce the grey WF by 21 % (from around 95 to 75 m3 t−1) but with further yield reduction by 5 % (from 3.7 to 3.5 t ha−1).
3.3 Reducing grey WF vs. consumptive WF
Both ET and yield increase with increasing N application rate, but level off at large N application rates (Fig. 5a). Adding more N at relatively low application rates has a larger impact on Y increase than on ET increase. As a result, the consumptive WF per tonne, defined as ET over Y, decreases with increasing N application rate, levelling off at larger N application rates (Fig. 5b). The grey WF per tonne, however, exponentially increases with increasing N application rate. As a result, the sum of grey and consumptive WF has a minimum somewhere at intermediate N application rates, at 150 N ha−1 in the case of our reference management package. The total WF is dominated by the consumptive WF for smaller N application rates and by the grey WF for larger N application rates.
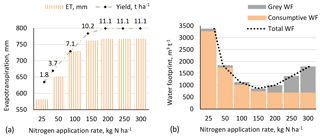
Figure 5Evapotranspiration and yield (a) and consumptive WF and grey WF per tonne (b) for the reference management package.
Figure 6 shows the total (grey + consumptive) WF per tonne for the reference management package for different N application rates (the solid red line). For each given N application rate, shifting to another management package (the dashed red and green lines, and the solid green line) can reduce the total WF. Generally, the reduction in total WF is the result from reductions in both the grey WF and the consumptive WF (as indicated in the figure). At N application rates of 25, 50 and 100 kg N ha−1, the total WF can be reduced by shifting towards no-tillage and deficit irrigation. At N application rates of 150 kg N ha−1, the total WF can be reduced by shifting towards organic N, no-tillage and deficit irrigation. Finally, at N application rates of 200, 250 and 300 kg N ha−1, the total WF can be reduced by shifting towards organic N and no-tillage. The total WF reductions shown in the figure are the net effect of changes in the consumptive WF and grey WF; in some cases, the total WF decrease is at the cost of some grey WF increase.
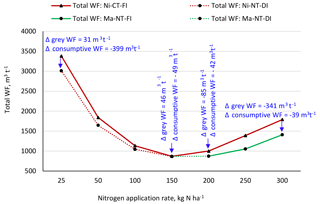
Figure 6The total (green, blue and grey) WF per tonne for the reference management package and for a management package with the largest total WF reduction potential. Red lines refer to nitrate (Ni); green lines refer to manure (Ma). Circular markers refer to no-tillage (NT); triangular markers refer to conventional tillage. Dashed lines refer to deficit irrigation (DI); solid lines refer to full irrigation (FI).
3.4 Resultant leaching–runoff fractions
The N leaching–runoff fractions α and β for different N application rates for the reference management package, as calculated here with the tier-3 approach, are shown in Fig. 7. The α values, which show the ratio of the N load to fresh water to the N application rate are lower than the β values, which show the ratio of the N load to the N surplus in the soil. This can be logically understood, because the N load to fresh water (in the numerator of both ratios) is the same, while the α ratio has the total N application rate in the denominator, while the β ratio has the relatively smaller N surplus (which is only a fraction of the N applied) in the denominator.
With increasing N application rate, both N surplus in the soil and the N load to fresh water increase exponentially (Fig. 2). The α values grow with increasing N application rate, because the N load to fresh water increases quicker with increasing N application rates than the application rate itself. The β values also grow with increasing N application rates, because denitrification and volatilization do not grow proportionally to the growth in N surplus, which leads to greater fractions of the surplus getting lost through leaching and runoff.
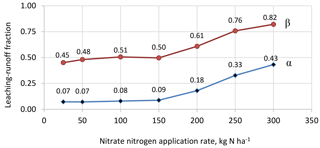
Figure 7The N leaching–runoff fractions α and β calculated per N application rate for the reference management package.
Figures 8 and 9 show α and β values for different management packages and N application rates. For comparison, the figures also show the α and β values when estimated based on the simpler tier-1 approach (Tables A3 and A4), which estimates α and β within minimum and maximum values based on context-specific environmental and management factors (see Sect. 2.3). The calculated leaching–runoff fractions based on the APEX model (tier-3 approach) for all management packages across the range of N application rates fall within the range set by the minimum and maximum leaching–runoff fraction margins as applied in the tier-1 approach (Franke et al., 2013), except for α for very high N application rates.
For N applications rates in the range up to 150 kg ha−1, the tier-1 approach gives a good proxy for the α value. For the reference management package, the most common practice, the tier-1 approach even yields nearly the same α values as the more advanced tier-3 approach. For N applications rates exceeding about 150 kg ha−1, the tier-1 approach underestimates the leaching–runoff fraction and thus the grey WF. The β values estimated based on the tier-1 approach are comparable to the ones calculated at the tier-3 level for the management packages with manure and conventional tillage. For the other management packages, β is underestimated with the tier-1 approach. Also for N application rates of 250 kg ha−1 and beyond, the tier-1 approach underestimates β.
The leaching–runoff fractions from the application of inorganic N (nitrate) calculated at the tier-3 level are larger than these for organic N (manure) – a distinction that is not made in the tier-1 approach.
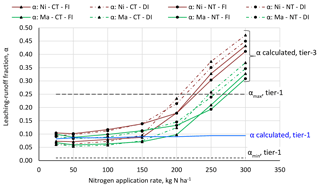
Figure 8N leaching–runoff fractions α for different management packages and N application rates following from the tier-1 or tier-3 approach. Red lines refer to nitrate (Ni); green lines refer to manure (Ma). Circular markers refer to no-tillage (NT); triangular markers refer to conventional tillage. Dashed lines refer to deficit irrigation (DI); solid lines refer to full irrigation (FI).
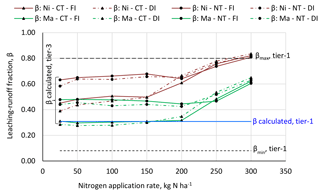
Figure 9N leaching–runoff fractions β for different management packages and N application rates following from the tier-1 or tier-3 approach. Red lines refer to nitrate (Ni); green lines refer to manure (Ma). Circular markers refer to no-tillage (NT); triangular markers refer to conventional tillage. Dashed lines refer to deficit irrigation (DI); solid lines refer to full irrigation (FI).
The study shows that there is not only one combination of management practices that minimises grey WF or overall WF and maximises crop yield at the same time. Table 2 shows that the best combination of practices depends on what variable is optimized. Yield is optimal when there is neither nitrogen stress nor water stress, i.e. at high N application rate and full irrigation. The highest yield (11.5 t ha−1) is found for when N is applied in the form of manure and the case of no-tillage. The total WF per tonne (the sum of the green, blue and grey WF) is smallest at 150 kg N ha−1, manure application, no-tillage and deficit irrigation. The yield in this case, 9.3 t ha−1, is below-optimum. There is both nitrogen and water stress, but the latter is more important. The grey WF per tonne is smallest at 50 kg N ha−1, manure application, conventional tillage and deficit irrigation. This, however, reduces the yield to 3.5 t ha−1 because of nitrogen stress. Deficit irrigation gives some water stress as well, but at such high nitrogen stress, it is the latter that constrains crop yield. Our results confirm the finding by Mekonnen and Hoekstra (2014) that there is a trade-off between consumptive WF per tonne and grey WF per tonne, i.e. a trade-off between reducing water consumption and water pollution.
Table 2The measures that give the optimum grey WF per tonne, total WF per tonne or yield.

* Total WF refers to the sum of the green, blue and grey WF.
The response of maize yield to nitrogen input as simulated in this study with the APEX model is comparable with the shape of the N-response curves for a few crops, including maize, constructed for the EU based on field measurements from various earlier studies (Godard et al., 2008). Our finding is also consistent with the results presented by Berenguer et al. (2009), who carried out field experiments for maize for similar conditions in Spain (Fig. 10). For every given N input, their yields are 25 % higher than from our study, which may relate to the fact that Berenguer et al. (2009) used a high-yield maize variety.

Figure 10The maize yield simulated in our study in relation to N application rate (a) and N harvested with maize (b) in comparison to the maize yields from field experiments by Berenguer et al. (2009) when corrected for zero N build-up in the root zone.
An inter-model comparison for the case of no N stress and no water stress (taking optimal N application rate and full irrigation) for exactly the same growing conditions in Spain shows similar crop yields and net irrigation supply. The current study, using the APEX model, simulates a net irrigation supply of 638 mm and a maize yield of 11.1 t ha−1, while in an earlier study, employing the AquaCrop model (Steduto et al., 2011), we simulate an irrigation supply of 630 mm and a maize yield of 11.9 t ha−1 (Chukalla et al., 2015). APEX is reported to adequately simulate evapotranspiration for different management practices with the Penman–Monteith equation for semi-arid conditions in the Mediterranean, including Spain (Cavero et al., 2012). The study by Milly and Dunne (2016), however, reported that Penman–Monteith overestimates evapotranspiration for non-water stress conditions, which suggests that ground-truthing with field experiments is necessary.
While acknowledging the need for further validation of our simulation results through field experiments, we need to be aware of the limitations attached to field measurements as well. The nitrogen that can be measured in groundwater and streams can originate from different sources and represents the N coming from an experimental field only partially, so that attribution of what can be measured in groundwater and streams to certain management practices can be very difficult. In addition, field experimental results from a few years have to be interpreted cautiously, because some management practices, such as no-tillage, become effective only after several years (Grandy et al., 2006; Derpsch et al., 2010). A practical difficulty is that field experiments generally need to focus on varying just a few management practices as it is costly to experiment with a large number of combinations of practices.
Simulated yields, N loads to fresh water and grey WFs under different management packages are subject to the local environmental conditions of our case in Spain, which means that they cannot simply be transferred to other conditions. In addition, even for our specific case, the outcomes are subject to uncertainties inherent to any modelling effort (Kersebaum et al., 2016). We have also excluded other factors relevant in crop production, like the effects of weeds, pests and diseases. Therefore, the precise values presented should be taken with caution; the value of our study rather lies in the understanding it provides on how different agricultural management practices can affect yield, N load and resultant grey WF of crop production, and how and why there are inevitable trade-offs between crop yield, water consumption and water pollution.
While the focus of the current study has been leaching and runoff of nitrogen, the effect of water pollution through phosphorous can be as important. The results from the current study cannot necessarily be transferred to the phosphorus-related grey WF of crop production, which requires additional study.
This paper provides the first detailed study on potential N-related grey WF reduction of growing a crop by analysing the effect of a large number of combinations of different management practices. The paper shows that, when choosing a certain N application rate and when choosing between inorganic versus organic fertilizer, between conventional versus no-tillage, and between full versus deficit irrigation, two inevitable trade-offs are made. The first trade-off is between crop yield and water pollution (grey WF). Whereas maximizing crop yields requires a relatively high N application rate and full irrigation, minimizing water pollution per unit of crop requires deficit irrigation and seeking a balance between N application rate (and associated water pollution) and the resultant yield. The second trade-off is between reducing water pollution (grey WF) and water consumption (green and blue WF). Minimizing consumptive water use per tonne requires a higher N application rate (150 kg N ha−1 in our case) than minimizing water pollution per tonne (50 kg N ha−1 in our case). Applying manure instead of inorganic N and deficit instead of full irrigation are measures that reduce both water pollution and water consumption per tonne. However, for minimizing water pollution per tonne one can choose conventional tillage, because that reduces leaching, whereas for minimizing water consumption per tonne the no-tillage practice is to be preferred, because that reduces soil evaporation.
The study gives some support to the simple tier-1 approach of estimating the grey WF of applying N fertilizer as proposed by Franke et al. (2013), but only for N application rates below 150 kg ha−1. Below that, the α value is estimated in the proper range (in our specific case), but the β value is underestimated. Beyond the N application rate of 150 kg ha−1, the tier-1 approach underestimates the leaching–runoff fraction, by not accounting for the fact that N uptake by the crop is stabilizing and that denitrification and volatilization do not increase proportionally with growing N inputs, which results in an increasing fraction of the N surplus in the soil lost through leaching, runoff and erosion.
The daily observed rainfall, minimum and maximum temperature data are freely available and can be downloaded from the European Climate Assessment and Dataset at http://www.ecad.eu/dailydata/ (Klein Tank et al., 2002). The mean monthly solar radiation, relative humidity and wind speed data can be downloaded from the FAO CLIMWAT database at http://www.fao.org/land-water/databases-and-software/climwat-for-cropwat/en/ (Smith, 1993). The soil data are freely available as well: they can be downloaded with 1 km by 1 km resolution at http://esdac.jrc.ec.europa.eu/content/european-soil-database-v20-vector-and-attribute-data (Hannam et al., 2009). APEX (the Agricultural Policy Environmental eXtender model) can be freely obtained from https://epicapex.tamu.edu/model-executables/ (Williams and Izaurralde, 2006).
Table A3N leaching–runoff potential scores for environmental factors and agricultural practices, following the tier-1 approach (Franke et al., 2013).

* See Table A4.
The authors declare that they have no conflict of interest.
The paper was
partially developed within the framework of the Panta Rhei Research
Initiative of the International Association of Hydrological Sciences
(IAHS).
Edited by: Nandita Basu
Reviewed by: Ann-Perry Witmer and five anonymous referees
Al-Kaisi, M. M. and Yin, X.: Effects of nitrogen rate, irrigation rate, and plant population on corn yield and water use efficiency, Agron. J., 95, 1475–1482, 2003.
Amery, F. and Schoumans, O.: Agricultural phosphorus legislation in Europe, Institute for Agricultural and Fisheries Research (ILVO), 2014.
Anderson, K. A. and Downing, J. A.: Dry and wet atmospheric deposition of nitrogen, phosphorus and silicon in an agricultural region, Water Air Soil Poll., 176, 351–374, 2006.
Azooz, R. and Arshad, M.: Soil infiltration and hydraulic conductivity under long-term no-tillage and conventional tillage systems, Can. J. Soil Sci., 76, 143–152, 1996.
Berenguer, P., Santiveri, F., Boixadera, J., and Lloveras, J.: Nitrogen fertilisation of irrigated maize under Mediterranean conditions, Eur. J. Agron., 30, 163–171, 2009.
Brueck, H. and Lammel, J.: Impact of Fertilizer N Application on the Grey Water Footprint of Winter Wheat in a NW-European Temperate Climate, Water, 8, 356, https://doi.org/10.3390/w8080356, 2016.
Carpenter, S. R., Caraco, N. F., Correll, D. L., Howarth, R. W., Sharpley, A. N., and Smith, V. H.: Nonpoint pollution of surface waters with phosphorus and nitrogen, Ecol. Appl., 8, 559–568, 1998.
Cavero, J., Barros, R., Sellam, F., Topcu, S., Isidoro, D., Hartani, T., Lounis, A., Ibrikci, H., Cetin, M., and Williams, J.: APEX simulation of best irrigation and N management strategies for off-site N pollution control in three Mediterranean irrigated watersheds, Agr. Water Manage., 103, 88–99, 2012.
Chapagain, A., Hoekstra, A., Savenije, H., and Gautam, R.: The water footprint of cotton consumption: An assessment of the impact of worldwide consumption of cotton products on the water resources in the cotton producing countries, Ecol. Econ., 60, 186–203, 2006.
Chen, Y., Ale, S., Rajan, N., and Munster, C.: Assessing the hydrologic and water quality impacts of biofuel-induced changes in land use and management, GCB Bioenergy, 9, 1461–1475, 2017.
Chukalla, A. D., Krol, M. S., and Hoekstra, A. Y.: Green and blue water footprint reduction in irrigated agriculture: effect of irrigation techniques, irrigation strategies and mulching, Hydrol. Earth Syst. Sci., 19, 4877–4891, https://doi.org/10.5194/hess-19-4877-2015, 2015.
Clarke, N., Bizimana, J.-C., Dile, Y., Worqlul, A., Osorio, J., Herbst, B., Richardson, J. W., Srinivasan, R., Gerik, T. J., and Williams, J.: Evaluation of new farming technologies in Ethiopia using the Integrated Decision Support System (IDSS), Agr. Water Manage., 180, 267–279, 2017.
Cooper, J., Quemada, M., Kristensen, H., and van der Burgt, G.: Toolbox of cost-effective strategies for on-farm reductions in N losses to water, Final Report, Newcastle University, 2012.
Dangolani, S. K. and Narob, M.: The effect of four types of tillage operations on soil moisture and morphology and performance of three varieties of cotton, European Journal of Experimental Biology, 3, 694–698, 2013.
de Miguel, Á., Hoekstra, A. Y., and García-Calvo, E.: Sustainability of the water footprint of the Spanish pork industry, Ecol. Indic., 57, 465–474, 2015.
Derpsch, R., Friedrich, T., Kassam, A., and Li, H.: Current status of adoption of no-till farming in the world and some of its main benefits, Int. J. Agr. Biol. Eng., 3, 1–25, 2010.
De Vita, P., Di Paolo, E., Fecondo, G., Di Fonzo, N., and Pisante, M.: No-tillage and conventional tillage effects on durum wheat yield, grain quality and soil moisture content in southern Italy, Soil Till. Res., 92, 69–78, 2007.
EUROSTAT: EUROSTAT online database, European Commission, Luxembourg, Agri-environmental indicator – tillage practices, available at: http://epp.eurostat.ec.europa.eu (last access: 18 October 2016), 2013.
EUROSTAT: EUROSTAT online database, European Commission, Luxembourg, Agri-environmental indicator – Irrigation methods, available at: http://epp.eurostat.ec.europa.eu, last access: 18 October 2016.
Falkenmark, M. and Lindh, G.: How can we cope with the water resources situation by the year 2015?, Ambio, 3, 114–122, 1974.
FAO: on-line database, Suitable methods of tillage for the farm, Food and Agricultural Orgnization, Rome, Italy, available at: http://www.fao.org/docrep/006/y5146e/y5146e08.htm, last access: 16 November 2016.
Fereres, E. and Soriano, M. A.: Deficit irrigation for reducing agricultural water use, J. Exp. Bot., 58, 147–159, 2007.
Franke, N., Boyacioglu, H., and Hoekstra, A.: Grey water footprint accounting: Tier 1 supporting guidelines, Value of Water Research Report Series No. 65, UNESCO-IHE, Delft, the Netherlands, 2013.
Gassman, P., Williams, J., Wang, X., Saleh, A., Osei, E., Hauck, L., Izaurralde, R., and Flowers, J.: Invited Review Article: The agricultural policy/environmental eXtender (APEX) model: an emerging tool for landscape and watershed environmental analyses, T. ASABE, 53, 711–740, 2010.
Godard, C., Roger-Estrade, J., Jayet, P.-A., Brisson, N., and Le Bas, C.: Use of available information at a European level to construct crop nitrogen response curves for the regions of the EU, Agr. Syst., 97, 68–82, 2008.
Gonzalez-Dugo, V., Durand, J.-L., and Gastal, F.: Water deficit and nitrogen nutrition of crops. A review, Agron. Sustain. Dev., 30, 529–544, 2010.
Good, A. G. and Beatty, P. H.: Fertilizing nature: a tragedy of excess in the commons, PLoS Biol, 9, e1001124, https://doi.org/10.1371/journal.pbio.1001124, 2011.
Grandy, A., Robertson, G., and Thelen, K.: Do productivity and environmental trade-offs justify periodically cultivating no-till cropping systems?, Agron. J., 98, 1377–1383, 2006.
Hannam, J. A., Hollis, J. M., Jones, R. J. A., Bellamy, P. H., Hayes, S. E., Liedekerke, M. H., and Montanarella, L.: SPE-2: The soil profile analytical database for Europe, Beta Version 2.0, available at: http://esdac.jrc.ec.europa.eu/content/european-soil-database-v20-vector-and-attribute-data (last access: 16 June 2014), 2009.
Haynes, R.: Mineral nitrogen in the plant-soil system, Elsevier, 2012.
Hoekstra, A. Y.: Water neutral: Reducing and offsetting the impacts of water footprints, Value of Water Research Report Series No. 28, UNESCO-IHE, Delft, the Netherlands, 2008.
Hoekstra, A. Y., Chapagain, A. K., Aldaya, M. M., and Mekonnen, M. M.: The Water Footprint Assessment Manual: Setting the Global Standard, Earthscan, London, UK, 2011.
Hoekstra, A. Y., Mekonnen, M. M., Chapagain, A. K., Mathews, R. E., and Richter, B. D.: Global monthly water scarcity: blue water footprints versus blue water availability, PLoS One, 7, e32688, https://doi.org/10.1371/journal.pone.0032688, 2012.
Horowitz, J.: No-till farming is a growing practice, 70, DIANE Publishing, 2011.
Huang, M., Liang, T., Wang, L., and Zhou, C.: No-tillage and fertilization management on crop yields and nitrate leaching in North China Plain, Ecol. Evol., 5, 1143–1155, 2015.
Huang, T., Ju, X., and Yang, H.: Nitrate leaching in a winter wheat-summer maize rotation on a calcareous soil as affected by nitrogen and straw management, Scientific Reports, 7, 2017.
Kersebaum, K. C., Kroes, J., Gobin, A., Takáč, J., Hlavinka, P., Trnka, M., Ventrella, D., Giglio, L., Ferrise, R., and Moriondo, M.: Assessing Uncertainties of Water Footprints Using an Ensemble of Crop Growth Models on Winter Wheat, Water, 8, 571, https://doi.org/10.3390/w8120571, 2016.
Ketterings, Q., Albrecht, G., Czymmek, K., and Bossard, S.: Nitrogen credits from manure Fact Sheet 4, Cornell University Cooperative Extension, Ithaca, 2005.
Klein Tank, A.: EUMETNET/ECSN optional programme: European Climate Assessment & Dataset (ECA&D) Algorithm Theoretical Basis Document (ATBD), version 4, Royal Netherlands Meteorological Institute KNMI, available at: http://www.ecad.eu/dailydata/ (last access: 16 June 2014), 2007.
Klein Tank, A., Wijngaard, J., Können, G., Böhm, R., Demarée, G., Gocheva, A., Mileta, M., Pashiardis, S., Hejkrlik, L., and Kern-Hansen, C.: Daily dataset of 20th-century surface air temperature and precipitation series for the European Climate Assessment, Int. J. Climatol., 22, 1441–1453, 2002.
Liu, C., Kroeze, C., Hoekstra, A. Y., and Gerbens-Leenes, W.: Past and future trends in grey water footprints of anthropogenic nitrogen and phosphorus inputs to major world rivers, Ecol. Indic., 18, 42–49, 2012.
Liu, J., Liu, Q., and Yang, H.: Assessing water scarcity by simultaneously considering environmental flow requirements, water quantity, and water quality, Ecol. Indic., 60, 434–441, 2016.
Mekonnen, M. M. and Hoekstra, A. Y.: The green, blue and grey water footprint of crops and derived crop products, Hydrol. Earth Syst. Sci., 15, 1577–1600, https://doi.org/10.5194/hess-15-1577-2011, 2011.
Mekonnen, M. M. and Hoekstra, A. Y.: Water footprint benchmarks for crop production: A first global assessment, Ecol. Indic., 46, 214–223, 2014.
Mekonnen, M. M. and Hoekstra, A. Y.: Global gray water footprint and water pollution levels related to anthropogenic nitrogen loads to fresh water, Environ. Sci. Technol., 49, 12860–12868, 2015.
Milly, P. C. and Dunne, K. A.: Potential evapotranspiration and continental drying, Nature Climate Change, 6, 946–949, 2016.
Monteny, G. J.: The EU Nitrates Directive: a European approach to combat water pollution from agriculture, Sci. World J., 1, 927–935, 2001.
Nagy, J. and Rátonyi, T.: Soil Cultivation and Land Use, University of Debrecen, Debrecen, Hungary, 2013.
Pittelkow, C. M., Linquist, B. A., Lundy, M. E., Liang, X., Van Groenigen, K. J., Lee, J., Van Gestel, N., Six, J., Venterea, R. T., and Van Kessel, C.: When does no-till yield more? A global meta-analysis, Field Crop. Res., 183, 156–168, 2015.
Podder, M., Akter, M., Saifullah, A., and Roy, S.: Impacts of plough pan on physical and chemical properties of soil, Journal of Environmental Science and Natural Resources, 5, 289–294, 2012.
Postel, S. L., Daily, G. C., and Ehrlich, P. R.: Human appropriation of renewable fresh water, Science-AAAS-Weekly Paper Edition, 271, 785–787, 1996.
Pratt, P. F. and Castellanos, J. Z.: Available nitrogen from animal manures, Calif. Agr., 35, p. 24, 1981.
Ragab, R.: Integrated Management Tool for Water, Crop, Soil and N-Fertilizers: The Saltmed Model, Irrig. Drainage, 64, 1–12, 2015.
Raun, W. R., Solie, J. B., Johnson, G. V., Stone, M. L., Mullen, R. W., Freeman, K. W., Thomason, W. E., and Lukina, E. V.: Improving nitrogen use efficiency in cereal grain production with optical sensing and variable rate application, Agron. J., 94, 815–820, 2002.
Rimski-Korsakov, H., Rubio, G., and Lavado, R. S.: Effect of water stress in maize crop production and nitrogen fertilizer fate, J. Plant Nutr., 32, 565–578, 2009.
Robinson, S.: New simulation output analysis techniques: a statistical process control approach for estimating the warm-up period, Proceedings of the 34th conference on Winter simulation: exploring new frontiers, 439–446, 2002.
Rong, Y. and Xuefeng, W.: Effects of nitrogen fertilizer and irrigation rate on nitrate present in the profile of a sandy farmland in Northwest China, Procedia Environ. Sci., 11, 726–732, 2011.
Saxton, K., Rawls, W. J., Romberger, J., and Papendick, R.: Estimating generalized soil-water characteristics from texture, Soil Sci. Soc. Am. J., 50, 1031–1036, 1986.
Smith, M.: CLIMWAT for CROPWAT. A climatic database for irrigation planning and management, FAO, http://www.fao.org/land-water/databases-and-software/climwat-for-cropwat/en/ (last access: 12 January 2016), 1993.
Steduto, P.: Modelling for crop response to water: physiological aspects, Options Mediterraneennes, Serie A: Seminaires Mediterraneens (CIHEAM), 1997.
Steduto, P., Hsiao, T., Raes, D., Fereres, E., Izzi, G., Heng, L., and Hoogeveen, J.: Performance review of AquaCrop- The FAO crop-water productivity model, ICID 21st International Congress on Irrigation and Drainage, 15–23, 2011.
Sumner, M. E.: Handbook of soil science, CRC Press, 1999.
Townsend, T., Ramsden, S., and Wilson, P.: How do we cultivate in England? Tillage practices in crop production systems, Soil Use Manage., 32, 106–117, 2015.
Triplett, G. and Dick, W. A.: No-tillage crop production: a revolution in agriculture!, Agron. J., 100, S-153–S-165, 2008.
Valero, J. D. J., Maturano, M., Ramírez, A. A., Martín-Benito, J. T., and Álvarez, J. O.: Growth and nitrogen use efficiency of irrigated maize in a semiarid region as affected by nitrogen fertilization, Span. J. Agr. Res., 3, 134–144, 2005.
van den Pol-van Dasselaar, A., Aarts, H., De Vliegher, A., Elgersma, A., Reheul, D., Reijneveld, J., Verloop, J., and Hopkins, A.: Grassland and forages in high output dairy farming systems, Grassland Science in Europe, Wageningen Academic Publishers, Wageningen, the Netherlands, 2015.
Van Dijk, H., Schukking, S., and Van der Berg, R.: Fifty years of forage supply on dairy farms in the Netherlands, Grassland Sci. Eur., 20, 12–20, 2015.
van Grinsven, H. J. M., ten Berge, H. F. M., Dalgaard, T., Fraters, B., Durand, P., Hart, A., Hofman, G., Jacobsen, B. H., Lalor, S. T. J., Lesschen, J. P., Osterburg, B., Richards, K. G., Techen, A.-K., Vertès, F., Webb, J., and Willems, W. J.: Management, regulation and environmental impacts of nitrogen fertilization in northwestern Europe under the Nitrates Directive; a benchmark study, Biogeosciences, 9, 5143–5160, https://doi.org/10.5194/bg-9-5143-2012, 2012.
Vitousek, P. M., Naylor, R., Crews, T., David, M., Drinkwater, L., Holland, E., Johnes, P., Katzenberger, J., Martinelli, L., and Matson, P.: Nutrient imbalances in agricultural development, Science, 324, 1519, https://doi.org/10.1126/science.1170261, 2009.
Wang, X., Williams, J. R., Gassman, P. W., Baffaut, C., Izaurralde, R. C., Jeong, J., and Kiniry, J. R.: Epic and Apex: Model Use, Calibration, and Validation, T. ASABE, 55, 1447–1462, 2012.
Williams, J. R. and Izaurralde, R. C.: The APEX Model, in: Watershed Models, edited by: Singh, V. P. and Frevert, D. K., CRC Press, Boca Raton, Florida, 437–482, https://epicapex.tamu.edu/model-executables/ (last access: 8 December 2015), 2006.
Williams, J. R., Jones, C. A., Kiniry, J. R., and Spanel, D. A.: The EPIC crop growth model, T. ASAE, 32, 0497–0511, 1989.
Williams, J. R., Izaurralde, R. C., and Steglich, E. M.: Agricultural Policy/Environmental eXtender Model: Theoretical documentation version 0604, BREC Report, 17, 2008.
Withers, P. J. and Lord, E. I.: Agricultural nutrient inputs to rivers and groundwaters in the UK: policy, environmental management and research needs, Sci. Total Environ., 282, 9–24, 2002.
Yanan, T., Emteryd, O., Dianqing, L., and Grip, H.: Effect of organic manure and chemical fertilizer on nitrogen uptake and nitrate leaching in a Eum-orthic anthrosols profile, Nutr. Cycl. Agroecosys., 48, 225–229, 1997.
Yin, G., Gu, J., Zhang, F., Hao, L., Cong, P., and Liu, Z.: Maize yield response to water supply and fertilizer input in a semi-arid environment of Northeast China, PloS One, 9, e86099, https://doi.org/10.1371/journal.pone.0086099, 2014.
Yu, C.-L., Hui, D., Deng, Q., Wang, J., Reddy, K. C., and Dennis, S.: Responses of corn physiology and yield to six agricultural practices over three years in middle Tennessee, Scientific Reports, 6, 27504, https://doi.org/10.1038/srep27504, 2016.
Zhou, J. B., Wang, C. Y., Zhang, H., Dong, F., Zheng, X. F., Gale, W., and Li, S. X.: Effect of water saving management practices and nitrogen fertilizer rate on crop yield and water use efficiency in a winter wheat-summer maize cropping system, Field Crop. Res., 122, 157–163, 2011.


