the Creative Commons Attribution 4.0 License.
the Creative Commons Attribution 4.0 License.
 | 04 Jun 2018
Historical drought patterns over Canada and their teleconnections with large-scale climate signals
Howard Simon Wheater
Barrie Bonsal
Saman Razavi
Sopan Kurkute
Drought is a recurring extreme climate event and among the most costly natural disasters in the world. This is particularly true over Canada, where drought is both a frequent and damaging phenomenon with impacts on regional water resources, agriculture, industry, aquatic ecosystems, and health. However, nationwide drought assessments are currently lacking and impacted by limited ground-based observations. This study provides a comprehensive analysis of historical droughts over the whole of Canada, including the role of large-scale teleconnections. Drought events are characterized by the Standardized Precipitation Evapotranspiration Index (SPEI) over various temporal scales (1, 3, 6, and 12 consecutive months, 6 months from April to September, and 12 months from October to September) applied to different gridded monthly data sets for the period 1950–2013. The Mann–Kendall test, rotated empirical orthogonal function, continuous wavelet transform, and wavelet coherence analyses are used, respectively, to investigate the trend, spatio-temporal patterns, periodicity, and teleconnectivity of drought events. Results indicate that southern (northern) parts of the country experienced significant trends towards drier (wetter) conditions although substantial variability exists. Two spatially well-defined regions with different temporal evolution of droughts were identified – the Canadian Prairies and northern central Canada. The analyses also revealed the presence of a dominant periodicity of between 8 and 32 months in the Prairie region and between 8 and 40 months in the northern central region. These cycles of low-frequency variability are found to be associated principally with the Pacific–North American (PNA) and Multivariate El Niño/Southern Oscillation Index (MEI) relative to other considered large-scale climate indices. This study is the first of its kind to identify dominant periodicities in drought variability over the whole of Canada in terms of when the drought events occur, their duration, and how often they occur.
- Article
(5866 KB) - Full-text XML
-
Supplement
(1136 KB) - BibTeX
- EndNote


Drought is a naturally occurring environmental phenomenon and a major natural hazard that can have devastating impacts on regional water resources, agriculture, industry, and other social-ecological systems, with far-reaching impacts in an increasingly globalized and uncertain world (IPCC, 2013; Sternberg, 2011). Although still among the least understood extreme weather events affecting larger areas, droughts have proved to be the costliest and most widespread of natural disasters (Bryant, 2005; Wilhite, 2000b). This is primarily due to their usually lengthy duration, severity, and large spatial extent, sometimes reaching continental scales and lasting for many years (Sheffield et al., 2009). Generally, droughts can affect all components of the hydrological cycle, from its origin as a deficit in precipitation (P; Dai, 2011; Palmer, 1965; McKee et al., 1993), to its combination with high evapotranspiration losses that can lead to a deficit in soil moisture and subsequent manifestation into a hydrological drought (Tallaksen and Stahl, 2014).
A review of key drought concepts (e.g. classification and indices) and the relation between droughts and large-scale climate indices has been carried out by Mishra and Singh (2010). However, due to the wide variety of sectors affected by droughts, their diverse spatial and temporal structures, the interdependence across climatic, hydrologic, geomorphic, ecological, and societal variables, and the demand placed on water supply by different users, there is no universal definition of droughts and associated impacts. The most used drought classification is that initially proposed by Dracup et al. (1980) and later integrated by Wilhite and Glantz (1985), and Wilhite (2000a). Based on the degree of water deficit, droughts are often classified into three types including (1) meteorological, (2) agricultural, and (3) hydrological. Further details on drought classification and definitions are found in Mishra and Singh (2010), Dai (2011), and Van Loon et al. (2016).
Studies on regional drought characteristics are important and should be incorporated in water resource management efforts (Mishra and Singh, 2011; Wheater and Gober, 2013). Of particular interest is the analysis of drought occurrence over Canada, a country in which drought is among the most costly natural hazards, particularly in the interior Prairie region; see e.g. Bonsal et al. (2011a). During the period 1950–2010, nationwide annual mean surface air temperature, T, increased by 1.5 ∘C (Vincent et al., 2012). Being the second largest country in the world and with a large continental interior, this rapid warming has been accompanied by significant changes in many other hydroclimatic elements in different parts of the country, including increases in P (Mekis and Vincent, 2011), decreases in the duration of snow cover (Brown and Braaten, 1998), and decreases in annual streamflow (Zhang et al., 2001). Climate projections also indicate that many regions of Canada will likely experience increasing drought risk by the end of the 21st century (Masud et al., 2017; Bonsal et al., 2013; Dibike et al., 2017).
Historically, most areas of Canada have experienced periodic droughts with different durations, severities, and marked spatial extent, but the agricultural belt of the Canadian Prairies has tended to be highly susceptible to droughts due in part to its location in the lee of the Rocky Mountains and its strong dependence on rain-fed agriculture (Shabbar and Skinner, 2004). In particular, devastating drought events over western Canada during the 1890s, 1910s, 1930s, 1960s, 1980s, 1999–2005, and most recently in 2015 have been identified by using a variety of drought indicators at various scales (Bonsal et al., 2011b; Bonsal and Regier, 2007; Szeto et al., 2016). The 1961 drought (the worst single year drought on the Prairies, with about 50 % of normal growing season precipitation) led to a total net farm income drop of 48 % (USD 300 million) compared with the previous year (Bonsal et al., 1999). The drought of 1988 had many impacts on the agricultural sectors of Canada, including wind erosion, livestock, incomes, farm management, crop production, and prices. In addition, the sparse snow cover and high spring Ts resulted in little or no spring runoff from Prairie watersheds in 1988, such that the mean runoff volume was 60 to 70 % of the normal amount (Wheaton et al., 1992). Furthermore, the 1999–2005 drought which was at its most severe between 2001 and 2002 was felt across Canada but was concentrated in the Prairies, and cost the regional economy an estimated USD 3.6 billion in lost agricultural output (Council of Canadian Academies, 2013).
The uncertainty of drought characterization in Canada in an era of changing climate and increasing pressure from competing water users poses a major challenge to sustainable water management. A better understanding of the spatial distribution of drought, and its frequency, intensity, and duration is thus required. Increased knowledge of these drought characteristics and their relationship to large-scale ocean–atmosphere forcing is necessary for predicting seasonal drought severity, as well as for planning for impacts due to future climate change. Previous studies have documented significant links between low-frequency internal climate variability and the Canadian hydroclimate. For example, positive phases of the Pacific Decadal Oscillation (PDO) and El Niño–Southern Oscillation (ENSO) have been associated with warm winter T in western and central Canada (Bonsal et al., 2001; Shabbar and Yu, 2012; Shabbar and Khandekar, 1996) and a reduction of snow cover in western Canada (Brown and Braaten, 1998). A review of the association of large-scale variability and low streamflows over Canada was conducted by Bonsal and Shabbar (2008). They found a higher frequency of low-flow events to coincide with warmer/drier conditions during El Niño events and positive phases of the PDO and the Pacific–North American (PNA) pattern. Nazemi et al. (2017) investigated the major drivers of annual streamflow variability in the headwaters of the Canadian Prairies during the 20th century and found the PDO to significantly determine monotonic trends and shifts in the central tendency of annual mean streamflow.
Fleming and Quilty (2006) quantified the effects of organized modes of climate variability upon groundwater resources, by examining the influence of ENSO on water levels in shallow aquifers in British Columbia. They found water levels to be above average during La Niña years and below average during El Niño years, an indication of variability in winter and spring P that recharges the aquifer systems. Similarly, Tremblay et al. (2011) analyzed the variability of groundwater systems for three different regions across Canada and their linkage to the North Atlantic Oscillation (NAO), the Arctic Oscillation (AO), the PNA, and ENSO. Their findings indicated that groundwater variability in the Prince Edward Island region is mostly modulated by the NAO and AO, in Manitoba it is influenced by the PNA, while for Vancouver Island NAO, AO, and ENSO showed the highest influence. Perez-Valdivia et al. (2012) found variability in groundwater levels in the Canadian Prairies in the 2–7-year and 7–10-year bands to be highly influenced by ENSO while oscillation modes in the 18–22-year band reflected a negative correlation with the PDO index.

The development of a comprehensive drought monitoring system capable of providing early warning of a drought's onset, severity, persistence, and spatial extent in a timely manner is a critical component in establishing a national drought policy or strategy. However, such nationwide drought assessments in Canada are hampered partly by observational uncertainties. The paucity and heterogeneous distribution of P and T estimates are an important limitation of drought characterization. Ground-based measurements (e.g. gauges) are limited, especially over the Rocky Mountains and north of the 60th parallel, and suffer from inaccuracies associated with cold climate processes (Wang and Lin, 2015; Wong et al., 2016; Asong et al., 2017; Asong et al., 2016). For this purpose, it is worthwhile to study the long-term time series of P and T regarding their non-homogeneous climatic and hydrological properties. It is also important to identify homogeneous regions within Canada with distinct drought features for improved drought risk assessment and for a more efficient water resource management at the regional level. So far, most studies on droughts have been limited to Canada south of 60∘ N (Masud et al., 2015; Bonsal et al., 2013; Dibike et al., 2017). Nevertheless, we have not come across studies that attempt to establish the link between nationwide drought characteristics (e.g. spatial structure, temporal patterns, periodicities) and the large-scale ocean–atmospheric modes of variability in a comprehensive manner.
This study aims to fill these gaps by providing a comprehensive analysis of historical droughts over the whole of Canada. Drought events are characterized by the Standardized Precipitation Evapotranspiration Index (SPEI; Vicente-Serrano et al., 2010) over various temporal scales (1, 3, 6, and 12 consecutive months, 6 months from April to September, and 12 months from October to September). First, trends in the SPEI are investigated by means of the Mann–Kendall test. Major patterns of long-term change and periodicity of drought events are then characterized using the rotated empirical orthogonal function and continuous wavelet transform techniques, respectively. In addition, potential key drivers of drought are investigated using wavelet coherence analysis, with a special emphasis on the role played by large-scale modes of climate variability. Finally, due to the uncertainty associated with climate variables, especially in the northern and mountainous regions where ground-based measurements are inevitably limited (Zhang et al., 2000), this study utilizes and compares two common Canada-wide gridded data sets (monthly P and T) for the period 1950–2013.
The paper is organized as follows. Section 2 provides a description of the data and analysis methods. Section 3 discusses the detailed characteristics of drought over different regions of Canada by applying the different aforementioned statistical analyses to the drought index. This section also discusses the physical and dynamical mechanisms driving the observed dry episodes in the country. Finally, a summary and conclusions are given in Sect. 4.
2.1 Study area
The study area comprises the entire Canadian landmass (Fig. 1). The region includes several major river systems including the Great Lakes–St. Lawrence River system, which is one of the largest freshwater resources globally. Topography plays an important role in shaping regional climates, ranging from wet maritime on the coasts to dry continental across the Prairies and Boreal Plain. Snowfall is restricted to winter months (approximately October to April depending on region). The occurrence, intensity, and timing of seasonal P greatly influence the functioning of ecosystems in various terrestrial ecozones in this region (Hogg et al., 2000). Based on the period 1950–2013, mean annual P varied from more than 2460 mm on the west and 1260 mm on the east coastal regions to less than 360 mm in the interior Prairie (southern central) and northern (above 60∘ N) regions (Fig. 2). The long-term monthly (January–December) minimum and maximum Ts ranged from −30 to +15 ∘C (see Sect. 2.2 below for data sources). Characterized by a highly variable hydroclimate and diminishing water resources, southern parts of Canada are home to cities with the highest population densities and support a vibrant agro-based economy that was hard-hit by the most severe and prolonged droughts of 1988, 1999–2005, and 2015, as well as severe floods of 2011, 2013, and 2014 (Wheater and Gober, 2015; Pomeroy et al., 2016).

Figure 2Mean annual climatology of precipitation, minimum temperature (Tmin), and maximum temperature (Tmax) for the period 1950–2013.
2.2 Data sources
2.2.1 Gridded observations – ANUSPLIN
The Australian National University Spline (ANUSPLIN) implementation of trivariate thin plate smoothing splines (Hutchinson et al., 2009) has been used to provide gridded climate data over continental Canada, available on a 0.0833 grid spacing (∼ 10 km). Variables include monthly minimum T (Tmin), maximum T (Tmax), and P amounts. Station data from Environment and Climate Change Canada observing sites were interpolated onto the high-resolution grid using the ANUSPLIN smoothing splines, with longitude, latitude, and elevation as interpolation predictors (McKenney et al., 2011). Prior to interpolation, observed station data (Fig. S1 in the Supplement) were quality-controlled and corrected for station relocation, changes in the definition of the climate day, and trace P amounts. Hopkinson et al. (2011) showed that annual mean absolute interpolation errors in ANUSPLIN were limited to 1.0 ∘C for Tmax, 1.3 ∘C for Tmin, and about 9 % for annual P over southern Canada.
2.2.2 Gridded observations – CANGRD
The Canadian gridded (CANGRD) data originate from the second generation of Adjusted and Homogenized Canadian Climate Data – Daily Temperature and Precipitation (http://open.canada.ca/data/en/dataset/d6813de6-b20a- 46cc-8990-01862ae15c5f, last access: 25 April 2018), with over 330 locations (Fig. S2) for T and 460 for total P (note that these numbers are not constant over time). These data have been quality-controlled and adjusted to account for known changes in measurement practices. In particular, records from stations separated by less than 10 km were merged so that correlations between stations would be small. See Mekis and Vincent (2011) for a detailed discussion on merging techniques and trends in the mean climatologies of these data. For CANGRD, these data were interpolated to evenly spaced (50 km) grids using Gandin's optimal interpolation (Gandin, 1966) technique. As in the case of ANUSPLIN, monthly P, Tmax, and Tmin values were extracted from 1950–2013 and used in the analyses.
2.2.3 Teleconnection indices
To analyze the key drivers of drought events over Canada, six large-scale climate anomalies that have been linked to hydroclimatic variability over Canada (Shabbar and Khandekar, 1996; Asong et al., 2015; Zhao et al., 2013; Perez-Valdivia et al., 2012; Bonsal and Shabbar, 2008; Fleming and Quilty, 2006; Nazemi et al., 2017) and/or North America (Ropelewski and Halpert, 1986) are investigated. They include the Pacific Decadal Oscillation (PDO; Mantua and Hare, 2002), North Atlantic Oscillation (NAO; Hurrell and Van Loon, 1997), Pacific–North American (PNA; Barnston and Livezey, 1987), Arctic Oscillation (AO; Zhou et al., 2001), Atlantic Multidecadal Oscillation (AMO; Enfield et al., 2001), and Multivariate El Niño/Southern Oscillation Index (MEI; Wolter, 1987; Wolter and Timlin, 2011). Monthly values of all indices are sourced from https://www.esrl.noaa.gov/psd/ (last access: 25 April 2018) for the period 1950–2013.
2.3 Drought index calculation and drought identification
Many quantitative metrics have been developed and used for identification and monitoring of droughts (Mishra and Singh, 2011; Raible et al., 2017). A variety of these indices measure, in most cases, how much P and T for a given period deviate from historical averages. Examples include the Palmer drought severity index (PDSI; Palmer, 1965), Palmer hydrological drought index (Palmer, 1965), self-calibrated Palmer drought severity index (Wells et al., 2004), standardized precipitation index (SPI; McKee et al., 1993), the SPEI (Vicente-Serrano et al., 2010), and multivariate standardized drought index (Hao and AghaKouchak, 2013). In Canada, most drought analyses (Dibike et al., 2016; Masud et al., 2017) have utilized climate-based indices since the T and P variables are readily available for longer periods and span larger areas, compared to hydrologic variables such as soil moisture and streamflow. In this study, we make use of the SPEI as a meteorological proxy for drought quantification.
As detailed in Vicente-Serrano et al. (2010), the SPEI is a multi-scalar drought index based on a water balance approach that uses the monthly difference between P and potential evapotranspiration (PET) to analyze wet/dry spells over multiple timescales. SPEI involves calculating monthly PET and then subtracting this from the corresponding monthly P to obtain the climatic water balance. Several derivations have been put forth for calculating PET, including the widely used Penman (Penman, 1948), Thornthwaite (Thornthwaite, 1948), Priestley–Taylor (Priestley and Taylor, 1972), and Hargreaves (Hargreaves et al., 1985) methods. However, most of these approaches require long records for solar radiation, Ts, wind speed, and air pressure, which are not readily available in Canada and many regions of the world. Reanalysis products are an alternative data set for historical drought analysis in Canada and could lead to robust estimates of PET based on the Penman–Monteith algorithm (Maidment, 1993). However, they have been found to be uncertain compared to observations (Wong et al., 2017). A more suitable product with close performance to observations is the Global Environmental Multiscale (GEM) numerical weather prediction model output (Côté et al., 1998). However, it is limited in record length (2002–present). Therefore, the Hargreaves method (Hargreaves, 1994) which simply uses Tmin and Tmax for estimating PET is employed in this study. Once PET is calculated, the difference between P and PET for the month j is calculated as in Eq. (1):
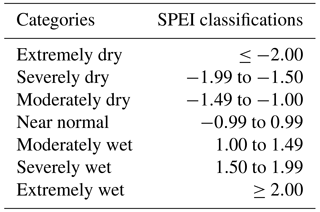
Table 1Categories of dryness/wetness degree according to the SPEI values (McKee et al., 1993).
where Qjvalues represent monthly water surplus or deficit.
To compute SPEI, the monthly Qjvalues are first standardized with respect to the long-term monthly mean values. The 1-month SPEI is generally representative of meteorological drought, while timescales between 3 and 6 months are considered as an agricultural drought index. Longer scales such as 6 and 12 months are used to represent hydrological drought and are useful for monitoring surface water resources (Beguería et al., 2014; Hayes et al., 2011). To ascertain the variability of spatio-temporal patterns for different types of droughts, the SPEI was used at different timescales, namely, at 1 (SPEI1), 3 (SPEI3), 6 (SPEI6), and 12 (SPEI12) consecutive months from January–December, at 6 months during the warm season (April–September, SPEI6Apr−Sep), and at 12 months during the hydrologic year (October–September, SPEI12Oct−Sep). SPEI1, SPEI3, SPEI6, and SPEI12 account for the sub-annual variability of droughts, while SPEI6Apr−Sep and SPEI12Oct−Sep account for the inter-annual variability. A drought event occurs any time the SPEI is continuously negative and reaches an intensity of −1.0 or less, and it ends when SPEI becomes positive. Whenever a drought event has been detected with a start and termination month, drought properties such as duration, magnitude, and frequency can be determined. SPEI categories are shown in Table 1. Unless indicated, we focus mostly on other SPEI timescales except SPEI1, which at 1 month is mainly a meteorological drought index.
2.4 Trend analysis
Long-term trends in drought intensity and variability (inter-annual) are analyzed using the SPEI time series at each grid point. This enables investigation of the percentage of grid points with increasing/decreasing trends during the period 1950–2013 based on the ANUSPLIN- and CANGRD-derived SPEI values. Pre-whitening as described in Yue et al. (2002) is first applied to the monthly SPEI anomalies to remove lag-1 autocorrelation, since serial correlation is generally recognized to influence trends in auto-correlated time series, which may distort the power of the Mann–Kendall test. Pre-whitening is limited to a low-order autoregressive model, i.e. AR(1), since it can falsify the structure of variability in time series across timescales (particularly with higher order models) (Razavi and Vogel, 2018). The pre-whitened SPEI values on different timescales are then used for detecting statistically significant (p<0.05) trends on a pixel basis. Further details on Mann–Kendall trends can also be found in Hamed and Rao (1998).
2.5 Empirical orthogonal function analysis
Hydroclimatological data are often characterized by non-linearity and high dimensionality. Thus, the challenging task is to find ways to reduce the dimensionality of the system to as few modes as possible by expressing the data in such a way as to highlight their similarities and differences (Hannachi et al., 2007). The empirical orthogonal function (EOF) analysis (also known as principal component analysis, PCA) is among the most widely and extensively used method in hydroclimate sciences for accomplishing such tasks (Richman, 1986; Wilks, 2011; Preisendorfer and Mobley, 1988). EOF is employed to find hydroclimate subregions that experienced similar drought features during the period 1950–2013. The EOF consists of computing the covariance matrix of the SPEI series with the corresponding eigenvalues and eigenvectors (Uvo, 2003).
Following the rule by North et al. (1982), the sampling errors at 95 % confidence level of the eigenvalues associated with the leading components were estimated in order to establish how many modes to retain for rotation. To achieve more stable and physically explainable patterns, a rotation of the retained components with the varimax procedure (Richman, 1986) was applied. The patterns defined in this way are referred to as rotated empirical orthogonal functions (REOFs). In summary, the REOF (spatial patterns) values indicate the spatial representativeness of each rotated temporal component (RPC; temporal patterns). Subsequently, we obtained the most revealing patterns of drought evolution across Canada and determined the spatial extent of each component series by mapping the factorial matrix values (i.e. correlation between each REOF and the original SPEI series). Finally, the time variability of the selected RPCs of SPEI was examined for possible trends in the identified subregions using linear regression. The slopes of the trends were computed by applying the method of least squares linear fitting to the time series.
2.6 Wavelet analysis
After delimitating hydroclimate subregions that experienced similar drought features, the RPC time series corresponding to the REOFs was then analyzed in a time–frequency domain (to reveal dominant oscillations) by means of the continuous wavelet transform (CWT). Subsequently, by utilizing the wavelet coherence (WCO) technique (Grinsted et al., 2004; Torrence and Compo, 1998; Addison, 2016), the relationships between the dominant oscillations and large-scale climate indices that have possibly modulated historical drought patterns across Canada are investigated. The CWT projects the spectral-temporal characteristics of a time series onto a time–frequency plane from which the dominant periodicities and their duration can be distinguished (Fugal, 2009; Grinsted et al., 2004).
The wavelet power spectrum (WPS) is defined as the squared modulus of the CWT (Jiang et al., 2014; Hao et al., 2012), and represents the signal energy at a specific scale (period) and time. From the WPS, the various periodicities and the time intervals of their occurrence can be determined. For a given time series {yn}, with n the CWT is given by
where Wn(s) are the wavelet coefficients, n is the time index describing the location of the wavelet in time, s is the wavelet scale, and δt is the sampling interval. The function ψ is the mother wavelet, and the asterisk (*) denotes its complex conjugate. The Morlet wavelet was used since it provides a good balance between time and frequency domains and is suitable when the purpose is to extract dominant signals (Grinsted et al., 2004). The statistical significance of the CWT was assessed against a red noise background at a 95 % confidence interval. The CWT function creates a cone of influence (COI) that delimitates a region of the WPS beyond which edge effects become important and the power could be suppressed (Torrence and Compo, 1998).
Wavelet analysis can also be used to identify the covariance between two time series. This can be done using the concept of wavelet coherence (Grinsted et al., 2004). Wavelet coherence (WCO) reveals local similarities between two time series and may be considered a local correlation coefficient in the time–frequency (time period) plane. For climatological time series, WCO can be used to identify their possible teleconnection with large-scale atmospheric drivers. The WCO between two time series can be computed by normalizing and smoothing their cross wavelet spectrum:
where and represent the WPS of the time series {xi} and {yi}, respectively. The statistical significance (p<0.05) of the WCO is estimated using Monte Carlo methods with respect to a red-noise spectrum, resulting in significant periodicities of coherence delineated by significance contours. As in the CWT, regions outside of the COI should be interpreted with caution (Torrence and Compo, 1998).
3.1 Spatial structure of long-term climatic water balance
Figure 3 shows the average monthly (January–December) water surplus/deficit (mm) as defined in Eq. (1) for ANUSPLIN and CANGRD. It is evident that, apart from the Pacific/Atlantic maritime, most of the continental Canadian interior experienced moisture deficits, with the Prairie being the most affected region (this region also has the highest climatological Tmin and Tmax, and some of the least mean annual P during the study period – Fig. 2). Other than the coastal areas, there is a general east to west moisture deficit pattern, mostly determined by the P and T pattern. For comparison, 5.8 % (33.3 %) of CANGRD points experienced moisture surplus (deficit), and 4.3 % (41.6 %) for ANUSPLIN. This implies that ANUSPLIN showed a relatively higher tendency towards dryness relative to CANGRD.
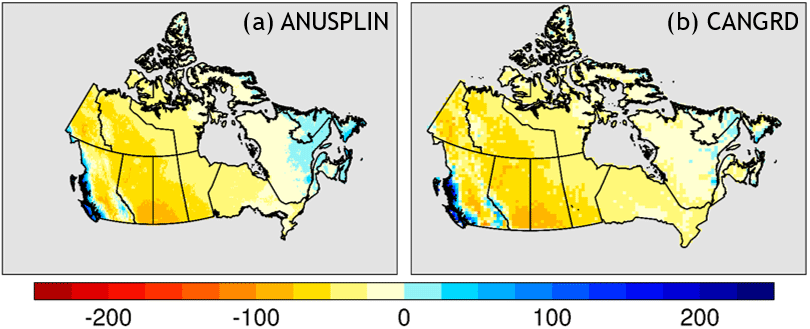
Figure 3Spatial structure of long-term mean monthly water surplus/deficit (mm), i.e. P-PET, derived from ANUSPLIN (a) and CANGRD (b).
Table 2Percentage of grids with decreasing (Dec.) and increasing (Inc.) trends for the SPEI.
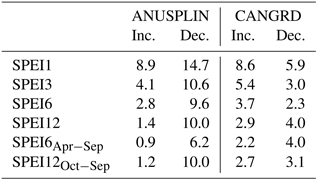
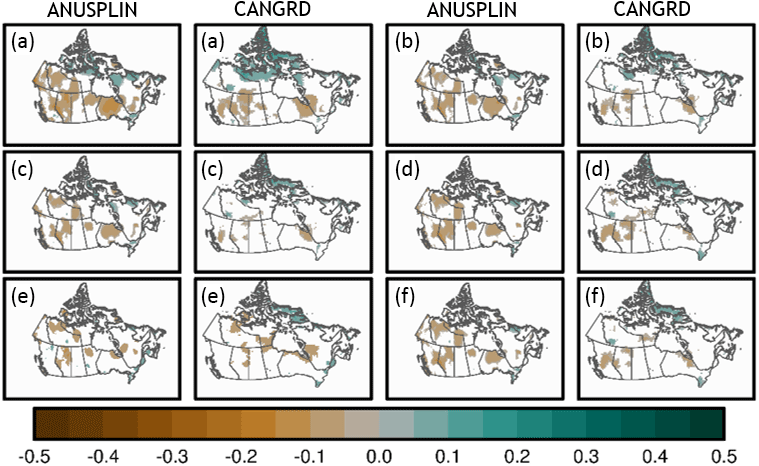
Figure 4Trends in SPEI at each grid point for ANUSPLIN and CANGRD. Only significant values are shown on the map. Brown indicates decreasing and green is increasing. (a) SPEI at 1 month, (b) SPEI at 3 months, (c) SPEI at 6 months, (d) SPEI at 12 months, (e) SPEI at 6 months from Apr–Sep, and (f) SPEI at 12 months of the water/hydrologic year, i.e. Oct–Sep. Trends are significant at 95 % confidence level.
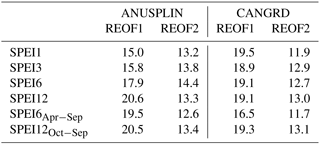
Table 3Percentage of variance explained by the first two varimax rotated loadings (REOFs) of the SPEI at various timescales, computed using observations from ANUSPLIN and CANGRD data sets.
3.2 Long-term trends
Figure 4 depicts the spatial structure of long-term (1950–2013) SPEI trends at various timescales. Only grid points with significant trends are shown. It is noteworthy that significant trends largely occur in spatially isolated blocks. Decreasing trends are observable in the southern parts of the Prairies, the foothills of the Rocky Mountains, and Pacific maritime regions, whereas increasing trends are limited to a small area in the north and parts of the Atlantic coast to the east, similar to the water balance shown in Fig. 3.
Table 2 shows the percentage of grids with decreasing and increasing trends for ANUSPLIN and CANGRD. For both data sets, the percentage generally decreases with increasing SPEI timescale. ANUSPLIN has a higher tendency towards dryness (decreasing trends) unlike CANGRD. Using SPEI12 as an example, 10 % of ANUSPLIN pixels experienced decreasing trends compared to 4 % in the case of CANGRD. Conversely, apart from SPEI1, CANGRD showed a strong tendency towards wetness (increasing trends) relative to ANUSPLIN. These differences can be attributed partly to the inputs (e.g. the number of stations considered for gridding ANUSPLIN is larger than the number of stations of the CANGRD dataset), estimation methods, and spatial resolution, which are different for both data sets (see Sect. 2.2).
3.3 Spatial patterns of drought
Concerning the EOF analysis, and taking into account the percentage of variance explained by each rotated component (REOF), two main patterns were identified for subsequent discussion and analysis. Table 3 presents the explained variances of varimax rotated components relative to the considered SPEI timescales and data sets. The first two components (for both data sets) explain about 28 to 33.9 % of the total variance depending on the timescale, with the minimum and maximum variances observed for SPEI1 and SPEI12, respectively, in the case of ANUSPLIN. For CANGRD, SPEI6Apr−Sep and SPEI12 explained the minimum and maximum variances, respectively.
Figure 5 shows that between the two main components (REOF), the regions with higher correlations (>0.7) do not overlap, with clearly spatially disjunctive structure. For all SPEI timescales, the loading patterns of the first component (REOF1) with a maximum explained temporal variance of 20.6 % (SPEI12, ANUSPLIN) and 19.5 % (SPEI1, CANGRD) highlights mainly the drought evolution on the interior Prairie ecozone of Canada. This semi-arid region is relatively low-lying and characterized by high hydroclimate variability and some of the least annual mean P. The second component (REOF2) explains a maximum variance of around 13.8 % (SPEI3) in the case of ANUSPLIN and 13.1 % (SPEI12Oct−Sep) for CANGRD. REOF2 is mainly representative of the northern central part of Canada (with the least annual mean P), including the Taiga Shield, Taiga Plains, Southern Arctic, and Taiga Cordillera ecozones, with positive correlations across all timescales and data sets. In summary, the foregoing analyses suggest that the Prairies and northern central regions are the leading droughts modes for Canada, in that they are well captured by the two data sets, with high positive loadings at all investigated timescales.
3.4 Temporal drought characteristics
The RPCs of REOF1 and REOF2 for ANUSPLIN and CANGRD, as well as correlation coefficients between the data sets, are shown in Fig. 6. It is evident that the RPCs from the two data sets are strongly correlated (cor>0.75) for all SPEI timescales, except for RPC2 of SPEI3 where cor=0.45 (the centroids of SPEI3 REOF2 in Fig. 5 are slightly different for both data sets). The primary focus is on SPEI6Apr−Sep and SPEI12Oct−Sep, which reflect the agricultural season (when droughts are most critical for rain-fed and irrigated agriculture) and hydrological year in Canada, respectively. Fig. 6 reveals that the Prairies (REOF1 and RPC1) experienced moderate to extreme (Table 1) drought episodes starting in the mid-1950s, early and late 1960s, the 1970s and 1980s, the period from mid-1997–2005, and the summer of 2009. Some of the drought episodes were extremely dry and severe as they were prolonged in time such as the ones in the late 1970s, mid-1980s, and 1997–2005. These identified drought events correspond well with the findings of Bonsal et al. (2011a), who identified large-scale Prairie droughts in 1961, 1967, 1988, and 2001 using ANUSPLIN and CANGRD data. In the northern central region (REOF2 and RPC2), although fewer droughts were detected for the hydrological year (SPEI12Oct−Sep), with the most intense occurring in 2000 (based on the ANUSPLIN data set), the seasonal SPEI series (SPEI6Apr−Sep) detected several drought events in this region. Extremely dry episodes in this region occurred in the early 1960s, 1980s, early 1990s, and 2000s.
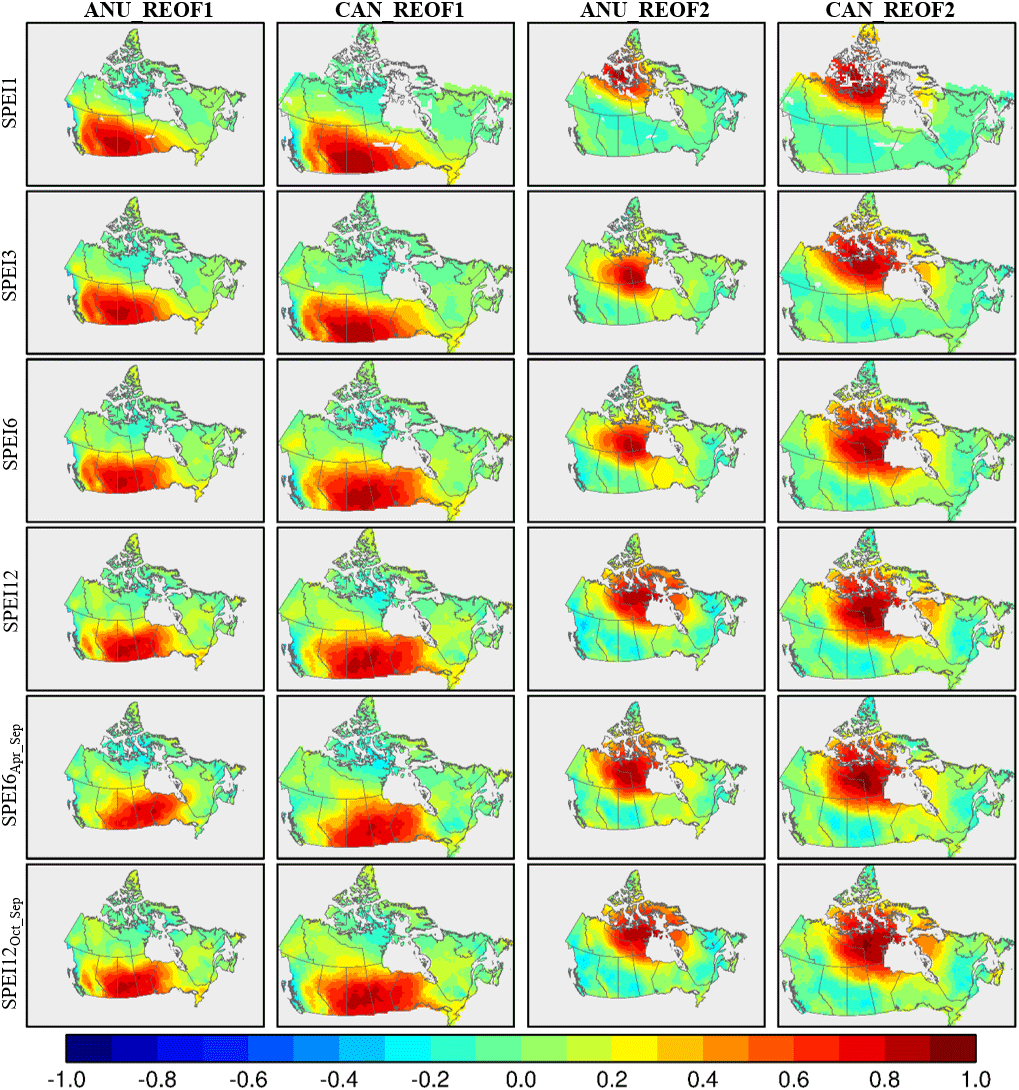
Figure 5Spatial patterns of the first two REOFs of SPEI at various timescales. The spatial extent of the first two REOFs was characterized by mapping the values of the factorial matrix. See Table 3 for information on variances explained by each REOF pattern.
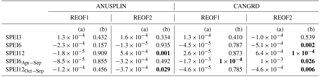
Linear trends of the RPCs for the two subregions are depicted in Fig. 7 and Table 4. For the Prairie subregion, both ANUSPLIN and CANGRD showed insignificant decreasing trends for SPEI6, SPEI6Apr−Sep, and SPEI12Oct−Sep. However, in the northern central region, the trend direction is not the same for both data sets at all SPEI timescales. For ANUSPLIN (CANGRD), decreasing (increasing) trends are found in SPEI6Apr−Sep. Conversely, CANGRD (ANUSPLIN) shows decreasing (increasing) trends in SPEI3. Regionally, the SPEI at different timescales tends to display more significant trends in the northern central relative to the Prairies. Most of the trends are significant in the case of CANGRD compared to ANUSPLIN. The apparent differences in trends between the two data sets and subregions may be attributed to the low station density in areas above 60∘ N which can introduce higher uncertainty in the gridded P and T fields (Vincent et al., 2015).
Table 4Long-term (1950–2013) trends of monthly time series (RPCs) for the first two REOFs of SPEI at various timescales. The slope year−1 (a) and p value (b) is indicated, with significant (p<0.05) trends shown in bold.
3.5 Frequency estimation/periodicity of drought
To detect the dominant frequencies in the RPCs of the SPEI series in Fig. 6, the time series were further analyzed using a CWT. The wavelet power spectrum (WPS) of the RPCs is shown in Fig. 8. Periodicities of drought will be identified for SPEI6Apr−Sep and SPEI12Oct−Sep and their relationship to teleconnection indices examined. These two timescales correspond to the warm season and water year, respectively, and represent periods when moisture shortages are most critical for various sectors in Canada. Other SPEI timescales which explain sub-annual variability are included in Fig. 8 for the interested reader. For SPEI6Apr−Sep, from the WPS of RPC1 in Fig. 8, significant inter-annual variability of between 8 and 32 months is evident throughout much of the entire lengths of the SPEI time series. However, it is concentrated most heavily during the mid-1950s, early and late 1960s, the 1970s and 1980s, and the period from mid-1997–2010. For SPEI12Oct−Sep, a strong frequency band is centred mostly around 16–66 months (∼4 years) and is concentrated during the mid-1950s and late 1960s. Moreover, 32–64-month frequencies are dominant in the mid-1980s and the years between 1990 and 2010.
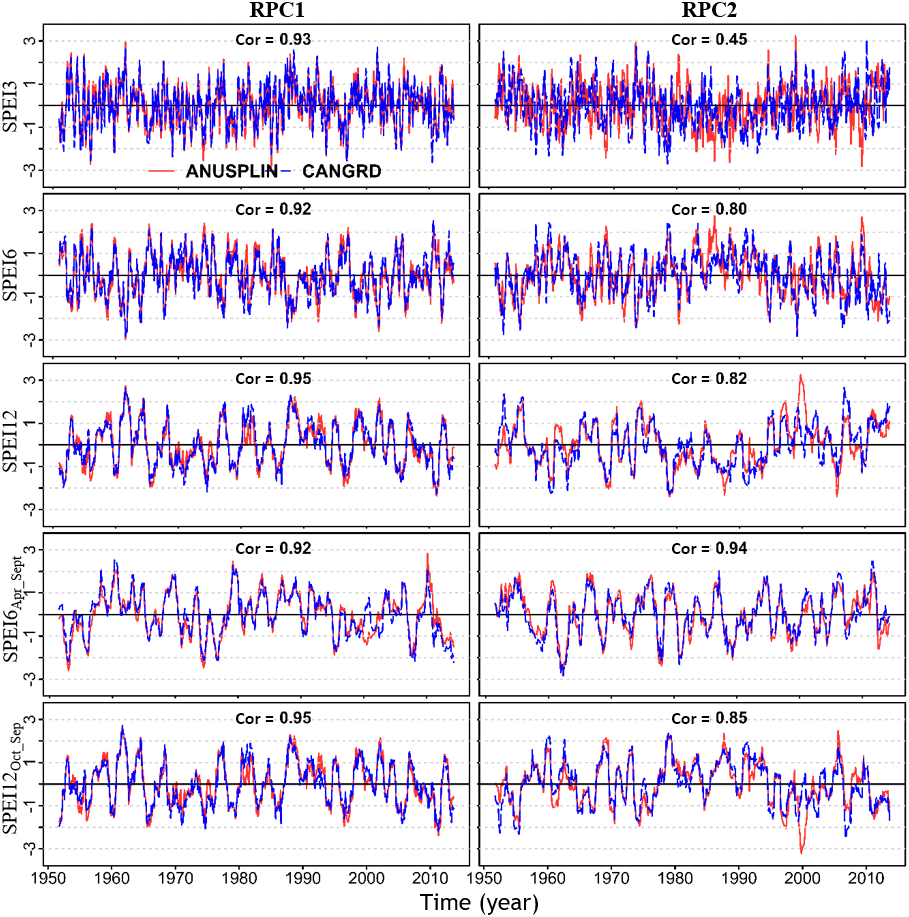
Figure 6Temporal patterns (RPCs) of the first two rotated principal components (REOFs) of SPEI at various timescales. Indicated within each box is the pattern correlation between ANUSPLIN and CANGRD.
In the northern central region (RPC2), for SPEI6Apr−Sep, a significant periodicity of a cycle of between 8 and 40 months as a dominant period of variability is evident. It is concentrated in the early 1960s, 1980s, late 1990s, and 2000s. For SPEI12Oct−Sep, the WPS indicates a significant high power for relatively low-frequency (16–100 months, i.e. ∼ 7 years) signals, concentrated over the period 1956–1975 and 1995–2013. The foregoing analysis reveals that the Prairie region (REOF1) of Canada is dominated by high-frequency power signals with high cycles of oscillation for both SPEI6Apr−Sep and SPEI12Oct−Sep, while the northern central region (REOF2) is dominated by relatively low-frequency power signals and low cycles of oscillation. The analysis further indicates that significant inter-annual periodicities (<10 years) dominate drought variability over the two identified subregions across Canada. The dominant periodicities and the intervals during which they occurred are summarized in Table 5.
Table 5Dominant periods and the intervals of significant variance for SPEI6Apr−Sep and SPEI12Oct−Sep during 1950–2013.
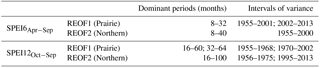
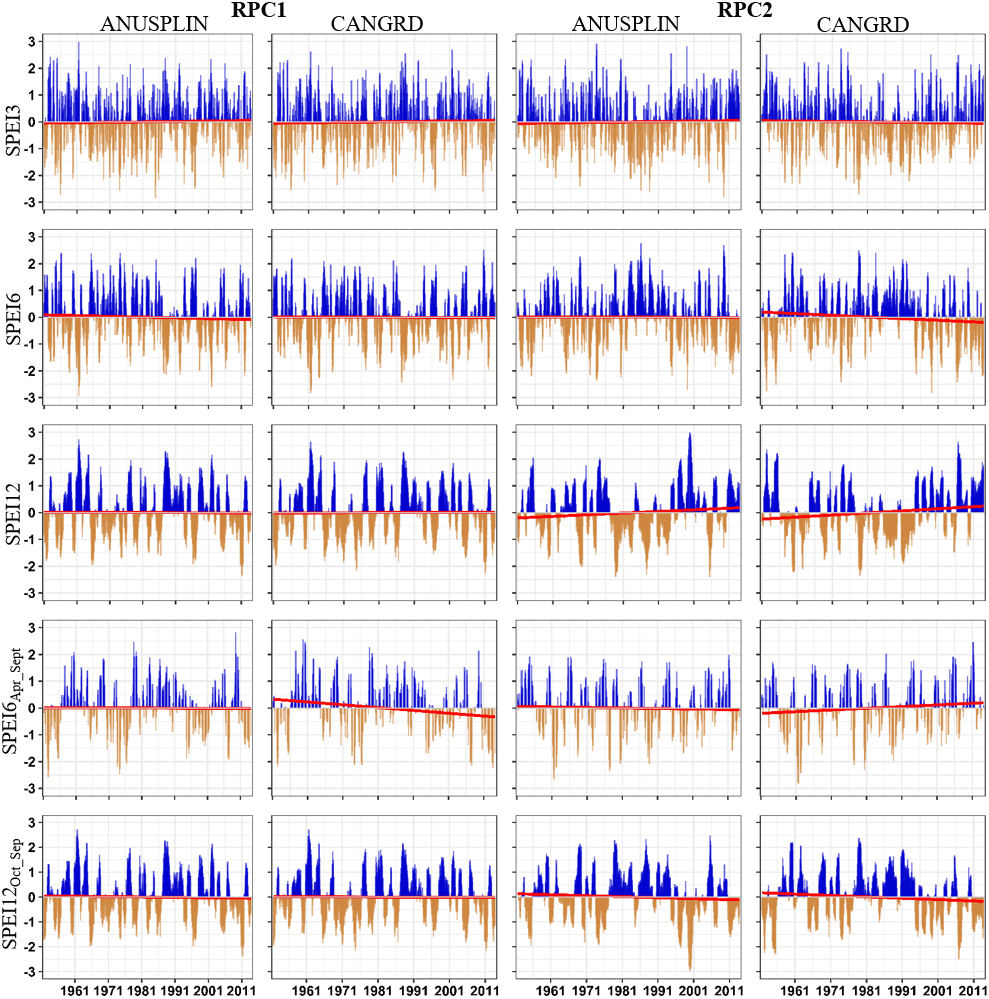
Figure 7Long-term (1950–2013) trends (red line) of the RPCs for each drought subregion and data set.
3.6 Coherence between drought and large-scale climate drivers

Figure 8Wavelet power spectrum of the time series (RPCs) shown in Fig. 6. The black contour designates the 95 % confidence level against red noise, and the cone of influence (COI), where edge effects might distort the picture, is shown as a lighter grey shade.
The WCO technique was used to identify both frequency bands and time intervals at which SPEI6Apr−Sep and SPEI12Oct−Sep, and large-scale climate indices are co-varying (Torrence and Webster, 1999). The results of WCO coefficients between the RPCs of SPEI6Apr−Sep and SPEI12Oct−Sep and teleconnection indices are shown in Figs. 9–11. In these plots, the coloured shading represents the magnitude in the coherence as shown in the colour bar, which varies from 0 to 1 and indicates the timescale variability in the correlation between the two time series. As in Fig. 8, the black contours represent the significant regions. The relative phase relationships are shown as arrows, with in phase pointing right (positive correlation) and antiphase pointing left (negative correlation), whereas a vertical upward (downward) arrow indicates that the second time series lags (leads) the first in phase by 90∘. If an association exists between two time series, a slowly varying phase lag would be expected, and the phenomenon would be phase-locked; i.e. the phase arrows point only in one direction for a given wavelength (Grinsted et al., 2004; Gobena and Gan, 2006). For this study, phase angle associations were noted strictly as either being in-phase-locked or antiphase-locked. To simplify and limit the length of the paper, only results for large-scale climate indices with the strongest correlations with frequencies of drought are shown. Other results are included as supplementary material.
Figure 9 illustrates the squared WCO between the temporal patterns of drought and MEI. It is apparent that, for SPEI6Apr−Sep, the MEI had significant coherence with PC1 mainly concentrated in the 8–16-month band and from 1960–1980 in the Prairie region, indicating that the two time series are phase-locked over this time interval. Also, the strongest coherence between PC1 and MEI occurred over the 32–50-month scale, spanning the period 1986–2002. In the case of SPEI6Apr−Sep PC2 (northern central region), discontinuous in-phase coherence patterns were detected in the 2–32-month bands. The dominant high energy coherence occurred in the 16–32-month scale, spanning the period 1985–2005. Similarly, for the hydrological year timescale (SPEI12Oct−Sep), drought in the Prairies (SPEI12Oct−SepPC1) experienced significant high power with the MEI at the 16–32-month scale from 1980 to 2005 based on ANUSPLIN (1986–2005 based on CANGRD), whereas in the northern central region (SPEI12Oct−SepPC2), significant in-phase cross power between drought and the MEI occurred in the 32–64-month period over the years 1978–2000 (in the case of ANUSPLIN). As in Fig. 8, it can be seen that the Prairie region has more short-term periodicities compared to the northern central region. It is also evident that although the MEI co-varied with drought events, the frequency is higher but shorter lived in the Prairies relative to the northern central region.
Figure 10 shows that for both the seasonal (SPEI6Apr−Sep) and annual (SPEI12Oct−Sep) drought time series, sporadic but significant coherence is observed intermittently from year to year with the PDO. For SPEI6Apr−Sep, dominant strong coherence occurred between 16 and 32 months over the period 1988–2003 for the Prairies region, whereas fluctuations were intermittently observed between 1955 and 2000 for SPEI12Oct−Sep over the Prairie and northern central regions ranging from 16 to 64 months. Unlike the PDO, the PNA showed a strong in-phase relationship with drought over Canada (Fig. 11). It is apparent that the PNA co-varied significantly with SPEI6Apr−SepPC1 over most of the years during the study period. Oscillations in the PNA are manifested in the SPEI6Apr−SepPC1 on wavelengths varying from 2 to 108 months (∼9 years), suggesting that the PNA actively mirrors SPEI6Apr−SepPC1. Particularly, the PNA was phase-locked with drought during the period 1980–2001 at the 16–32-month scale. Apart from the late 1990s and early 2000s at the 8–16 month scale, no significant coherence was found between the PNA and SPEI6Apr−SepPC2. Although with less coherence relative to SPEI6Apr−Sep, the PNA also co-varied with SPEI12Oct−Sep, more so for the northern Central region compared to the Prairie region. In the Prairie region, the strongest coherence between SPEI12Oct−SepPC1 and the PNA occurred over the 16–32-month scale, while for the northern central region, significant cross power between the PNA and SPEI12OctApr−SepPC2 occurred over the 32–64-month scale, spanning the periods 1960–1973 and 1985–2000.
The relationship between drought and the AMO is shown in Fig. S3. It is clear that the AMO did not co-vary with SPEI6Apr−Sep over both homogenous drought regions. However, it is important to note that Shabbar and Skinner (2004) found a significant correlation pattern between the winter AMO index and following summer PDSI in the north of the Prairies province. Here, we only made use of the AMO index for the months April–September of each year. For SPEI12Oct−Sep, significant and high energy existed for the Prairie region only (SPEI12Oct−SepPC1), mainly distributed in the 8–64-month (∼5 years) band and spanning the period 1970–2005. For the AO (Fig. S4), in-phase significant coherence existed with SPEI6Apr−Sep PC2 and SPEI12Oct−SepPC1. In the northern central region (SPEI6Apr−Sep PC2), 16–32-month high-energy regions were found over the period 1963–1978, and 8–16-month significant coherence also existed from 1994 to 2002. In the Prairie region (SPEI12Oct−SepPC1), drought was in phase with the AO especially from 1981 to 2003, where significant cross power and coherence were mainly concentrated in the 64–128-month band (based on CANGRD). The results further indicate that the AO was in antiphase with SPEI6Apr−Sep PC1 and SPEI12Oct−SepPC2 during the study period from 1950 to 2013. In terms of the NAO (Fig. S5), sporadic significant coherence is noticed with the seasonal SPEI6Apr−Sep at a higher frequency, ranging between 4 and 20 months and mainly concentrated over the period 1975–1990. There is also statistically significant in-phase coherence between SPEI12Oct−SepPC1 and the NAO in the 70–128-month band in the late 1970s–late 1990s, based on CANGRD.
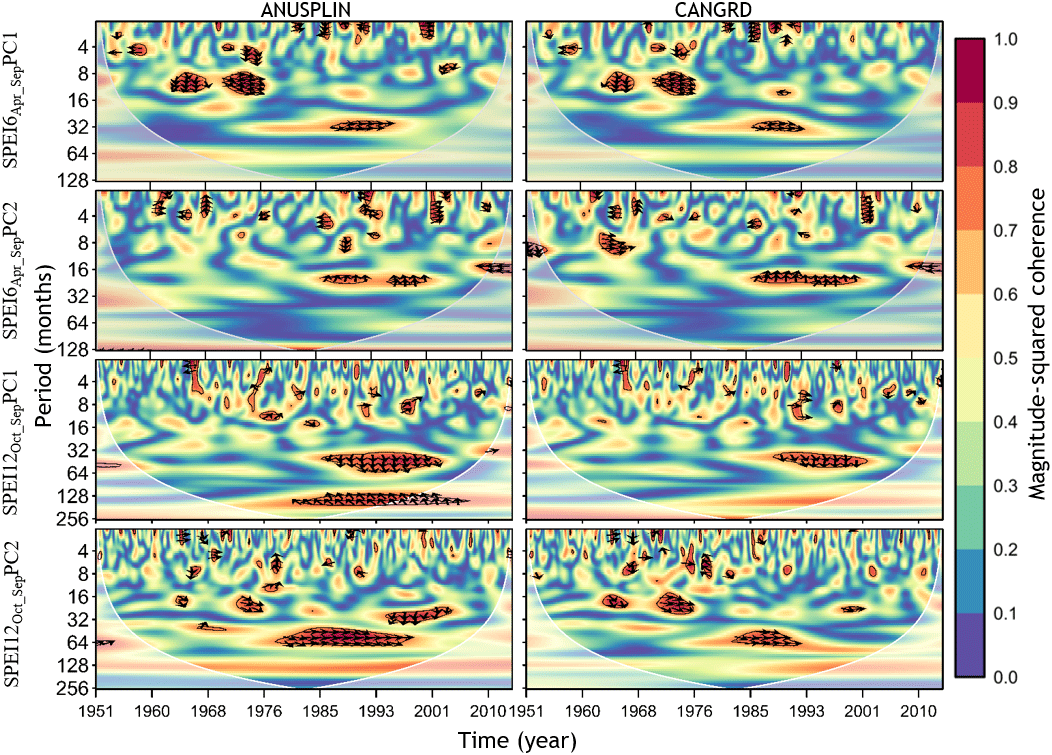
Figure 9Squared wavelet coherence between the MEI and the temporal patterns of drought (SPEI6Apr−Sep and SPEI12Oct−Sep). Phase arrows pointing right indicate signals are in phase, whereas left-pointing arrows indicate an antiphase relationship. Arrows deviating from the horizontal are indicative of lead–lag relationships between the two signals. The black contour designates the 95 % confidence level against red noise, and the cone of influence (COI), where edge effects might distort the picture, is shown as a lighter grey shade.
The foregoing analysis has shown significant covariance between drought variability over Canada and large-scale climate indices, especially the MEI, PNA and PDO. This is in line with previous studies (e.g. Bonsal and Shabbar, 2008, Fleming and Quilty, 2006, Tremblay et al., 2011, and Perez-Valdivia et al., 2012) that have established links between Canadian hydroclimate and teleconnection indices. Furthermore, one should expect most of the climate indices to yield similar findings given that they appear to be interrelated at several timescales (Sheridan, 2003; Gan et al., 2007; Ng and Chan, 2012). We recommend that future studies examine the degree to which such interrelations can affect the findings reported here by eliminating, for example, the influence of the PDO on the MEI via partial wavelet coherence analysis (Ng and Chan, 2012). Also, a lead/lag response of the identified drought frequencies as well their correlations to positive and negative phases of various teleconnections constitute an area for future research. In addition, only one PET estimation method was used in this study and its selection was constrained by data availability during the study period. We recommend the use of other simple or complex methods to calculate PET and assess their impact on drought analysis over Canada since the Hargreaves method has been known to underestimate PET relative to the Penman–Monteith method (McMahon et al., 2013). Furthermore, the Hargreaves method responds only to changes in temperature and can lead to misleading results under global warming. For example, Sheffield et al. (2012) found little change in global drought over the past 60 years (1950–2008). In terms of data sources, the findings reported here should be validated against other data sets such as long-term satellite products as they become available.
This study performs a comprehensive analysis of historical droughts over the whole of Canada, considering the role of teleconnections by analyzing different monthly P and T products for the period 1950–2013. SPEI, a climatological drought index, is applied over various temporal scales to evaluate various drought characteristics such as trends, spatio-temporal patterns of long-term change, inter/intra-annual variability, and periodicity/frequency. In addition, potential prominent modes of low-frequency variability such as the PNA, AO, MEI, PDO, AMO, and NAO which are well established to influence the hydroclimate of Canada and North America are investigated as precursors to historical drought occurrence. The main conclusions from the analyses are given in the following.
Apart from the Pacific/Atlantic maritime regions, most of the continental Canadian interior experienced moisture deficits, with the Prairie region being the most affected region between 1950 and 2013. Based on a trend analysis derived from the water balance, significant decreasing trends in SPEI values are observed in the southern Prairies, the foothills of the Rocky Mountains, and Pacific maritime regions, whereas increasing trends are limited to a small area in the north and parts of the Atlantic coast to the east. Therefore, southern parts of the country showed a trend towards drier conditions and vice versa for the northern regions. Note that the northern region (above 60∘ N) has lower station density and as such higher uncertainty in the gridded P and T fields.
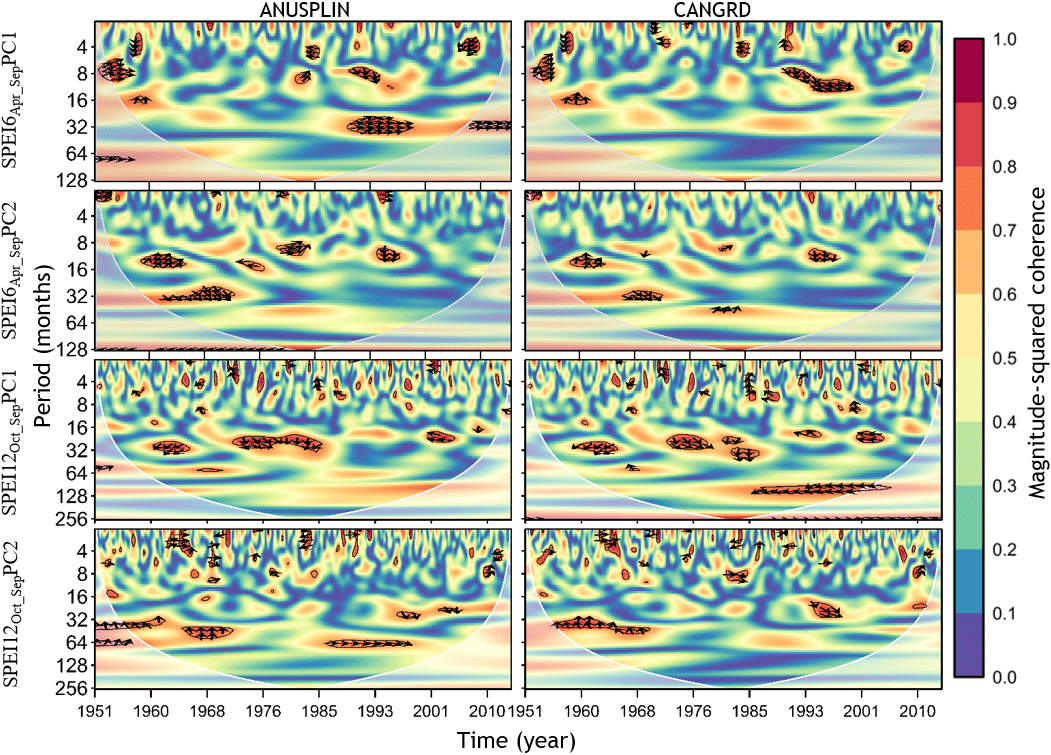
Figure 10Squared wavelet coherence between the PDO and the temporal patterns of drought (SPEI6Apr−Sep and SPEI12Oct−Sep). Phase arrows pointing right indicate signals are in phase, whereas left-pointing arrows indicate an antiphase relationship. Arrows deviating from the horizontal are indicative of lead–lag relationships between the two signals. The black contour designates the 95 % confidence level against red noise, and the cone of influence (COI), where edge effects might distort the picture, is shown as a lighter grey shade.
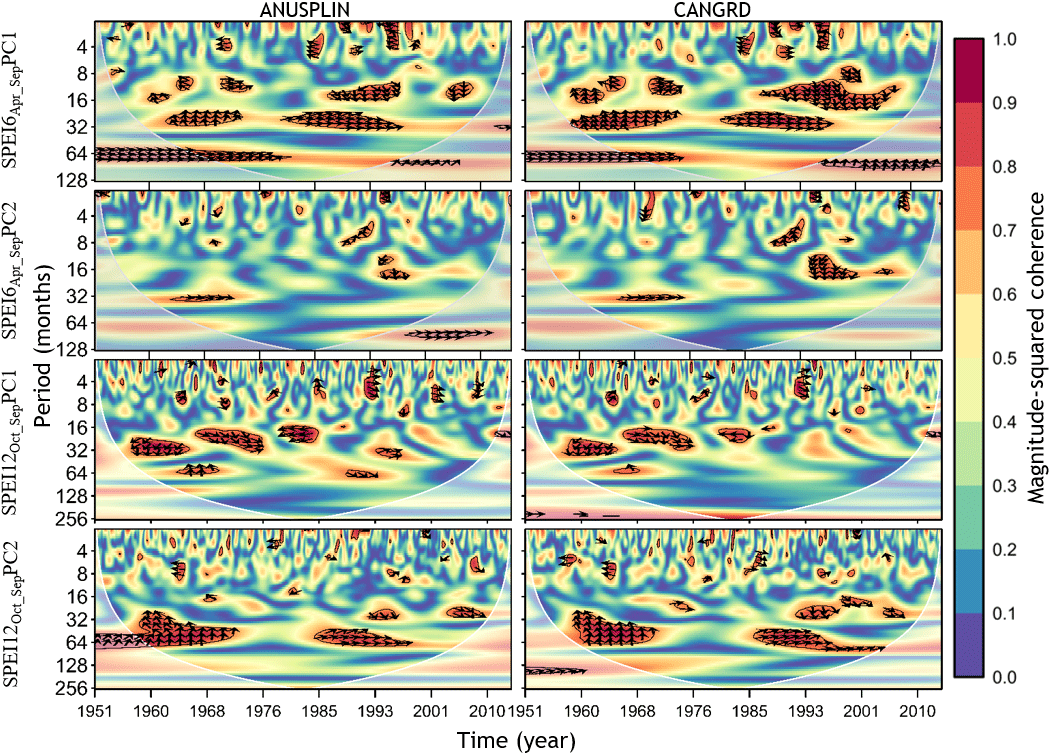
Figure 11Squared wavelet coherence between the PNA and the temporal patterns of drought (SPEI6Apr−Sep and SPEI12Oct−Sep). Phase arrows pointing right indicate signals are in phase, whereas left-pointing arrows indicate an antiphase relationship. Arrows deviating from the horizontal are indicative of lead–lag relationships between the two signals. The black contour designates the 95 % confidence level against red noise, and the cone of influence (COI), where edge effects might distort the picture, is shown as a lighter grey shade.
EOF identifies two main spatially disjunctive subregions of drought variability over Canada – the Prairies and northern central Canada. Based on both seasonal (SPEI6Apr−Sep) and annual (SPEI12Oct−Sep) SPEI values, the Prairie subregion experienced moderate to extreme droughts episodes starting in the mid-1950s, early and late 1960s, the 1970s and 1980s, the period from mid-1997–2005, and the summer of 2009. Some of the drought episodes were extremely dry and severe as they were prolonged in time such as the ones in the late 1970s, mid-1980s, and 1997–2005. In the northern central region, although fewer (likely due to below 0 temperatures for most of the cold season) droughts were detected for the hydrological year (SPEI12Oct−Sep), with the most intense occurring in 2000, the seasonal SPEI series (SPEI6Apr−Sep) detected extremely dry episodes in this region in the early 1960s, 1980s, early 1990s, and 2000s. However, drought variability in the Prairies in particular experienced largely insignificant trends, a finding similar to numerous previous studies.
Wavelet analysis was particularly useful to detect periodical signals in the SPEI time series patterns for each subregion. For SPEI6Apr−Sep, the analysis reveals clearly the presence of a dominant periodicity of between 8 and 32 months, persisting approximately from 1955 to 2001 in the Prairie region, while in the North central region, a significant periodicity of a cycle between 8 and 40 months as a dominant period of variability spanning the years 1955–2000 is apparent. For SPEI12Oct−Sep, a strong power frequency band over the Prairie region, centred mostly around 16–66 months (∼4 years) and spanning the period 1955–1968 is found. Moreover, 32–64-month periodic high-power signals are dominant during the years 1970–2002. In the northern central region, a significant high power for relatively low-frequency (16–100 months, i.e. ∼7 years), spanning the period 1956–1975 and 1995–2013, is detected. Therefore, the Prairie region of Canada is dominated by high-frequency (i.e. more frequent and shorter cycles of dry events) power signals for both SPEI6Apr−Sep and SPEI12Oct−Sep, while the northern central region is dominated by low-frequency (i.e. less frequent cycles of dry events) power signals. The analysis further indicates that significant inter-annual periodicities (with a period of <10 years) dominate drought variability over the two identified major regions of drought variability across Canada.
The identified drought short-time (long-time) inter-annual periodicities in the Prairie (northern central region) are likely associated with the immediate and significant influence of the MEI and PNA in particular, as these large-scale climate indices have maximum regions with a 5 % significance level in the WCO plots. For the MEI index, 8–16 and 32–50 months were the most predominant and effective periods for drought occurrence in Canada, while for the PNA, the 2–108-month period was the most predominant over the Prairie region and for SPEI6Apr−Sep compared with the northern central region. For SPEI12Oct−Sep, the PNA showed more coherence with drought at the 32–64-month scale.
The foregoing analysis has indicated the need to consider various observational data sets in drought characterization, given the uncertainty in data. In terms of trends, the ANUSPLIN data set indicated a higher tendency for drought over the study period relative to CANGRD. Furthermore, irrespective of the timescale of accumulation, ANUSPLIN tends to reveal more drought severity compared to CANGRD although the correlation between the time series of the two data sets from each of the homogenous drought subregions is very strong. Therefore, further applications using other gridded data sets to verify the role played by the spatial resolution of the input data on regional drought patterns are recommended. The identification of these subregions with similar drought variability and characteristics can be useful for drought risk management at a regional scale in Canada. Two of the most important river basins are both in the Prairies region (Saskatchewan River basin) and northern region (MacKenzie River basin). Lastly, this study is the first of its kind to identify dominant periodicities in drought variability over the whole of Canada in terms of when the drought events occur, their duration, and how often they do so over the Prairies and northern central regions.
The data utilized in this study are available from various sources. ANUSPLIN data are currently freely available online through Natural Resources Canada at https://cfs.nrcan.gc.ca/projects/3/3 (Natural Resources Canada, 2018; McKenney et al., 2011). CANGRD data are freely available through Environment and Climate Change Canada at https://open.canada.ca/data/en/dataset/3d4b68a5-13bc-48bb-ad10-801128aa6604 (Environment and Climate Change Canada, 2018). The monthly teleconnection indices can be downloaded from https://www.esrl.noaa.gov/psd/ (U.S. Department of Commerce, 2018).
The supplement related to this article is available online at: https://doi.org/10.5194/hess-22-3105-2018-supplement.
The authors declare that they have no conflict of interest.
This article is part of the special issue “Understanding and predicting Earth system and hydrological change in cold regions”. It is not associated with a conference.
The authors are thankful to Environment and Climate Change Canada and
Natural Resources Canada for making the datasets freely available to the
scientific community. We would like to thank two anonymous referees and John
Hanesiak, the editor, for their contributions that have led to a significantly
improved manuscript.
Edited by: John
Hanesiak
Reviewed by: two anonymous referees
Addison, P. S.: The Illustrated Wavelet Transform Handbook: Introductory Theory and Applications in Science, Engineering, Medicine and Finance, Second Edition, CRC Press, Taylor & Francis Group, Boca Raton, Florida, USA, 2016.
Asong, Z. E., Khaliq, M. N., and Wheater, H. S.: Regionalization of precipitation characteristics in the Canadian Prairie Provinces using large-scale atmospheric covariates and geophysical attributes, Stoch. Env. Res. Risk A., 29, 875–892, https://doi.org/10.1007/s00477-014-0918-z, 2015.
Asong, Z. E., Khaliq, M. N., and Wheater, H. S.: Multisite multivariate modeling of daily precipitation and temperature in the Canadian Prairie Provinces using generalized linear models, Clim. Dynam., 47, 2901–2921, https://doi.org/10.1007/s00382-016-3004-z, 2016.
Asong, Z. E., Razavi, S., Wheater, H. S., and Wong, J. S.: Evaluation of Integrated Multi-satellitE Retrievals for GPM (IMERG) over Southern Canada against Ground Precipitation Observations: A Preliminary Assessment, J. Hydrometeorol., 18, 1033–1050, https://doi.org/10.1175/jhm-d-16-0187.1, 2017.
Barnston, A. G. and Livezey, R. E.: Classification, Seasonality and Persistence of Low-Frequency Atmospheric Circulation Patterns, Mon. Weather Rev., 115, 1083–1126, https://doi.org/10.1175/1520-0493(1987)115<1083:csapol>2.0.co;2, 1987.
Beguería, S., Vicente-Serrano, S. M., Reig, F., and Latorre, B.: Standardized precipitation evapotranspiration index (SPEI) revisited: parameter fitting, evapotranspiration models, tools, datasets and drought monitoring, Int. J. Climatol., 34, 3001–3023, 10.1002/joc.3887, 2014.
Bonsal, B. and Regier, M.: Historical comparison of the 2001/2002 drought in the Canadian Prairies, Climate Res., 33, 229–242, 2007.
Bonsal, B. and Shabbar, A.: Impacts of large-scale circulation variability on low streamflows over Canada: a review, Can. Water Resour. J., 33, 137–154, 2008.
Bonsal, B., Zhang, X., and Hogg, W.: Canadian Prairie growing season precipitation variability and associated atmospheric circulation, Climate Res., 11, 191–208, 1999.
Bonsal, B., Shabbar, A., and Higuchi, K.: Impacts of low frequency variability modes on Canadian winter temperature, Int. J. Climatol., 21, 95–108, https://doi.org/10.1002/joc.590, 2001.
Bonsal, B., Aider, R., Gachon, P., and Lapp, S.: An assessment of Canadian prairie drought: past, present, and future, Clim. Dynam., 41, 501–516, https://doi.org/10.1007/s00382-012-1422-0, 2013.
Bonsal, B. R., Wheaton, E. E., Meinert, A., and Siemens, E.: Characterizing the Surface Features of the 1999–2005 Canadian Prairie Drought in Relation to Previous Severe Twentieth Century Events, Atmos. Ocean., 49, 320–338, https://doi.org/10.1080/07055900.2011.594024, 2011a.
Bonsal, B., Wheaton, E., Meinert, A., and Siemens, E.: Characterizing the Surface Features of the 1999–2005 Canadian Prairie Drought in Relation to Previous Severe Twentieth Century Events, Atmos. Ocean., 49, 320–338, https://doi.org/10.1080/07055900.2011.594024, 2011b.
Brown, R. D. and Braaten, R. O.: Spatial and temporal variability of Canadian monthly snow depths, 1946–1995, Atmos. Ocean., 36, 37–54, https://doi.org/10.1080/07055900.1998.9649605, 1998.
Bryant, E. A.: Natural Hazards, University of Cambridge, Cambridge, UK, 2005.
Côté, J., Gravel, S., Méthot, A., Patoine, A., Roch, M., and Staniforth, A.: The Operational CMC–MRB Global Environmental Multiscale (GEM) Model. Part I: Design Considerations and Formulation, Mon. Weather Rev., 126, 1373–1395, https://doi.org/10.1175/1520-0493(1998)126<1373:tocmge>2.0.co;2, 1998.
Council of Canadian Academies: Water and Agriculture in Canada: Towards Sustainable Management of Water Resources. Chapter 6–Building the Foundation for Sustainable Management of Water in Agriculture, available at: http://www.scienceadvice.ca/en/assessments/completed/water-agri.aspx (last access: 25 April 2018), 2013.
Dai, A.: Drought under global warming: a review, Wiley Interdisciplinary Reviews: Climate Change, 2, 45–65, https://doi.org/10.1002/wcc.81, 2011.
Dibike, Y., Prowse, T., Bonsal, B., and O'Neil, H.: Implications of future climate on water availability in the western Canadian river basins, Int. J. Climatol., 37, 3247–3263, https://doi.org/10.1002/joc.4912, 2016.
Dibike, Y., Prowse, T., Bonsal, B., and O'Neil, H.: Implications of future climate on water availability in the western Canadian river basins, Int. J. Climatol., 37, 3247–3263, https://doi.org/10.1002/joc.4912, 2017.
Dracup, J. A., Lee, K. S., and Paulson, E. G.: On the definition of droughts, Water Resour. Res., 16, 297–302, https://doi.org/10.1029/WR016i002p00297, 1980.
Enfield, D. B., Mestas-Nuñez, A. M., and Trimble, P. J.: The Atlantic Multidecadal Oscillation and its relation to rainfall and river flows in the continental U.S, Geophys. Res. Let., 28, 2077–2080, https://doi.org/10.1029/2000GL012745, 2001.
Environment and Climate Change Canada: Canadian Gridded Temperature and Precipitation Anomalies CANGRD, available at: https://open.canada.ca/data/en/dataset/3d4b68a5-13bc-48bb-ad10-801128aa6604, last access: 25 April 2018.
Fleming, S. W. and Quilty, E. J.: Aquifer Responses to El Niño–Southern Oscillation, Southwest British Columbia, Ground Water, 44, 595–599, https://doi.org/10.1111/j.1745-6584.2006.00187.x, 2006.
Fugal, D. L.: Conceptual Wavelets in Digital Signal Processing: An In-depth, Practical Approach for the Non-mathematician, Space & Signals Technical Pub., University of California, USA, 2009.
Gan, T. Y., Gobena, A. K., and Wang, Q.: Precipitation of southwestern Canada: Wavelet, scaling, multifractal analysis, and teleconnection to climate anomalies, J. Geophys. Res.-Atmos., 112, D10110, https://doi.org/10.1029/2006JD007157, 2007.
Gandin, L. S.: Objective analysis of meteorological fields. By L. S. Gandin. Translated from the Russian. Jerusalem (Israel Program for Scientific Translations), 1965. Pp. vi, 242: 53 Figures; 28 Tables. £4 1s. 0d, Q. J. Roy. Meteor. Soc., 92, 447–447, https://doi.org/10.1002/qj.49709239320, 1966.
Gobena, A. K. and Gan, T. Y.: Low-frequency variability in Southwestern Canadian stream flow: links with large-scale climate anomalies, Int. J. Climatol., 26, 1843–1869, https://doi.org/10.1002/joc.1336, 2006.
Grinsted, A., Moore, J. C., and Jevrejeva, S.: Application of the cross wavelet transform and wavelet coherence to geophysical time series, Nonlin. Processes Geophys., 11, 561–566, https://doi.org/10.5194/npg-11-561-2004, 2004.
Hamed, K. H. and Rao, R. A.: A modified Mann-Kendall trend test for autocorrelated data, J. Hydrol., 204, 182–196, https://doi.org/10.1016/S0022-1694(97)00125-X, 1998.
Hannachi, A., Jolliffe, I. T., and Stephenson, D. B.: Empirical orthogonal functions and related techniques in atmospheric science: A review, Int. J. Climatol., 27, 1119–1152, https://doi.org/10.1002/joc.1499, 2007.
Hao, Z. and AghaKouchak, A.: Multivariate Standardized Drought Index: A parametric multi-index model, Adv. Water Resour., 57, 12–18, https://doi.org/10.1016/j.advwatres.2013.03.009, 2013.
Hao, Y., Liu, G., Li, H., Li, Z., Zhao, J., and J. Yeh, T.-C.: Investigation of karstic hydrological processes of Niangziguan Springs (North China) using wavelet analysis, Hydrol. Process., 26, 3062–3069, https://doi.org/10.1002/hyp.8265, 2012.
Hargreaves, G. H.: Defining and Using Reference Evapotranspiration, J. Irrig. Drain. E., 120, 1132–1139, https://doi.org/10.1061/(ASCE)0733-9437(1994)120:6(1132), 1994.
Hargreaves, G. L., Hargreaves, G. H., and Riley, J. P.: Agricultural Benefits for Senegal River Basin, J. Irrig. Drain. E., 111, 113–124, https://doi.org/10.1061/(ASCE)0733-9437(1985)111:2(113), 1985.
Hayes, M., Svoboda, M., Wall, N., and Widhalm, M.: The Lincoln Declaration on Drought Indices: Universal Meteorological Drought Index Recommended, B. Am. Meteorol. Soc., 92, 485–488, https://doi.org/10.1175/2010bams3103.1, 2011.
Hogg, E. H., Price, D. T., and Black, T. A.: Postulated Feedbacks of Deciduous Forest Phenology on Seasonal Climate Patterns in the Western Canadian Interior, J. Climate, 13, 4229–4243, https://doi.org/10.1175/1520-0442(2000)013<4229:pfodfp>2.0.co;2, 2000.
Hopkinson, R. F., McKenney, D. W., Milewska, E. J., Hutchinson, M. F., Papadopol, P., and Vincent, L. A.: Impact of Aligning Climatological Day on Gridding Daily Maximum–Minimum Temperature and Precipitation over Canada, J. Appl. Meteorol. Clim., 50, 1654–1665, https://doi.org/10.1175/2011jamc2684.1, 2011.
Hurrell, J. W. and Van Loon, H.: Decadal Variations In Climate Associated With The North Atlantic Oscillation, Climatic Change, 36, 301–326, https://doi.org/10.1023/a:1005314315270, 1997.
Hutchinson, M. F., McKenney, D. W., Lawrence, K., Pedlar, J. H., Hopkinson, R. F., Milewska, E., and Papadopol, P.: Development and Testing of Canada-Wide Interpolated Spatial Models of Daily Minimum–Maximum Temperature and Precipitation for 1961–2003, J. Appl. Meteorol. Clim., 48, 725–741, https://doi.org/10.1175/2008jamc1979.1, 2009.
IPCC: Climate Change 2013: The Physical Science Basis. Contribution of Working Group I to the Fifth Assessment Report of the Intergovernmental Panel on Climate Change, Cambridge University Press, Cambridge, UK and New York, NY, USA, 1535 pp., 2013.
Jiang, R., Gan, T. Y., Xie, J., and Wang, N.: Spatiotemporal variability of Alberta's seasonal precipitation, their teleconnection with large-scale climate anomalies and sea surface temperature, Int. J. Climatol., 34, 2899–2917, https://doi.org/10.1002/joc.3883, 2014.
Maidment, D. R.: Handbook of hydrology, McGraw-Hill, New York, 1993.
Mantua, N. J. and Hare, S. R.: The Pacific Decadal Oscillation, J. Oceanogr., 58, 35–44, https://doi.org/10.1023/a:1015820616384, 2002.
Masud, M. B., Khaliq, M. N., and Wheater, H. S.: Analysis of meteorological droughts for the Saskatchewan River Basin using univariate and bivariate approaches, J. Hydrol., 522, 452–466, https://doi.org/10.1016/j.jhydrol.2014.12.058, 2015.
Masud, M. B., Khaliq, M. N., and Wheater, H. S.: Future changes to drought characteristics over the Canadian Prairie Provinces based on NARCCAP multi-RCM ensemble, Clim. Dynam., 48, 2685–2705, https://doi.org/10.1007/s00382-016-3232-2, 2017.
McKee, T., Doesken, N., and Kleist, J.: The Relationship of Drought Frequency and Duration to Time Scales. Paper Presented at 8th Conference on Applied Climatology, American Meteorological Society: Anaheim, CA, 1993.
McKenney, D. W., Hutchinson, M. F., Papadopol, P., Lawrence, K., Pedlar, J., Campbell, K., Milewska, E., Hopkinson, R. F., Price, D., and Owen, T.: Customized Spatial Climate Models for North America, B. Am. Meteorol. Soc., 92, 1611–1622, https://doi.org/10.1175/2011bams3132.1, 2011.
McMahon, T. A., Peel, M. C., Lowe, L., Srikanthan, R., and McVicar, T. R.: Estimating actual, potential, reference crop and pan evaporation using standard meteorological data: a pragmatic synthesis, Hydrol. Earth Syst. Sci., 17, 1331–1363, https://doi.org/10.5194/hess-17-1331-2013, 2013.
Mekis, É. and Vincent, L. A.: An Overview of the Second Generation Adjusted Daily Precipitation Dataset for Trend Analysis in Canada, Atmos. Ocean., 49, 163–177, https://doi.org/10.1080/07055900.2011.583910, 2011.
Mishra, A. K. and Singh, V. P.: A review of drought concepts, J. Hydrol., 391, 202–216, https://doi.org/10.1016/j.jhydrol.2010.07.012, 2010.
Mishra, A. K. and Singh, V. P.: Drought modeling–A review, J. Hydrol., 403, 157–175, https://doi.org/10.1016/j.jhydrol.2011.03.049, 2011.
Natural Resources Canada: ANUSPLIN data, available at: https://cfs.nrcan.gc.ca/projects/3/3, last access: 25 April 2018.
Nazemi, A., Wheater, H. S., Chun, K. P., Bonsal, B., and Mekonnen, M.: Forms and drivers of annual streamflow variability in the headwaters of Canadian Prairies during the 20th century, Hydrol. Process., 31, 221–239, https://doi.org/10.1002/hyp.11036, 2017.
Ng, E. K. and Chan, J. C.: Geophysical applications of partial wavelet coherence and multiple wavelet coherence, J. Atmos. Ocean Tech., 29, 1845–1853, 2012.
North, G. R., Bell, T. L., Cahalan, R. F., and Moeng, F. J.: Sampling Errors in the Estimation of Empirical Orthogonal Functions, Mon. Weather Rev., 110, 699–706, https://doi.org/10.1175/1520-0493(1982)110<0699:seiteo>2.0.co;2, 1982.
Palmer, W.: Meteorological drought, Research Paper No. 45. U.S. Weather Bureau, NOAA Library and Information Services Division, Washington, D.C. 20852, 1–25, 1965.
Penman, H. L.: Natural evaporation from open water, bare soil and grass, P. Roy. Soc. Lon. A. Mat., 193, 120–145, https://doi.org/10.1098/rspa.1948.0037, 1948.
Perez-Valdivia, C., Sauchyn, D., and Vanstone, J.: Groundwater levels and teleconnection patterns in the Canadian Prairies, Water Resour. Res., 48, W07516, https://doi.org/10.1029/2011WR010930, 2012.
Pomeroy, J. W., Fang, X., and Marks, D. G.: The cold rain-on-snow event of June 2013 in the Canadian Rockies – characteristics and diagnosis, Hydrol. Process., 30, 2899–2914, https://doi.org/10.1002/hyp.10905, 2016.
Preisendorfer, R. W. and Mobley, C. D.: Principal component analysis in meteorology and oceanography, Elsevier, Amsterdam, 1988.
Priestley, C. H. B. and Taylor, R. J.: On the Assessment of Surface Heat Flux and Evaporation Using Large-Scale Parameters, Mon. Weather Rev., 100, 81–92, https://doi.org/10.1175/1520-0493(1972)100<0081:otaosh>2.3.co;2, 1972.
Raible, C. C., Bärenbold, O., and Gómez-navarro, J. J.: Drought indices revisited–improving and testing of drought indices in a simulation of the last two millennia for Europe, Tellus A, 69, 1287492, https://doi.org/10.1080/16000870.2017.1296226, 2017.
Razavi, S. and Vogel, R.: Prewhitening of hydroclimatic time series? Implications for inferred change and variability across time scales, J. Hydrol., 557, 109–115, https://doi.org/10.1016/j.jhydrol.2017.11.053, 2018.
Richman, M. B.: Rotation of principal components, J. Climatol., 6, 293–335, https://doi.org/10.1002/joc.3370060305, 1986.
Ropelewski, C. F. and Halpert, M. S.: North American Precipitation and Temperature Patterns Associated with the El Niño/Southern Oscillation (ENSO), Mon. Weather Rev., 114, 2352–2362, https://doi.org/10.1175/1520-0493(1986)114<2352:napatp>2.0.co;2, 1986.
Shabbar, A. and Khandekar, M.: The impact of el Nino-Southern oscillation on the temperature field over Canada: Research note, Atmos. Ocean., 34, 401–416, https://doi.org/10.1080/07055900.1996.9649570, 1996.
Shabbar, A. and Skinner, W.: Summer Drought Patterns in Canada and the Relationship toGlobal Sea Surface Temperatures, J. Climate, 17, 2866–2880, https://doi.org/10.1175/1520-0442(2004)017<2866:sdpica>2.0.co;2, 2004.
Shabbar, A. and Yu, B.: Intraseasonal Canadian Winter Temperature Responses to Interannual and Interdecadal Pacific SST Modulations, Atmos. Ocean., 50, 109–121, https://doi.org/10.1080/07055900.2012.657154, 2012.
Sheffield, J., Andreadis, K. M., Wood, E. F., and Lettenmaier, D. P.: Global and Continental Drought in the Second Half of the Twentieth Century: Severity–Area–Duration Analysis and Temporal Variability of Large-Scale Events, J. Climate, 22, 1962–1981, https://doi.org/10.1175/2008jcli2722.1, 2009.
Sheffield, J., Wood, E. F., and Roderick, M. L.: Little change in global drought over the past 60 years, Nature, 491, 435, https://doi.org/10.1038/nature11575, 2012.
Sheridan, S. C.: North American weather-type frequency and teleconnection indices, Int. J. Climatol., 23, 27–45, 2003.
Sternberg, T.: Regional drought has a global impact, Nature, 472, 169–169, 2011.
Szeto, K., Zhang, X., White, R. E., and Brimelow, J.: The 2015 Extreme Drought in Western Canada, B. Am. Meteorol. Soc., 97, S42–S46, https://doi.org/10.1175/bams-d-16-0147.1, 2016.
Tallaksen, L. M. and Stahl, K.: Spatial and temporal patterns of large-scale droughts in Europe: Model dispersion and performance, Geophys. Res. Let., 41, 429–434, https://doi.org/10.1002/2013GL058573, 2014.
Thornthwaite, C. W.: An Approach toward a Rational Classification of Climate, Geogr. Rev., 38, 55–94, https://doi.org/10.2307/210739, 1948.
Torrence, C. and Compo, G. P.: A Practical Guide to Wavelet Analysis, B. Am. Meteorol. Soc., 79, 61–78, https://doi.org/10.1175/1520-0477(1998)079<0061:apgtwa>2.0.co;2, 1998.
Torrence, C. and Webster, P. J.: Interdecadal Changes in the ENSO–Monsoon System, J. Climate, 12, 2679–2690, https://doi.org/10.1175/1520-0442(1999)012<2679:icitem>2.0.co;2, 1999.
Tremblay, L., Larocque, M., Anctil, F., and Rivard, C.: Teleconnections and interannual variability in Canadian groundwater levels, J. Hydrol., 410, 178–188, 2011.
U.S. Department of Commerce, National Oceanic & Atmospheric Administration, Earth System Research laboratory, Physical Sciences Division: Climate Indices: Monthly Atmospheric and Ocean Time Series, available at: https://www.esrl.noaa.gov/psd/, 25 April 2018.
Uvo, C. B.: Analysis and regionalization of northern European winter precipitation based on its relationship with the North Atlantic oscillation, Int. J. Climatol., 23, 1185–1194, https://doi.org/10.1002/joc.930, 2003.
Van Loon, A. F., Stahl, K., Di Baldassarre, G., Clark, J., Rangecroft, S., Wanders, N., Gleeson, T., Van Dijk, A. I. J. M., Tallaksen, L. M., Hannaford, J., Uijlenhoet, R., Teuling, A. J., Hannah, D. M., Sheffield, J., Svoboda, M., Verbeiren, B., Wagener, T., and Van Lanen, H. A. J.: Drought in a human-modified world: reframing drought definitions, understanding, and analysis approaches, Hydrol. Earth Syst. Sci., 20, 3631–3650, https://doi.org/10.5194/hess-20-3631-2016, 2016.
Vicente-Serrano, S. M., Beguería, S., and López-Moreno, J. I.: A Multiscalar Drought Index Sensitive to Global Warming: The Standardized Precipitation Evapotranspiration Index, J. Climate, 23, 1696–1718, https://doi.org/10.1175/2009jcli2909.1, 2010.
Vincent, L. A., Wang, X. L., Milewska, E. J., Wan, H., Yang, F., and Swail, V.: A second generation of homogenized Canadian monthly surface air temperature for climate trend analysis, J. Geophys. Res.-Atmos., 117, D18110, https://doi.org/10.1029/2012JD017859, 2012.
Vincent, L. A., Zhang, X., Brown, R. D., Feng, Y., Mekis, E., Milewska, E. J., Wan, H., and Wang, X. L.: Observed Trends in Canada's Climate and Influence of Low-Frequency Variability Modes, J. Climate, 28, 4545–4560, https://doi.org/10.1175/jcli-d-14-00697.1, 2015.
Wang, X. L. and Lin, A.: An algorithm for integrating satellite precipitation estimates with in situ precipitation data on a pentad time scale, J. Geophys. Res.-Atmos., 120, 3728–3744, https://doi.org/10.1002/2014JD022788, 2015.
Wells, N., Goddard, S., and Hayes, M. J.: A Self-Calibrating Palmer Drought Severity Index, J. Climate, 17, 2335–2351, https://doi.org/10.1175/1520-0442(2004)017<2335:aspdsi>2.0.co;2, 2004.
Wheater, H. and Gober, P.: Water security in the Canadian Prairies: science and management challenges, Philos. T. R. Soc. A., 371, A 2013 371 20120409, https://doi.org/10.1098/rsta.2012.0409, 2013.
Wheater, H. and Gober, P.: Water security and the science agenda, Water Resour. Res., 51, 5406–5424, https://doi.org/10.1002/2015WR016892, 2015.
Wheaton, E., Arthur, L., Chorney, B., Shewchuk, S., Thorpe, J., Whiting, J., and Wittrock, V.: The prairie drought of 1988, Climatological Bulletin, 26, 188–205, 1992.
Wilhite, D. A.: Drought as a natural hazard: concepts and definitions, 3–18, Routledge, London, 2000a.
Wilhite, D. A.: Drought as a natural hazard: Concepts and definitions. Drought: A Global Assessment, 3–18, Routledge, London, 2000b.
Wilhite, D. A. and Glantz, M. H.: Understanding: the Drought Phenomenon: The Role of Definitions, Water Int., 10, 111–120, https://doi.org/10.1080/02508068508686328, 1985.
Wilks, D. S.: Statistical methods in the atmospheric sciences, Academic press, Cambridge, Massachusetts, USA, 2011.
Wolter, K.: The Southern Oscillation in Surface Circulation and Climate over the Tropical Atlantic, Eastern Pacific, and Indian Oceans as Captured by Cluster Analysis, J. Clim. Appl. Meteorol., 26, 540–558, https://doi.org/10.1175/1520-0450(1987)026<0540:tsoisc>2.0.co;2, 1987.
Wolter, K. and Timlin, M. S.: El Niño/Southern Oscillation behaviour since 1871 as diagnosed in an extended multivariate ENSO index (MEI.ext), Int. J. Climatol., 31, 1074–1087, https://doi.org/10.1002/joc.2336, 2011.
Wong, J. S., Razavi, S., Bonsal, B. R., Wheater, H. S., and Asong, Z. E.: Inter-comparison of daily precipitation products for large-scale hydro-climatic applications over Canada, Hydrol. Earth Syst. Sci., 21, 2163–2185, https://doi.org/10.5194/hess-21-2163-2017, 2017.
Yue, S., Pilon, P., Phinney, B., and Cavadias, G.: The influence of autocorrelation on the ability to detect trend in hydrological series, Hydrol. Process., 16, 1807–1829, 2002.
Zhang, X., Vincent, L. A., Hogg, W. D., and Niitsoo, A.: Temperature and precipitation trends in Canada during the 20th century, Atmos. Ocean., 38, 395–429, https://doi.org/10.1080/07055900.2000.9649654, 2000.
Zhang, X., Harvey, K. D., Hogg, W. D., and Yuzyk, T. R.: Trends in Canadian streamflow, Water Resour. Res., 37, 987–998, https://doi.org/10.1029/2000WR900357, 2001.
Zhao, H., Higuchi, K., Waller, J., Auld, H., and Mote, T.: The impacts of the PNA and NAO on annual maximum snowpack over southern Canada during 1979–2009, Int. J. Climatol., 33, 388–395, https://doi.org/10.1002/joc.3431, 2013.
Zhou, S., Miller, A. J., Wang, J., and Angell, J. K.: Trends of NAO and AO and their associations with stratospheric processes, Geophys. Res. Let., 28, 4107–4110, https://doi.org/10.1029/2001GL013660, 2001.