the Creative Commons Attribution 3.0 License.
the Creative Commons Attribution 3.0 License.
Impacts of future climate change on urban flood volumes in Hohhot in northern China: benefits of climate change mitigation and adaptations
Qianqian Zhou
Guoyong Leng
Maoyi Huang
As China becomes increasingly urbanised, flooding has become a regular occurrence in its major cities. Assessing the effects of future climate change on urban flood volumes is crucial to informing better management of such disasters given the severity of the devastating impacts of flooding (e.g. the 2016 flooding events across China). Although recent studies have investigated the impacts of future climate change on urban flooding, the effects of both climate change mitigation and adaptation have rarely been accounted for together in a consistent framework. In this study, we assess the benefits of mitigating climate change by reducing greenhouse gas (GHG) emissions and locally adapting to climate change by modifying drainage systems to reduce urban flooding under various climate change scenarios through a case study conducted in northern China. The urban drainage model – Storm Water Management Model – was used to simulate urban flood volumes using current and two adapted drainage systems (i.e. pipe enlargement and low-impact development, LID), driven by bias-corrected meteorological forcing from five general circulation models in the Coupled Model Intercomparison Project Phase 5 archive. Results indicate that urban flood volume is projected to increase by 52 % over 2020–2040 compared to the volume in 1971–2000 under the business-as-usual scenario (i.e. Representative Concentration Pathway (RCP) 8.5). The magnitudes of urban flood volumes are found to increase nonlinearly with changes in precipitation intensity. On average, the projected flood volume under RCP 2.6 is 13 % less than that under RCP 8.5, demonstrating the benefits of global-scale climate change mitigation efforts in reducing local urban flood volumes. Comparison of reduced flood volumes between climate change mitigation and local adaptation (by improving drainage systems) scenarios suggests that local adaptation is more effective than climate change mitigation in reducing future flood volumes. This has broad implications for the research community relative to drainage system design and modelling in a changing environment. This study highlights the importance of accounting for local adaptation when coping with future urban floods.
- Article
(4992 KB) - Full-text XML
-
Supplement
(452 KB) - BibTeX
- EndNote


Floods are one of the most hazardous and frequent disasters in urban areas and can cause enormous impacts on the economy, environment, city infrastructure, and society (Chang et al., 2013; Ashley et al., 2007; Zhou et al., 2017). Urban drainage systems have been constructed to provide carrying and conveyance capacities at a desired frequency to prevent urban flooding. However, the design of drainage systems is often based on historical precipitation statistics for a certain period of time, without considering the potential changes in precipitation extremes for the designed return periods (Yazdanfar and Sharma, 2015; Peng et al., 2015; Zahmatkesh et al., 2015). It is likely that drainage systems would be overwhelmed by additional runoff induced by climate change, which may lead to increased flood frequency and magnitude, disruption of transportation systems, and increased health risks (Chang et al., 2013; Abdellatif et al., 2015). For example, Arnbjerg-Nielsen (2012) reported that the design intensities in Denmark are projected to increase by 10–50 % for return periods ranging from 2 to 100 years. Therefore, it is important to investigate the performance of drainage systems in a changing environment and to assess the potential urban flooding under various scenarios to achieve better adaptations (Mishra, 2015; Karamouz et al., 2013; Yazdanfar and Sharma, 2015; Notaro et al., 2015).
Impacts of climate change on extreme precipitation and urban flooding have been well documented in a number of case studies. For example, Ashley et al. (2005) showed that flooding risks (i.e. occurrence of pluvial floods) in four UK catchments may increase by almost 30 times by the 2080s compared to current conditions around the year 2000, and effective adaptation measures are required to cope with the increasing risks in the UK. Larsen et al. (2009) estimated that future extreme 1 h precipitation will increase by 20–60 % throughout Europe by 2071–2100 relative to 1961–1990. Willems (2013) found that in Belgium the current design storm intensity for the 10-year return period is projected to increase by 50 % by the end of this century. Several studies have also investigated the role of climate change mitigation or adaptation in reducing urban flood damages and risks under climate change scenarios (Alfieri et al., 2016; Arnbjerg-Nielsen et al., 2015; Moore et al., 2016; Poussin et al., 2012). The relationship between changes in precipitation intensity and flood volume has also been well explored, providing additional insights into drainage design strategies (Olsson et al., 2009; Willems et al., 2012; Zahmatkesh et al., 2015). However, previous studies on the effects of climate change mitigation and adaptation are typically conducted separately, and it is unclear which strategy is more effective at reducing urban floods. This study aims to advance our understanding of urban floods within the context of change climate, through investigating the benefits of climate change mitigation (by reducing greenhouse gas, GHG, emissions) and local adaptation (by improving drainage systems) in reducing future urban flood volumes in a consistent framework.
As China increasingly urbanises, flooding has become a regular occurrence in its cities; 62 % of Chinese cities surveyed experienced floods and direct economic losses of up to USD 100 billion between 2011 and 2014 (China Statistical Yearbook, 2015). The 2016 flooding events affected more than 60 million people – across China more than 200 people were killed and USD 22 billion in losses were suffered. Hence, assessing future changes in urban flooding is very important for managing urban floods by designing new urban infrastructure and re-designing existing ones to be resilient in response to the impacts of future climate change. While urban floods are speculated to increase in the future (Yang, 2000; Ding et al., 2006), their magnitudes are hard to assess because of uncertainties associated with future climate change scenarios, as well as the under-representation of plausible climate change mitigation and adaptation strategies in the models.
In this study, we chose a drainage system in a typical city in northern China to illustrate the role of climate change mitigation and local adaptation in coping with future urban flood volumes. Such an investigation of the performance of the present-day drainage system also has important implications for local governments responsible for managing urban flood disasters in the study region. Specifically, we first quantified the effects of future climate change on urban flood volumes as a result of extreme precipitation events for various return periods using the present-day drainage system. We then designed two plausible adaptation strategies for the study region and investigated how much urban flood volume can be reduced with the adapted systems by the 2020s. We also compared the benefits of global-scale climate change mitigation and local adaptation in reducing urban flood volumes to advance our understanding effective measures for coping with future urban floods.
2.1 Study region
The study region (Hohhot) is located in the southern central portion of Inner Mongolia, China. It lies between the Great Blue Mountains to the north and the Hetao Plateau to the south, which has a north-to-south topographic gradient. The region is in a cold semi-arid climate zone, characterised by cold and dry winters and hot and humid summers. The regional annual mean precipitation is approximately 396 mm with large intra-seasonal variations. Most rain falls between June and August, a period that accounts for more than 65 % of the annual precipitation. The drainage area in year 2010 was about 210.72 km2, and it served a residential population of 1.793 million (Fig. 1a). The land use types in the region can be classified into five categories: agricultural land (8 %), residential areas (38 %), industrial land (13 %), green spaces (7 %), and other facilities (34 %; including municipal squares, commercial districts, institutions). According to local water authorities, the major soil type of the area is a mixture of loam and clay.
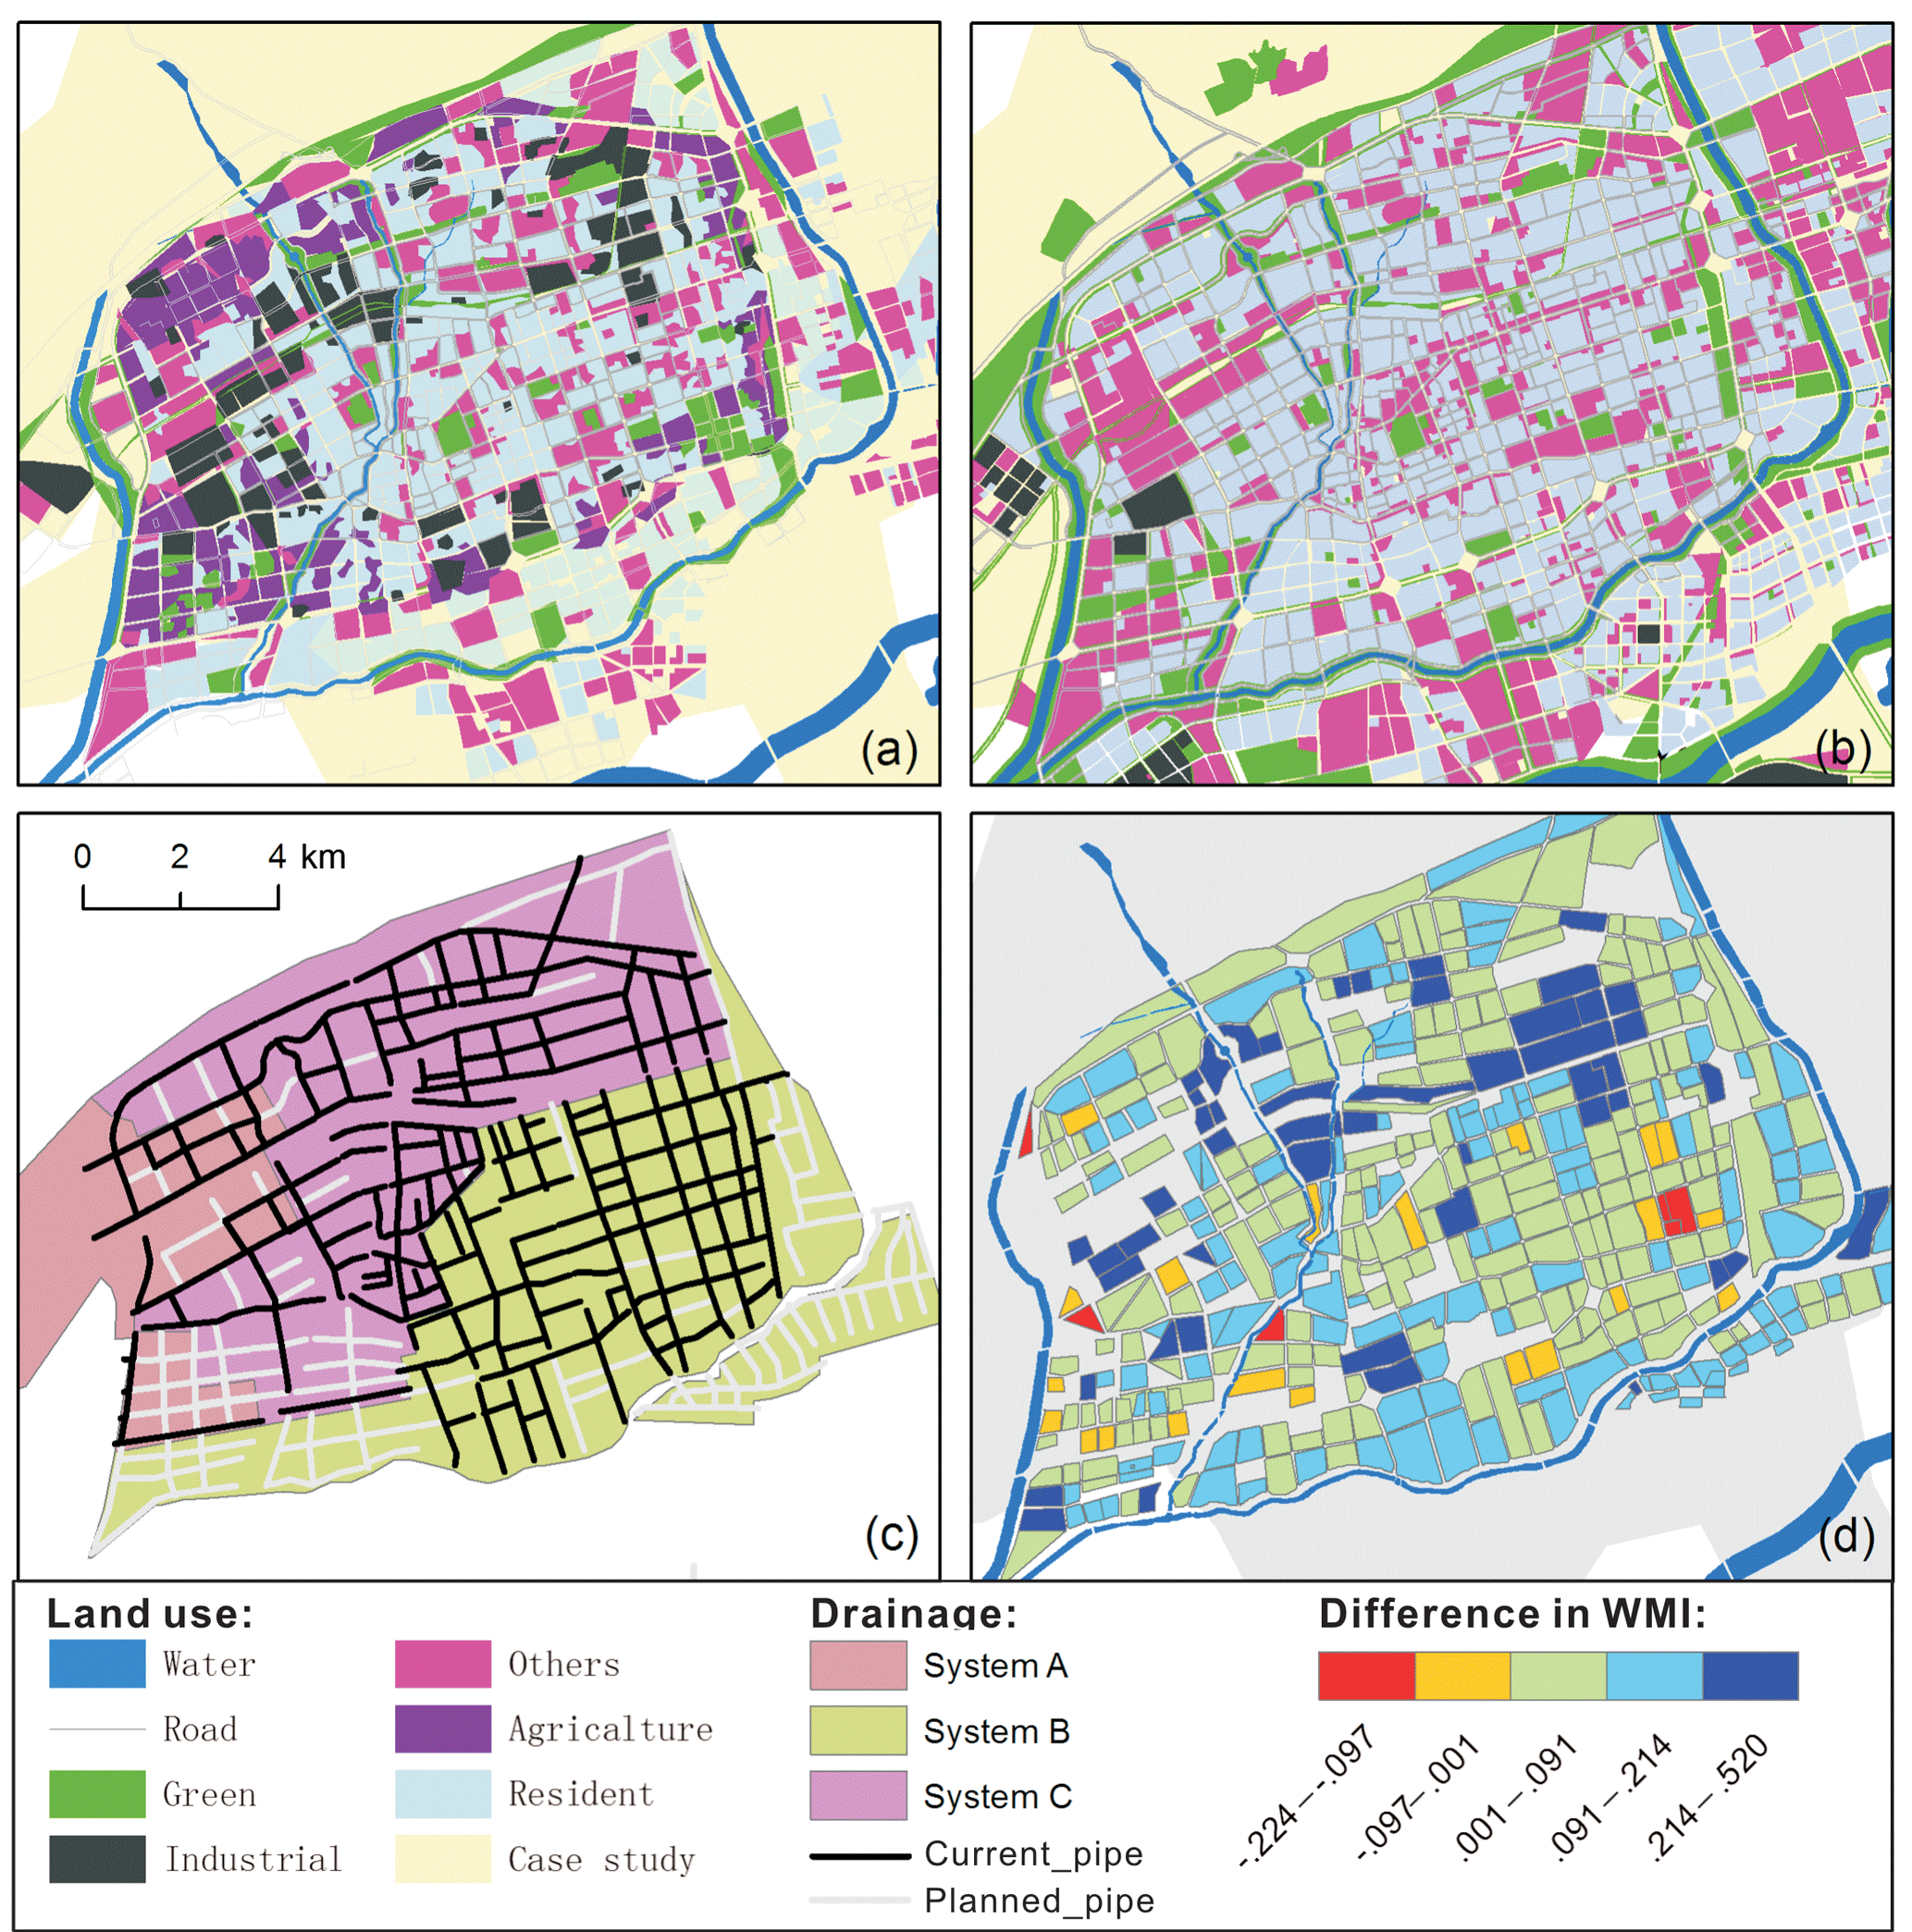
Figure 1Land use of the study region for the year 2010 (a) and 2020 (b). Pipe network description of current and planned drainage systems (c). Difference in weighted mean imperviousness (WMI) between year 2010 and 2020 (d).
The current drainage system can be divided into 3 large sub-basins (Fig. 1c) and 326 sub-catchments with a total pipeline length of 249.36 km. The drainage network has a higher pipeline cover rate in the centre, but a rather low design standard for extreme rainfall events with a return period of less than 1 year. Historical records of stormwater drainage and flood damage indicate that the region has experienced an increase in flood frequency and magnitude within the context of climate change and urbanisation (Zhou et al., 2016). During the major flood event on 11 July 2016, the city, especially the western portion of the watershed, was hit by an extreme rainfall event of more than 100 mm of rain in 3 h. The flood event led to the cancellation of at least 8 flights and 17 trains, and delays of several transportation systems. In particular, in the central area, the flood event caused severe traffic jams on major streets and resulted in a number of flooded residential buildings. A new drainage system is therefore required to cope with increasing urban flood volumes and frequencies in the future. The planned drainage area for 2020s is about 307.83 km2, which is 50 % larger than the current drainage area (Zhou et al., 2016). The land use categories and distribution are shown in Fig. 1b.
2.2 Climate change scenarios
Climate projections by five general circulation models (GCMs) from the Coupled Model Intercomparison Project Phase 5 (CMIP5) archive were obtained from the Inter-Sectoral Impact Model Intercomparison Project (ISI-MIP; Warszawski et al., 2014). The CMIP5 climate projections were bias-corrected against observed climate for the overlapping period 1950–2000 using a quantile mapping method (Piani et al., 2010; Hempel et al., 2013). Several studies have demonstrated the value of the bias-corrected climate projections in quantifying climate change impacts on global and regional hydrology (e.g. Piontek et al., 2014; Elliott et al., 2014; Haddeland et al., 2014; Leng et al., 2015a, b). In this study, we used the bias-corrected climate from five GCMs (HadGEM2-ES, GFDL-ESM2M, IPSLCM5A-LR, MIROC-ESM-CHEM, and NorESM1-M) under two representative concentration pathways (RCPs; RCP 2.6 and RCP 8.5). The projected urban flood volumes under the business-as-usual scenario RCP 8.5 are compared with those under the climate change mitigation scenario RCP 2.6 to explore the benefits of climate change mitigation in reducing regional urban flood volumes. The possible land–surface–atmosphere interactions that would indirectly affect rainfall and flooding are not considered in this study.
2.3 Urban drainage modelling
The Storm Water Management Model (SWMM 5.1) developed by the U.S. Environmental Protection Administration is a widely used urban stormwater model that can simulate rainfall–runoff routing and pipe dynamics under single or continuous events (Rossman and Huber, 2016). SWMM can be used to evaluate the variation in hydrological and hydraulic processes and the performance of drainage systems under specific mitigation and adaptation scenarios in the context of global warming. The hydrological component requires inputs of precipitation and subcatchment properties including drainage area, subcatchment width, and imperviousness. The pipe network requires inputs from manholes, pipelines, outfalls, and connections to sub-catchments (Zahmatkesh et al., 2015; Chang et al., 2013). Basic flow-routing models include steady flow, kinematic, and dynamic wave methods. Infiltration can be described by the Horton, Green-Ampt, or Soil Conservation Service curve number (SCS-CN) methods. The dynamics of pipe flow are calculated based on the continuity equation and Saint-Venant equations (Rossman and Huber, 2016). Overflow occurs once the surface runoff exceeds the pipe capacity and is expressed as the value of total flood volume (TFV) at each overloaded manhole, i.e. the excess water from manholes after completely filling the pipe system without taking into account the outlet discharges. Other types of model outputs include catchment peak flows, maximum flow rates of pipelines, and flooded hours of manholes. It should be noted that SWMM is not capable of simulating surface inundation dynamics and cannot provide accurate estimation of the inundated zones and depths. The TFV is thus used to approximately reflect the flood condition and drainage system overloading status. Nevertheless, surface inundation models (e.g. Apel et al., 2009; Horritt and Bates, 2002; Vojinovic and Tutulic, 2009) are applicable if more accurate information about overland flow characteristics is available. In this study, the kinematic wave routing and the Horton infiltration model are used for model simulations. The infiltration capacity parameters for the category of “dry loam soils with little or no vegetation” are used in the hydrological model to be consistent with the local soil type (Akan, 1993; Rossman and Huber, 2016; Supplement, Table S1).
Rainfall inputs are calculated based on the regional storm intensity formula (SIF) using historical climatic statistics (Zhang and Guan, 2012; Supplement, Eqs. S1–S4). In this study, we considered 10 return periods: 1-, 2-, 3-, 10-, 20-, 50-, 100-, 200-, 500-, and 1000-year events. A 4 h rainfall time series was generated for each return period at 10 min intervals. The duration of design rainfalls (i.e. 4 h rainfall) is selected based on the time of concentration (ToC) of the watershed in the study region, according to the design principles as outlined in Butler and Davies (2010) and Chow et al. (2013). We assumed that the SIF was constant without considering the non-stationary features in a changing climate. That is, the intensity–duration–frequency (IDF) relationships for estimating design rainfall hydrographs were assumed to remain stable in the future and only changes in the daily mean intensity were considered because of the limited data availability in future sub-hourly climate projections from which these parameters would be derived.
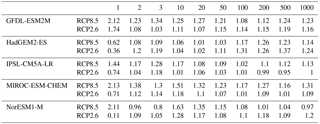
As for future climate, the projected changes (i.e. change factors) in precipitation intensity at various return periods were calculated for each GCM–RCP combination (Table 1). Specifically, for each year, the annual maximum daily precipitation was determined for both historical and future periods. The generalised extreme value (GEV) distribution was then fitted separately to the two sets of daily values (Coles, 2001; Katz et al., 2002). Kolmogorov–Smirnov and Anderson–Darling statistics show that the hypothesis regarding the extreme value distribution is not rejected. That is, the fitted distribution could be well used to describe the extreme precipitation distribution in the study region. The value corresponding to each return period was estimated based on the GEV distribution and the changes between future and historical periods were calculated as the change factors. The derived change factor for each return period was then multiplied by the historical design Chicago Design Storms (CDS) rainfall time series to derive future climate scenarios. We acknowledge that the estimation of changes in extreme precipitation events involves inevitable uncertainties and therefore caution should be exercised when interpreting the relevant results.
Table 1Projected changes in precipitation intensity under return periods ranging from 1 to 1000 years by five global climate models under two representative concentration pathways (RCPs).
2.4 Flood volume assessment
The TFVs of given rainfall events were simulated by the SWMM. A log-linear relationship is assumed to characterise the changes in flood volume with the increase in precipitation intensity as indicated by return periods (Fig. 2a) following Zhou et al. (2012) and Olsen et al. (2015). Generally, more TFV (i.e. system overloading) is expected with an increase in rainfall intensity. In Fig. 2b, the TFVs were linked to their specific occurrence probabilities. The total grey area under the curve denotes the TFVs integrated across various return periods and represents the total expected TFVs per year. The contribution of an individual flood event to total average TFV is dependent not only on the flood volume but also its corresponding probability of occurrence. Intensified precipitation is expected to increase the magnitude of system overflow, resulting in an upward trend in the TFV return period relationship and increased total TFVs.
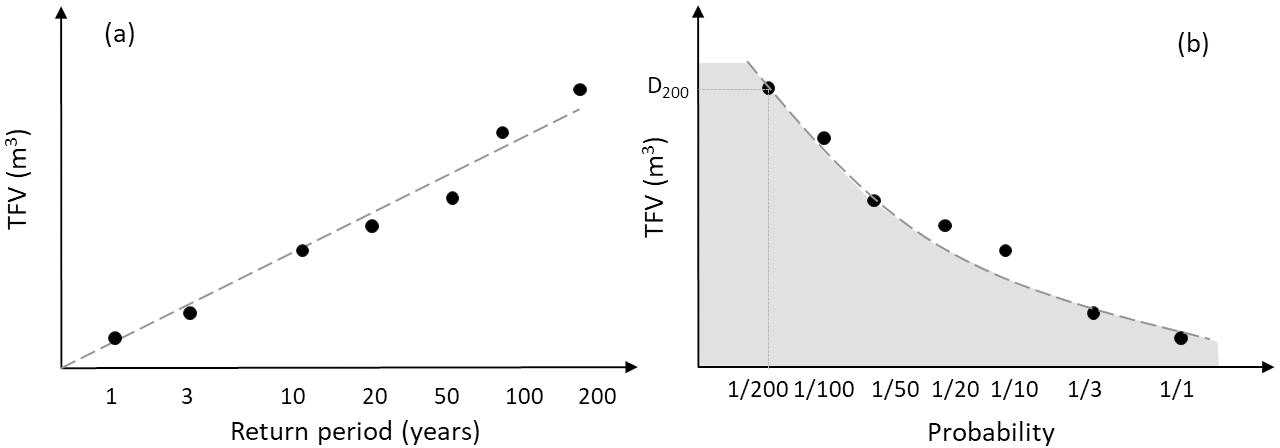
Figure 2Illustration of total flood volume (TFV) as a function of return periods (a) and estimation of average total expected TFV per year (i.e. the grey area in b) under a stationary drainage system.
2.5 Design of adaptation scenarios
In this study, two adaptation scenarios were designed to explore the role of adaptation in reducing urban flood volume within the context of climate change by the 2020s. The first scenario was designed to update the drainage system as planned by local water authorities to cope with the standard 3-year design event. It involved two main improvements of the current drainage system – enhancing the pipeline diameter and expanding the pipe network. The design was implemented in the SWMM model as shown in Fig. 1c. The number of pipelines of the present day and adapted systems was 323 and 488, with a total pipe length of 251.6 and 375.4 km, respectively. In the adapted scenarios, the mean pipeline diameter was about 1.73 m, an increase of 53 % compared to that of the present-day system.
The second adaptation scenario was designed to increase the permeable surfaces (e.g. green spaces) and reduce the regional imperviousness in the study region on the basis of pipe capacity enhancement. This scenario is referred to as the low-impact development (LID) scenario, and it was used to explore the effectiveness of urban green measures, such as the use of permeable pavements, infiltration trenches, and green roofs. Changes in land imperviousness in LID scenario have direct impacts on the performance of drainage systems in managing surface runoff. Due to a lack of detailed information about the permeable soil and coverage rates in the study region, the effects of these specific measures cannot be modelled individually. Here, we used a simplified approach by altering the subcatchment imperviousness to reflect the combined effects of infiltration-related measures. We derived such information by calculating the difference in land use type and imperviousness between the current and planned city maps using GIS. Figure 1d shows the difference in weighted mean imperviousness (WMI , where IF i and Ai is the impervious factor and area for land use type i, respectively.) for each subcatchment in the current and planned maps, using the commonly applied impervious factors (Pazwash, 2011; Butler and Davies, 2010) for each land use type. The difference in WMI was used to indicate the potential for adaptation based on the city plan. For example, a subcatchment with higher positive changes in the WMI indicates that the area's expected land use will have lower imperviousness and therefore is assumed to be more suitable for LID planning, and vice versa.
3.1 Impacts of future climate change on urban flood volumes
Figure 3 shows the projected climate change (CC) impacts on urban flooding using the present-day drainage system of the near future (i.e. 2020–2040) under the RCP 8.5 scenario. Without climate change mitigation or adaptation, the TFV was projected to increase significantly with the increase of extreme rainfall events for most of investigated return periods (Table 2). Note that the lower bounds for return periods of 1, 3, and 1000 years fall below the current TFV curve due to the decrease in precipitation intensities. Despite the large uncertainty associated with climate projections, in particular with the 1-, 10-, and 1000-year return periods, the poor service performance of the current system in coping with urban flooding was evident. Overall, the urban flood volume was projected to increase by 52 % on average by the multi-model ensemble median by 2020–2040; the largest increase (258 %) was projected for the 1-year event and the smallest increase (12 %) for the 100-year event.
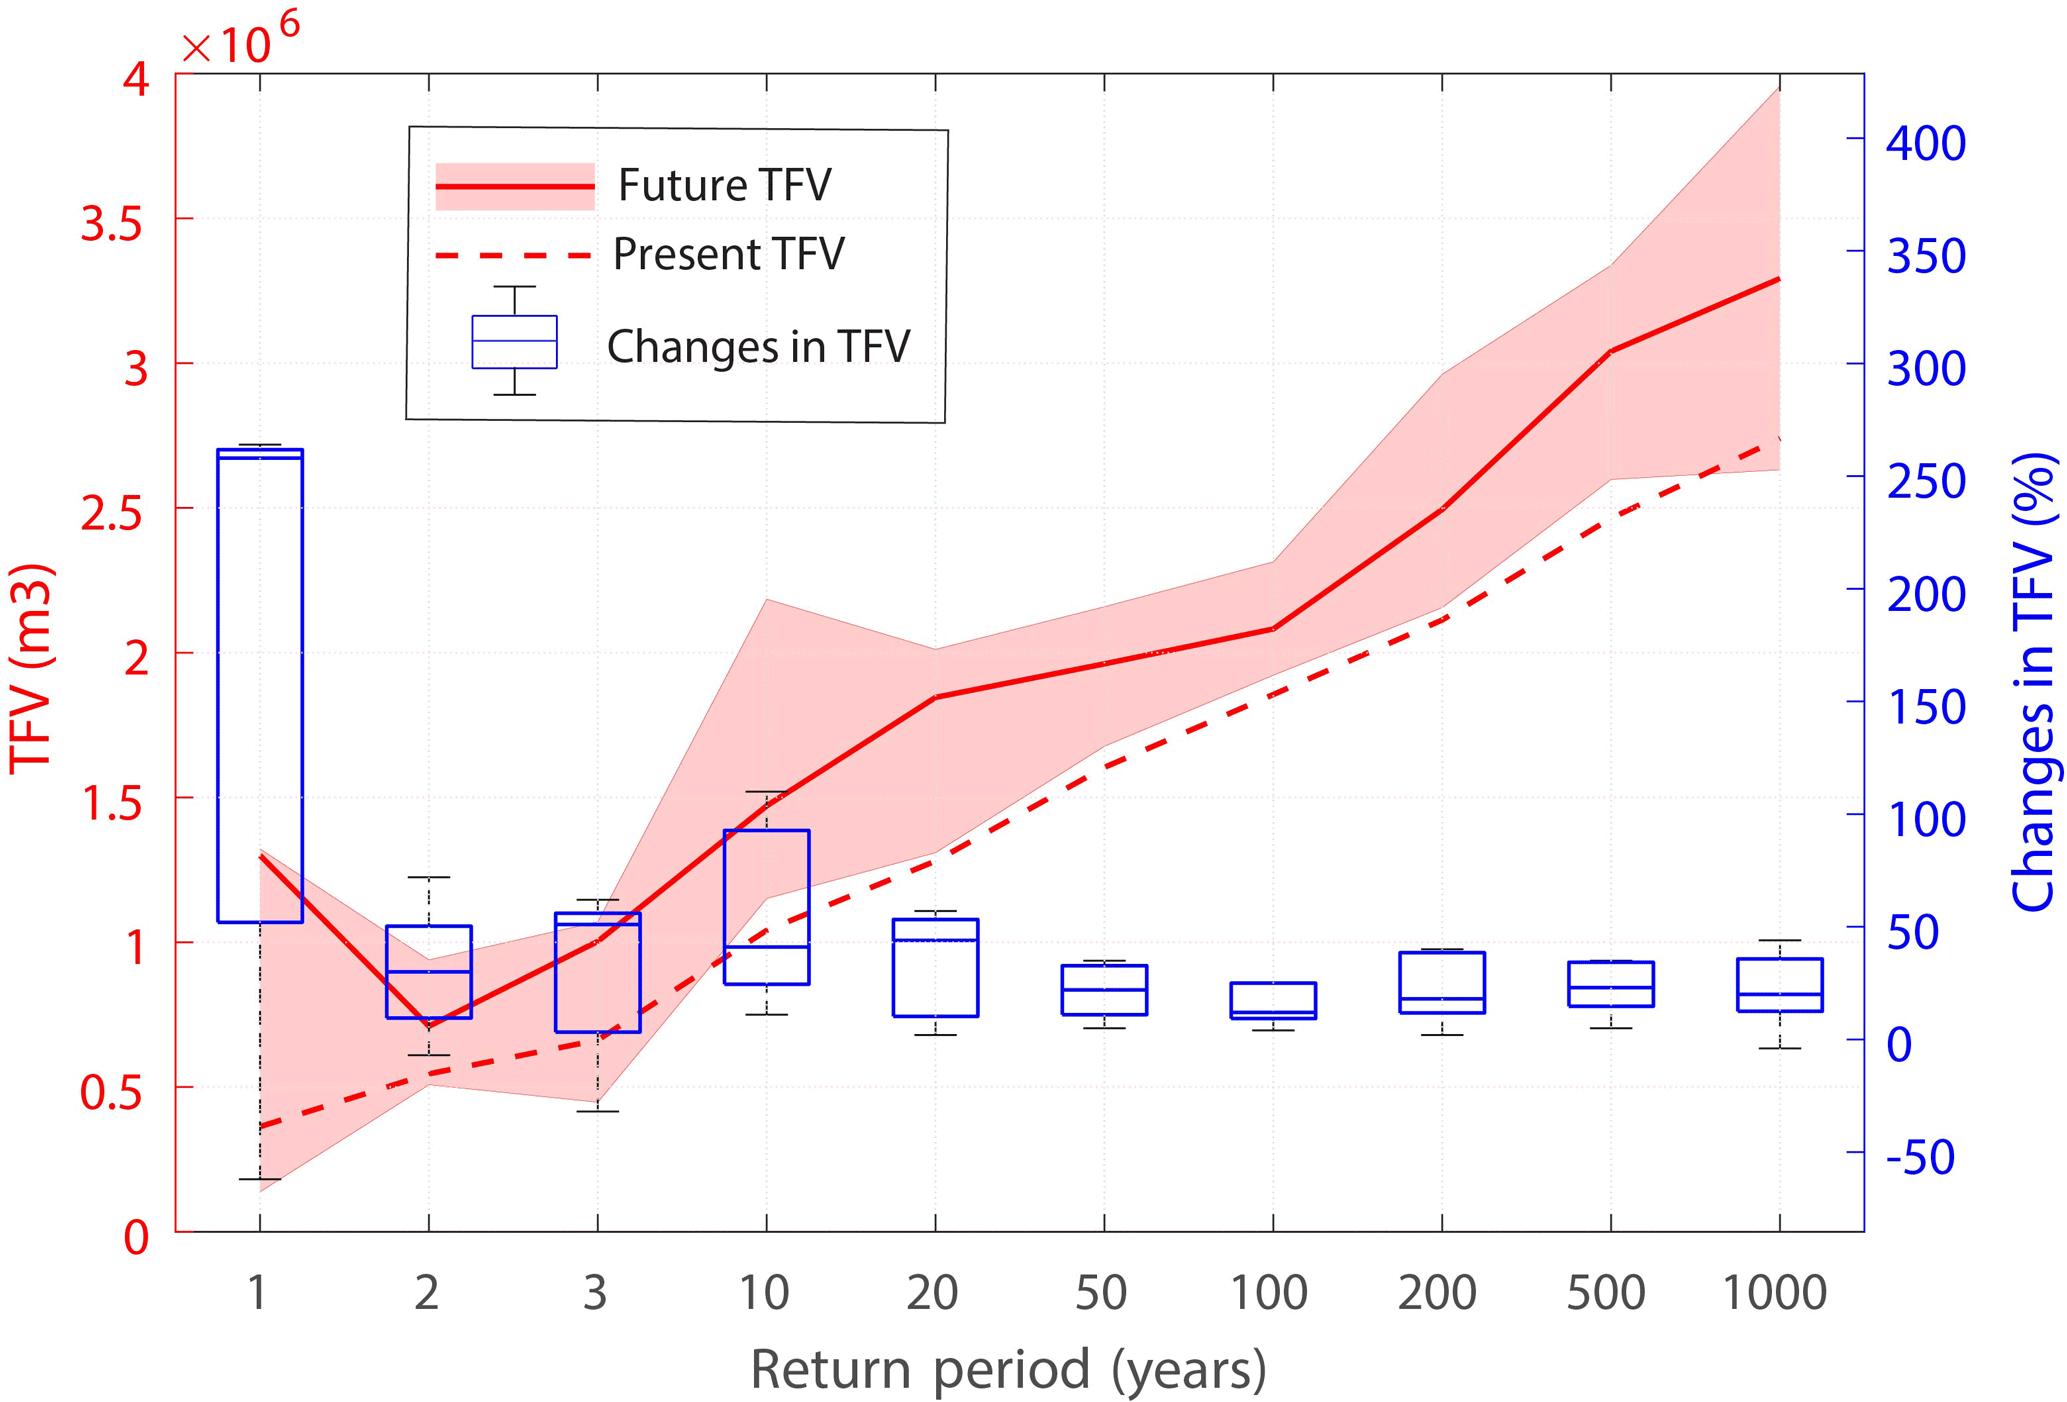
Figure 3Changes in total flood volume (TFV) as a function of precipitation intensity at various return periods under RCP8.5 scenario without mitigation and adaptation. The red solid line represents the multi-model ensemble median TFV with shaded areas denoting the ensemble range. The red dashed line is the TFV under present condition. Box plots show the relative changes in TFV by 2020–2040 relative to present condition. Box edges illustrate the 25th and 75th percentile, the central mark is the median, and whiskers mark the 5th and 95th percentiles.
3.2 Benefits of climate change mitigation in reducing urban flood volumes
Figure 4 shows the comparison of TFVs under the RCP 8.5 scenario (i.e. a business-as-usual scenario) and the RCP 2.6 scenario (i.e. a climate change mitigation scenario). Although large uncertainties exist arising from climate models, it is clear that the simulated TFVs are much smaller under the RCP 2.6 scenario than under the RCP 8.5 scenario, demonstrating the benefits of climate mitigation in reducing local urban flood volumes. Such benefits are especially evident for floods for smaller return periods. For example, an increase of 936 m3 in flood volume is projected with the increase in 1-year extreme rainfall under the business-as-usual climate change scenario (i.e. RCP 8.5), 52 % of which would be reduced if climate change mitigation were in place (i.e. under RCP 2.6). Notably, the peak of the total TFV curve was projected to shift from the 1-year event under the RCP8.5 scenario to the 3-year event under the RCP2.6 scenario (Fig. 4b), indicating a substantial reduction in the TFVs (especially at the 1-year return period; Fig. 4c). The lower total TFVs under RCP2.6 scenario could be attributed to the smaller magnitude of rainfall intensity than in the RCP8.5 scenario (Table 1), demonstrating the important role of climate mitigation in reducing urban flood volumes. Overall, climate change mitigation can reduce future flood volumes by 13 % compared to the scenario without mitigation, as indicated by the multi-model ensemble median.
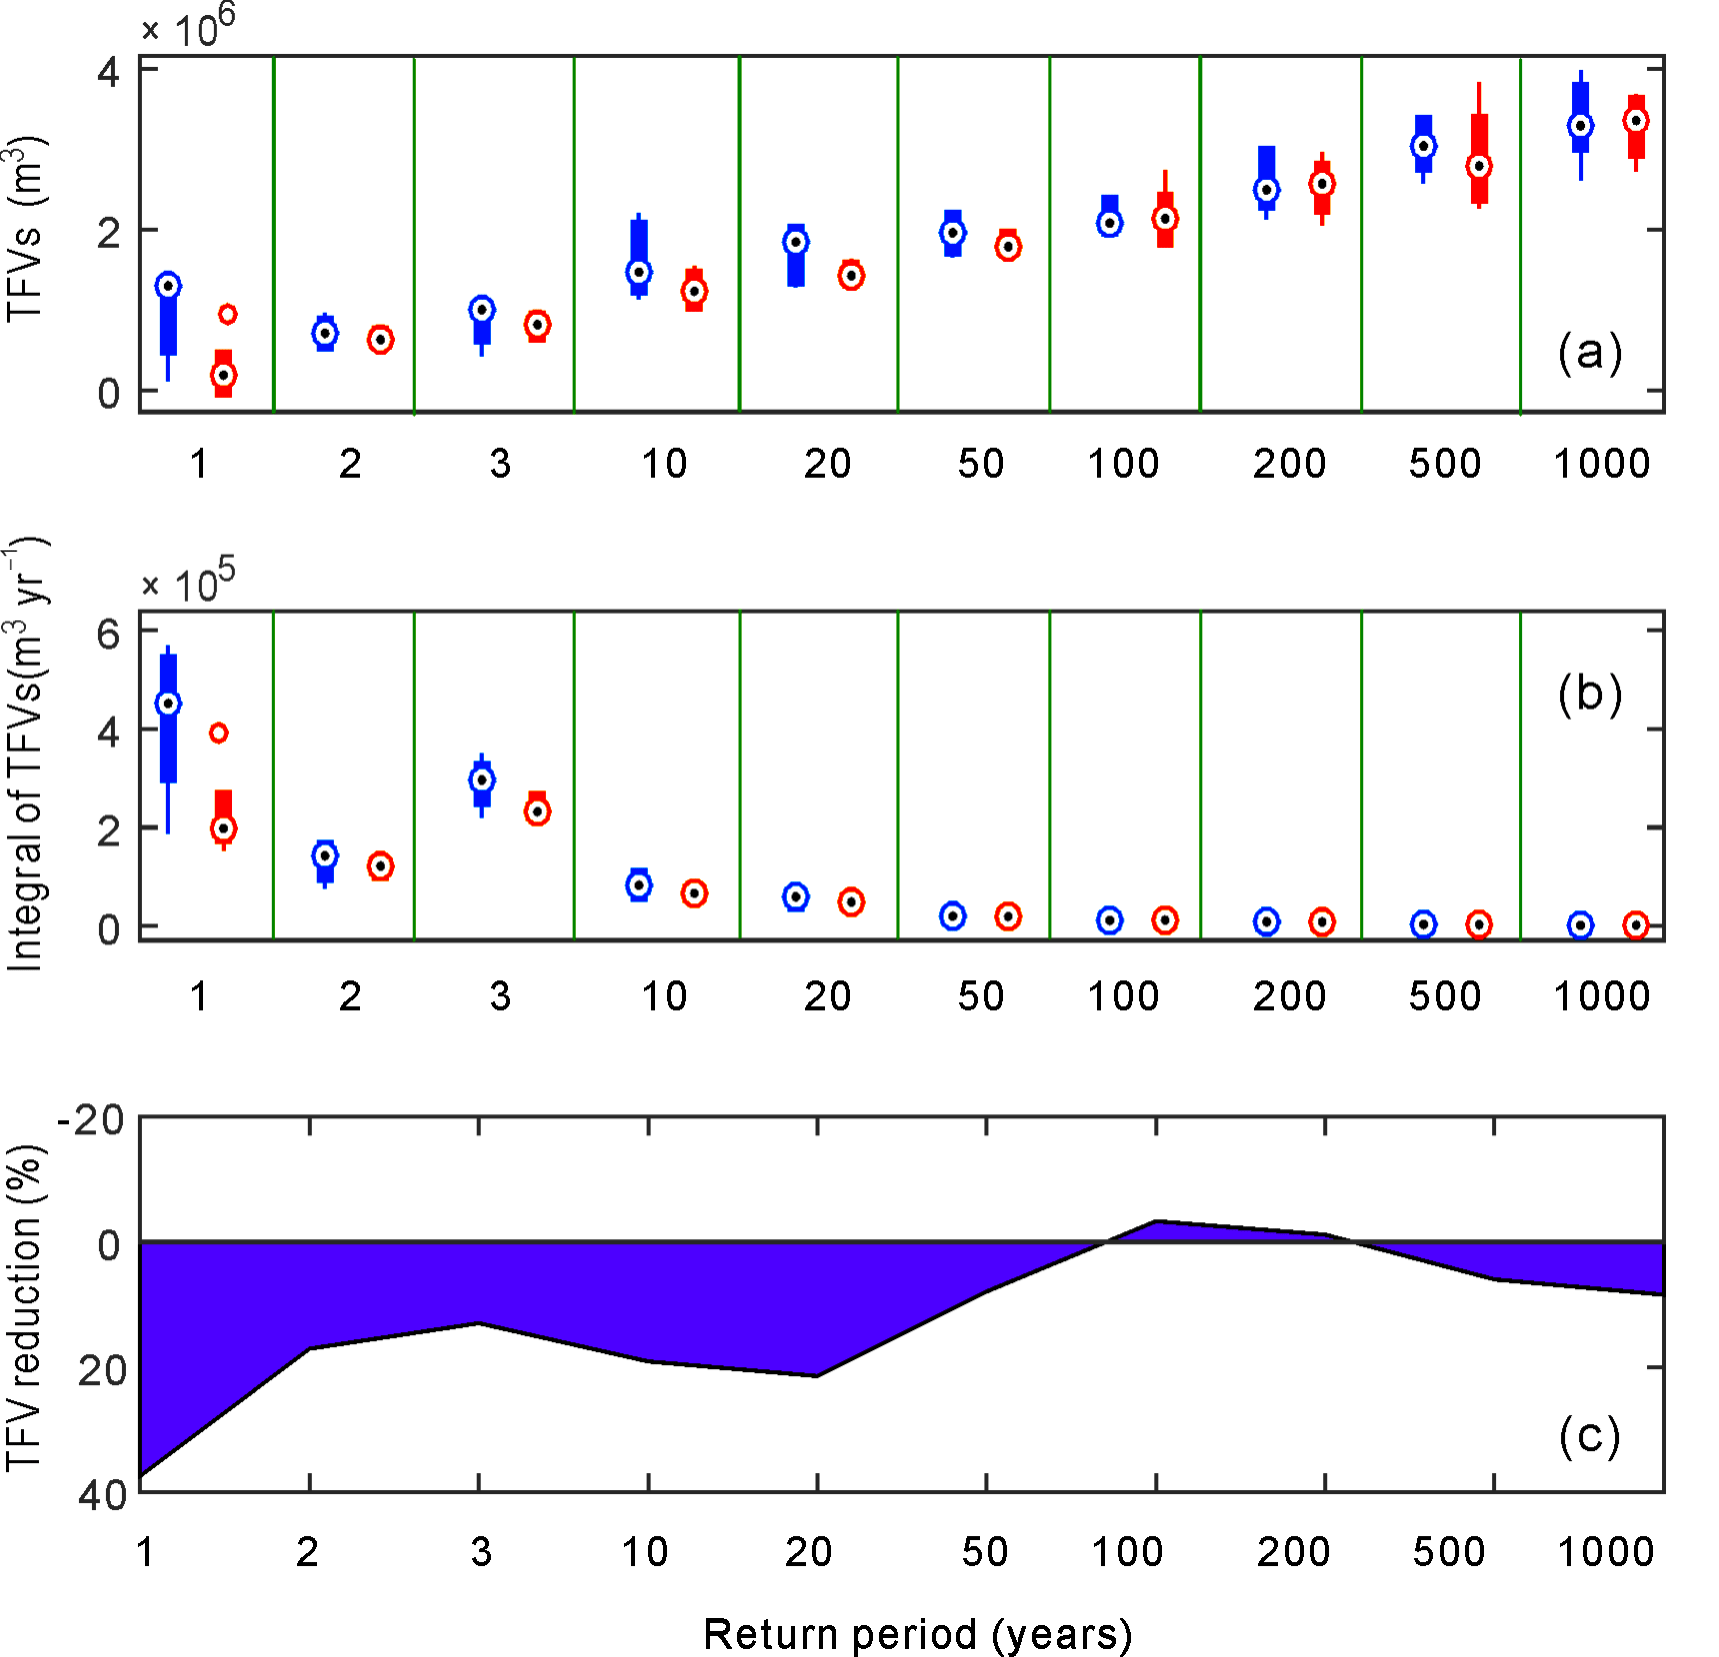
Figure 4Comparison of (a) flood volume and (b) total TFVs (i.e. the piece-wise integral of flood volume versus the expected frequency with changes in precipitation intensity of various return periods under RCP8.5, blue, and RCP2.6, red). Panel (c) shows the TFV reduction calculated as the percentage difference in TFVs under RCP2.6 compared to RCP8.5 (i.e. benefits of climate mitigation) at various return periods.
3.3 Benefits of adaptation in reducing urban flood volumes
Figure 5 shows the overloaded pipelines (red colour) with and without adaptation. The simulated results under the present 3-year event (recommended service level) and 50-year event (one typical extreme event) were selected to illustrate the role of adaptation in coping with floods in the historical period. As shown in Fig. 5a, the simulated locations of overloaded pipelines are in good agreement with historical flood points as recorded by local water authorities. Overall, the percentage of overloaded manholes (POM) and the ratio of flood volume (RFV) to input rainfall volume are up to 37 and 35 % in the current drainage system (Fig. 5a), respectively. When experiencing a 50-year extreme rainfall, the POM and RFV increase to 67 and 38 %, respectively. This indicates that current pipe capacities are insufficient to cope with extreme rainfall events (Fig. 5b). Spatially, the centre of the city is the most affected region due to the low service level in the area. With proposed adaptations, urban floods can be reduced to zero under a 3-year flood event. Such benefits of local adaptations are also evident when experiencing more intense precipitation events (e.g. 50-year events), for which the POM and RFV were reduced from 67 and 50 to 49 and 17 %, respectively.
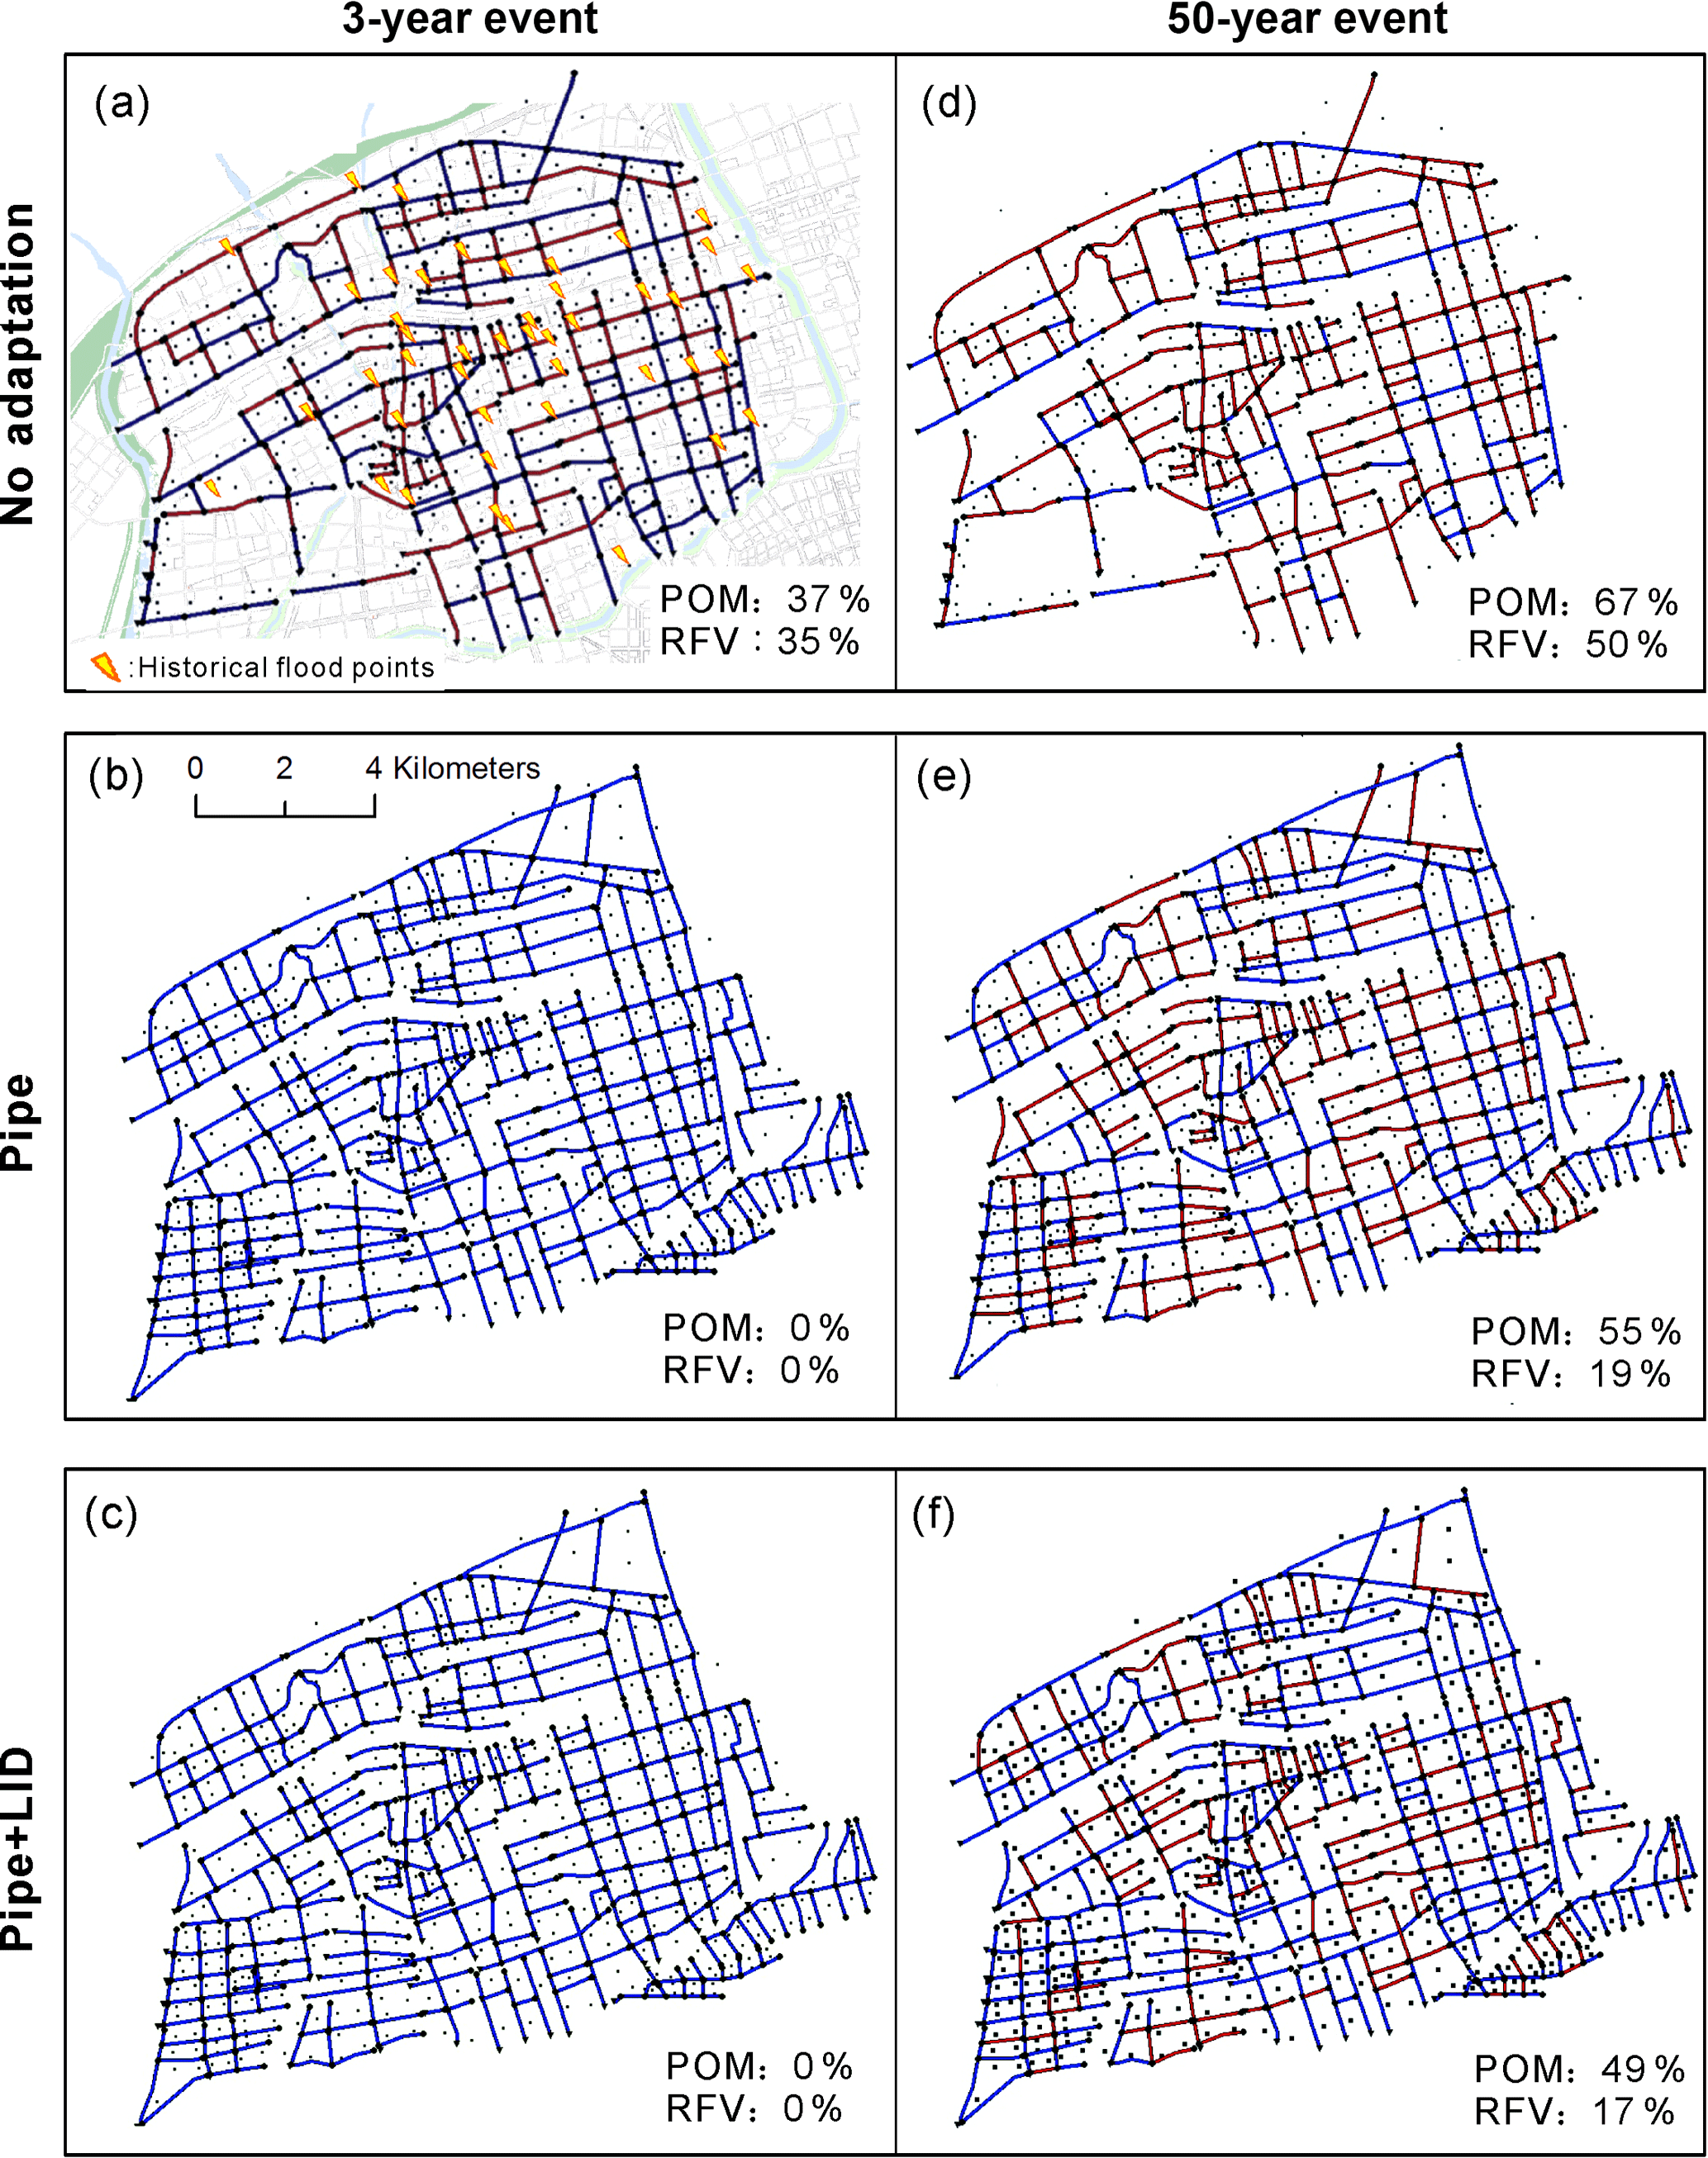
Figure 5Spatial distribution of overloaded pipelines (red colour) induced by the 3-year (a–c) and 50-year extreme events (d–f) without and with adaptations. The total percentage of overloaded manholes (POM) and ratio of flood volume (RFV) to input rainfall volume are summarised for each scenario. Historical flood points and local land use, mainly the traffic network and green spaces, are shown in (a).
Figure 6 shows the future changes in urban flood volume (CTFVs; CTFV = (TFV, where c and nc represent the results with and without climate change, respectively) with changes in extreme rainfall for various return periods. The performance of the current drainage system (no adaptation) was found to be less sensitive to future climate change, as indicated by the flatter slope in Fig. 6. For example, a similar magnitude of changes in flood volume was projected given changes in extreme rainfall for the return periods of 3, 50, and 500 years; the CTFV is 0.62, 0.32, and 0.35 for these periods, respectively. This is because the capacity of the current system is too small to handle extreme rainfall events with return periods larger than 1 year – a condition under which the current drainage system would be flooded completely, not to mention the situations with increased rainfall intensity in the future. Mathematically, the low sensitivity of the current drainage system to changes in extreme rainfall intensity could be attributed to the large value of the denominator in the calculation of CTFV.
With adaptations in place, the flood volume becomes much smaller than that in the current system due to capacity upgrading to hold more water. For example, when experiencing a 10-year extreme rainfall event, the urban flood volumes for the present period (i.e. TFVnc) are 1 041 230, 274 650, and 180 610 m3 in the current and two adapted systems, respectively, while in the future period, the magnitude of flood volume (i.e. TFVc) is relatively similar among the three drainage systems. Therefore, future CTFVs relative to the historical period are much larger in the adapted systems than in the current system. The larger CTFVs in the adapted systems do not mean worse drainage system performance. Rather, they imply that the capacity (i.e. service level) of adapted drainage systems tends to become lower with climate change, while the current drainage system has already reached its peak capacity in handling extreme rainfall events in the historical period and thus shows a low sensitivity to future increases in rainfall intensity under climate change scenarios. Notably, the considerable increases in the CTFVs for return periods of less than 10 years in the adapted systems imply that the designed adaptations can effectively attenuate extreme rainfall events for small return periods. For more extreme rainfall events of return periods ≥ 50 years, more consistent results were found for both adaptation scenarios. This indicates that although the performance of adapted drainage systems is significantly improved compared to that of the current system, the flood volume remains large when experiencing extreme rainfall events with return periods larger than 50 years, because flooding in such cases will push the adapted drainage systems to their limits.

Figure 6Future changes in flood volumes (CTFVs) relative to historical conditions under the current drainage system (yellow) and two adaptation scenarios (i.e. pipe in red and pipe + LID in green) at various return periods.
3.4 Climate mitigation versus drainage adaptation
Figure 7 shows the reduced TFVs by climate change mitigation and drainage system adaptation as functions of return period. It is evident that both mitigation and adaptation measures are effective at reducing future urban flood volumes. However, such benefits are projected to weaken gradually with the increase in rainfall intensity (i.e. larger return periods). Overall, climate mitigation can lead to a reduction of flood volume by 10–40 % compared to the scenario without mitigation. Notably, there are minor negative values of TFV reductions for the return period of 100 and 200 years under climate mitigation scenario. The negative value is attributed to the slightly higher increase in precipitation intensity under climate mitigation scenario (i.e. RCP26) than the scenario without mitigation (i.e. RCP85) simulated by two of five climate models (i.e. GFDL-ESM2m and NorESM1-M, see Table 1), which translated to slightly larger flood volume under climate mitigation scenario. This climate internal variability is partly cancelled out by the other three climate models, thus leading to very minor negative values by the multi-model ensemble mean. This calls for the use of more climate models to derive more robust projections in the future studies.
Importantly, our results show that the two adaptation systems proposed in this study are found to be more effective at reducing urban floods than climate change mitigation. In most cases, the benefits of local adaptation are more than double those of mitigation. In extreme cases, the reduction in TFV achieved by adaptation is five times more than that achieved by climate change mitigation (i.e. for the return periods of 2–3 years). Such effectiveness of urban flood reduction through drainage system adaptations has profound implications for local governments charged with managing urban flooding in the future. Notably, the second scenario (LID + pipe) exhibited a higher level of flood volume reduction than the pipe scenario in coping with extreme rainfall events for all investigated return periods. This implies that implementation of LID measures to augment drainage system capacity is more effective through reducing upstream loadings compared to updating the pipe system alone.
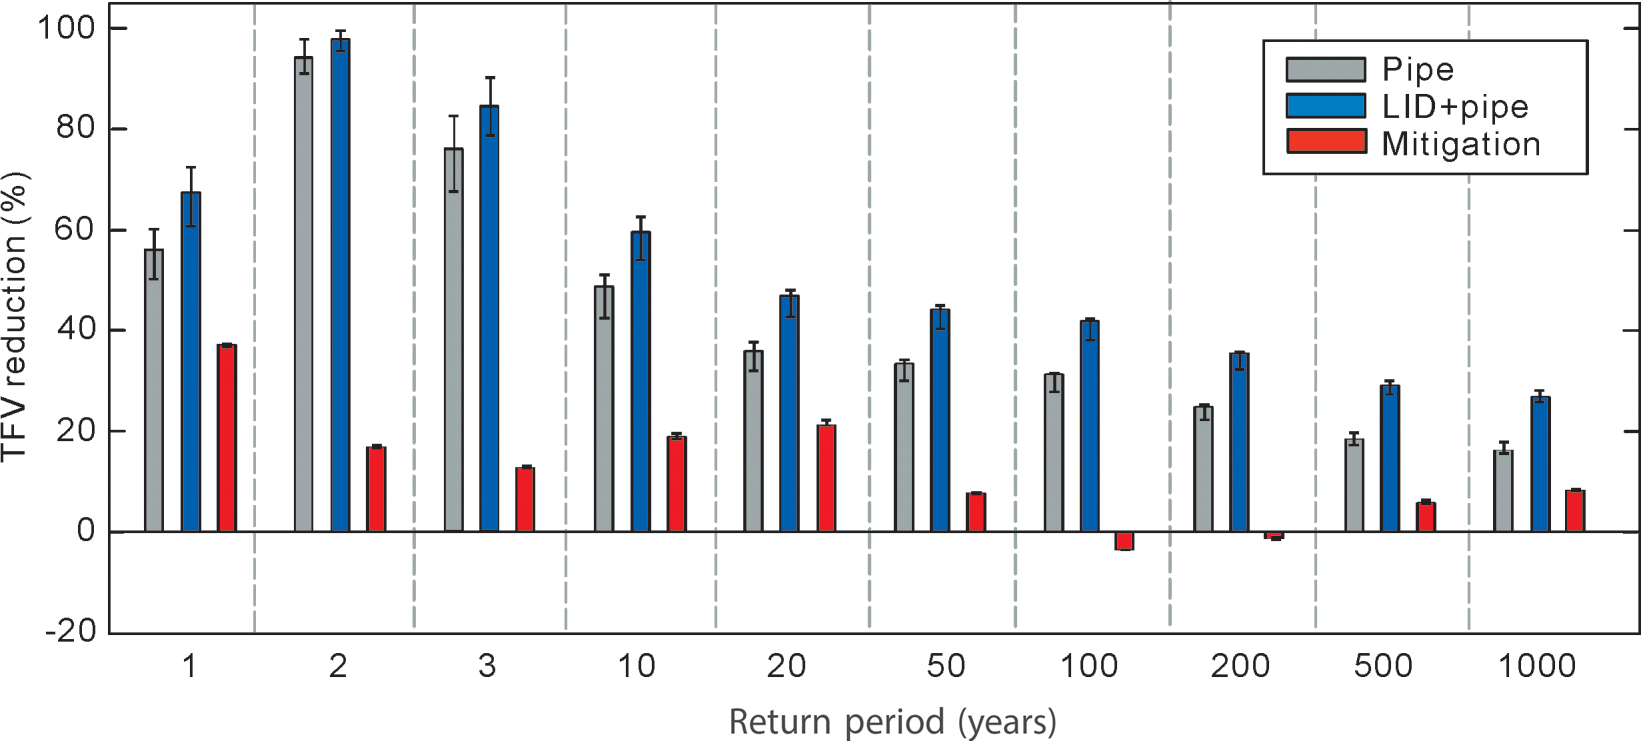
Figure 7Comparison of benefits of climate mitigation and two adaptation strategies in reducing urban flood volumes with changes in precipitation intensities for various return periods, and with related variations (boundary bars) as a result of uncertainty arising from local soil conditions.
It is noted that local soil characteristics could affect the performance of the designed adaptation systems, in particular the LID measures. However, information about soil properties was not available at the subcatchment level in the study region. Here, a set of sensitivity experiments was conducted by adopting different parameters (e.g. infiltration values) associated with possible soil conditions (i.e. dry sand, loam, and clay soils with little or no vegetation in Table S1) for the area. The whiskers in Fig. 7 show the uncertainty range arising from the representation of different soil conditions in the drainage model. The benefits of the designed adaptation measures in reducing urban flood volumes were found to be robust regardless of soil conditions, and such benefits exceeded those of climate change mitigation, confirming our major conclusions found in this study.
A number of uncertainties and limitations arise from the model structure, parameter inputs, emission scenarios, GCMs, climate downscaling/bias-correction approaches, etc. Specifically, climate projections by GCMs are subject to large uncertainties, in particular regarding precipitation (Covey et al., 2003) at spatial scales which are relevant for urban flood modelling. An alternative approach is to simulate future climate using a regional climate model (RCM) nested within a GCM. Such climate projections by RCMs have added value in terms of higher spatial resolution, which can provide more detailed regional climate information. However, various levels of bias would still remain in RCM simulations and bias corrections of RCM projections would be required; e.g. the European project ENSEMBLES. Running an RCM was not within the scope of this study; instead, we tended to use publicly available climate projections. Here, we obtained the climate projections from the ISI-MIP (Warszawski et al., 2014), which provides spatially downscaled climate data for impact models. The climate projections were also bias-corrected against observations (Hempel et al., 2013) and have been widely used in climate change impact studies on hydrological extremes such as floods and droughts (e.g. Dankers et al., 2014; Prudhomme et al., 2014; Leng et al., 2015a). It should be noted that we used the delta change factor to derive future climate scenarios as inputs into our drainage model instead of using GCM climate directly. This is because the relative climate change signal simulated by GCMs is argued to be more reliable than the simulated absolute values (Ho et al., 2012). Moreover, we used an ensemble of GCM simulations rather than one single climate model in order to characterise the uncertainty range arising from climate projections. However, disadvantages of this method are that transient climate changes cannot be represented and that changes in intra-seasonal or daily climate variability are not taken into account (Leng and Tang, 2014). Such sources of uncertainty can be explored when improved climate models at finer scales become available (Jaramillo and Nazemi, 2017).
In addition, the SIF parameters were assumed to remain stable in the future and only changes in the daily mean intensity were considered, because future sub-hourly climate projections were not readily available. The full climate variability range would also be under-sampled, although we used five climate models to show the possible range. Given the above limitations, we acknowledge that the modelling results represent the first-order potential climate change impacts on urban floods. Future efforts should be devoted to the representation of dynamic rainfall changes at hourly time steps considering non-stationary climate change.
Moreover, several assumptions had to be made due to limitations of the current modelling structure and approach. For example, the conveyance capacities of the drainage system and flood volume would largely depend on the state of drainage systems. Hence, a drainage system obstructed by vegetation, waste, or artefacts (cables, pipes, temporary structures) could make the outcomes of the SWMM calculation significantly different from observations. However, quantifying the impacts of drainage system states on urban flood volumes is not trivial because of the difficulties involved in collecting field data and selecting and using appropriate methods for reasonable assessment of pipe conditions (Ana and Bauwens, 2007; Fenner, 2000), and was not within the scope of this study. With deterioration, such as ageing networks, pipe deterioration, blockage, and construction failures, drainage systems were shown to become more vulnerable to extreme rainfalls as demonstrated in previous studies (Dawson et al., 2008; CIRIA, 1997; Davies et al., 2001). It is very likely that our simulated urban flood volumes would be underestimated without considering the changes in drainage conditions (Pollert et al., 2005).
Further, constrained by the one-dimensional modelling approach using SWMM, the performance of LID measures was mainly evaluated according to their effects at reducing water volume from overloaded manholes (Oraei Zare et al., 2012; Lee et al., 2013). That is, the LID adaptation measure was mainly designed to reduce the amount of water rather than slowing down the water speed, which has been demonstrated to be effective at reducing urban floods (Messner et al., 2006; Ashley et al., 2007; Floodsite, 2009). However, it should be noted that most LID measures can reduce runoff volume and flow speed at the same time, although some of the LID measures are primarily designed to slow down the flow speed, i.e. vegetated swales. To examine whether flood retention of a given event is induced by runoff volume or the internal speed control function in the model is difficult and requires detailed data for model validations. Specifically, the required information about surface roughness, soil conductivity, and seepage rate were unavailable at the subcatchment scale in the study region. Therefore, a simplified modelling approach was used to take advantage of existing data, especially for the design of LID measures. With the aid of more detailed field data and planning documents, the design of LID measures could be significantly improved by implementing more advanced approaches (Elliott and Trowsdale, 2007; Zoppou, 2001).
Evaluation of other potential adaptation strategies, such as flood retention by rain gardens and green roofs, can be explored in the future to gain additional insights into the performance of LID systems. In particular, the cost-effectiveness of the proposed adaptation measures should be accounted for. Indeed, a major limitation of this study is lack of assessment of costs and benefits of adaptation measures from an economic perspective. In fact, besides the effectiveness of proposed adaptation measures in reducing flood volume, assessment of the associated economic costs is essential for flood risk management (Rojas et al., 2013; Veith et al., 2003; Hinkel et al., 2014; Aerts et al., 2014; Ward et al., 2017). For example, Ward et al. (2017) showed that investments in urban flood protections with dykes are not economically attractive everywhere. Higher investment and maintenance costs may prohibit the implementation of adaptation strategies as proposed in this study. Future efforts should therefore be devoted to building a framework for assessing the costs and benefits of urban flood reduction measures and examine whether the reduced losses are higher than the costs of investments and maintenance of these measures.
Nevertheless, given these limitations, this study stands out from previous climate impact assessment studies of urban flood volumes by having proposed two feasible adaptation strategies and compared their benefits to those from global-scale climate change mitigation through GHG reductions within a consistent framework. Depending on the progress at data collection and the demands of local authorities, more advanced methods for pipe assessment (e.g. considering the changing pipe conditions), LID measures (detailed modelling of LID control), and two-dimensional surface flooding for assessment of flood damage and risk are planned in a future study to provide a more comprehensive analysis of the adaptation measures.
The potential impacts of future climate change on current urban drainage systems have received increasing attention during recent decades because of the devastating impacts of urban flooding on the economy and society (Chang et al., 2013; Zhou et al., 2012; Abdellatif et al., 2015). However, few studies have explored the role of both climate change mitigation and drainage adaptations in coping with urban flooding in a changing climate. This study investigated the performance of a drainage system in a typical city in northern China in response to various future scenarios. In particular, we assessed the potential changes in urban flood volume and explored the role of both mitigation and adaptation in reducing urban flood volumes in a consistent manner.
Our results show significant increases in urban flood volumes due to increases in precipitation extremes, especially for return periods of less than 10 years. Overall, urban flood volume in the study region is projected to increase by 52 % by the multi-model ensemble median in the period of 2020–2040. Such increases in flood volume can be reduced considerably by climate change mitigation through reduction of GHG emissions. For example, the future TFVs under 1-year extreme rainfall events can be reduced by 50 % when climate change mitigation is in place. Besides global-scale climate change mitigation, regional/local adaptation can be implemented to cope with the adverse impacts of future climate change on urban flood volumes. Here, the adaptation measures as designed in this study were demonstrated to be much more effective at reducing future flood volumes than climate change mitigation measures. In general, the reduced flood volumes achieved by adaptation were more than double those achieved by climate change mitigation.
Through comprehensive investigation of future urban floods, this study provides much-needed insights into urban flood management for similar urban areas in China, most of which are equipped with highly insufficient drainage capacities. By comparing the reduction of flood volume by climate change mitigation (via reduction of GHG emissions) and local adaptation (via improvement of drainage systems), this study highlights the effectiveness of system adaptations in reducing future flood volumes. This has important implications for the research community and decision makers involved in urban flood management. We emphasise the importance of accounting for both global-scale climate change mitigation and local-scale adaptation in assessing future climate impacts on urban flood volumes within a consistent framework.
Datasets used in this study are freely available by contacting the corresponding author, Guoyong Leng, at guoyong.leng@ouce.ox.ac.uk.
The supplement related to this article is available online at: https://doi.org/10.5194/hess-22-305-2018-supplement.
The authors declare that they have no conflict of interest.
This research was supported by the Public Welfare Research and Ability
Construction Project of Guangdong Province, China (grant no. 2017A020219003),
the Water Conservancy Science and Technology Innovation Project of Guangdong
province, China (grant no. 201710), the Natural Science Foundation of
Guangdong Province, China (no. 2014A030310121), and the Scientific Research
Foundation for the Returned Overseas Chinese Scholars, State Education
Ministry. Guoyong Leng and Maoyi Huang were supported by the Integrated
Assessment Research program through the Integrated Multi-sector, Multi-scale
Modeling (IM3) Scientific Focus Area (SFA) sponsored by the Biological
and Environmental Research Division of Office of Science, U.S. Department of
Energy. The Pacific Northwest National Laboratory (PNNL) is operated for the
U.S. DOE by Battelle Memorial Institute under contract
DE-AC05-76RL01830.
Edited by: Carlo De
Michele
Reviewed by: three anonymous referees
Abdellatif, M., Atherton, W., Alkhaddar, R., and Osman, Y.: Flood risk assessment for urban water system in a changing climate using artificial neural network, Nat. Hazards, 79, 1059–1077, 2015.
Aerts, J. C., Botzen, W. W., Emanuel, K., Lin, N., de Moel, H., and Michel-Kerjan, E. O.: Evaluating flood resilience strategies for coastal megacities, Science, 344, 473–475, 2014.
Akan, O. A.: Urban stormwater hydrology: a guide to engineering calculations, CRC Press, Basel, Switzerland, 1993.
Alfieri, L., Feyen, L., and Di Baldassarre, G.: Increasing flood risk under climate change: a pan-European assessment of the benefits of four adaptation strategies, Climatic Change, 136, 507–521, https://doi.org/10.1007/s10584-016-1641-1, 2016.
Ana, E. and Bauwens, W.: Sewer network asset management decision-support tools: a review, International Symposium on New Directions in Urban Water Management, 12–14 September 2007, UNESCO Paris, 2007.
Apel, H., Aronica, G. T., Kreibich, H., and Thieken, A. H.: Flood risk analyses-how detailed do we need to be?, Nat. Hazards, 49, 79–98, 2009.
Arnbjerg-Nielsen, K.: Quantification of climate change effects on extreme precipitation used for high resolution hydrologic design, Urban Water J., 9, 57–65, 2012.
Arnbjerg-Nielsen, K., Leonardsen, L., and Madsen, H.: Evaluating adaptation options for urban flooding based on new high-end emission scenario regional climate model simulations, Clim. Res., 64, 73–84, https://doi.org/10.3354/cr01299, 2015.
Ashley, R., Garvin, S., Pasche, E., Vassilopoulos, A., and Zevenbergen, C.: Advances in Urban Flood Management, edited by: Ashley, R., Garvin, S., Pasche, E., Vassilopoulos, A., and Zevenbergen, C., Taylor & Francis/Balkema, London, UK, 2007.
Ashley, R. M., Balmforth, D. J., Saul, A. J., and Blanskby, J. D.: Flooding in the future – predicting climate change, risks and responses in urban areas, Water Sci. Technol., 52, 265–273, 2005.
Butler, D. and Davies, J.: Urban drainage, Third Edn., CRC Press, London, ISBN: 0415455251, 2010.
China Statistical Yearbook: National Bureau of Statistics of China, China Statistics Press, Beijing, 2015.
Chang, H. K., Tan, Y. C., Lai, J. S., Pan, T. Y., Liu, T. M., and Tung, C. P.: Improvement of a drainage system for flood management with assessment of the potential effects of climate change, Hydrolog. Sci. J., 58, 1581–1597, 2013.
Chow, V. T., Maidment, D. R., and Mays, L. W.: Applied Hydrology, 2nd Edn., in, McGraw-Hill, New York, ISBN: 007174391X, 2013.
CIRIA: Risk Management for Real Time Control in Urban Drainage Systems: Scoping Study, Project Report 45, CIRIA, London, 1997.
Coles, S.: An Introduction to Statistical Modeling of Extreme Values, Springer Series in Statistics, Springer, London, 2001.
Covey, C., AchutaRao, K. M., Cubasch, U., Jones, P., Lambert, S. J., Mann, M. E., Phillips, T. J., and Taylor, K. E.: An overview of results from the Coupled Model Intercomparison Project, Global Planet. Change, 37, 103–133, 2003.
Dankers, R., Arnell, N. W., Clark, D. B., Falloon, P. D., Fekete, B. M., Gosling, S. N., Heinke, J., Kim, H., Masaki, Y., Satoh, Y., and Stacke, T.: First look at changes in flood hazard in the Inter-Sectoral Impact Model Intercomparison Project ensemble, P. Natl. Acad. Sci. USA, 111, 3257–3261, 2014.
Davies, J. P., Clarke, B. A., Whiter, J. T., and Cunningham, R. J.: Factors influencing the structural deterioration and collapse of rigid sewer pipes, Urban Water, 3, 73–89, 2001.
Dawson, R. J., Speight, L., Hall, J. W., Djordjevic, S., Savic, D., and Leandro, J.: Attribution of flood risk in urban areas, J. Hydroinform., 10, 275–288, 2008.
Ding, Y., Ren, G., Shi, G., Gong, P., Zheng, X., Zhai, P., Zhang, D., Zhao, Z., Wang, S., Wang, H., Luo, Y., Chen, D., Gao, X., and Dai, X.: National assessment report of climate change (I): climate change in China and its future trend, Adv. Clim. Change Res., 2, 3–8, 2006 (in Chinese).
Elliott, A. H. and Trowsdale, S. A.: A review of models for low impact urban stormwater drainage, Environ. Modell. Softw., 22, 394–405, 2007.
Elliott, J., Deryng, D., Müller, C., Frieler, K., Konzmann, M., Gerten, D., Glotter, M., Flörke, M., Wada, Y., Best, N., and Eisner, S.: Constraints and potentials of future irrigation water availability on agricultural production under climate change, P. Natl. Acad. Sci. USA, 111, 3239–3244, 2014.
Fenner, R. A.: Approaches to sewer maintenance: a review, Urban Water, 2, 343–356, 2000.
Floodsite: Flood risk assessment and flood risk management. An introduction and guidance based on experiences and findings of FLOODsite (an EU-funded Integrated Project), Deltares, Delft Hydraulics, ISBN: 978 90 8 4067 0, 2009.
Haddeland, I., Heinke, J., Biemans, H., Eisner, S., Flörke, M., Hanasaki, N., Konzmann, M., Ludwig, F., Masaki, Y., Schewe, J., and Stacke, T.: Global water resources affected by human interventions and climate change, P. Natl. Acad. Sci. USA, 111, 3251–3256, 2014.
Hempel, S., Frieler, K., Warszawski, L., Schewe, J., and Piontek, F.: A trend-preserving bias correction – the ISI-MIP approach, Earth Syst. Dynam., 4, 219–236, https://doi.org/10.5194/esd-4-219-2013, 2013.
Hinkel, J., Lincke, D., Vafeidis, A. T., Perrette, M., Nicholls, R. J., Tol, R. S., Marzeion, B., Fettweis, X., Ionescu, C., and Levermann, A.: Coastal flood damage and adaptation costs under 21st century sea-level rise, P. Natl. Acad. Sci., 111, 3292–3297, 2014.
Horritt, M. S. and Bates, P. D.: Evaluation of 1D and 2D numerical models for predicting river flood inundation, J. Hydrol., 268, 87–99, 2002.
Ho, C. K., Stephenson, D. B., Collins, M., Ferro, C. A., and Brown, S. J.: Calibration strategies: a source of additional uncertainty in climate change projections, B. Am. Meteorol. Soc., 93, 21–26, 2012.
Jaramillo, P. and Nazemi, A.: Assessing Urban Water Security under Changing Climate: Challenges and Ways Forward, Sustain. Cities Soc., https://doi.org/10.1016/j.scs.2017.04.005, in press, 2017.
Karamouz, M., Nazif, S., and Zahmatkesh, Z.: Self-Organizing Gaussian-Based Downscaling of Climate Data for Simulation of Urban Drainage Systems, J. Irrig. Drainage Eng., 139, 98–112, 2013.
Katz, R. W., Parlange, M. B., and Naveau, P.: Statistics of extremes in hydrology, Adv. Water Resour., 25, 1287–1304, 2002.
Larsen, A. N., Gregersen, I. B., Christensen, O. B., Linde, J. J., and Mikkelsen, P. S.: Potential future increase in extreme one-hour precipitation events over Europe due to climate change, Water Sci. Technol., 60, 2205–2216, 2009.
Lee, J. M., Hyun, K. H., and Choi, J. S.: Analysis of the impact of low impact development on runoff from a new district in Korea, Water Sci. Technol., 68, 1315–1321, 2013.
Leng, G. and Tang, Q.: Modeling the impacts of future climate change on irrigation over China: Sensitivity to adjusted projections, J. Hydrometeorol., 15, 2085–2103, 2014.
Leng, G., Tang, Q., and Rayburg, S.: Climate change impacts on meteorological, agricultural and hydrological droughts in China, Global Planet. Change, 126, 23–34, 2015a.
Leng, G., Huang, M., Tang, Q., and Leung, L. R.: A modeling study of irrigation effects on global surface water and groundwater resources under a changing climate, J. Adv. Model. Earth Sy., 7, 1285–1304, 2015b.
Messner, F., Penning-Rowsell, E., Green, C., Meyer, V., Tunstall, S., and Van der Veen, A.: Guidelines for Socio-economic Flood Damage Evaluation, Report Nr. T9-06-01, FLOOD site, HR Wallingford, UK, 2006.
Mishra, A.: A study on the occurrence of flood events over Jammu and Kashmir during September 2014 using satellite remote sensing, Nat. Hazards, 78, 1463–1467, 2015.
Moore, T. L., Gulliver, J. S., Stack, L., and Simpson, M. H.: Stormwater management and climate change: vulnerability and capacity for adaptation in urban and suburban contexts, Climatic Change, 138, 491–504, https://doi.org/10.1007/s10584-016-1766-2, 2016.
Notaro, V., Liuzzo, L., Freni, G., and La Loggia, G.: Uncertainty Analysis in the Evaluation of Extreme Rainfall Trends and Its Implications on Urban Drainage System Design, Water, 7, 6931–6945, 2015.
Olsen, A., Zhou, Q., Linde, J., and Arnbjerg-Nielsen, K.: Comparing Methods of Calculating Expected Annual Damage in Urban Pluvial Flood Risk Assessments, Water, 7, 255–270, 2015.
Olsson, J., Berggren, K., Olofsson, M., and Viklander, M.: Applying climate model precipitation scenarios for urban hydrological assessment: A case study in Kalmar City, Sweden, Atmos. Res., 92, 364–375, https://doi.org/10.1016/j.atmosres.2009.01.015, 2009.
Oraei Zare, S., Saghafian, B., and Shamsai, A.: Multi-objective optimization for combined quality-quantity urban runoff control, Hydrol. Earth Syst. Sci., 16, 4531–4542, https://doi.org/10.5194/hess-16-4531-2012, 2012.
Pazwash, H.: Urban Storm Water Management, CRC Press, Taylor and Francis, Boca Raton, FL, 2011.
Peng, H. Q., Liu, Y., Wang, H. W., and Ma, L. M.: Assessment of the service performance of drainage system and transformation of pipeline network based on urban combined sewer system model, Environ. Sci. Pollut. R., 22, 15712–15721, 2015.
Piani, C., Weedon, G. P., Best, M., Gomes, S. M., Viterbo, P., Hagemann, S., and Haerter, J. O.: Statistical bias correction of global simulated daily precipitation and temperature for the application of hydrological models, J. Hydrol., 395, 199–215, 2010.
Piontek, F., Müller, C., Pugh, T. A., Clark, D. B., Deryng, D., Elliott, J., González, F. D. J. C., Flörke, M., Folberth, C., Franssen, W., and Frieler, K.: Multisectoral climate impact hotspots in a warming world, P. Natl. Acad. Sci. USA, 111, 3233–3238, 2014.
Pollert, J., Ugarelli, R., Saegrov, S., Schilling, W., and Di Federico, V.: The hydraulic capacity of deteriorating sewer systems, Water Sci. Technol., 52, 207–214, 2005.
Poussin, J. K., Bubeck, P., Aerts, J. C. J. H., and Ward, P. J.: Potential of semi-structural and non-structural adaptation strategies to reduce future flood risk: case study for the Meuse, Nat. Hazards Earth Syst. Sci., 12, 3455–3471, https://doi.org/10.5194/nhess-12-3455-2012, 2012.
Prudhomme, C., Giuntoli, I., Robinson, E. L., Clark, D. B., Arnell, N. W., Dankers, R., Fekete, B. M., Franssen, W., Gerten, D., Gosling, S. N., and Hagemann, S.: Hydrological droughts in the 21st century, hotspots and uncertainties from a global multimodel ensemble experiment, P. Natl. Acad. Sci. USA, 111, 3262–3267, 2014.
Rojas, R., Feyen, L., and Watkiss, P.: Climate change and river floods in the European Union: Socio-economic consequences and the costs and benefits of adaptation, Global Environ. Chang., 23, 1737–1751, https://doi.org/10.1016/j.gloenvcha.2013.08.006, 2013.
Rossman, L. A. and Huber, W. C.: Storm Water Management Model Reference Manual EPA/600/R-15/162A, 2016.
Veith, T. L., Wolfe, M. L., and Heatwole, C. D.: Optimization procedure for cost effective BMP placement at a watershed scale, J. Am. Water Resour. As., 39, 1331–1343, https://doi.org/10.1111/j.1752-1688.2003.tb04421.x, 2003.
Vojinovic, Z. and Tutulic, D.: On the use of 1D and coupled 1D-2D modelling approaches for assessment of flood damage in urban areas, Urban Water J., 6, 183–199, 2009.
Ward, P. J., Jongman, B., Aerts, J. C., Bates, P. D., Botzen, W. J., Loaiza, A. D., Hallegatte, S., Kind, J. M., Kwadijk, J., Scussolini, P., and Winsemius, H. C.: A global framework for future costs and benefits of river-flood protection in urban areas, Nature Climate Change, 7, 642–646, 2017.
Warszawski, L., Frieler, K., Huber, V., Piontek, F., Serdeczny, O., and Schewe, J.: The Inter-Sectoral Impact Model Intercomparison Project [ISI-MIP]: Project framework, P. Natl. Acad. Sci. USA, 111, 3228–3232, 2014.
Willems, P.: Revision of urban drainage design rules after assessment of climate change impacts on precipitation extremes at Uccle, Belgium, J. Hydrol., 496, 166–177, 2013.
Willems, P., Arnbjerg-Nielsen, K., Olsson, J., and Nguyen, V. T. V.: Climate change impact assessment on urban rainfall extremes and urban drainage: Methods and shortcomings, Atmos. Res., 103, 106–118, 2012.
Yang, G.: Historical change and future trends of storm surge disaster in China's coastal area, Journal of Natural Disasters 9, 23–30, (in Chinese) 2000.
Yazdanfar, Z. and Sharma, A.: Urban drainage system planning and design-challenges with climate change and urbanization: a review, Water Sci. Technol., 72, 165–179, 2015.
Zahmatkesh, Z., Karamouz, M., Goharian, E., and Burian, S. J.: Analysis of the Effects of Climate Change on Urban Storm Water Runoff Using Statistically Downscaled Precipitation Data and a Change Factor Approach, J. Hydrol. Eng., 20, 05014022, https://doi.org/10.1061/(ASCE)HE.1943-5584.0001064, 2015.
Zhang, B. and Guan, Y.: Watersupply & Drainage Design Handbook, China Construction Industry Press, Being, China, ISBN: 9787112136803, 2012.
Zhou, Q., Mikkelsen, P. S., Halsnaes, K., and Arnbjerg-Nielsen, K.: Framework for economic pluvial flood risk assessment considering climate change effects and adaptation benefits, J. Hydrol., 414, 539–549, 2012.
Zhou, Q., Ren, Y., Xu, M., Han, N., and Wang, H.: Adaptation to urbanization impacts on drainage in the city of Hohhot, China, Water Sci. Technol., 73, 167–175, https://doi.org/10.2166/wst.2015.478, 2016.
Zhou, Q., Leng, G., and Feng, L.: Predictability of state-level flood damage in the conterminous United States: the role of hazard, exposure and vulnerability, Sci. Rep., 7, 5354, https://doi.org/10.1038/s41598-017-05773-4,, 2017.
Zoppou, C.: Review of urban storm water models, Environ. Modell. Softw., 16, 195–231, 2001.