the Creative Commons Attribution 4.0 License.
the Creative Commons Attribution 4.0 License.
 | 25 Apr 2018
Assessing the hydrologic response to wildfires in mountainous regions
Aaron Havel
Ali Tasdighi
Mazdak Arabi
This study aims to understand the hydrologic responses to wildfires in mountainous regions at various spatial scales. The Soil and Water Assessment Tool (SWAT) was used to evaluate the hydrologic responses of the upper Cache la Poudre Watershed in Colorado to the 2012 High Park and Hewlett wildfire events. A baseline SWAT model was established to simulate the hydrology of the study area between the years 2000 and 2014. A procedure involving land use and curve number updating was implemented to assess the effects of wildfires. Application of the proposed procedure provides the ability to simulate the hydrologic response to wildfires seamlessly through mimicking the dynamic of the changes due to wildfires. The wildfire effects on curve numbers were determined comparing the probability distribution of curve numbers after calibrating the model for pre- and post-wildfire conditions. Daily calibration and testing of the model produced “very good” results. No-wildfire and wildfire scenarios were created and compared to quantify changes in average annual total runoff volume, water budgets, and full streamflow statistics at different spatial scales. At the watershed scale, wildfire conditions showed little impact on the hydrologic responses. However, a runoff increase up to 75 % was observed between the scenarios in sub-watersheds with high burn intensity. Generally, higher surface runoff and decreased subsurface flow were observed under post-wildfire conditions. Flow duration curves developed for burned sub-watersheds using full streamflow statistics showed that less frequent streamflows become greater in magnitude. A linear regression model was developed to assess the relationship between percent burned area and runoff increase in Cache la Poudre Watershed. A strong (R2 > 0.8) and significant (p < 0.001) positive correlation was determined between runoff increase and percentage of burned area upstream. This study showed that the effects of wildfires on hydrology of a watershed are scale-dependent. Also, using full streamflow statistics through application of flow duration curves revealed that the wildfires had a higher effect on peak flows, which may increase the risk of flash floods in post-wildfire conditions.
- Article
(7902 KB) - Full-text XML
- BibTeX
- EndNote


Assessing the hydrologic and water quality effects of wildfires is becoming more important as the frequency and severity of wildfires in the United States and other regions around the world have shown increasing trends (Westerling, 2016; Doerr and Santín, 2016; Ebel et al., 2012). Wildfires may have undesired consequences for water quality, carbon storage, and ecosystem disturbance (Gould et al., 2016; Holden et al., 2012; Moody and Martin, 2009). Wildfire-prone regions, often with increasing populations, are susceptible to loss of life and catastrophic destruction from floods and debris flows as a result of higher runoff and erosion under post-wildfire conditions (Moody et al., 2013). Assessing the hydrologic effects of wildfires in mountainous regions is particularly interesting as these areas often contain the headwater sub-watersheds supplying water that is relied upon downstream (Viviroli et al., 2007). Wildfires could alter the timing and magnitude of runoff and subsurface flow, along with other hydrologic fluxes, which eventually will reduce the reliability of water supply in these areas (Ebel et al., 2012).
Characterization of complex responses to wildfires is difficult due to the spatial variability of post-wildfire conditions (Moody et al., 2013). Wildfires can substantially change land use–land cover (LULC) and vegetation within watersheds, which may subsequently result in altering hydrologic regimes including (1) increased availability of rainfall for runoff by decreasing canopy interception (Moody and Martin, 2009; Robichaud et al., 2000), (2) increased base flow through the decrease of water normally lost through evapotranspiration (Neary et al., 2003), and (3) increased runoff velocities and reduced interception/storage through loss of ground cover, litter, duff, and debris (Moody and Martin, 2001). These alterations can cause increased hillslope erosion and may significantly alter terrestrial habitat. They may also increase channel flooding, decrease channel stability, fill the streambed with fine sediment, and modify temperature regimes (Ryan et al., 2011).
Mathematical modeling is a useful and well accepted approach for improving our understanding of complex watershed processes (Kiesel et al., 2013). Various approaches are adopted in the literature for modeling the hydrologic and water quality processes in watersheds ranging from purely empirical to fully process-based models (Beven, 2001; Famiglietti and Wood, 1995). Process-based hydrologic models have been used in the literature extensively to simulate the effects of natural and anthropogenic perturbations on the hydrologic regime (Clark et al., 2017). Application of these models to assess the effects of wildfires entails availability of mechanisms for updating model parameters and inputs such as land use which may not be readily available in most models. The Soil and Water Assessment Tool (SWAT) is a process-based distributed parameter watershed model that has been used to characterize and quantify the effects of LULC change, climate change, and mitigation strategies on runoff, evapotranspiration, streamflow, groundwater, and other hydrologic responses, showing very good results in terms of model performance (Tasdighi et al., 2017; Motallebi et al., 2017; El-Khoury et al., 2015; Fan and Shibata, 2015; Foy et al., 2015). More specifically, numerous studies involving SWAT model development and calibration have been conducted to evaluate the hydrology in mountainous and snow-driven regions throughout the world, including this study watershed (Foy et al., 2015; Sanadhya et al., 2014); Cannonsville Reservoir watershed, New York (Tolson and Shoemaker, 2007); the Little River watershed, Tennessee (Zhu and Li, 2014); two Himalayan drainages of Nepal (Neupane et al., 2015); and the Yingluoxia watershed of northwest China (Lu et al., 2015). These studies document promising results for the application of SWAT for hydrologic simulations in mountainous regions.
One of the challenges in using models for evaluating the hydrologic response of a system to wildfire is developing the mechanism through which the hydrologic effects of wildfires are simulated. Studies have used alteration of model parameters and LULC to represent pre- and post-wildfire conditions (Parson et al., 2010; Robichaud, 2000). The majority of these studies have used field measurements or implemented a deterministic approach using fixed values for specific parameters during the pre- and post-wildfire conditions to represent the change in hydrology as a result of wildfire (Parson et al., 2010; Robichaud et al., 2007). This approach has a direct impact on the results obtained as the selection of parameters to change and the values assigned to them during pre- and post-wildfire conditions are subjective and may not necessarily represent the changes in the real world. Additionally, a lack of required components (modules in the model) for representing LULC change adds to the complexity of the procedure (Batelis and Nalbantis, 2014; Goodrich et al., 2005; McLin et al., 2001). A proper LULC change component in the model is required for continuous simulation and is particularly important when assessing effects of wildfires. The LULC change module within SWAT has been shown to be useful for evaluating hydrologic conditions where LULC has changed as the result of urbanization (Pai and Saraswat, 2001).
The 2012 Hewlett and High Park wildfires have provided a unique opportunity for examining the hydrologic responses to wildfires, specifically, in a mountainous region. This unique opportunity stems from the fact that a relatively significant proportion of the gaged Cache la Poudre (Poudre) headwaters (approximately 14 % from the Mouth of Canyon) has been burned as the result of wildfire. The pre- and post-wildfire streamflow data availability allows for the development, calibration, and testing of a hydrologic model that accounts for spatial variability in LULC to continuously simulate the hydrology from pre-wildfire conditions through post-wildfire conditions. Due to the magnitude of the 2012 wildfire incident, burn severity mapping is available for the area. These mapping data allow for a land use change module to be implemented during calibration efforts which adjusts hydrologic parameters impacted by wildfire seamlessly during simulation.
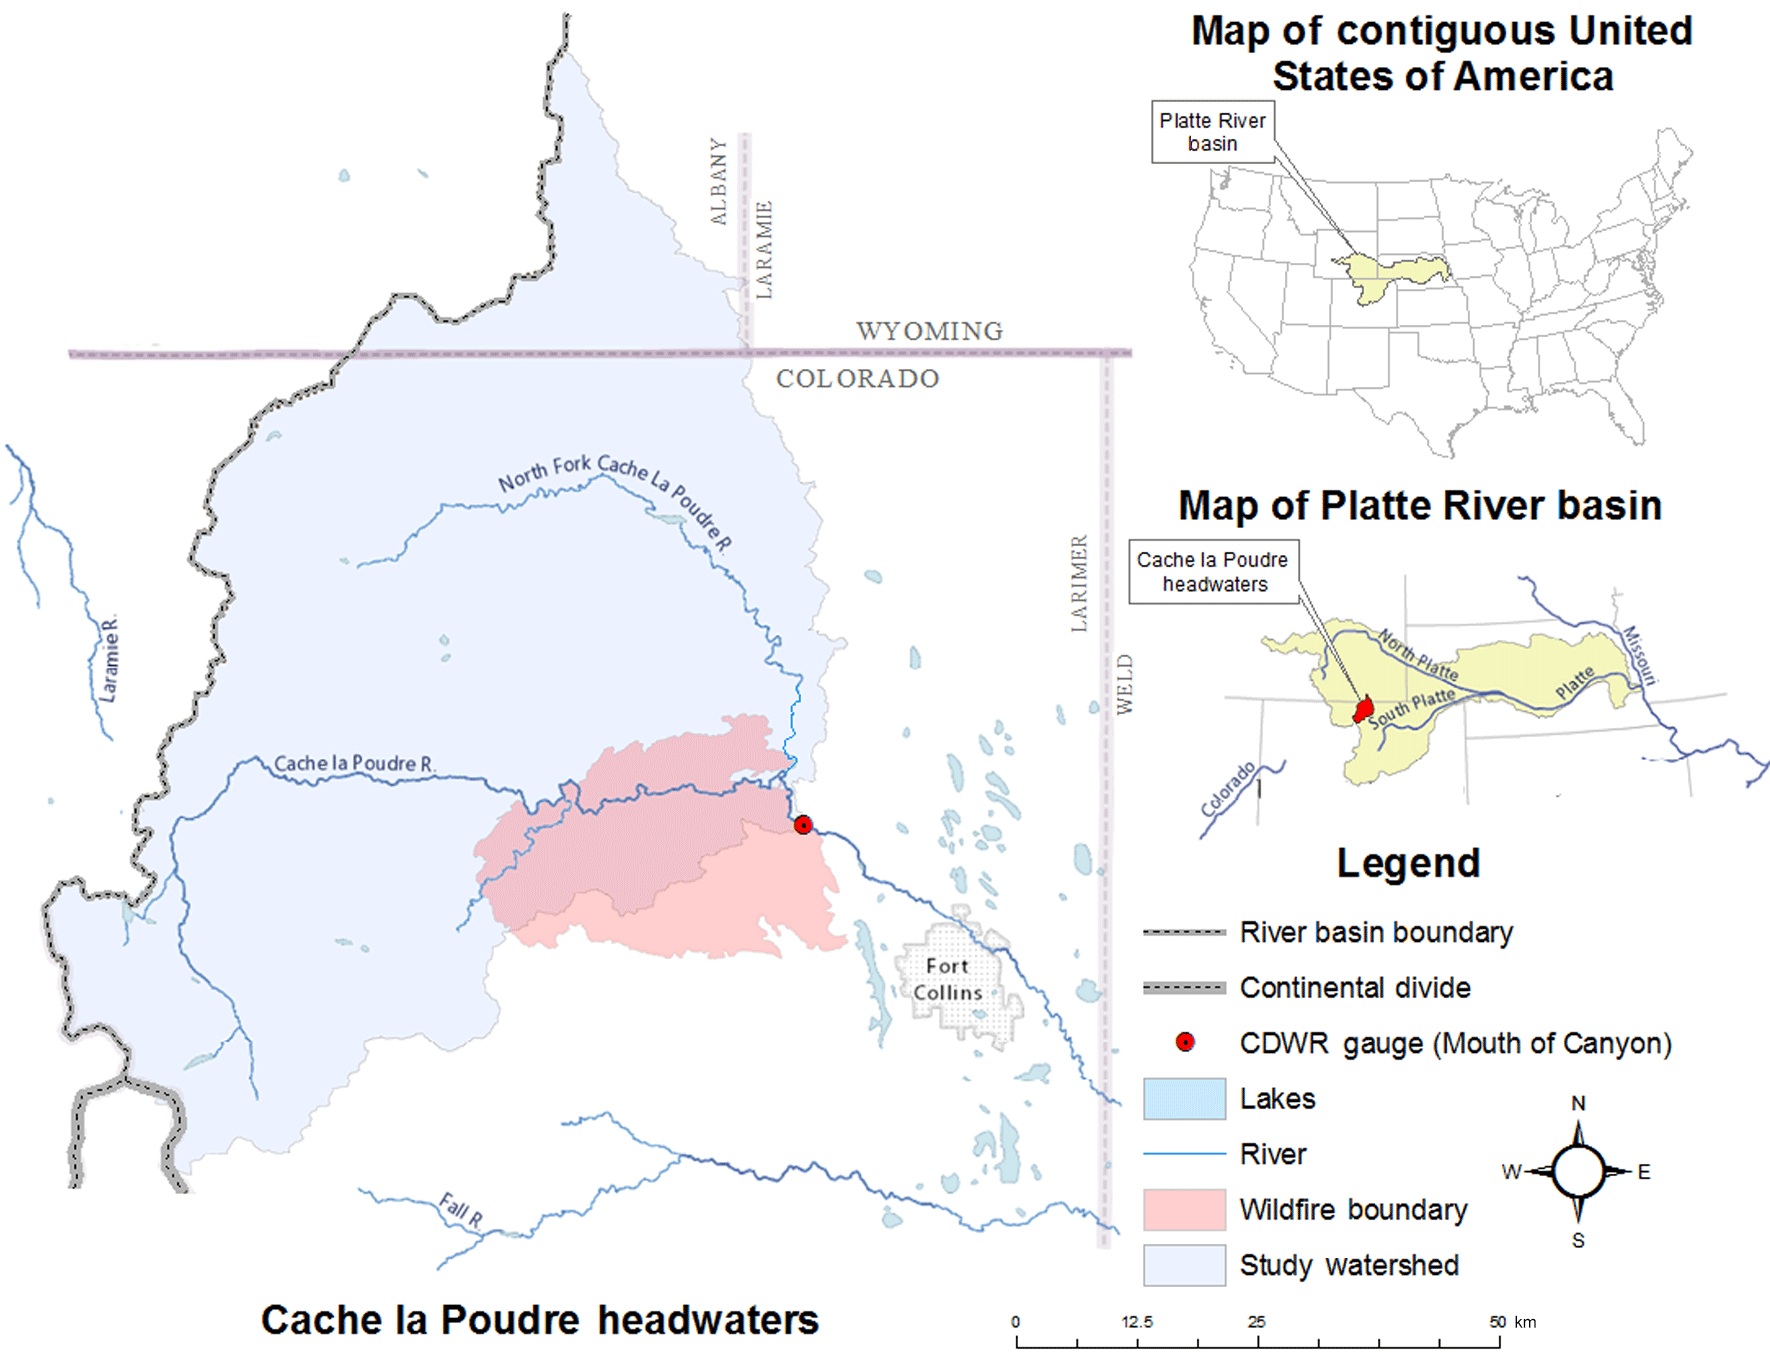
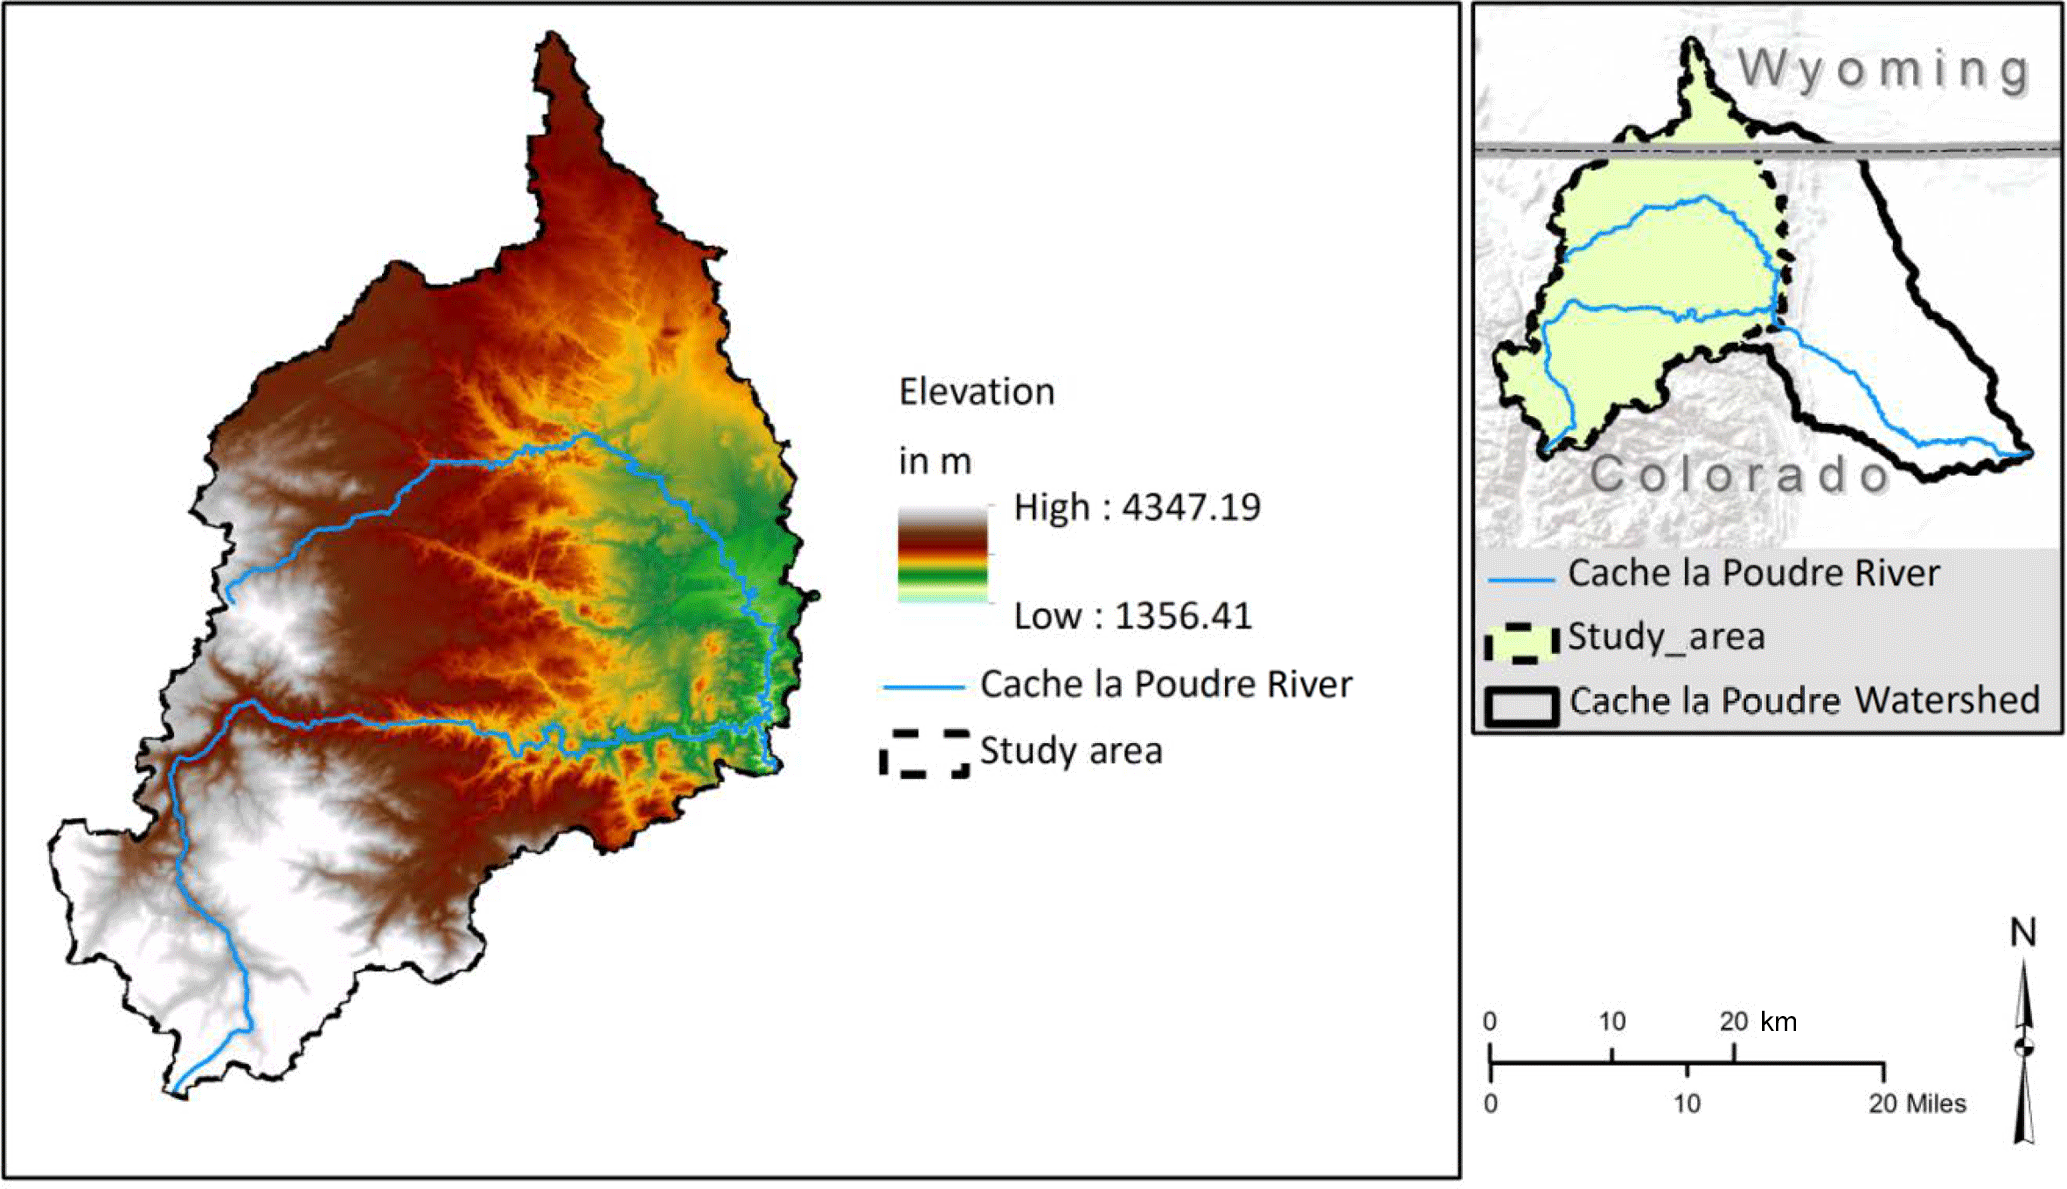
Figure 1Study area map which includes the location of the study watershed and the CDWR surface water gauge.
The overall goal of this study is to characterize and quantify the hydrologic responses to wildfires in mountainous regions at various spatial scales (smaller high burn intensity sub-watersheds to watershed scale). To accomplish this goal, the Poudre headwaters located in northern Colorado, United States, which experienced the 2012 Hewlett and High Park wildfires, were analyzed using the SWAT model. This analysis includes simulation of no-wildfire and wildfire scenarios over a 15-year (2000 to 2014) period. Specific objectives of this study are to (1) quantify changes in average annual total runoff volume and explore how these changes fluctuate with the percent of the area burned, (2) quantify annual changes in various components of the hydrologic budget, and (3) highlight potential implications of these changes using full streamflow statistics through the application of flow duration curves at both sub-watershed and watershed scales. While a number of previous studies have examined the hydrologic effects of wildfires, the application of a probabilistic approach for characterizing the change in key hydrologic parameters between the pre- and post-wildfire scenarios and a dynamic LULC updating through the analysis period is novel. The results of this study have important implications for the hydrologic effects of wildfires and the methods used to assess them.
2.1 Study area
The Poudre Watershed, with an area of approximately 5230 km2 above its confluence with the South Platte River on the Great Plains, is situated mostly in northern Colorado, United States, with a portion reaching into southern Wyoming, United States (Wohl, 2010). The Poudre River (Fig. 1) is supplied by two major tributaries within its headwaters, the South Fork and the North Fork, the latter being the longer of the two joining the main stem farther downstream. After streamflow retreats from the Poudre's headwaters in the Rocky Mountain range, the river passes through the cities of Fort Collins and Greeley. Eventually, the river joins the South Platte River and winds downstream to join the Platte River and then to the Missouri River. The Poudre River, with its minimally developed mountainous headwaters, is widely utilized as a source of drinking water for several cities and communities located along its banks (Richer, 2009).
During May and June 2012 the Hewlett and High Park wildfires burned approximately 384 m2 of primarily forested landscape within the Poudre Watershed. The burned area includes numerous drainage tributaries to the main stem of Poudre River. Widespread loss of vegetation and burned soils from the wildfires created areas susceptible to severe erosion and flooding. Localized summertime thunderstorms immediately following the wildfire worsened the effects by washing sediment and debris into the river channel, posing a threat to the safety of people and homes in the area (Oropeza and Heath, 2013). The affected area extends along the Poudre River from the mountain front upstream to several kilometers south of the community of Rustic, Colorado. Therefore, a study watershed outlet was defined near the mountain front at Colorado Division of Water Recourses' (CDWR) surface water gauge CLAFTCCO18 (formally USGS Gage 06752000), commonly referred to as the Mouth of Canyon (Fig. 1).
The resulting study watershed is approximately 2732 km2. At higher elevations, streamflow is dominated by snowmelt runoff and at lower elevations, rainfall runoff from summer convective storms greatly affects streamflow. The storms, combined with the upstream snowmelt runoff, can produce high-magnitude, short-lived floods at times (Wohl, 2010). The resulting hydrograph is snowmelt dominated with a rise typically beginning in April and a recession lasting into August. Generally, peak streamflow occurs at the end of May or early June and base flow levels occur in September or October (Richer, 2009).
2.2 Hydrologic model
2.2.1 SWAT model
SWAT is a continuous-time, distributed-parameter, process-based watershed model, which has been used extensively for hydrologic and water quality assessments under varying climatic, land use, and management conditions in small watersheds to large river basins (Gassman et al., 2007; Neitsch et al., 2011; Arnold et al., 2012, CARD Staff, 2016).
The SWAT model allows for numerous physical processes to be simulated in a watershed. These processes may be separated into two coarse divisions of the hydrologic cycle: the land phase and the routing phase. The main processes include precipitation, infiltration, surface runoff, evapotranspiration, groundwater flow, snowmelt, and flood routing. SWAT is driven by a water balance equation which relates individual components of the hydrologic cycle. Additional details including specific equations associated with the water balance and the individual hydrologic processes may be found in the SWAT Theoretical Documentation, Version 2009 (Neitsch et al., 2011).
In order to assess the hydrologic effects of wildfires, application of a continuous-time model is necessary as it will provide the capability to explore the long-term hydrologic effects (Jeong et al., 2010). Compared to event-based models, continuous time models better represent watersheds where channel storage may be significant and/or where significant variability exists in land use (e.g., urbanization), soil types, and/or topography (Arnold et al., 1995, 1998; Nicklow et al., 2006; Jeong et al., 2010). Being a distributed-parameter model, SWAT divides a watershed into sub-watersheds, which are further divided into hydrologic response units (HRUs). HRUs are the smallest spatial units in SWAT and are defined as areas within each sub-watershed with unique combinations of land use, soil, and slope class. Sub-watersheds can be assigned unique climate and hydrologic properties, which in combination with unique land use characteristics of HRUs, provides the capability to investigate the effects of land use change scenarios under varying climatic conditions, both spatially and temporally.
2.2.2 Updating LULC
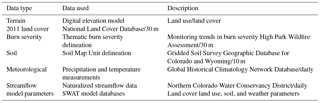
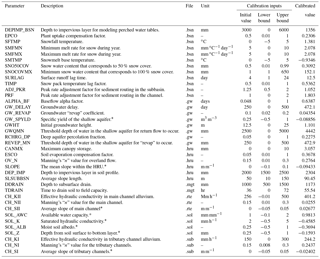
The hydrologic modeling process was initiated by first collecting and preparing the necessary data, summarized in Table 1. A detailed description of each data type is presented in Appendix A1. The National Land Cover Database (NLCD) 2011 Land Cover spatial dataset was preprocessed to allow the High Park and Hewlett wildfires to be simulated by SWAT. The NLCD 2011 Land Cover was overlaid with the thematic burn severity dataset (Monitoring Trends in Burn Severity Project, 2016). Then the NLCD 2011 Land Cover was reclassified to incorporate low, medium, and high burn severity categories. The reclassification was accomplished using the spatial analyst toolset within ArcMap from ESRI's ArcGIS software package. The preprocessing retained the pre-wildfire classification, but added a burn severity identifier. For example, portions of the NLCD 2011 Land Cover that consist of evergreen forest and overlap with a low burn area were reclassified to a newly created evergreen forest low burn classification.
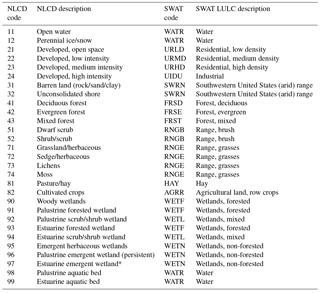
The SWAT model database contains various predefined model parameters for different LULC types, and the SWAT LULC lookup table relates NLCD classifications to the LULC types found in the SWAT model database. In order to seamlessly represent wildfire during the simulation, the SWAT model database and SWAT LULC lookup table were altered to reflect the conditions after the wildfire.
For the pre-wildfire database, the newly added LULC types consisted of attributes identical to the original classification, but with a new description and identification code. Thus, the SWAT model created using this database will represent pre-wildfire condition, but areas influenced by wildfire will be delineated from non-burned areas.
For the post-wildfire database, the newly added LULC types included a new description and identification code similar to the pre-wildfire database; however, for the post-wildfire case, attributes were also altered from their original classifications. Wildfires result in loss of canopy. Most of the canopy in the study watershed was evergreen forest (NLCD 2011). This canopy is mainly replaced by shrubs and range grasses after the wildfire. In order to mimic this alteration in canopy, for all burned areas, LULC attributes in the database were changed to match those of the range grasses LULC. This land use change results in changes in several land-use-specific predefined parameters available in model databases. This change was implemented to aid with appropriately representing the alteration in canopy in burned areas.
2.2.3 Updating curve numbers
Curve numbers (CNs) were adjusted to account for expected increases in runoff. The change in CNs was based on a pre- and post-wildfire calibration of the model explained in Sect. 2.2.7. Comparing the probability distribution of CNs before and after the wildfire, average CN increases of 5, 10, and 15 for areas with low, moderate, and high burn intensity were considered, respectively. The original and edited SWAT LULC lookup tables as well as curve numbers for both pre- and post-wildfire conditions can be found in Appendix A2, Tables A3 through A5.
2.2.4 Initial model development
Two models representing pre- and post-wildfire conditions were developed and then later merged to create a unified model. Two sets of initial SWAT model input files for the study watershed were created using ArcSWAT 2012 (US Department of Agriculture Agricultural Research Service, 2014). ArcSWAT is an ArcMap extension that provides a graphical user interface for creating a SWAT model. The interface was used to process the previously described model data to generate initial SWAT input files. This process is summarized in Fig. 2.
The ArcSWAT Automatic Watershed Delineation tool was used to create a stream network, define sub-watershed outlet locations, delineate the watershed, and calculate the sub-watershed parameters. Additional outlets were manually placed at locations where a large tributary entered the study reach and the whole watershed outlet was defined at the Mouth of Canyon. ArcSWAT was then used to determine LULC/soil/slope combinations within each sub-watershed, which is then used to determine the distribution of HRUs for the entire watershed.
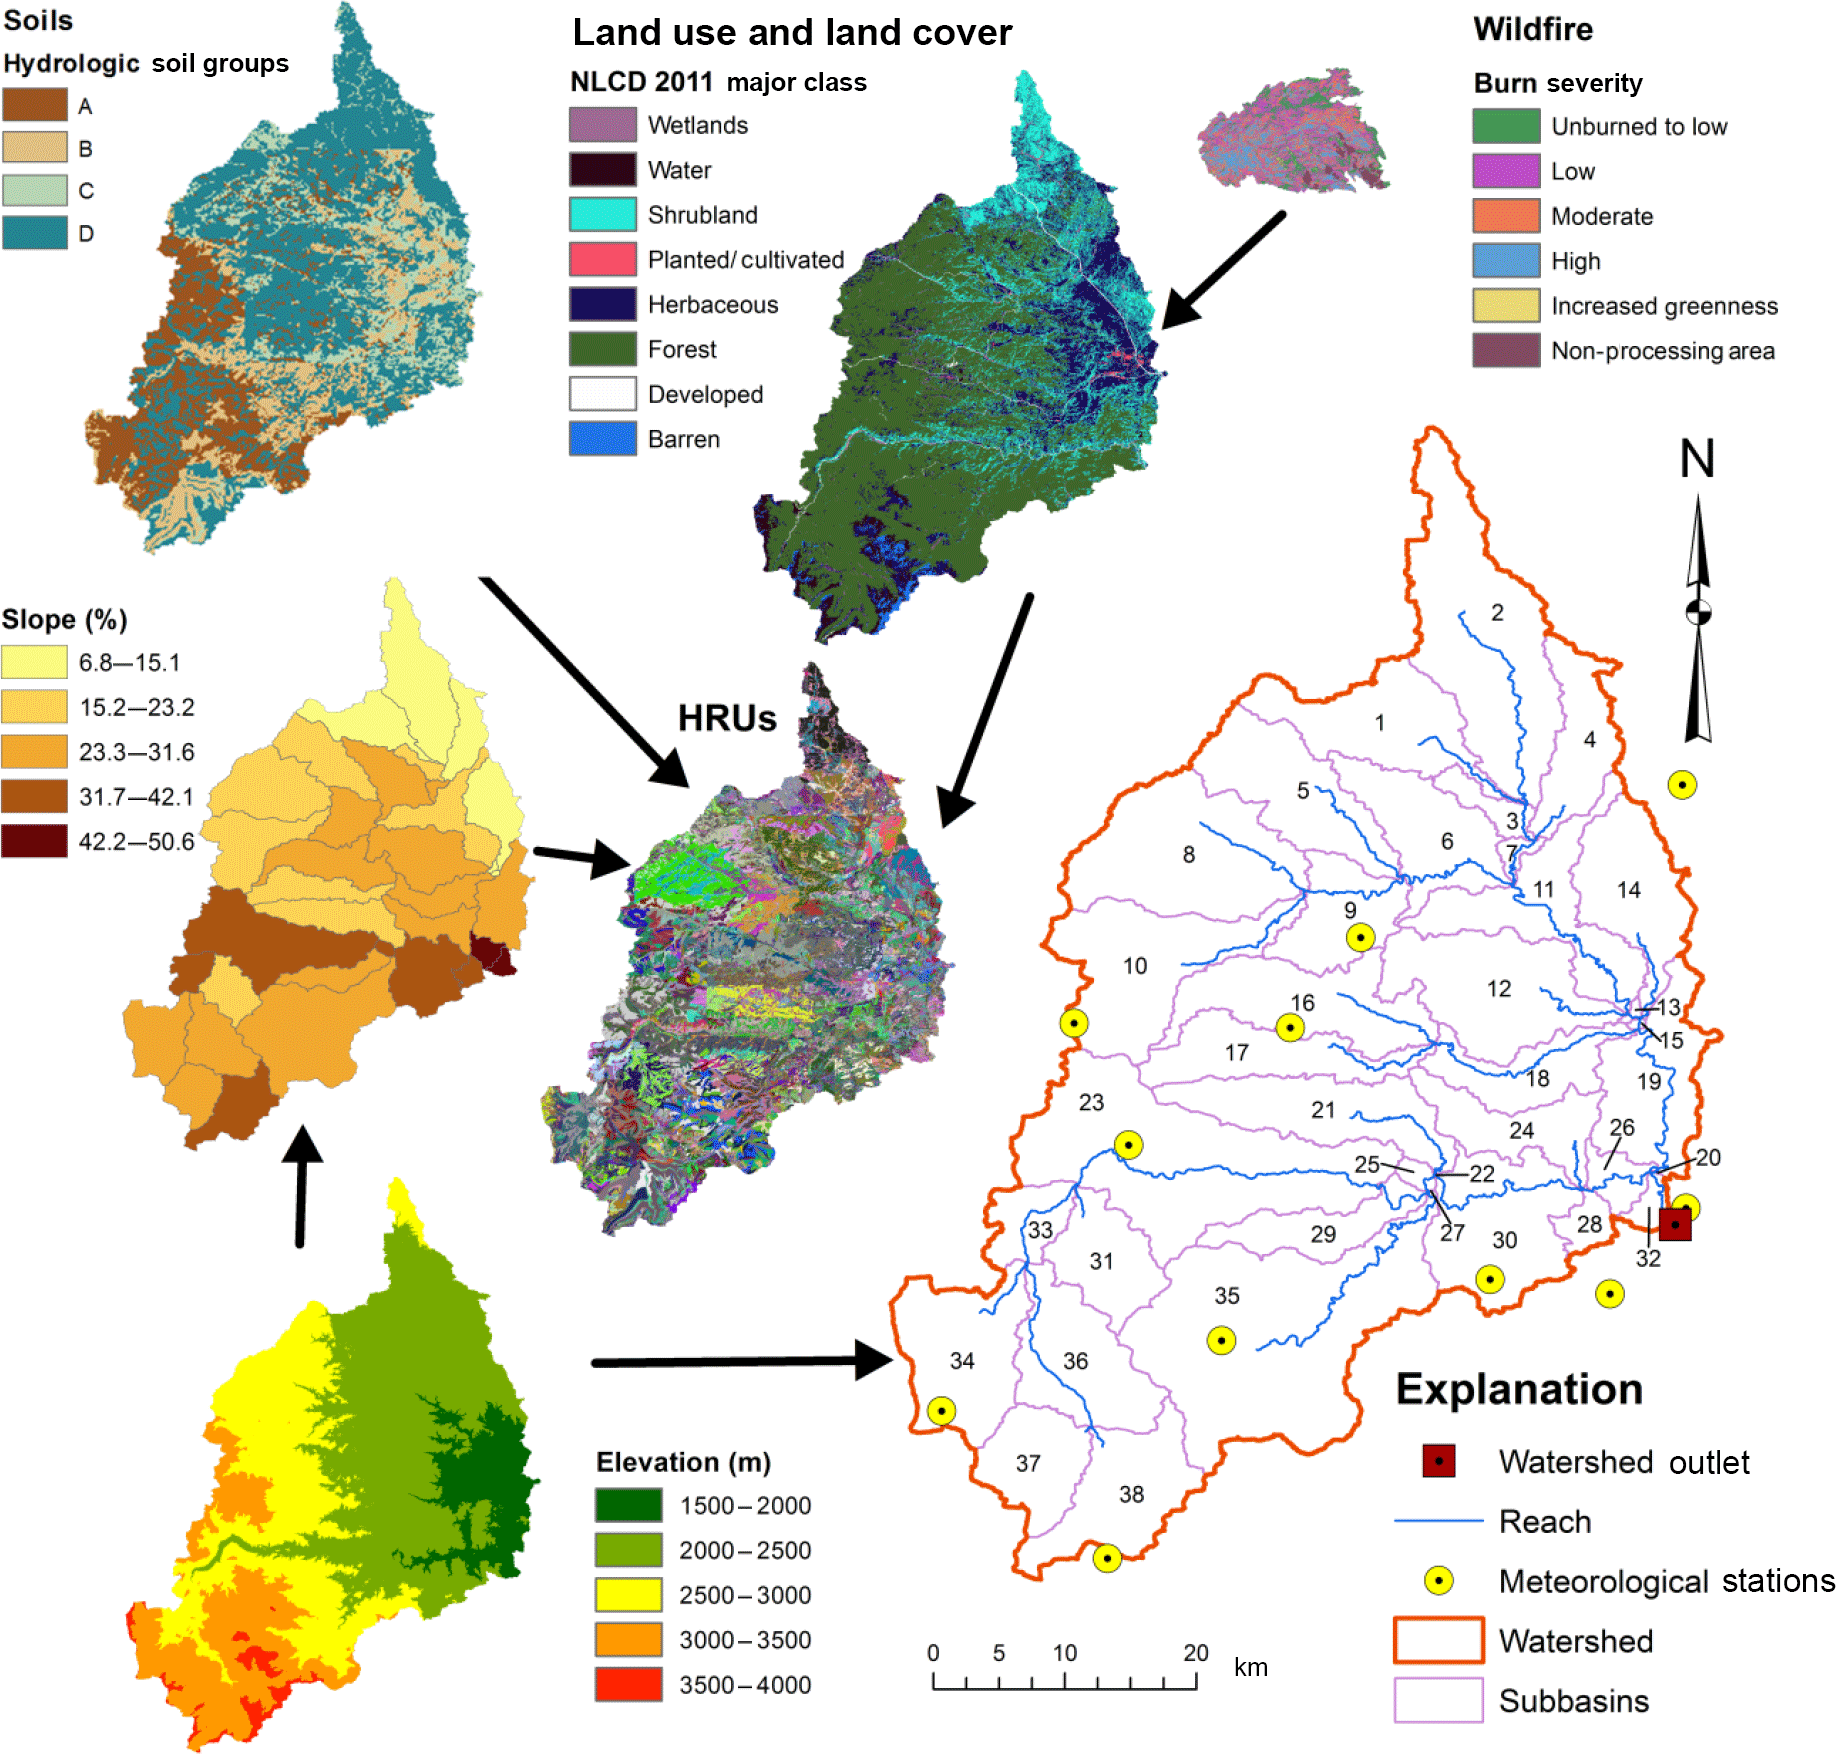
Figure 2Initial SWAT model development summary. Outer figures show terrain, LULC, wildfire burn severity, soils, and HRUs. Main figure (lower right panel) includes labeled sub-watersheds, location of meteorological stations, and reach network. Note that for illustrative purposes the soils and LULC classifications shown are simplified versions of the actual classifications used to establish HRUs.
2.2.5 Model options
Options for both models are identical and were selected based on previous modeling studies using SWAT in mountainous regions (Foy et al., 2015; Lu et al., 2015; Neupane et al., 2015). A modified version of the commonly applied United States Soil Conservation Service (now the NRCS) CN procedure was adopted to simulate surface runoff in the watershed. The CN depends on the soil type, LULC, and hydrologic condition (Lu et al., 2015). The Penman–Monteith method based on energy balance components was selected to estimate potential evapotranspiration. Lastly, channel routing was represented using the Muskingum River routing method. Other model options were left as default configurations.
2.2.6 Accounting for mountainous terrain
The study watershed is located within the rain shadow of the Rocky Mountains and overall experiences a topographically driven climate. A significant difference in elevation within the study watershed yields large variability in the quantity and form of precipitation. Thus, lapse rates as well as elevation band parameters were assigned to each sub-watershed to account for orographic effects. The precipitation lapse rate (i.e., increase in mean annual precipitation with an increase in elevation) of 658.4 mm km−1 obtained from Foy et al. (2015) was incorporated into the model. Additionally, the temperature lapse rate (i.e., decrease in mean annual temperature with an increase in elevation) of −5.5 ∘C km−1 reported by Foy et al. (2015) was used.
SWAT is capable of integrating up to 10 elevation bands in each sub-watershed. These bands were derived by topographically discretizing each sub-watershed within the watershed. SWAT requires the input of the elevation at the center of each band and the fraction of sub-watershed area within the elevation band. Data from the topography report generated by ArcSWAT were used to discretize each sub-watershed into 10 elevation bands. The minimum elevation was subtracted from the maximum elevation and divided by 10, which creates 10 equal-interval elevation bands. Next, the elevation at the center of each band and the fraction of sub-watershed area within the elevation band is calculated. Lastly, the previously generated SWAT input files were modified to contain these parameters. These parameters allow SWAT to use the elevation band equations described in the SWAT Theoretical Documentation, Version 2009 (Neitsch et al., 2011) to simulate orographic effects.
The curve numbers provided in the SWAT model database are appropriate for slopes up to 5 % (Neitsch et al., 2011). An analysis of the HRUs revealed that many of the average HRU slopes in the study watershed exceed 5 %. We adjusted the curve numbers for different slopes at the HRU level using the following equation (Neitsch et al., 2011):
where CN2S is the moisture condition II CN adjusted for slope, CN3 is the moisture condition III CN for the default 5 % slope, CN2 is the moisture condition II CN for the default 5 % slope, and S is the average fraction slope of the sub-watershed. Note that upon simulation SWAT caps CN values at 98.
2.2.7 Land use update module
The pre- and post-wildfire models were used to create a unified model by activating the land use update module in SWAT. A Matlab code was developed to prepare the land use update files. This code was prepared to add the burned HRUs from the post-wildfire model to the pre-wildfire model and create a land use update file to make a unified model. Land use update files tell SWAT to change the pre-wildfire HRU fractions to nearly zero (the HRU fraction is a HRU level parameter that specifies the fraction of sub-watershed area represented by that HRU; Neitsch et al., 2011) and increase the post-wildfire HRU fractions to represent the burn area at the appropriate time during the simulation. In this case, the High Park and Hewlett wildfires occurred during May and June 2012. Thus, for model calibration the land use update was initiated on 1 July 2012.
2.2.8 Model calibration and testing
Calibration of process-based distributed hydrologic models is often challenging due to high data demand to support the complexities (Beven, 2001). Many studies use a single source of data (e.g., streamflow or nutrient concentrations) to calibrate such models (Ahmadi et al., 2014; Foy et al., 2015). While this is a common approach in calibrating the models due to difficulties in data acquisition and limited resources, it also has limitations. Application of several data sources for calibration of process-based models can improve the performance of the model by assuring that various modules within the model have a good performance. The SWAT model was calibrated and tested for the daily naturalized streamflows at the Mouth of Canyon. The naturalized flows were determined using the daily historical flow records of diversions or reservoirs. Separate calibrations were conducted for pre- and post-wildfire conditions with the purpose of characterizing the change in CN as a result of wildfire. Once the change in CN was characterized, it was implemented in the unified model. The unified model was then calibrated and tested for the whole period (2000–2014). Calibration, pre-wildfire testing, and post-wildfire testing periods were 2005–2013, 2000–2004, and 2014, respectively. These simulation periods were selected based on data availability. Initial calibration parameters were identified from previous modeling and sensitivity analysis efforts for the study watershed (Sanadhya et al., 2014; Foy et al., 2015). They used eFAST (Saltelli et al., 1999), which is a variance-based global sensitivity analysis method to determine the sensitivity of streamflow simulations to SWAT parameters. Both first- and total-order sensitivity indices were determined and used to rank the parameters. These parameters were supplemented with additional parameters identified from a previous sensitivity analysis study using the method of Sobol with the SWAT model (Ahmadi et al., 2014). A total of 38 modal parameters were used for calibration (Table A6). Parameters related to subsurface processes, specifically the soil hydraulic conductivity (SOL_K) and tributary channel hydraulic conductivity (CH_KI), had the highest effects on simulations in the watershed (Sanadhya et al., 2014). A Matlab code was developed for auto-calibration of SWAT model using a global optimization algorithm, named dynamically dimensioned search (DDS; Tolson and Shoemaker, 2007). DDS is designed to arrive at good solutions within a maximum number of user-defined function evaluations for use in model calibration with many parameters (Tolson and Shoemaker, 2007). This auto-calibration tool was used to generate 498 model runs. Each model run consisted of a unique combination of the 38 model calibration parameters. The tool works towards minimizing an objective function. In this case, we based this objective function on two primary error statistics, the relative error (RE) and the Nash–Sutcliffe efficiency coefficient (ENS). ENS is a normalized statistic that indicates how well an observed versus simulated plot fits a 1 : 1 line. ENS is computed as
where for this study Yobs is the observed streamflow, Ysim is the simulated streamflow, and Ymean is the mean of observed streamflows (Nash and Sutcliffe, 1970). The optimal value for ENS is 1. ENS can range between −∞ and 1.0, with values between 0.0 and 1.0 generally regarded as satisfactory levels of performance. Values equal to or smaller than 0.0 indicate that the simulated values are a similarly good or a worse predictor than the mean of observed values (Moriasi et al., 2007) respectively. The RE gives an indication of how good simulated values are relative to the magnitude of corresponding observed values. The RE in percentage is computed as
where for this study Yobs is the observed streamflow and Ysim is the simulated streamflow. These error statistics are used to determine how well the model simulations match the observations at the Mouth of Canyon. While they may not necessarily mean that all hydrologic processes are accurately represented, they are a good indicator of the performance of the model with regard to fitting the observations. Model calibration parameter starting values and ranges are displayed in Appendix A2, Table A6.
2.2.9 Scenario analysis
With the SWAT model calibrated and tested, two scenario models were created. First, a no-wildfire scenario model was created. This was achieved by simply removing the land use update files, thus representing no wildfire activity throughout the entire simulation period. Second, a wildfire scenario model was created. This was achieved by adjusting the land use update files to reflect a wildfire occurring at the beginning of the simulation. Thus, wildfire is simulated throughout the entire simulation period. Note the simulation period for each scenario was between 2000 and 2014 (15 years).
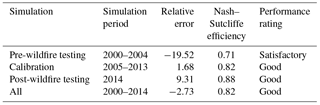
Table 2Error statistics between observed and simulated daily streamflows for the calibration period as well as the testing periods. Performance ratings based on Motovilov et al. (1999).
2.3 Output data post-processing
SWAT outputs were post-processed in Matlab. Simple summing functions were used to calculate total runoff volumes and water budgets throughout the study watershed. Full streamflow statistics were used to develop flow duration curves for burned sub-watersheds. These represent the percentage of time that streamflow is likely to equal or exceed a given streamflow value for both scenarios. The code used sorts, ranks, and plots the input streamflow data to generate flow duration curves. Flow duration curves are a widely accepted method for characterizing streamflow regimes. They are commonly used for hydropower, water resource management, water quality management, habitat suitability, and flood control applications (Fan and Li, 2004). However, they have not been frequently used in evaluating response to wildfires (Newtson, 2013). Next, the ecodeficit and ecosurplus metrics introduced by Vogel et al. (2007) were computed for each flow duration curve. These metrics provide a simplified representation of hydrologic impacts (Vogel et al., 2007). For this study, ecodeficit is defined as the ratio of the area below the no-wildfire scenario flow duration curve and above the wildfire scenario flow duration curve divided by the total area under the no-wildfire scenario flow duration curve. Conversely, ecosurplus is defined as the ratio of the area above the no-wildfire scenario flow duration curve and below the wildfire scenario flow duration curve divided by the total area under the no-wildfire scenario flow duration. Thus, these values represent the overall loss (ecodeficit) and gain (ecosurplus) in streamflow (Vogel et al., 2007) between scenarios.
3.1 Model performance
The performance of the model during calibration and testing at various temporal scales was assessed using the common criteria in the literature (Motovilov et al., 1999; Moriasi et al., 2007). Model performance at a daily timestep was considered good if ENS ≥ 0.75 and was considered satisfactory for values of ENS between 0.75 and 0.36 (Motovilov et al., 1999). At a monthly timestep, the performance of the model was categorized as very good (0.75 < ENS ≤ 1.00), good (0.65 < ENS ≤ 0.75), satisfactory (0.5 < ENS ≤ 0.65), and unsatisfactory (ENS ≤ 0.5) (Moriasi et al., 2007).

Figure 3Box plots showing the range of % change in CNs for before and after fire conditions (the boxes show the range of values between 25th and 75th percentiles; the whiskers show the 0.5 and 99.5 percentiles).
During the separate pre- and post-wildfire calibration the model had a good performance giving ENS = 0.92, RE = −0.32 %; and ENS = 0.81, RE = 2.16 %, respectively. This separate calibration step was done to characterize the change in CN between pre- and post-wildfire conditions. Figure 3 illustrates box plots of CNs for the pre- and post-wildfire conditions. The values of CN for the best solution (highest ENS) and mean of the CNs are also marked on the box plots. Based on these results, an average CN increase of 5, 10, and 15 for areas with low, moderate, and high burn intensity were considered, respectively.
The optimal parameter set found during the calibration effort generally yielded good results. The model performed best during the post-wildfire testing period, but still performed well during the calibration period and pre-wildfire testing period. Final values for the 38 calibration parameters are displayed in Appendix A2, Table A6. Model performance was evaluated based on primary statistical results (at both the daily and monthly timesteps) and visual inspection of the graphical results.
Table 3Error statistics between observed and simulated monthly streamflows for the calibration period as well as the testing periods. Performance ratings based on Moriasi et al. (2007).
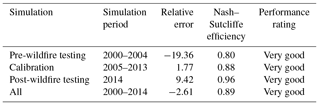
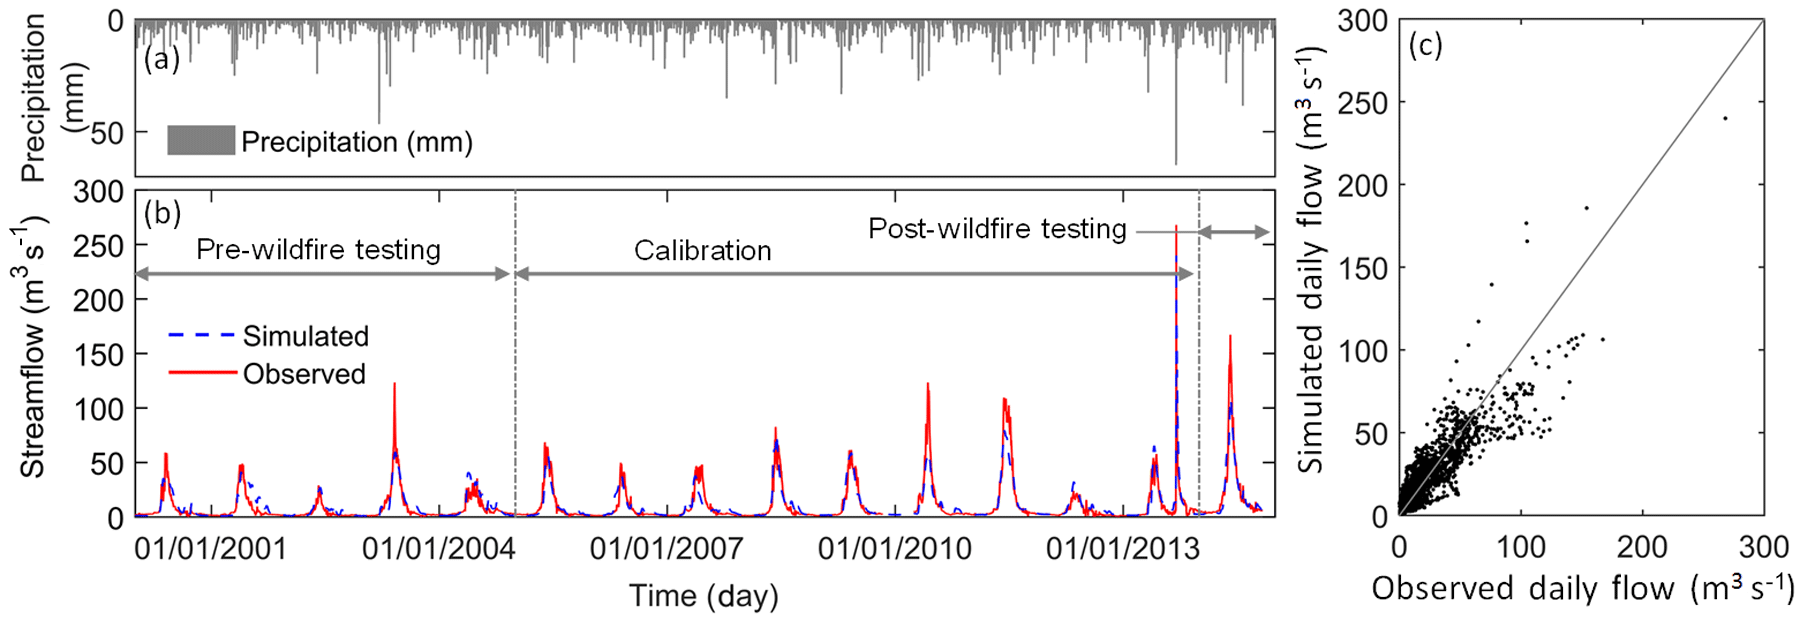
Figure 4(a) Total daily precipitation during simulation period. (b) Observed versus simulated average daily streamflow hydrographs. (c) Observed versus simulated average daily streamflows scatter plot.
The best calibration achieved for the Mouth of Canyon naturalized streamflow at the daily timestep was ENS of 0.82 and RE of 1.68. The testing ENS values for the pre-wildfire and post-wildfire periods were 0.71 and 0.88, with RE values of −19.52 and 9.31 %, respectively. Table 2 presents a summary of the model performance at the daily timestep.
All simulation periods earned a performance rating of very good at the monthly timestep. Monthly results were generally comparable to those from other SWAT modeling studies involving mountainous watersheds (Foy et al., 2015; Lu et al., 2015; Neupane et al., 2015). Table 3 presents a summary of the model performance at the monthly timestep.
Generally, simulations yielded good visual agreement between observed and simulated daily streamflows and total runoff volume, as shown in Fig. 4. A slight discrepancy between the observed and simulated total runoff volume exists for the no-wildfire testing period. This difference propagates to the statistical results, most notably, the RE value of −19.52 %. A negative relative error shows that the model overestimates runoff volume compared to observations. Based on visual examination of the hydrographs, the calibration period may be slightly “wetter” relative to the pre-wildfire testing period, which may be the cause of the noted discrepancy.
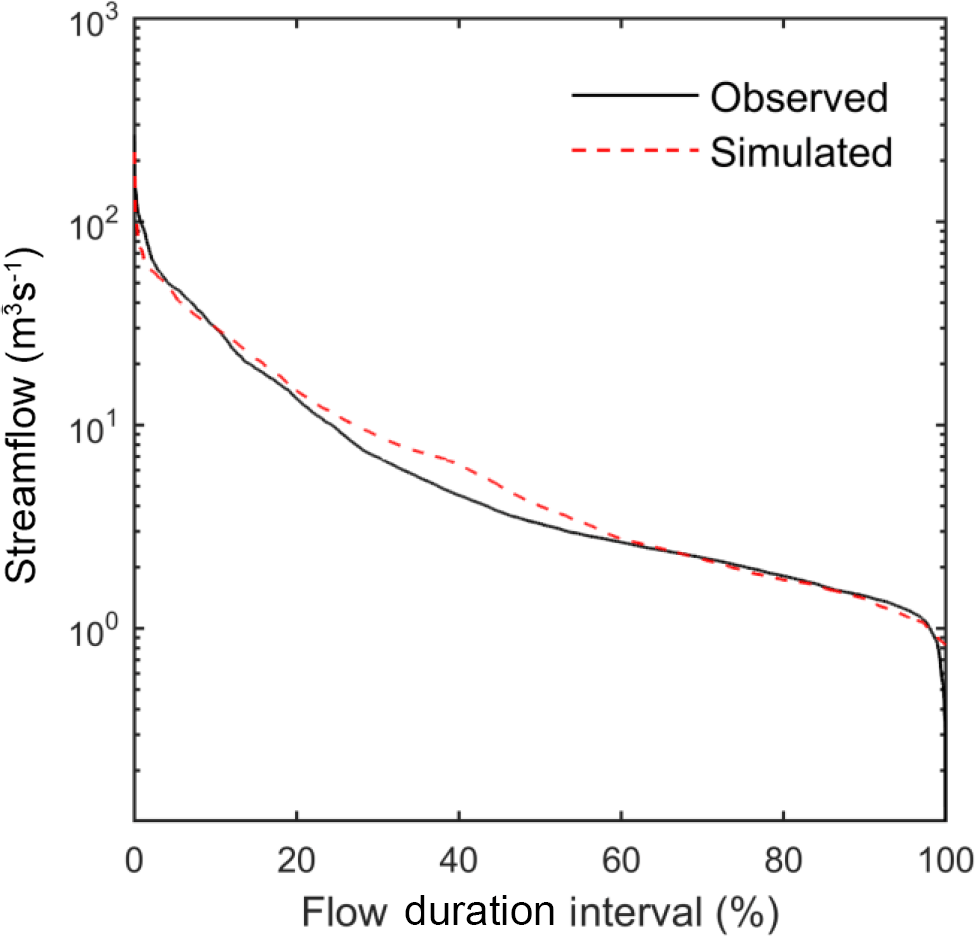
Also, the simulated and observed flow duration curves for the entire simulation period yielded good visual agreement, as shown in Fig. 5. The simulated flow duration curve generally follows the observed flow duration curve with the exception of a slight deviation for less frequent flows. For the less frequent streamflows the model underestimates streamflows. A deviation is expected as less frequent streamflows correspond to larger streamflows which are less predictable and less well understood.
Previous studies have used SWAT along with similar calibration techniques throughout this region for hydrologic analysis. However, use of the SWAT land use change module to investigate hydrologic response to wildfires has not been well documented. Moreover, characterization of change in CNs as a result of wildfires using a probabilistic approach has not been performed previously. The performance results above indicate that the comprehensive methodology of using the SWAT land use change module along with multi-variable parameter calibration was an effective technique to represent the hydrology of an area which has been exposed to wildfire.
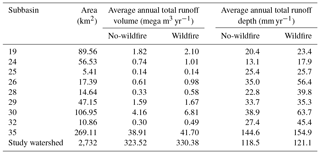
Table 4Average annual total runoff volumes and depths for both the no-wildfire and fire scenarios, shown for the burned sub-watersheds as well as for the entire study watershed. Area is also include for reference.
3.2 Wildfire effects on runoff volume
The daily simulation outputs from both no-wildfire and wildfire scenarios were analyzed and compared in order to characterize an average hydrologic response to wildfire during the simulation period of 15 years (2000 to 2014). Total runoff values, represented as both depth and volume for each burned sub-watershed as well as for the entire study watershed are shown in Table 4. Also, Fig. 6 displays the burn severity distribution and average annual total runoff percent increase (based on the values presented in Table 4) for each burned sub-watershed and for the entire study watershed. The average annual total runoff includes surface runoff, lateral flow, and base flow.
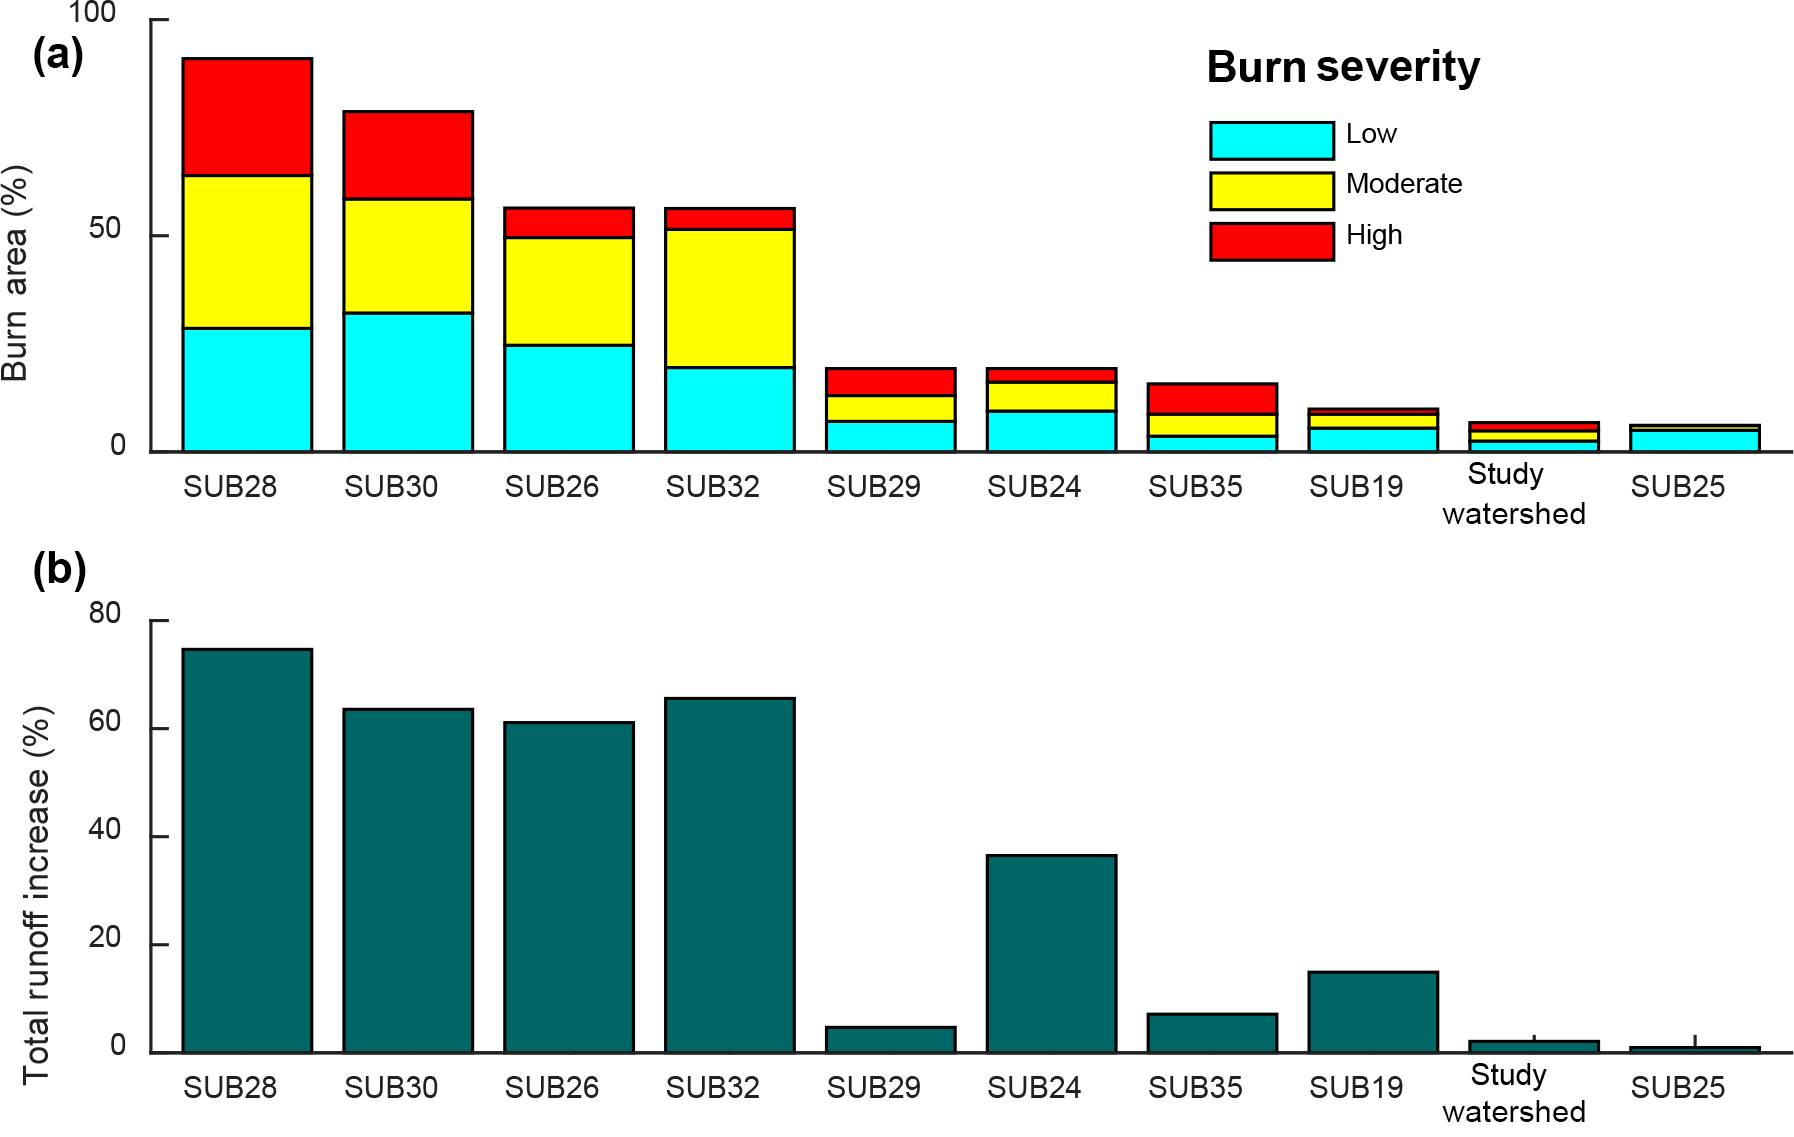
Figure 6Burn severity distribution (a) and average annual total runoff percent increase between the no-wildfire and fire scenarios (b). Results are shown for the burned sub-watersheds as well as for the entire study watershed arranged in descending order from left to right based on total percent burned area.
Figure 6 shows that in the case of sub-watersheds 28, 30, 26, and 32, more than 50 % of the area experienced burning as a result of the High Park and Hewlett wildfires. Sub-watersheds 28 and 30 were the most severely burned with large high burn severity percentages. The remaining sub-watersheds had smaller burned area percentages.
The total runoff percent increase between scenarios was greatest on average for sub-watersheds 28, 30, 26, and 32. For these sub-watersheds, increases in runoff between the no-wildfire and wildfire scenarios ranged from approximately 66 to 75 %. For the remaining sub-watersheds, as well as the entire study watershed, runoff percent increases are found to be considerably less. This is likely because those sub-watersheds were not as heavily burned. Nevertheless, the results indicate wildfire effects at larger scales are still substantial, but only in terms of the magnitude rather than percent change of total runoff volume increase. Larger areas (i.e., sub-watershed 35 and the entire study watershed) appear to experience much greater absolute increases in total runoff volume between scenarios, despite having smaller total burn area percentages. This is what we might expect given that each sub-watershed is nested within the study watershed, resulting in a cumulative effect.
Other studies have documented total runoff increases under post-wildfire conditions (Benavides-Solorio and MacDonald, 2001; Inbar et al., 1998; Lavabre et al., 1993; Robichaud et al., 2000; Scott, 1993). For example, Lavabre et al. (1993) used a lumped conceptual hydrological model to evaluate a small Mediterranean basin which experienced a burn covering 85 % of its surface area in 1990. They suggested a 30 % increase in the annual runoff yield. Scott (1993) showed total streamflow volume increases of 15.3 and 9.4 % in response to burning in two small mountainous catchments using a paired catchment method. In contrast, Mahat et al. (2015) reported no significant change between the modeled streamflow from burned and unburned models. They suggested that this outcome may be the result of using a conceptual modeling approach instead of using a physically based model. The amount of total runoff volume increase following wildfire disturbance varies greatly between locations depending on wildfire intensity, proportion of the forest vegetation burned, climate, precipitation, geology, soils, watershed aspect, and tree species (Neary et al., 2003). Thus, it is not surprising that results vary. Also, comparison between studies is difficult because of changes in size of disturbance (i.e., wildfire) in relation to the size of the catchment (Robichaud et al., 2000). This emphasizes the need to examine increases based on percent burn area upstream.
Figure 6 is arranged in descending order of percent burned area from left to right. Generally, we see an increase in total runoff as the percentage of total burn area increases. This observation is consistent with reports in the literature indicating that total runoff volume increase following wildfire disturbance is in part a function of the proportion of the contributing area burned (Neary et al., 2003; Robichaud et al., 2000). This relationship is further explored by applying linear regression to the data. Figure 7 shows a linear regression model fitted between the total runoff volume increase and total burned area percentage in the Cache la Poudre Watershed. Note that the entire study watershed results were not included in this regression. Also, the sub-watershed average slope was categorized as low (slope < 0.30), moderate (0.30 ≤ slope < 0.40), and steep (slope ≥ 0.40) for each sub-watershed.
An F test was performed using Matlab to determine if this particular model fits the data well. The regression generally yields a good fit, with a p value < 0.001 for the F test. No previous study was found documenting this relationship with linear regression. This study suggests it may be reasonable to use total burn area percentage as a predictor for increase in total runoff volume in Cache la Poudre Watershed. Also, the figure indicates that generally for the High Park and Hewlett wildfires the sub-watersheds with moderate to steep slopes experienced wildfire in a larger percentage of their area relative to low slope sub-watersheds. It should be noted that the linear regression model was developed for Cache la Poudre Watershed and it may not necessarily be applicable to other watersheds. Further studies are required to draw a potential generalized relationship between percent burned areas and increase in runoff.
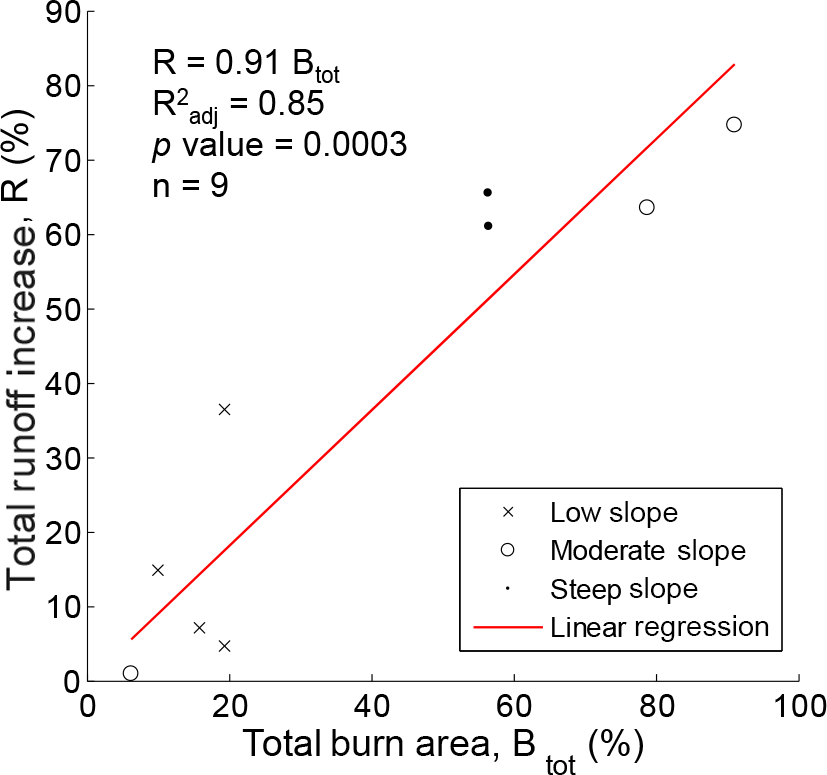
Figure 7Linear regression model fitted between the total runoff volume increase and total burn area percentage. The catchment slope is categorized as low (slope < 0.30), moderate (0.30 ≤ slope < 0.40), and steep (slope ≥ 0.40) for each sub-watershed.
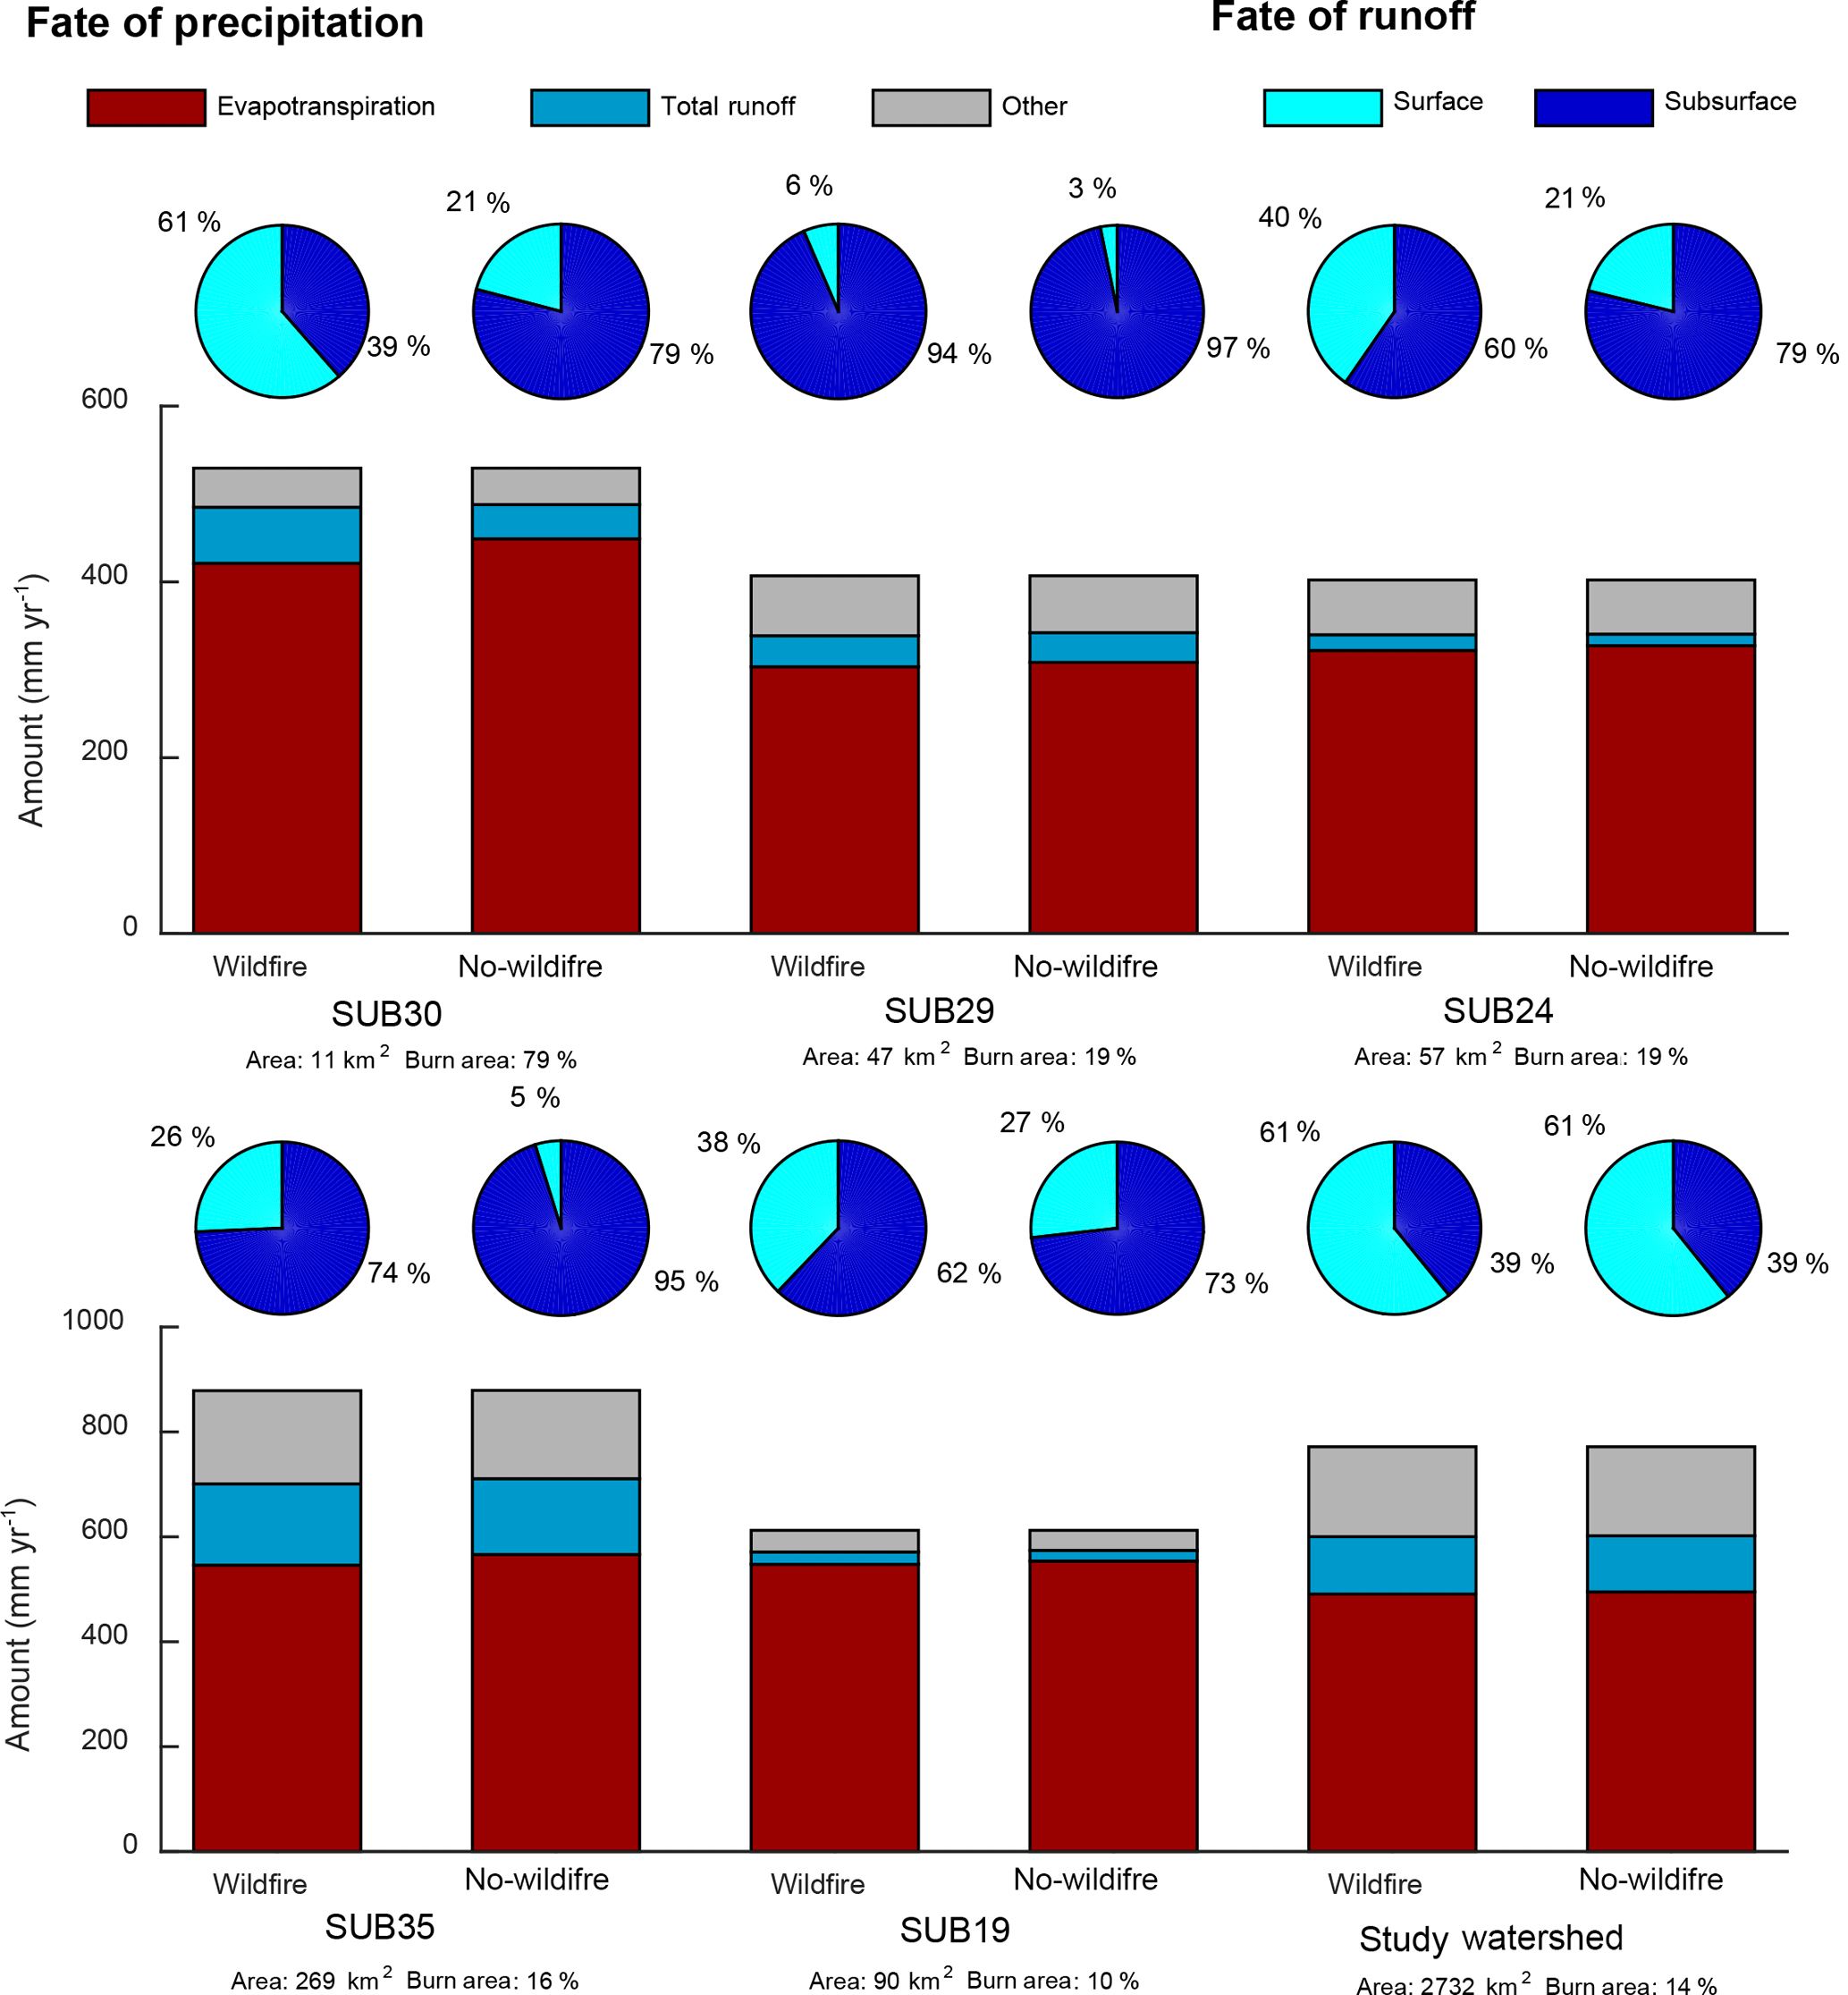
Figure 8Hydrologic budgets showing the fate of average annual precipitation (i.e., evapotranspiration, total runoff, and other) with the fate of average annual total runoff (i.e., surface and subsurface) for select sub-watersheds and the entire study watershed.
3.3 Wildfire effects on hydrologic budgets
The daily simulation outputs from both no-wildfire and wildfire scenarios were further analyzed and compared in order to quantify changes in average annual hydrologic budgets as a result of wildfire during the simulation period of 15 years (2000 to 2014). Figure 8 shows hydrologic budgets for select sub-watersheds as well as the entire study watershed. These hydrologic budgets show the fate of average annual precipitation along with the fate of average annual total runoff. The fate of precipitation (rainfall and snowfall) is shown as evapotranspiration, total runoff, and other (deep aquifer contribution and soil water storage). Also, the major hydrologic processes for the fate of runoff were defined as surface and subsurface (lateral flow and base flow) runoff.
It is evident that hydrologic budgets change on the sub-watershed scale following wildfire; however, little change is seen at the watershed scale. Batelis and Nalbantis (2014) also documented that wildfire effects are practically indiscernible on a regional scale. Generally, Fig. 8 shows under the wildfire scenario an increase in surface runoff and a corresponding decrease in subsurface flow at the sub-watershed scale. For example, the hydrologic budget for sub-watershed 30 (a heavily burned area) shows a change in surface runoff from 21 to 61 % under the no-wildfire and wildfire scenarios, respectively. This is consistent with previous studies in which it seems to be generally accepted that infiltration rates decrease after wildfires. For example, Moody and Martin (2001) showed that infiltration rates were decreased by a factor of 2 to 7 after wildfires.
At the sub-watershed scale under the wildfire scenario we also see less evapotranspiration. This connects well with the results from Sect. 3.2, where generally we see an increase in total runoff for the wildfire scenario. Increased water yields (i.e., total runoff) primarily due to reduced evapotranspiration has been a reported effect on post-wildfire hydrology (Neary et al., 2003; Townsend and Douglas, 2004).
3.4 Implications of wildfire effects
Lastly, the daily simulation outputs from both no-wildfire and wildfire scenarios were analyzed and compared in order to determine potential implications of wildfire effects during the simulation period of 15 years (2000 to 2014). Figure 9 shows flow duration curves for select burned sub-watersheds as well as for the entire study watershed and Table 5 lists the ecosurplus and ecodeficit values associated with each computed flow duration curve. Flow duration curves were generated using total runoff, which includes both surface and subsurface water fluxes leaving the sub-watershed or watershed. The ecosurplus and ecodeficit metrics are a dimensionless measure which represent the overall loss (ecodeficit) and gain (ecosurplus) in streamflow (Vogel et al., 2007) between scenarios.
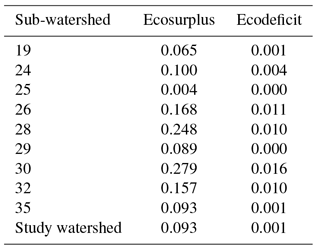
Table 5Ecosurplus and ecodeficit values for the burned sub-watersheds as well as for the entire study watershed.
Similar to findings from the hydrologic budgets, it is evident that flow duration curves change under wildfire conditions on the sub-watershed scale. Also, little change is seen at the watershed scale (Fig. 9 and Table 5). This is perhaps the result of wildfire effects at the watershed scale being damped by non-burned portions of the contributing area.
Figure 9 also suggests that wildfire has little impact on flow duration curves for areas with low total burn area percentages, but seems to impact flow duration curves for areas with higher total burn area percentages. For example, in sub-watershed 30 we see that less frequent streamflows become greater in magnitude under the wildfire scenario (i.e., we see an ecosurplus), whereas in sub-watershed 19 (a less burned area) we see little change in the flow duration curve. Previous research efforts have involved a paired catchment analysis to compare flow duration curves for pre- and post-wildfire conditions (Liu et al., 2004; Newtson, 2013). Both Newtson (2013) and Liu et al. (2004) found a general increase in percentile streamflow as a result of wildfire. However, Liu et al. (2004) examined precipitation duration curves for the study areas and concluded that changes in precipitation between locations explained the difference in streamflow and not necessarily wildfire. For this study, the two-scenarios approach uses an identical precipitation record for both scenarios. Thus, the study eliminates limitations associated with temporal and special variation in precipitation. Table 5 indicates that the streamflows for the burned sub-watersheds appear to be ecosurplus versus ecodeficit when the wildfire scenario is compared with the no-wildfire scenario. The ecosurplus values range from 0.004 to 0.279. Kannan and Jeong (2011) indicate that for high streamflows a large ecosurplus is likely to have moderate to high impacts on stream health. In this case, the ecosurplus values associated with the heavily burned sub-watersheds (i.e., sub-watersheds 28, 30, 26, and 32) are much greater in magnitude when compared to the other ecosuplus values. Thus, impacts on stream health are expected to be the greatest in heavily burned areas.
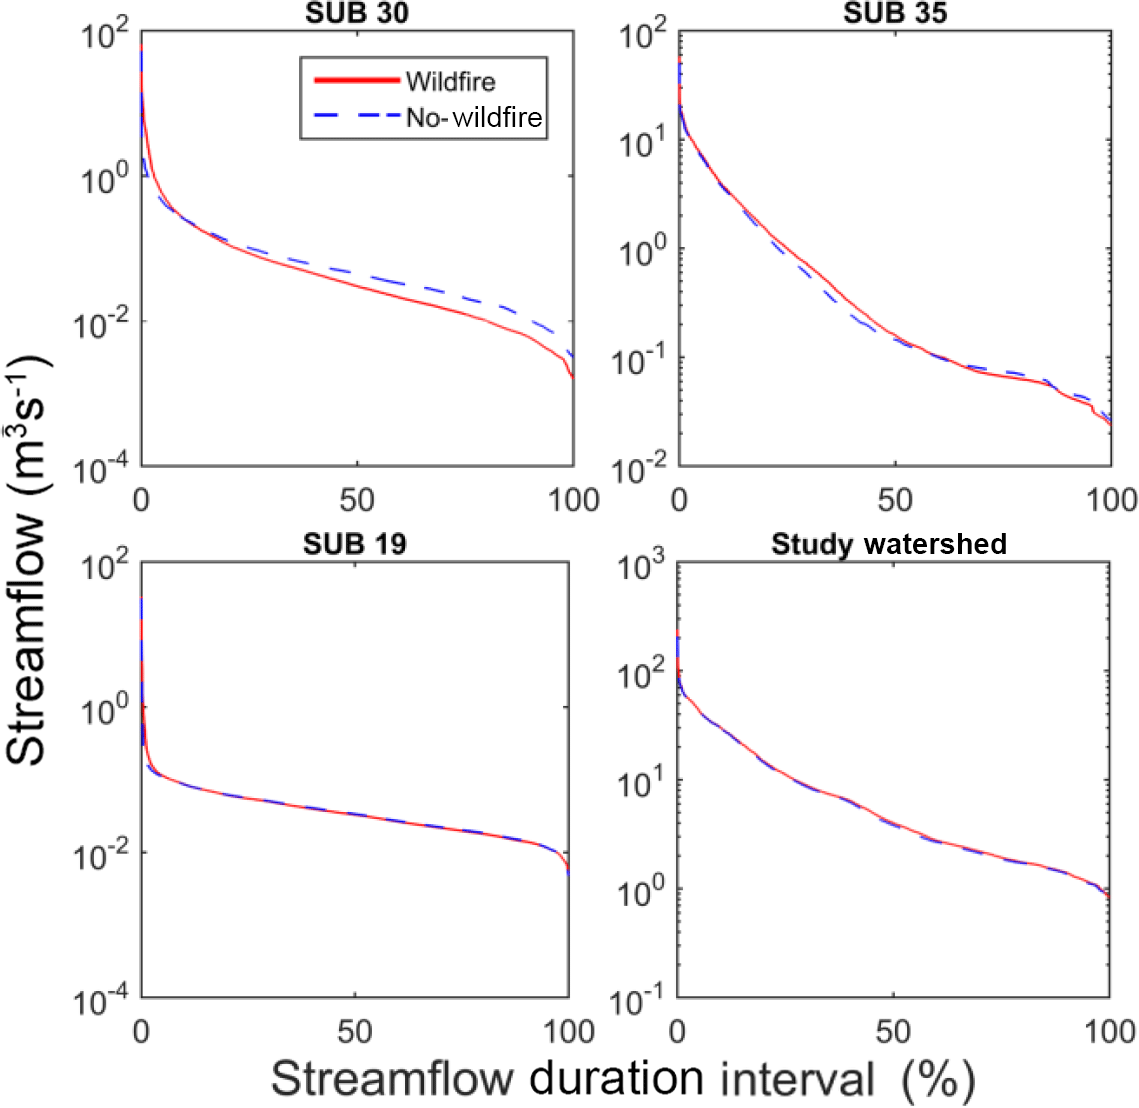
Figure 9Flow duration curves for select sub-watersheds as well as the entire study watershed. Sub-watershed area and percentage of burned area for sub-watersheds 30, 35, 19, and the study watershed are 11 km2 and 79 %; 269 km2 and 16 %; 90 km2 and 10 %; and 2732 km2 and 14 %, respectively.
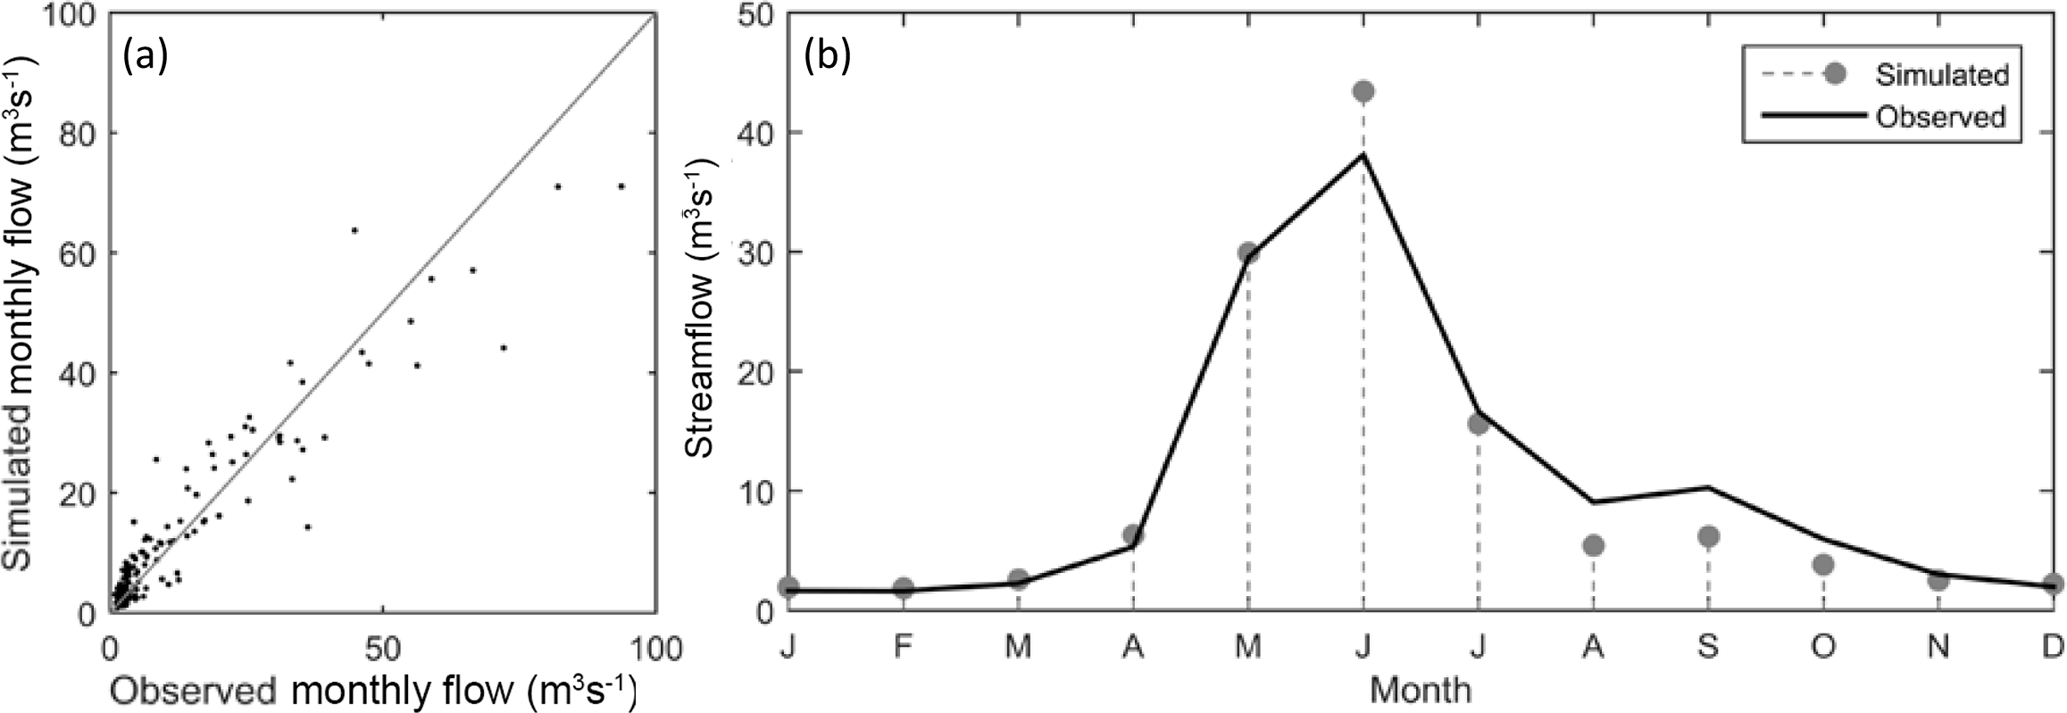
Figure 10(a) Scatter plot of simulated versus observed monthly streamflows and (b) the observed versus simulated average monthly streamflows for the simulation period.
3.5 Limitations and future work
Figure 10 displays simulated versus observed monthly streamflows as well as average monthly simulated and observed streamflow for the Mouth of Canyon. This figure suggests that the model slightly overestimates larger monthly streamflows: specifically, those during the month of June when streamflows are elevated due to mountain snowpack melting. Also, the model appears to slightly underestimate streamflows during late summer into autumn. These systematic errors may be due to SWAT releasing snowmelt too quickly during spring runoff; thus, rising streamflows are simulated earlier than observations during the melting season. Further, perhaps the tendency of the model to simulate earlier snowmelt results in higher simulated streamflow during the latter part of summer and early autumn. This deficiency may be the result of SWAT misrepresenting snowmelt processes or perhaps faulty model parameterization. Thus, it is thought that hydrologic model uncertainty is introduced here and it is recommended that additional research be focused on better representing snowmelt processes in mountainous watersheds.
Simulation scenario analysis at the sub-watershed and watershed scales was used to characterize hydrologic response to wildfires in mountainous regions. This was achieved by applying the hydrologic model SWAT to a watershed recently exposed to significant wildfire incident, located in northern Colorado, United States. The model represents pre-wildfire and post-wildfire conditions by implementing the SWAT land use change module as well as curve number updating during simulations to represent burned area as a result of wildfire. Geospatial data representing LULC, soil, terrain, and climate attributes of the study watershed were used to develop the model. An optimal parameter set was obtained for pre-wildfire and post-wildfire conditions through the automated DDS optimization algorithm. Error statistics were calculated to evaluate model performance with regard to daily observed naturalized streamflows. Results indicate a good model performance, with an ENS of 0.82 during calibration as well as 0.71 and 0.88 for the no-wildfire and wildfire testing periods, respectively, for daily streamflows at the Mouth of Canyon. No-wildfire and wildfire scenarios representing a 15-year (2000 to 2014) simulation period were created from the optimal parameter set achieved during model calibration. These scenarios were used to characterize the hydrologic response to wildfires.
Specific objectives of this study were to investigate changes in average annual total runoff volume, average annual hydrologic budgets, and flow duration curves across multiple scales as a result of wildfire. At the watershed scale, wildfire conditions appear to have little effect on the hydrologic responses with the exception of total runoff volume. However, at the sub-watershed scale, simulations suggest that wildfire effects trend with burned area upstream. A total runoff increase up to approximately 75 % between scenarios was found. Generally, water budgets showed more surface runoff versus subsurface flow, which suggests that infiltration rates decrease under post-wildfire conditions. Flow duration curves for burned sub-watershed showed that less frequent streamflows become greater in magnitude, leading to ecosurplus values of up to 0.279.
Results reported in this study show an overall acceptable performance of the SWAT model in simulating daily streamflows under pre- and post-wildfire conditions to characterize the hydrologic response to wildfires. However, this method required comprehensive knowledge of the watershed, was time-consuming, and was computationally intensive. Further, this study demonstrates the need for improvement in understanding the rainfall runoff prediction relationship for burned areas.
The data and codes developed are available upon request from the corresponding author.
A1 Detailed description of model data
The 10 m resolution digital elevation model (DEM), courtesy of the United States Geological Survey (USGS) National Elevation Dataset (USGS TNM, 2016), was used to describe the topography within the watershed. The study watershed ranges in elevation from 4138 m at the Continental Divide down to 1493 m at the Mouth of Canyon. The distribution of elevation within the study watershed is displayed in Fig. A1.
The 30 m resolution NLCD 2011 Land Cover dataset created through a project conducted by the Multi-Resolution Land Characteristics (MRLC) Consortium was used to describe the LULC distribution for the study watershed (USGS TNM, 2016). NLCD 2011 Land Cover uses 16 classifications that are based primarily on an analysis of circa 2011 Landsat imagery. Distribution of the major types found within the study watershed may be seen in Fig. A2 and a complete breakdown is shown in Table A1. Generally, the study watershed consists of forest (primary evergreen type) with considerably large portions covered by shrubland and herbaceous vegetation. Note the study watershed is relatively undeveloped, with less than 1 % of the land surface developed for commercial, industrial, or residential purposes. Through comparison of earlier NLCD products, it is evident that LULC changes little between the years 2000, 2006, and 2011. Therefore, it was assumed appropriate to use NLCD 2011 Land Cover for the entire simulation period. A comprehensive LULC change analysis for the study watershed using NLCD 2000, 2006, and 2011 Land Cover is included in Table A1.
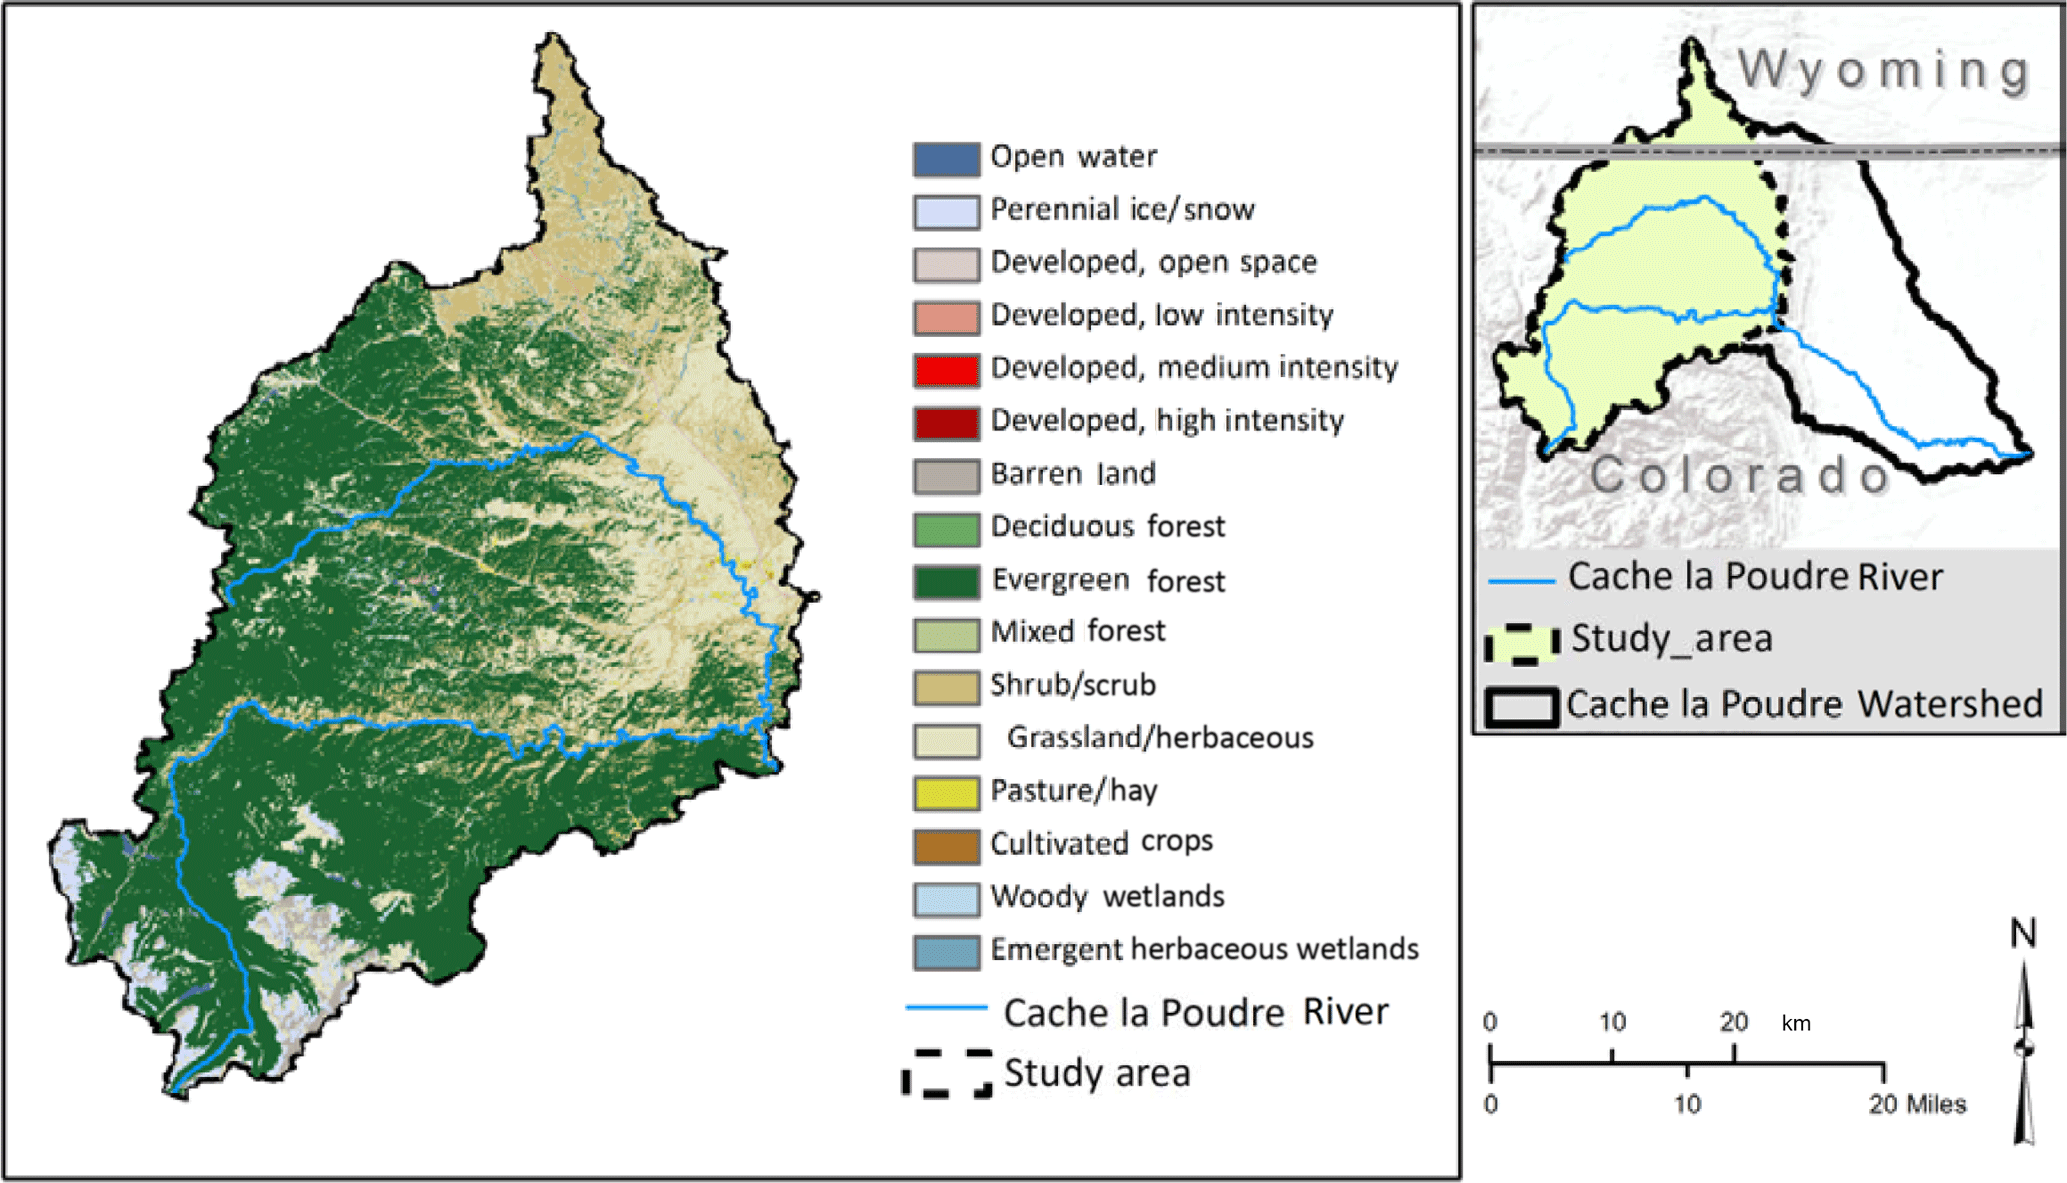
Figure A2Distribution of major LULC types in study watershed based on MRLC's NLCD 2011 Land Cover dataset.
Burned areas within the watershed were identified using the High Park Wildfire Assessment (Monitoring Trends in Burn Severity Project, 2016) conducted as a part of the Monitoring Trends in Burn Severity (MTBS) project directed by groups within the USGS and United States Forest Service. The MTBS project was introduced to consistently map burn severity and boundaries of wildfires across all lands of the United States from 1984 and beyond. The product of this assessment includes a thematic burn severity delineation which depicts severity as unburned to low, low, moderate, high, and increased greenness (i.e., increase in post-wildfire vegetation response). Through examining the wildfire boundary, it is evident that the High Park Wildfire Assessment includes the Hewlett wildfire which occurred just prior to the High Park wildfire. The burn severity distribution of the Hewlett and High Park wildfire within the study watershed may be seen in Fig. A3. The distribution of the different burn severities within the wildfire boundary is relatively even.
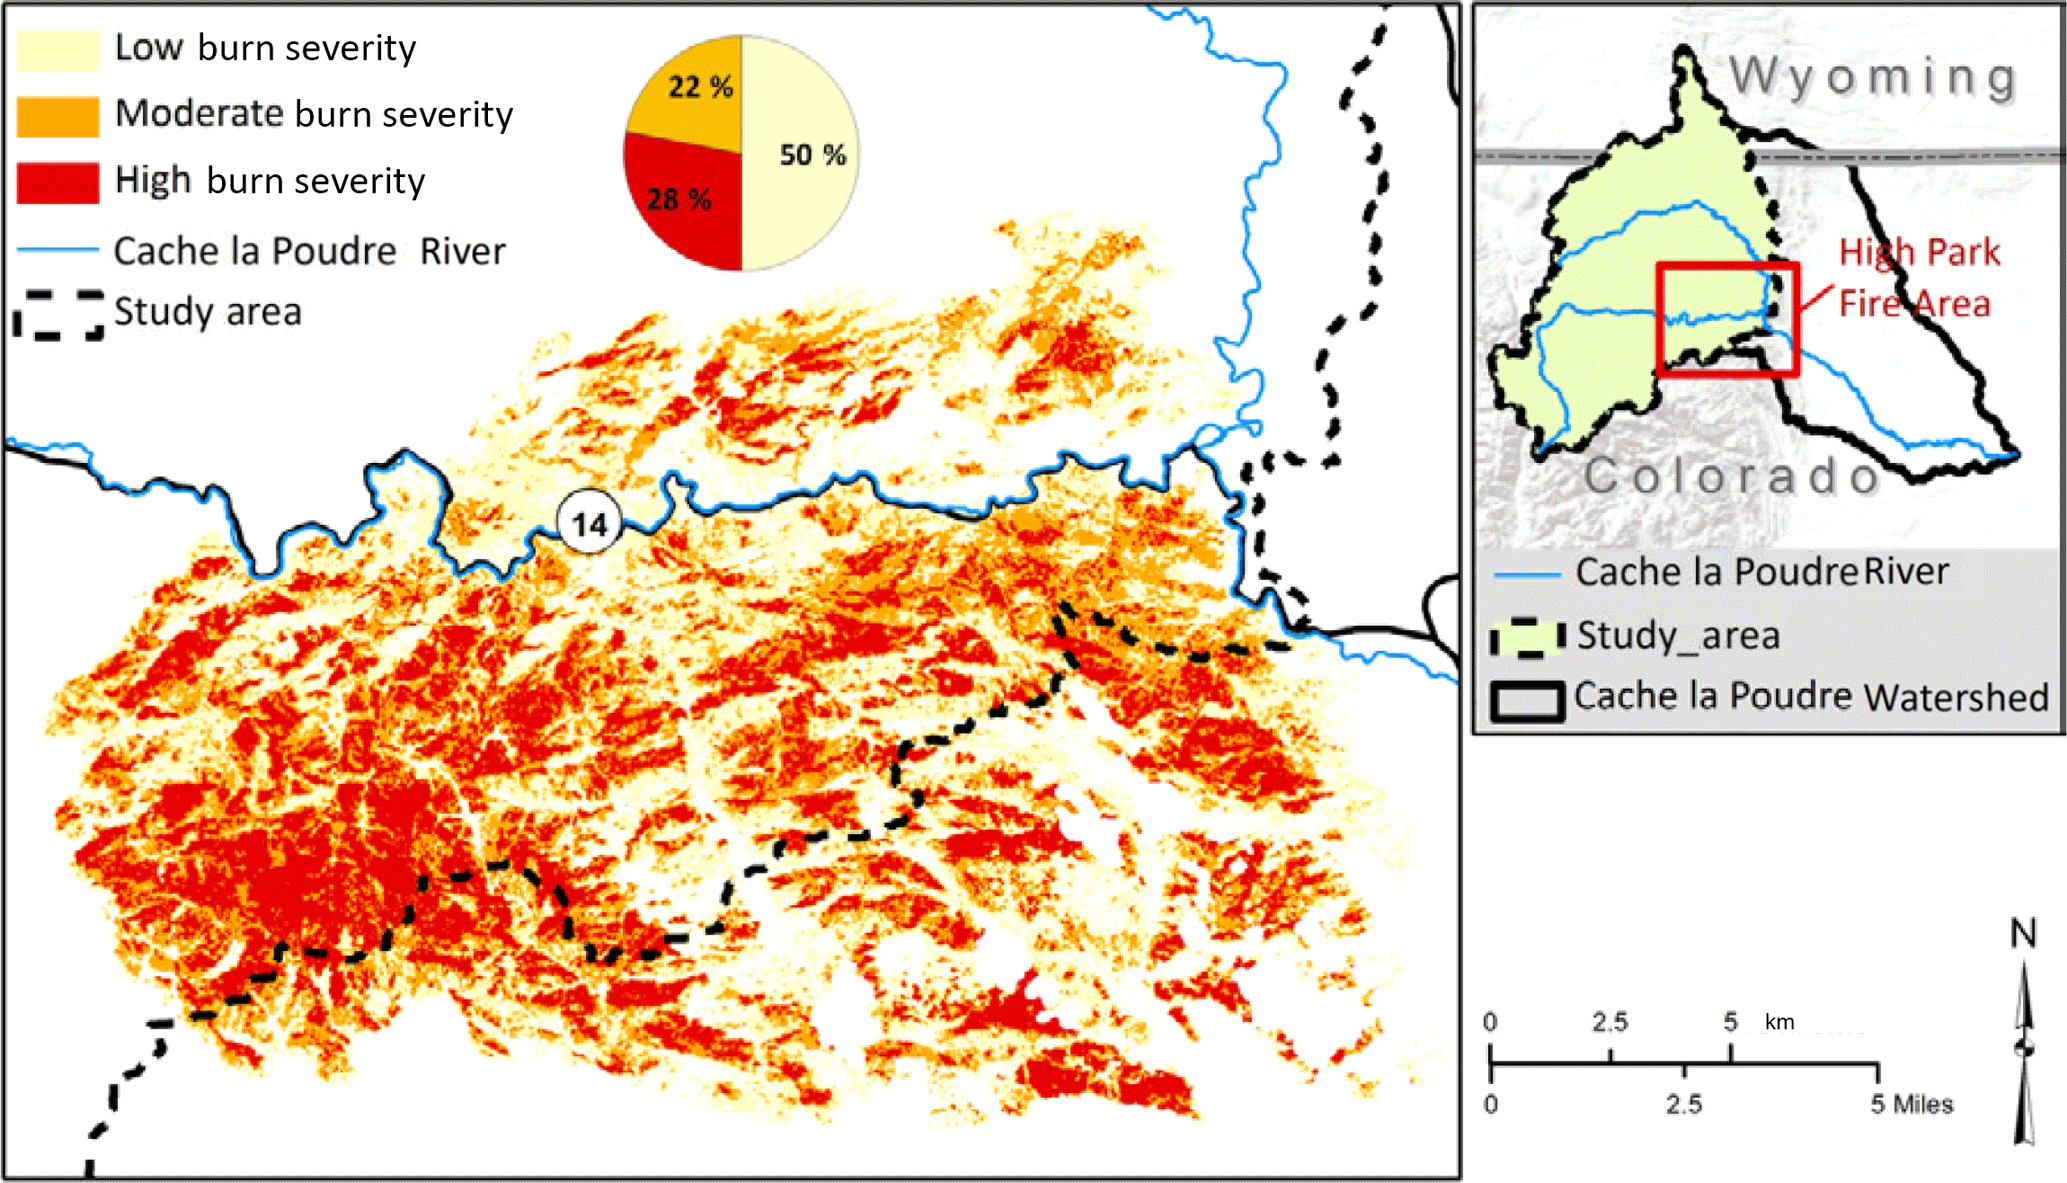
Figure A3Distribution of burn severity of the Hewlett and High Park wildfires within the study watershed based on MTSB's High Park Wildfire Assessment.
The Gridded Soil Survey Geographic (gSSURGO) database for Colorado and Wyoming (Soil Survey Staff, 2015), obtained from the USDA Natural Resources Conservation Service (NRCS), was used to represent the distribution of soil within the study watershed. This dataset contains soil mapping, which includes outlined areas called map units. These map units have unique properties, interpretations, and productivity which describe the soils. The study watershed contains 153 different map units. The SWAT SSURGO soils database (US Department of Agriculture Agricultural Research Service, 2012a, b) was used to describe various model parameters for each gSSURGO map unit. One model parameter of particular interest is the Hydrologic Soil Group (HSG). The HSG is a classification established by the NRCS which is based on the runoff potential of a given soil. This classification consists of four groups: A–D. Generally, soils designated as type A have the smallest runoff potential and soils designated as type D have the greatest. The distribution of soil as represented by HSG within the study watershed is shown in Fig. A4. Generally, the study watershed consists of Hydrologic Soil Group D-type soils, indicating the area has very low to moderate infiltration rates. This implies that the study watershed may have a high runoff potential.
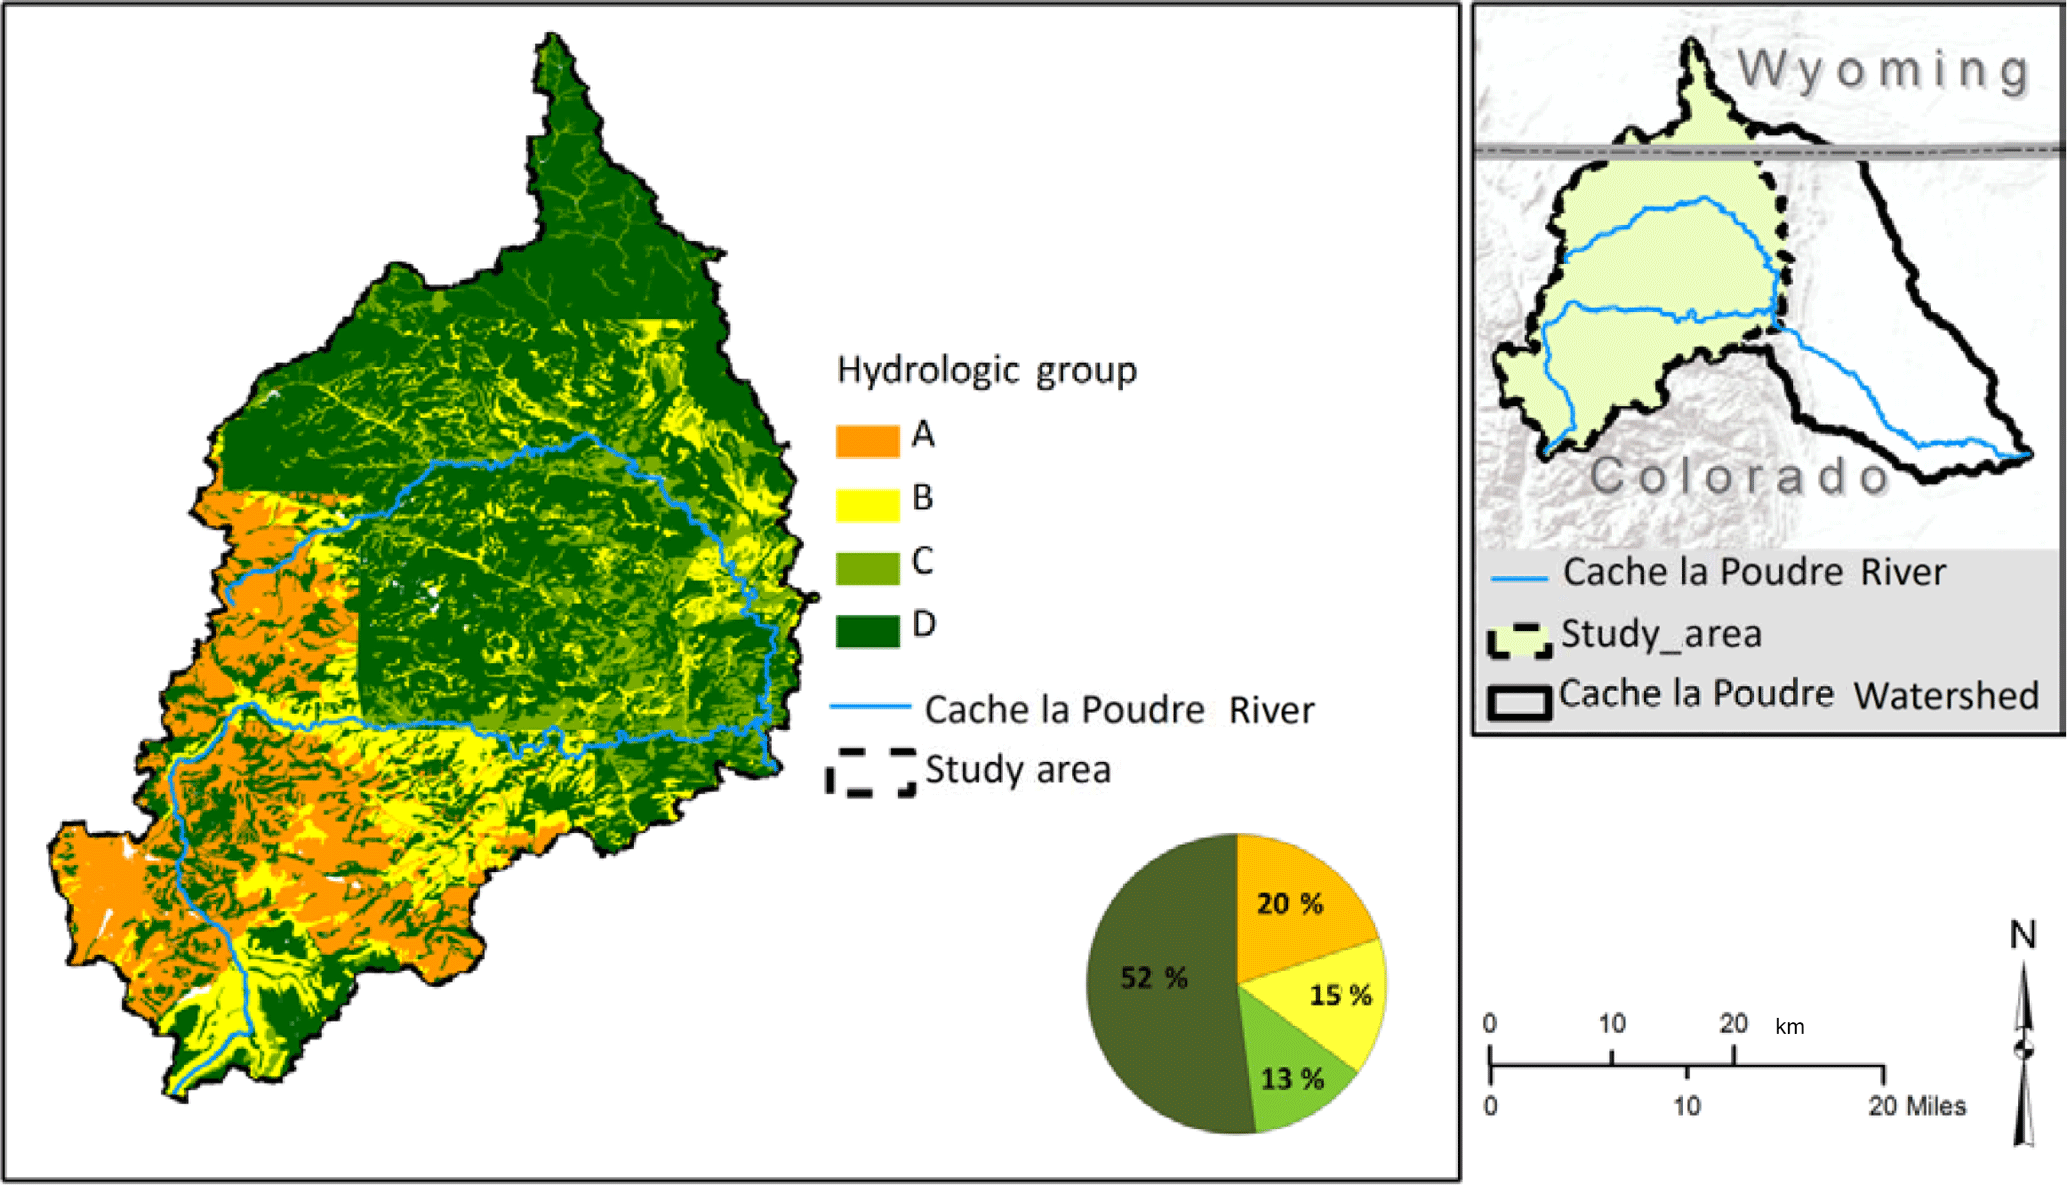
Figure A4Distribution of soil as represented by Hydrologic Soil Groups A–D within the study watershed based on the USDA's gSSURGO database.
Daily measurements of precipitation, maximum temperature, and minimum temperature for the study watershed were obtained from the Global Historical Climatology Network (GHCN) Daily dataset (NOAA, 2016), which is maintained by the National Climatic Data Center (NCDC). The NCDC extensively quality-assures GHCN daily data prior to data release. This is accomplished using a multi-tiered approach including a formatting check as well as a quality test looking for a variety of data problems. Based on this, no further quality control beside removal of flagged data was conducted. The stations were selected based on location, type of data provided, length of record, and completeness of record. A complete list of stations may be found in Table A2. Mean annual precipitation ranges from 330 mm at the lower elevations to 1350 mm at the higher elevations and mean annual temperature ranges from approximately 9 ∘C at the lower elevations to −5 ∘C at the higher elevations.
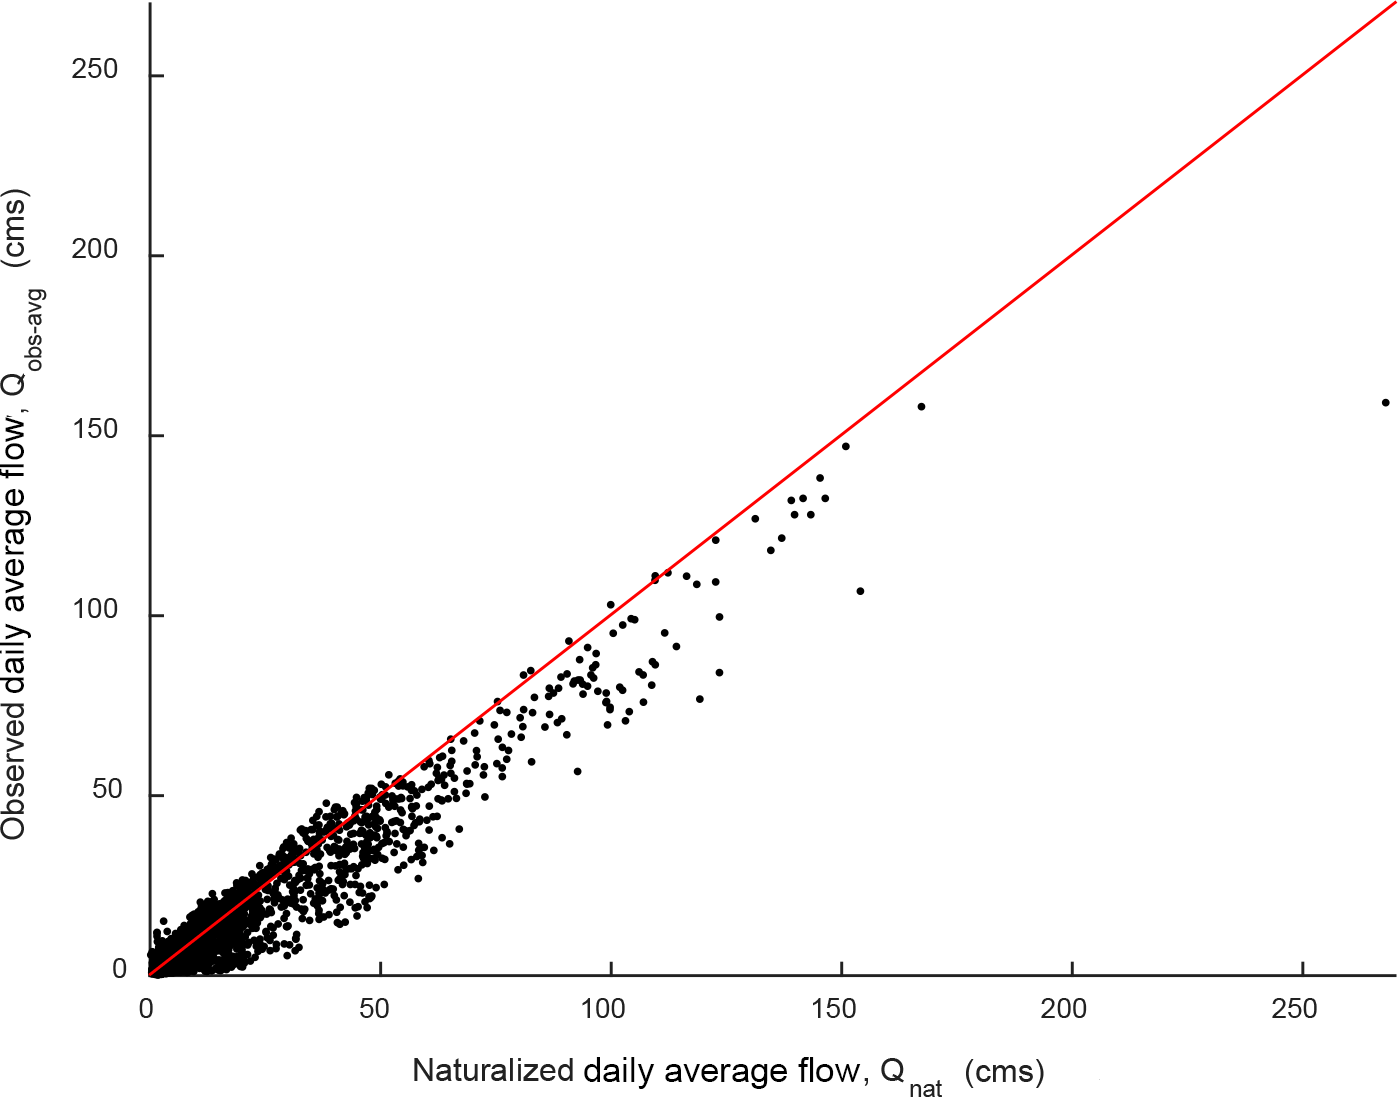
Figure A5CDWR naturalized daily average streamflow versus observed daily average streamflow with a 1 : 1 reference line.
Precipitation within the study watershed is greatest during the winter months. Snow accumulates which generates the mountain snowpack that is then released during the spring and early summer months. In an effort to support economic, environmental, and recreational water demands downstream, man-made structures such as diversions, storage reservoirs, and irrigation canals are used to store and distribute the snowmelt runoff during times of the year when the demand of water exceeds its availability. Thus, the Poudre River flow regime is modified. One study of the Poudre Watershed described several flow regime modifications including delayed hydrograph rise, decreased peak streamflows, and lower winter base flows (Richer, 2009). In an effort to ensure hydrologic processes are represented appropriately, naturalized streamflows were used for model calibration and testing. Naturalized streamflows remove the influence of the aforementioned features such as diversions and impoundments. Daily naturalized streamflows were collected from the Northern Colorado Water Conservancy District at the Mouth of Canyon. Figure A5 shows the relationship between naturalized daily average streamflow versus observed daily average streamflow.
A2 Supplementary tables
Table A1Comprehensive distribution of LULC in study watershed based on NLCD 2001, 2006, and 2011.
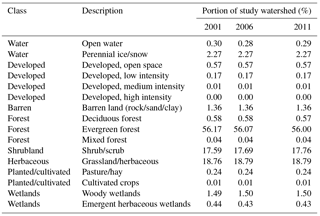
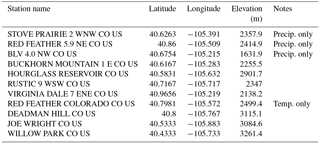
Table A3Original SWAT database land use/land cover lookup table.
* These parameters were varied as a percentage to maintain spatial variability.
Table A4Pre-wildfire edited lookup table and corresponding curve numbers.
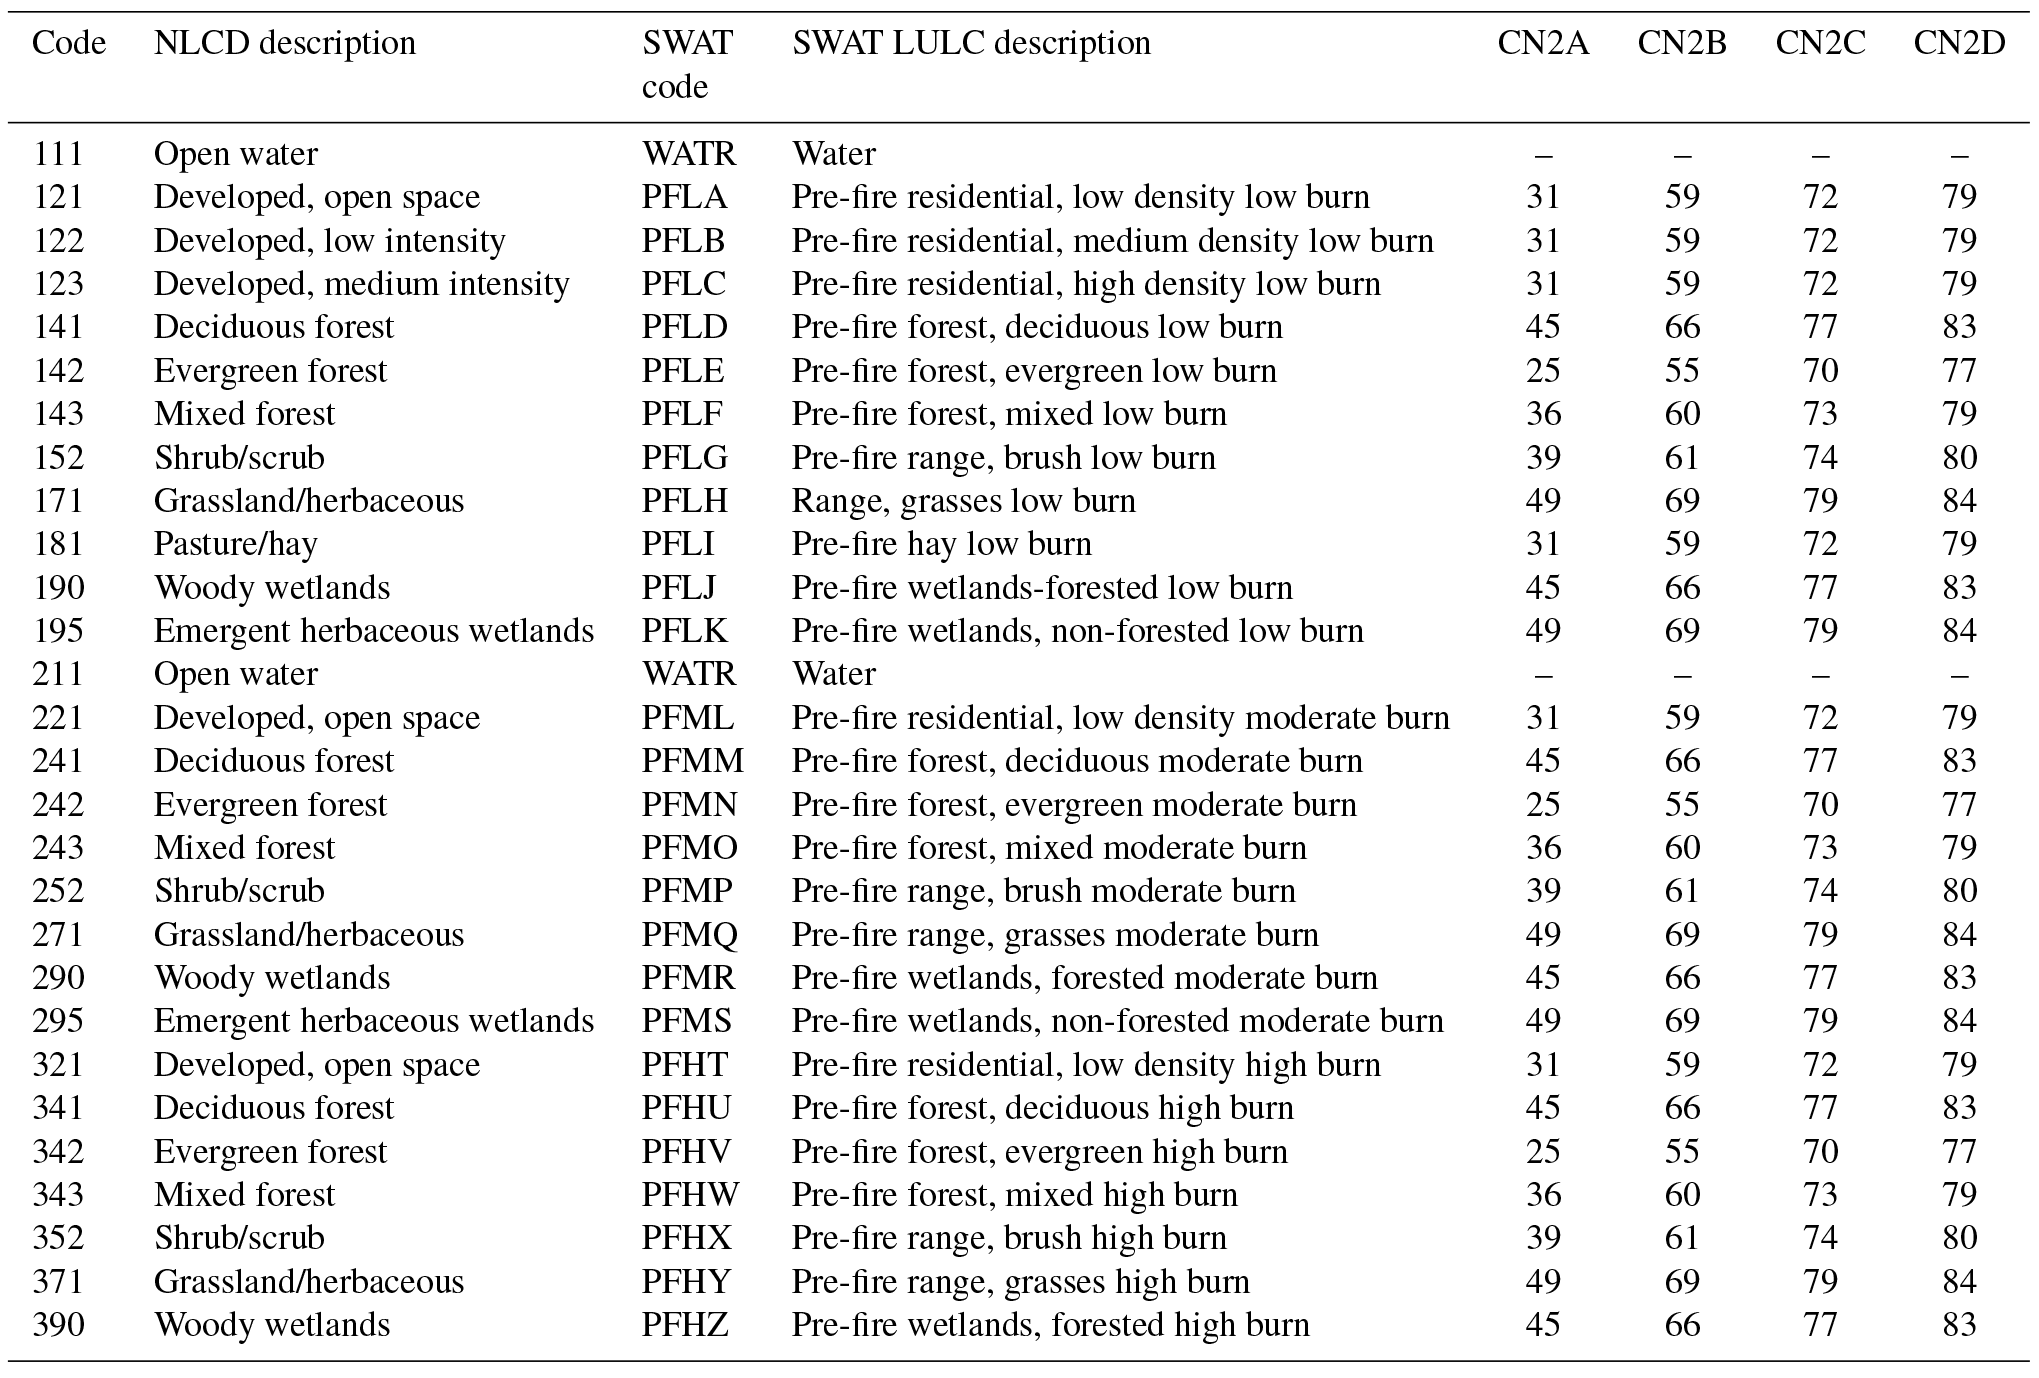
Table A5Post-wildfire edited lookup table and corresponding curve numbers.
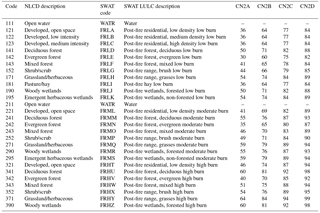
Table A6SWAT calibration parameters.
* These parameters were varied as a percentage to maintain spatial variability.
The authors declare that they have no conflict of interest.
This project was funded by the US Department of Agriculture National Institute
of Food and Agriculture (USDA-NIFA) grant number: 2012-67003-19904.
Edited by: Thom Bogaard
Reviewed by: two anonymous referees
Ahmadi, M., Arabi, M., Ascough, J., Fontane, D. G., and Engel, B. A.: Toward improved calibration of watershed models: Multisite multiobjective measures of information, Environ. Model. Softw., 59, 135-145, 2014.
Arnold, J. G., Williams, J. R., and Maidment, D. R.: Continuous-time water and sediment routing model for large basins, J. Hydraul. Eng., 121, 171–183, 1995.
Arnold, J. G., Srinivasan, R., Muttiah, R. S., and Williams, J. R.: Large-area hydrologic modeling and assessment: Part I. Model development, J. Am. Water Resour. Assoc., 34, 73–89, 1998.
Arnold, J. G., Moriasi, D. N., Gassman, P. W., Abbaspour, K. C., White, M. J., Srinivasan, R., Santhi, C., Harmel, R. D., van Griensven, A., Van Liew, M. W., Kannan, N., and Jha, M. K.: SWAT: model use, calibration, and validation, T. ASABE, 55, 1491–1508, 2012.
Batelis, S. and Nalbantis, I.: Potential effects of forest fires on streamflow in the Enipeas River Basin, Thessaly, Greece, Environ. Process., 1, 73–85, https://doi.org/10.1007/s40710-014-0004-z, 2014.
Benavides-Solorio, J. and MacDonald, L. H.: Post-fire runoff and erosion from simulated rainfall on small plots, Colorado Front Range, Hydrol. Process., 15, 2931–2952, https://doi.org/10.1002/hyp.383, 2001.
Beven, K.: How far can we go in distributed hydrological modelling?, Hydrol. Earth Syst. Sci., 5, 1–12, https://doi.org/10.5194/hess-5-1-2001, 2001.
CARD Staff: SWAT literature database for peer-reviewed journal articles, https://www.card.iastate.edu/swat_articles/, last access: 1 August 2016.
Clark, M. P., Bierkens, M. F. P., Samaniego, L., Woods, R. A., Uijlenhoet, R., Bennett, K. E., Valentijn, R. N. P., Cai, X., Wood, A. W., and Peters-Lidard, C. D.: The evolution of process-based hydrologic models: historical challenges and the collective quest for physical realism. Hydrol. Earth Syst. Sci., 21, 3427–3440, https://doi.org/10.5194/hess-21-3427-2017, 2017.
Doerr, S. H. and Santín, C.: Global trends in wildfire and its impacts: perceptions versus realities in a changing world, Philos. T. Roy. Soc. B, 371, 20150345, https://doi.org/10.1098/rstb.2015.0345, 2016.
Ebel, B. A., Moody, J. A., and Martin, D. A.: Hydrologic conditions controlling runoff generation immediately after wildfire, Water Resour. Res., 48, W03529, https://doi.org/10.1029/2011WR011470, 2012.
El-Khoury, A., Seidou, O., Lapen, D. R., Que, Z., Mohammadian, M., Sunohara, M., and Bahram, D.: Combined impacts of future climate and land use changes on discharge, nitrogen and phosphorus loads for a Canadian river basin, J. Environ. Manage., 151, 76–86, https://doi.org/10.1016/j.jenvman.2014.12.012, 2015.
Famiglietti, J. S. and Wood, E. F.: Effects of spatial variability and scale on areally averaged evapotranspiration, Water Reour. Res., 31, 699–712, https://doi.org/10.1029/94wr02820, 1995.
Fan, C. and Li, J.: A modelling analysis of urban stormwater flow regimes and their implication for stream erosion, Water Qual. Res. J. Canada, 39, 356–361, 2004.
Fan, M. and Shibata, H.: Simulation of watershed hydrology and stream water quality under land use and climate change scenarios in Teshio River watershed, northern Japan, Ecol. Indic., 50, 79–89, https://doi.org/10.1016/j.ecolind.2014.11.003, 2015.
Foy, C., Arabi, M., Yen, H., Asce, A. M., Gironás, J., and Bailey, R. T.: Multisite assessment of hydrologic processes in snow-dominated mountainous river basins in Colorado using a watershed model, J. Hydrol. Eng., 20, 04015017, https://doi.org/10.1061/(ASCE)HE.1943-5584.0001130, 2015.
Gassman, P. W., Reyes, M. R., Green, C. H., and Arnold, J. G.: The soil and water assessment tool: historical development, application, and future research directions, T. ASABE, 50, 1211–1250, 2007.
Goodrich, D. C., Canfield, H. E., Burns, S. B., Semmens, D. J., Miller, S. N., Hernandez, M., Levick, L. R., Guertin, D. P., and Kepner, W. G.: Rapid post-fire hydrologic watershed assessment using the AGWA GIS-based hydrologic modeling tool, in: Proceedings, ASCE Watershed Management Conference, 19–22 July 2005, Williamsburg, VA, https://doi.org/10.1061/40763(178)44, 2005.
Gould, G. K., Liu, M., Barber, M. E., Cherkauer, K. A., Robichaud, P. R., and Adam, J. C.: The effects of climate change and extreme wildfire events on runoff erosion over a mountain watershed, J. Hydrol., 536, 74–91, 2016.
Holden, J., Chapman, P. J. Palmer, S. Grayson, R., and Kay, P: The impacts of prescribed moorland burning on water colour and dissolved organic carbon: A critical synthesis, J. Environ. Manage., 101, 92–103, 2012.
Inbar, M., Tamir, M., and Wittenberg, L.: Runoff and erosion processes after a forest fire in Mount Carmel, a Mediterranean area, Geomorphology, 24, 17–33, https://doi.org/10.1016/S0169-555X(97)00098-6, 1998.
Jeong, J., Kannan, N., Arnold, J., Glick, R., Gosselink, L., and Srinivasan, R.: Development and integration of sub-hourly rainfall-runoff modelling capability within a watershed model, Water Resour. Manage., 15, 4505–4527, https://doi.org/10.1007/s11269-010-9670-4, 2010.
Kannan, N. and Jeong, J.: An approach for estimating stream health using flow duration curves and indices of hydrologic alteration, EPA Region 6 Water Quality Protection Division, United States Environmental Protection Agency, Dallas, Texas, USA, 2011.
Kiesel, J., Schmalz, B., Brown, G. L., and Fohrer, N.: Application of a hydrological-hydraulic modelling cascade in lowlands for investigating water and sediment fluxes in catchment, channel and reach, J. Hydrol. Hydromech., 61, 334–346, https://doi.org/10.2478/johh-2013-0042, 2013.
Lavabre, J., Torres, D. S., and Cernesson, F.: Changes in the hydrological response of a small Mediterranean basin a year after a wildfire, J. Hydrol., 142, 273–299, https://doi.org/10.1016/0022-1694(93)90014-Z, 1993.
Liu, S., Leslie, L. M., Speer, M., Bunker, R., and Mo, X.: The effects of bushfires on hydrological processes using a paired-catchment analysis, Meteorol. Atmos. Phys., 86, 31–44, https://doi.org/10.1007/s00703-003-0614-x, 2004.
Lu, Z., Zou, S., Xiao, H., Zheng, C., Yin, Z., and Wang, W.: Comprehensive hydrologic calibration of SWAT and water balance analysis in mountainous watersheds in northwest China, Phys. Chem. Earth, 79–82, 76–85, https://doi.org/10.1016/j.pce.2014.11.003, 2015.
Mahat, V., Anderson, A., and Silins, U.: Modelling of wildfire impacts on catchment hydrology applied to two case studies, Hydrol. Process. 29, 3687–3698, https://doi.org/10.1002/hyp.10462, 2015.
McLin, S. G., Springer, E. P., and Lane, L. J.: Predicting floodplain boundary changes following the Cerro Grande wildfire, Hydrol. Process., 15, 2967–2980, https://doi.org/10.1002/hyp.385, 2001.
Monitoring Trends in Burn Severity Project: Monitoring Trends in Burn Severity Data Access, Fire Map Geospatial Data, US Geological Survey and US Forest Service, http://www.mtbs.gov/dataaccess.html, last access: 1 August 2016.
Moody, J. A. and Martin, D. A.: Post-fire, rainfall intensity-peak discharge relations for three mountainous watersheds in the Western USA, Hydrol. Process., 15, 2981–2993, https://doi.org/10.1002/hyp.386, 2001.
Moody, J. A. and Martin, D. A.: Synthesis of sediment yields after wildland fire in different rainfall regimes in the western United States, Int. J. Wildland Fire, 18, 96–115, 2009.
Moody, J. A., Shakesby, R. A., Robichaud, P. R., Cannon, S. H., and Martin, D. A.: Current research issues related to post-wildfire runoff and erosion processes, Earth-Sci. Rev., 122, 10–37, https://doi.org/10.1016/j.earscirev.2013.03.004, 2013.
Moriasi, D. N., Arnold, J. G., Van Liew, M. W., Bingner, R. L., Harmel, R. D., and Veith, T. L.: Model evaluation guidelines for systematic quantification of accuracy in watershed simulations, Am. Soc. Agric. Biol. Eng., 50, 885–900, https://doi.org/10.13031/2013.23153, 2007.
Motallebi, M., Hoag, D. L., Tasdighi, A., Arabi, M., and Osmond, D.: An economic inquisition of water quality trading programs, with case study of Jordan Lake, NC, J. Environ. Manage., 193, 483–490, 2017.
Motovilov, Y., Gottschalk, L., Engeland, K., and Rodhe, A.: Validation of a distributed hydrological model against spatial observations, Agr. Forest Meteorol., 98–99, 257–277, https://doi.org/10.1016/S0168-1923(99)00102-1, 1999.
Nash, E. and Sutcliffe, V.: River Flow Forecasting Through Conceptual Models Part I – A Discussion of Principles, J. Hydrol., 10, 282–290, 1970.
Neary, D. G., Gottfried, G. J., and Ffolliott, P. F.: Post-Wildfire Watershed Flood Responses, in: Paper 1B7, Second International Fire Ecology and Fire Management Congress, 16–20 November 2003, Orlando, Florida, 2003.
Neitsch, S., Arnold, J., Kiniry, J.., and Williams, J.: Soil & Water Assessment Tool Theoretical Documentation Version 2009, United States Department of Agriculture, Agricultural Reseach Service, Texas Agricultural Experiment Station, College Station, Texas, USA, 2011.
Neupane, R. P., White, J. D., and Alexander, S. E.: Projected hydrologic changes in monsoon-dominated Himalaya Mountain basins with changing climate and deforestation, J. Hydrol., 525, 216–230, https://doi.org/10.1016/j.jhydrol.2015.03.048, 2015.
Newtson, J.: The impact of fire on flow duration curves in Southern California shrubland watersheds, MS thesis, San Diego State University, San Diego, p. 66, 2013.
Nicklow, J. W., Boulos, P. F., and Muleta, M. K.: Comprehensive Urban Hydrologic Modeling Handbook for Engineers and Planners, MWH Soft, Inc., Pasadena, CA, 2006.
NOAA – National Oceanic and Atmospheric Administration: National Climatic Data Center, http://www.ncdc.noaa.gov/, last access: 1 February 2016.
Oropeza, J. and Heath, J.: Five year summary report (2008–2012) Upper Cache la Poudre River Collaborative Water Quality Monitoring Program, City of Fort Collins Utilities, Fort Collins, 2013.
Pai, N. and Saraswat, D.: SWAT2009_LUC: A tool to activate the land use change module in SWAT 2009, T. ASABE, 54, 1649–1658, 2001.
Parson, A., Robichaud, P. R., Lewis, S. A., Napper, C., and Clark, J. T.: Field Guide for Mapping Post-fire Soil Burn Severity, Gen. Tech. Rep. No. RMRS-GTR-243, Department of Agriculture, Forest Service, Rocky Mountain Research Station, Fort Collins, CO, USA, 2010.
Richer, E. E.: Snowmelt runoff analysis and modeling for the Upper Cache la Poudre River Basin, Colorad, MS Thesis, Colorado State University, Fort Collins, Colorado, USA, 117 pp., 2009.
Robichaud, P. R.: Fire effects on infiltration rates after prescribed fire in Northern Rocky Mountain forests, USA, J. Hydrol., 231, 220–229, https://doi.org/10.1016/S0022-1694(00)00196-7, 2000.
Robichaud, P. R., Beyers, J. L., and Neary, D. G.: Evaluating the effectiveness of postfire rehabilitation treatments, General Technical Report RMRS-GTR-63, United States Department of Agriculture, Forest Service, Fort Collins, Colorado, USA, 2000.
Robichaud, P. R., Elliot, W. J., Pierson, F. B., Hall, D. E., and Moffet, C. A.: Predicting postfire erosion and mitigation effectiveness with a web-based probabilistic erosion model, Catena, 71, 229–241, https://doi.org/10.1016/j.catena.2007.03.003, 2007.
Ryan, S. E., Dwire, K. A., and Dixon, M. K.: Impacts of wildfire on runoff and sediment loads at Little Granite Creek, western Wyoming, Geomorphology, 129, 113–130, https://doi.org/10.1016/j.geomorph.2011.01.017, 2011.
Saltelli, A., Tarantola, S., and Chan, K. P. S.: A quantitative model-independent method for global sensitivity analysis of model output, Technometrics, 41, 39–56, 1999.
Sanadhya, P., Gironas, J., and Arabi, M.: Global sensitivity analysis of hydrologic processes in major snow-dominated mountainous river basins in Colorado, Hydrol. Process., 28, 3404–3418, https://doi.org/10.1002/hyp.9896, 2014.
Scott, D. F.: The hydrological effects of fire in South African mountain catchments, J. Hydrol., 150, 409–432, https://doi.org/10.1016/0022-1694(93)90119-T, 1993.
Soil Survey Staff: The Gridded Soil Survey Geographic (SSURGO) Database, US Department of Agriculture, Natural Resources Conservation Service, http://datagateway.nrcs.usda.gov/ (last access: 1 August 2016), 2015.
Tasdighi, A., Arabi, M., and Osmond, D. L.: The relationship between land use and vulnerability to nitrogen and phosphorus pollution in an urban watershed, J. Environ. Qual., 46, 113–122, 2017.
Tolson, B. A. and Shoemaker, C. A.: Dynamically dimensioned search algorithm for computationally efficient watershed model calibration, Water Resour. Res., 43, W01413, https://doi.org/10.1029/2005WR004723, 2007.
Townsend, S. A. and Douglas, M. M.: The effect of a wildfire on stream water quality and catchment water yield in a tropical savanna excluded from fire for 10 years (Kakadu National Park, North Australia), Water Res., 38, 3051–3058, https://doi.org/10.1016/j.watres.2004.04.009, 2004.
US Department of Agriculture Agricultural Research Service: SWAT 2012 Revision 591, http://swat.tamu.edu/ (last access: 1 August 2016), 2012a.
US Department of Agriculture Agricultural Research Service: SWAT US SSURGO database, http://swat.tamu.edu/ (last access: 1 August 2016), 2012b.
US Department of Agriculture Agricultural Research Service: ArcSWAT 2012.10_1.13, http://swat.tamu.edu/ (last access: 1 August 2016), 2014.
USGS TNM – US Geological Survey The National Map: TNM Map viewer, https://viewer.nationalmap.gov/viewer/, last access: 1 August 2016.
Viviroli, D., Dürr, H. H., Messerli, B., Meybeck, M., and Weingartner, R.: Mountains of the world, water towers for humanity: Typology, mapping, and global significance, Water Resour. Res., 43, W07447, https://doi.org/10.1029/2006WR005653, 2007.
Vogel, R. M., Sieber, J., Archfield, S. A., Smith, M. P., Apse, C. D., and Huber-Lee, A.: Relations among storage, yield, and instream flow, Water Resour. Res., 43, 1–12, https://doi.org/10.1029/2006WR005226, 2007.
Westerling, A.: Increasing western US forest wildfire activity: sensitivity to changes in the timing of spring, Philos. T. Roy. Soc. B, 371, 20150178, https://doi.org/10.1098/rstb.2015.0178, 2016.
Wohl, E.: A brief review of the process domain concept and its application to quantifying sediment dynamics in bedrock canyons, Terra Nov., 22, 411–416, https://doi.org/10.1111/j.1365-3121.2010.00950.x, 2010.
Zhu, C. and Li, Y.: Land use/land cover change and its hydrological impacts from 1984 to 2010 in the Little River Watershed, Tennessee, Int. Soil Water Conserv. Res., 2, 11–21, https://doi.org/10.1016/S2095-6339(15)30002-2, 2014.