the Creative Commons Attribution 4.0 License.
the Creative Commons Attribution 4.0 License.
 | 08 Feb 2018
Impact of coastal forcing and groundwater recharge on the growth of a fresh groundwater lens in a mega-scale beach nourishment
Sebastian Huizer
Max Radermacher
Sierd de Vries
Gualbert H. P. Oude Essink
Marc F. P. Bierkens
For a large beach nourishment called the Sand Engine – constructed in 2011 at the Dutch coast – we have examined the impact of coastal forcing (i.e. natural processes that drive coastal hydro- and morphodynamics) and groundwater recharge on the growth of a fresh groundwater lens between 2011 and 2016. Measurements of the morphological change and the tidal dynamics at the study site were incorporated in a calibrated three-dimensional and variable-density groundwater model of the study area. Simulations with this model showed that the detailed incorporation of both the local hydro- and morphodynamics and the actual recharge rate can result in a reliable reconstruction of the growth in fresh groundwater resources. In contrast, the neglect of tidal dynamics, land-surface inundations, and morphological changes in model simulations can result in considerable overestimations of the volume of fresh groundwater. In particular, wave runup and coinciding coastal erosion during storm surges limit the growth in fresh groundwater resources in dynamic coastal environments, and should be considered at potential nourishment sites to delineate the area that is vulnerable to salinization.
- Article
(6726 KB) - Full-text XML
- BibTeX
- EndNote


Groundwater is an important – in many situations vital – source of high-quality fresh water for most coastal communities in the world. However, these coastal fresh groundwater resources are to an increasing degree affected by seawater intrusion, primarily caused by (excessive) groundwater extraction and sea-level rise (Ferguson and Gleeson, 2012; Taylor et al., 2013). Global population growth in the coming decades will lead to a rising demand for fresh water, and combined with the projected sea-level rise this will likely result in a gradual decline of fresh groundwater resources (Famiglietti, 2014; Wong et al., 2014). In addition, sea-level rise can also increase coastal flooding – caused by storm surges – and may lead to an increase in coastal erosion, which in turn will induce seawater intrusion and may cause a loss of wetland and biodiversity (FitzGerald et al., 2008; Passeri et al., 2015; Wong et al., 2014). Coastal lowlands with low topographic gradients and small islands are particularly vulnerable, because these areas are the most susceptible to coastal flooding and seawater intrusion (FitzGerald et al., 2008; McGranahan et al., 2007; Michael et al., 2013; Rotzoll and Fletcher, 2012).
There are two potential responses to these rising threats to coastal communities, especially in relation to sea-level rise: (global) mitigation and (local) adaptation (Nicholls, 2011; Wong et al., 2014). With the progression of our knowledge and expectations on sea-level rise, the international perspective has shifted to adaptation (Brown et al., 2014). Some countries, such as the Netherlands, Germany, and the United States, have implemented coastal protection measures, which is the only adaptation approach that additionally might help to preserve fresh groundwater resources (van Koningsveld and Mulder, 2004; Rosenzweig and Solecki, 2010; Sterr, 2008).
In the Netherlands – a vulnerable low-lying country with a long history of coastal flood management – sandy shorelines have been successfully maintained and reinforced with an extensive sand nourishment programme in the last decades (Giardino et al., 2011; Keijsers et al., 2015). The anticipation of sea-level rise has led to new adaptation measures (Kabat et al., 2009), where the construction of a large concentrated beach nourishment called the Sand Engine (also called Sand Motor) is one notable example (Fig. 1). This large beach nourishment was created on the Dutch coast as part of an effort to attain a more sustainable coastal protection approach (Slobbe et al., 2013). Contrary to regular nourishments, the Sand Engine is deemed advantageous because it only causes a disturbance at a concentrated part of the coastline during a short time, after which the excess sand nourishes the larger length of the coastline gradually by natural along-shore sand transport (Stive et al., 2013).
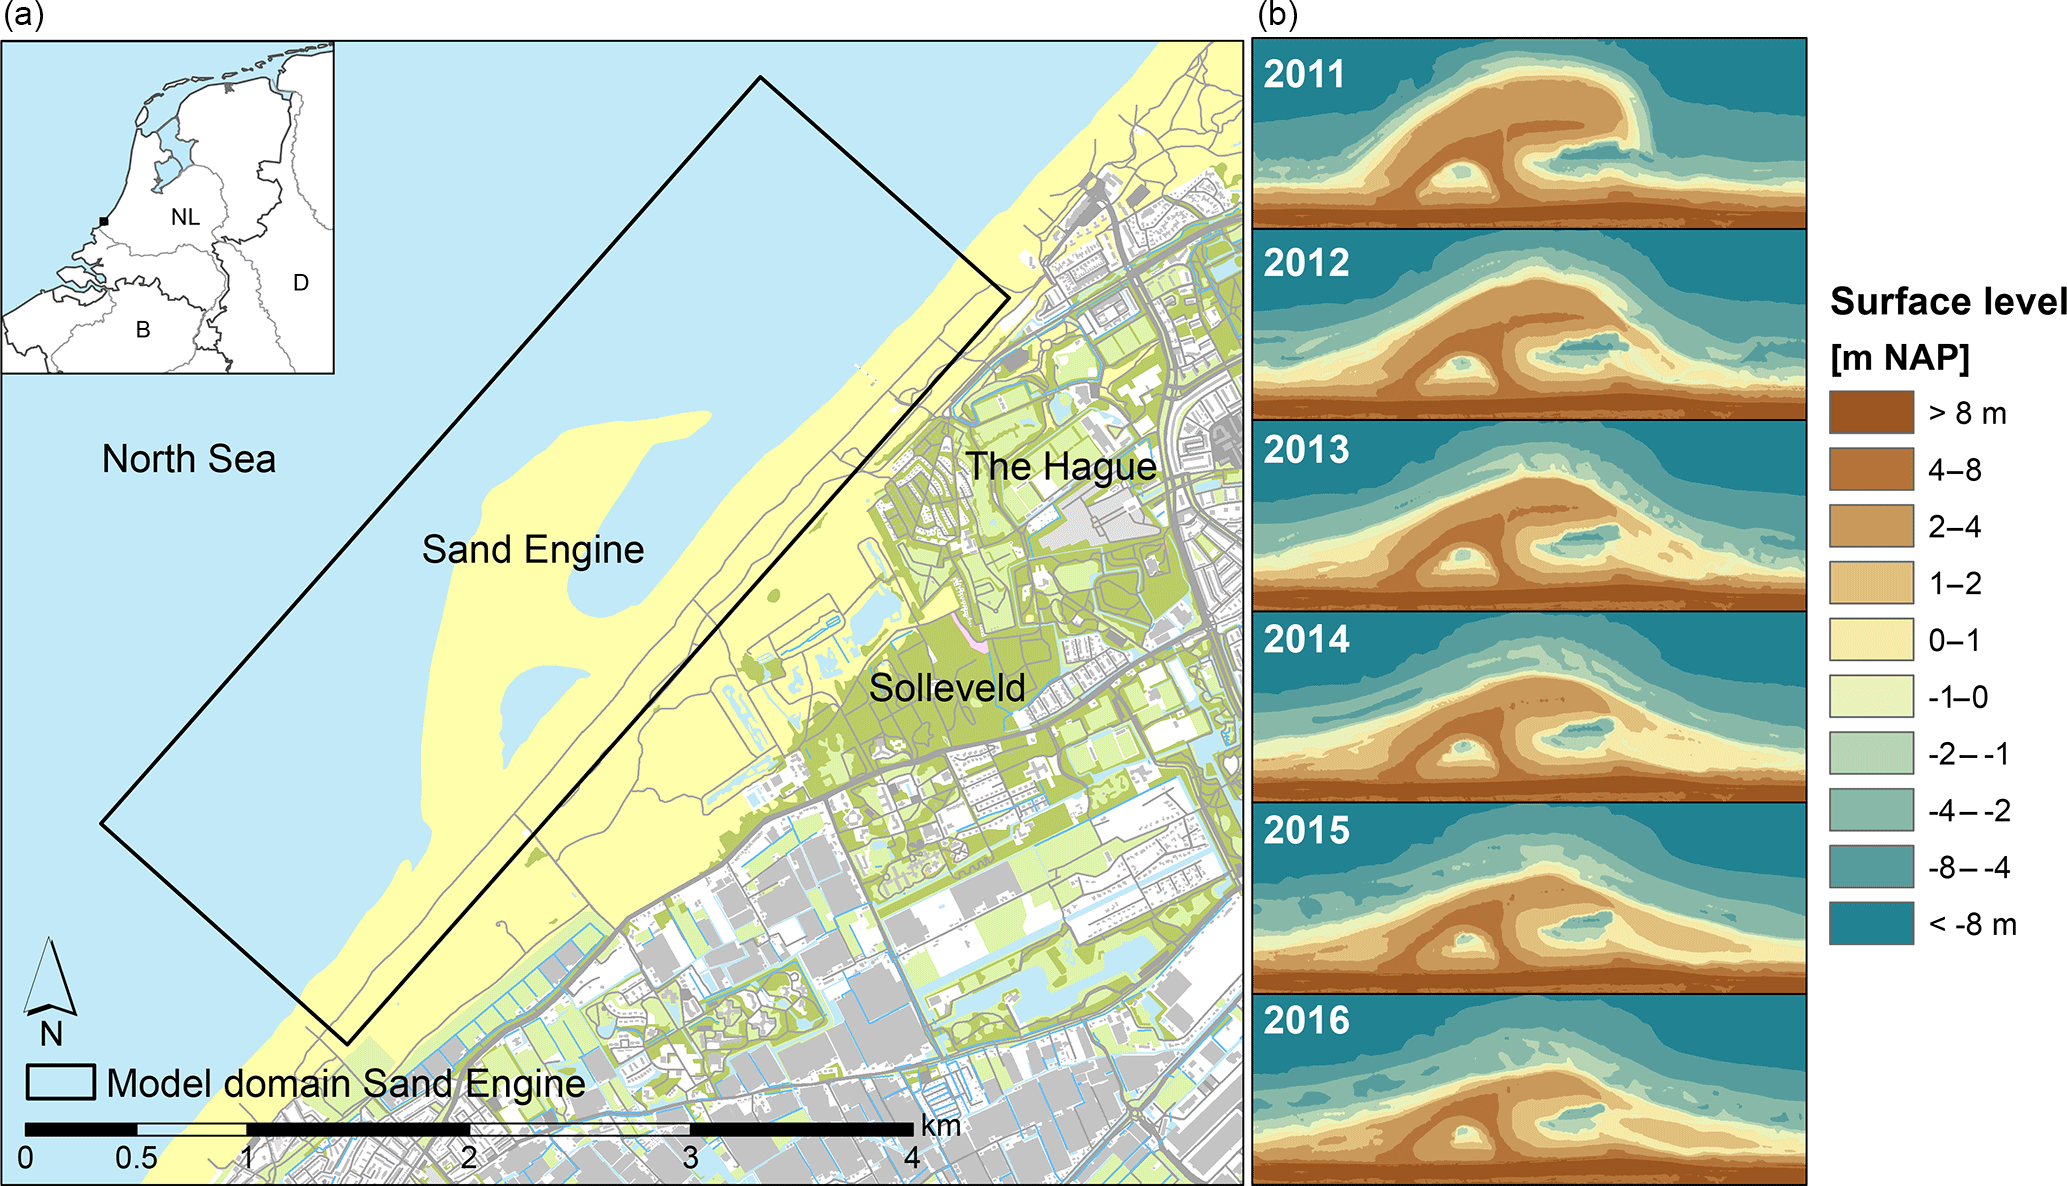
Figure 1Map of the study area with the model domain (a), and the change of the surface level in the study area (morphological development) between 2011 and 2016 (b) in metres with respect to the NAP datum, which is approximately equal to mean sea level.
In previous studies, we showed that large beach nourishments such as the Sand Engine can potentially lead to substantial increases in fresh groundwater resources (Huizer et al., 2016) and that the impact of tides and storm surges on these resources can be simulated accurately when the system is thoroughly understood (Huizer et al., 2017). This raised questions concerning the potential growth of fresh groundwater resources in the Sand Engine following its construction in 2011, and how important the impact of coastal forcing (i.e. natural processes that drive coastal hydro- and morphodynamics such as wind, waves, and tides) precipitation and evaporation was on the observed growth in fresh groundwater resources. In other words, did the freshwater lens grow substantially following the construction of the Sand Engine, is it possible to reproduce this growth reliably with a numerical model, and how important is detailed information on land-surface inundations, geomorphological changes, and groundwater recharge for the replication of this growth? To answer these questions this study aims to reconstruct the development of the freshwater lens and mixing zone between 2011 and 2016, and evaluate the importance of an accurate description of (1) land-surface inundations, (2) geomorphological changes, and (3) groundwater recharge for the prediction of the growth of fresh groundwater resources. Both the reconstruction and evaluation were conducted with a three-dimensional (3-D) variable-density groundwater model, where the model simulations were calibrated and evaluated with (transient) groundwater head and groundwater salinity measurements. Considering the aims of this study, it is important to note that both the spatial and temporal changes of fresh groundwater resources in the Sand Engine are simulated, calibrated, and evaluated.
2.1 Site description: Sand Engine
The Sand Engine (also called Sand Motor) is a large concentrated beach nourishment of approximately 17 million m3 sand, which was placed on the Dutch coast in 2011 as a hook-shaped peninsula (Fig. 1). This nourishment is part of an innovative pilot project in which this nourishment method is evaluated with respect to the current practice of large-scale distribution of smaller volumes of sand. One appealing hallmark of the Sand Engine is that natural forces (i.e. wind, waves, and currents) gradually transport the replenished sand along the retreating coast, and simultaneously support natural dune growth (Slobbe et al., 2013).
Coastal forcing – storm surges in particular – led to substantial geomorphological changes at the Sand Engine in the measurement period. Between 2011 and 2016 the shoreline along the outer perimeter of the peninsula retreated approximately 200 m (de Schipper et al., 2016). The geomorphological changes of the Sand Engine were monitored every 1–3 months with topographic surveys, as part of an intensive monitoring programme (Aquavision et al., 2017). Spatial interpolations of all topographic surveys were used to update the surface elevation in the groundwater model, and these were implemented as sequential grid regenerations.
2.2 Variable-density groundwater flow model
Spatial and temporal changes in fresh and salt groundwater in the Sand Engine were simulated with a 3-D groundwater model, in which the computer code SEAWAT was used to simulate variable-density saturated groundwater flow and salinity transport (Langevin et al., 2008). In SEAWAT the governing flow and solute transport equations are coupled and solved with a cell-centred finite difference approximation. Numerous studies have applied this code to simulate variably-density, transient groundwater flow in coastal environments (Colombani et al., 2016; Holding and Allen, 2015; Pauw et al., 2014; Rasmussen et al., 2013; Webb and Howard, 2011).
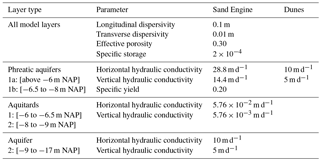
The model domain had a length of 4500 m and width of 1500 m (Fig. 1), and was discretized into 75 rows and 225 columns with horizontal cell sizes of 20 m, and 28 layers with a thickness of 0.5 m in the upper layers and 1 m in layers below −7 m NAP (Amsterdam Ordnance Datum, which is approximately equal to MSL). Boreholes from the Sand Engine and adjacent dunes show that the subsoil of the study area consists of sandy aquifers with fine to coarse-grained sand, which are (partially) interrupted by two thin aquitards consisting of sandy clay, and are separated from underlying aquifers by an aquitard consisting of clay and peat (Fig. 2). The replenished sand and upper aquifers (Aquifer 1a and b) are mainly composed of medium coarse-grained sand, while the sand in the dunes and below −9 m NAP (Aquifer 2) is mainly composed of fine-grained sand (Fig. 2). The underlying aquitard – situated between −17 and −20 m NAP – was defined as the local hydrogeological base of the model.
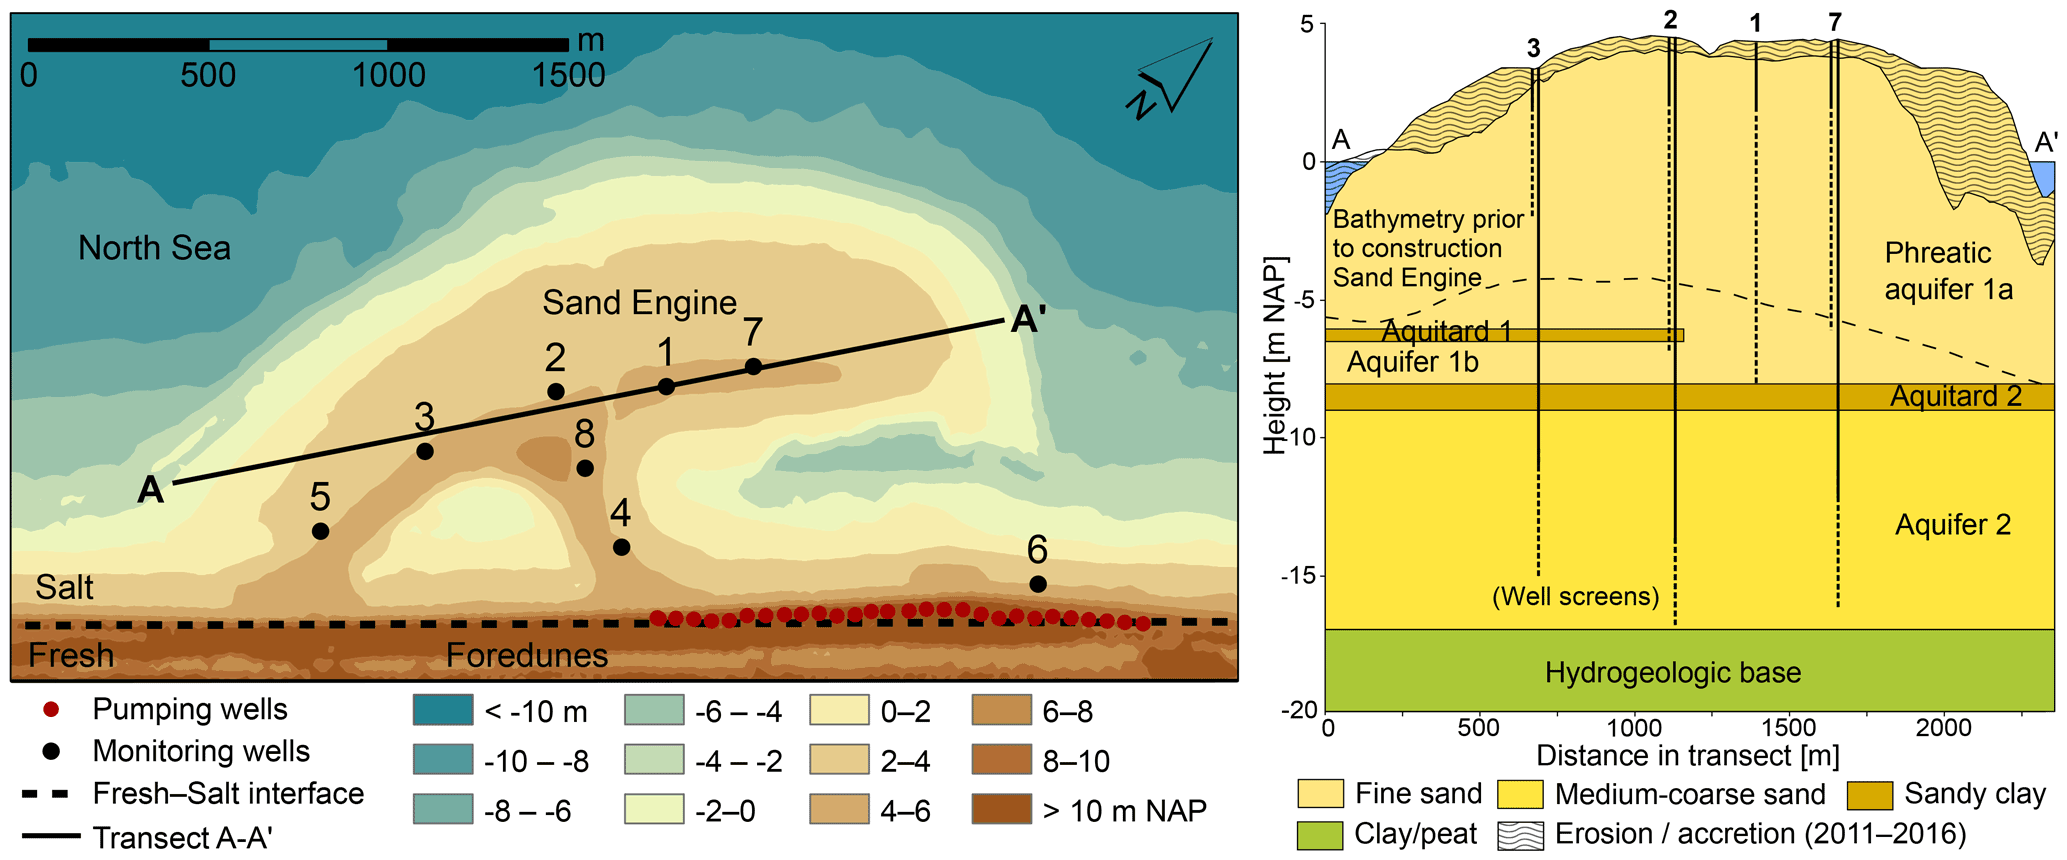
Figure 2Contour map of topographic height (in metres with respect to the NAP datum) and hydrogeological cross section (along black line, A–A') of the Sand Engine between 1 and 3 August 2011, with the location of monitoring wells (black points) and pumping wells (red points). The dashed line in the cross section marks the bathymetry prior to the construction of the Sand Engine, and the wave-shading pattern marks the erosion or accretion of sand between 3 August 2011 and 3 June 2016.
The boundaries of the model domain were defined either as a no-flow boundary (boundaries perpendicular to shoreline, and hydrogeological base) or as a specified head and concentration boundary (boundaries parallel to the shoreline). Specific head and concentration boundaries within the North Sea equalled tide gauge measurements in the harbours of Scheveningen and Hoek van Holland and seawater salinity of 28 g TDS L−1 (i.e. equal to the observed average seawater salinity at the site: Rijkswaterstaat 2012). The inland specified head and concentration boundary, situated in the Solleveld dune area, was determined with an extra simulation with the calibrated groundwater model as described in Huizer et al. (2016). In this calibrated model the groundwater recharge was adapted according to the model scenarios (Sect. 2.5.3). The groundwater head distribution at the start of the model simulations – before the completion of the Sand Engine in June 2011 – were set equal to the calibrated conditions of the same previously mentioned model (Huizer et al., 2016). The initial groundwater salinity distribution was approximated with a sharp (vertical) fresh–salt groundwater interface in the foredunes (see Fig. 2), because the former model underestimated the salinization close to the dunes and because previous nourishments led to seawater intrusion in the (newly constructed) foredunes. The interface was positioned in the foredunes with fresh groundwater salinities of 0.1 g TDS L−1 in the Solleveld dune area, and completely saline groundwater in the foredunes, beach, and Sand Engine (28 g TDS L−1). Model cells close to this interface and in the Solleveld dune area were excluded from evaluations.
In the adjacent dune area Solleveld a drinking-water company extracts groundwater, and in order to prevent any undesirable or unexpected effects of the construction of the Sand Engine to the groundwater quality (e.g. flow of saline groundwater towards pumping wells), 29 pumping wells were installed in 2012 on the first dune ridge (see red points in Fig. 2). These pumping wells keep the groundwater level at +0.8 to +1 m NAP with the aim to control the direction of the groundwater flow, and were included as such in the model simulations (Stuurman, 2010).
2.3 Model calibration
The groundwater model was calibrated with groundwater head measurements in monitoring wells 1 to 8 (Fig. 2), from 1 May 2014 until the end of the scenario simulations on 31 May 2016 (Aquavision et al., 2017). These monitoring wells all contain one well screen in Aquifer 1a (phreatic), and monitoring wells 2, 3, 7, and 8 contain a second well screen in Aquifer 2 (see cross section in Fig. 2). Simulated groundwater salinities were compared with chloride measurements, which were obtained from soil samples that were taken during the construction of the monitoring wells between 10 and 14 March 2014. For the conversion of the measured chloride concentrations to salinity (TDS), we have adopted the relation between chloride and TDS as found in the North Sea; 0.553 g Cl L−1 in 1 g TDS L−1 (Millero, 2003). In this study freshwater was classified as 0–1 g TDS L−1.
The calibration comprised of manual model parameter adjustments and comparisons of measured and simulated (transient) groundwater heads and groundwater salinities. For the evaluation of the fit to the measured groundwater heads, the subsequent calibration criteria were adopted: the error between the measured and simulated transient groundwater head should be smaller than the observed variation in groundwater level (average standard deviation is 0.1 m in the calibration period), where the variation in the simulated groundwater head should be similar to the observed fluctuation pattern. For the calibration of the groundwater salinities equivalent criteria were adopted: the depth of the fresh-to-salt groundwater interface and mixing zone thickness should be smaller than the observed mixing zone thickness (in our case approximately 2 m), where the error between the measured and simulated groundwater salinity should be small or explicable. The calibration concentrated on a selection of model parameters: hydraulic conductivity, storage coefficients, and dispersivity. These model parameters were adjusted with small incremental changes from an initial estimate, which was identical to a previous model calibration of the same area (Huizer et al., 2016). The dispersivity was adapted in accordance with the observed mixing zone thickness.
Ideally, we would have liked to split the data into a calibration and a validation dataset (split sample approach). However, the number of observation locations and the length of the time series made such an approach unachievable, and therefore all available information was used for the calibration. This meant that only the lack of fit of the model could be verified, not the predictive uncertainty. The calibrated set of model parameters is shown in Table 1.
Table 1Calibrated parameter values implemented in the model simulations.
2.4 Model convergence
To test whether the adopted spatial model discretization returned reliable quantifications of the volume of fresh groundwater in the study site, a grid convergence or refinement test was conducted. As described in Sect. 2.2, the reference model discretization consisted of a horizontal grid size of 20 m, and 28 layers with a variable thickness of 0.5 (upper layers) to 1 m (lower layers). This discretization was tested with three additional simulations with higher and lower spatial resolutions: one with an increased vertical resolution of 0.25 to 0.5 m over 56 layers (S1), one with a decreased vertical resolution of 1 to 2 m over 14 layers (S2), and one with a coarser horizontal grid size of 30 m (S3). All the model parameters, initial conditions, and boundary conditions of the simulations were equal to the calibrated model. The convergence in regard to the temporal model discretization was not tested, because stability constraints were used to calculate the length of transport time steps.
2.5 Model scenarios
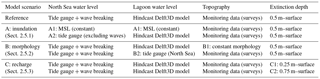
The importance of detailed information on (1) land-surface inundations (2) geomorphological changes, and (3) groundwater recharge for reliable reconstructions of the growth of the freshwater lens in the Sand Engine was evaluated with model simulations for the period of 1 June 2011 (completion Sand Engine) to 31 May 2016. Using the calibrated model as a representation of the actual growth in fresh groundwater resources, the importance of each factor was evaluated with model scenarios that consist of simplifications to this detailed reference model. The simplifications were based on assumptions that are often made in model simulations. The adopted methodology in the calibrated model and the model scenarios are summarized in Table 2, and described in detail in Sects. 2.5.1 to 2.5.3.
2.5.1 Land-surface inundations
For the simulation of the land-surface inundations we used the same method as in Huizer et al. (2017). In this paper the method is described briefly, and for a more extensive description and evaluation of this method we refer to Huizer et al. (2017). Tide gauge measurements with a 10 min time interval in the harbours of Scheveningen and Hoek van Holland were used to estimate the seawater level near the Sand Engine (i.e. still water level: SWL). The average seawater level of both measurement sites was used as an estimate of the local seawater level, and the tidal North Sea boundary was modelled as “General Head (head-dependent) Boundaries and Drains” (Mulligan et al., 2011). All model layers above −2 m NAP were defined convertible (saturated thickness) and rewettable with a wetting threshold of 0.05 m (McDonald et al., 1992). To ensure a reactivation of all inundated model cells, an additional seawater infiltration of 0.01 m per minute (equal to the vertical hydraulic conductivity) was added to the area of inundation during rising tides. In addition, to analyse the impact of tidal dynamics on fresh groundwater resources, a simulation (scenario A1) with a constant seawater level of 0.065 m NAP (MSL simulation period) was executed (Table 2).

Figure 3The images show three measurements of distinct morphologies of the Sand Engine domain in 2011, 2012, and 2014. The red circle represents the location where tides inside the lagoon are calculated with the Delft3D flow model in de Vries et al. (2015). The graphs show the simulated tides inside and outside the lagoon as obtained with the three successive morphologies.
Wave setup (i.e. local rise of the MSL) and wave runup (i.e. maximum level of wave up-rush on the beach) will result in an increase in the extent of land-surface inundations, and hence to an increase of seawater intrusion. To assess the impact of wave setup and wave runup on fresh groundwater resources both processes were included in the reference model, and excluded in model scenario A2 (Table 2). Wave setup was modelled with an identical approach as the observed seawater level fluctuations, and wave runup as an infiltration of seawater between the wave setup height and the wave runup height. The infiltration rate at the wave setup height was estimated as the drainable storage (determined by specific yield) between SWL and the wave setup height, and above the wave setup height this infiltration rate was reduced linearly to a value of 10 % at the wave runup height. The wave setup and wave runup height in every model period was estimated with the parameterization for setup on dissipative sites (Stockdon et al., 2006), which is dependent on the deep-water significant wave height, and the deep-water wave length. The deep-water significant wave height and deep-water wave length were estimated with offshore measurements at the measurement location called “Euro platform”, located 50 km southwest from the study site.
2.5.2 Geomorphology
The morphological evolution of the Sand Engine in the period 2011–2016 has led to significant decreases in the dimensions of the tidal channel (hereafter referred to as lagoon), which gradually choked the tidal system in the lagoon (de Vries et al., 2015). As a result the tidal amplitude decreased over time and the mean water level inside the lagoon increased (Fig. 3).
In an effort to produce a hindcast of tidal water levels inside the lagoon for the period of 3 August 2011 to 4 January 2016, the Delft3D flow model by de Vries et al. (2015) was extended (Fig. 4). Measurements of morphology and boundary conditions (wind and water levels) were included in the simulation. Details on the model setup, assumptions, and boundary conditions can be found in Appendix A. This hindcast of tidal water levels inside the lagoon was implemented in the reference model, where we assumed that the lagoon water level sustains over the whole channel. Before and after the hindcasted period we assumed that the water levels inside the lagoon were identical to the offshore seawater levels. Note that after 4 January 2016 the choking of the tidal system in the lagoon was (temporarily) lifted, because the continued erosion of the outer perimeter of the Sand Engine and the increasing hydraulic gradient between the lagoon and the North Sea led to breach of the sand barrier that separated the two systems.

Figure 4Simulated water level (in m NAP) inside the lagoon from 3 August 2011 to 4 January 2016, where the vertical red lines signify topographic surveys.
To determine the impact of the observed morphological changes and the increase of the mean water level inside the lagoon on fresh groundwater resources, two additional model scenarios (B1 and B2) were implemented (Table 2). In model scenario B1 all morphological changes between 2011 and 2016 were excluded and hence the topography remained constant (equal to the situation in August 2011). In model scenario B2 the choking of the tidal system in the lagoon was ignored and thus the water level in the lagoon remained equal to the North Sea throughout the simulation period (model scenario B2).
2.5.3 Groundwater recharge
Hourly measurements of the precipitation at a measurement station in Hoek van Holland – located 9 km south-southwest from the measurement site – were used as an estimate of the precipitation on the Sand Engine. Potential soil evaporation was calculated with the FAO Penman–Monteith method for hourly time steps, where the mean wind speed, air temperature, global radiation, and relative atmospheric humidity were also based on hourly measurements in Hoek van Holland (Allen et al., 1998). The FAO Penman–Monteith equation was adapted with estimations of the aerodynamic resistance and surface resistance for bare sand (Voortman et al., 2015). Similar to Voortman et al. (2015) the ratio between the incoming solar radiation and the clear sky solar radiation between sunset and sunrise was linearly interpolated between the 4 to 6 h average before sunset and after sunrise (Gubler et al., 2012).
The actual soil evaporation was estimated with the average moisture content between surface elevation and the extinction depth, where the evaporation was set equal to the potential evaporation for moisture contents equal and larger to field capacity. For moisture contents smaller than field capacity, the soil evaporation drops linearly to zero, parallel with the decrease in moisture. For coarse sand, field capacity was estimated as 0.042 cm3 cm−3 (Wösten et al., 2001).
The moisture content was calculated with a water budget method of precipitation and evaporation, where we assumed that percolation only occurs when the moisture content equals field capacity. At that point the groundwater recharge equals the (positive) difference between precipitation and evaporation. This method for the estimation of the actual evaporation and percolation to the groundwater is comparable to the approach used in Falkland and Woodroffe (2004) and Post and Houben (2017). Based on literature data the extinction depth was estimated as 0.5 m (Shah et al., 2007; Wösten et al., 2001). However, because of uncertainties in this estimation, we have also conducted model scenarios C1 and C2 with extinction depths of 0.25 and 0.75 m (±50 %; Table 2).
The effects of sea spray deposition were estimated with semi-empirical equations (Stuyfzand, 2014) with wind speed and wind direction measurements in Hoek van Holland. For the angle of the coastal high water line we used the angle of the shoreline of 228∘, as existed prior to the construction of the Sand Engine. Between June 2011 and May 2016 the resulting annual mean TDS concentration – caused by sea spray deposition – was respectively 0.11, 0.08, 0.06, and 0.04 g TDS L−1 at 100, 200, 500, and 1000 m from the local mean high water (MHW) height of +1.09 m NAP. These TDS concentrations were linearly interpolated based on the distance from the MHW height, with a maximum concentration of 0.11 g TDS L−1.
The calibrated groundwater model (i.e. reference case) contained all elements of the previously described model scenarios that were deemed important for the growth of the fresh groundwater resources: estimates of wave setup and wave runup (Sect. 2.5.1), hindcast of tidal water levels inside the lagoon (Sect. 2.5.2), and a groundwater recharge that was based on an extinction depth of 0.5 m below surface (Sect. 2.5.3). The simulated (transient) groundwater head and groundwater salinity of this model were compared with measurements at the study site. In addition, the reliability of the adopted spatial discretization was tested with a grid convergence test, consisting of simulations with lower and higher spatial resolutions. In the subsequent model scenarios, the effects of coastal forcing, geomorphology, and groundwater recharge on the growth of fresh groundwater resources were examined with respect to this calibrated model.
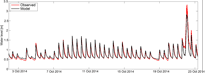
Figure 5Observed and simulated water levels in the lagoon from 2–23 October 2014, which contains a fortnightly spring–neap tidal cycle and a storm surge around 22 October.
3.1 Model evaluation
Figures 6 and 7 show that the simulated groundwater head closely resemble the observed fluctuation pattern at the eight monitoring wells (MWs) on the Sand Engine. This demonstrates that the calibrated model can reproduce the observations with plausible model parameters (Table 1) and indicates that the groundwater dynamics are described satisfactorily. The similarity between the observed and simulated groundwater head is strongest near the shoreline (MW 1, 2, 5, 7) and in the centre of the Sand Engine (MW 8), with RMS errors varying between 0.08 and 0.15 m. Closer to the dunes (MW 4 and 6) the RMS error increases slightly due to temporary underestimations in the simulated groundwater head. The only exception to this overall pattern is MW 3, which has a larger RMS error in comparison with the other MWs. However, the simulated fluctuation of the groundwater head in MW 3 is similar to the measurements, and the larger RMS error is primarily a result of a systemic underestimation. This underestimation of the groundwater head at MW 3 is probably caused by mismatches in the local geology (e.g. finer sand, or variations in the position, thickness or conductivity of aquitards) that reduces the decline in groundwater head. This possibility is corroborated by the contrast in the observed and simulated groundwater head in the bottom aquifer at MW 2 and 3 (Fig. 7). The measurements indicate that the attenuation of the tidal signal is stronger at MW 2 and weaker at MW 3, while MW 2 is situated closer to the shoreline than MW 3. Thus, this suggests a stronger variability in the thickness, hydraulic conductivity, or spatial distribution of aquitard(s) near these MWs.
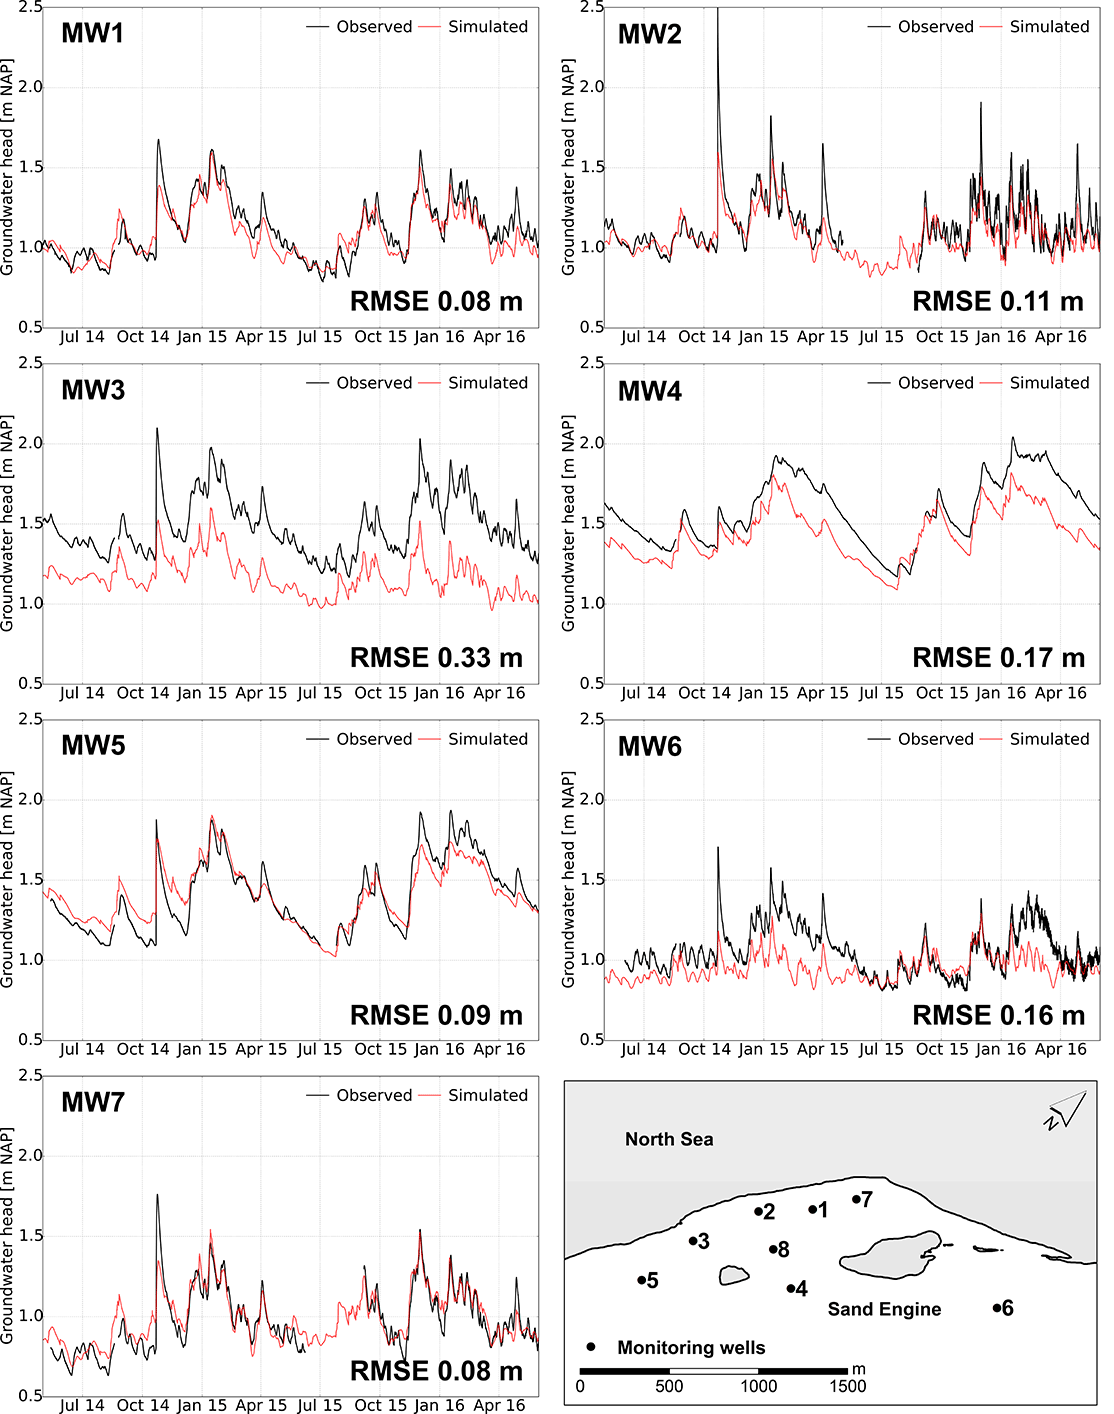
Figure 6Observed and simulated groundwater level in MW 1–7 (phreatic aquifer 1: see Fig. 2), from May 2014 to June 2016.
Figure 7Observed and simulated groundwater head in MW 2, 3, 7, and 8 (in aquifer 2: see Fig. 2), from May 2014 to June 2016.
One of the likely causes of the temporary underestimations of the groundwater head in MW 4, 6, and 8 – and to a lesser extent MW 3 – is (temporary) deviations of the groundwater head at the inland model boundary, as for example between February and July 2015 and February and June 2016. In these periods the deviation is largest for MW 4, 6 and 8. The mismatches on the inland model boundary are most likely caused by overestimations of groundwater extractions in the dunes (i.e. changes in extraction rate throughout the year) or underestimations in the groundwater recharge rates in the dunes.
Another notable deviation in the observed and simulated groundwater head is the rapid rise of the groundwater level in MW 1, 2, 3, 5, 6, and 7, during a storm surge on 22 October 2014 (see also Fig. 5). The rise of the groundwater level is smaller in the model simulations – especially in the monitoring wells that lie closest to the shoreline – and this is probably caused by an underestimation of the wave runup height or seawater infiltration during this storm surge.
The depth profiles of the groundwater salinity (Fig. 8) confirm the presence of a fresh groundwater lens on top of an otherwise saline aquifer. Only in MW 4 the measurements show a decrease in the groundwater salinity at depth, but it is uncertain whether this is the result of a single measurement error or an actual deviation from the overall observed pattern. In addition, Figure 8 shows that the reference simulation closely resembles the observed groundwater salinity in most monitoring wells. However, the deviations suggest that the average North Sea salinity may be higher (MW 1, 2, 3, and 7), and indicate that the thickness of the fresh groundwater lens is slightly overestimated in the reference case. The cause of this slight overestimation will likely either lie in an overestimation of the volume of groundwater recharge or an underestimation of the salinization of fresh groundwater by coastal flooding (in particular during storm surges). The only exception is MW 6, where the depth of the fresh–salt groundwater interface is underestimated, and the likely cause for this deviation is a mismatch in the initial groundwater salinity near the dunes (e.g. overestimation of the salinization by nourishments).
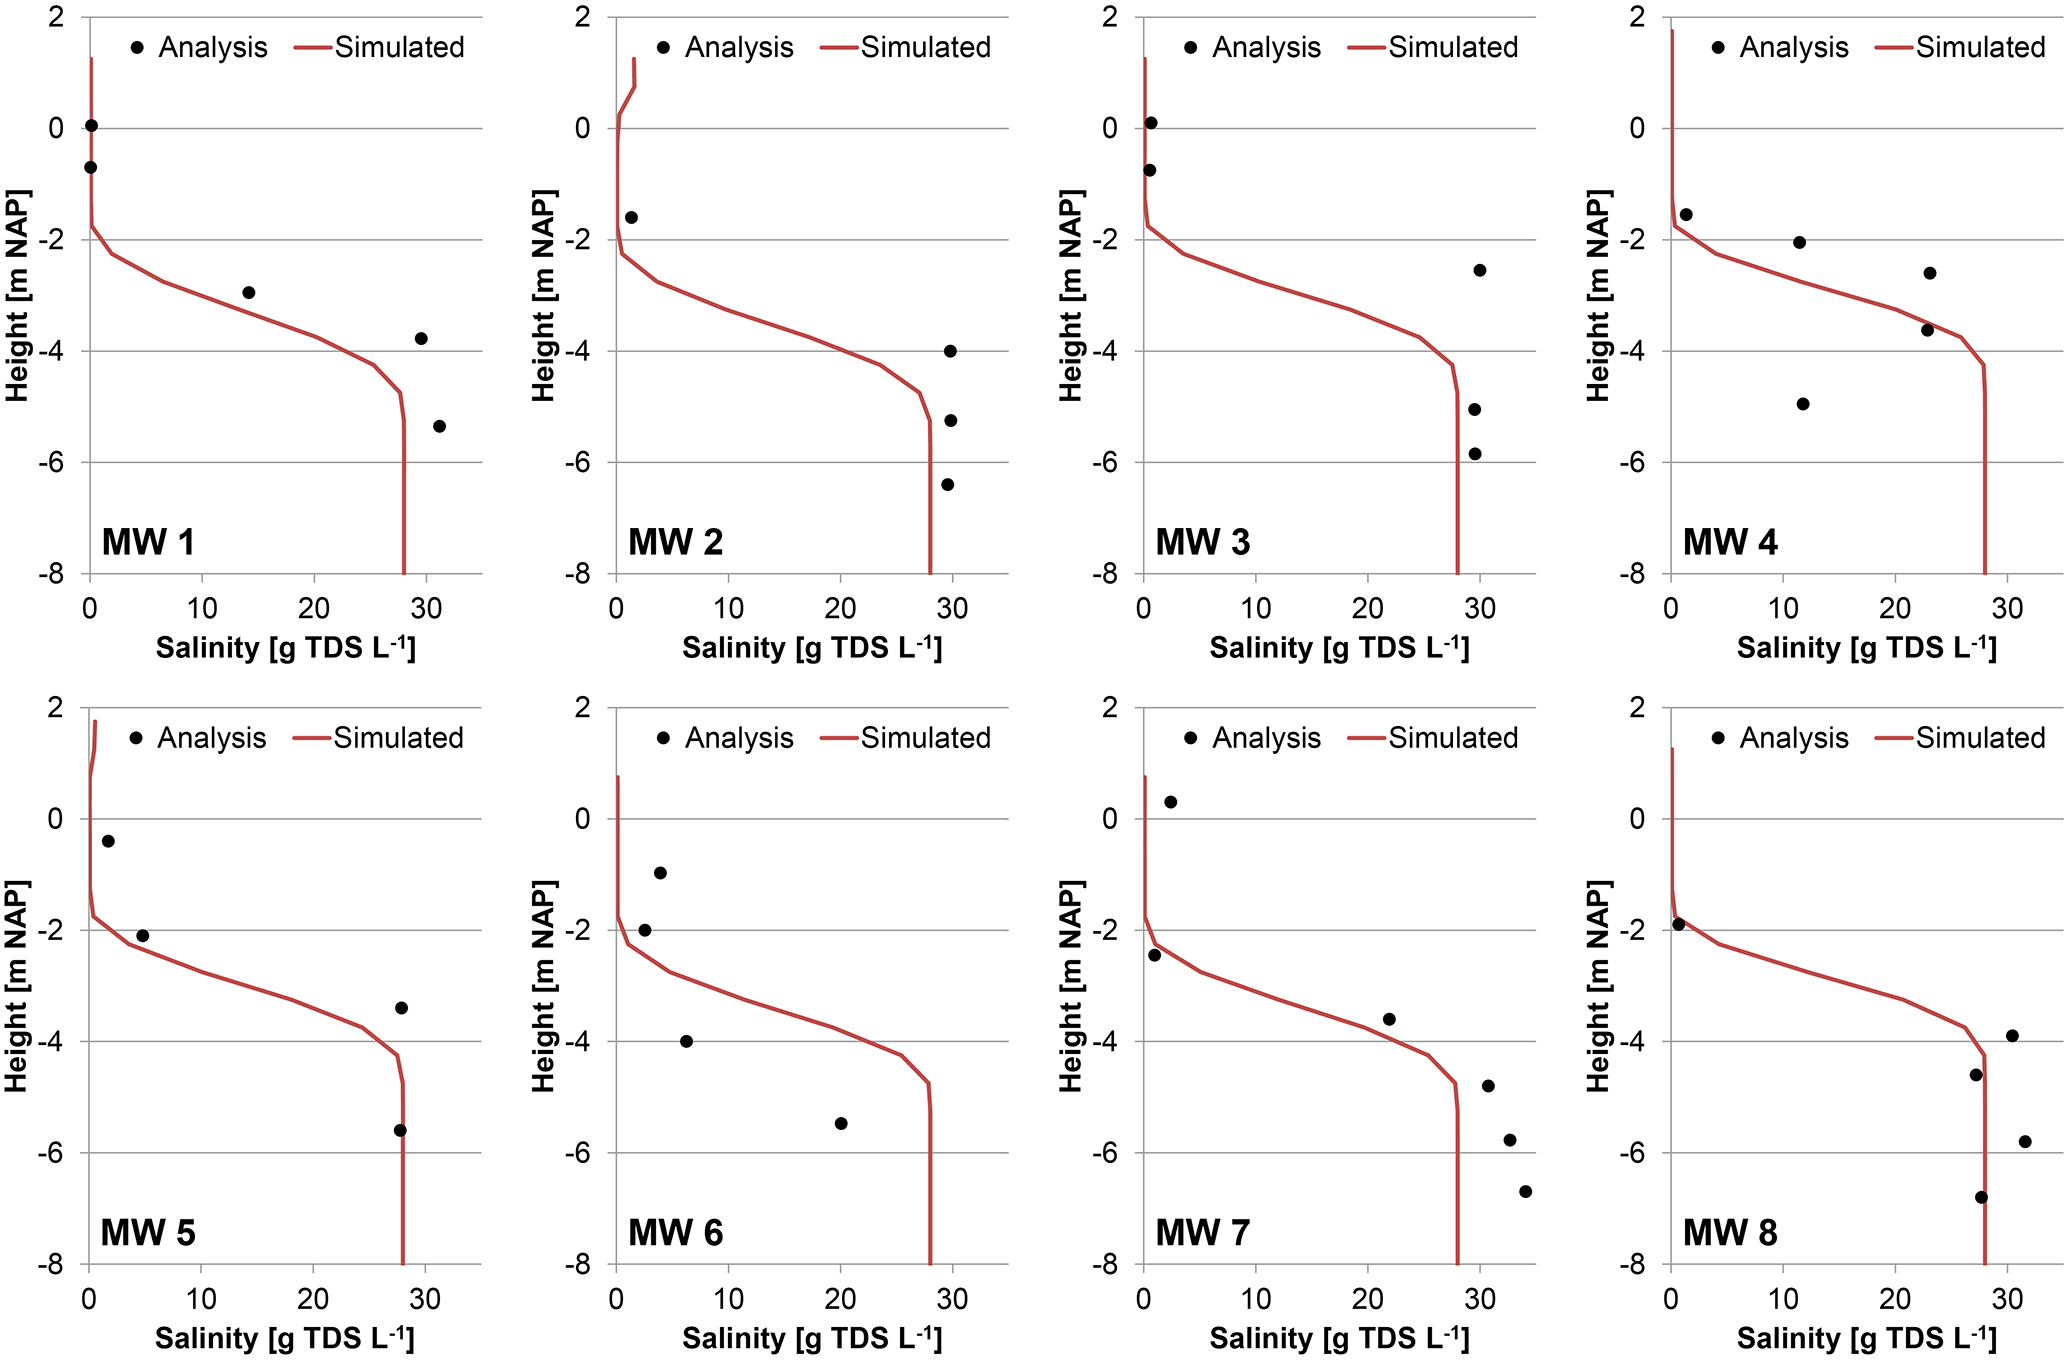
Figure 8Depth profiles with the observed (black points) and simulated (red line) groundwater salinity in MW 1–8, obtained between 10 and 14 March 2014.
3.2 Grid convergence
Simulations with finer and coarser grid resolutions (S1, S2, and S3) show increases of the volume of fresh groundwater similar to the reference model (Fig. 9). Coarser spatial resolution (S2 and S3) resulted in lower volumes of fresh groundwater, and a finer vertical spatial resolution (S1) resulted in a nearly identical growth of the fresh groundwater volume. However, at the end of the simulation period (May 2016) the overall deviation in the simulated change in fresh groundwater is small (1.1–1.16 million m3). This convergence is probably mainly caused by aquitard 1 (Fig. 2), which hampers the growth of fresh groundwater resources in a large section of the study area. Thus, the additional simulations show that subsequent increases of the spatial resolution would lead to similar growth curves, which suggests that the model grid was sufficiently refined.

Figure 9Change in the volume of fresh groundwater from June 2011 to May 2016 for the calibrated model (reference case) and model convergence simulations S1, S2, and S3.
3.3 Scenario A: land-surface inundations
One of the processes that can inhibit the growth of fresh groundwater resources in large beach nourishments is coastal forcing, which is the driving force of land-surface inundations. Tides will lead to frequent land-surface inundations near the shoreline (i.e. intertidal area), and storm surges to occasional and more extensive inundations (intertidal to supratidal area). In both cases the inundations will lead to a periodic infiltration of seawater in the intertidal and supratidal area, where the extent and duration of the inundations will depend on the intensity of wind and wave forces, and local morphology.
The model simulations confirm that coastal forcing limits the growth of fresh groundwater resources in the Sand Engine, as illustrated in the divergence in growth of the fresh groundwater volume in the reference model and model scenario A1 (approximately 1 700 000 m3: Fig. 10). This contrast in growth over the simulated period is primarily caused by the periodic salinization of fresh groundwater in the intertidal and supratidal area, where simultaneously geomorphological changes between 2011 and 2016 led to substantial increases in the intertidal and supratidal area (Fig. 11).

Figure 10Simulated increase in the volume of fresh groundwater in the model domain from June 2011 to May 2016, for the reference model (incl. wave setup and wave runup), model scenario A1 (constant MSL), and model scenario A2 (SWL).
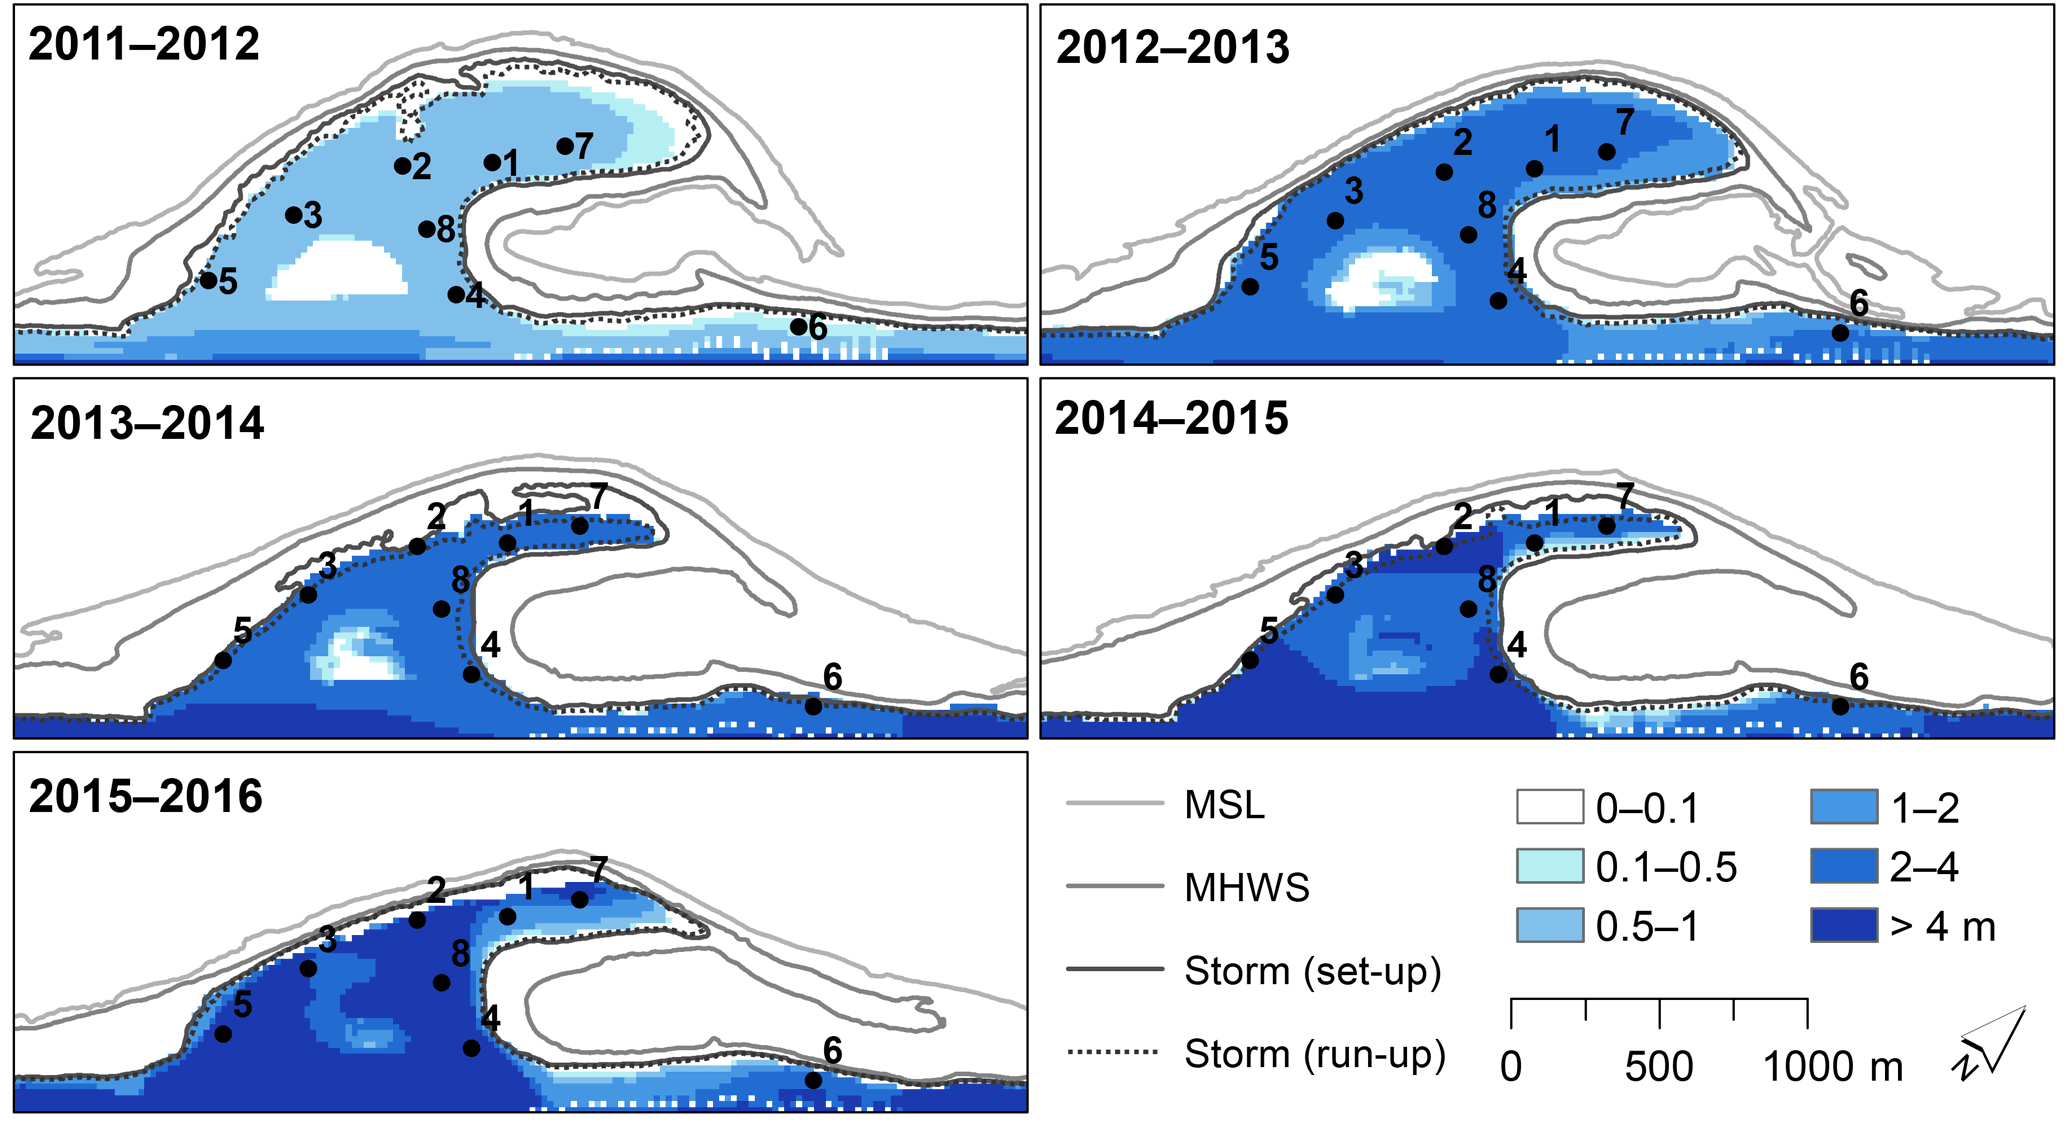
Figure 11Thickness of fresh groundwater lens (in metres) 1, 2, 3, 4, and 5 years after the construction of the Sand Engine, with contour lines of the MSL, MHWS, and (estimated) maximum wave setup and wave runup height of every yearly period.
The in- and exclusion of wave setup and wave runup in respectively the reference model and model scenario A2 has a similar – but smaller – effect on the growth of the fresh groundwater volume (Fig. 10). The neglect of wave setup and wave runup leads to an underestimation of the extent of land-surface inundations and the infiltrated volume of seawater, especially during storm surges (Fig. 11). In addition, it is important to note that the model calibration suggests the wave runup height or seawater infiltration rate during storm surges was underestimated (Sect. 3.1).
Another important variable that reflects the divergence in the model scenarios is the groundwater table. The omission of tides and storm surges leads to an underestimation of seawater intrusion, and therefore an underestimation in the groundwater levels. In model scenario A1 the groundwater level on 1 June 2016 is 0.4–0.6 m lower than the reference case – and observed groundwater levels. In turn, this leads to a reduction of submarine fresh groundwater discharge and a larger inflow of fresh groundwater from the adjacent dune area, which also contributes to the overestimation of the growth of fresh groundwater resources in the study area.
3.4 Scenario B: geomorphology
Besides hydrodynamics, coastal forcing also drives morphodynamics. Geomorphological changes in the study area from June 2011 until May 2016 consisted of a substantial retreat of the shoreline along the outer perimeter of the Sand Engine (Fig. 1) and a gradual decline in surface elevations (Luijendijk et al., 2017; de Schipper et al., 2016). These morphological changes led to a direct loss of fresh groundwater due to coastal erosion, and to more substantial indirect losses because of a shift and in some situations extension of the intertidal and supratidal area (Fig. 11). The simulation with a constant surface elevation and bathymetry (B1) shows that the absence of morphodynamics would have led to substantially higher fresh groundwater volumes (approximately 600 000 m3 in June 2016) in the study area (Fig. 12).
Another result of the morphological changes was the development of a lagoon, which led to a gradual decrease of the tidal amplitude and increase of the mean water level in the lagoon from 2011 to 2016, as described in Sect. 2.5.2. The model simulations (reference case) show that this led to a small decrease in the growth of the fresh groundwater volume (70 000 m3 on 1 June 2016) in comparison with model scenario B2 where the water level in the lagoon remained equal to the offshore sea level (Fig. 12).
The effect of the morphological evolution of the lagoon on the overall growth in the volume of fresh groundwater is relatively small in comparison with model scenario A2 (Sect. 3.3), and C1 and C2 (Sect. 3.5), because the inundation extent during storm surges (e.g. high seawater levels) is similar in both situations. The smaller growth of the fresh groundwater lens is primarily caused by a rise of the local groundwater level (around the lagoon), which led to a reduced inflow of fresh groundwater from the adjacent dune area and an increase in (lateral) seawater intrusion.
3.5 Scenario C: groundwater recharge
On average, the yearly precipitation from June 2011 until May 2016 was 938 mm, of which 421 mm fell in March–August (spring–summer) and 517 mm in September–February (autumn–winter). The average yearly potential soil evaporation was 990 mm, of which 695 mm evaporated in March–August and 295 mm in September–February. Thus, the net surplus based on the potential soil evaporation was −52 mm per year. However, moisture levels in the upper part of the unsaturated zone on the Sand Engine were often (especially in spring and summer) too low to attain this potential evaporation rate. The actual evaporation rate was therefore important for the net groundwater recharge in the study area.
Based on the available soil moisture between the surface and the extinction depth (see Sect. 2.5.3), the actual evaporation rate was determined. The resulting groundwater recharge for the respective extinction depths of 0.25, 0.5, and 0.75 m, as shown in Fig. 13, varied between respectively 595 mm (+78 mm relative to the reference case), 516 mm, and 470 (−46 mm relative to the reference case) mm per year. Most of the groundwater recharge (30 to 34 %) occurred in autumn and winter seasons, and least (9–12 %) in spring. Therefore, as to be expected, larger extinction depths led to more evaporation and less groundwater recharge, in particular in the spring and summer seasons.
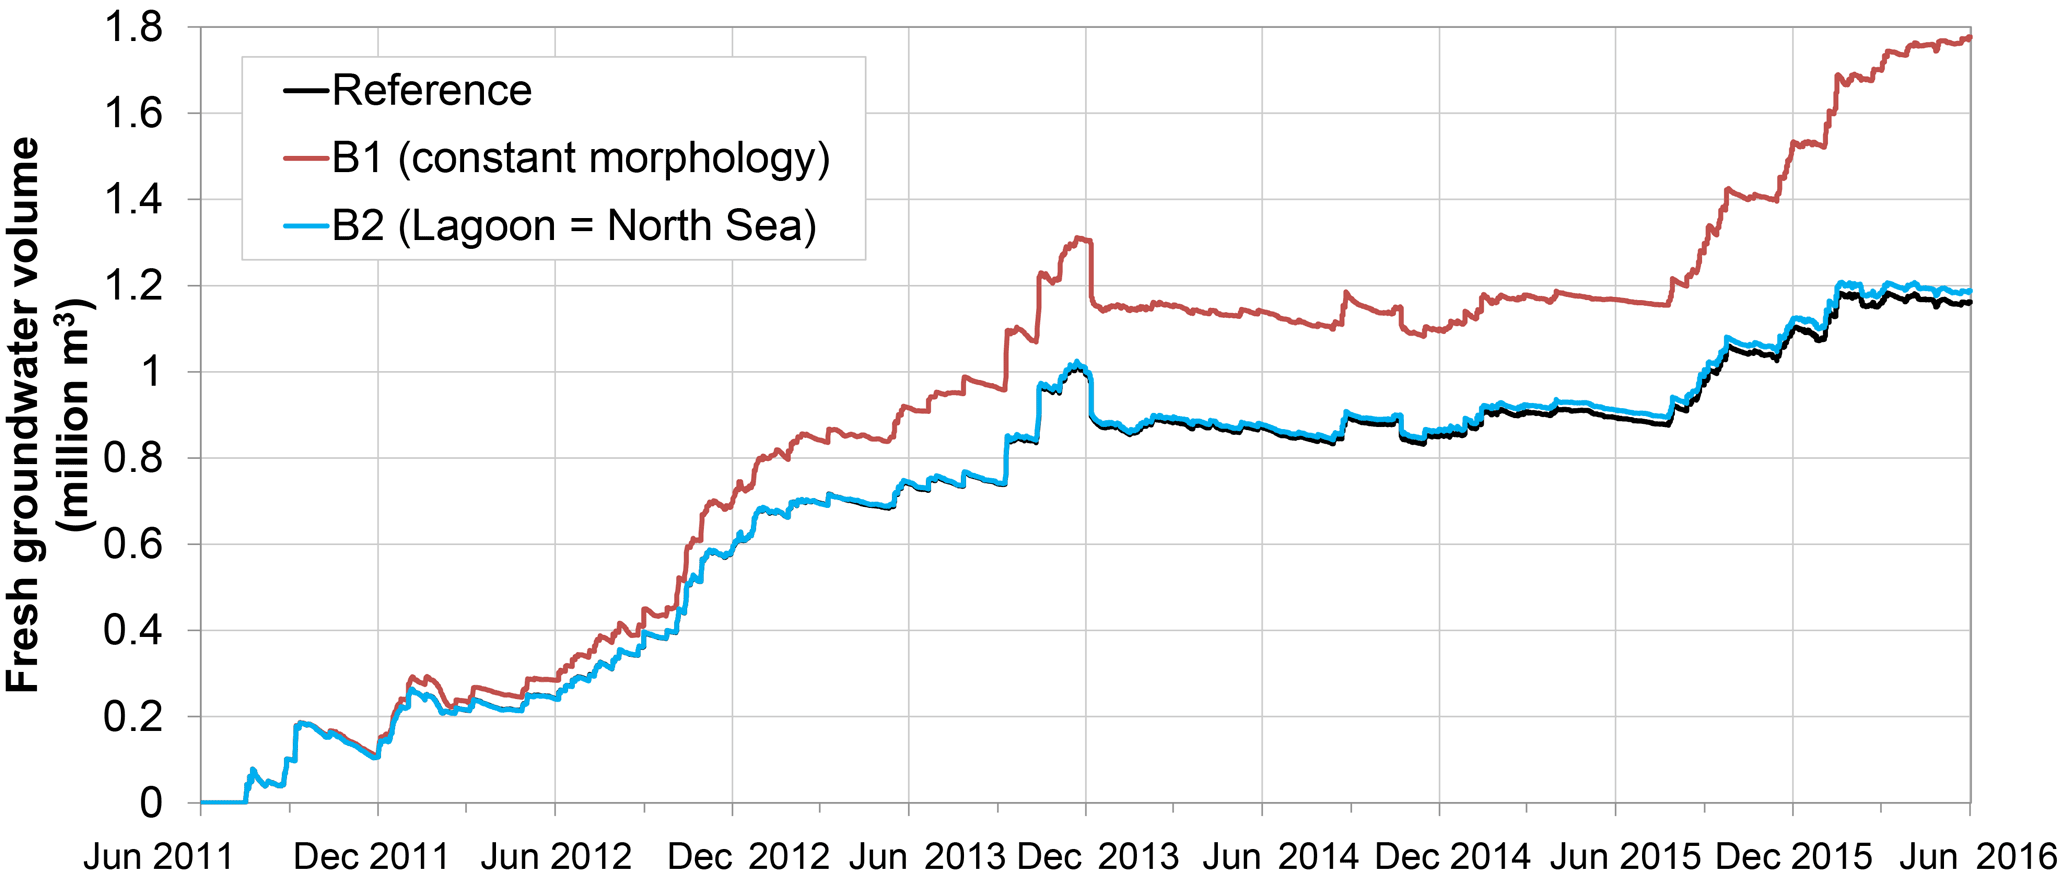
Figure 12Increase in the volume of fresh groundwater from June 2011 to May 2016, for the reference case (with hindcast of the lagoon water level), model scenario B1 (constant morphology), and model scenario B2 (lagoon water level equal to North Sea).
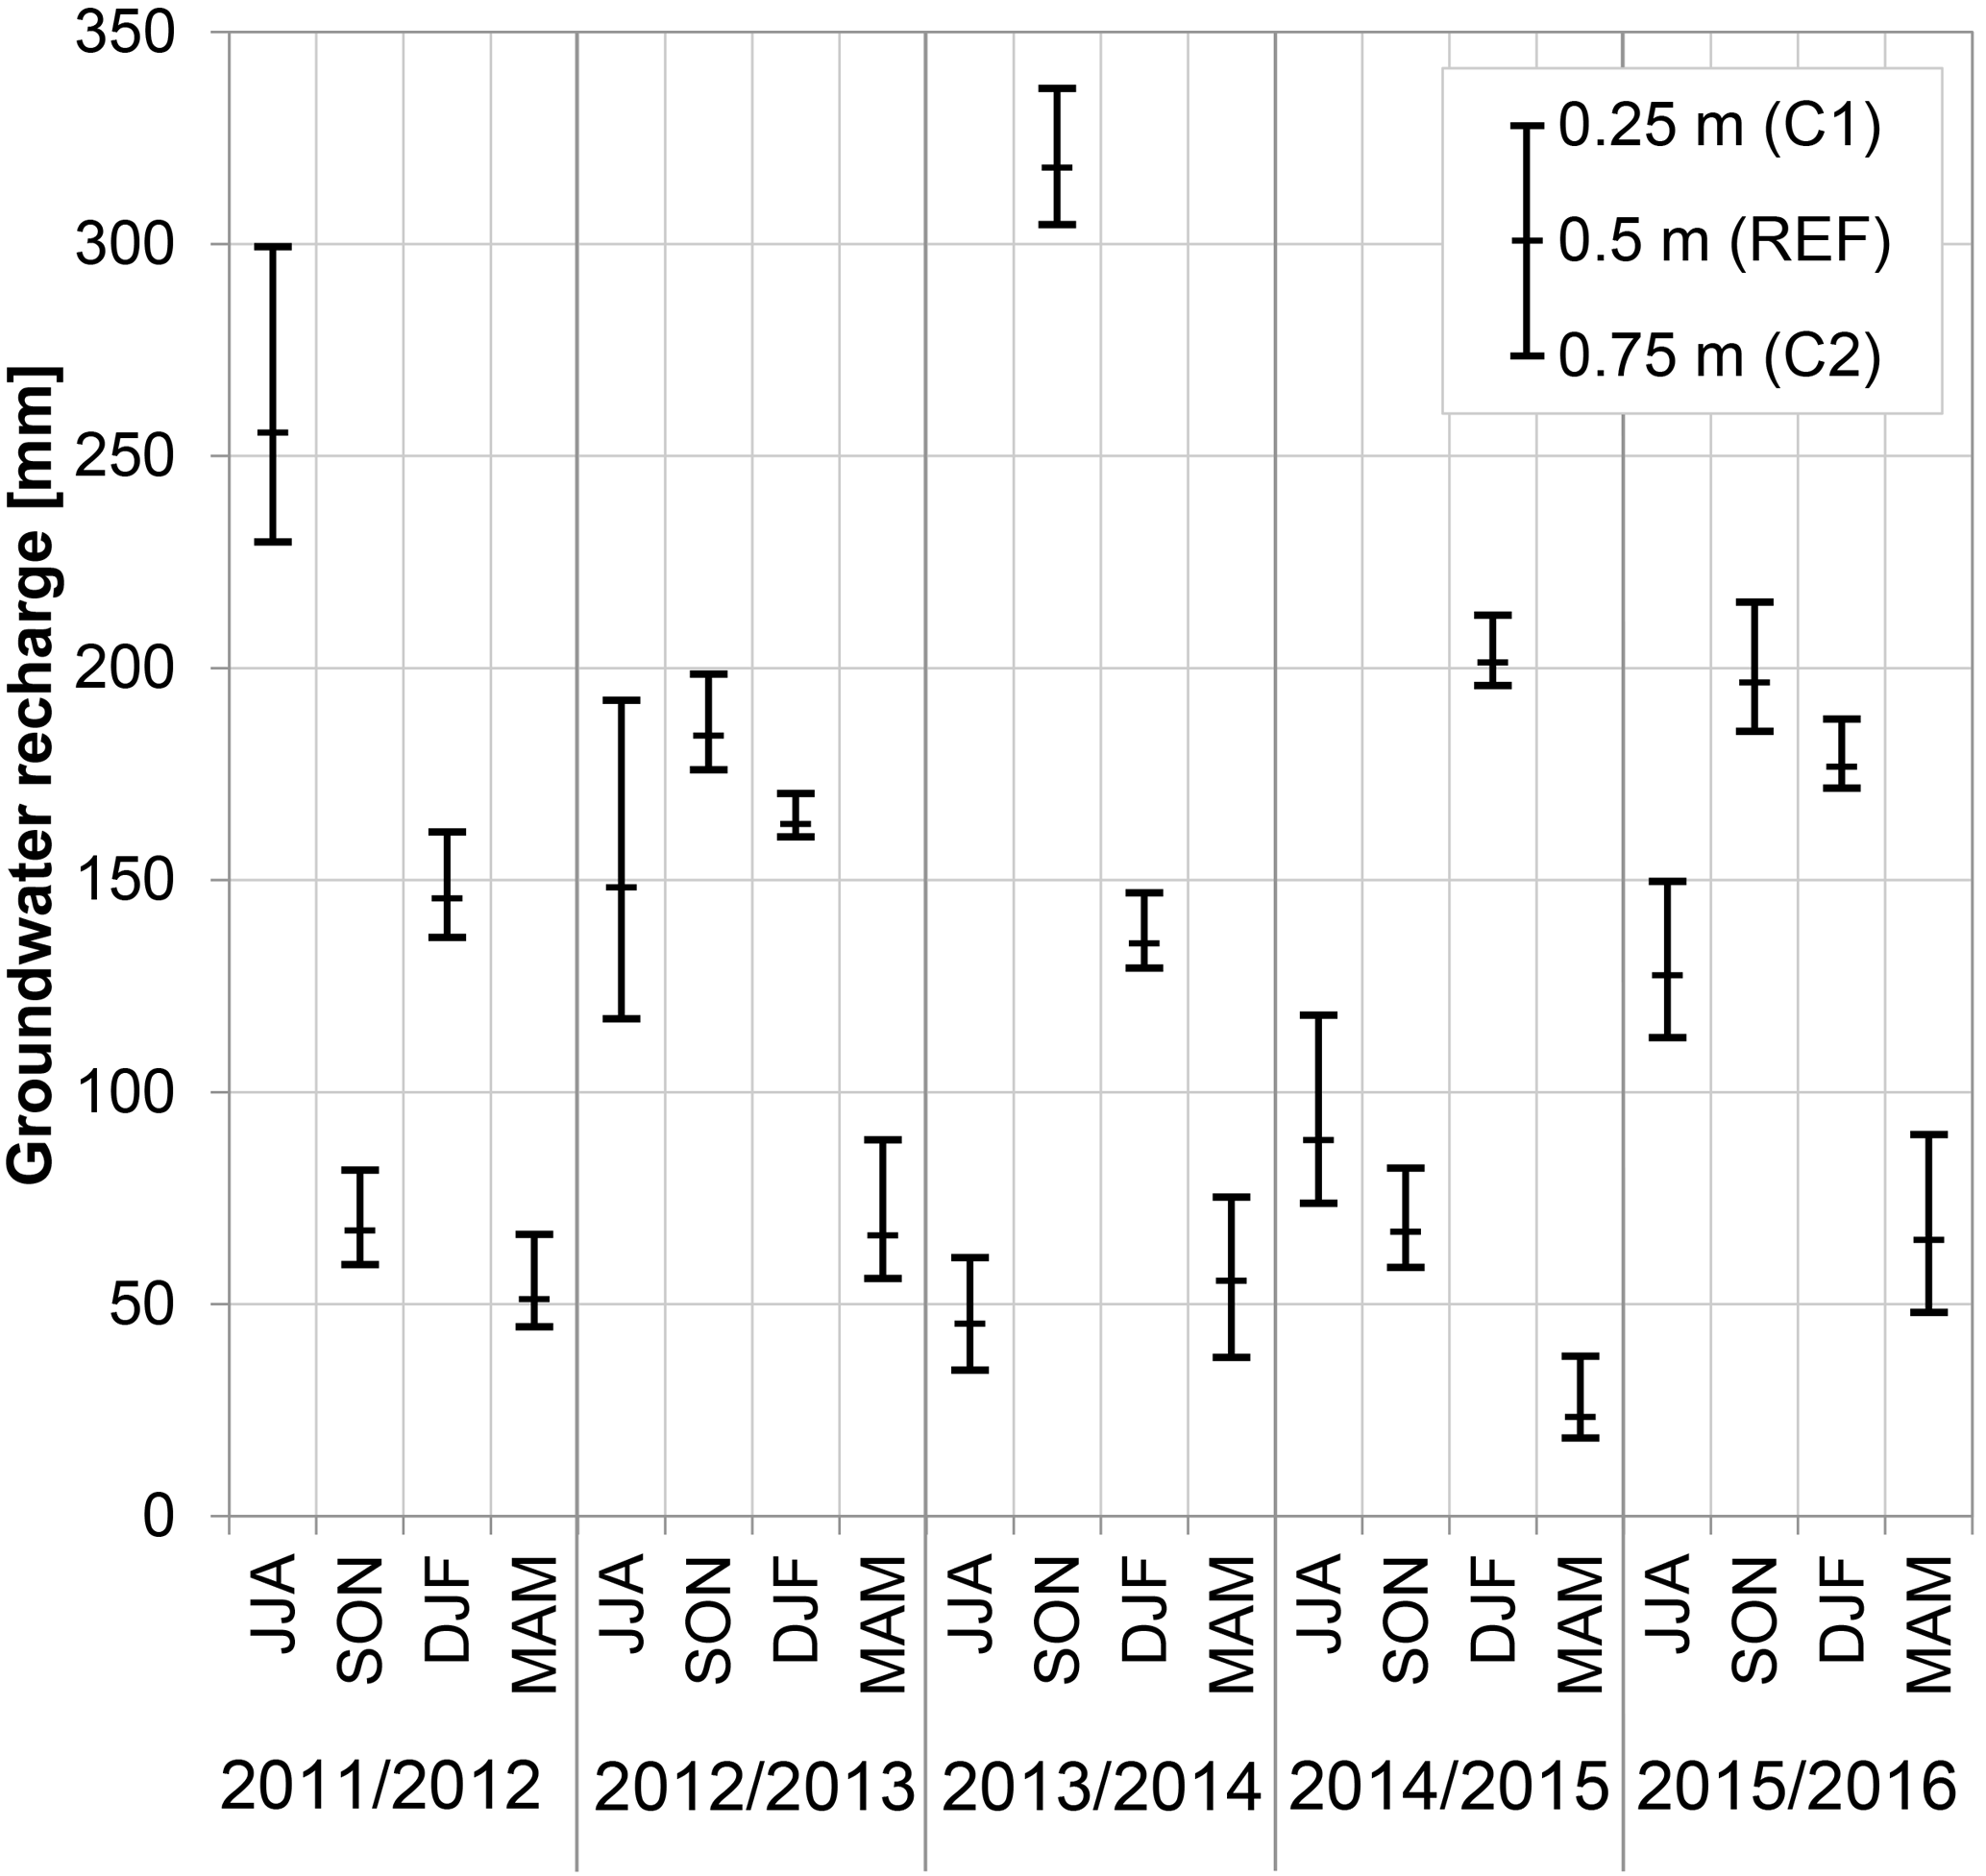
Figure 13Simulated groundwater recharge per season (JJA: summer; SON: autumn; DJF: winter; MAM: spring) from June 2011 until May 2016, for the reference model (extinction depth 0.5 m), model scenario C1 (extinction depth 0.25 m: less evaporation), and model scenario C2 (extinction depth 0.75 m: more evaporation).
The simulated change in the fresh groundwater volume (Fig. 14) shows that groundwater recharge is one of the primary driving mechanisms, with increases in periods with relatively high percolation rates and a stabilization or decrease in periods with relatively low percolation rates. Parallel to groundwater recharge, most of the overall growth in the fresh groundwater lens occurs in the autumn and winter seasons. In periods with low recharge rates, the loss of fresh groundwater – primarily due to submarine groundwater discharge and coastal erosion – leads to a stabilization or decrease in the overall fresh groundwater volume in the study area. One notable example is the change in the fresh groundwater volume over the period March 2014 to November 2015, which coincides with a substantially lower than average groundwater recharge (Fig. 13).
The measurements and model simulations showed a substantial growth of fresh groundwater resources in the Sand Engine between 2011 and 2016, and demonstrated the importance of both coastal forcing and groundwater recharge for an accurate reproduction of the growth of the freshwater lens. Periods with high rainfall (mainly in autumn and winter) led to sharp increases in the fresh groundwater volume, while periods with little or no rainfall (mainly in spring and summer) led to a net loss of fresh groundwater. Coastal forcing led to land-surface inundations and considerable geomorphological changes in the study area, where inundation events resulted in the salinization of the intertidal and supratidal areas and morphodynamics led to a shift or in some instances extension of these areas. Storm surges in particular were important for the determination of the growth of the freshwater lens, because these were the primary drivers of coastal erosion and led to the most extensive land-surface inundations.
Comparisons of the calibrated reference model with simulations that excluded coastal hydro- and morphodynamics (model scenarios A1 and B1) showed that the incorporation of these processes was essential for a good calibration result and a reliable estimate of the intertidal and supratidal area, and thus essential for the estimation of the growth of the fresh groundwater resources. Besides the impact of land-surface inundations on the freshwater lens, tidal dynamics also played an important role in the height and variability of the groundwater head. For example, the exclusion of these tidal dynamics in model scenario A1 led to an underestimation of the groundwater heads between 0.4 and 0.6 m at MW 1 to 8. In addition, where model scenario A1 indicates a continued growth in fresh groundwater resources between June 2011 and May 2016, the model scenarios with tidal dynamics (reference and model scenario A2) only indicate a clear (net) growth in fresh groundwater resources between June 2011 and December 2013, and a slight (net) growth or stabilization in the period thereafter.
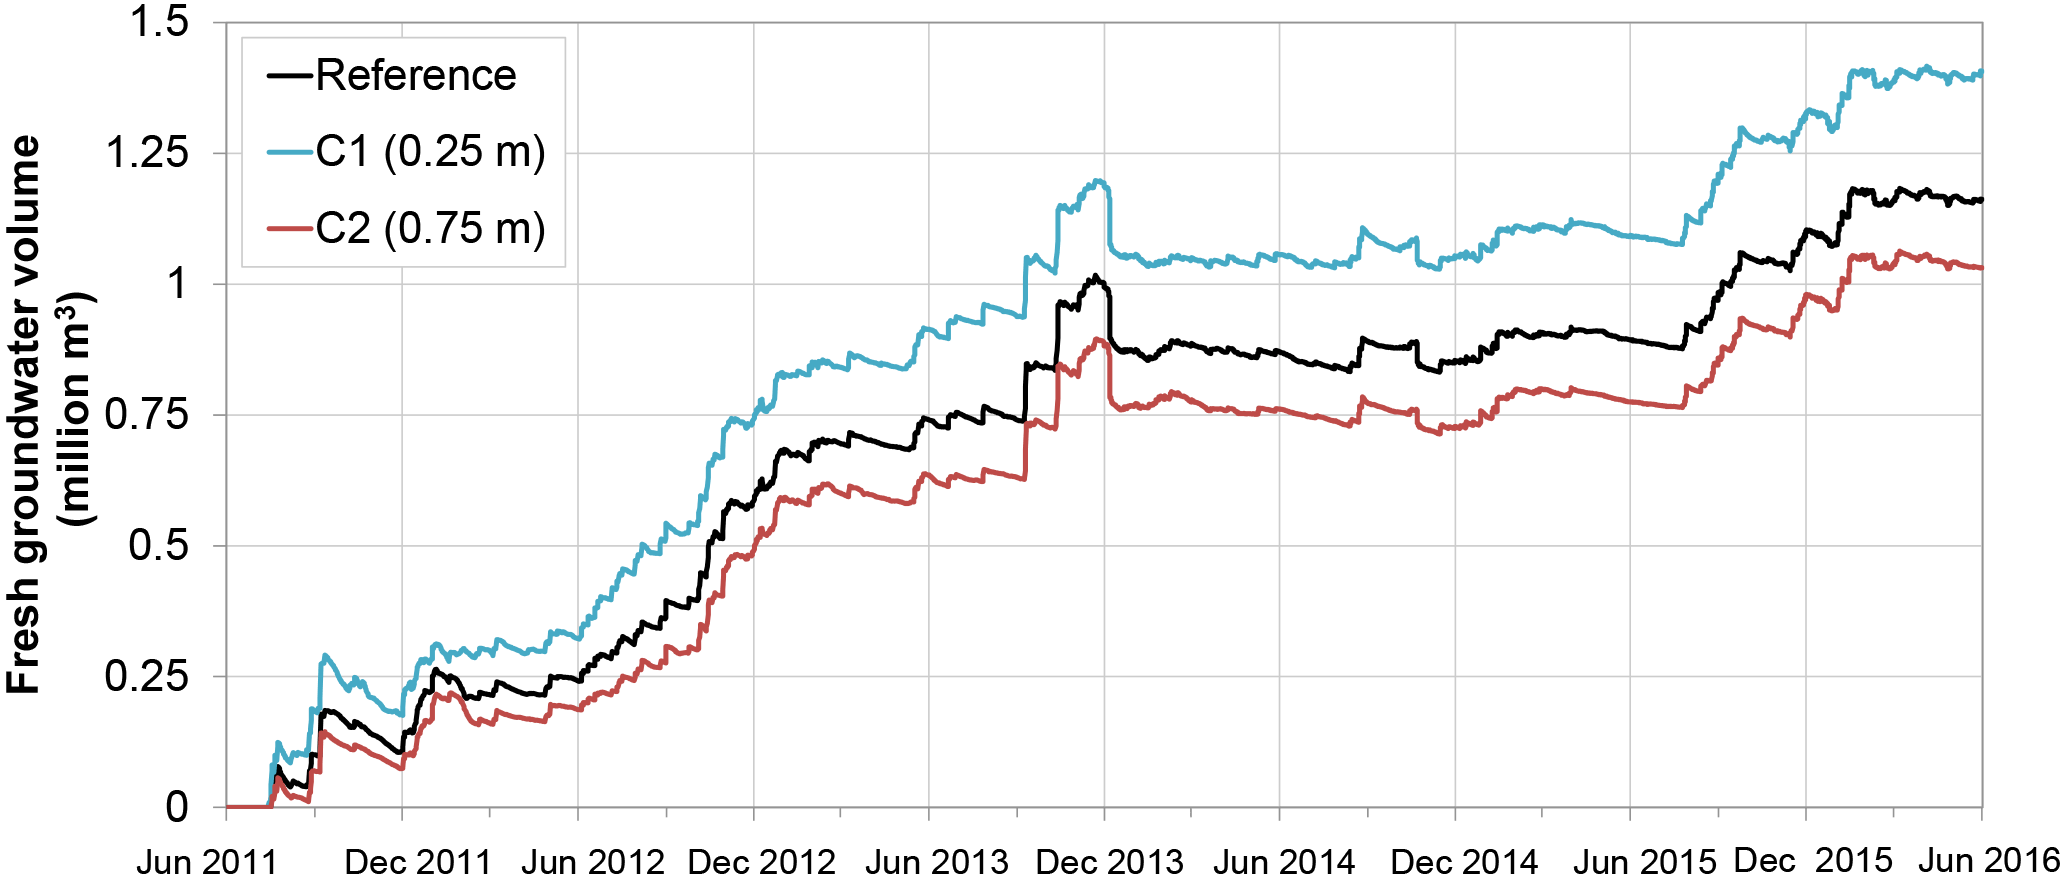
Figure 14Increase in the fresh groundwater volume from June 2011 until May 2016, with the calibrated model with an extinction depth of 0.5 m (Sect. 2.5.3), a 50 % decreased extinction depth of 0.25 m (C1), and a 50 % increased extinction depth of 0.75 m (C2).
For most MWs the simulated transient groundwater head and groundwater salinity corresponded well with measurements. This demonstrates that the hydro- and morphodynamic conditions of the study area could be reproduced with the adopted methodology. Most of the discrepancies between measurements and simulations could be explained by unmapped geological heterogeneity (near MW 3), and mismatches in the initial groundwater salinity distribution (near the coastal dunes). It is important to note that the simulated groundwater salinity could only be compared with groundwater salinity measurements that were conducted in March 2014. Therefore, it is uncertain to what extent the simulated change in groundwater salinity corresponds with the salinity distributions of the period thereafter.
While the close similarity between the measured and simulated groundwater head time series under realistic hydrogeological parameter settings indicates that the tidal dynamics and extent of land-surface inundations are well represented in the model, the modelled wave setup height and wave runup height (and related infiltration of seawater) probably differed strongly with reality at times. Small variations in surface elevation, bathymetry, wave height, and wave period could have led to substantial variations in wave setup and wave runup. Underestimations of the increase of the groundwater level during some of the storm surges (see Fig. 6) also indicate an underestimation of wave setup height, wave runup height, or the infiltration of seawater. However, these differences could also be caused by deviations in the modelled and actual morphology at the study site. Despite the frequent topographical measurements, interim morphological changes were not observed. This especially affects periods with rapid and extensive morphological changes, e.g. periods with frequent or intensive storm surges. However, based on the calibration results and comparisons with on-site observations we believe that the adopted approach attained realistic but rough estimates of the effects of wave setup and wave runup on the coastal aquifer.
Being the main source of fresh groundwater, groundwater recharge is another important control on the development of the fresh groundwater resources of the Sand Engine. Vegetation was virtually absent on the Sand Engine, with the exception of a few pockets of dune grass in the last years of the simulated period, and therefore the processes that determine the groundwater recharge rates could be limited to precipitation and soil evaporation. Because the depth to the groundwater table was relatively large (generally larger than 1.5 m below surface) in relation to the expected extinction depth, capillary rise will be limited or non-existent and was therefore neglected. Given these simplifications and the aims of this paper, we opted to estimate recharge rates with the described water budget method and analyse the uncertainty with the alterations to the extinction depth.
For future studies on the (potential) growth of fresh groundwater resources in coastal areas, it is recommended to monitor wave setup, wave runup, and seawater infiltration and evaluate the accuracy of the adopted approach in this research under various conditions. However, this will require frequent topographic measurements to monitor morphological changes in the coastal area, as for example the periodic topographic surveys (every 1–3 months) that were executed on the Sand Engine. In addition, simulations with unsaturated groundwater flow could provide more detailed estimates of the growth in fresh groundwater resources in these areas, because of a potential improvement in the simulation of groundwater recharge and seawater infiltration.
Between 2011 and 2016 the growth of the freshwater lens in a mega-scale beach nourishment (the Sand Engine) was primarily determined by the groundwater recharge, (maximum) land-surface inundations due to storm surges, groundwater in- and outflow, and to a lesser extent by geomorphological changes.
Groundwater recharge was the primary contributor to the growth of fresh groundwater in the large concentrated beach nourishment. An accurate estimation of the actual soil evaporation – besides meteorological measurements – will likely be important for the determination of the net input of fresh water in any coastal area.
Storm surges produced the most extensive land-surface inundations, and the coinciding infiltration of seawater resulted in a salinization of most of the fresh groundwater volume within this inundation area. The model simulations showed that (accurate) estimates of the maximum wave setup and wave runup height are important to delineate the area that is vulnerable to seawater intrusion and reconstruct the growth of fresh groundwater resources.
The groundwater level, or better, the hydraulic gradients within the study area, determined the inflow of fresh groundwater from adjacent dunes and outflow of (fresh) groundwater via submarine groundwater discharge. Model simulations that underestimate the height of the groundwater level, e.g. by the neglect of tidal dynamics, can therefore lead to considerable overestimation of the fresh groundwater volume.
Finally, the geomorphological changes led to a gradual decline of the area that was not affected by seawater intrusion. Together with the increase of the mean water level inside the lagoon, this led to a small restriction of the potential growth in fresh groundwater resources.
In conclusion, the incorporation of hydro- and morphodynamics and accurate estimation of groundwater recharge rate are essential for a reliable estimate of the growth of fresh groundwater resources in dynamic coastal environments.
This work was carried out within the NatureCoast (Nature-driven nourishment of coastal systems) programme. Most of the raw data (e.g. morphological measurements, groundwater levels) collected in this programme are available at the 4TU.Centre for Research (Aquavision et al., 2017 https://doi.org/10.4121/uuid:6c828566-33be-4e5d-900a-4817898c9ddb). Other data sets (i.e. other than raw data) that were used to produce the results of this paper may be obtained by contacting the corresponding author.
The depth-averaged numerical model was constructed with the modelling package Delft3D (Lesser et al., 2004), which numerically integrates the shallow water equations. Prescribed water levels along the offshore boundary were obtained from permanent tidal stations south (Hoek van Holland) and north (Scheveningen) of the Sand Engine. Lateral boundaries were forced with Neumann conditions, which represent the alongshore water level gradient. Bottom friction is specified with a spatially uniform Chezy coefficient of 65 m1∕2 s−1. A constant eddy viscosity of 0.01 m2 s−1 was applied. The influence of wind was taken into account as a wind shear stress at the free surface.
The model bathymetry and associated nourishment geometry was constructed from a set of 34 bathymetric field surveys at the Sand Engine and the adjacent coastal cell. These surveys were conducted using a jetski-mounted single-beam echo sounder for the submerged part of the domain and a real-time kinematic differential GPS mounted on an all-terrain vehicle for the dry beach (de Schipper et al., 2016).
The authors declare that they have no conflict of interest.
This research is supported by the Dutch Technology Foundation STW, which is
part of the Netherlands Organisation for Scientific Research (NWO), and
which is partly funded by the Ministry of Economic Affairs.
Edited by: Graham Fogg
Reviewed by: two anonymous referees
Allen, R. G., Pereira, L. S., Raes, D., and Smith, M.: Crop Evapotranspiration-Guidelines for Computing Crop Water Requirements. FAO Irrigation and Drainage Paper 56, FAO – Food and Agriculture Organization of the United Nations, Rome, Italy, 1998.
Aquavision, Boskalis, Deltares, EcoShape, Imares, Nortek, Oregon State University, Provincie Zuid-Holland, Rijkswaterstaat, Shore Monitoring and Research, TU Delft, University of Twente, Utrecht University, Van Oord, VU University Amsterdam, and Wageningen University: Sand Motor raw data 2011–2016, TU Delft, Faculty of Civil Engineering and Geosciences, Department of Hydraulic Engineering, Dataset, https://doi.org/10.4121/uuid:6c828566-33be-4e5d-900a-4817898c9ddb, 2017.
Brown, S., Nicholls, R. J., Hanson, S., Brundrit, G., Dearing, J. A., Dickson, M. E., Gallop, S. L., Gao, S., Haigh, I. D., Hinkel, J., Jiménez, J. A., Klein, R. J. T., Kron, W., Lázár, A. N., Neves, C. F., Newton, A., Pattiaratachi, C., Payo, A., Pye, K., Sánchez-Arcilla, A., Siddall, M., Shareef, A., Tompkins, E. L., Vafeidis, A. T., van Maanen, B., Ward, P. J., and Woodroffe, C. D.: Shifting perspectives on coastal impacts and adaptation, Nature Climate Change, 4, 752–755, https://doi.org/10.1038/nclimate2344, 2014.
Colombani, N., Osti, A., Volta, G., and Mastrocicco, M.: Impact of Climate Change on Salinization of Coastal Water Resources, Water Resour. Manag., 30, 2483–2496, https://doi.org/10.1007/s11269-016-1292-z, 2016.
de Schipper, M. A., de Vries, S., Ruessink, G., de Zeeuw, R. C., Rutten, J., van Gelder-Maas, C., and Stive, M. J. F.: Initial spreading of a mega feeder nourishment: Observations of the Sand Engine pilot project, Coast. Eng., 111, 23–38, https://doi.org/10.1016/j.coastaleng.2015.10.011, 2016.
de Vries, S., Radermacher, M., de Schipper, M. A., and Stive, M. J. F.: Tidal dynamics in the Sand Motor lagoon, in E-proceedings of the 36th IAHR World Congress, the Hague, the Netherlands, available from: http://resolver.tudelft.nl/uuid:e49d8911-72c2-4f6c-a8b4-7009954134c0 (last access: 25 September 2015), 1–6, 2015.
Falkland, A. C. and Woodroffe, C. D.: Geology and Hydrogeology of Tarawa and Christmas Island, Kiribati, in Developments in Sedimentology, chap. 19, vol. 54, edited by: Vacher, H. L. and Quinn, T. M., Elsevier., 577–610, 2004.
Famiglietti, J. S.: The global groundwater crisis, Nature Climate Change, 4, 945–948, https://doi.org/10.1038/nclimate2425, 2014.
Ferguson, G. and Gleeson, T.: Vulnerability of coastal aquifers to groundwater use and climate change, Nature Climate Change, 2, 342–345, https://doi.org/10.1038/nclimate1413, 2012.
FitzGerald, D. M., Fenster, M. S., Argow, B. A., and Buynevich, I. V.: Coastal Impacts Due to Sea-Level Rise, Annu. Rev. Earth Planet. Sc., 36, 601–647, https://doi.org/10.1146/annurev.earth.35.031306.140139, 2008.
Giardino, A., Mulder, J., de Ronde, J., and Stronkhorst, J.: Sustainable Development of the Dutch Coast: Present and Future, J. Coast. Res., 61, 166–172, https://doi.org/10.2112/SI61-001.11, 2011.
Gubler, S., Gruber, S., and Purves, R. S.: Uncertainties of parameterized surface downward clear-sky shortwave and all-sky longwave radiation., Atmos. Chem. Phys., 12, 5077–5098, https://doi.org/10.5194/acp-12-5077-2012, 2012.
Holding, S. and Allen, D. M.: From days to decades: numerical modelling of freshwater lens response to climate change stressors on small low-lying islands, Hydrol. Earth Syst. Sci., 19, 933–949, https://doi.org/10.5194/hess-19-933-2015, 2015.
Huizer, S., Oude Essink, G. H. P., and Bierkens, M. F. P.: Fresh groundwater resources in a large sand replenishment, Hydrol. Earth Syst. Sci., 20, 3149–3166, https://doi.org/10.5194/hess-20-3149-2016, 2016.
Huizer, S., Karaoulis, M. C., Oude Essink, G. H. P., and Bierkens, M. F. P.: Monitoring and simulation of salinity changes in response to tide and storm surges in a sandy coastal aquifer system, Water Resour. Res., 53, 6487–6509, https://doi.org/10.1002/2016WR020339, 2017.
Kabat, P., Fresco, L. O., Stive, M. J. F., Veerman, C. P., van Alphen, J. S. L. J., Parmet, B. W. A. H., Hazeleger, W., and Katsman, C. A.: Dutch coasts in transition, Nat. Geosci., 2, 450–452, https://doi.org/10.1038/ngeo572, 2009.
Keijsers, J. G. S., Giardino, A., Poortinga, A., Mulder, J. P. M., Riksen, M. J. P. M., and Santinelli, G.: Adaptation strategies to maintain dunes as flexible coastal flood defense in The Netherlands, Mitig. Adapt. Strat. Gl., 20, 913–928, https://doi.org/10.1007/s11027-014-9579-y, 2015.
Langevin, C. D., Thorne Jr., D. T., Dausman, A., Sukop, M. C., and Guo, W.: SEAWAT version 4: A Computer Program for Simulation of Multi-Species Solute and Heat Transport, in U.S. Geological Survey Techniques and Methods 6, US Geological Survey, Reston, Virginia, USA, p. 39, 2008.
Lesser, G. R., Roelvink, J. A., van Kester, J. A. T. M., and Stelling, G. S.: Development and validation of a three-dimensional morphological model, Coast. Eng., 51, 883–915, https://doi.org/10.1016/j.coastaleng.2004.07.014, 2004.
Luijendijk, A. P., Ranasinghe, R., de Schipper, M. A., Huisman, B. A., Swinkels, C. M., Walstra, D. J. R., and Stive, M. J. F.: The initial morphological response of the Sand Engine: A process-based modelling study, Coast. Eng., 119, 1–14, https://doi.org/10.1016/j.coastaleng.2016.09.005, 2017.
McDonald, M. G., Harbaugh, A. W., Orr, B. R., and Ackerman, D. J.: A method of converting no-flow cells to variable- head cells for the U.S. Geological Survey modular finite-difference ground-water flow model, U.S. Geological Survey Open-File Report 91-536, Reston, Virginia, USA, 1992.
McGranahan, G., Balk, D., and Anderson, B.: The rising tide: assessing the risks of climate change and human settlements in low elevation coastal zones, Environ. Urban., 19, 17–37, https://doi.org/10.1177/0956247807076960, 2007.
Michael, H. A., Russoniello, C. J., and Byron, L. A.: Global assessment of vulnerability to sea-level rise in topography-limited and recharge-limited coastal groundwater systems, Water Resour. Res., 49, 2228–2240, https://doi.org/10.1002/wrcr.20213, 2013.
Millero, F. J.: Physicochemical Controls on Seawater, in Treatise on Geochemistry, chap. 6.01, edited by: Elderfield, H., Elsevier, Amsterdam, 1–21, 2003.
Mulligan, A. E., Langevin, C., and Post, V. E. A.: Tidal Boundary Conditions in SEAWAT, Ground Water, 49, 866–879, https://doi.org/10.1111/j.1745-6584.2010.00788.x, 2011.
Nicholls, R.: Planning for the Impacts of Sea Level Rise, Oceanography, 24, 144–157, https://doi.org/10.5670/oceanog.2011.34, 2011.
Passeri, D. L., Hagen, S. C., Medeiros, S. C., Bilskie, M. V., Alizad, K., and Wang, D.: The dynamic effects of sea level rise on low-gradient coastal landscapes: A review, Earth's Future, 3, 159–181, https://doi.org/10.1002/2015EF000298, 2015.
Pauw, P. S., Oude Essink, G. H. P., Leijnse, A., Vandenbohede, A., Groen, J., and van der Zee, S. E. A. T. M.: Regional scale impact of tidal forcing on groundwater flow in unconfined coastal aquifers, J. Hydrol., 517, 269–283, https://doi.org/10.1016/j.jhydrol.2014.05.042, 2014.
Post, V. E. A. and Houben, G. J.: Density-driven vertical transport of saltwater through the freshwater lens on the island of Baltrum (Germany) following the 1962 storm flood, J. Hydrol., 551, 689–702, https://doi.org/10.1016/j.jhydrol.2017.02.007, 2017.
Rasmussen, P., Sonnenborg, T. O., Goncear, G., and Hinsby, K.: Assessing impacts of climate change, sea level rise, and drainage canals on saltwater intrusion to coastal aquifer, Hydrol. Earth Syst. Sci., 17, 421–443, https://doi.org/10.5194/hess-17-421-2013, 2013.
Rosenzweig, C. and Solecki, W.: Introduction to Climate Change Adaptation in New York City: Building a Risk Management Response, Ann. NY Acad. Sci., 1196, 13–17, https://doi.org/10.1111/j.1749-6632.2009.05415_1.x, 2010.
Rotzoll, K. and Fletcher, C. H.: Assessment of groundwater inundation as a consequence of sea-level rise, Nature Climate Change, 3, 477–481, https://doi.org/10.1038/nclimate1725, 2012.
Shah, N., Nachabe, M., and Ross, M.: Extinction Depth and Evapotranspiration from Ground Water under Selected Land Covers, Ground Water, 45, 329–338, https://doi.org/10.1111/j.1745-6584.2007.00302.x, 2007.
Slobbe, E., Vriend, H. J., Aarninkhof, S. G. J., Lulofs, K., Vries, M., and Dircke, P.: Building with Nature: in search of resilient storm surge protection strategies, Nat. Hazards, 65, 947–966, https://doi.org/10.1007/s11069-012-0342-y, 2013.
Sterr, H.: Assessment of Vulnerability and Adaptation to Sea-Level Rise for the Coastal Zone of Germany, J. Coastal Res., 242, 380–393, https://doi.org/10.2112/07A-0011.1, 2008.
Stive, M. J. F., de Schipper, M. A., Luijendijk, A. P., Aarninkhof, S. G. J., van Gelder-Maas, C., van Thiel de Vries, J. S. M., de Vries, S., Henriquez, M., Marx, S., and Ranasinghe, R.: A New Alternative to Saving Our Beaches from Sea-Level Rise: The Sand Engine, J. Coastal. Res., 290, 1001–1008, https://doi.org/10.2112/JCOASTRES-D-13-00070.1, 2013.
Stockdon, H. F., Holman, R. A., Howd, P. A., and Sallenger, A. H.: Empirical parameterization of setup, swash, and runup, Coast. Eng., 53, 573–588, https://doi.org/10.1016/j.coastaleng.2005.12.005, 2006.
Stuurman, R.: Conclusions drainage meeting MOS-Boskalis/Van Oord/Deltares, version 3, Deltares, Utrecht, the Netherlands, 2010 (in Dutch).
Stuyfzand, P. J.: Predicting the effects of sea spray deposition and evapoconcentration on shallow coastal groundwater salinity under various vegetation types, Proceedings of the 23rd Salt Water Intrusion Meeting, 401–404, Husum, Germany, 2014.
Taylor, R. G., Scanlon, B., Döll, P., Rodell, M., van Beek, R., Wada, Y., Longuevergne, L., Leblanc, M., Famiglietti, J. S., Edmunds, M., Konikow, L., Green, T. R., Chen, J., Taniguchi, M., Bierkens, M. F. P., MacDonald, A., Fan, Y., Maxwell, R. M., Yechieli, Y., Gurdak, J. J., Allen, D. M., Shamsudduha, M., Hiscock, K., Yeh, P. J.-F., Holman, I., Treidel, H., Beek, R. van, Wada, Y., Leblanc, Laurent Longuevergne, M., Famiglietti, J. S., Edmunds, M., Konikow, L., Green, T. R., Chen, J., Taniguchi, M., MacDonald, A., Fan, Y., Maxwell, R. M., Yechieli, Y., Gurdak, J. J., Allen, D. M., Shamsudduha, M., Hiscock, K., Yeh, P. J.-F., Holman, I., and Treidel, H.: Ground water and climate change, Nature Climate Change, 3, 322–329, https://doi.org/10.1038/NCLIMATE1744, 2013.
van Koningsveld, M. and Mulder, J. P. M.: Sustainable Coastal Policy Developments in The Netherlands. A Systematic Approach Revealed, J. Coast. Res., 202, 375–385, https://doi.org/10.2112/1551-5036(2004)020[0375:SCPDIT]2.0.CO;2, 2004.
Voortman, B. R., Bartholomeus, R. P., van der Zee, S. E. A. T. M., Bierkens, M. F. P., and Witte, J. P. M.: Quantifying energy and water fluxes in dry dune ecosystems of the Netherlands, Hydrol. Earth Syst. Sci., 19, 3787–3805, https://doi.org/10.5194/hess-19-3787-2015, 2015.
Webb, M. D. and Howard, K. W. F.: Modeling the Transient Response of Saline Intrusion to Rising Sea-Levels, Ground Water, 49, 560–569, https://doi.org/10.1111/j.1745-6584.2010.00758.x, 2011.
Wong, P. P., Losada, I. J., Gattuso, J.-P., Hinkel, J., Khattabi, A., McInnes, K. L., Saito, Y., and Sallenger, A.: Coastal systems and low-lying areas, in Climate Change 2014: Impacts, Adaptation, and Vulnerability, Cambridge University Press, Cambridge, UK and New York, NY, USA, 361–409, 2014.
Wösten, J. H. M., Veerman, G. J., DeGroot, W. J. M., and Stolte, J.: Water retention and conductivity parameters of soils in the Netherlands: The Staring series, Wageningen, 2001 (in Dutch).