the Creative Commons Attribution 4.0 License.
the Creative Commons Attribution 4.0 License.
 | 06 Jan 2026
Swiss glacier mass loss during the 2022 drought: persistent streamflow contributions amid declining melt water volumes
Matthias Huss
Massimiliano Zappa
Tobias Jonas
Daniel Farinotti
The year 2022 was extremely warm and dry in Europe, resulting in a severe hydrological drought. In Switzerland, part of Europe’s water tower, streamflow in glacier-fed rivers could have been even more reduced if the situation had not led simultaneously to extreme glacier melt. Here we analyze the role of glaciers during the 2022 drought for 88 glacierized catchments by combining streamflow and meteorological observations with estimations of snow water equivalent, actual evapotranspiration and daily glacier storage changes. We also compare the year 2022 to earlier exceptionally warm and dry years (1921, 1928, 1947, 1998, 2003 and 2018) to assess if the ongoing glacier retreat has already caused a declining meltwater supply in such extreme conditions. Results show that 60 %–80 % of the total glacier melt in 2022 came from net mass loss (imbalanced melt). During summer, the increased glacier melt could completely offset the precipitation and snowmelt deficits for catchments with around 15 % glacierization. Further downstream, the extra glacier melt in summer alleviated water input deficits by up to 5 % at Basel (Rhine) and 70 % at Porte du Scex (Rhone). Compared to past extreme years, total glacier meltwater volume has declined due to strong glacier area loss, despite higher melt rates per unit area. In 2022 versus 2003 – the most comparable recent extreme summer – total glacier meltwater supply decreased in two thirds of the catchments over the entire summer, and in one third in July. In the remaining catchments, the more intense specific melt of 2022 could offset the 21 % glacier area loss since 2003. Despite these declines, relative glacier melt contributions to streamflow stayed rather constant, or even rose in some months, highlighting its ongoing importance during droughts while simultaneously raising concerns for future drought situations.
- Article
(7422 KB) - Full-text XML
-
Supplement
(13807 KB) - BibTeX
- EndNote


The year 2022 was characterized by extreme weather events, such as floods, droughts and heatwaves, all around the world. At a global level, the year was the fifth warmest year on record since 1880 (WMO, 2023). Throughout Europe, the summer of 2022 was the hottest since 1950 (Copernicus, 2023). Although the following years, 2023 and 2024, broke some of the temperature records, 2022 is still characterized as most recent extreme year in Central Europe with respect to summer temperature in combination with a precipitation deficit. During 2022, a persistent high-pressure anomaly, centered over France, caused a spatially varying intensity in lack of precipitation, a series of heatwaves occurring from May until August, and drying out soils over Europe (Faranda et al., 2023; Tripathy and Mishra, 2023). The compound drought and heatwave hit particularly hard in Northern Italy, for which Tripathy and Mishra (2023) found a return period of 354 years. In combination with a large snow deficit building up during the preceding winter (Avanzi et al., 2024), the Po river in Italy experienced its worst streamflow drought of the past two centuries (Montanari et al., 2023). At the same time, the extremely warm summer of 2022, in combination with low snowfall in winter and several Saharan dust events darkening the snow, led to record-breaking glacier volume losses in the European Alps (Réveillet et al., 2022; Cremona et al., 2023; Voordendag et al., 2023).
Meteorological droughts, such as in 2022, can propagate through the hydrological cycle and turn into a hydrological drought, with considerably less discharge in streams and rivers, as well as low lake and groundwater levels (Zappa and Kan, 2007; Van Lanen et al., 2016). In Switzerland, the drought, defined as a sustained and regionally extensive period of below-normal water availability (Van Loon, 2015) of 2022 resulted in problems with water supply, restrictions on water use for households and agriculture, reduction in energy production from hydropower plants, restriction of navigation on the river Rhine and some lakes due to low water levels, and fish mortality due to high water temperatures (BAFU, 2023). During drought conditions, catchment storage elements are important to buffer and alleviate the propagation of meteorological droughts to hydrological droughts (Van Lanen et al., 2013; Van Loon and Laaha, 2015; Bruno et al., 2022). In the case of the extreme year 2022, in which snow melted away early in the year and groundwater levels were affected due to the prolonged duration of the drought, the relevance of glaciers as a catchment storage to buffer the drought increased significantly (Pritchard, 2019; Van Tiel et al., 2020; Ultee et al., 2022; McCarthy et al., 2022a), also far downstream (Huss, 2011; Koboltschnig and Schöner, 2011; Jost et al., 2012; Van Tiel et al., 2023). Beyond merely buffering drought, glaciers can counterbalance some of the precipitation-driven water deficits by releasing more meltwater than normally during heatwaves (Van Tiel et al., 2021; Anderson and Radić, 2023). For example, Zappa and Kan (2007) showed that during the 2003 drought and heatwave in the European Alps, catchments between 10 %–20 % of glacierization showed positive streamflow anomalies, despite strong precipitation deficits. Besides the role of catchment glacierization, a detailed quantification of this counterbalancing effect of water deficits at regional scales is lacking. Such a quantification is crucial to understand the diminishing role of glaciers for mitigating hydrological droughts.
While additional glacier melt is favorable to mitigate or alleviate streamflow droughts, the situation is very unfavorable for glaciers. During years of exceptional mass loss, glaciers loose a significant part of their volume of which they do not recover from during times of unprecedented climatic warming (Vincent et al., 2017; Hugonnet et al., 2021). With ongoing climate change, there is a tendency of extremely hot and dry years to occur more often and to become more intense (Alizadeh et al., 2020; Mishra et al., 2020; De Luca and Donat, 2023). Vargo et al. (2020) showed that due to anthropogenic climate change extreme annual glacier mass losses are six to ten times more likely to occur, focusing on glaciers in New Zealand. How glaciers respond to extreme meteorological conditions depends on several factors: (1) the intensity of (lack of) accumulation and melt conditions, (2) their balanced state with the climate, and (3) their areal extent, which determines the volume of melt that can be generated. All of these factors are changing over time, and need to be considered to assess how retreating glaciers affect the buffering capacity of glacier melt during droughts.
In the context of glacier retreat and water resources, rarely extreme glacier melt years are studied. Research mostly focus on the concept of “peak water”, which describes how glacier meltwater volumes first increase under continued rise of temperatures due to global warming, but decline thereafter (the peak) when the volume and area of glaciers has diminished and the increased specific mass losses cannot offset the smaller glacier area anymore (Ragettli et al., 2016; Frans et al., 2018; Huss and Hock, 2018; Chesnokova et al., 2020; Rets et al., 2020; Wang et al., 2023). This trajectory often refers to smoothed time series of glacier runoff (Huss and Hock, 2018; Carnahan et al., 2019; Rounce et al., 2020), and therefore provides only information on the general trend but not on the changing glacier meltwater volumes during specific extreme years (e.g. Koboltschnig et al., 2007; Zappa and Kan, 2007; Pelto et al., 2022; Menounos et al., 2025). Theoretically, glacier responses during extreme years could be different from long-term mean changes in glacier runoff, i.e. on average glacier melt volumes could be declining, while during an extreme year a new record of released glacier melt volume could be broken.
Understanding the changing compensational role of glaciers for downstream hydrology, requires investigation of the changing impacts of extreme conditions on meltwater supply and quantification of the compensation effects by analyzing water balance anomalies in a comprehensive framework. In this study, we examine the drought and extreme glacier melt of 2022. We combine glaciological and hydrological observations and model-based estimates of all water balance terms to identify the hydro-meteorological drivers behind the extreme glacier melt and downstream flow deficits. We quantify how much glacier meltwater could compensate for the lack of rain and snowmelt in the summer 2022 and how impacts vary spatially and evolve with distance from glaciers. To assess whether increasing melt rates are offset by ongoing glacier retreat that would lead to generally declining meltwater volumes, we put 2022 into a long-term perspective and compare it with previous extreme years.
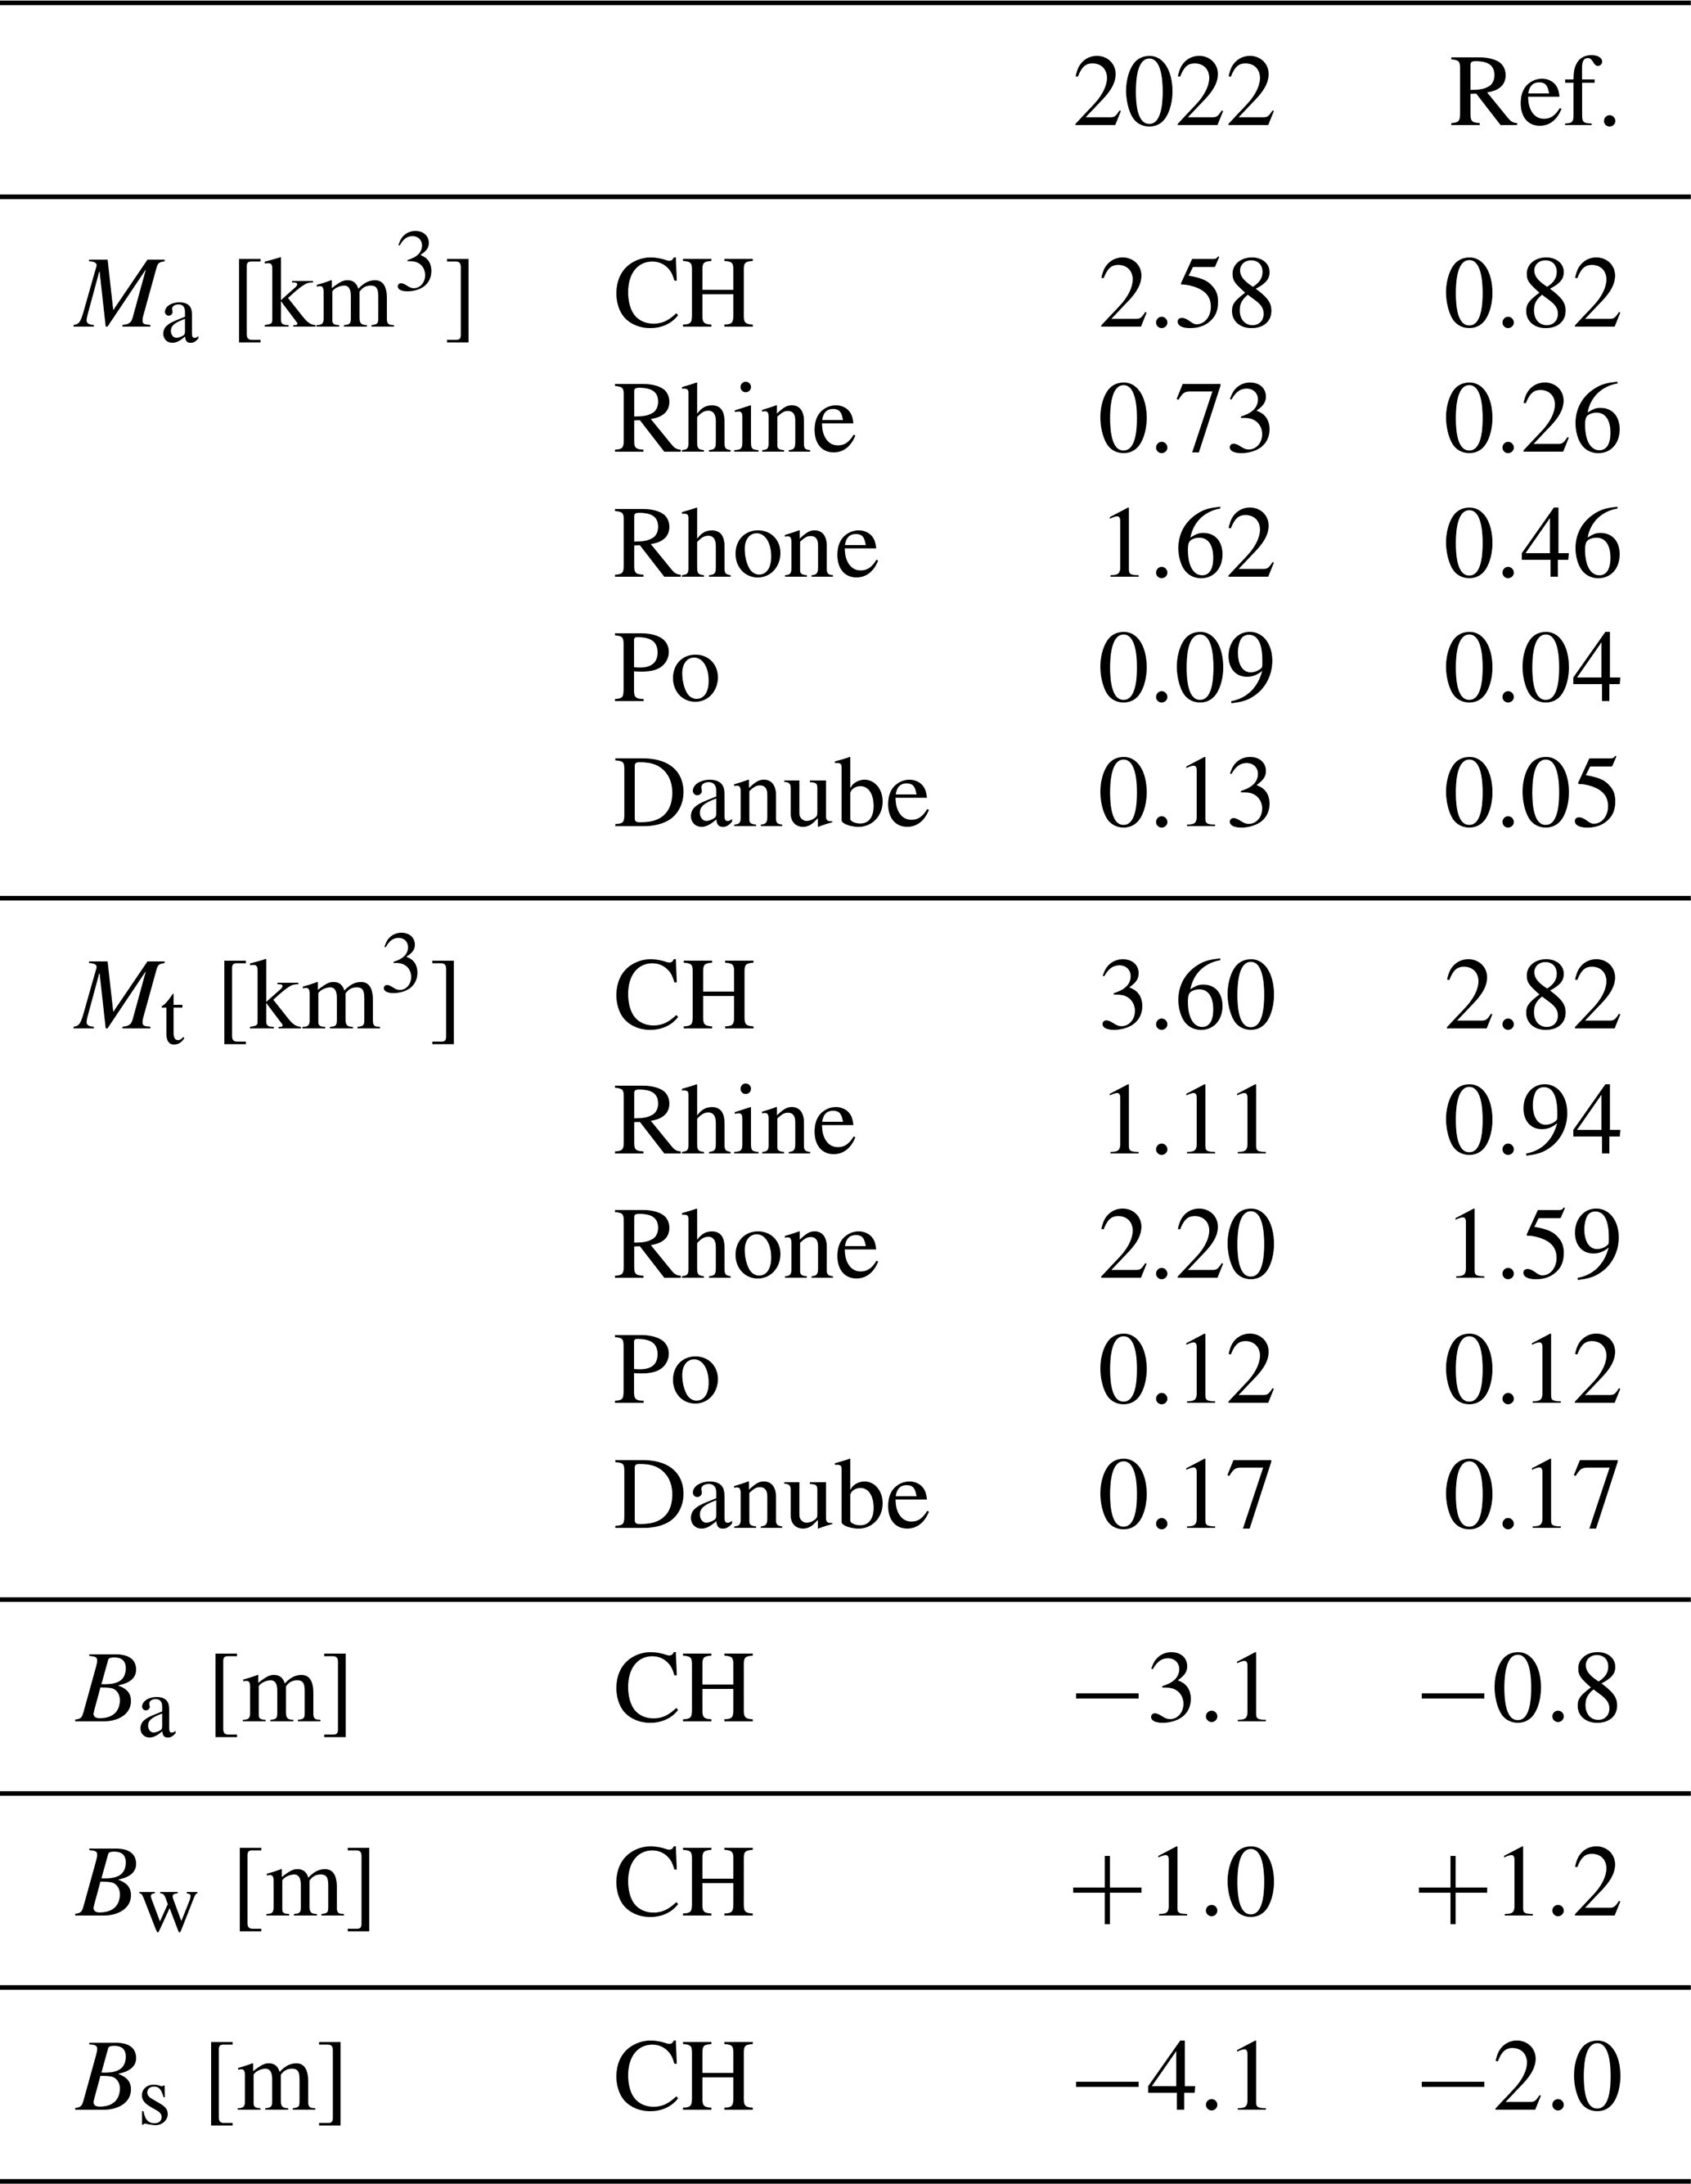
We consider all gauged glacierized catchments in Switzerland for which reliable data could be obtained through the federal network, the cantonal stations and private companies (Fig. 1). In total, 88 catchments are included, with sizes varying from 9 to 35 877 km2 (Table S1 in the Supplement). These catchments contain 97 % of the 1400 Swiss glaciers (Linsbauer et al., 2021) and are sub-catchments of the four main river basins Rhine, Rhone, Po and Danube (Table 1). A small part of the alpine Rhine basin is located outside the Swiss borders and the glaciers in this part are therefore not included in the analyses (0.3 % of the glacier area of the Rhine basin). These four main river basins experience varying climates, with the Rhone and Danube basins being drier, and the Po basin generally wetter, compared to the Rhine basin.
Switzerland has extensive water management infrastructure, including reservoirs and water transfers, leaving only 14 catchments classified as predominantly natural (Fig. S2 in the Supplement). Additionally, streamflow data for 8 catchments were obtained from discharge measurements at water intakes with minimal influence from management infrastructure upstream. Thus, altogether, 22 catchments represent a natural streamflow signal.
Table 1Characteristics of the four main studied basins in Switzerland, with the number of studied sub-catchments indicated in the last column. The Glacierization column refers to relative glacier cover for the chosen outlets in column 2, with in brackets the range for the sub-catchments. Glacier data refer to the Swiss Glacier Inventory 2016.
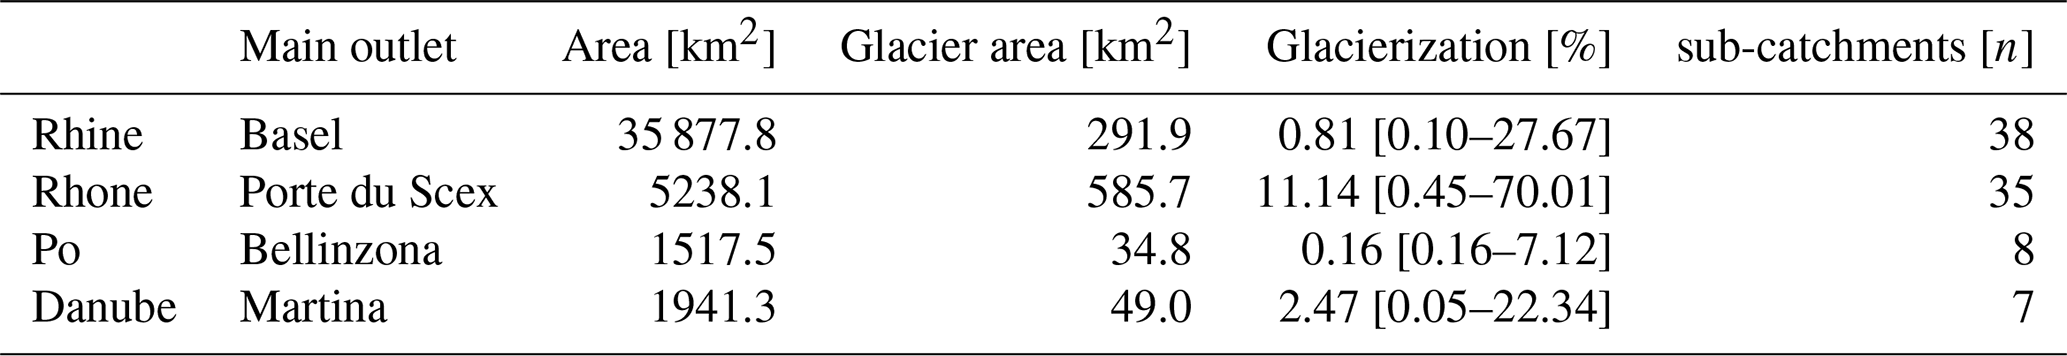
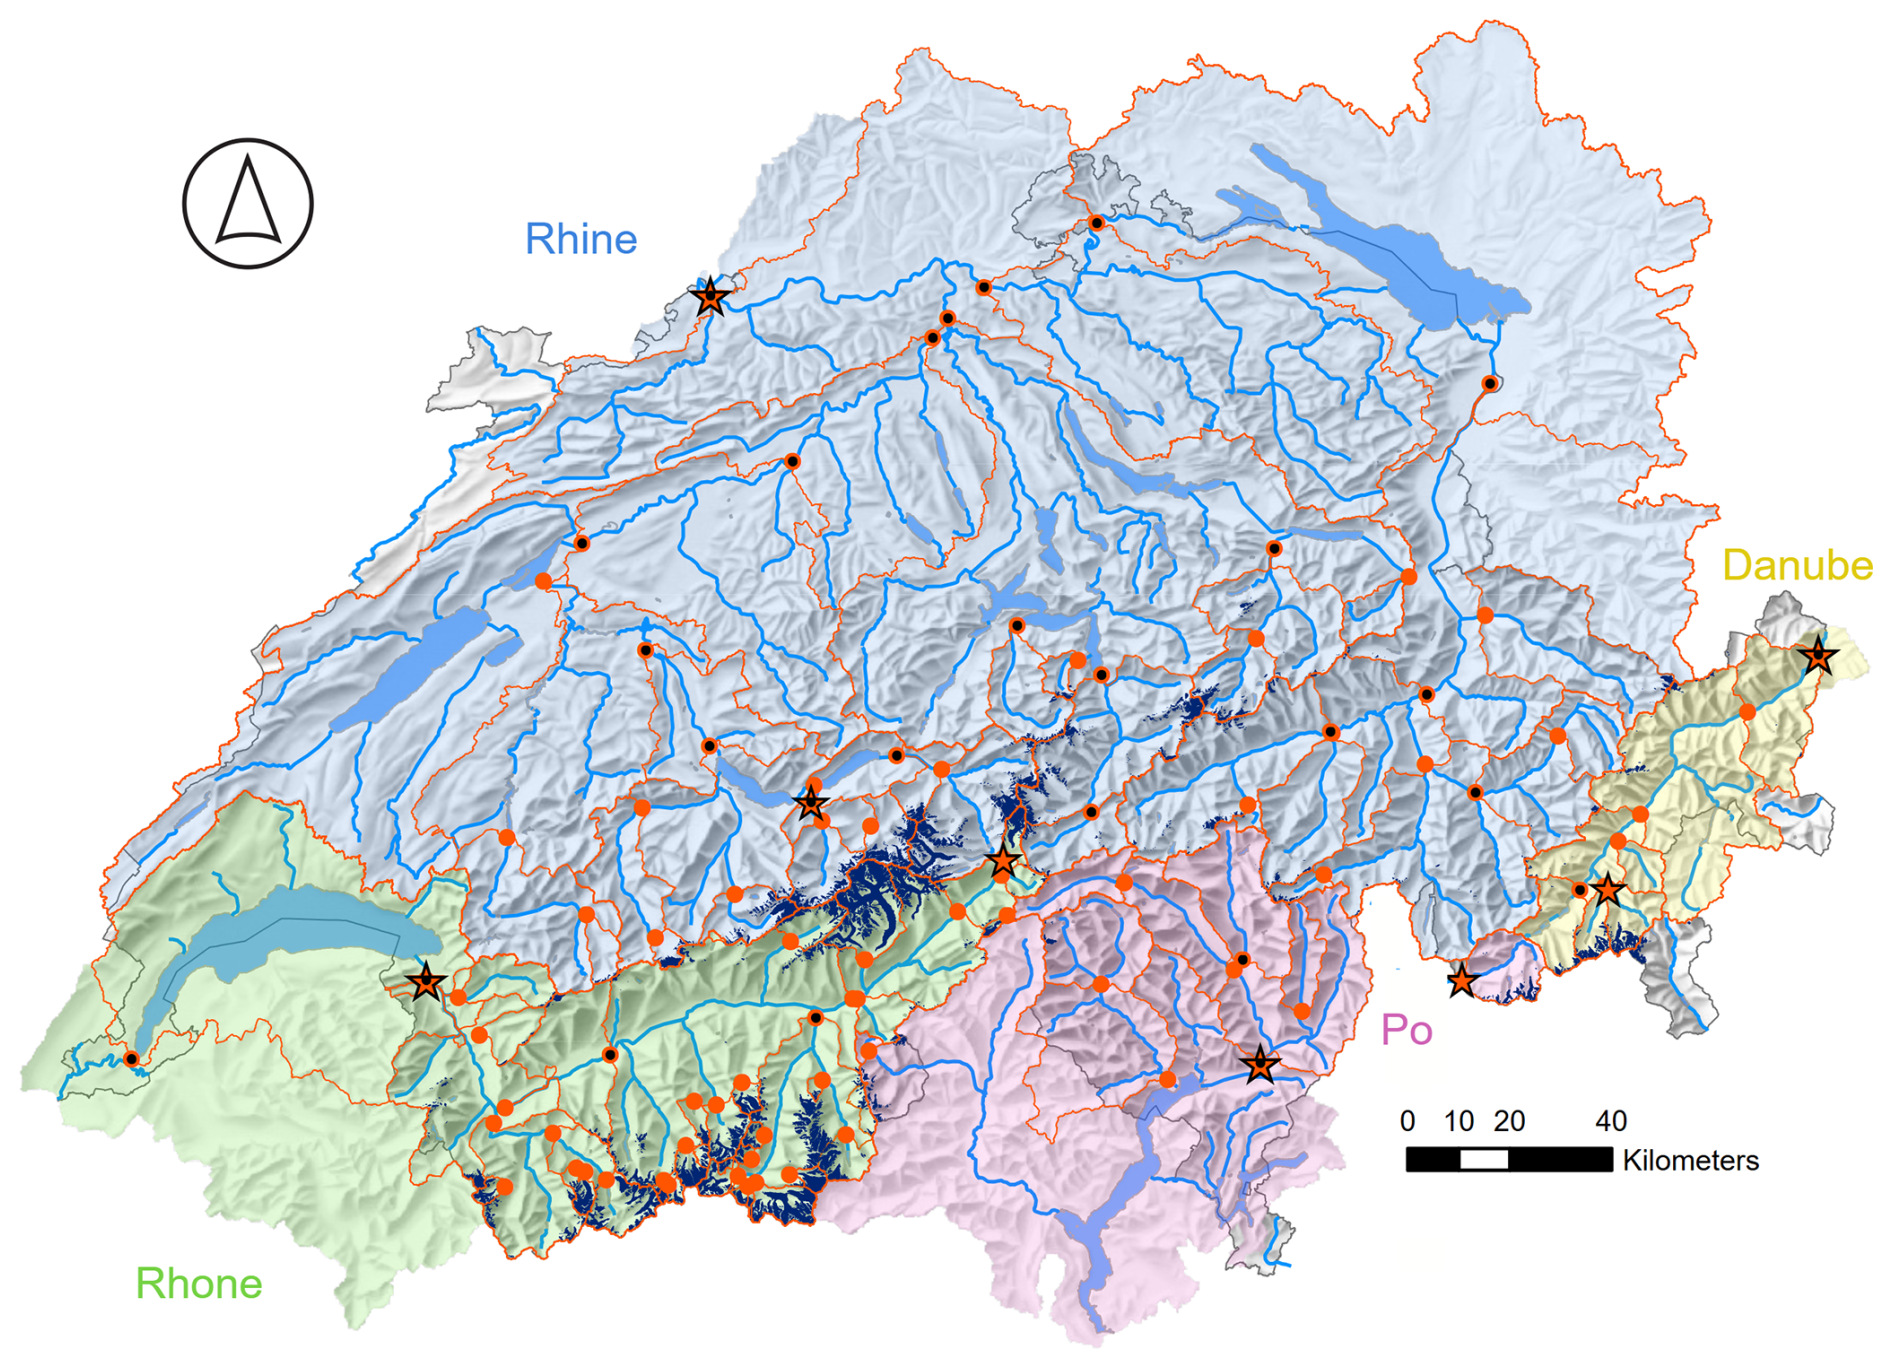
Figure 1Map of hydrological Switzerland with the 88 studied catchments and gauging stations (orange outlines and dots). The four main river basins are indicated with a different background color. Glacier outlines (dark blue) are from the Swiss Glacier Inventory 2016. Selected outlet stations for the main river basins (stars) and gauging stations with streamflow data starting before 1921 (black dots) are indicated.
For the glacio-hydrological characterization of 2022 and the comparison with past extremes, we assembled all available regional-scale observations and complemented this with model-based estimates at a daily resolution (Table 2) to derive the water balance terms for all of the catchments. Since glacier mass balance is only available for a few selected glaciers and at a seasonal resolution, a method was developed to estimate the mass balance for all individual glaciers in Switzerland at the daily scale (Sect. 4.1).
For streamflow, we used a combination of gauging stations from the network of the Federal Office for the Environment Switzerland (FOEN) (64 stations) (Höge et al., 2023) and stations from the Cantons of Bern (4), Valais (1), Glarus (1) and Vaud (1), as well as streamflow time-series from hydropower companies (Alpiq, Kraftwerke Mattmark AG, Forces Mortrices de Mauvoisin and Aegina SA). These time series varied in length and quality. The catchments were classified based on time series length and a water balance test to determine what types of analysis (e.g. investigation of glacier melt contribution to streamflow, year-to-year comparisons, or water balance calculations; see Sect. 4 and Table S1) the streamflow data could support.
The water balance test (details on data used provided below) evaluated the long-term ratio of annual measured streamflow to the total of precipitation, actual evapotranspiration, and glacier storage change. Catchments were included in the analysis if the ratio deviated by less than 25 %. A threshold of 25 % was chosen here, weighing off the effects of a too strict threshold resulting in few catchments remaining in the analyses, and a too high threshold including catchments that have a clear deficiency in the data that would hinder interpretation of patterns that we are after in this study. For deviations exceeding 25 %, we followed these criteria to decide if catchments should be included in the analyses: (1) if the ratio exceeded 1 and the catchment was classified as natural, we applied a uniform multiplication correction to the daily precipitation data, assuming underestimation of precipitation, (2) if the ratio exceeded 1 and the catchment was classified as influenced, we excluded it from analyses involving precipitation estimates and (3) if the ratio was below 1, the catchment was used only for relative year-to-year comparisons, as absolute streamflow was assumed to be underestimated compared to the other water balance terms.
(MeteoSwiss, 2019, 2021)(Viviroli et al., 2009)(Höge et al., 2023)GLAMOS (2024)Fischer et al. (2015)Linsbauer et al. (2021)Müller et al. (1976)Grab et al. (2021)Table 2Overview of the datasets used in the study. (O) and (M) in the “Data” column refers to Observations, or Modelled, respectively. P stands for precipitation, T for temperature, SWE for Snow Water Equivalent. The “n” column indicates the number of catchments/glaciers for which data was available in this study.
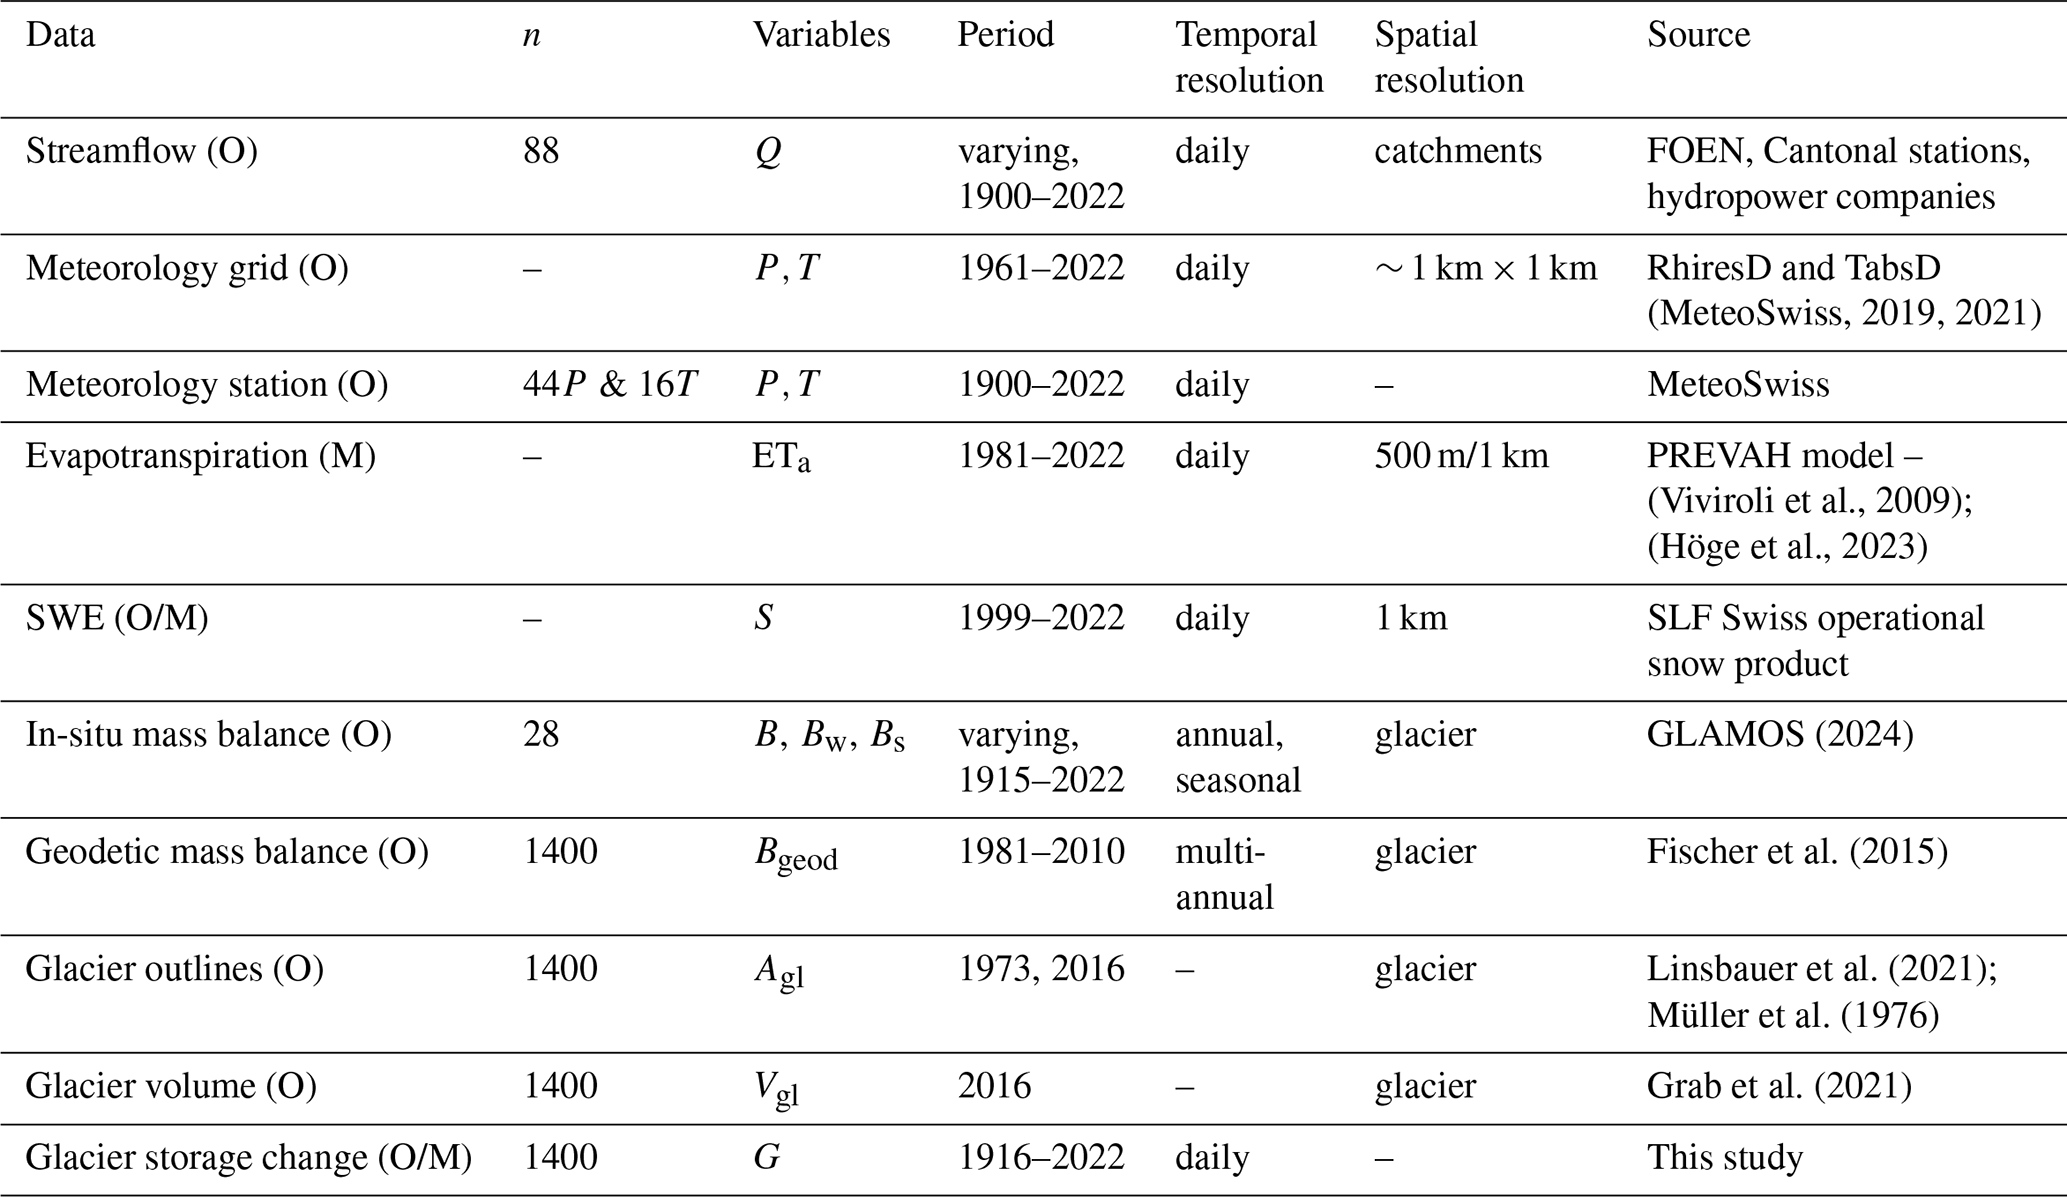
Precipitation and temperature data were derived as catchment average daily time series from the gridded products of MeteoSwiss (see Table 2). To extend the time series further back in time than 1961 (Sect. 4.4), we selected all Swiss meteorological stations that covered the period from 1900 until 2022 (Fig. S1). The monthly and annual anomalies for these stations were averaged to combine them and obtain a single, long-term Swiss-wide time series of precipitation and temperature anomalies.
Evapotranspiration amounts (ET) were derived from outputs of the distributed hydrological model PREVAH, which is used for operational purposes in Switzerland. Evaporation is modelled following the Penman-Monteith scheme as detailed in Gurtz et al. (1999) and Zappa and Gurtz (2003). Values were extracted for the non-glacierized parts of the catchments.
Information on snow water equivalent (SWE) was obtained from the Swiss operational snow product. It is based on the assimilation of snow monitoring data from 349 stations into the snow model OSHD_TICL as described in Mott et al. (2023) and Magnusson et al. (2014). The SWE product is intended to represent seasonal snow, consequently all snow remaining on 1 September of each year has been removed from the simulations. Because only 12 snow monitoring stations are available above 2500 m a.s.l., catchment average daily SWE time series were extracted only for the non-glacierized catchment areas, equivalent to the treatment of the ET data. Snow on the glaciers is included in the glacier storage change data (Sect. 4.1). To use SWE as a proxy for snowmelt, the differences between maximum and minimum SWE within a specific time period (e.g., a month, season or year) were calculated.
For the extrapolation of available glacier mass balances in space and time, all the available in-situ annual and seasonal glacier mass balance data (GLAMOS, 2024) were used. The surveyed glaciers are a representative sample and cover all climatological regions of the Swiss Alps. The data refer to a fixed-date system (30 April for winter, and 30 September for annual mass balances) (Table S2). Only 3 time series extend back to before 1920, while 9 time series start before 1970. The density of observations strongly increased after 2005, with 20 glaciers being measured in 2022. In addition, geodetic mass balances for all glaciers in Switzerland, and glacier outlines representing 2016 and 1973 glacier areas were used for the extrapolation procedure.
4.1 Swiss-wide daily glacier storage changes
To analyze glacier mass changes and melt and assess their downstream contributions to streamflow in time and space, a new approach was developed. It estimates glacier mass change at the scale of all individual Swiss glaciers (1400 glaciers) at a daily time resolution. The approach is based on a combination of in-situ measurements, remote-sensing data and modelling, and consists of four main parts: (a) extrapolating seasonal and annual mass balance from surveyed glaciers in space for obtaining an observation-based year-to-year variability (steps 1–2 Fig. 2), (b) combining these with geodetic mass balances from the comparison of digital elevation models (DEMs) for obtaining information on long-term mass changes of all individual glaciers (step 3 Fig. 2), (c) extracting a seasonal daily glacier mass balance pattern from a daily glacier mass balance model constrained with these data sets (steps 4–6 Fig. 2), and (d) estimating glacier area evolution over time using area-volume scaling to convert specific mass balance into absolute glacier mass changes, or water volumes (steps 7–8 Fig. 2). A similar approach, including parts, a, b and d has recently been applied also at a global scale (Dussaillant et al., 2025).
First, the available long-term glacier-wide annual mass balance measurement series (28 in total) were converted into a mass balance anomaly for each surveyed glacier g and year y (ΔBg,y). This was done by subtracting the mean of a glacier reference period, here 2011–2020 (GLAMOS, 2024; Huss et al., 2015). This glacier reference period was chosen to optimize mass balance data availability (Sect. 3). Taking the annual mass balance anomaly (ΔB) instead of absolute mass balance values is necessary for spatial extrapolation as glaciers are known to respond with strongly differing mass balances to the same change in atmospheric forcing, mostly depending on their geometry (Fischer et al., 2015; Brun et al., 2019). Long-term observations show that mass balance anomalies are more spatially homogeneous. The values ΔBg,y for the set of surveyed glaciers were then extrapolated to all individual glaciers contained in the SGI2016 (Linsbauer et al., 2021) using an inverse-distance weighting scheme (step 2). The initial search radius for an individual glacier was set to 150 km, which was extended in steps of 10 % until at least three measurements were available. The inverse-distance weighting also accounts for the main weather divide of the Alps by attributing higher weights to series on the same side (North/South of the divide) as the glacier to which the anomaly is extrapolated to.
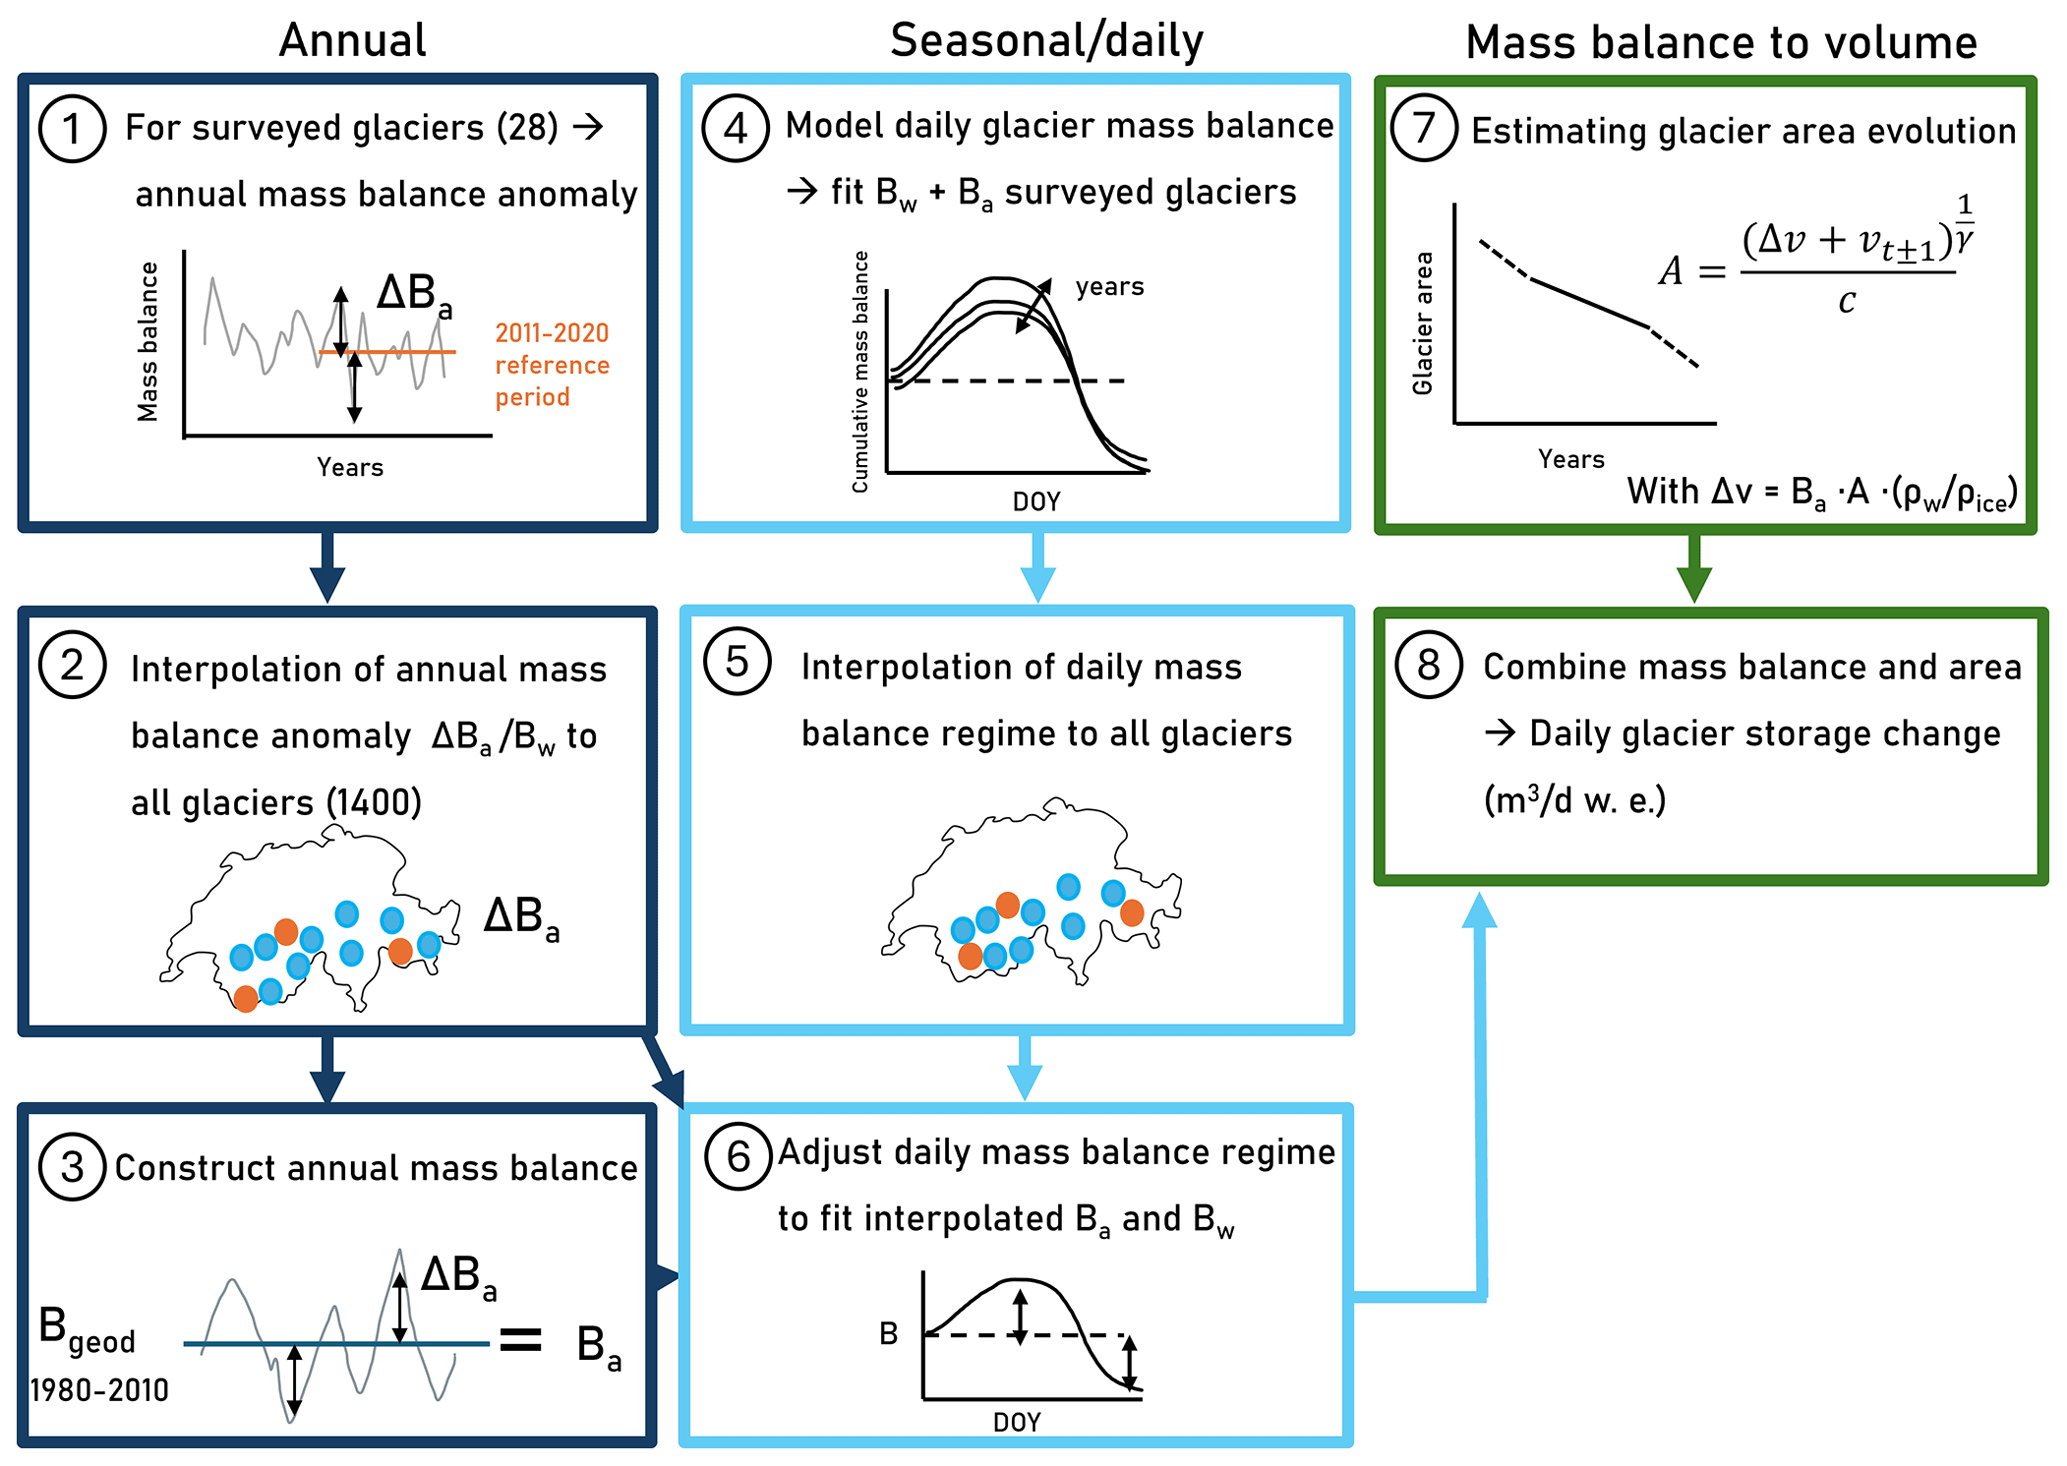
Figure 2Overview of the various steps to derive daily glacier mass balance and storage change estimations for the period 1916–2022 for all 1400 Swiss glaciers. B represents glacier mass balance, with the subscripts “a” for annual, and “w” for winter.
Observed winter mass balances () were extrapolated based on their actual values (instead of their anomalies) because no long-term average winter mass balance is available for each glacier and Bw is expected to vary less in space as no glacier dynamics are involved here. The extrapolation was done using the same inverse-distance weighting scheme. To reflect the differences in amounts of snow accumulation for individual glaciers due to their characteristic location, a correction factor was applied to each extrapolated winter mass balance value. This factor is based on the difference in median glacier elevation of the respective glacier with the surrounding glaciers. Glaciers at higher elevations than their surroundings receive a negative correction (wind-erosion processes), while glaciers located lower than their surrounding glaciers receive a positive correction (snow-deposition processes) (Ohmura et al., 1992) (Fig. S3). The correction was set to 10 % per 100 m elevation difference, a value that is challenging to validate due to the limited availability of observational series informing about local-scale snow accumulation differences between neighboring glaciers.
For step 3, the extrapolated annual mass balance anomalies ΔBg,y are superimposed onto the available geodetic mass balance (see Sect. 3) to obtain a locally adjusted, absolute annual mass balance Bg,y for each individual glacier:
Here, is the mean of the mass balance anomalies for 1980–2010, which is used to correct for the bias between and the observed mean glacier mass balance over the period 2011–2020. This way, the extrapolated cumulative annual mass balance for each glacier agrees with long-term observed mass change from remote sensing.
For step 4–6, in which we downscale the seasonal and annual glacier mass balances to the daily resolution, a distributed accumulation and temperature-index model was used (see e.g. Huss et al., 2015, 2021; GLAMOS, 2024). It is applied to each of the 28 glaciers with in-situ mass balance measurements. For each of these glaciers, accumulation and ablation are simulated using model parameters that are optimized to best match all available point-based winter and annual/summer mass balance measurements each year, as well as geodetic surveys of multi-annual mass change. The forcing of the model is based on data obtained from nearby meteorological stations. The model computes daily mass balances on a fine spatial grid that are then aggregated to glacier-wide cumulative time series. Next, each of the non-surveyed glaciers was assigned a simulated daily cumulative mass balance time series of the closest surveyed glacier (step 5). The daily cumulative time series were scaled to fit the assigned winter and annual mass balance of steps 1–3 according to
in which Bg,d is the daily cumulative mass balance at day d in m w.e., expressed as number of days from 1 October. Bnearest,d is the simulated time series of daily cumulative mass balances from the closest surveyed glacier. Δt are the number of days for the months indicated in subscripts (step 6).
For the last part, steps 7 & 8, we combined linear interpolation and volume-area scaling as a simple method to estimate glacier area evolution. The glacier area is needed together with the specific glacier mass balance (Bg,y and Bg,d) to calculate glacier mass change, and hence the generated meltwater volumes. Between 1973 and 2016, glacier areas for each glacier were linearly interpolated between the two respective inventories (Müller et al., 1976; Linsbauer et al., 2021). Before 1973 and after 2016, the area A of a glacier was computed based on its annually updated volume V by using volume-area scaling (Bahr et al., 1997):
where c is a glacier-specific constant, and γ=1.8 is an exponent which was adjusted to fit the observed area and volume changes between 2016 and 2022. c was derived for each glacier individually based on the known values for A and V for the 2016 inventory Grab et al. (2021). For estimating glacier area during years outside the 1973–2016 window, Eq. (3) was applied by computing an updated glacier volume (V±ΔV) based on the extrapolated mass balance and glacier area of previous or next time step (depending on whether the equation is used for determining an area after 2016 or before 1973) and a volume-to-mass change conversion factor of 850 kg m−3 (Huss, 2013).
With this framework, we derived daily time series of cumulative mass balance (m w.e.) and daily glacier storage changes (m3 d−1 w.e.) from 1916 to 2022 for each individual glacier. Positive daily glacier storage change values represent net daily accumulation over the glacier, while negative values indicate net daily mass loss over the glacier. Time series from glaciers within the same catchment were averaged (mass balance) or summed (storage change) for further analysis.
4.2 Attributing extreme glacier mass loss
To attribute the extreme glacier mass change of 2022 to its causes, three aspects were analyzed: (1) the contribution of summer and winter mass balance anomalies to annual mass balance anomalies, (2) the timing and intensity of the summer melt period, and (3) the ratio between balanced and imbalanced melt contributions (Fig. S4). In this attribution framework, radiation terms were not physically analyzed, but rather its effects, such as earlier melt onset and stronger melting.
For aspect 1, winter and summer balance anomalies were calculated based on the reference period 1991–2020. For the glacier attribution analyses, mass balance years were defined using the stratigraphic method, i.e. by identifying the period between the two successive annual minima of the cumulative mass balance time-series. The difference between these minima represents the annual mass balance. Winter mass balance is defined as the difference between the first minimum and the maximum cumulative mass balance during that year. Summer mass balance is the difference between annual and winter mass balance.
For aspect 2, we attributed the extreme melt of 2022 to differences in timing of the melt season and its intensity compared to the reference period (1991–2020). We calculated how much of the anomalous melt occurred due to (i) an earlier onset of the melt period, computed as the amount of melt occurring in the shifted timing of the maximum cumulative daily mass balance between 2022 and the mean of the reference period, (ii) more intense melting when compared to the reference summer mass balance period, and (iii) the timing of the melt season ending, computed here as the amount of meltwater generated between the mean end of the mass balance year in the reference period and the end of the mass balance year in 2022.
For aspect 3, the sum of all negative glacier storage changes over the mass balance year 2022 was separated into balanced and imbalanced melt. The balanced part of the melt equals the winter accumulation on the glacier, and consists mostly of snowmelt, but also includes ice melt. The remaining melt is the imbalanced melt and causes the glaciers to lose volume with respect to the start of the year (Fig. S4). Imbalanced melt consists mostly of ice melt, but can also include firn melt. For each glacier and extreme year (2022 and other years), the day when glaciers switch from balanced to imbalanced melt was extracted as the day when the cumulative daily mass balance equaled zero, similarly as the “Glacier Loss Day” in Voordendag et al. (2023).
4.3 Attribution of streamflow responses and glacier compensation effects
For the attribution of the 2022 streamflow anomalies (ΔQ), we analyzed anomalies in precipitation (ΔP), snowmelt (ΔS), ET (Δ ET), and glacier storage change (ΔG). For each of these water balance components, annual (hydrological year) and summer (MJJA) anomalies were derived. May was included since in 2022 this month experienced high snow melt rates already. The anomalies were generally calculated using the reference period 1991–2020. However, due to insufficient data, Δ SWE was calculated using 1999–2020 across all catchments, while ΔQ was calculated for seven catchments using reference periods starting between 1994 and 2012. For ΔG, the sum of all storage change values (positive and negative values) were used.
The individual water balance anomalies were used to calculate a glacier compensation level L:
L is a percentage indicating the extent to which the surplus glacier melt can compensate for deficits in precipitation, snowmelt (only in summer), or increased evapotranspiration. A value of 100 % means that the surplus glacier meltwater could fully compensate for the deficits in the other water balance terms, resulting in near-normal streamflow (ΔQ=0). Values below 100 % indicate only partial compensation, whereas values greater than 100 % indicate overcompensation, i.e. the surplus meltwater exceeds the deficits.
Since the various water balance anomalies were derived from various data sources and estimation methods, the sum of all terms does not necessarily equal zero, also because storage processes were not considered (reservoirs and groundwater). To include this uncertainty in the estimation of L, we calculated the uncertainty ϵ as follows:
Since it is not known which component causes the ϵ to deviate from zero, the term was once added to the surplus glacier melt component (ΔG), and once to the water deficit drivers ( ET) in Eq. (4) to calculate the uncertainty in L. Depending on the sign of ϵ, it can refer to an over/underestimation of (one of) the respective water balance anomalies or it could relate to water transfers from or to the catchment, affecting ΔQ in Eq. (5). Thus, in total, we derived three estimates of L per catchment, indicating the maximum range of possible values.
4.4 Long-term perspective: past extremes
To put the year 2022 in a long-term perspective, seven years with very negative annual and summer mass balances were selected: 1921, 1928, 1947, 1998, 2003, 2018 and 2022. All of these years where also characterized by severe droughts (Zeng et al., 2005; Erfurt et al., 2019; Brunner et al., 2019; Hansel et al., 2022). We compared these years in terms of meteorological conditions, glacier mass balance, glacier meltwater volume, and streamflow volumes. Since only one-third of the catchments have streamflow data covering all extreme years, an emphasis is put on the comparison between 2003 and 2022 for which 76/88 catchments could be used.
To gain insights into the changing glacier meltwater volumes over time, while correcting for temperature differences, a glacier melt sensitivity index Θg,y was defined as
where Mg,y is the sum of all negative glacier storage changes between 1st of June and 30 September for glacier g and year y, and Tg,y is the average temperature in Kelvin (K) (to avoid issues with close to zero values) for the mean elevation of the same glacier and the same period. Yearly values of Θg were calculated for the period 1961–2022, corresponding to the data coverage of the gridded meteorological product (Section 3). To compare Θg across glaciers, time series of Θg were normalized between 0 and 1, based on the maximum and minimum values for each glacier.
5.1 Attribution of extreme glacier melt in 2022
With respect to the 1991–2020 period, the summer temperature anomaly in 2022 for the various catchments ranged between +1.8 and +2.7 °C. At a monthly scale, especially, May, June and July stood out, with monthly temperature anomalies of +3 °C. Annual precipitation amounts were 17 % to 40 % lower than the reference period, with the highest deficits for catchments in the Po basin (Figs. S6 and S7). The winter period was most exceptional, with deficits up to 50 % for catchments in the Po basin. Catchments in the Rhine basin showed the smallest deficits in winter, ranging between 20 %–35 %. These meteorological conditions led to strong glacier mass losses (Table 3). In 2022, all Swiss glaciers together lost a total estimated ice volume of around 3 km3, equaling 2.6 km3 of meltwater. This amount is more than three times the mean glacier volume loss over 1991–2020. The glacier volume loss of 2022 equals to around 5.9 % of the total inferred volume of all Swiss glaciers in 2021 (GLAMOS, 2024). The 2022 net annual meltwater volume loss (Ma) represents roughly 6 % of the total precipitation of Switzerland in 2022 (1037 mm), while covering only 2.1 % of the Swiss area. The total meltwater volume generated (net melt of 2.6 km3+ balanced melt) was around 3.6 km3, around 28 % more than the reference total meltwater volume. Daily glacier storage changes were highest during July, and deviating most from the reference period average during May, June and July (Fig. S8). Meltwater volumes for the different basins scale with the glacierized areas and were highest for the Rhone basin (Table 3). In contrast, the area-weighted annual mass balance was most negative for glaciers in the Po and Danube basins, ( m w.e.) (Fig. S5).
Table 3Glacier meltwater volumes and mass balances for 2022 and the reference period (1991–2020). M refers to meltwater volumes, whereas B refers to glacier-wide mean specific mass balance. “a” refers to net annual, “s” to summer, “w” to winter and “t” to total. CH/Basin refers to Swiss-wide/Basin average or sum. The numbers refer to the mass balance year corresponding to the hydrological year; used in most of the comparisons and analyses. Table S3 shows the results for the stratigraphic mass balance, used in the glacier attribution analyses.
The anomalous annual mass balance of 2022 (ΔBa) was primarily related to the summer mass balance anomaly (ΔBs) (Fig. 3a). For the different glaciers, the contribution of ΔBs to ΔBa varied between 55 %–75 %. For glaciers in the Po and Danube basins, the winter mass balance anomaly (ΔBw) contributed the highest among the basins and explained up to 45 % of ΔBa.
The anomalous summer mass balance and the generated summer melt volume could be attributed for 15 %–20 % to the early onset of the ablation period and for 75 %–85 % to the more intense melt over the summer period, with similar contributions of these two aspects across the glaciers in the different basins (Fig. 3b). The day of maximum cumulative daily mass balance (stratigraphic winter mass balance), was reached 1–3 weeks earlier in 2022 than in the reference period (not shown). The ablation season ended for approximately half of the glaciers (661/1400) not later than during the reference period. For the other half, the melt season of 2022 ended 1–4 weeks later than during the reference period. Compared to the other two processes, the prolongation of the ablation season into autumn contributed only marginally to the extra glacier melt in 2022 for some glaciers in the Rhine and Danube basins.
Due to the limited snow accumulation, most of the total glacier melt in 2022 was imbalanced. Glaciers in the Po and Danube basins had the highest share of imbalanced melt contributions (Fig. 3c). Melt turned from balanced to imbalanced conditions between mid-June and mid-July. This point was reached slightly earlier for glaciers in the Danube and Po basins and some glaciers in the Rhone basin, followed by the majority of the glaciers in the Rhone and the Rhine basin (not shown). During the reference period the same point would occur for most glaciers in the first half of August. This is approximately 40 to 60 d later than in 2022.
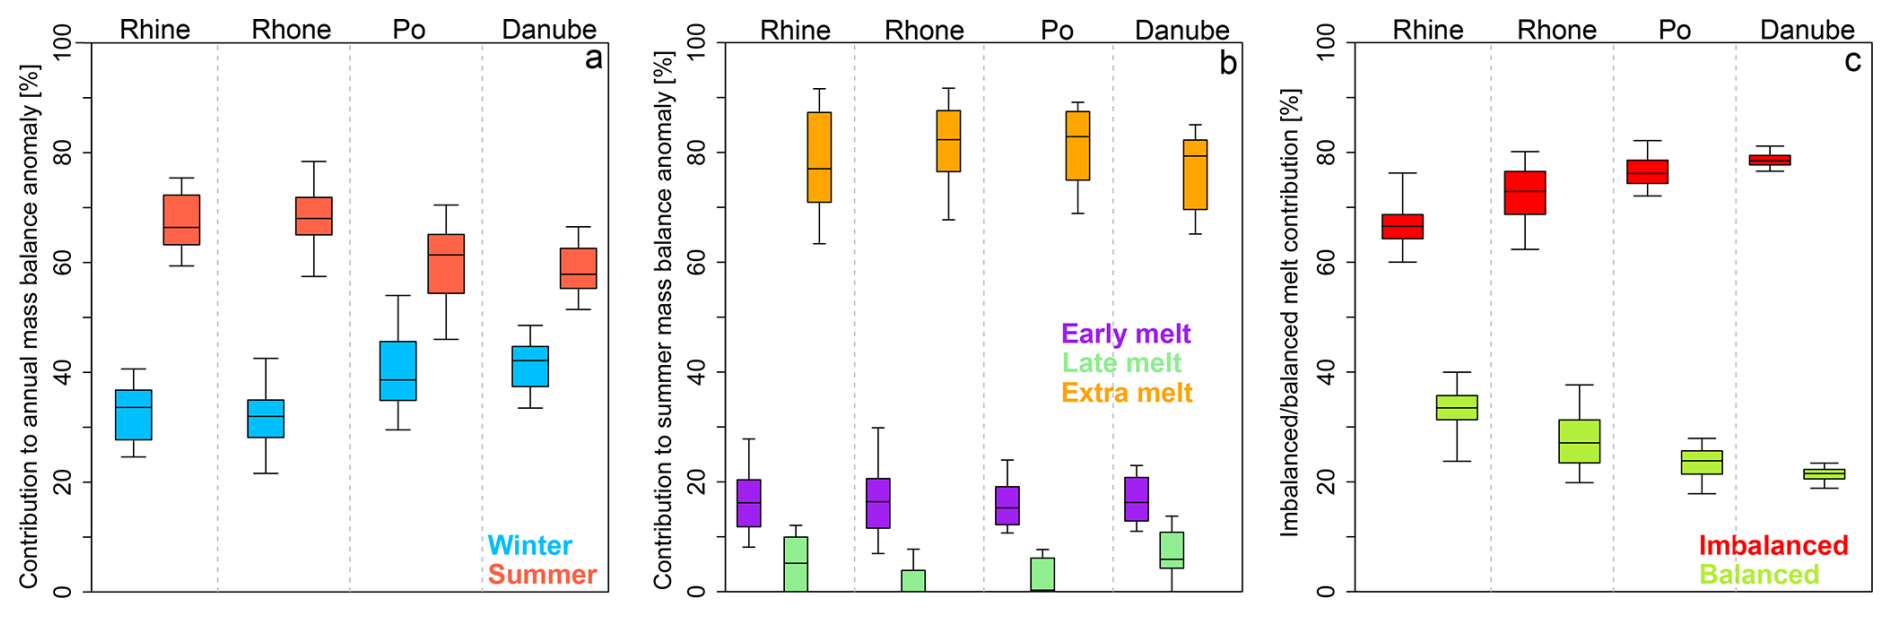
Figure 3Attribution of extreme glacier volume change in 2022 to its mass balance components for all Swiss glaciers. (a) Contribution of summer (ΔBs) and winter mass balances (ΔBw) anomalies to the annual mass balance anomaly ΔBa, (b) Contributions of the early onset of the melt season, late ending of the melt season and the intensity of the melt season to ΔBs. For the “late ending”, some of the boxplot percentiles were zero, because the melt season did not last longer than during the reference period, (c) Partitioning of total glacier meltwater volume into balanced and imbalanced melt. Each box-plot includes all glaciers in the respective main river basin.
5.2 Attribution of 2022 streamflow anomalies
During 2022, the downstream reaches of the main river basins were severely affected by the dry and hot conditions (Figs. S6 and S7), resulting in a hydrological drought. For most catchments, streamflow showed large deficits (variable “Q” in Fig. 4). The largest absolute deficits were reached for catchments in the Po, Rhone and Rhine basins with glacierization <5 %. In relative terms, anomalies reached up to more than 40 % annually and up to 60 % during the summer (Fig. S9). Over the summer, absolute streamflow deficits were smaller than the annual anomalies, while summer streamflow surpluses in highly glacierized catchments were larger. The streamflow anomalies changed sign with increasing level of glacierization in the Rhine and Rhone basins, in which catchments span the full range of glacierization (Fig. 4). The absolute values, instead of the anomalies, of the various water balance components in 2022 are shown in Fig. S10.
To explain the streamflow anomalies, we need to analyze the anomalies in the other water balance terms. Precipitation and the glacier net storage change (variable “P” and “G” in Fig. 4) anomalies are the largest in magnitude, but with opposite signs. For snowmelt (variable “S” in Fig. 4), only the non-glacierized area was considered and therefore the absolute anomalies are smaller, especially for catchments with high glacierization. During summer, the lack of precipitation (rainfall) and the snowmelt deficit of the non-glacierized area contributed approximately equally to the water deficit for most catchments. The surplus glacier net storage change counterbalanced the deficits in rainfall and snowmelt. The glacier net storage change anomalies were larger at the annual scale than for the summer, especially in the Rhone and Danube basin. This difference is opposite to the absolute glacier net storage change value (not the anomaly), which is larger in summer (mostly ablation) than over the year (net effect of accumulation and ablation). The lack of snow, in addition to the high melt, caused these larger anomalies at the annual scale than for the summer. The catchment scale net glacier storage change anomalies (surpluses) increase with increasing glacierization. The smallest anomaly term, both absolute and relative, is the evapotranspiration anomaly (variable “ET” in Fig. 4). For catchments in the Rhone basin the ET anomaly was negative, as opposed to the other catchments, indicating a water-limited situation in this part of Switzerland.
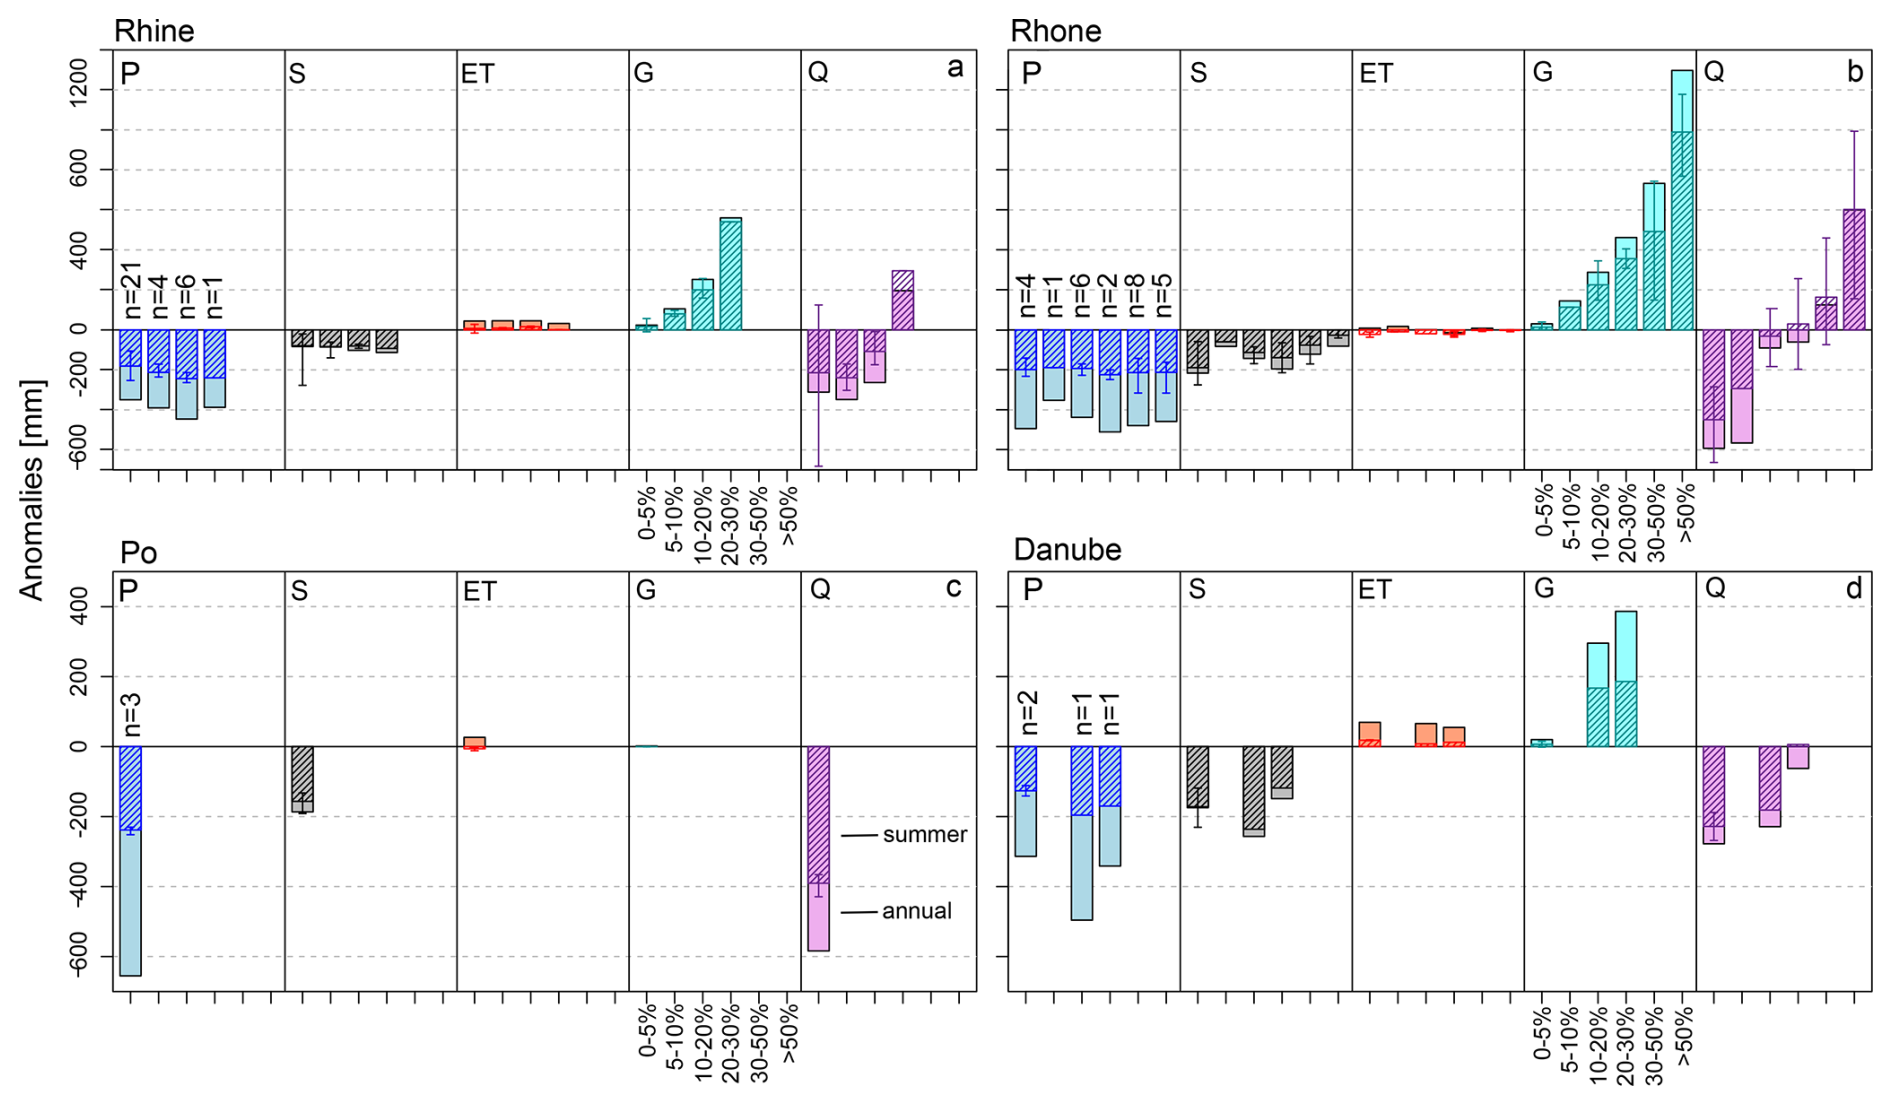
Figure 4Water balance anomalies in 2022, based on the reference period 1991–2020, specified for catchments with different glacierization. Within each of the four main basins, anomalies are shown for: (1) total catchment precipitation P, (2) snowmelt S from non-glacierized catchment areas, (S is part of P at the annual scale), (3) Evapotranspiration ET, (4) Glacier storage change G (net storage change over the year or summer) and (5) streamflow Q. Anomalies are aggregated by catchment glacierization classes (indicated below the variable G). n is the number of catchments within each glacierization class. The filled bars indicate the annual anomalies (October–September) while the dashed bars show the summer anomalies (May–August). Whiskers show the range for summer anomalies. All variables are expressed in mm with respect to the entire catchment.
5.3 Glacier compensation effects and contributions to streamflow
The large glacier melt anomalies of 2022 could (partly) compensate for the lack of precipitation and snowmelt, as well as for the extra evapotranspiration. The degree of this compensation depends on the level of glacierization (Fig. 5). At the annual scale, in catchments with around 25 % glacierization the extra glacier melt could fully compensate the deficits in the other water balance terms (L=100 %), while in summer this full compensation already occurs for catchments with 15 %–20 % glacier coverage (Fig. 5). For catchments with higher glacierizations, resulting in L>100 %, the excess glacier melt overcompensated the negative anomalies in precipitation, snowmelt and evapotranspiration, leading to positive anomalies in streamflow. A 50 % compensation of the water deficits occurred for catchments with a glacierization of 15 %–20 % (10 %–15 %) at the annual (summer) level. Even for catchments with only a few percent glacier cover (1 %–5 %), the extra glacier melt could still alleviate the impact of the deficits by around 10 %. The addition of the water balance anomaly rest term ϵ (difference between the ΔQ and the sum of ΔP, ΔS, Δ ET and ΔG) leads mostly to a higher compensation level for catchments with low glacierization, and vice versa. This may suggest that water transfers from the highly glacierized catchments to other regions, included in the larger low glacierized catchments play an additional role in the catchment compensation processes. Alternatively, uncertainties in water balance anomalies may differ up- to downstream.
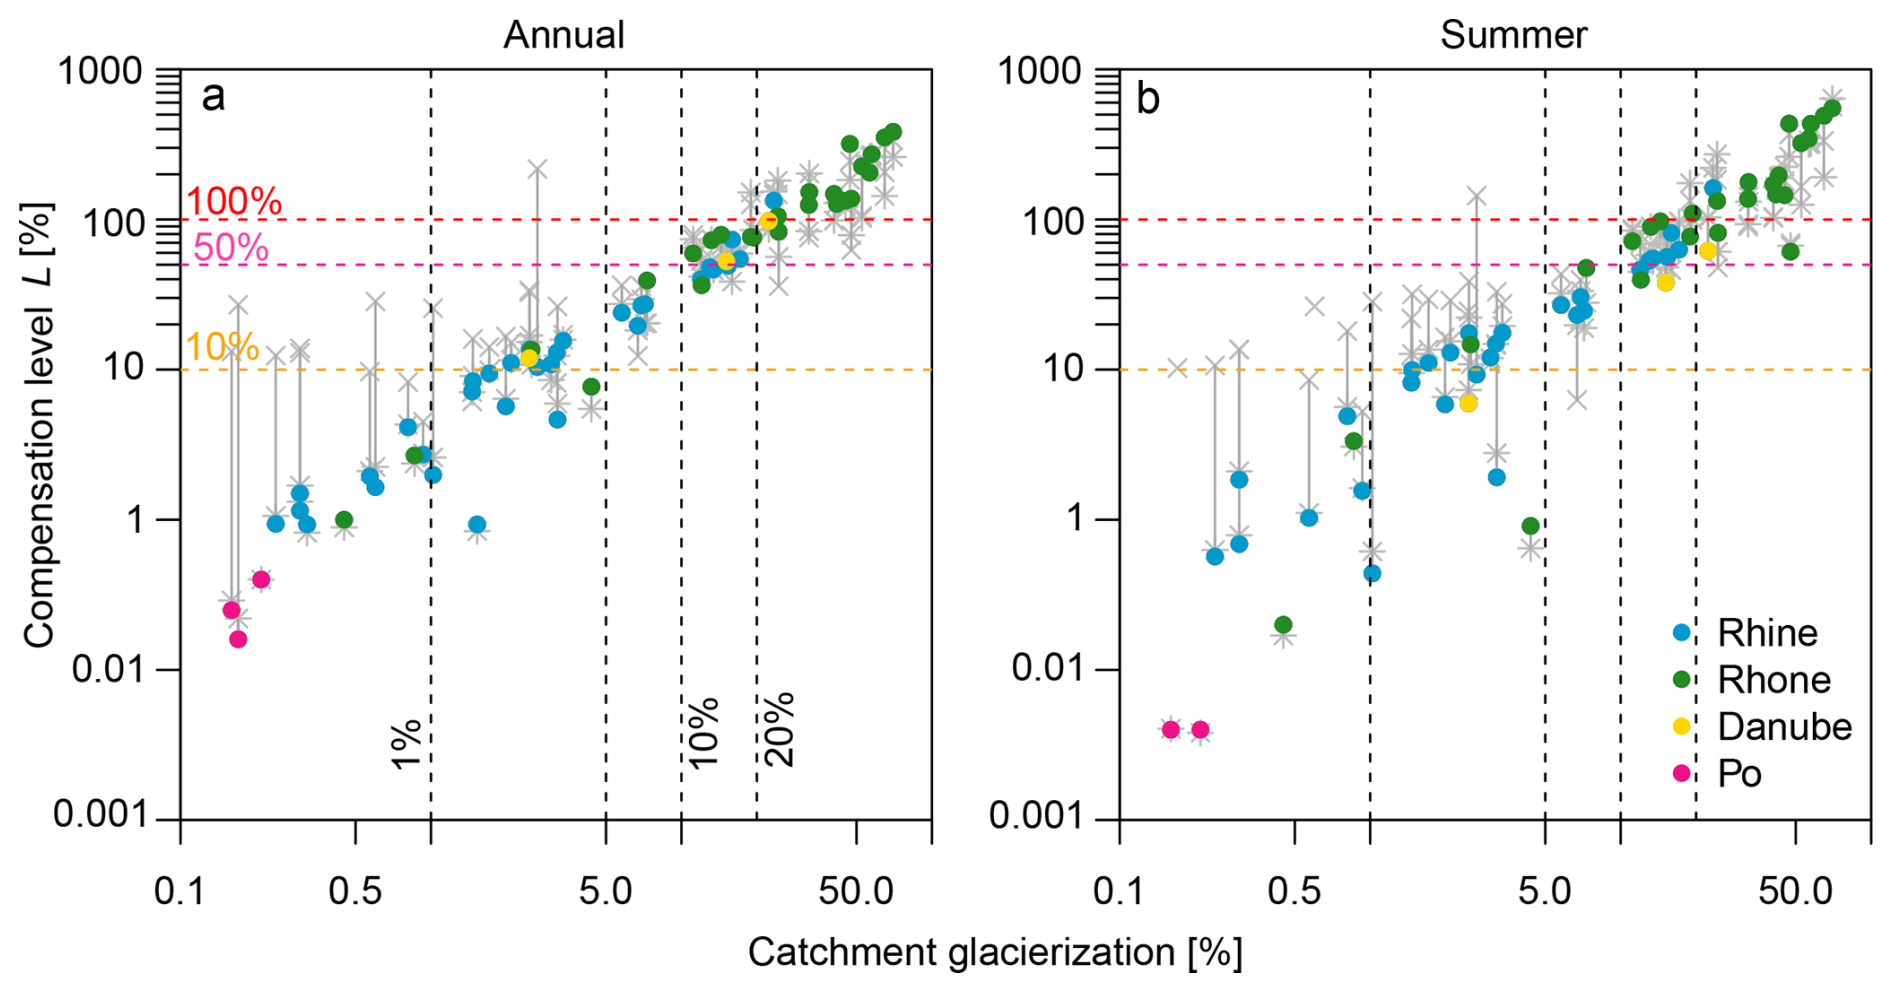
Figure 5Glacier compensation level L against glacierization for annual (a) and summer (MJJA; b) periods. The gray bars indicate the range of uncertainty in L due to non-closing water balance anomalies of some catchments. Since the uncertain term in the water balance is not known, the crosses indicate the water balance anomaly rest-term added to glacier surplus term, and the asterisk indicate L when the rest term is added to deficit terms (Sect. 4.3). Note that x- and y-axis are logarithmic, distorting the scale of the uncertainty ranges (Fig. S12 shows the plot without logarithmic y-axis).
The anomalous glacier melt in combination with the precipitation deficits of 2022 resulted in much higher relative glacier melt contributions to streamflow compared to the reference period (Fig. 6a–c). At the annual scale, imbalanced glacier melt contributed between a few percent up to 60 %–80 % of annual streamflow volumes (Fig. 6a). This imbalanced glacier melt is the part of the water supply that would be lost when glaciers have disappeared. In summer, relative contributions of glacier melt were even higher, up to almost 100 % of the summer streamflow for some catchments (Fig. 6c). In particular, summer glacier melt contributions are disproportionally higher per unit of glacier cover for catchments with <10 % glacierization (Fig. S11). The reason for the exponential relationship between catchment glacierization and relative glacier melt, especially during dry years, is not completely clear. It may relate to changing climatological gradients with elevations or to the cluster of highly glacierized catchments that are all located in the drier Rhone basin.
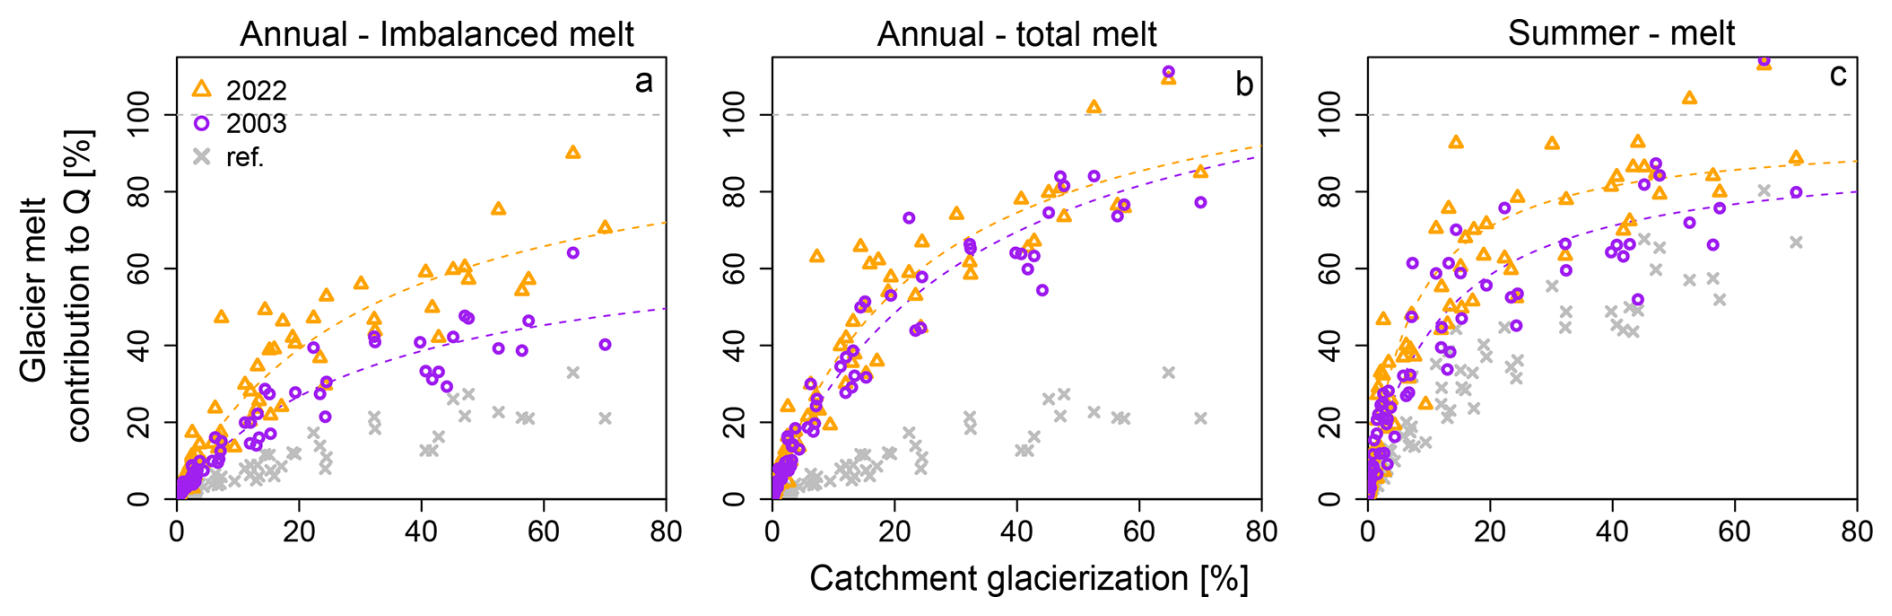
Figure 6Glacier storage change contribution to streamflow in 2022, 2003 and during the reference period (1991–2020) for imbalance melt at the annual scale (a), for total melt at the annual scale (b) and for melt during summer (MJJA) (c). The dashed line shows an exponential fit between catchment glacierization and glacier melt contribution to streamflow.
5.4 Extreme melt of 2022 in a long-term perspective
5.4.1 Past extremes
2022 was a record year regarding annual and summer glacier specific mass balance (Table 4, columns 2 and 4) in the >100-year series of observation-based glacier mass balances for Switzerland. At the Swiss scale, only 1947 comes close to the extreme of 2022 in terms of annual glacier mass balance (Fig. 7, row 2). In terms of meltwater volumes, the ranking of extreme years shifts, with 2022 no longer being the most extreme year (Table 4, columns 5–6, Fig. 7, row 3). Over time, the area of Swiss glaciers changed considerably (Table 4). Thus, the larger glacierized areas in the extreme years 1921, 1928 and 1947 resulted in substantially higher glacier meltwater volumes than in 1998, 2003, 2018 and 2022, especially in terms of total meltwater volumes, as opposed to net meltwater (mass loss) volumes.
Zooming in to the more recent extreme years (1998, 2003, 2018 and 2022), 2022 had the highest annual net volume loss (Ma). However, the total glacier melt volume in 2022 was smaller than in 2003, despite higher specific melt (Mt, Table 4, and Fig. 7 column 1, row 3). This shows that the ongoing glacier retreat (21 % reduction in glacier area between 2003–2022) dominated the difference in meltwater volume responses to the extreme years of 2003 and 2022, at the Swiss-wide scale and for the four large basins, which has important hydrological implications for summer water supply (Fig. 7 rows 2–3). At the scale of individual months, July 2022 still showed highest meltwater volumes, for all glaciers together, and for the Rhine and Rhone basins (Fig. 7, column 3, row 2–3).
In terms of streamflow, the annual minimum flow of 2022 had never been that low at the outlets of the four basins, but for the Rhone basin (Table 4, columns 7–10). Annual, June, July and August streamflow sums were lowest in 2022 (Po and Danube) or comparable to the extreme of 1921 (Rhine and Rhone) when comparing to the set of extreme years, (filled triangles for the basin outlet, filled circles for the average of the long-term stations, Fig. 7, rows 4–7).
The pattern of streamflow variations across these extreme years resembles mostly the fluctuations in meltwater volumes, especially in the Rhine and Rhone basins, but precipitation deficits play an important role too. Around 1950, the construction of big reservoirs started. It is difficult to distinguish the effect of these reservoirs on streamflow during extreme years, as the earlier years (1921, 1928, and 1947) and later years (1998, 2003, 2018, 2022) were also characterized by very different amounts of meltwater volumes. One catchment in the Rhine basin with long-term data can be classified as natural (square in Fig. 7, row 4), thus without reservoir influence. This catchment shows that streamflow follows fluctuations in meltwater volumes, but in 1947 (Annual and June) and 2022 (Annual, June, July and August), precipitation deficits were dominating.
Relative glacier meltwater contributions to streamflow were among the highest in 2022, in particular when comparing the more recent extreme years (Fig. 7, rows 4–7, open symbols). In the Rhone and Rhine basins, relative glacier meltwater contributions to streamflow were among the highest in July 2022, with around 20 % for the Rhine at Basel, and close to 100 % for the Rhone at Porte du Scex. These contributions strongly diminish at the annual scale (5 %), but are still substantial for the Rhone basin (40 %). The relatively constant or increasing relative contributions underscore how the absence of other water sources enhances the importance of glaciers, highlighting their continued role during droughts even as overall meltwater volumes decline.
Table 4Glaciological and hydrological characteristics of selected extreme years, referring to the hydrological year (October–September). Ag is the glacier area, Ba, Bw and Bs the annual, winter and summer mass balances (m w.e.), respectively, for the fixed system. Ma is the corresponding net meltwater volume and Mt the total meltwater volume (km3 w.e.), taken as the sum of all daily negative storage changes. The last four columns indicate the 7 d average lowest flow (NMQ7) at the outlet of the four main basins (Fig. 1), with in brackets the date of occurrence (d-m) and the rank for that day (rx).
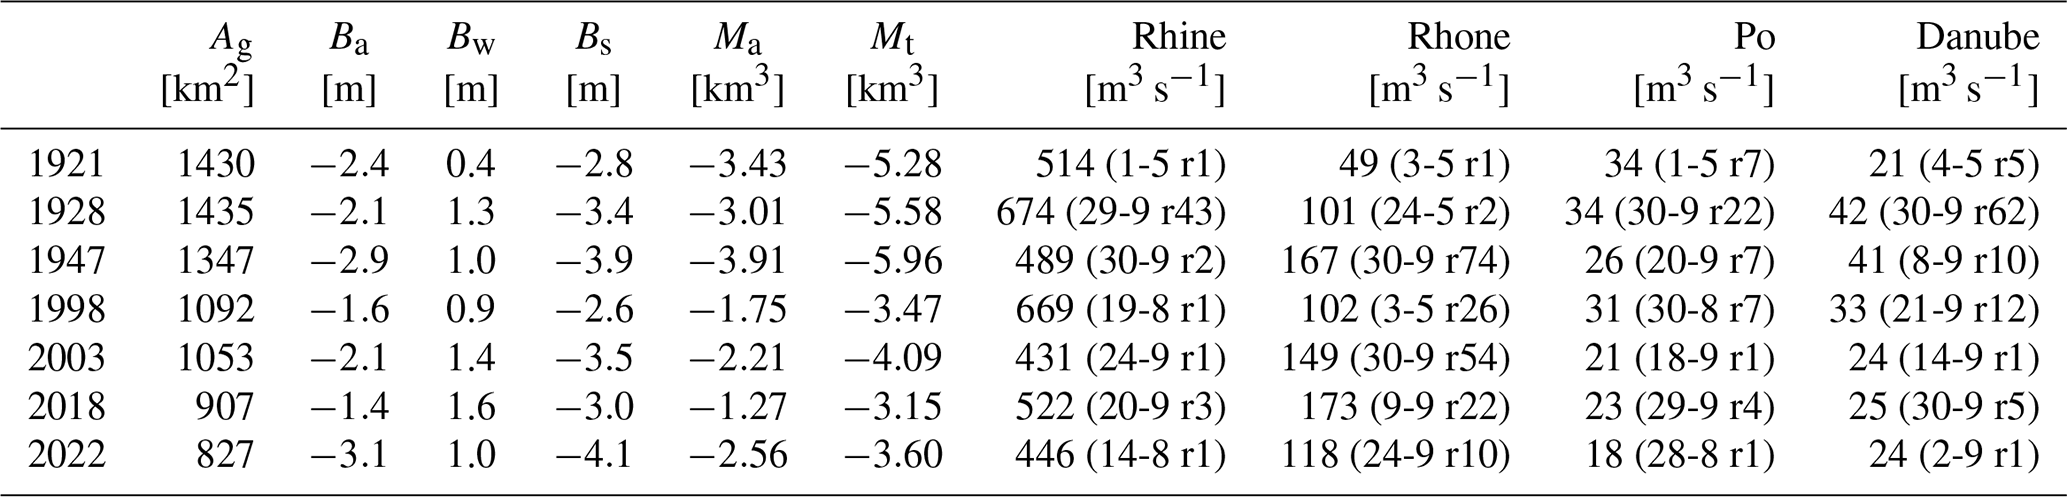
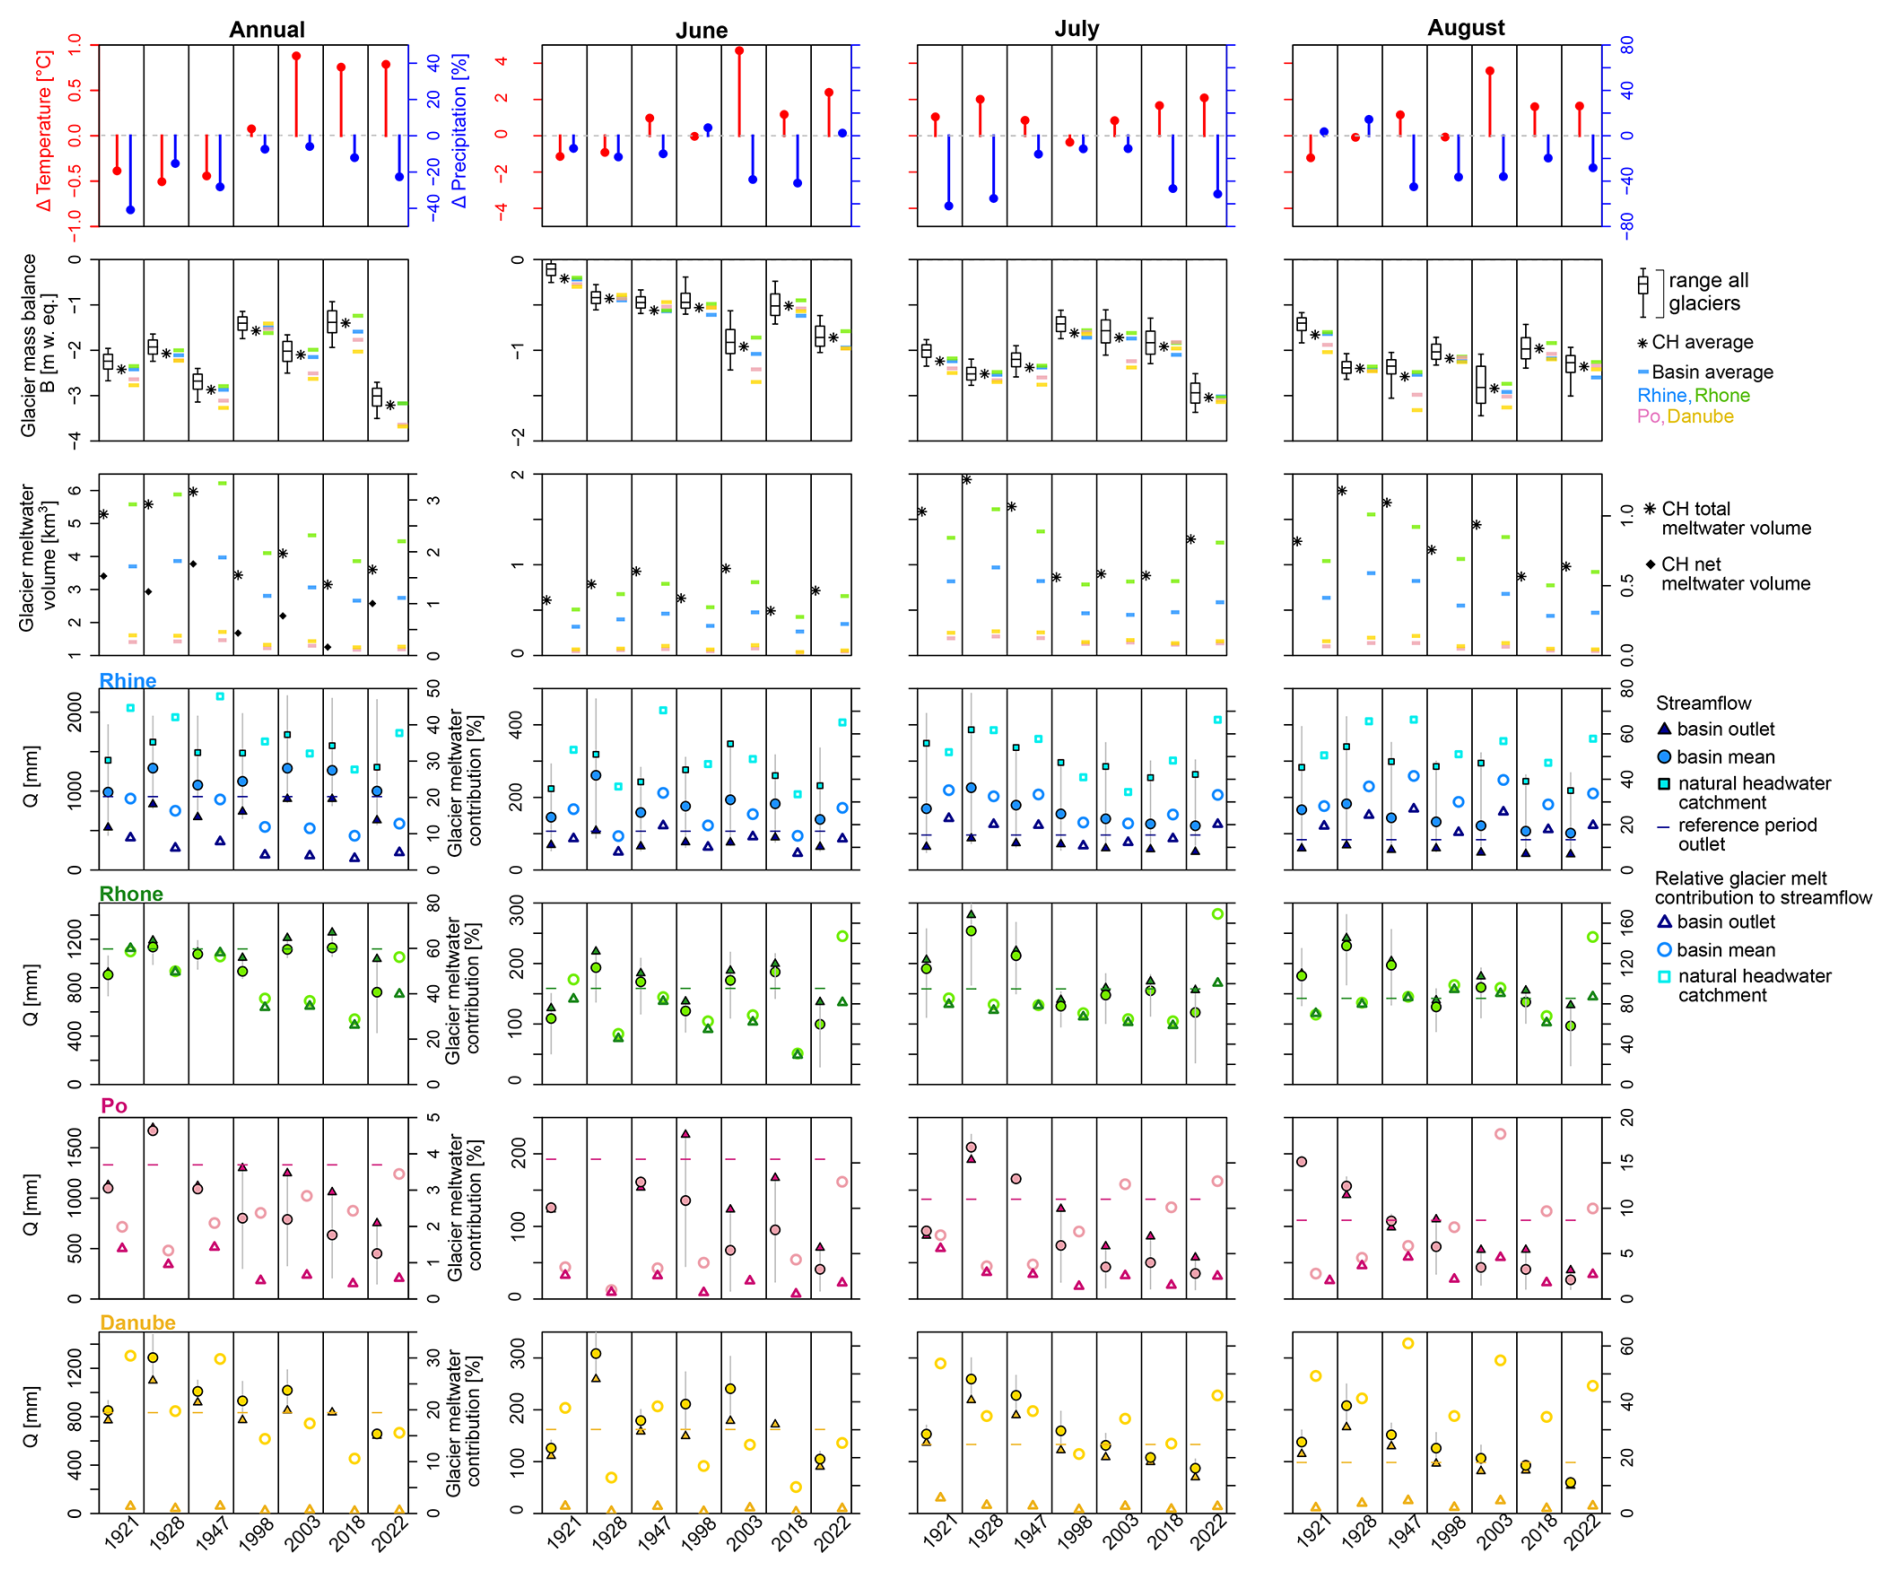
Figure 7Comparison of meteorological, glaciological and hydrological conditions for glacio-hydrological extreme years (1921, 1928, 1947, 1998, 2003, 2018, 2022). The columns indicate different aggregation periods: annual and monthly (June, July, August), while the rows indicate different variables: temperature and precipitation anomalies (row 1), glacier specific mass balance (row 2), glacier meltwater volumes (row 3), streamflow (row 4–7), relative glacier meltwater contributions to streamflow (row 4–7). In each panel, the columns refer to the different extreme years. Note the double y-axes for row 3–7. The right y-axes in row 3 refers to the basin volumes, whereas the left y-axis refers to the Swiss-wide volumes.
5.5 Comparison of extreme year 2022 with extreme 2003
To analyze the possible decline of glacier meltwater supply (i.e. the declining phase of glacier peak water) during extreme years and its downstream consequences in space, we compared 2003 and 2022 for each catchment. These two years are most similar in terms of negative glacier mass balance, and many catchments have data availability going back to 2003 (76). We zoomed in to July, as this reflects a period of meltwater supply, and during July 2022, the melt conditions were more extreme than in 2003 (Fig. 7, column 3, row 2), but the glacier area was significantly smaller than in 2003 (21 % smaller).
In July 2022, positive degree-day sums and the specific glacier mass balance were higher/more negative than in 2003 for almost all catchments (“T” and “B” in Fig. 8, in 75 of the 76 considered basins). However, only in most of the Rhone basin and parts of the Rhine basin (the western part, Aare sub-basin), this led to higher glacier meltwater volumes (48 of the 76 catchments) (“G” in Fig. 8). Even though meltwater volumes were higher here, not everywhere this led to higher streamflow volumes (“Q” in Fig. 8). Only in 13 of the 76 catchments both streamflow and meltwater volume was higher in July 2022 than in 2003. Thus only in 30 % of the catchments more meltwater resulted in higher streamflow (13 of the 48 with higher meltwater volumes). In all the other catchments (35 of the 48 catchments), the higher meltwater volumes could likely not compensate for the higher precipitation deficits and less snowmelt (“S”) in 2022 compared to 2003, resulting in less streamflow. Alternatively, for catchments downstream of reservoirs, more water may have been stored in the reservoirs in 2022 than in 2003, for which no data is available.
Over the summer period (MJJA), only 20 of the 76 catchments showed higher glacier meltwater volumes in 2022 than in 2003, despite more negative glacier mass balances for most of the catchments (62 of the 76 catchments) (Fig. S13). This translates to 68 % (42 of the 62 catchments with stronger melt rates) of the catchments showing a declining meltwater supply in summer, despite higher melt rates. In the remaining catchments (located in the eastern part of Switzerland, 14 of the 76 catchments), 2003 was more extreme in terms of glacier melt conditions than 2022. Streamflow was lower in summer 2022 than in summer 2003 almost everywhere, despite higher precipitation in 2022 for around half of the catchments. This highlights the complex interaction of glacier melt (less in 2022 in most catchments), snowmelt (less in all catchments), rainfall (less in half of the catchments) and evapotranspiration (more in approx. of the catchments) that all contribute to runoff generation, but in varying proportions from up- to downstream. The combination of higher glacier meltwater volumes for some catchments and lower streamflow in 2022 compared to 2003 led to overall higher relative glacier melt contributions to streamflow (Fig. 6c).
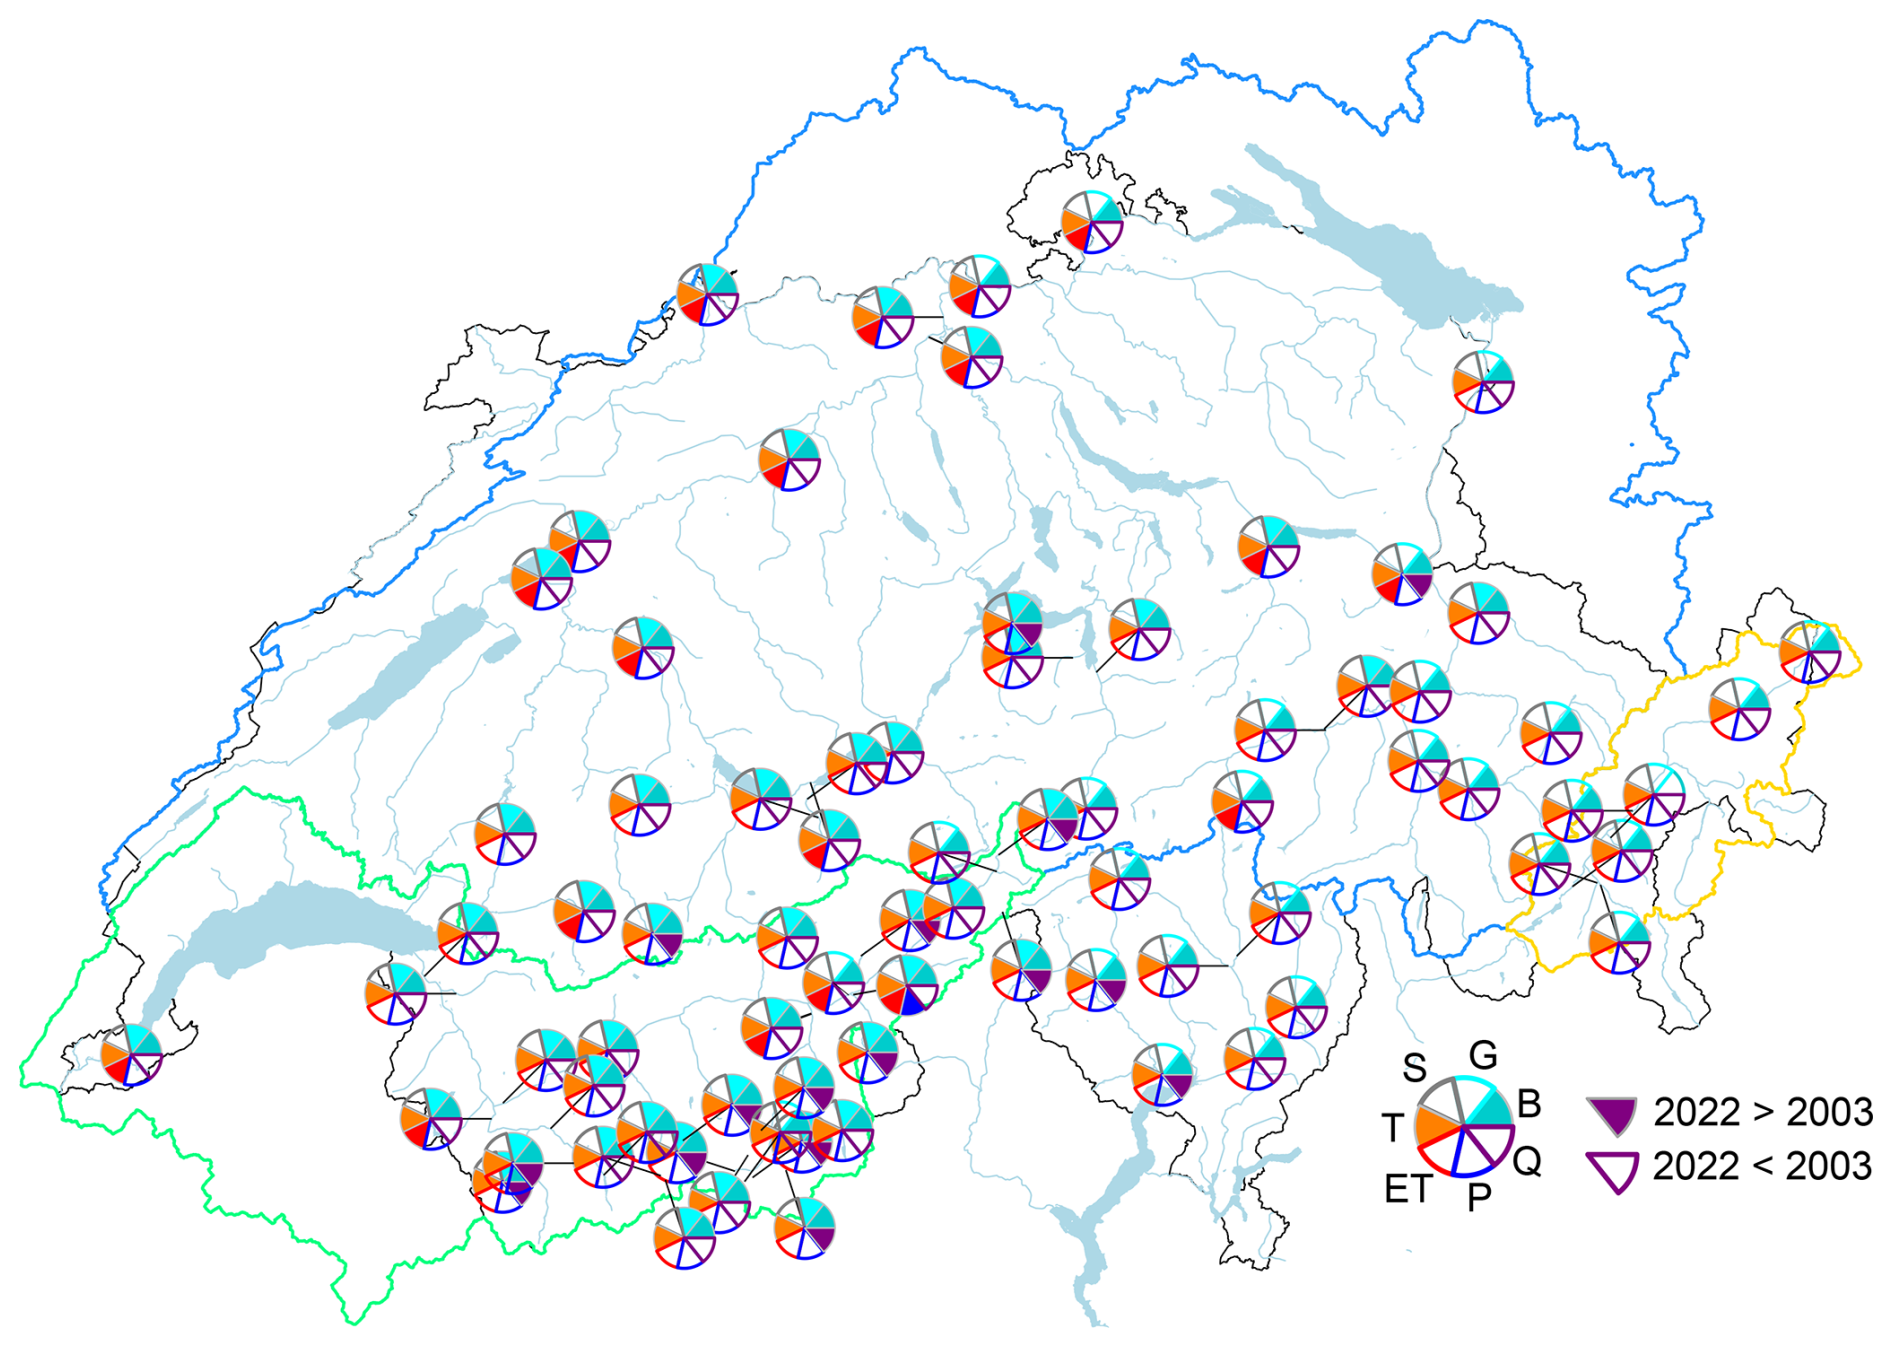
Figure 8Comparison of glacio-hydrological variables between July 2003 and July 2022 for each catchment (76 catchments). Closed pie parts indicate that a given variable was higher (more (melt) water or warmer) in 2022 than in 2003, and vice versa for the open pie parts. T refers to the positive degree day sum, S to the change in SWE as proxy for snowmelt, G to the glacier meltwater volume, B the specific glacier melt rate (mass balance), and ET, P, and Q refer to the sum of evapotranspiration, precipitation and streamflow, respectively. Plots for June, August and summer (MJJA) can be found in the Supplement (Fig. S13).
5.5.1 Changing glacier sensitivity
At the scale of Switzerland, across the four major basins and for the individual catchment level, results indicate a decline in total glacier meltwater supply, with some local and regional exceptions, as well as an exception during the particularly extreme month of July 2022 (Table 4, Figs. 7 and S8). To analyze the causes of this spatial variability, we analyzed the changing sensitivity (Θ), here expressed as the glacier meltwater supply volume per unit of temperature, for all glaciers over 1961–2022 (Fig. 9).
Years with common high Θ across all glaciers, 1983, 1991 and 2003, corresponded to years with more negative summer mass balances than the reference period average. After 2003, most glaciers smaller than 0.1 km2 did not show a high Θ value anymore, also not in 2022. For larger glaciers, especially >10 km2 2022 still had a high sensitivity, meaning they responded to the unusually high temperatures with high meltwater volumes.
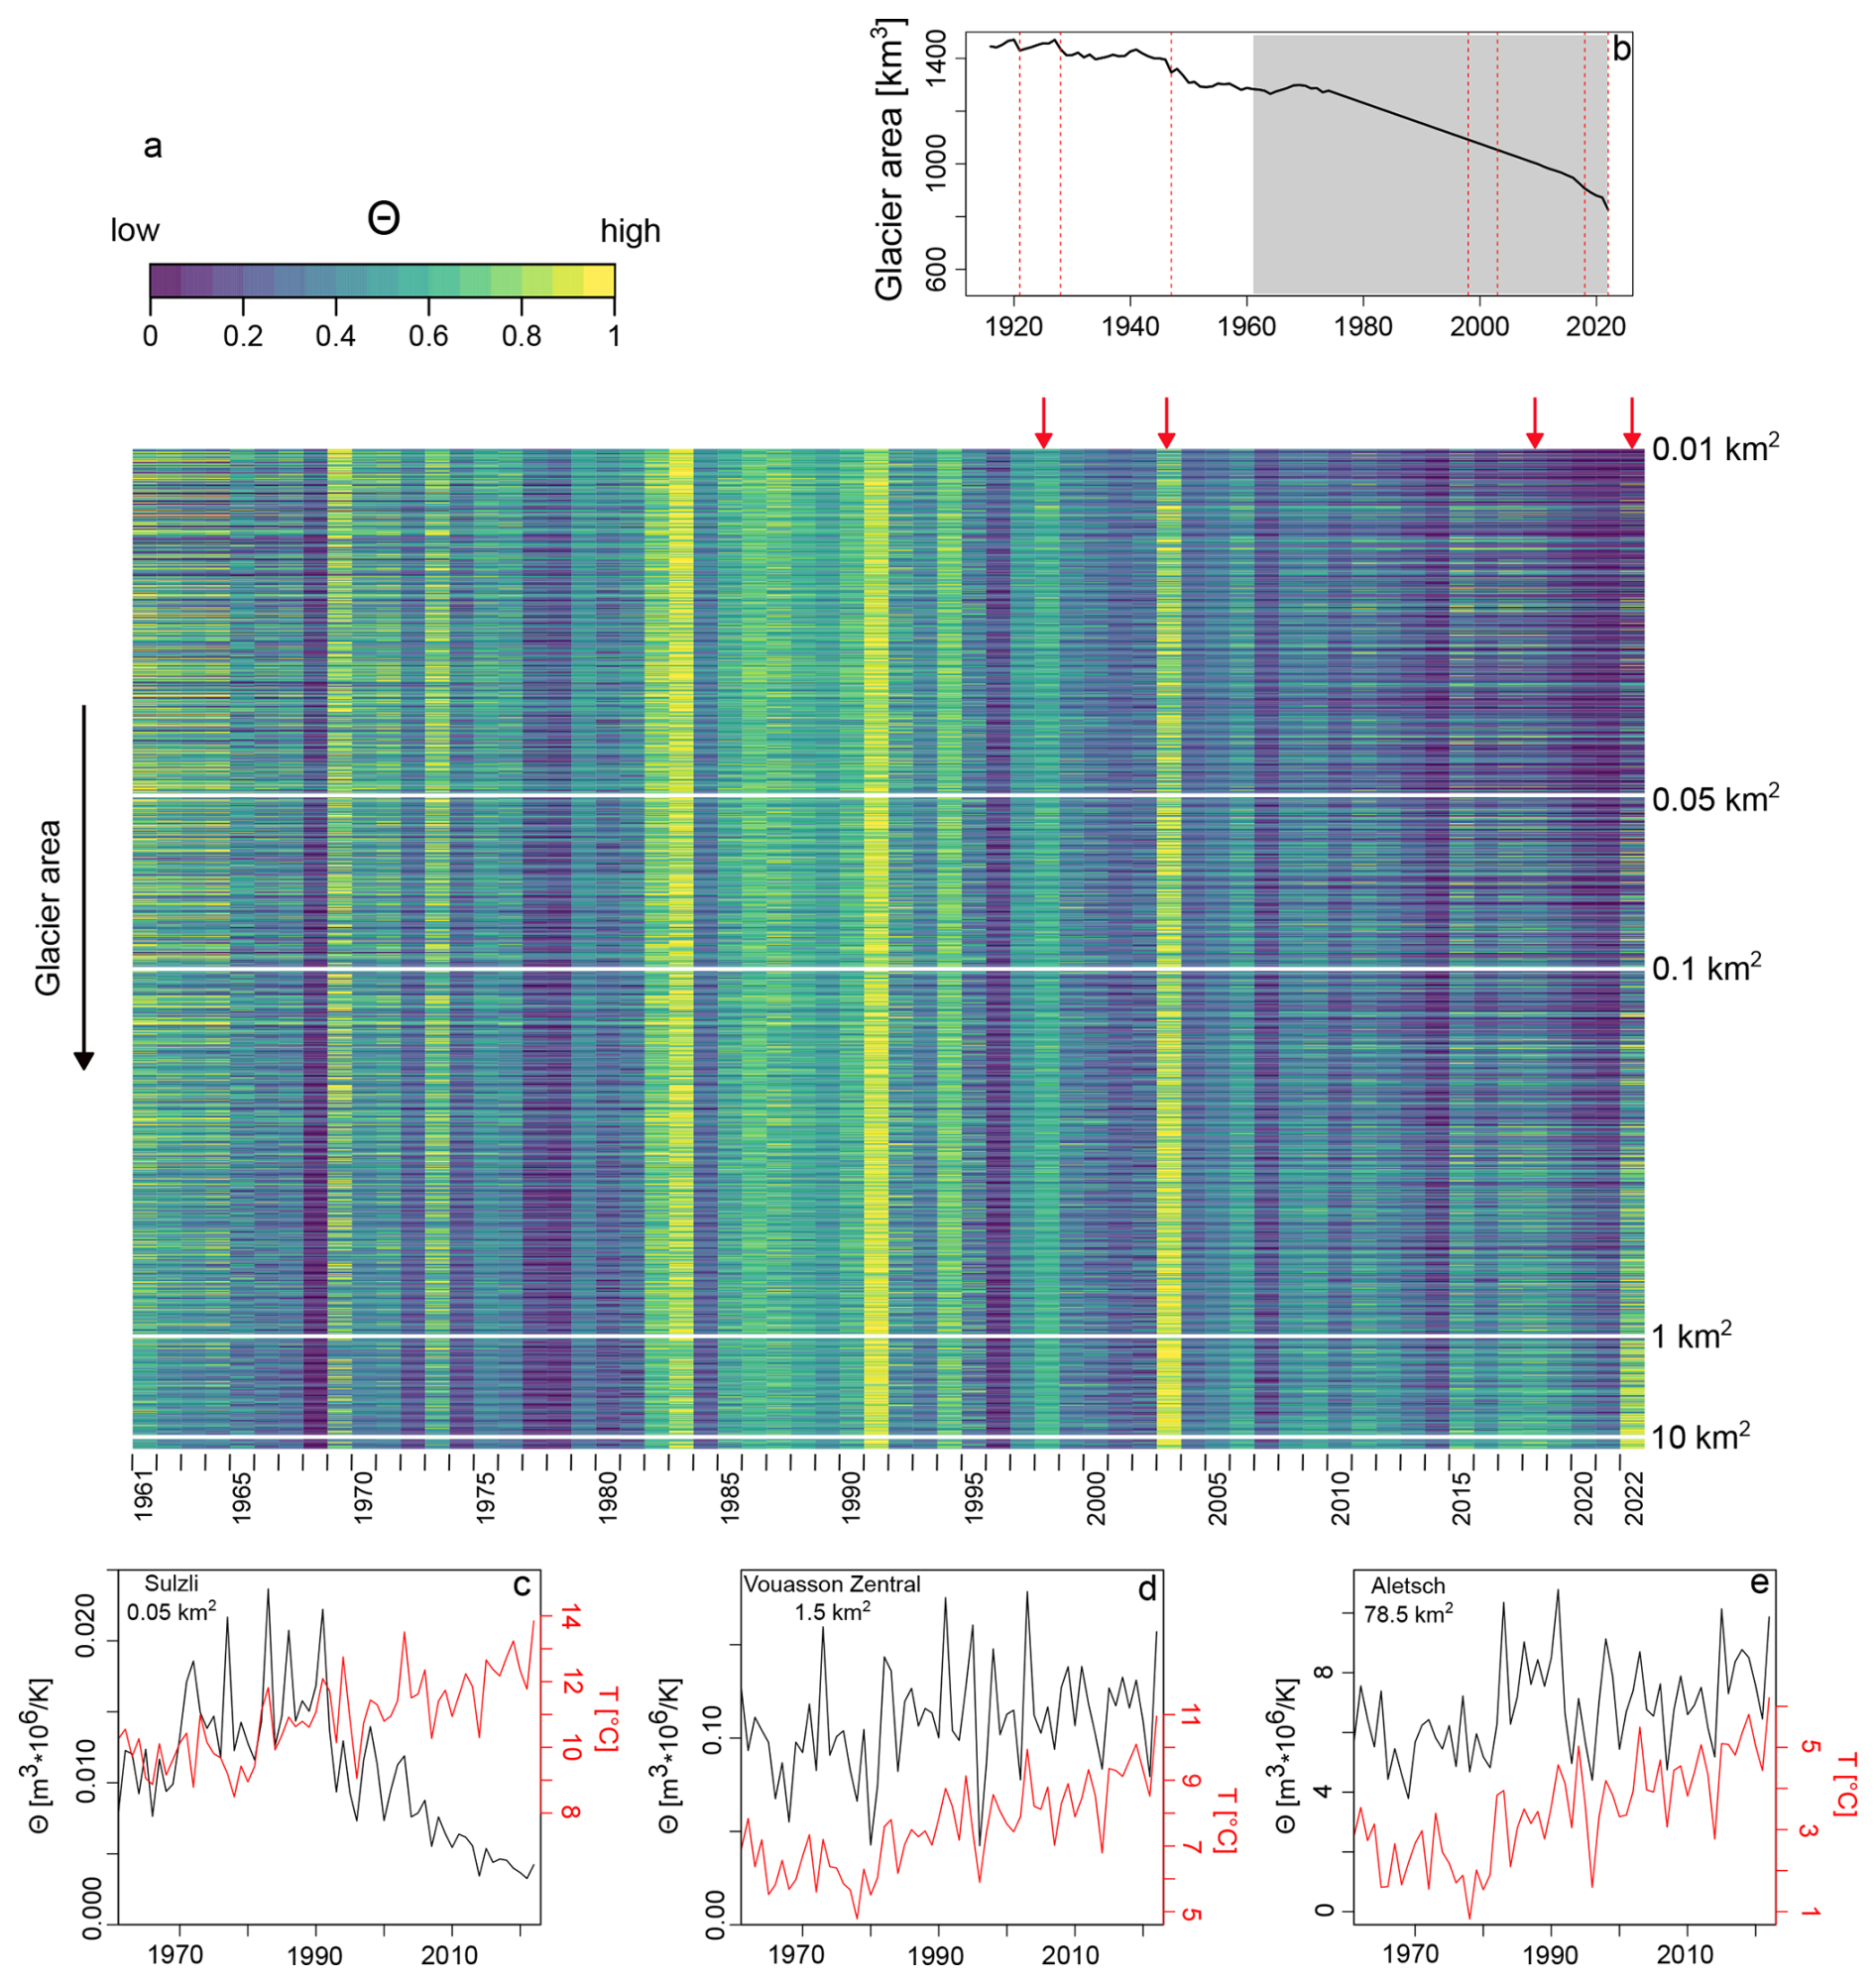
Figure 9Time series of normalized glacier melt sensitivity (Θ) for each glacier and the period 1961–2022, sorted by glacier area (a). The red arrows indicate the extreme years 1998, 2003, 2018 and 2022. Panel (b) shows the evolution of the total glacier area in Switzerland over time, with in gray the period covered by the sensitivity metric of panel (a). Panels (c)–(e) show examples of individual glaciers with Θ in black and temperature in red, with Sulzli glacier located in the eastern part of the Rhine basin, Vouasson glacier in the southern part of the Rhone basin and Aletsch in the northeastern part of the Rhone basin.
In 2022, the large glaciers thus still responded to the extreme melt conditions with large meltwater volumes. Coming back to the 2003 comparison, around 30 % (40 %) of the 1400 Swiss glaciers had larger annual total (net) meltwater volumes in 2022 than in 2003. For the glaciers larger than 10 km2 (19 glaciers), 33 % of them showed higher total meltwater volumes in 2022, whereas all of them showed higher net meltwater volumes. For glaciers between 1–10 km2 (141 glaciers), 30 % (75 %) had higher total (net) meltwater volumes, which further reduced to 30 % (45 %) and 2 % (15 %) for glacier size classes 0.1–1 km2 (514 glaciers) and 0.05–0.1 km2 (242 glaciers), respectively. Since many of the larger glaciers are located in the Rhone basin and western part of the Rhine basin, this explains the generally higher meltwater volumes generated in 2022 relative to 2003 in these basins and their sub-catchments.
6.1 The changing importance of glacier melt during drought
The analyses have shown that glaciers played a crucial role in sustaining downstream water supply during the extreme warm and dry year of 2022 in Switzerland. This confirms findings of earlier studies, showing for example that the imbalanced melt contribution of glaciers was relevant for reservoir filling during the Megadrought in Chile (McCarthy et al., 2022a), or that the importance of glacier melt contribution during droughts diminishes downstream in a non-linear way (Huss, 2011; Mastrotheodoros et al., 2020). Despite modest annual glacier melt contributions at downstream locations (for example, at Basel we estimated 0.7 % annually, 4.4 % in summer), glacier melt becomes of notable importance on shorter timescales (Stahl et al., 2016; Van Tiel et al., 2023), with contributions up to 20 % in July and August 2022 at Basel (Fig. 7). The framework presented here allowed us to quantify for the first time the compensation role of glaciers at a regional scale based on observations, providing insights how much glacier meltwater surpluses can counterbalance water deficits due to a lack of rainfall and snowmelt and increased evapotranspiration.
Although glacier melt was still of high importance in 2022 in Switzerland, the role of glaciers during drought is inevitably diminishing due to ongoing atmospheric warming and resulting glacier retreat (Zemp et al., 2015; Hugonnet et al., 2021). The results show declining total meltwater volumes, particularly for small glaciers (Fig. 9), with clear spatial patterns at the catchment scale (Figs. 7 and 8). The various comparisons have shown that it is important to make the distinction between net annual meltwater volumes (mass losses) and total meltwater volumes when investigating a “decreasing glacier meltwater supply”. While the net mass losses were much higher in 2022 than in other recent extreme years, total melt water volumes were lower when aggregating all glaciers. This suggests that the reduction in glacier area has become more dominant than the increase in melt rates. The analyses here focused on specific extreme years, but fit in with longer-term trends (Fig. 10). The Rhine, Danube and Po basins all show a declining trend after 1980 for the total meltwater supply. For the Rhone basin, the slightly lower meltwater volume of 2022 compared to 2003 may be a precursor of an overall declining trend in the next years. The net meltwater volumes still show generally increasing trends in all basins, especially due to the record breaking 2022 year (Fig. 10). The total meltwater volumes are most relevant in a drought buffering context, as it is the meltwater supply of glaciers that drives this role and compensates for the lack of snow accumulation and precipitation during drought and heatwaves in summer. While changes in glacier meltwater supply are an important indicator, our findings show that understanding the role of glaciers during droughts also requires considering other hydrological processes, particularly streamflow dynamics and relative melt contributions. Together, glacier melt and the resulting streamflow determine when and how the importance of glaciers during droughts will significantly diminish.
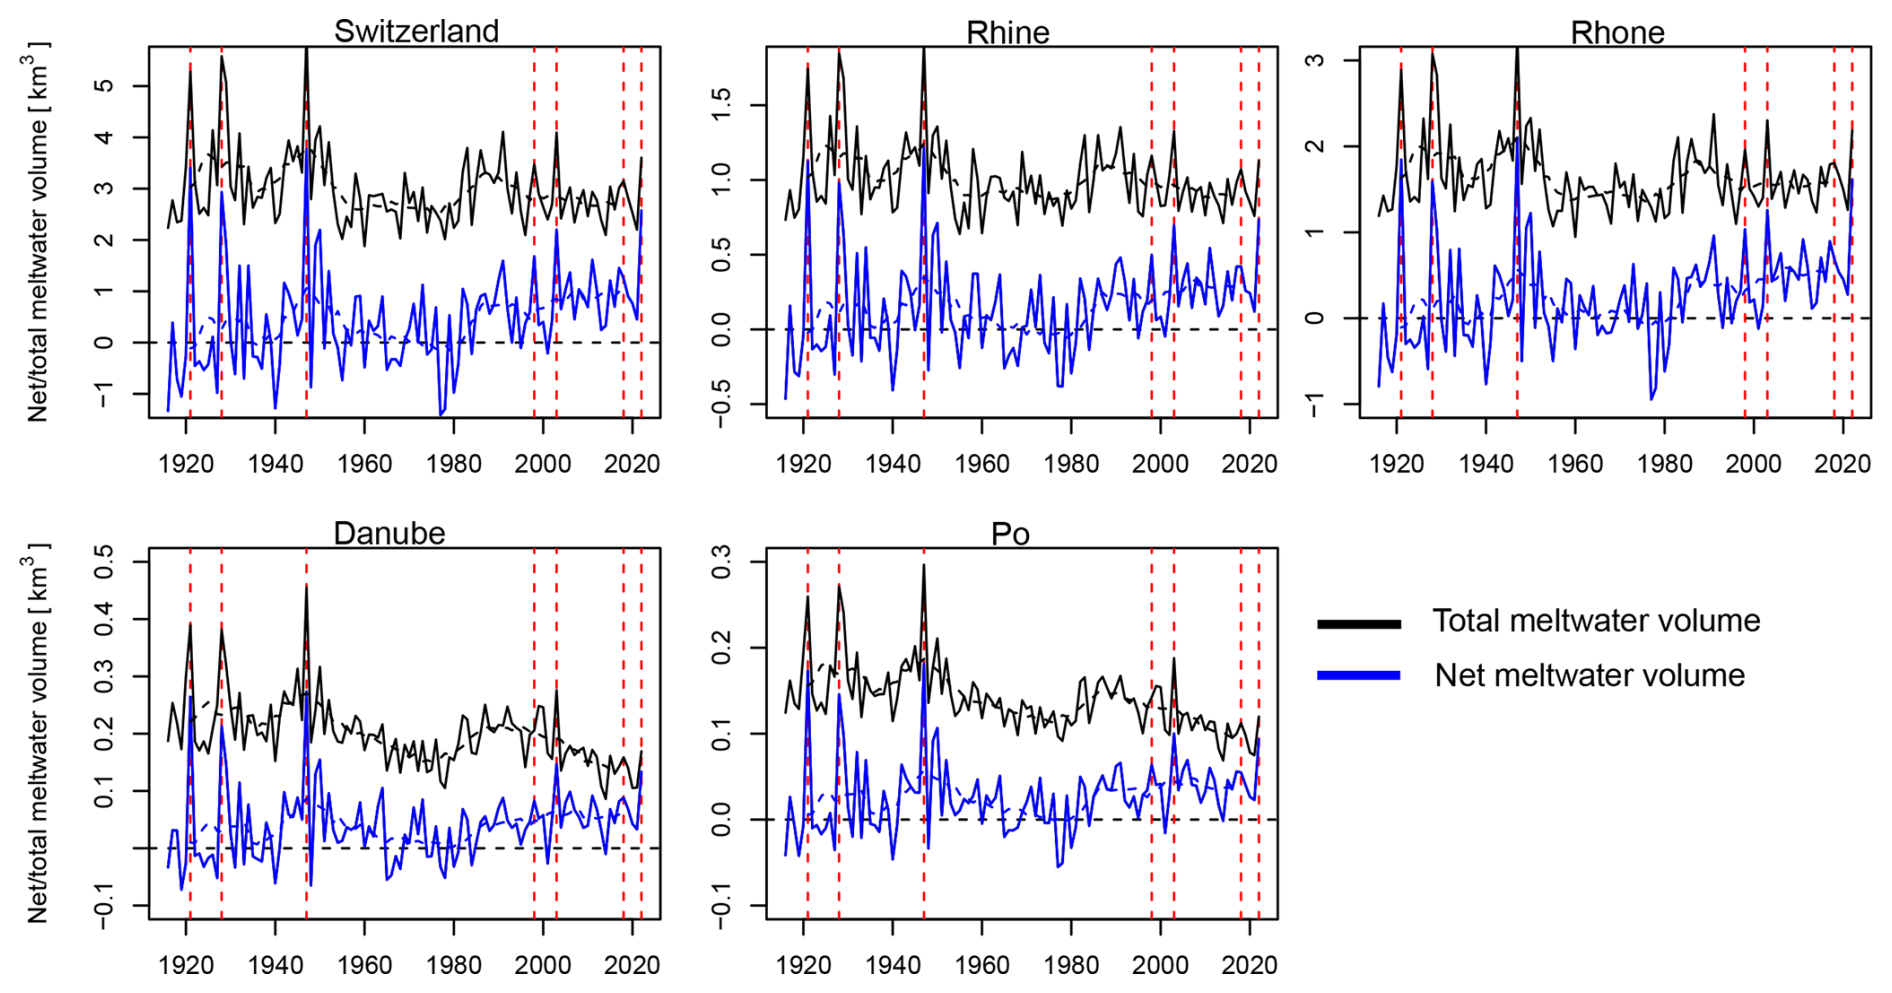
Figure 10Evolution of annual meltwater volumes from 1916–2022 aggregated for Switzerland and the four main basins Rhine, Rhone, Danube and Po. The lines depict net meltwater volumes (annual glacier mass loss) and total meltwater volumes (absolute value of sum of all negative storage changes), with the 11y moving average as dashed line. Negative net meltwater volumes indicate mass gain of the glaciers. Vertical dashed lines indicate the selected extreme years.
Even though we demonstrated the relevance of focusing on extreme years specifically, the comparability of the different extreme years is still challenging. To circumvent the comparability issue, Θ was introduced, which normalized the meltwater volumes to average summer temperatures. However, a changing Θ may not only relate to decreases in glacier area, but also to changes in glacier surface albedo, due to changing snow cover duration or the deposition and accumulation of dust at the surface (e.g. Gabbi et al., 2015). For example, 2022 was characterized by several Saharan dust events, accelerating the snowmelt on- and off the glacierized areas (Réveillet et al., 2022; Abegg and Mayer, 2023). Furthermore, also the thickening of supra-glacial debris (McCarthy et al., 2022b) or changes in shortwave radiation (e.g. Huss et al., 2009) is impacting the relation between air temperature and melt rates. Quantifying the effect of these additional processes would require detailed follow-up studies including energy balance modelling.
6.2 Uncertainty in water balance components
The study combined several data sources and approaches to estimate all terms of the catchment water balance. Because of this combination, the various terms are not necessarily consistent with each other, highlighting the challenges of obtaining data in high mountain terrain or over large regions where water management strategies play a significant role and the need for better observations of these water fluxes.
For precipitation, there is is general tendency of underestimating it at high elevations, due to the lack of meteorological stations there and the orographic effect (Immerzeel et al., 2014). For example Gugerli et al. (2020) showed that precipitation on a few selected Swiss glaciers needed a correction factor between 2.2–3.7 to match on glacier SWE measurements. Here we applied a correction factor for 7 catchments, that we classified as natural, only, to close the water balance for catchments with deviations more than 25 % (Sect. 3). For the other catchments, with a degree of human influence, such a correction cannot be applied as we cannot assess if the non-closure of the water balance comes from a precipitation underestimation or from human influences for which we do not know their magnitudes. Without more insights on the degree of human influence, we thus lose information by having to exclude catchments in some of the analyses. SWE, here used as a potential for snowmelt, experiences similar uncertainties as precipitation. Moreover, by taking changes in SWE as proxy for snowmelt available to streamflow, we neglect sublimation processes and recharge processes to deep groundwater. Evapotranspiration is difficult to measure over large areas and was therefore derived from model simulations. There is only very little information on ET amounts at high elevations, and studies have shown high spatial variability especially under drought conditions (Mastrotheodoros et al., 2020) (Fig. S10).
The non-closing water balance issues could also arise from the glacier storage change estimations. Although the extrapolation procedure was carefully designed and improved in comparison to previous estimates (Huss, 2012; Cremona et al., 2023), the large variability in glacier geometries, the terrain surrounding glaciers, and other local conditions make the extrapolation of measurements on only a few glaciers to 1400 glaciers a challenging task. In particular, there is limited information on the spatial variability of accumulation and ablation processes. Estimations before 1950 are even more uncertain due to the limited amount of glaciers with in-situ observations (Table S2). Figure 10 shows for example much higher inter-annual variability in the first half of the timeseries, which could relate to less data available to extract the year-to-year variability. In addition, the evolution of the glacier area over time is a crucial element for determining the meltwater volumes, but also here only sparse observations in time exist. Whereas model simulations may include more local information than the presented extrapolation procedure, model parameters still need to be calibrated on the sparse measurements and transferred to unobserved glaciers.
Last, the measured streamflow data is a source of uncertainty too. Although the relatively dense network of gauges with long-term observations in a mountain setting is rather unique, many of the observations are influenced by water transfers or lake regulations. Without knowing the details of such regulations, and how they vary during extreme years, these influences on the analyses can only implicitly be taken into account, for example by providing a range of compensation levels in Fig. 5 that include the possibility of water being im- or exported to/from the catchment. The role of human influences, in particular during extreme years such as 2022, on streamflow dynamics downstream of reservoirs in relation to glacier melt processes should be an avenue of future research (Brunner, 2021).
6.3 Outlook to future extreme years
The comparison of the year 2022 with other extreme melt years in the (recent) past showed both declines (2022–2003) and increases (e.g. 2022–2018) in the amount of meltwater that glaciers can generate to sustain downstream dry conditions. The direction of change depends both on the difference in extremeness (the specific glacier mass balance or melt rate) and the change in glacier area between two extreme years. When comparing 2022 to 2018, glacier area changes were relatively minor due to the short interval. However the higher melt rates of 2022 allowed for higher meltwater volumes. When comparing 2022 to the most recent year with exceptional high meltwater volumes (2003), almost all glaciers (950/1400) showed total meltwater volumes that could not reach the volumes anymore that were generated in 2003, despite mostly stronger melt rates. This change in balance between increased melt rates and glacier retreat was reached more widespread for the summer than for July (Figs. 8 and S8). Due to the stronger melt anomaly of July 2022 compared to July 2003, the melt was better able to offset the effect of strongly reduced glacier area. How future extreme years may evolve thus depends on the extremeness of future conditions and the status of glacier retreat, i.e. the timing of a future extreme year.
At the same time, comparing the glacier meltwater volumes with downstream water deficits, shows that these processes are in a delicate balance with each other. Similar processes, such as a lack of snow in winter, result both in increased glacier melt volumes (i.e. more to compensate with), but also stronger deficits in the non-glacierized parts of catchments (i.e. more to compensate for). With retreating glaciers this balance is shifting, with deficits increasingly becoming more dominant over glacier melt surpluses. Thus, for understanding the future role of glaciers as drought buffers, not only the absolute meltwater volumes are relevant, but also the changes in the other hydrological components. To better understand how future extreme meteorological conditions and consequent droughts may evolve, insights could be gained from large ensemble datasets of future climates (Van der Wiel et al., 2019; Maher et al., 2021). Such scenarios, however, are still only available at rather coarse resolution.
This study analyzed the role of glaciers during the drought year 2022 in Switzerland, which was characterized by a very dry winter, and particularly dry months in May and July, combined with high summer temperatures, especially from May to July. We estimated daily glacier storage changes for all glaciers in Switzerland and brought it together with hydro-climatological data from 88 glacierized catchments. The findings highlight the critical role of glacier melt in mitigating water shortages during extreme dry and hot years.
In 2022, the glacier melt season began about two weeks earlier than usual. By mid-June, glaciers started melting in an imbalanced way, summing up to 80 % of all melt that was unsustainable. The extra glacier melt that was generated over the warm and dry summer, particularly in July, could fully compensate the precipitation deficits at a catchment glacierization level of around 15 % and at least half of the deficit for catchments with a glacierization of around 10 %. These catchments are mostly located in the upstream parts of the Rhone, Danube and the Rhine basins. For catchments with smaller glacieriziation, annual and summer streamflow were strongly below average. The streamflow deficits were mostly driven by precipitation deficits, rather than increased evapotranspiration. For the summer period (MJJA) we estimated the lack of rainfall and the lack of snowmelt in the non-glacierized areas to contribute with a similar magnitude to the overall water deficit.
While 2022 showed still high relative glacier melt contributions to streamflow when comparing to other extremes (especially to: 1998, 2003, 2018), the compensation and buffering role of glaciers is weakening as glaciers further retreat. A comparison with 2003, the most similar recent extreme year, shows that while 2022 had the most negative specific glacier mass balance (annual and summer), 2003 provided more total meltwater volume (Swiss-wide), due to a loss of glacier area between 2022–2003 of approximately 200 km2. Only 26 % (20 out of 76) of the catchments still experienced higher meltwater volumes in the summer of 2022 than in 2003, despite 81 % of the catchments (62 out of 76) showing higher melt rates, a number that increased to 63 % (48 out of 76) for July 2022 because of the more extreme melt rates in that particular month.
Sensitivity analysis indicates that only the largest glaciers (>10 km2) and about half of medium-sized glaciers (1–10 km2) remain highly responsive to temperature increases and extremes. Altogether, the results indicate that for most smaller Swiss glaciers and around half of the catchments, meltwater contributions during droughts have started to decline. These results now need to be confirmed in a longer-term future perspective. Despite these declines, the relative importance of glacier melt in streamflow has not diminished significantly and even increased in some catchments, underscoring the ongoing, though diminishing, role of glaciers in buffering drought impacts.
The findings show the importance of analyzing extreme years from a holistic glacio-hydrological perspective for aiding conclusions on the declining glacier meltwater supply with ongoing glacier retreat. Furthermore, the findings underline the need to adapt future water management strategies to account for reduced meltwater availability in the future, in particular during droughts.
Meteorological data are available through MeteoSwiss and through IDAweb (https://www.meteoswiss.admin.ch/services-and-publications/service/weather-and-climate-products/data-portal-for-teaching-and-research.html, last access: 3 October 2023). FOEN streamflow data is available through https://www.hydrodaten.admin.ch/en/seen-und-fluesse/messstationen-zustand (last access: 12 February 2024). Discharge at these stations is measured in a variety of ways, depending on the setting, using pressure sensors, velocity-area (radar) and weirs. The evapotranspiration data is available from Höge et al. (2023). Snow water equivalent data can be obtained through the institute of Snow and Avalanche Research (SLF) Davos. Glaciological data is available through GLAMOS (https://www.glamos.ch, last access: 15 August 2024). The daily cumulative glacier mass balances for the period 1916–2023 and the corresponding glacier areas for all glaciers in Switzerland can be downloaded from https://doi.org/10.3929/ethz-c-000786939 (Van Tiel and Huss, 2025).
The supplement related to this article is available online at https://doi.org/10.5194/hess-30-23-2026-supplement.
MvT designed the study and assembled all data. MH developed the extrapolation method for daily scale glacier storage changes for all Swiss glaciers, with input from MvT, and performed the calculations for all Swiss glaciers. MZ provided simulated ET data for all catchments and TJ provided the simulated SWE product for Switzerland. MvT conducted the analyses with feedback from DF and MH, designed the figures with input from DF, and wrote the manuscript. DF and MH edited the manuscript, while all authors provided feedback on the manuscript.
The contact author has declared that none of the authors has any competing interests.
Publisher's note: Copernicus Publications remains neutral with regard to jurisdictional claims made in the text, published maps, institutional affiliations, or any other geographical representation in this paper. The authors bear the ultimate responsibility for providing appropriate place names. Views expressed in the text are those of the authors and do not necessarily reflect the views of the publisher.
We thank Andreas Bauder for his help in obtaining and interpreting hydropower reservoir data. Furthermore, we thank the data providers BAFU, Alpiq, and the cantons of Bern, Vaud and Wallis for sharing their streamflow data, GLAMOS for measuring and distributing glacier mass balance data and MeteoSwiss for the meteorological data.
This research has been supported by the Deutsche Forschungsgemeinschaft (grant no. 510684314) and the Swiss National Science Foundation (grant. no 184634).
This paper was edited by Laurent Pfister and reviewed by two anonymous referees.
Abegg, B. and Mayer, M.: The exceptional year of 2022: “deathblow” to glacier summer skiing in the Alps?, Frontiers in Human Dynamics, 5, 1154245, https://doi.org/10.3389/fhumd.2023.1154245, 2023. a
Alizadeh, M. R., Adamowski, J., Nikoo, M. R., AghaKouchak, A., Dennison, P., and Sadegh, M.: A century of observations reveals increasing likelihood of continental-scale compound dry-hot extremes, Science Advances, 6, eaaz4571, https://doi.org/10.1126/sciadv.aaz4571, 2020. a
Anderson, S. and Radić, V.: Modeling the streamflow response to heatwaves across glacierized basins in southwestern Canada, Water Resources Research, 59, e2023WR035428, https://doi.org/10.1029/2023WR035428, 2023. a
Avanzi, F., Munerol, F., Milelli, M., Gabellani, S., Massari, C., Girotto, M., Cremonese, E., Galvagno, M., Bruno, G., Morra di Cella, U., Rossi, L., Altamura, M., and Ferraris, L.: Winter snow deficit was a harbinger of summer 2022 socio-hydrologic drought in the Po Basin, Italy, Communications Earth & Environment, 5, 64, https://doi.org/10.1038/s43247-024-01222-z, 2024. a
BAFU: Hydrologisches Jahrbuch der Schweiz 2022, Abfluss, Wasserstand und Wasserqualität der Schweizer Gewässer, Tech. rep., Bundesamt für Umwelt, https://portal-cdn.scnat.ch/asset/0763cad0-c201-5089-98b5-6d2406896ca0/, last access: 4 December 2023. a
Bahr, D. B., Meier, M. F., and Peckham, S. D.: The physical basis of glacier volume-area scaling, Journal of Geophysical Research: Solid Earth, 102, 20355–20362, 1997. a
Brun, F., Wagnon, P., Berthier, E., Jomelli, V., Maharjan, S., Shrestha, F., and Kraaijenbrink, P.: Heterogeneous influence of glacier morphology on the mass balance variability in High Mountain Asia, Journal of Geophysical Research: Earth Surface, 124, 1331–1345, 2019. a
Brunner, M. I.: Reservoir regulation affects droughts and floods at local and regional scales, Environmental Research Letters, 16, 124 016, 2021. a
Brunner, M. I., Liechti, K., and Zappa, M.: Extremeness of recent drought events in Switzerland: dependence on variable and return period choice, Nat. Hazards Earth Syst. Sci., 19, 2311–2323, https://doi.org/10.5194/nhess-19-2311-2019, 2019. a
Bruno, G., Avanzi, F., Gabellani, S., Ferraris, L., Cremonese, E., Galvagno, M., and Massari, C.: Disentangling the role of subsurface storage in the propagation of drought through the hydrological cycle, Advances in Water Resources, 169, 104305, https://doi.org/10.1016/j.advwatres.2022.104305, 2022. a
Carnahan, E., Amundson, J. M., and Hood, E.: Impact of glacier loss and vegetation succession on annual basin runoff, Hydrol. Earth Syst. Sci., 23, 1667–1681, https://doi.org/10.5194/hess-23-1667-2019, 2019. a
Chesnokova, A., Baraër, M., Laperrière-Robillard, T., and Huh, K.: Linking mountain glacier retreat and hydrological changes in southwestern Yukon, Water Resources Research, 56, e2019WR025706, https://doi.org/10.1029/2019WR025706, 2020. a
Copernicus: European State of the Climate 2022, Tech. rep., Copernicus Climate Change Service, https://climate.copernicus.eu/ESOTC/2022 (last access: 24 January 2024), 2023. a
Cremona, A., Huss, M., Landmann, J. M., Borner, J., and Farinotti, D.: European heat waves 2022: contribution to extreme glacier melt in Switzerland inferred from automated ablation readings, The Cryosphere, 17, 1895–1912, https://doi.org/10.5194/tc-17-1895-2023, 2023. a, b
De Luca, P. and Donat, M. G.: Projected Changes in Hot, Dry, and Compound Hot-Dry Extremes Over Global Land Regions, Geophysical Research Letters, 50, e2022GL102493, https://doi.org/10.1029/2022GL102493, 2023. a
Dussaillant, I., Hugonnet, R., Huss, M., Berthier, E., Bannwart, J., Paul, F., and Zemp, M.: Annual mass change of the world's glaciers from 1976 to 2024 by temporal downscaling of satellite data with in situ observations, Earth Syst. Sci. Data, 17, 1977–2006, https://doi.org/10.5194/essd-17-1977-2025, 2025. a
Erfurt, M., Glaser, R., and Blauhut, V.: Changing impacts and societal responses to drought in southwestern Germany since 1800, Regional Environmental Change, 19, 2311–2323, 2019. a
Faranda, D., Pascale, S., and Bulut, B.: Persistent anticyclonic conditions and climate change exacerbated the exceptional 2022 European-Mediterranean drought, Environmental Research Letters, 18, https://doi.org/10.1088/1748-9326/acbc37, 2023. a
Fischer, M., Huss, M., and Hoelzle, M.: Surface elevation and mass changes of all Swiss glaciers 1980–2010, The Cryosphere, 9, 525–540, https://doi.org/10.5194/tc-9-525-2015, 2015. a, b
Frans, C., Istanbulluoglu, E., Lettenmaier, D. P., Fountain, A. G., and Riedel, J.: Glacier recession and the response of summer streamflow in the Pacific Northwest United States, 1960–2099, Water Resources Research, 54, 6202–6225, 2018. a
Gabbi, J., Huss, M., Bauder, A., Cao, F., and Schwikowski, M.: The impact of Saharan dust and black carbon on albedo and long-term mass balance of an Alpine glacier, The Cryosphere, 9, 1385–1400, https://doi.org/10.5194/tc-9-1385-2015, 2015. a
GLAMOS: Swiss Glacier Mass Balance, release 2024, Tech. rep., Glacier Monitoring Switzerland, https://doi.org/10.18750/massbalance.2024.r2024, 2024. a, b, c, d, e
Grab, M., Mattea, E., Bauder, A., Huss, M., Rabenstein, L., Hodel, E., Linsbauer, A., Langhammer, L., Schmid, L., Church, G., Hellmann, S., Délèze, K., Schaer, P., Lathion, P., Farinotti, D., and Maurer, H.: Ice thickness distribution of all Swiss glaciers based on extended ground-penetrating radar data and glaciological modeling, Journal of Glaciology, 67, 1074–1092, 2021. a, b
Gugerli, R., Gabella, M., Huss, M., and Salzmann, N.: Can weather radars be used to estimate snow accumulation on Alpine Glaciers? An evaluation based on glaciological surveys, Journal of Hydrometeorology, 21, 2943–2962, 2020. a
Gurtz, J., Baltensweiler, A., and Lang, H.: Spatially distributed hydrotope-based modelling of evapotranspiration and runoff in mountainous basins, Hydrological Processes, 13, 2751–2768, https://doi.org/10.1002/(SICI)1099-1085(19991215)13:17<2751::AID-HYP897>3.0.CO;2-O, 1999. a
Hansel, S., Hoy, A., Brendel, C., and Maugeri, M.: Record summers in Europe: Variations in drought and heavy precipitation during 1901–2018, International Journal of Climatology, 42, 6235–6257, https://doi.org/10.1002/joc.7587, 2022. a
Höge, M., Kauzlaric, M., Siber, R., Schönenberger, U., Horton, P., Schwanbeck, J., Floriancic, M. G., Viviroli, D., Wilhelm, S., Sikorska-Senoner, A. E., Addor, N., Brunner, M., Pool, S., Zappa, M., and Fenicia, F.: CAMELS-CH: hydro-meteorological time series and landscape attributes for 331 catchments in hydrologic Switzerland, Earth Syst. Sci. Data, 15, 5755–5784, https://doi.org/10.5194/essd-15-5755-2023, 2023. a, b, c
Hugonnet, R., McNabb, R., Berthier, E., Menounos, B., Nuth, C., Girod, L., Farinotti, D., Huss, M., Dussaillant, I., Brun, F., and Kääb, A.: Accelerated global glacier mass loss in the early twenty-first century, Nature, 592, 726–731, 2021. a, b
Huss, M.: Present and future contribution of glacier storage change to runoff from macroscale drainage basins in Europe, Water Resources Research, 47, W07511, https://doi.org/10.1029/2010WR010299, 2011. a, b
Huss, M.: Extrapolating glacier mass balance to the mountain-range scale: the European Alps 1900–2100, The Cryosphere, 6, 713–727, https://doi.org/10.5194/tc-6-713-2012, 2012. a
Huss, M.: Density assumptions for converting geodetic glacier volume change to mass change, The Cryosphere, 7, 877–887, https://doi.org/10.5194/tc-7-877-2013, 2013. a
Huss, M. and Hock, R.: Global-scale hydrological response to future glacier mass loss, Nature Climate Change, 8, 135–140, 2018. a, b
Huss, M., Funk, M., and Ohmura, A.: Strong Alpine glacier melt in the 1940s due to enhanced solar radiation, Geophysical Research Letters, 36, L23501, https://doi.org/10.1029/2009GL040789, 2009. a
Huss, M., Dhulst, L., and Bauder, A.: New long-term mass-balance series for the Swiss Alps, Journal of Glaciology, 61, 551–562, 2015. a, b
Huss, M., Bauder, A., Linsbauer, A., Gabbi, J., Kappenberger, G., Steinegger, U., and Farinotti, D.: More than a century of direct glacier mass-balance observations on Claridenfirn, Switzerland, Journal of Glaciology, 67, 697–713, 2021. a
Immerzeel, W., Petersen, L., Ragettli, S., and Pellicciotti, F.: The importance of observed gradients of air temperature and precipitation for modeling runoff from a glacierized watershed in the Nepalese Himalayas, Water Resources Research, 50, 2212–2226, 2014. a
Jost, G., Moore, R. D., Menounos, B., and Wheate, R.: Quantifying the contribution of glacier runoff to streamflow in the upper Columbia River Basin, Canada, Hydrol. Earth Syst. Sci., 16, 849–860, https://doi.org/10.5194/hess-16-849-2012, 2012. a
Koboltschnig, G. R. and Schöner, W.: The relevance of glacier melt in the water cycle of the Alps: the example of Austria, Hydrol. Earth Syst. Sci., 15, 2039–2048, https://doi.org/10.5194/hess-15-2039-2011, 2011. a
Koboltschnig, G. R., Schöner, W., Zappa, M., and Holzmann, H.: Contribution of glacier melt to stream runoff: if the climatically extreme summer of 2003 had happened in 1979, Annals of Glaciology, 46, 303–308, 2007. a
Linsbauer, A., Huss, M., Hodel, E., Bauder, A., Fischer, M., Weidmann, Y., Bärtschi, H., and Schmassmann, E.: The New Swiss Glacier Inventory SGI2016: from a topographical to a glaciological dataset, Frontiers in Earth Science, 9, 704189, https://doi.org/10.3389/feart.2021.704189, 2021. a, b, c, d
Magnusson, J., Gustafsson, D., Hüsler, F., and Jonas, T.: Assimilation of point SWE data into a distributed snow cover model comparing two contrasting methods, Water Resources Research, 50, 7816–7835, 2014. a
Maher, N., Milinski, S., and Ludwig, R.: Large ensemble climate model simulations: introduction, overview, and future prospects for utilising multiple types of large ensemble, Earth Syst. Dynam., 12, 401–418, https://doi.org/10.5194/esd-12-401-2021, 2021. a
Mastrotheodoros, T., Pappas, C., Molnar, P., Burlando, P., Manoli, G., Parajka, J., Rigon, R., Szeles, B., Bottazzi, M., Hadjidoukas, P., and Fatichi, S.: More green and less blue water in the Alps during warmer summers, Nature Climate Change, 10, 155–161, 2020. a, b
McCarthy, M., Meier, F., Fatichi, S., Stocker, B. D., Shaw, T. E., Miles, E., Dussaillant, I., and Pellicciotti, F.: Glacier contributions to river discharge during the current Chilean megadrought, Earth's Future, 10, e2022EF002852, https://doi.org/10.1029/2022EF002852, 2022a. a, b
McCarthy, M., Miles, E., Kneib, M., Buri, P., Fugger, S., and Pellicciotti, F.: Supraglacial debris thickness and supply rate in High-Mountain Asia, Communications Earth & Environment, 3, 269, https://doi.org/10.1038/s43247-022-00588-2, 2022b. a
Menounos, B., Huss, M., Marshall, S., Ednie, M., Florentine, C., and Hartl, L.: Glaciers in Western Canada-conterminous US and Switzerland experience unprecedented mass loss over the last four years (2021–2024), Geophysical Research Letters, 52, e2025GL115235, https://doi.org/10.1029/2025GL115235, 2025. a
MeteoSwiss: Daily precipitation (final analysis): RhiresD, Documentation of MeteoSwiss Grid-Data Products, https://www.meteoswiss.admin.ch/dam/jcr:4f51f0f1-0fe3-48b5-9de0-15666327e63c/ProdDoc_RhiresD.pdf (last access: 14 May 2024), 2019. a
MeteoSwiss: Daily Mean, Minimum and Maximum Temperature: TabsD, TminD, TmaxD, Documentation of MeteoSwiss Grid-Data Products, https://www.meteoswiss.admin.ch/dam/jcr:818a4d17-cb0c-4e8b-92c6-1a1bdf5348b7/ProdDoc_TabsD.pdf (last access: 14 May 2024), 2021. a
Mishra, V., Thirumalai, K., Singh, D., and Aadhar, S.: Future exacerbation of hot and dry summer monsoon extremes in India, Npj Climate and Atmospheric Science, 3, 10, https://doi.org/10.1038/s41612-020-0113-5, 2020. a
Montanari, A., Nguyen, H., Rubinetti, S., Ceola, S., Galelli, S., Rubino, A., and Zanchettin, D.: Why the 2022 Po River drought is the worst in the past two centuries, Science Advances, 9, eadg8304, https://doi.org/10.1126/sciadv.adg8304, 2023. a
Mott, R., Winstral, A., Cluzet, B., Helbig, N., Magnusson, J., Mazzotti, G., Quéno, L., Schirmer, M., Webster, C., and Jonas, T.: Operational snow-hydrological modeling for Switzerland, Frontiers in Earth Science, 11, 1228158, https://doi.org/10.3389/feart.2023.1228158, 2023. a
Müller, F. B., Caflisch, T., and Müller, G.: Firn und Eis der Schweizer Alpen: Gletscherinventar, Technical Report 57, Geographisches Institut der ETH Zürich, Zürich, 1976. a, b
Ohmura, A., Kasser, P., and Funk, M.: Climate at the equilibrium line of glaciers, Journal of Glaciology, 38, 397–411, 1992. a
Pelto, M. S., Dryak, M., Pelto, J., Matthews, T., and Perry, L. B.: Contribution of glacier runoff during heat waves in the Nooksack River Basin USA, Water, 14, 1145, https://doi.org/10.3390/w14071145, 2022. a
Pritchard, H. D.: Asia's shrinking glaciers protect large populations from drought stress, Nature, 569, 649–654, 2019. a
Ragettli, S., Immerzeel, W. W., and Pellicciotti, F.: Contrasting climate change impact on river flows from high-altitude catchments in the Himalayan and Andes Mountains, Proceedings of the National Academy of Sciences, 113, 9222–9227, 2016. a
Rets, E. P., Durmanov, I. N., Kireeva, M. B., Smirnov, A. M., and Popovnin, V. V.: Past “peak water” in the North Caucasus: deglaciation drives a reduction in glacial runoff impacting summer river runoff and peak discharges, Climatic Change, 163, 2135–2151, 2020. a
Réveillet, M., Dumont, M., Gascoin, S., Lafaysse, M., Nabat, P., Ribes, A., Nheili, R., Tuzet, F., Ménégoz, M., Morin, S., et al.: Black carbon and dust alter the response of mountain snow cover under climate change, Nature Communications, 13, 5279, https://doi.org/10.1038/s41467-022-32501-y, 2022. a, b
Rounce, D. R., Hock, R., and Shean, D. E.: Glacier mass change in High Mountain Asia through 2100 using the open-source python glacier evolution model (PyGEM), Frontiers in Earth Science, 7, 331, https://doi.org/10.3389/feart.2019.00331, 2020. a
Stahl, K., Weiler, M., Kohn, I., Freudiger, D., Seibert, J., Vis, M., Gerlinger, K., and Bohm, M.: The snow and glacier melt components of streamflow of the river Rhine and its tributaries considering the influence of climate change, Synthesis Report I-25, International Commission for the Hydrology of the Rhine Basin, Lelystad, Netherlands, 10, ISBN/EAN 978-90-70980-38-2, 2016. a
Tripathy, K. P. and Mishra, A. K.: How Unusual Is the 2022 European Compound Drought and Heatwave Event?, Geophysical Research Letters, 50, e2023GL105453, https://doi.org/10.1029/2023GL105453, 2023. a, b
Ultee, L., Coats, S., and Mackay, J.: Glacial runoff buffers droughts through the 21st century, Earth Syst. Dynam., 13, 935–959, https://doi.org/10.5194/esd-13-935-2022, 2022. a
Van der Wiel, K., Wanders, N., Selten, F., and Bierkens, M.: Added value of large ensemble simulations for assessing extreme river discharge in a 2 C warmer world, Geophysical Research Letters, 46, 2093–2102, 2019. a
Van Lanen, H. A. J., Wanders, N., Tallaksen, L. M., and Van Loon, A. F.: Hydrological drought across the world: impact of climate and physical catchment structure, Hydrol. Earth Syst. Sci., 17, 1715–1732, https://doi.org/10.5194/hess-17-1715-2013, 2013. a
Van Lanen, H. A. J., Laaha, G., Kingston, D. G., Gauster, T., Ionita, M.; Vidal, J. P., Vlnas, R., Tallaksen, L. M., Stahl, K., Hannaford, J., Delus, C., Fendekova, M., Mediero, L., Pudhomme, C., Rets, E., Romanowicz, R. J., Gailliez, S., Wong, W. K., Adler, M. J., Blauhut, V., Caillouet, L., Chelcea, S., Frolova, N., Gudmundsson, L., Hanel, M., Haslinger, K., Kireeva, M., Osuch, M., Sauquet, E., Stagge, J. H., and Van Loon, A. F.: Hydrology needed to manage droughts: the 2015 European case, Hydrological Processes, 30, 3097–3104, 2016. a
Van Loon, A. F.: Hydrological drought explained, Wiley Interdisciplinary Reviews: Water, 2, 359–392, 2015. a
Van Loon, A. F. and Laaha, G.: Hydrological drought severity explained by climate and catchment characteristics, Journal of Hydrology, 526, 3–14, 2015. a
Van Tiel, M. and Huss, M.: Daily cumulative glacier mass balances Swiss glaciers 1916–2023, ETH Zurich Research Collection [data set], https://doi.org/10.3929/ethz-c-000786939, 2025. a
Van Tiel, M., Kohn, I., Van Loon, A. F., and Stahl, K.: The compensating effect of glaciers: Characterizing the relation between interannual streamflow variability and glacier cover, Hydrological Processes, 34, 553–568, 2020. a
Van Tiel, M., Van Loon, A. F., Seibert, J., and Stahl, K.: Hydrological response to warm and dry weather: do glaciers compensate?, Hydrol. Earth Syst. Sci., 25, 3245–3265, https://doi.org/10.5194/hess-25-3245-2021, 2021. a
Van Tiel, M., Weiler, M., Freudiger, D., Moretti, G., Kohn, I., Gerlinger, K., and Stahl, K.: Melting Alpine Water Towers Aggravate Downstream Low Flows: A Stress-Test Storyline Approach, Earth's Future, 11, e2022EF003408, https://doi.org/10.1029/2022EF003408, 2023. a, b
Vargo, L. J., Anderson, B. M., Dadić, R., Horgan, H. J., Mackintosh, A. N., King, A. D., and Lorrey, A. M.: Anthropogenic warming forces extreme annual glacier mass loss, Nature Climate Change, 10, 856–861, 2020. a
Vincent, C., Fischer, A., Mayer, C., Bauder, A., Galos, S. P., Funk, M., Thibert, E., Six, D., Braun, L., and Huss, M.: Common climatic signal from glaciers in the European Alps over the last 50 years, Geophysical Research Letters, 44, 1376–1383, 2017. a
Viviroli, D., Zappa, M., Gurtz, J., and Weingartner, R.: An introduction to the hydrological modelling system PREVAH and its pre-and post-processing-tools, Environmental Modelling & Software, 24, 1209–1222, 2009. a
Voordendag, A., Prinz, R., Schuster, L., and Kaser, G.: Brief communication: The Glacier Loss Day as an indicator of a record-breaking negative glacier mass balance in 2022, The Cryosphere, 17, 3661–3665, https://doi.org/10.5194/tc-17-3661-2023, 2023. a, b
Wang, R., Ding, Y., Shangguan, D., Cuo, L., Zhao, Q., Qin, J., Li, J., and Song, M.: Projections of glacier peak water and its timing in the Sanjiangyuan on the Tibet Plateau, Journal of Hydrology: Regional Studies, 45, 101313, https://doi.org/10.1016/j.ejrh.2022.101313, 2023. a
WMO: State of the Global Climate in 2022, Tech. Rep. 1316, World Meteorological Organisation, ISBN 978-92-63-11316-0, 2023. a
Zappa, M. and Gurtz, J.: Simulation of soil moisture and evapotranspiration in a soil profile during the 1999 MAP-Riviera Campaign, Hydrol. Earth Syst. Sci., 7, 903–919, https://doi.org/10.5194/hess-7-903-2003, 2003. a
Zappa, M. and Kan, C.: Extreme heat and runoff extremes in the Swiss Alps, Nat. Hazards Earth Syst. Sci., 7, 375–389, https://doi.org/10.5194/nhess-7-375-2007, 2007. a, b, c
Zemp, M., Frey, H., Gärtner-Roer, I., Nussbaumer, S. U., Hoelzle, M., Paul, F., Haeberli, W., Denzinger, F., Ahlstrøm, A. P., Anderson, B., Bajracharya, S., Baroni, C., Braun, L. N., Cáceres, B. E., Casassa, G., Cobos, G., Dávila, L. R., Granados, H. D., Demuth, M. N., Espizua, L., Fischer, A., Fujita, K., Gadek, B., Ghazanfar, A., Hagen, J. O., Holmlund, P., Karimi, N., Li, Z., Pelto, M., Pitte, P., Popovnin, V. V., Portocarrero, C. A., Prinz, R.., Sangewar, C. V., Severskiy, I., Sigurđsson, O., Soruco, A., Usubaliev, R., and Vincent, C.: Historically unprecedented global glacier decline in the early 21st century, Journal of Glaciology, 61, 745–762, 2015. a
Zeng, N., Qian, H., Roedenbeck, C., and Heimann, M.: Impact of 1998–2002 midlatitude drought and warming on terrestrial ecosystem and the global carbon cycle, Geophysical Research Letters, 32, L22709, https://doi.org/10.1029/2005GL024607, 2005. a