the Creative Commons Attribution 4.0 License.
the Creative Commons Attribution 4.0 License.
 | 20 Mar 2026
Impact of occurrence conditions on NO3−-N source apportionment in groundwater: insights from PCA-APCS-MLR and MixSIAR methods
Yang Liu
Jian Luo
Ziyang Zhang
Xilai Zheng
Nitrate-N (NO-N) contamination in groundwater poses a significant threat to drinking water safety and ecosystem health, with accurate source identification being crucial for effective pollution control. Previous studies on NO-N source apportionment in groundwater have largely neglected groundwater occurrence conditions. In this study, groundwater samples from aquifers with different occurrence conditions were collected and analyzed using an integrated approach combining hydrochemical analysis (PCA-APCS-MLR) and the stable isotope mixing model (MixSIAR) to identify and quantify NO-N pollution sources. The results demonstrate that NO-N concentrations in 75 % of the groundwater samples exceeded the standard for drinking water quality of China (≤ 10 mg N L−1). NO-N in unconfined groundwater predominantly originates from soil nitrogen (58 %), with a non-negligible contribution from chemical fertilizers. NO-N enrichment in confined groundwater is primarily attributed to manure and sewage (37.9 %). In addition, ignoring the groundwater occurrence conditions leads to marked deviations in the source apportionment results derived from both the PCA-APCS-MLR and MixSIAR approaches. This study highlights that considering the occurrence conditions is crucial for distinguishing the primary sources of NO-N in groundwater, which can enhance the accuracy of source apportionment and the effectiveness of management measures.
- Article
(3737 KB) - Full-text XML
-
Supplement
(413 KB) - BibTeX
- EndNote


-
Elucidated the sources of NO-N in groundwater under different occurrence conditions.
-
Soil nitrogen contributes over 50 % to the NO-N in the unconfined groundwater.
-
NO-N in confined groundwater mainly originates from manure and sewage.
-
Neglecting occurrence conditions leads to significant deviations in source apportionment.
Groundwater nitrate-N (NO-N) contamination has persisted for nearly a century worldwide, emerging as a critical environmental challenge that threatens both human health and ecological security (Xin et al., 2019). As a highly toxic pollutant, NO-N poses significant health risks including methemoglobinemia and cancer through drinking water (Picetti et al., 2022), particularly when its concentration exceeds the WHO drinking water standard of 11.3 mg N L−1. It also causes severe ecological impacts such as aquatic eutrophication, primarily through groundwater discharge into rivers, lakes, and coastal waters (Romanelli et al., 2020). The environmental persistence of NO-N is exacerbated by limited natural attenuation in groundwater systems due to weak denitrification processes, resulting in long-term accumulation of NO-N (Rivett et al., 2008). The primary sources of NO-N include non-point source pollution from agricultural activities (fertilizer application and livestock operations) and point source pollution from industrial effluents and domestic sewage (Xin et al., 2021). Consequently, the accurate identification and dissection of NO-N pollution sources are pivotal to the assessment and control of groundwater pollution risks. Despite some advancements in NO-N source apportionment over the past decades (Yang et al., 2013; Gibrilla et al., 2020), the majority of studies have overlooked the occurrence conditions of groundwater. Ignoring this issue can lead to inaccurate source apportionment results, and consequently affect the scientific nature and effectiveness of groundwater pollution prevention and control strategies.
Current studies on NO-N source apportionment in groundwater predominantly simplifies complex multi-layer aquifer systems into single-layer models (Yu et al., 2020). While this simplification facilitates analysis, it introduces substantial limitations due to fundamental differences between unconfined and confined aquifers in terms of recharge mechanisms, flow paths, hydraulic characteristics, and contaminant transport behavior (Liang et al., 2017). Unconfined aquifers, characterized by strong connectivity with surface water, are highly vulnerable to anthropogenic activities (e.g., agricultural fertilization, industrial effluents, and domestic sewage), allowing contaminants to readily leach into groundwater through precipitation or surface runoff, resulting in rapid NO-N accumulation that typically reflects recent pollution caused by recent human activities (Gutiérrez et al., 2018). In contrast, confined aquifers, protected by overlying aquitards, exhibit slower contaminant migration, with NO-N pollution often representing legacy effects from historical agricultural practices (Wong et al., 2015). In addition, the transformation rates of nitrogen components from different pollution sources vary in aquifers with different occurrence conditions. Unconfined aquifers are generally aerobic environments, where the mineralization and nitrification of organic nitrogen occur rapidly, leading to a swift increase in NO-N concentration (Liu et al., 2022). In contrast, confined aquifers tend to have reducing conditions, which restrict the nitrogen transformation rate and cause a lag in NO-N formation (Ma et al., 2019). As a result, the source of NO-N may be mistakenly attributed to other pollution sources.
In recent years, some progress has been made in the identification of NO-N pollution sources in groundwater through the application of hydrochemical analysis methods and stable isotope mixing models (Minet et al., 2017; Yu et al., 2022). Hydrochemical analysis methods mainly include ion ratio methods, hydrochemical diagram methods, and quantitative hydrochemical analysis methods. Among these, quantitative hydrochemical analysis is the core, which encompasses models such as the chemical mass balance (CMB), positive matrix factorization (PMF), and multivariate statistical models (e.g., principal component analysis and multiple linear regression analysis). Among these methods, the absolute principal component score-multiple linear regression (APCS-MLR) method has garnered considerable attention due to its high efficiency and broad applicability (Meng et al., 2018; Ruan et al., 2024). APCS-MLR can extract key pollution source information by reducing data redundancy through principal component analysis while retaining the essential characteristics of major pollution sources. Additionally, APCS-MLR can establish a quantitative relationship between principal component scores and actual pollutant concentrations via multiple linear regression, thereby accurately calculating the contribution rates of various pollution sources. Subsequently, stable isotope techniques have been applied in the identification of NO-N pollution sources in groundwater. The development of this technology in groundwater NO-N source apportionment has evolved from the use of single isotopes (δ15N) to the combined application of multiple isotopes (both δ15N and δ18O) (Kellman and Hillaire-Marcel, 2003; Ji et al., 2022). By analyzing the isotopic compositions of nitrogen (δ15N) and oxygen (δ18O) in NO-N, this technique can effectively distinguish different sources of NO-N pollution in groundwater (such as agricultural fertilization, domestic sewage, soil nitrogen, and atmospheric deposition) (Ransom et al., 2016), thereby providing an important supplement to traditional hydrochemical analysis methods. To further quantify the contribution proportions of different pollution sources and enhance the accuracy of source identification, the stable isotope mixing model based on the R language, MixSIAR, has been developed. The MixSIAR method, by integrating isotope data with prior information (the ranges of isotopic values and initial estimates of their contributions) on pollution sources, is capable of quantifying the relative contributions of different pollution sources and assessing the uncertainty of the results. For example, Mao et al. (2023) used the MixSIAR method to analyze the distribution of NO-N pollution sources in the groundwater of Poyang Lake, China, revealing that manure and sewage accounted for 52 %, chemical fertilizers for 17 %, and soil nitrogen for 21.5 % of the pollution sources. In this study, hydrochemical analysis methods and the MixSIAR method were employed to comprehensively identify the NO-N pollution sources in groundwater under different occurrence conditions.
To bridge the methodological gap associated with overlooking groundwater occurrence conditions in NO-N source apportionment and to elucidate the genesis of “high-nitrogen groundwater” in the Old County groundwater source area, this study undertook an integrated field sampling and laboratory analysis. Groundwater samples were collected from 64 wells. Soil, fertilizer, manure, and precipitation samples were also gathered within the study area. The hydrochemical indicators and isotopic characteristics of these samples were analyzed. Subsequently, PCA-APCS-MLR and MixSIAR methods were employed for pollution source apportionment. The objectives of this study are (1) to quantify the concentration and distribution of NO-N in groundwater within the study area; (2) to quantitatively identify the sources of NO-N contamination in groundwater under different occurrence conditions using hydrochemical analysis and the MixSIAR method; and (3) to clarify distinct NO-N pollution sources in confined and unconfined groundwater, highlighting the critical role of occurrence conditions for targeted management. We hypothesize that the primary sources of NO-N pollution differ significantly between unconfined and confined groundwater, and neglecting occurrence conditions will introduce a discrepancy in the results of quantitative NO-N source apportionment. The study aims to provide a more accurate basis for assessing the risk of NO-N contamination in regional groundwater.
2.1 Study region
The study area is located on the western edge of the Tai-Lai Basin in the lower reaches of the Yellow River (Fig. 1), to the east of Tai'an urban area (117°04′09′′–117°26′45′′ E, 36°04′16′′–36°12′10′′ N), with a total area of approximately 220 km2. The topography is characterized as a proluvial and alluvial plain at the foot of Mount Tai, with an overall terrain slope from the northwest to the southeast. The study area falls within the temperate continental semi-humid monsoon climate zone, featuring hot and rainy summers, as well as cold and dry winters. The average annual temperature is 12.9 °C, and the average annual precipitation is 790.69 mm. Precipitation exhibits significant spatiotemporal variability, with uneven seasonal distribution and large interannual fluctuations. The primary aquifer formations in the study area consist of two types: the Quaternary unconsolidated porous aquifer group and the Cambrian-Ordovician carbonate rock fracture karst aquifer group. The former is mainly composed of medium to coarse sand, with recharge primarily from atmospheric precipitation and infiltration of surface water, and discharge through evaporation, artificial extraction, replenishment of surface water, and inter-aquifer flow to other aquifers. The latter is mostly situated beneath the Quaternary strata, with recharge mainly from “skylight” recharge of Quaternary water and lateral flow recharge from regional bedrock fracture aquifers, and discharge through artificial extraction, runoff discharge, and upward replenishment to the Quaternary porous water. The urban population in the study area is approximately 28 000, with over 85 % of the population engaged in agriculture and animal husbandry.
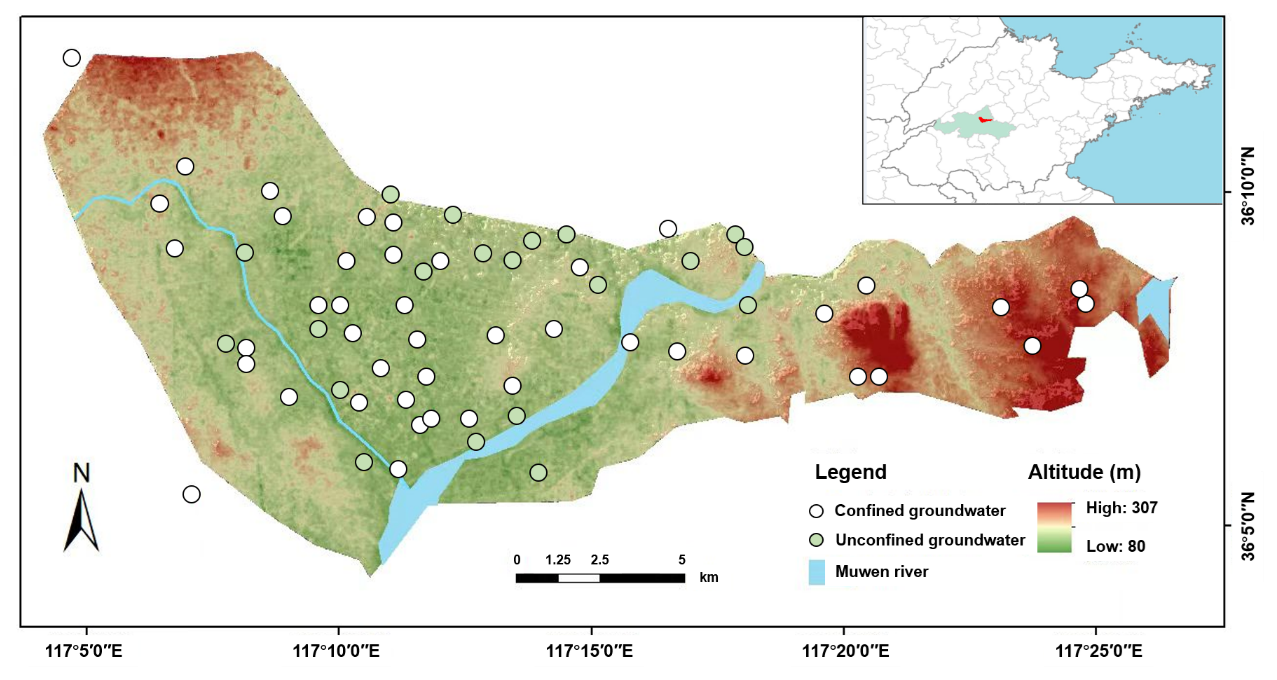
Figure 1Location of the Tailai Basin in lower reaches of the Yellow River and sampling sites in the study region.
2.2 Sample collection
A total of 64 groundwater samples were collected from the study area. Prior to sampling, wells were thoroughly flushed, and samples were taken from a depth of more than 0.5 m below the groundwater table. For sealed wells, water stored in the pumping pipe was completely drained before sampling. After collection, groundwater samples were filtered through a 0.45 µm membrane filter and stored in 500 mL amber glass bottles, which were then sealed and transported to the laboratory for refrigeration at 4 °C. Groundwater samples intended for isotopic analysis were filtered through a 0.22 µm membrane filter and stored frozen in 50 mL polyethylene bottles. Five atmospheric precipitation samples were collected using stainless-steel precipitation samplers. For single-day precipitation events, one complete-event sample was collected, while for multi-day precipitation events, samples were collected at 24 h intervals. All precipitation samples were stored in polyethylene bottles. Five typical fertilizer samples (including urea and compound fertilizers) were collected based on local farmers' fertilization practices. Given the difficulty in distinguishing between manure and sewage pollution sources using δ15N and δ18O isotopes, these two sources were combined into one category in this study. A total of 10 samples (including cow manure, pig manure, chicken manure, sheep manure, goose manure, and sewage) were collected. Manure samples were air-dried for later use, while sewage samples were filtered through a 0.22 µm membrane filter and stored frozen. Additionally, 20 agricultural soil samples were collected using the plum blossom point layout method. Each sample was composed of a mixture from 5 to 15 sampling points at a depth of 30 cm, with all sampling points avoiding fertilized areas. The collected soil samples were thoroughly mixed after removing roots and gravel and then stored.
2.3 Sample Analysis
The concentration of NO-N was determined using the ultraviolet spectrophotometric method (at 220 and 275 nm) following filtration through a 0.45 µm membrane. The concentrations of major ions (K+, Na+, Ca2+, Mg2+, Cl−, and SO42−) were measured using an ion chromatograph (ICS-3000, Dionex, USA). The separation was achieved with an IonPac AS23 analytical column and an AG23 guard column, using a carbonate eluent. The concentration of HCO was determined by acid-base titration with a standardized HCl solution (0.02 M) to a bromocresol green-methyl red endpoint. All analyses of hydrochemical indicators adhered to standard methods (Greenberg et al., 2005).
In the analysis of isotopic samples, δ15N and δ18O were measured using the azide reduction method for liquid samples (groundwater, atmospheric precipitation, and sewage). This involved chemically reducing NO-N in the samples to N2O, which was then analyzed using an elemental analyzer coupled with an isotope ratio mass spectrometer (Vario Isotope Cube – Isoprime, Elementar) to obtain the isotopic values of δ15N and δ18O. For solid samples (soil, fertilizer, and manure), δ15N and δ18O were measured using the high-temperature oxidation method. This procedure involved weighing an appropriate amount of thoroughly ground powder sample, encapsulating it in a tin cup, and analyzing it using an elemental analyzer coupled with an isotope ratio mass spectrometer.
2.4 Source apportionment methods
2.4.1 Hydrochemical analysis method
-
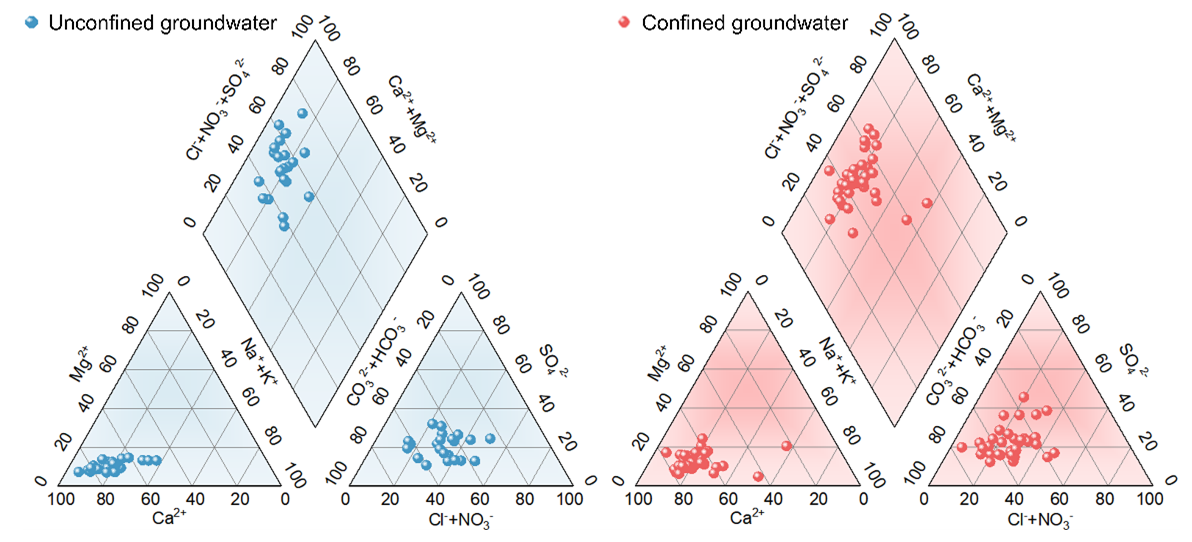
Piper diagram.
The method used to determine the hydrochemical type of groundwater is the Schoeller classification method. First, the concentrations of K+, Na+, Ca2+, Mg2+, HCO, SO, Cl−, and NO-N in groundwater samples, expressed in milligrams per liter (mg L−1), are converted to milliequivalent concentrations (meq L−1). Subsequently, the milliequivalent percentage of each ion is calculated. Finally, the hydrochemical type is determined based on the ions with a milliequivalent percentage greater than 25 %. The milliequivalent percentages of cations and anions for all water samples in the water quality monitoring data are plotted on a Piper diagram.
-
PCA-APCS-MLR.
Principal component analysis (PCA) was employed to extract the dominant pollution factors, and the potential sources of groundwater contamination were inferred in conjunction with hydrochemical indicators:
PC1, PC2, …, PCm represent the principal components 1, 2, …, m that can explain the original indicators. The eigenvalues λm (m≤j) of the correlation coefficient matrix are the variances of PCm, and the larger the variance, the greater the contribution to the principal component.
Subsequently, on the basis of PCA, the absolute principal component scores (APCS) were determined. A multiple linear regression (MLR) was performed with the measured pollutant concentrations as the dependent variables and the absolute principal component scores as the independent variables (Thurston and Spengler, 1985). The pollution contributions of each factor were calculated based on the regression coefficients, thereby determining the contribution rates of the pollution sources:
p represents the principal component extracted during the principal component analysis (PCA) process. denotes the absolute principal component score for principal component p. Spj represents the scoring coefficient of indicator j within principal component p.
Cj represents the measured concentration of pollutant j. bj denotes the constant term in the multiple linear regression analysis. bpj represents the regression coefficient for principal component p. bpj×APCSip indicates the concentration contribution of principal component p to pollutant j in sample i. The average value of bpj×APCSip represents the average concentration contribution of principal component p (the pollution source) to pollutant j. Finally, by converting the concentration contributions of each pollution source into percentages, the contribution rates of the pollution sources can be determined.
2.4.2 MixSIAR method
The principle of the MixSIAR method is to use the Dirichlet distribution as the prior distribution and to obtain the posterior distribution characteristics of the contributions, such as the mean, variance, and probability density, through the application of Bayes' theorem (Moore and Semmens, 2008). Assuming there are n samples, k different sources, and j isotopes, the MixSIAR mixing model can be expressed as follows:
Xij represents the value of the j isotope in the i sample (i=1, 2, 3, …, N; j=1, 2, 3, …, J). Pk denotes the contribution rate of the k source (k= 1, 2, 3, …, K), which is predicted using the MixSIAR method. Sjk represents the value of the j isotope from the k source, with a mean of μjk and a variance of . εjk represents the enrichment coefficient of the j isotope from the k source, with a mean of λjk and a variance of . νij represents the residual, with a mean of 0 and a variance of .
2.5 Data analysis
The stable isotope mixing model used in this study was run in the R package MixSIAR (R version x64 4.3.2). Statistical analysis was performed using SPSS 20 software. To evaluate the linear relationships between hydrochemical parameters, the Pearson correlation coefficient (r) was calculated. Correlations were considered statistically significant at a two-tailed p-value < 0.05. The spatial distribution of NO-N concentrations was generated using Surfer 15 software, and the cartographic work was completed with Origin 2020.
3.1 Characteristics of groundwater NO-N pollution
The type of groundwater in the study area is predominantly of the Ca-type, with the molar percentage of Ca2 exceeding 50 % in most sampling points (Fig. 2). In addition, the groundwater in the study area can be classified into two main types: Cl−•NOHCO-Ca2+ and Cl−•NO SO-Ca2+. Specifically, the Cl−• NOHCO-Ca2+ type is primarily found in karst water, while the Cl−•NO SO-Ca2+ type is mainly distributed in pore water.
Kriging interpolation was employed to analyze the spatial distribution of NO-N concentration in the groundwater of the study area. The results indicate that the NO-N concentration in the groundwater ranges from 0 to 68 mg N L−1, with an average concentration of 22.45 mg N L−1 (Fig. 3). Based on the standard for drinking water quality of China (NO-N ≤ 10 mg N L−1), the NO-N exceedance rate in the study area is 75 %, indicating a relatively severe overall pollution status. Specifically, the NO-N concentration in unconfined groundwater ranges from 0 to 68 mg N L−1, with an average concentration of 29.9 mg N L−1, while that in confined groundwater ranges from 0 to 62.1 mg N L−1, with an average concentration of 20.1 mg N L−1. Additionally, 50 % of the sampling sites in unconfined groundwater and 14 % in confined groundwater exceed 30 mg N L−1 (Class V groundwater quality standard of China), suggesting that NO-N pollution in unconfined groundwater is more severe than that in confined groundwater. Spatially, the NO-N pollution in the groundwater exhibits significant spatial heterogeneity, with the central part of the study area experiencing more severe NO-N contamination compared to the western and eastern regions.
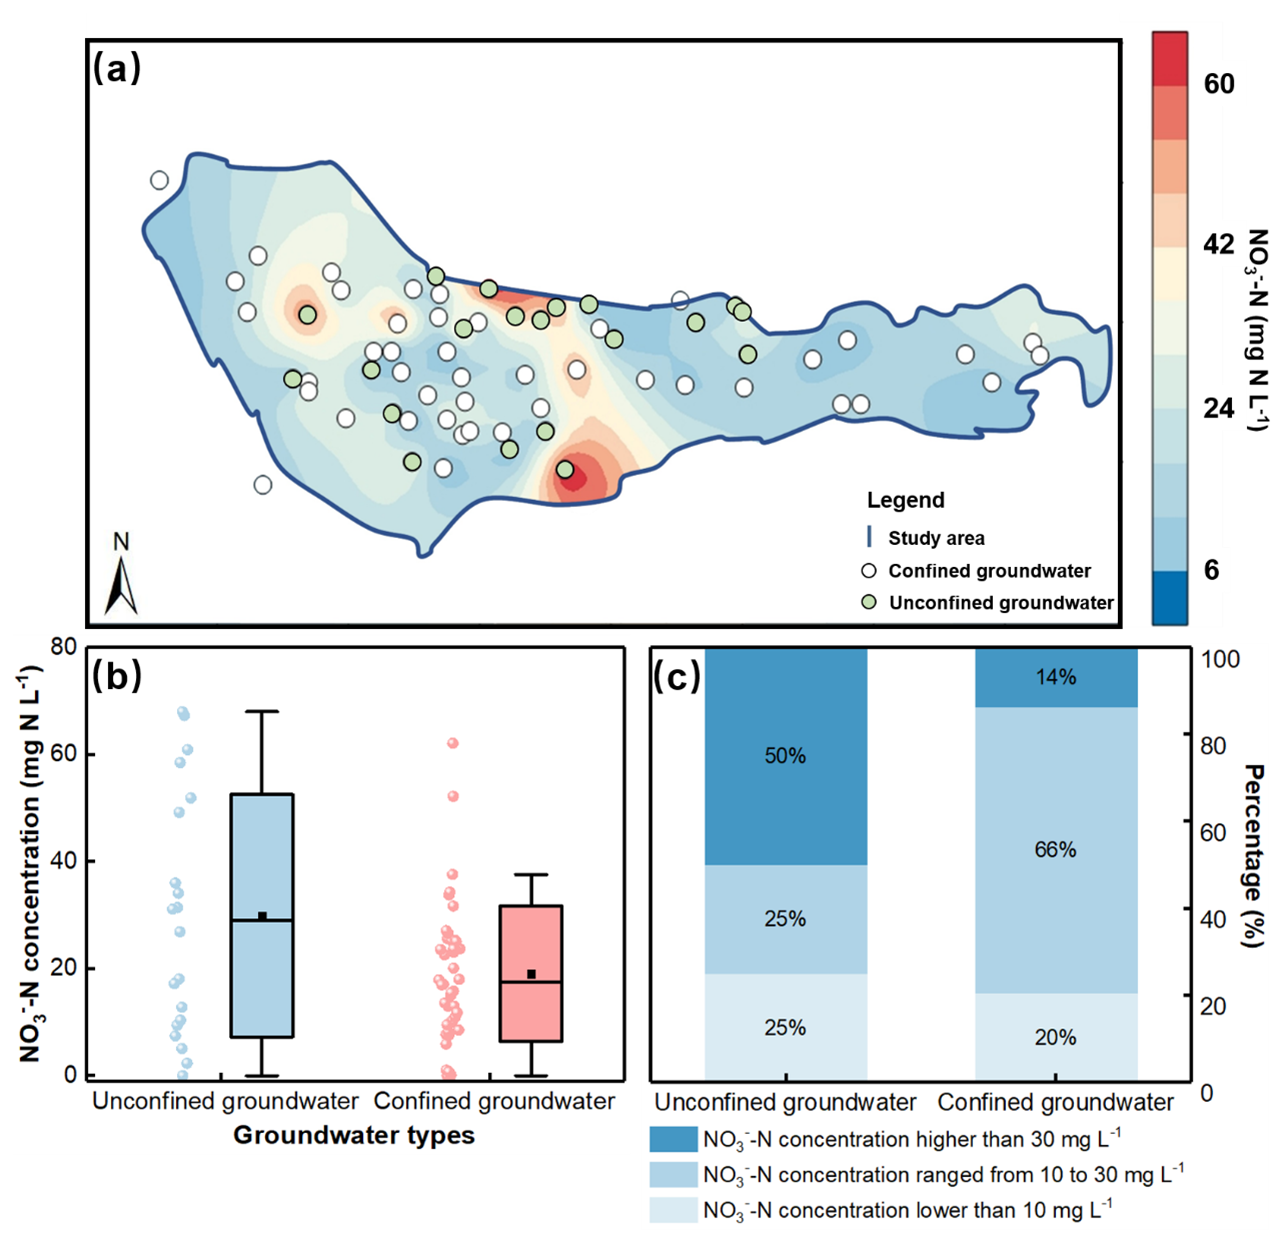
Figure 3(a) Spatial distribution map of NO-N concentrations in unconfined and confined groundwater of the study region. (b) Boxplot of NO-N concentrations. The dot and line represent mean value and median. (c) Percentages of NO-N concentrations in unconfined groundwater and confined groundwater (< 10 mg N L−1, ranging from 10 to 30 mg N L−1, and > 50 mg N L−1).
3.2 NO-N sources apportionment by PCA-APCS-MLR model
3.2.1 Qualitative identification of NO-N sources
The results of Pearson correlation analysis demonstrate that, in the generalized single-layer aquifer (refers to the simplified analytical scenario in which groundwater samples from both unconfined and confined aquifers are treated as a single homogeneous aquifer, without considering differences in occurrence conditions) (Fig. 4a), there is a strong correlation among the nine hydrochemical indicators. For example, Mg2+ is strongly correlated with Na+, Ca2+, Cl−, SO, HCO, and NO, while NO exhibits strong correlations with Ca2+, Mg2+, and Cl−. In the actual double-layer aquifer (refers to the realistic scenario in which unconfined and confined aquifers are analyzed separately, respecting their distinct hydrogeological settings, recharge mechanisms, and pollution pathways) (Fig. 4b and c), the indicators also show strong correlations. Specifically, Ca2+ is strongly correlated with Na+, Mg2+, Cl−, SO42−, HCO, and NO, and NO displays strong correlations with DO, Ca2+, Mg2+, and Cl−. Therefore, the selected hydrochemical indicators are suitable for principal component analysis.
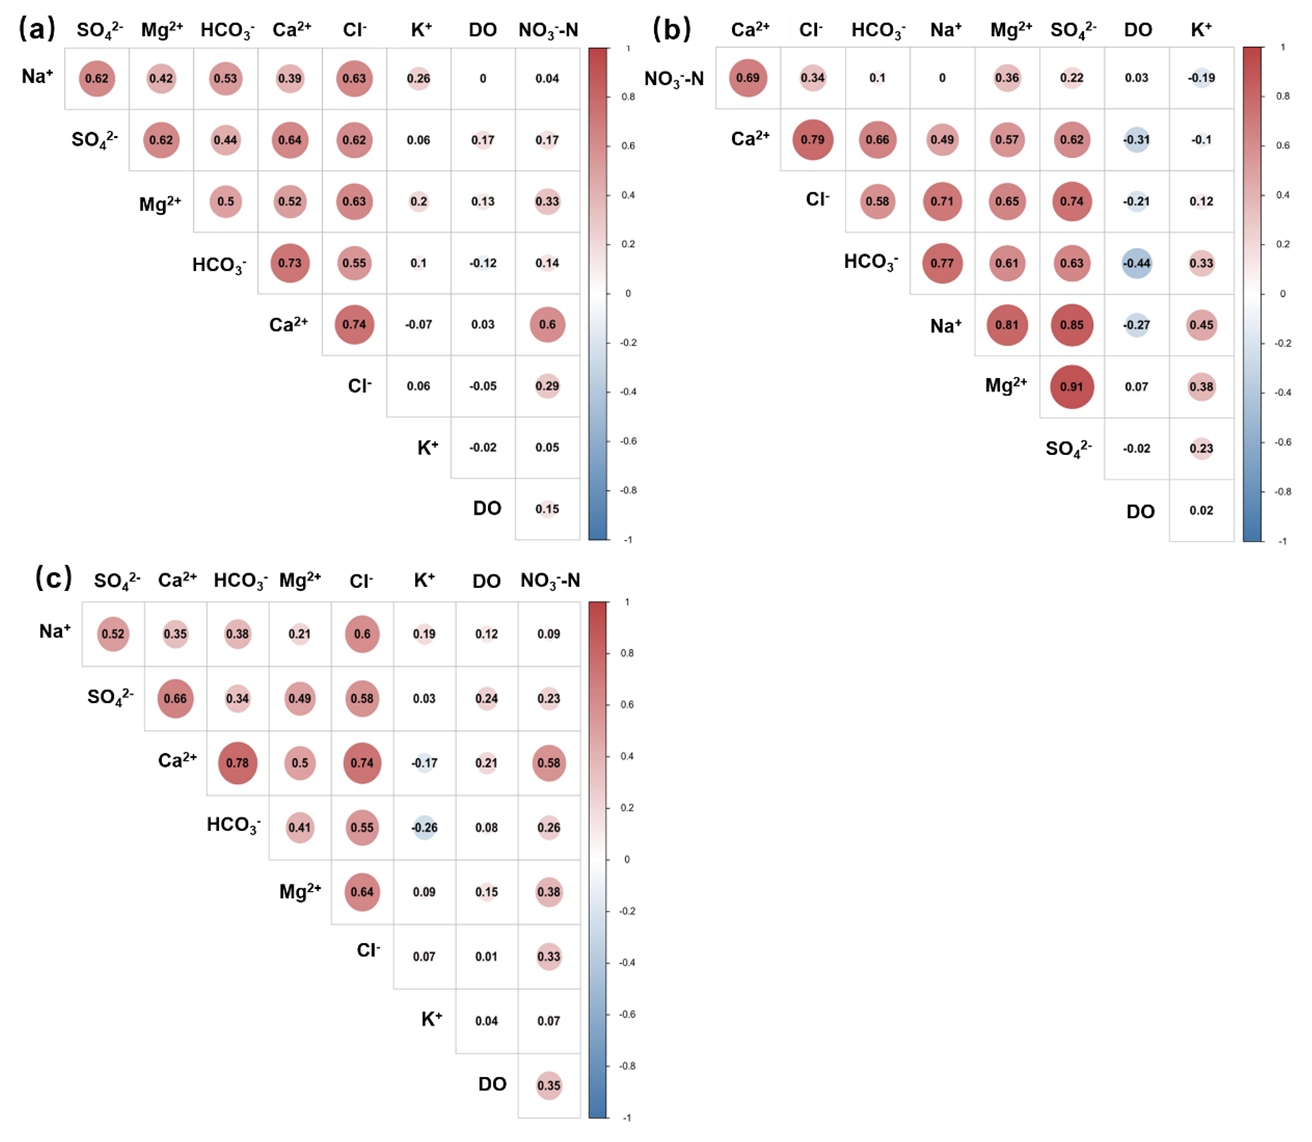
Figure 4Pearson correlation analysis of different hydrochemical indexes. (a) Generalized single-layer aquifer. (b) Actual double-layer aquifer (unconfined groundwater). (c) Actual double-layer aquifer (confined groundwater).
Subsequently, we calculated the rotated factor loadings using the varimax rotation method. The factor loadings reflect the relative importance of each variable in the principal components. Typically, factor loadings greater than 0.7, between 0.7 and 0.5, and between 0.5 and 0.3 are defined as strong, moderate, and weak loadings, respectively. Based on these factors loading results, we identified pollution sources. The results indicate that, for the generalized single-layer aquifer (Fig. 5a), P1 represents pollution from chemical fertilizers, P2 represents natural sources, and P3 represents pollution from manure and sewage. For the actual double-layer aquifer, in the unconfined groundwater (Fig. 5b), P1 represents natural sources, P2 represents pollution from chemical fertilizers, and P3 represents pollution from manure and sewage. In the confined groundwater (Fig. 5c), P1 represents pollution from chemical fertilizers, P2 represents pollution from manure and sewage, and P3 represents natural sources.
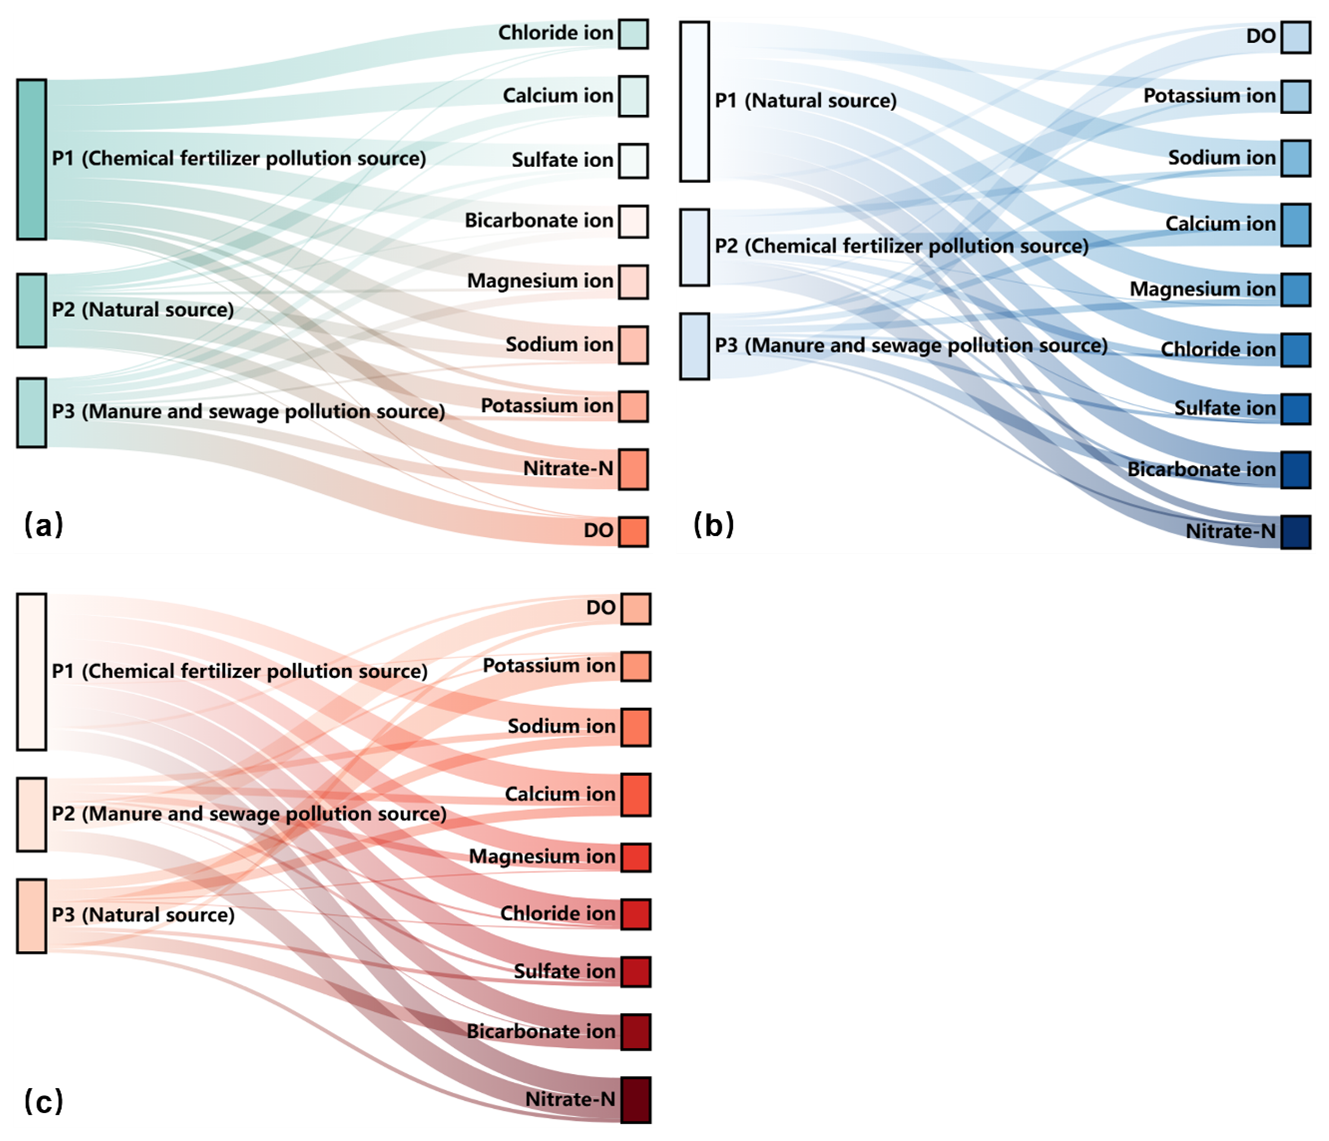
Figure 5Sankey graph of rotation factor load matrix for hydrochemical indexes. (a) Generalized single-layer aquifer. (b) Actual double-layer aquifer (unconfined groundwater).(c) Actual double-layer aquifer (confined groundwater).
3.2.2 Quantitative apportionment of NO-N sources
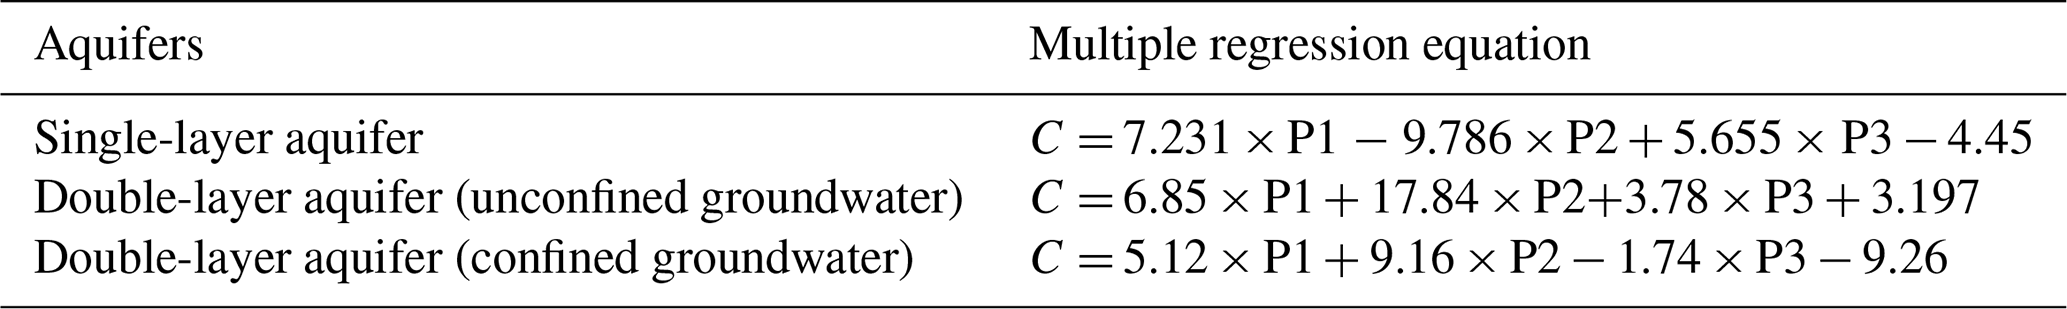
Following the qualitative identification of the major pollution sources, the APCS-MLR method was employed to quantitatively analyze the pollution sources (Table 1). For the generalized single-layer aquifer, the regression equation between NO-N concentration and the absolute principal component scores was established as: C= 7.231 × P1 − 9.786 × P2 + 5.655 × P3 − 4.45 (R2= 0.789, p<0.01). This regression model explains 78.9 % of the variation in NO-N concentration, with the remaining 21.1 % attributable to unknown pollution sources. For the actual double-layer aquifer, in the unconfined aquifer, the regression equation between NO-N concentration and the absolute principal component scores is: C= 6.85 × P1 + 17.84 × P2 + 3.78 × P3 + 3.197 (R2= 0.838, p<0.01), explaining 83.8 % of the variation in NO-N concentration, and the remaining 16.2 % is attributed to unknown pollution sources. In the confined aquifer, the regression equation is: C= 5.12 × P1 + 9.16 × P2 − 1.74 × P3 − 9.26 (R2= 0.841, p<0.01), accounting for 84.1 % of the variation in NO-N concentration, with the remaining 15.9 % attributed to unknown pollution sources.
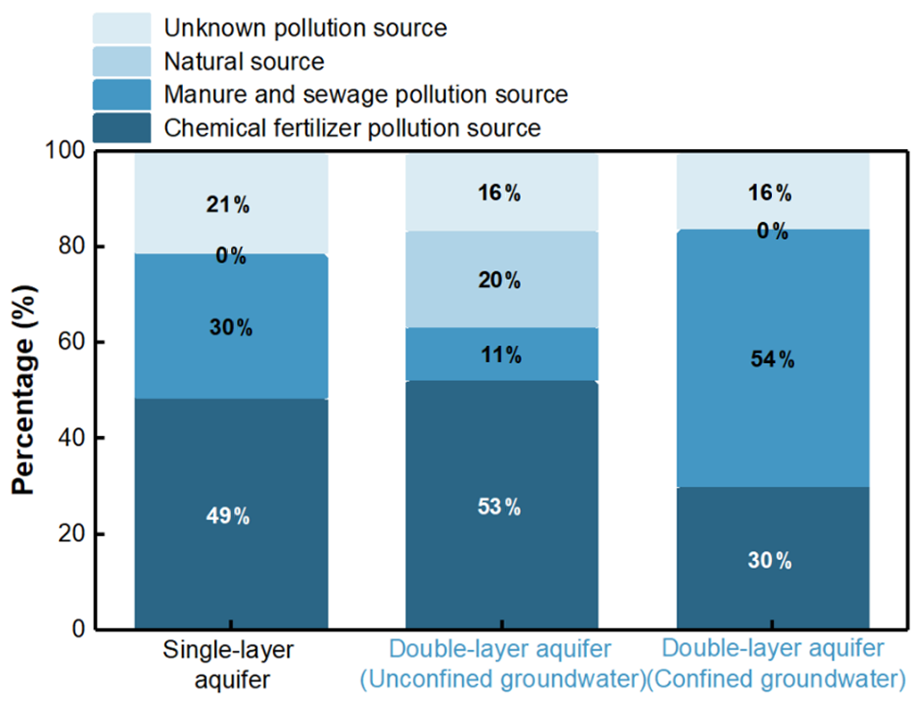
Furthermore, we calculated the contribution rates of each pollution source using the regression equations (Fig. 6). For the generalized single-layer aquifer, the contribution rates of chemical fertilizers, manure and sewage, natural sources, and unknown pollution sources were 48.75 %, 30.15 %, 0 %, and 21.1 %, respectively, with chemical fertilizers being the dominant pollution source. For the actual double-layer aquifer, in the unconfined groundwater, the contribution rates of chemical fertilizers, manure and sewage, natural sources, and unknown pollution sources were 52.51 %, 11.13 %, 20.16 %, and 16.2 %, respectively. In the confined groundwater, the contribution rates were 30.15 % for chemical fertilizers, 53.95 % for manure and sewage, 0 % for natural sources, and 15.9 % for unknown pollution sources. Chemical fertilizers and manure and sewage were identified as the primary pollution sources in the unconfined and confined groundwater, respectively.
3.3 NO-N sources apportionment by MixSIAR model
3.3.1 Distribution characteristics of δ15N and δ18O in groundwater
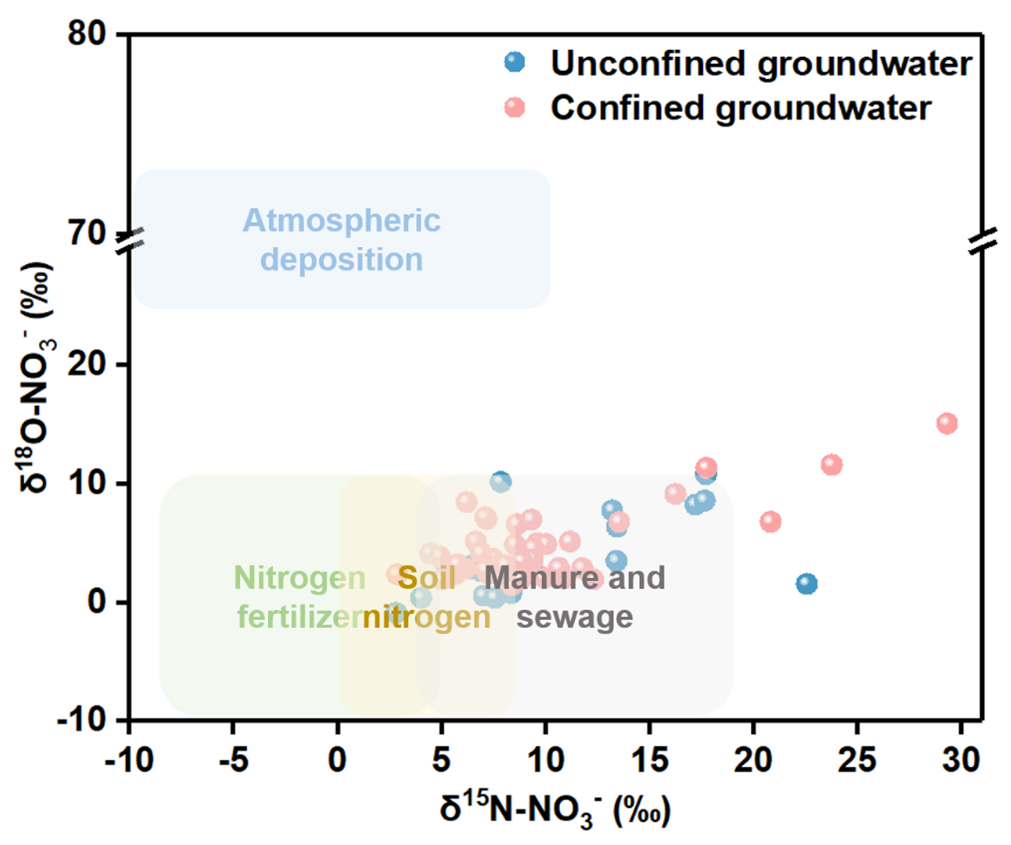
We analyzed the δ15N and δ18O values of NO-N in potential pollution sources (atmospheric deposition, soil nitrogen, chemical fertilizers, and manure and sewage) as well as in groundwater within the study area. The results of the δ15N and δ18O values for the potential pollution sources are presented in the Supplement (Sect. S1). The δ15N and δ18O values of NO-N in groundwater within the study area are shown in Fig. 7. For the generalized single-layer aquifer, the δ15N values range from 2.8 ‰ to 29.29 ‰, with an average of 9.85 ‰, while the δ18O values range from −0.85 ‰ to 15.12 ‰, with an average of 4.42 ‰. For the actual double-layer aquifer, the average δ15N and δ18O values in unconfined groundwater are 10.16 ‰ and 3.93 ‰, respectively, and in confined groundwater, the average δ15N and δ18O values are 9.71 ‰ and 4.6 ‰, respectively.
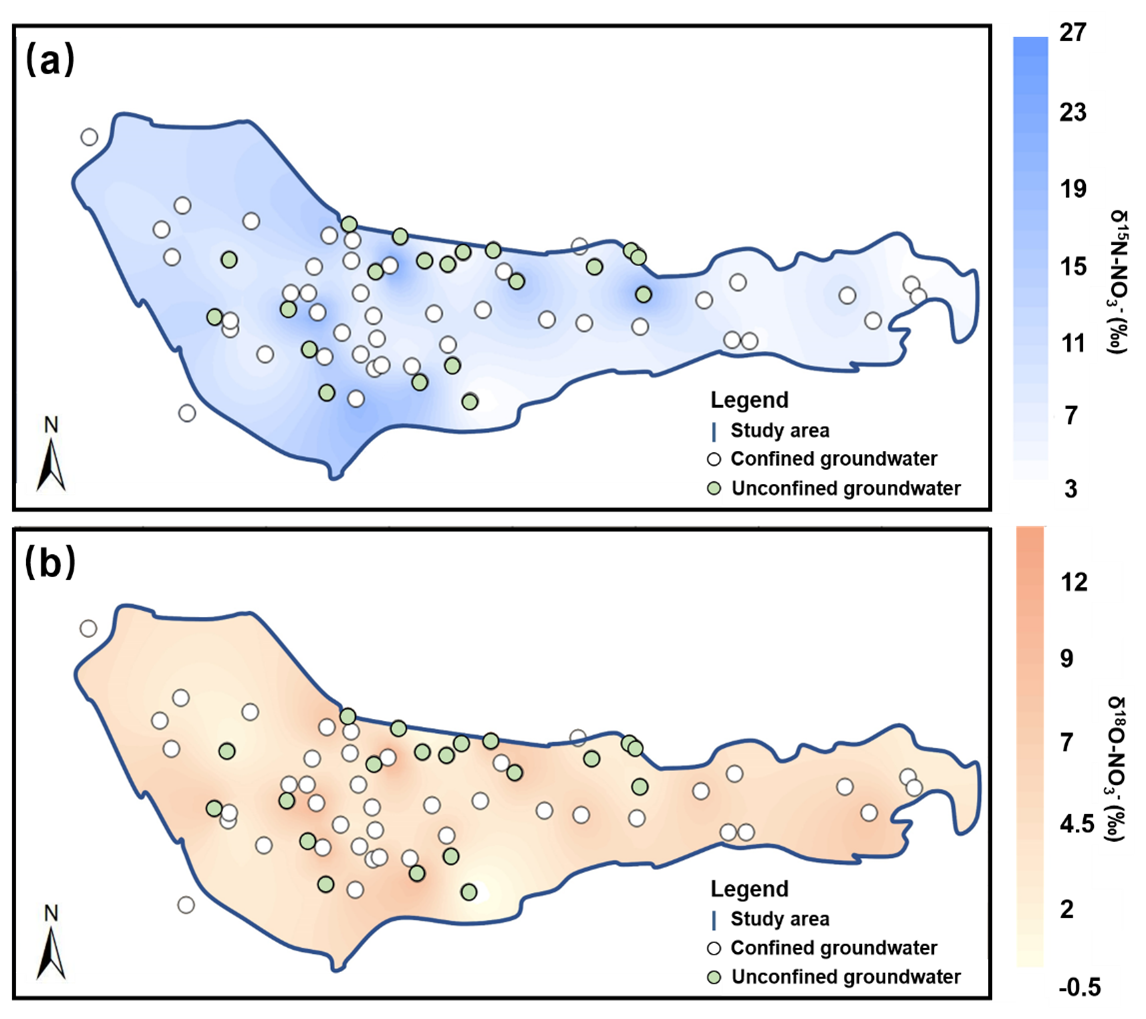
Figure 7Spatial distribution of δ15N-NO (a) and δ18O-NO (b) in the groundwater.
3.3.2 Qualitative identification of NO-N sources
The NO-N in the groundwater of the study area originates from multiple nitrogen pollution sources. Given the distinct isotopic signatures of δ15N and δ18O of NO-N from different sources, qualitative identification of groundwater NO-N sources can be achieved based on the characteristic ranges of these dual isotopes. As shown in Fig. 8, the majority of the δ15N and δ18O values in groundwater locate within the characteristic ranges of chemical fertilizers, soil nitrogen, and manure and sewage. This indicates that the NO-N in the groundwater of the study area is primarily derived from these three pollution sources.
3.3.3 Quantitative apportionment of NO-N sources
The δ15N and δ18O values of groundwater samples, as well as the mean values and standard deviations of δ15N and δ18O for potential pollution sources, were used as known parameters and input into the MixSIAR method. To account for potential errors caused by isotopic fractionation, we calculated the fractionation coefficients for δ15N and δ18O of different pollution sources (Sect. S2) and incorporated these coefficients into the MixSIAR model. Ultimately, by treating the contribution rates of different pollution sources as random variables, we established probabilistic distribution equations for pollution source contributions using the MixSIAR model, thereby determining the extent to which each pollution source contributes to NO-N pollution in groundwater. The results indicate that, for the generalized single-layer aquifer (Fig. 9a), the contribution rates of atmospheric deposition, soil nitrogen, chemical fertilizers, and manure and sewage to NO-N pollution are 4.6 %, 49.5 %, 27.8 %, and 18.1 %, respectively. For the actual double-layer aquifer (Fig. 9b), in the unconfined groundwater, the contribution rates of atmospheric deposition, soil nitrogen, chemical fertilizers, and manure and sewage to NO-N pollution are 5.7 %, 58 %, 20.1 %, and 16.2 %, respectively. In the confined groundwater, the contribution rates of these four pollution sources are 3.1 %, 27.5 %, 31.5 %, and 37.9 %, respectively.
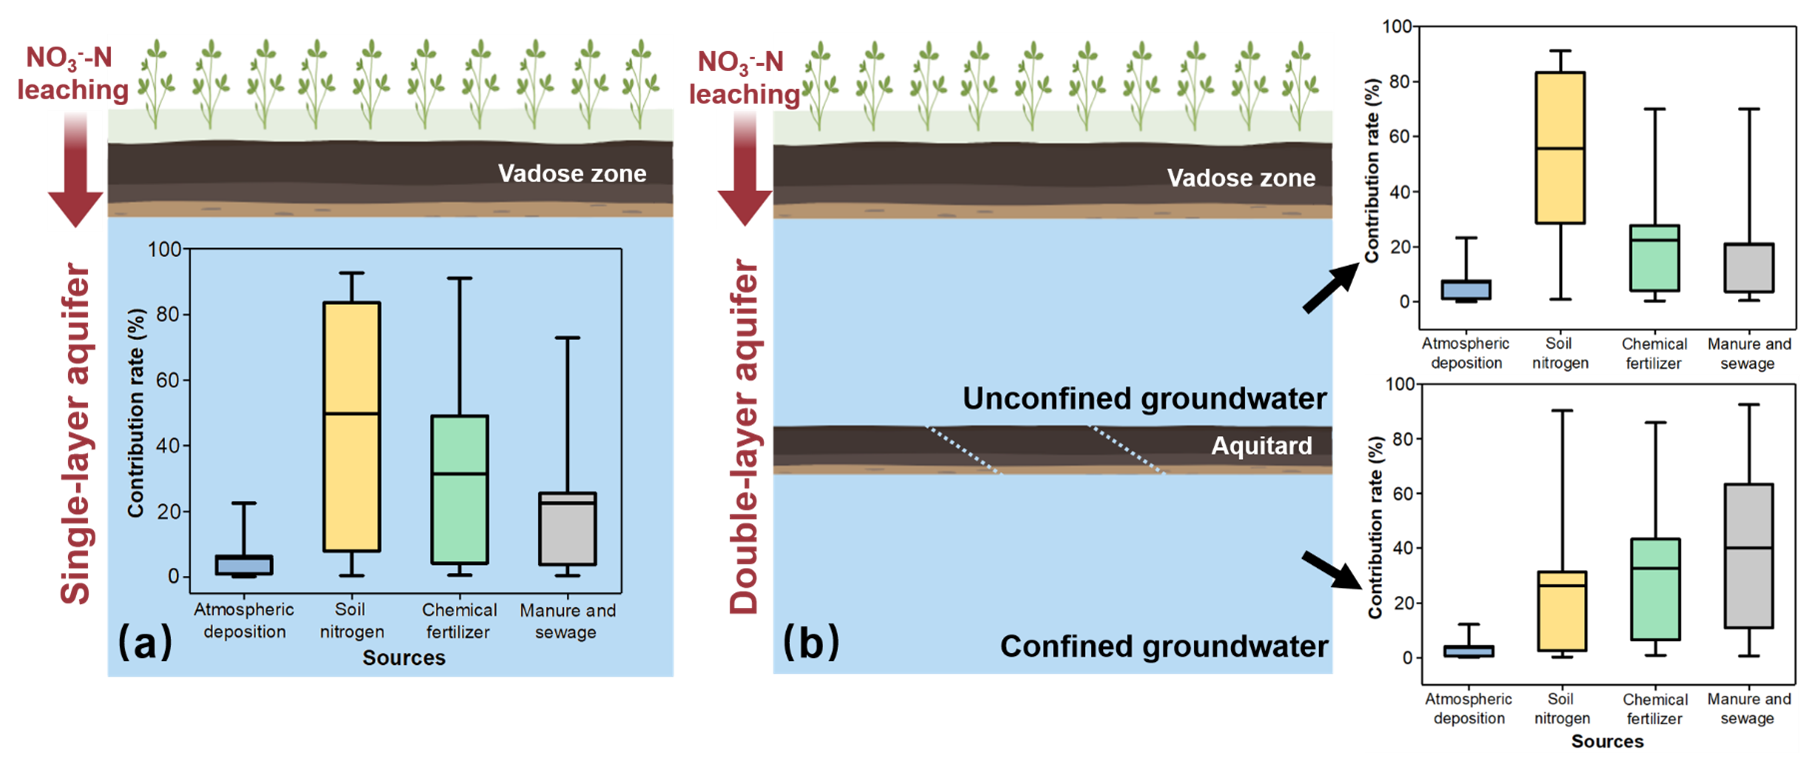
Figure 9Quantitative apportionment of NO-N source based on the MixSIAR method. (a) Generalized single-layer aquifer. (b) Actual double-layer aquifer.
We employed both the PCA-APCS-MLR method and the MixSIAR method to quantitatively identify the sources of NO-N in groundwater under different occurrence conditions. For the PCA-APCS-MLR analysis, different ions exhibit varying loading strengths in each principal component. Therefore, through hydrochemical analysis and statistical methods, we can calculate and infer the type of pollution source represented by each principal component. For example, in unconfined groundwater, Na+, Ca2+, Mg2+, HCO, SO, and Cl− have strong loadings in P1. These ions are all major ions in groundwater, and their average concentrations are relatively low. Moreover, correlation analysis results show that the concentration of NO-N has very low correlation with the concentrations of Na+, Mg2+, HCO, SO, and Cl−, indicating that NO-N does not originate from the same source as these ions (Yu et al., 2022). Thus, it is demonstrated that P1 represents a natural source. In P2, Ca2+ and NO-N have strong loadings. The correlation results (Fig. 4) indicate a significant positive correlation between Ca2+ and NO-N, suggesting that Ca2+ originates from anthropogenic pollution. Because Ca2+ is required in the cultivation of tomatoes and cucumbers (the main crop types in the study area), and the extensive use of calcium fertilizers during the application of base fertilizers and top-dressing fertilizers also increases the concentration of Ca2+ in groundwater (Schot and Wassen, 1993). Therefore, P2 primarily represents the pollution source from chemical fertilizers. In P3, DO has a strong loading. Since the oxidation and decomposition of organic matter require a large amount of DO (Díaz-Cruz and Barceló, 2008), the strong loading of DO is associated with organic pollution of groundwater (such as from manure and sewage). Thus, P3 mainly represents the pollution sources of manure and sewage. After determining the pollution sources represented by each principal component using the above methods, we can calculate the contribution rate of each pollution source using regression equations. The PCA-APCS-MLR method has the advantages of being rapid and convenient, but it has the disadvantage of being unable to further identify soil nitrogen as a pollution source. Accurately apportioning soil-derived NO-N is particularly challenging for hydrochemical-based methods due to the overlapping ionic signatures between soil nitrogen and the leaching of synthetic fertilizers or organic wastes (Yu et al., 2022). To compensate for this limitation, the MixSIAR method was further employed to analyze the sources of pollution. We identified soil nitrogen as another important source of NO-N in groundwater. Additionally, we incorporated isotope fractionation coefficients into the MixSIAR model. Because NO-N from different sources (atmospheric deposition, soil nitrogen, chemical fertilizers, and manure and sewage) has distinct isotopic signatures, and isotopic fractionation occurs during the transport and transformation processes of nitrogen in the groundwater system (such as ammonification and nitrification), leading to changes in the δ15N and δ18O values of NO-N (Shu et al., 2024). Our MixSIAR model incorporated fractionation factors of specific nitrogen transformation processes. This approach, essential for reliable quantification, aligns with established practice in NO-N source apportionment studies, where such constraints are proven to substantially reduce uncertainty (Wang et al., 2023).
In this study, the PCA-APCS-MLR method identified chemical fertilizers as the primary source of NO-N in unconfined groundwater and manure and sewage as the main sources of NO-N in confined groundwater. The MixSIAR method further revealed that soil nitrogen is a dominant pollution source for unconfined groundwater, with a higher contribution rate than that of chemical fertilizers. The identification of soil nitrogen as a major contributor in the unconfined groundwater is significant. Legacy soil nitrogen constitutes a dominant source in the unconfined groundwater, a finding that shifts the pollution focus from direct fertilizer inputs to cumulative soil nitrogen pools. This result is consistent with previous NO-N source studies conducted in other regions (Cui et al., 2023). The findings for unconfined groundwater can be attributed to the extensive use of chemical fertilizers in agricultural production (Hao et al., 2025). Nitrogen from these fertilizers can directly leach into the unconfined groundwater, causing NO-N pollution (Xie et al., 2025). Additionally, excess nitrogen accumulates in the soil and vadose zone, where it is transformed from organic nitrogen to NH-N and then to NO-N under the action of soil microorganisms (Liu et al., 2023). While NH-N can be adsorbed and immobilized by the soil, NO-N can leach into the deeper vadose zone and aquifer through atmospheric precipitation or agricultural irrigation, directly contaminating unconfined groundwater (Wan et al., 2024). This process underscores the phenomenon of the soil and vadose zone as a dynamic “nitrogen reactor and buffer”. Similar delayed release mechanisms from legacy nitrogen stored in thick unsaturated zones have been documented in arid regions (Li et al., 2025), indicating that the risk of groundwater contamination may persist long after surface inputs are reduced. Thus, in assessing the sources of NO-N pollution in regional groundwater, it is crucial not only to focus on the application rates of chemical fertilizers but also to pay attention to the storage of nitrogen in the soil and vadose zone. These accumulated nitrogen compounds can continuously leach into unconfined groundwater under external disturbances (such as irrigation or precipitation), leading to persistent contamination (Niu et al., 2022). Therefore, it is essential to guide local farmers in implementing surface management practices (such as the use of chemical fertilizers and the application of manure) to enforce optimal agricultural irrigation policies, including reducing irrigation frequency, to delay the transport of stored nitrogen in soil to groundwater. For confined groundwater, the MixSIAR method confirmed that manure and sewage is the major source of NO-N. Generally, the nitrogen in manure and sewage primarily exists in the form of large molecules. These complex nitrogen compounds are difficult to degrade microbially or transform chemically in a short period, leading to their long-term persistence in the environment. These pollutants can enter surface water bodies through surface runoff or infiltration and then gradually transport to deeper aquifers via the interflow recharge process between unconfined and confined aquifers, resulting in persistent contamination (McDonough et al., 2022). This may highlight a potential mechanism for sustained NO-N pollution in confined systems, which can be attributed to manure and sewage sources transported via aquifer exchange, providing a continuous input of recalcitrant nitrogen that gradually accumulates in this zone (Zhang et al., 2026). Therefore, for the prevention and control of NO-N pollution in confined groundwater, it is crucial to focus on the source control of manure and sewage to block the migration pathways of pollutants and mitigate their long-term impacts.
This study assessed the discrepancy in source apportionment of NO-N in groundwater obtained under different groundwater occurrence conditions. This discrepancy can be attributed to two main factors. First, the sources and recharge mechanisms of groundwater in unconfined and confined aquifers differ significantly (Liu et al., 2025), leading to distinct isotopic compositions and characteristic values. For example, the isotopic signature of a pollution source in an unconfined aquifer may resemble that of another source in a confined aquifer. Such overlapping isotopic signals can lead to ambiguous source identification. However, previous studies often fail to explicitly distinguish between groundwater occurrence conditions, and instead rely on land-use as a primary proxy for pollution source identification (Yu et al., 2020). When mixed calculations are performed without considering the actual occurrence conditions, the isotopic differences are obscured, which may lead to an underestimation or overestimation of pollution source contributions to groundwater. Second, the migration and transformation capacities of nitrogen vary among different geological strata. Hydrogeological conditions can influence the intensity of biogeochemical processes such as ammonification, nitrification, denitrification (Dai et al., 2023), and adsorption (Huang et al., 2022; Li et al., 2023), which further alter NO-N concentrations and isotopic signatures. This ultimately affects the accuracy and reliability of pollution source apportionment. Consequently, effective management of NO-N in groundwater systems requires policy interventions tailored to specific groundwater occurrence conditions. In unconfined groundwater, which is highly vulnerable to surface-derived inputs, management should prioritize agricultural best practices such as optimized irrigation scheduling — reducing both frequency and volume of irrigation – coupled with the promotion of slow-release or stabilized nitrogen fertilizers. These measures can significantly decrease the rapid leaching of soil nitrogen pools, thereby mitigating short-term, large-scale pulses of NO-N into groundwater. Besides, the confined groundwater, often affected by legacy pollution, requires long-term strategies focused on source control. This includes stricter regulation and monitoring of manure storage facilities, improved wastewater treatment infrastructure, and the implementation of containment systems to prevent leaching from historical contamination hotspots. Given the limited attenuation capacity and persistent nature of NO-N in confined groundwater, remediation efforts may also need to consider engineered attenuation or pump-and-treat systems in severely affected zones. Future research should integrate reactive-transport modeling with isotopic mixing models to better capture the dynamic behavior of nitrogen in dual-layer aquifer systems and to further reduce uncertainty in source apportionment under varying hydrogeological conditions.
The study quantitatively analyzed the pollution sources of NO-N in groundwater under different occurrence conditions using PCA-APCS-MLR and MixSIAR methods. The results showed that the groundwater NO-N concentration in the study area ranged from 0 to 68 mg N L−1, with an exceedance rate of 75 %. The NO-N pollution in unconfined groundwater (average concentration 29.9 mg N L−1) was more severe than that in confined groundwater (average concentration 20.1 mg N L−1). NO-N in unconfined groundwater predominantly originates from soil nitrogen (58 %), with a non-negligible contribution from chemical fertilizers. Therefore, it is necessary to focus on the storage of nitrogen in the soil and improve agricultural irrigation practices to prevent rapid infiltration of NO-N into unconfined groundwater, which could lead to persistent contamination. NO-N enrichment in confined groundwater is primarily attributed to manure and sewage (37.9 %). Regulations and infrastructure for the treatment and disposal of domestic sewage and livestock waste should be strengthened to prevent their extensive accumulation in confined groundwater. Moreover, ignoring the groundwater occurrence conditions leads to marked deviations in the source apportionment results. Pollution source identification and control policies for groundwater must explicitly distinguish between unconfined and confined groundwater.
The data of this study can be found in Liu (2026, https://doi.org/10.17632/53d3ktbg8d.2).
The supplement related to this article is available online at https://doi.org/10.5194/hess-30-1449-2026-supplement.
YL: Writing – review & editing, Writing – original draft, Visualization, Methodology, Investigation, Formal analysis, Data curation, Conceptualization.
JL: Writing – review & editing, Supervision, Methodology, Conceptualization.
YJW: Writing – review & editing, Supervision, Methodology, Conceptualization.
ZYZ: Visualization, Investigation, Methodology, Conceptualization.
XLZ: Supervision, Conceptualization.
TYZ: Writing – review & editing, Supervision, Resources, Methodology, Investigation, Conceptualization, Funding acquisition.
The contact author has declared that none of the authors has any competing interests.
Publisher's note: Copernicus Publications remains neutral with regard to jurisdictional claims made in the text, published maps, institutional affiliations, or any other geographical representation in this paper. The authors bear the ultimate responsibility for providing appropriate place names. Views expressed in the text are those of the authors and do not necessarily reflect the views of the publisher.
This research has been supported by the National Key Research and Development Program of China (no. 2024YFC3213900), the National Natural Science Foundation of China (nos. 42422207 and 42507105).
This paper was edited by Heng Dai and reviewed by three anonymous referees.
Cui, R., Zhang, D., Hu, W., Zhao, X., Yan, H., Liu, G., and Chen, A.: Nitrogen in soil, manure and sewage has become a major challenge in controlling nitrate pollution in groundwater around plateau lakes, Southwest China, J. Hydrol. 620, 129541, https://doi.org/10.1016/j.jhydrol.2023.129541, 2023.
Dai, H., Zhang, Y., Fang, W., Liu, J., Hong, J., Zou, C., and Zhang, J.: Microbial community structural response to variations in physicochemical features of different aquifers, Front. Microbiol., 14, 1025964, https://doi.org/10.3389/fmicb.2023.1025964, 2023.
Díaz-Cruz, M. S. and Barceló, D.: Trace organic chemicals contamination in ground water recharge, Chemosphere, 72, 333–342, https://doi.org/10.1016/j.chemosphere.2008.02.031, 2008.
Gibrilla, A., Fianko, J. R., Ganyaglo, S., Adomako, D., Anornu, G., and Zakaria, N.: Nitrate contamination and source apportionment in surface and groundwater in Ghana using dual isotopes (15N and 18O-NO3) and a Bayesian isotope mixing model, J. Contam. Hydrol., 233, 103658, https://doi.org/10.1016/j.jconhyd.2020.103658, 2020.
Greenberg, A. E., Trussell, R. R., Clesceri, L. S., and Association, A. W. W.: Standard methods for the examination of water and wastewater: supplement to the 16th edition, Am. J. Public Health N., 56, 387, https://doi.org/10.2105/AJPH.56.4.684-a, 2005.
Gutiérrez, M., Biagioni, R. N., Alarcón-Herrera, M. T., and Rivas-Lucero, B. A.: An overview of nitrate sources and operating processes in arid and semiarid aquifer systems, Sci. Total Environ., 624, 1513–1522, https://doi.org/10.1016/j.scitotenv.2017.12.252, 2018.
Hao, Y., Zheng, T., Liu, L., Li, P., Ma, H., Zheng, Z., Zheng, X., and Luo, J.: Occurrence of dissimilatory nitrate reduction to ammonium (DNRA) in groundwater table fluctuation zones during dissolved organic nitrogen leaching through unsaturated zone, J. Hazard. Mater., 489, 137501, https://doi.org/10.1016/j.jhazmat.2025.137501, 2025.
Huang, X., Jin, M., Ma, B., Liang, X., Cao, M., Zhang, J., Zhang, Z., and Su, J.: Identifying nitrate sources and transformation in groundwater in a large subtropical basin under a framework of groundwater flow systems, J. Hydrol., 610, 127943, https://doi.org/10.1016/j.jhydrol.2022.127943, 2022.
Ji, X., Shu, L., Chen, W., Chen, Z., Shang, X., Yang, Y., Dahlgren, R. A., and Zhang, M.: Nitrate pollution source apportionment, uncertainty and sensitivity analysis across a rural-urban river network based on δ15N/δ18O-NO isotopes and SIAR modeling, J. Hazard. Mater., 438, 129480, https://doi.org/10.1016/j.jhazmat.2022.129480, 2022.
Kellman, L. M. and Hillaire-Marcel, C.: Evaluation of nitrogen isotopes as indicators of nitrate contamination sources in an agricultural watershed, Agr. Ecosyst. Environ., 95, 87–102, https://doi.org/10.1016/s0167-8809(02)00168-8, 2003.
Li, J., Liu, Y., Dai, W., Li, J., Yang, P., Tian, L., Yu, S., Zuo, R., Zhai, Y., and Song, W.: Nitrate attenuation with rising groundwater levels: An integrated assessment using isotope tracers and microbial signatures, J. Hydrol., 624, 129911, https://doi.org/10.1016/j.jhydrol.2023.129911, 2023.
Li, S., Chow, R., Su, H., Han, F., and Li, Z.: Multiple isotopes and GIS analyses reveal sources and drivers of nitrate in the Loess Plateau's groundwater, Environ. Pollut., 127022, https://doi.org/10.1016/j.envpol.2025.127022, 2025.
Liang, X., Zhan, H., Zhang, Y. K., and Schilling, K.: Base flow recession from unsaturated-saturated porous media considering lateral unsaturated discharge and aquifer compressibility, Water Resour. Res., 53, 7832–7852, https://doi.org/10.1002/2017wr020938, 2017.
Liu, S., Zheng, T., Li, Y., and Zheng, X.: A critical review of the central role of microbial regulation in the nitrogen biogeochemical process: New insights for controlling groundwater nitrogen contamination, J. Environ. Manage., 328, 116959, https://doi.org/10.1016/j.jenvman.2022.116959, 2023.
Liu, W., Du, Y., Qiu, W., Deng, Y., and Wang, Y.: Constraints on vertical variability of geogenic ammonium in multi-layered aquifer systems, Water Res., 268, 122639, https://doi.org/10.1016/j.watres.2024.122639, 2025.
Liu, Y., Xin, J., Wang, Y., Yang, Z., Liu, S., and Zheng, X.: Dual roles of dissolved organic nitrogen in groundwater nitrogen cycling: nitrate precursor and denitrification promoter, Sci. Total Environ., 811, 151375, https://doi.org/10.1016/j.scitotenv.2021.151375, 2022.
Ma, J., Liu, H., Tong, L., Wang, Y., Chen, R., Liu, S., Zhao, L., Li, Z., and Cai, L.: Relationships between microbial communities and groundwater chemistry in two pristine confined groundwater aquifers in central China, Hydrol. Process., 33, 1993–2005, https://doi.org/10.1002/hyp.13437, 2019.
Liu, Y.: Data Availability for HESS, V2, Mendeley Data [data set], https://doi.org/10.17632/53d3ktbg8d.2, 2026.
Mao, H., Wang, G., Liao, F., Shi, Z., Zhang, H., Chen, X., Qiao, Z., Li, B., and Bai, Y.: Spatial variability of source contributions to nitrate in regional groundwater based on the positive matrix factorization and Bayesian model, J. Hazard. Mater., 445, 130569, https://doi.org/10.1016/j.jhazmat.2022.130569, 2023.
McDonough, L. K., Andersen, M. S., Behnke, M. I., Rutlidge, H., Oudone, P., Meredith, K., O Carroll, D. M., Santos, I. R., Marjo, C. E., and Spencer, R. G.: A new conceptual framework for the transformation of groundwater dissolved organic matter, Nat. Commun., 13, 2153, https://doi.org/10.1038/s41467-022-29711-9, 2022.
Meng, L., Zuo, R., Wang, J., Yang, J., Teng, Y., Shi, R., and Zhai, Y.: Apportionment and evolution of pollution sources in a typical riverside groundwater resource area using PCA-APCS-MLR model, J. Contam. Hydrol., 218, 70–83, https://doi.org/10.1016/j.jconhyd.2018.10.005, 2018.
Minet, E. P., Goodhue, R., Meier-Augenstein, W., Kalin, R. M., Fenton, O., Richards, K. G., and Coxon, C. E.: Combining stable isotopes with contamination indicators: a method for improved investigation of nitrate sources and dynamics in aquifers with mixed nitrogen inputs, Water Res., 124, 85–96, https://doi.org/10.1016/j.watres.2017.07.041, 2017.
Moore, J. W. and Semmens, B. X.: Incorporating uncertainty and prior information into stable isotope mixing models, Ecol. Lett., 11, 470–480, https://doi.org/10.1111/j.1461-0248.2008.01163.x, 2008.
Niu, X., Jia, X., Yang, X., Wang, J., Wei, X., Wu, L., and Shao, M.: Tracing the sources and fate of NOin the vadose zone–groundwater system of a thousand-year-cultivated region, Environ. Sci. Technol., 56, 9335–9345, https://doi.org/10.1021/acs.est.1c06289, 2022.
Picetti, R., Deeney, M., Pastorino, S., Miller, M. R., Shah, A., Leon, D. A., Dangour, A. D., and Green, R.: Nitrate and nitrite contamination in drinking water and cancer risk: A systematic review with meta-analysis, Environ. Res., 210, 112988, https://doi.org/10.1016/j.envres.2022.112988, 2022.
Ransom, K. M., Grote, M. N., Deinhart, A., Eppich, G., Kendall, C., Sanborn, M. E., Souders, A. K., Wimpenny, J., Yin, Q. Z., and Young, M.: Bayesian nitrate source apportionment to individual groundwater wells in the Central Valley by use of elemental and isotopic tracers, Water Resour. Res., 52, 5577–5597, https://doi.org/10.1002/2015wr018523, 2016.
Rivett, M. O., Buss, S. R., Morgan, P., Smith, J. W., and Bemment, C. D.: Nitrate attenuation in groundwater: a review of biogeochemical controlling processes, Water Res., 42, 4215–4232, https://doi.org/10.1016/j.watres.2008.07.020, 2008.
Romanelli, A., Soto, D. X., Matiatos, I., Martínez, D. E., and Esquius, S.: A biological and nitrate isotopic assessment framework to understand eutrophication in aquatic ecosystems, Sci. Total Environ., 715, 136909, https://doi.org/10.1016/j.scitotenv.2020.136909, 2020.
Ruan, D., Bian, J., Wang, Y., Wu, J., and Gu, Z.: Identification of groundwater pollution sources and health risk assessment in the Songnen Plain based on PCA-APCS-MLR and trapezoidal fuzzy number-Monte Carlo stochastic simulation model, J. Hydrol., 632, 130897, https://doi.org/10.1016/j.jhydrol.2024.130897, 2024.
Schot, P. P. and Wassen, M. J.: Calcium concentrations in wetland groundwater in relation to water sources and soil conditions in the recharge area, J. Hydrol., 141, 197–217, https://doi.org/10.1016/0022-1694(93)90050-j, 1993.
Shu, L., Chen, W., Liu, Y., Shang, X., Yang, Y., Dahlgren, R. A., Chen, Z., Zhang, M., and Ji, X.: Riverine nitrate source identification combining δ15N/δ18O-NO with Δ17O-NO and a nitrification 15N-enrichment factor in a drinking water source region, Sci. Total Environ., 918, 170617, https://doi.org/10.1016/j.scitotenv.2024.170617, 2024.
Thurston, G. D. and Spengler, J. D.: A quantitative assessment of source contributions to inhalable particulate matter pollution in metropolitan Boston, Atmos. Environ., 19, 9–25, https://doi.org/10.1016/0004-6981(85)90132-5, 1985.
Wan, Y., Li, R., Yao, K., Peng, C., Wang, W., Li, N., and Wang, X.: Bioelectro-barriers prevent nitrate leaching into groundwater via nitrogen retention, Water Res., 249, 120988, https://doi.org/10.1016/j.watres.2023.120988, 2024.
Wang, D., Li, P., Yang, N., Yang, C., Zhou, Y., and Li, J.: Distribution, sources and main controlling factors of nitrate in a typical intensive agricultural region, northwestern China: vertical profile perspectives, Environ. Res., 237, 116911, https://doi.org/10.1016/j.envres.2023.116911, 2023.
Wong, W. W., Grace, M. R., Cartwright, I., and Cook, P. L.: Unravelling the origin and fate of nitrate in an agricultural–urban coastal aquifer, Biogeochemistry, 122, 343–360, https://doi.org/10.1007/s10533-014-0045-4, 2015.
Xie, L., Li, P., Fida, M., and Elumalai, V.: Characteristics and potential health risk of inorganic nitrogen in phreatic water in the central and southern parts of Yinchuan Plain (Northwest China), Expo. Health, 17, 581–598, https://doi.org/10.1007/s12403-024-00679-9, 2025.
Xin, J., Liu, Y., Chen, F., Duan, Y., Wei, G., Zheng, X., and Li, M.: The missing nitrogen pieces: A critical review on the distribution, transformation, and budget of nitrogen in the vadose zone-groundwater system, Water Res., 165, 114977, https://doi.org/10.1016/j.watres.2019.114977, 2019.
Xin, J., Wang, Y., Shen, Z., Liu, Y., Wang, H., and Zheng, X.: Critical review of measures and decision support tools for groundwater nitrate management: A surface-to-groundwater profile perspective, J. Hydrol., 598, 126386, https://doi.org/10.1016/j.jhydrol.2021.126386, 2021.
Yang, L., Han, J., Xue, J., Zeng, L., Shi, J., Wu, L., and Jiang, Y.: Nitrate source apportionment in a subtropical watershed using Bayesian model, Sci. Total Environ., 463, 340–347, https://doi.org/10.1016/j.scitotenv.2013.06.021, 2013.
Yu, L., Zheng, T., Zheng, X., Hao, Y., and Yuan, R.: Nitrate source apportionment in groundwater using Bayesian isotope mixing model based on nitrogen isotope fractionation, Sci. Total Environ., 718, 137242, https://doi.org/10.1016/j.scitotenv.2020.137242, 2020.
Yu, L., Zheng, T., Yuan, R., and Zheng, X.: APCS-MLR model: a convenient and fast method for quantitative identification of nitrate pollution sources in groundwater, J. Environ. Manage., 314, 115101, https://doi.org/10.1016/j.jenvman.2022.115101, 2022.
Zhang, T., Lei, Q., Liu, H., Ding, K., Luo, J., Qiu, W., Ma, Y., Xu, Q., Zhao, Y., and Liu, X.: Vertical migration of multi-source nitrates driven by multiple water inputs in groundwater base on combined nitrogen-oxygen and hydrogen-oxygen isotopes, J. Hazard. Mater., 141181, https://doi.org/10.1016/j.jhazmat.2026.141181, 2026.