the Creative Commons Attribution 4.0 License.
the Creative Commons Attribution 4.0 License.
 | 09 Sep 2025
Rainfall recharge thresholds decrease after an intense fire over a near-surface cave at Wombeyan, Australia
Christina Song
Micheline Campbell
Quantifying the amount of rainfall needed to generate groundwater recharge is important for the sustainable management of groundwater resources. Here, we quantify rainfall recharge thresholds using drip loggers situated in a near-surface cave: Wildman's Cave at Wombeyan, southeast Australia. In just over 2 years of monitoring, 42 potential recharge events were identified in the cave, approximately 4 m below the land surface and comprising a 30° slope with 37 % bare rock. Recharge events occurred within 48 h of rainfall. Using daily precipitation data, the median 48 h rainfall needed to generate recharge was 19.8 mm, without clear seasonal variability. An intense experimental fire experiment was conducted 18 months into the monitoring period: the median 48 h rainfall needed to generate recharge was 22.1 mm before the fire (n= 22) and 16.4 mm after the fire (n= 20), with the decrease in rainfall recharge most noticeable starting 3 months after the fire. Rainfall recharge thresholds and the number of potential recharge events at Wildman's Cave are consistent with those published from other caves in water-limited Australia. At Wildman's Cave, we infer that soil water storage, combined with the generation of overland flow over bare limestone surfaces, is the pathway for water movement to the subsurface via fractures and that these determine the rainfall recharge threshold. Immediately after the fire, surface ash deposits initially retard overland flow, and after ash removal from the land surface, soil loss and damage decrease the available soil water storage capacity, leading to more efficient infiltration and a decreased rainfall recharge threshold.
- Article
(2591 KB) - Full-text XML
-
Supplement
(765 KB) - BibTeX
- EndNote


Groundwater recharge is a vital process where freshwater replenishes itself to support and nurture a healthy ecosystem and provide a source of water for human use. The groundwater recharge process is strongly controlled by climatic and geologic factors in association with temporal variability (Ajami, 2021). In warmer climates, evapotranspiration of water can occur at a faster rate than it can be replenished by rainfall, limiting the occurrence of recharge to infrequent, high-magnitude rainfall events (for example, Boas and Mallants, 2022). In lithologies that have low permeability, recharge is limited to preferential flow pathways such as fractures, leading to a very low fraction of annual rainfall generating recharge (Kotchoni et al., 2019).
Quantifying both the timing and amount of groundwater recharge is a challenge, yet fundamentally important if changes in groundwater recharge over time are to be quantified (e.g. Noori et al., 2023). At the event scale, only a few techniques are available to identify recharge, and the source and age of the water being analysed are often uncertain. Recharge events can be identified in some groundwater wells or bores where fluctuations in groundwater level can be observed over time using the water table fluctuation method (Healy and Cook, 2002). Recently, a new approach has been proposed that uses loggers in underground spaces such as caves that are situated in the unsaturated zone (Baker et al., 2020, 2021). This approach identifies when water percolates into the subsurface void and has been proposed as another method for identifying both the timing of recharge events at the event scale and the amount of rainfall needed for caves, tunnels and mines (Baker et al., 2024).
Fire can have an impact on subsurface hydrology; however its role in recharge processes is less well understood. For example, ash beds have a variable impact on hydrology and have been shown both to increase runoff and to reduce infiltration (e.g. Gabet and Sternberg, 2008) and store water, increasing infiltration (e.g. Woods and Balfour, 2008), and in general ash has a higher capacity to hold water than soil (Bodí et al., 2014). However, the formation of ash crusts may enhance overland flow and impede infiltration (Balfour et al., 2014; Onda et al., 2008). Ash crusts are thought to form due to physical–chemical properties of ash as well as rainfall compaction. Ashes which contain oxides (well-combusted ashes) may form ash crusts due to the hydration and recrystallisation of carbonate crusts (Balfour et al., 2014; Bodí et al., 2014). These crusts are generally ephemeral, but post-fire changes to hydrology may persist for several years (Cerdà, 1998). Furthermore, ash can clog soil pores, further reducing infiltration capacity (Bodí et al., 2014; Woods and Balfour, 2008).
Here, we use the unsaturated zone monitoring approach that uses loggers in underground spaces to investigate the potential impacts of fire on the amount of rainfall needed to generate recharge. Between December 2014 and May 2017, before and after a fire, cave drip water hydrological monitoring was undertaken at a shallow cave site in southeast Australia as part of a wider investigation of the impacts of fire on karst processes. The experimental design was to have at least 1 year of monitoring data before and after a fire, to assess potential impacts on the cave environment. Hydrograph analysis and percolation water geochemical analyses from that study were published by Bian et al. (2019); however, the amount of rainfall needed to generate recharge using cave percolation waters was not determined. Bian et al. (2019) demonstrated percolation water events into the cave were characterised by hydrographs of shorter duration and with higher maxima after the fire. Combined with inorganic geochemical and water isotope data, this observation was interpreted as increased preferential (fracture) flow and decreased diffuse flow (from the soil) after the fire. Because Bian et al. (2019) did not analyse the hydrology data to obtain rainfall recharge thresholds for each potential recharge event, this analysis is undertaken here (1) to quantify the rainfall recharge threshold for the site, (2) to investigate seasonal variations in rainfall recharge threshold and the possible impact of surface fire on rainfall recharge thresholds, and (3) to compare results to those reported from sites in southern and eastern Australia (Baker et al., 2020, 2021).
Wildman's Cave is located at 608 m above sea level in the Wombeyan Caves Karst Conservation Reserve (34°19′′ S, 149°58′′ E), in the southeastern part of New South Wales, Australia (Fig. 1). It is formed in the Silurian age Wombeyan Limestone formation, a marble which is highly fractured with no matrix porosity remaining (Osborne, 1993). Subsurface water movement is therefore dominated by fracture and conduit flows. The cave is small and shallow with a narrow pothole type entrance and a total of 42 m of cave passage containing numerous stalactites (Wylie and Wylie, 2004). The cave is approximately 4 m below the land surface. The surface above the cave comprises a 30° sloping ridgeline. 37 % of the surface has no soil cover; the remaining land surface has a median 5 cm soil cover, reaching a maximum 33 cm where soil has accumulated in fractures. Vegetation, where present, comprises dry sclerophyll shrubs and grasses.
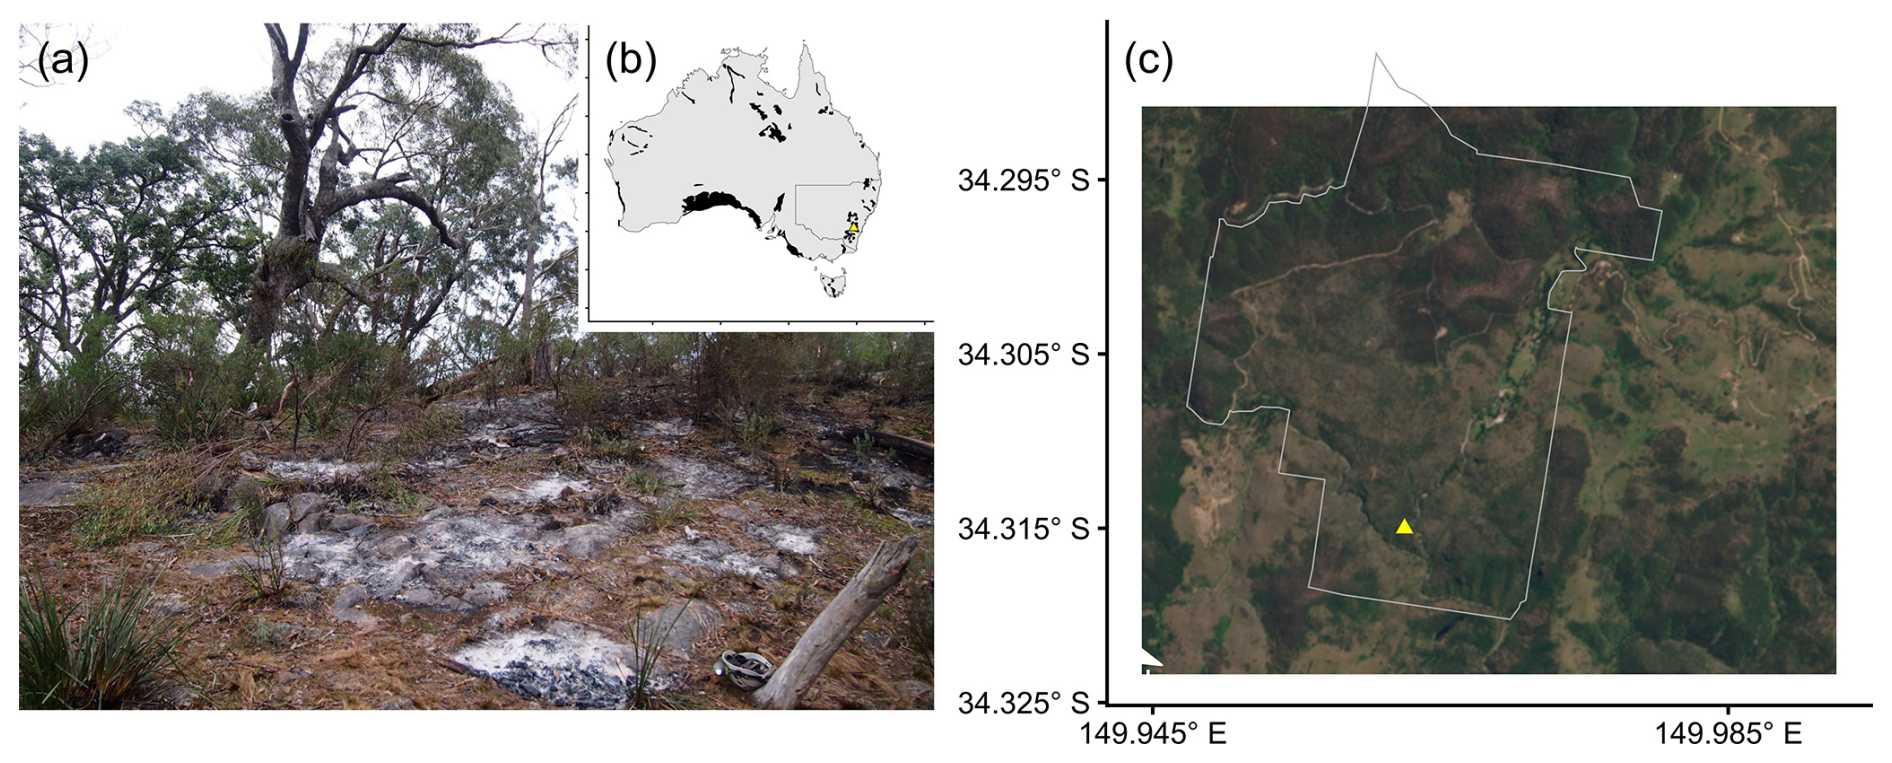
Figure 1(a) Photograph of the surface above the cave 1 d after the fire (source: Andy Baker). (b) Australia with karst overlay (black); yellow triangle indicates the study site (WOKAM; from Chen et al (2017). (c) Sentinel S2 visible image, with outer bounds of the Wombeyan Karst Reserve. Sentinel S2 True Colour image (2024). Retrieved from Copernicus Dataspace (7 December 2024), processed by Copernicus. Wombeyan karst conservation reserve boundary: State Government of NSW and NSW Department of Climate Change, Energy, the Environment and Water 2000, NSW National Parks and Wildlife Service (NPWS) Estate, accessed from The Sharing and Enabling Environmental Data Portal (https://datasets.seed.nsw.gov.au/dataset/nsw-national-parks-and-wildlife-service-npws-estate3f9e7, 29 August 2025).
Annual precipitation at the site over the last 10 years has a long-term average of 802 mm, annual areal potential evapotranspiration (PET) is 1228 mm, and modelled actual evapotranspiration (AET) is 680 mm (precipitation data are from the Bureau of Meteorology (BOM) and evapotranspiration data from the Australian Water Landscape Model (AWRA-L) v7, Frost and Shokri, 2021). Temperature at Taralga (17 km distant and 845 m above sea level) ranges from an average minimum of 6.1 °C to an average maximum of 18.3 °C. Over the study period, precipitation at the site was close to the long-term average (2015 annual precipitation: 773 mm; 2016 annual precipitation: 843 mm) and areal PET slightly higher than the long-term average (2015 annual areal PET: 1307 mm; 2016 annual areal PET: 1331 mm). There is minor seasonality in precipitation, with monthly precipitation in the cooler months (June and July) tending to be both lower and less variable than during the warmer months (Fig. 2). We note, however, that even the cool months can report unusually high monthly totals (Fig. 2), likely owing to the impact of East Coast Lows, intense low-pressure systems that form off the east coast of Australia and which are most common in autumn and winter (Pepler et al., 2014).
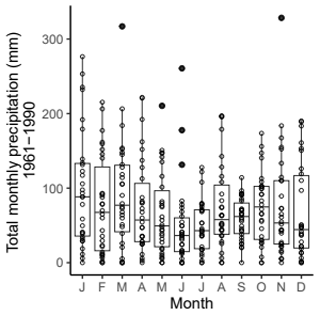
Figure 2Total BOM monthly precipitation, 1961–1990. Aggregated from daily rainfall data from Wombeyan Caves (BOM station number 63093).
We used data from 11 Stalagmate© drip loggers that were deployed throughout the cave between December 2014 and January 2017 and for which hydrograph analysis has been previously presented in Bian et al. (2019). Only four loggers remained in operation from January 2017 to May 2017: data from this period were not analysed quantitatively. Monitoring ceased in May 2017, 1 year after an experimental fire occurred on the surface above the cave. Loggers were programmed to record the total number of drips in a 15 min period. Recharge events were identified here through visual inspection of the time series and cross-checked with the events identified in Bian et al. (2019) and a date allocated. To determine the amount of rainfall needed to generate recharge, daily rainfall records were obtained for the 6 d up to and including the date of recharge. Since daily rainfall amounts are collected for the 24 h up to 09:00 am local time, this analysis also considered precipitation on the day after recharge was observed to ensure that all contributing rainfall was included. Precipitation data were taken from the BOM station at Wombeyan Caves as well as gridded daily precipitation from the AWRA-L, accessed via the Australian Water Outlook website (Bureau of Meteorology, 2024). Where there were incomplete returns from the BOM station, the AWRA-L gridded daily precipitation value was used.
Summarising the main results of the pre-fire and post-fire hydrological and geochemical monitoring of the site presented in Bian et al. (2019), an intense experimental fire over the cave (10 m × 10 m) occurred on 25 May 2016, which resulted in the surface litter being generally consumed by the fire, with ash accumulations of several centimetres' depth occurring in places. Thermocouples placed at 12 cm depth in the soil recorded maximum temperatures between 30 and 930 °C, with spalling of the limestone and calcining observed in localised hotspots. Bian et al. (2019) analysed drip water hydrograph structure, water isotope composition and geochemistry before and after the fire. After the fire, recharge event hydrographs were peakier and of shorter duration than pre-fire. Stable water isotope composition of drip waters was relatively constant pre-fire, with a rapid shift to a more negative oxygen isotope composition immediately post-fire, returning to the pre-fire baseline after 6 months. This was interpreted to be due to the complete evaporation of soil and shallow vadose zone water in the fire, with the post-fire drip water isotopic compositions reflecting those of the first recharge events after the fire rather than a long-term mixed precipitation signal and subsequent rainfall events over the next 6 months replenishing the water in the soil and shallow vadose zone. Water geochemical analyses demonstrated a decrease in rock–water residence time post-fire, with an associated increase in ash-derived sulfur immediately post-fire and limited evidence of other ash-derived geochemical tracers. For further details, see Bian et al. (2019).
To investigate whether rainfall recharge thresholds were altered by an intense experimental burn, we qualitatively compared recharge thresholds calculated for the pre- and post-fire intervals. Because 48 h thresholds may be overestimated due to both the coarse sampling interval and the impact of extreme events, we first compared the minimum recharge threshold calculated for each month pre- and post-fire. We then quantitatively analysed the 48 h rainfall recharge thresholds for all events before and after the fire using the BOM station data. To overcome the different lengths of monitoring data before and after the fire, we undertook a stratified qualitative analysis with data aggregated by season (DJF, MAM, JJA, SON) and 6-monthly periods (summer/autumn and winter/spring and autumn/winter and spring/summer).
Daily rainfall (BOM) and evapotranspiration (AWRA-L) and the 15 min total number of drips averaged for all loggers are shown in Fig. 3. A total of 42 recharge events occurred between December 2014 and January 2017, an average of 1.6 recharge events per month. One observed recharge event (4 May 2015) had only 1.6 mm of associated antecedent rainfall associated with it, and we assume that this was a locally heavier event that was not captured in the gauge ∼2 km away. This event is not included in subsequent rainfall recharge threshold calculations. Recharge events occurred in all months except March, and only seven recharge events were observed in the late summer/early autumn months of February to May (Fig. 4). Excluding the May 2015 event, 22 recharge events were observed before the fire and another 19 after the fire. Analysis of the daily rainfall distribution before and after the fire showed very little difference (Fig. 5).
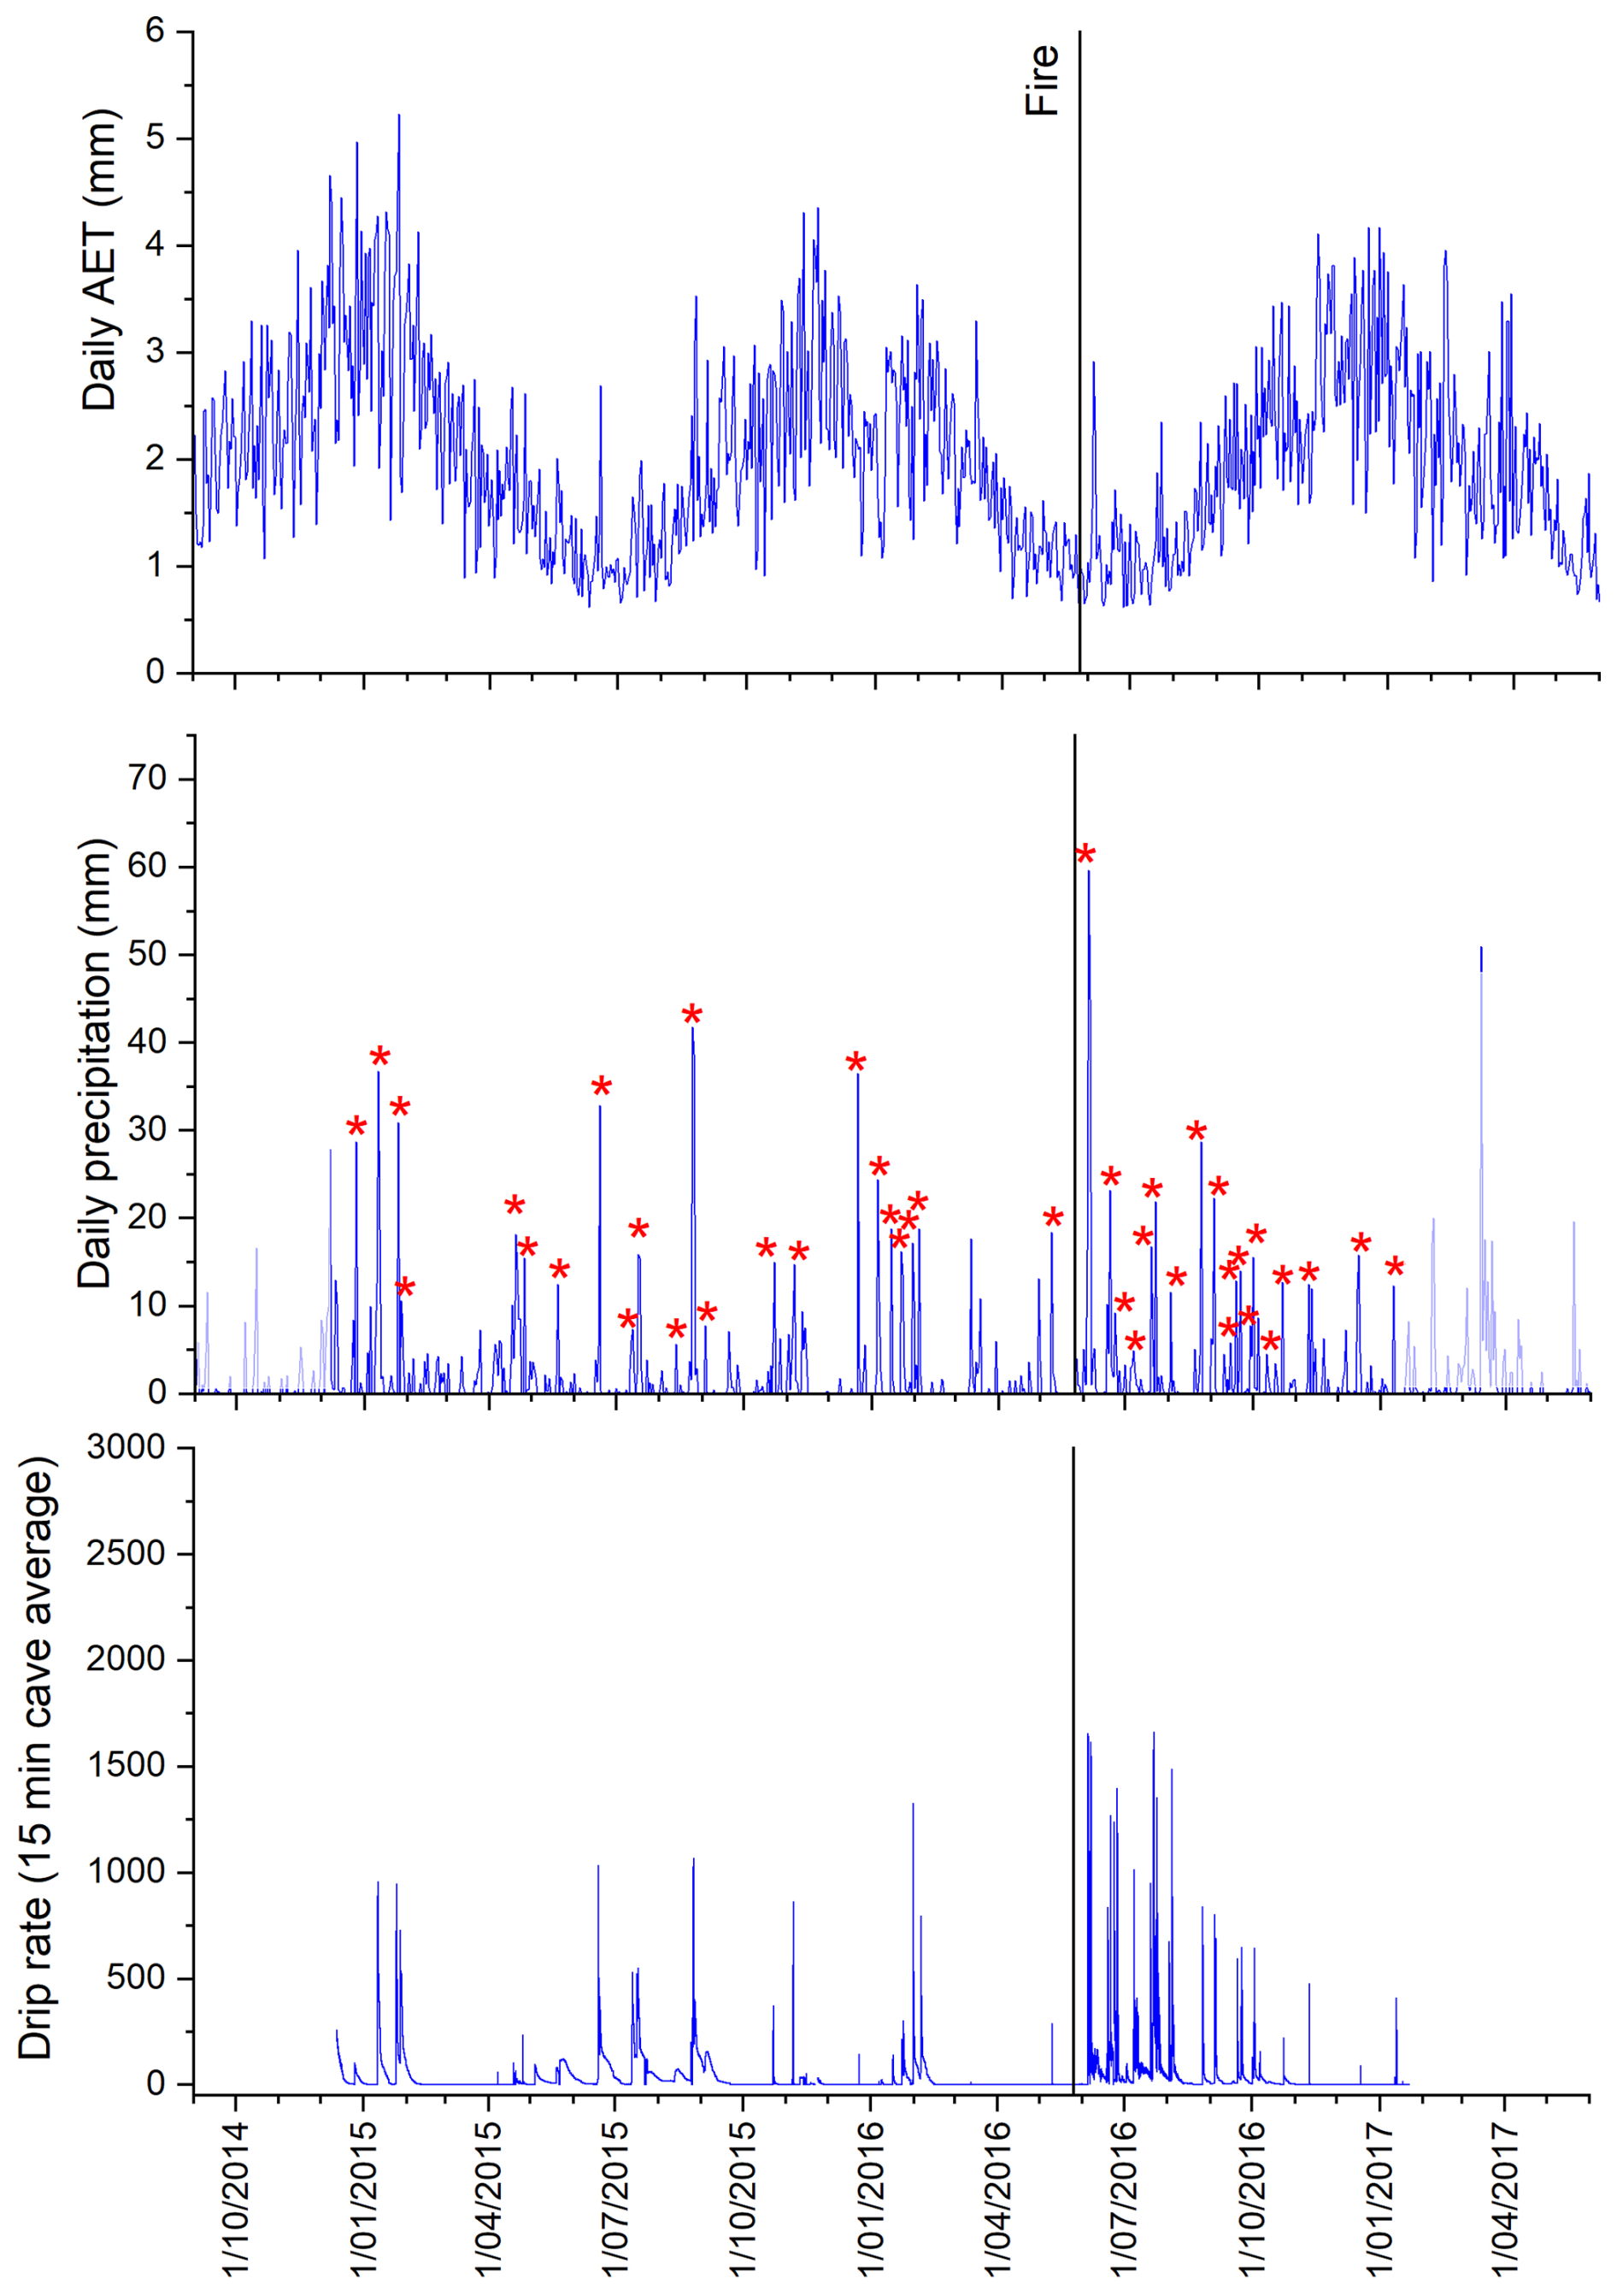
Figure 3Daily AET (from the AWRA-L); daily precipitation (light blue when outside the monitoring period), with timing of recharge events shown by red asterisks; and average 15 min total drips.
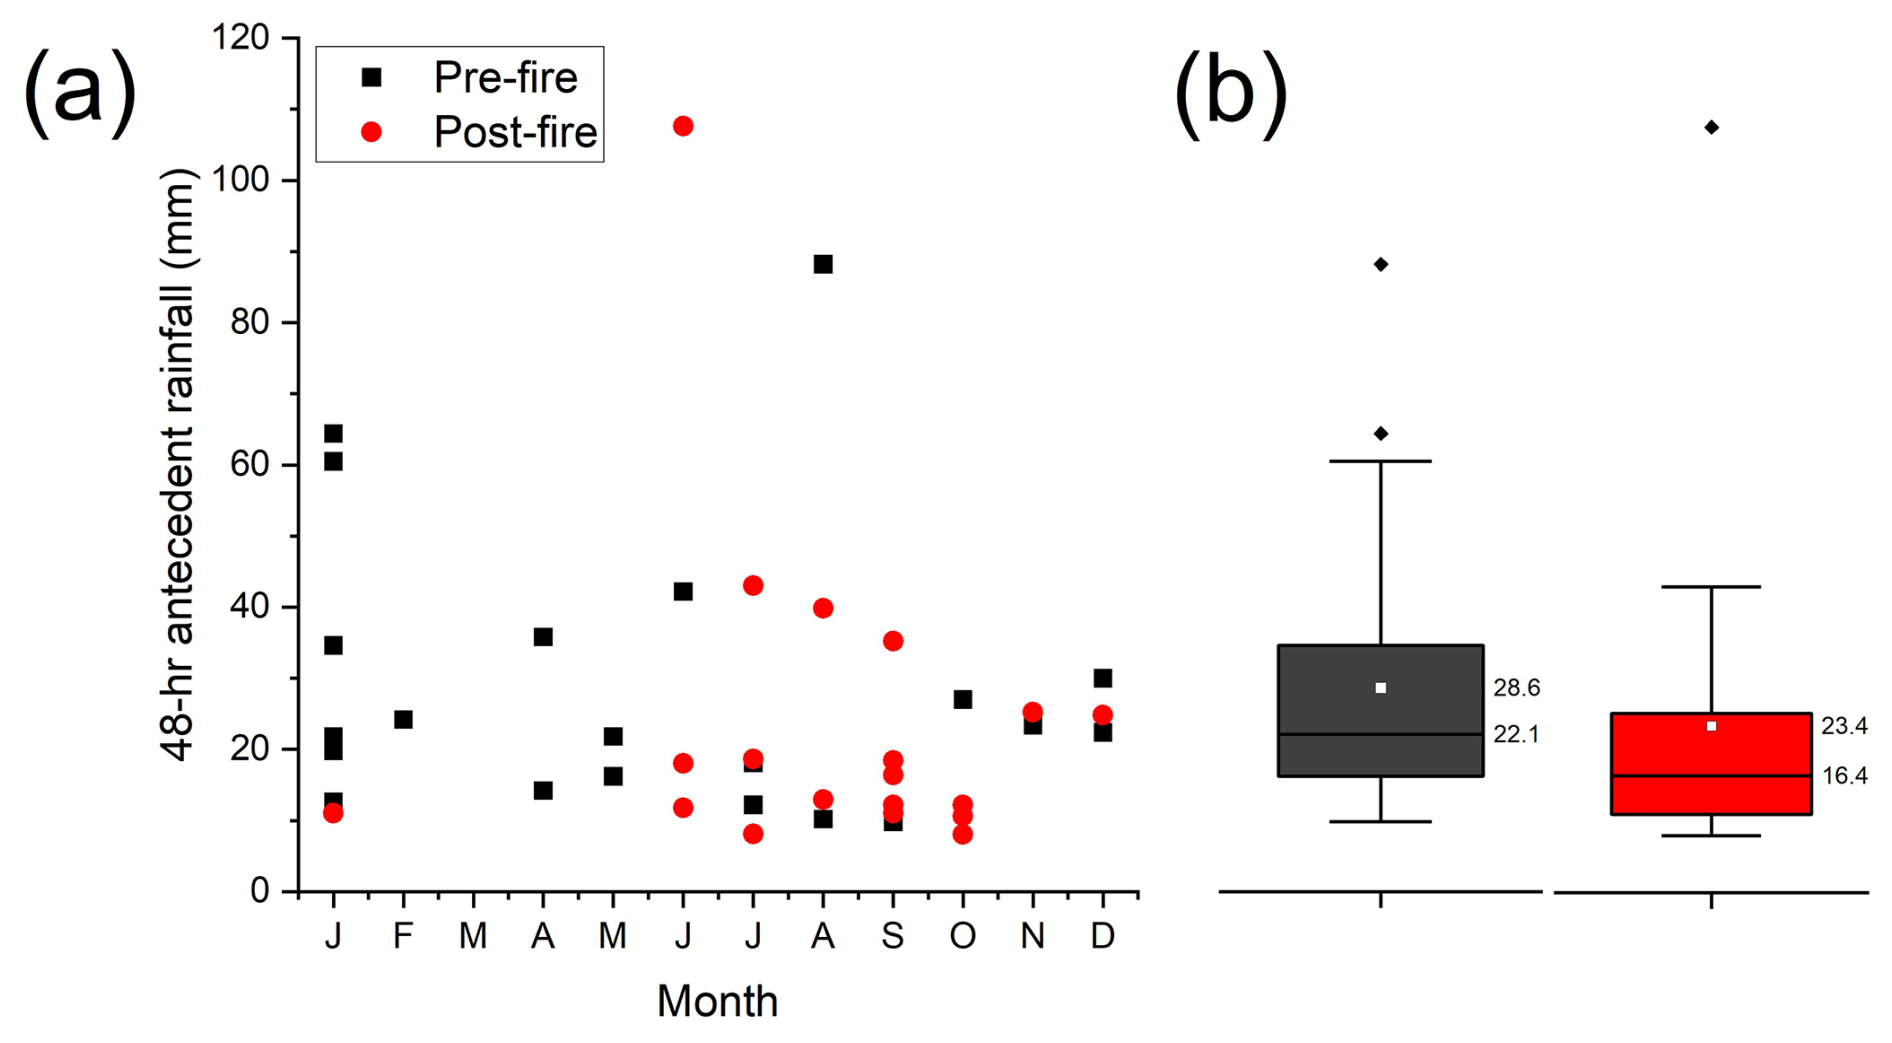
Figure 4(a) 48 h antecedent rainfall classified by month and whether before or after fire. (b) Box-and-whisker plot of all 48 h rainfall amounts for before the fire (black) and after the fire (red).
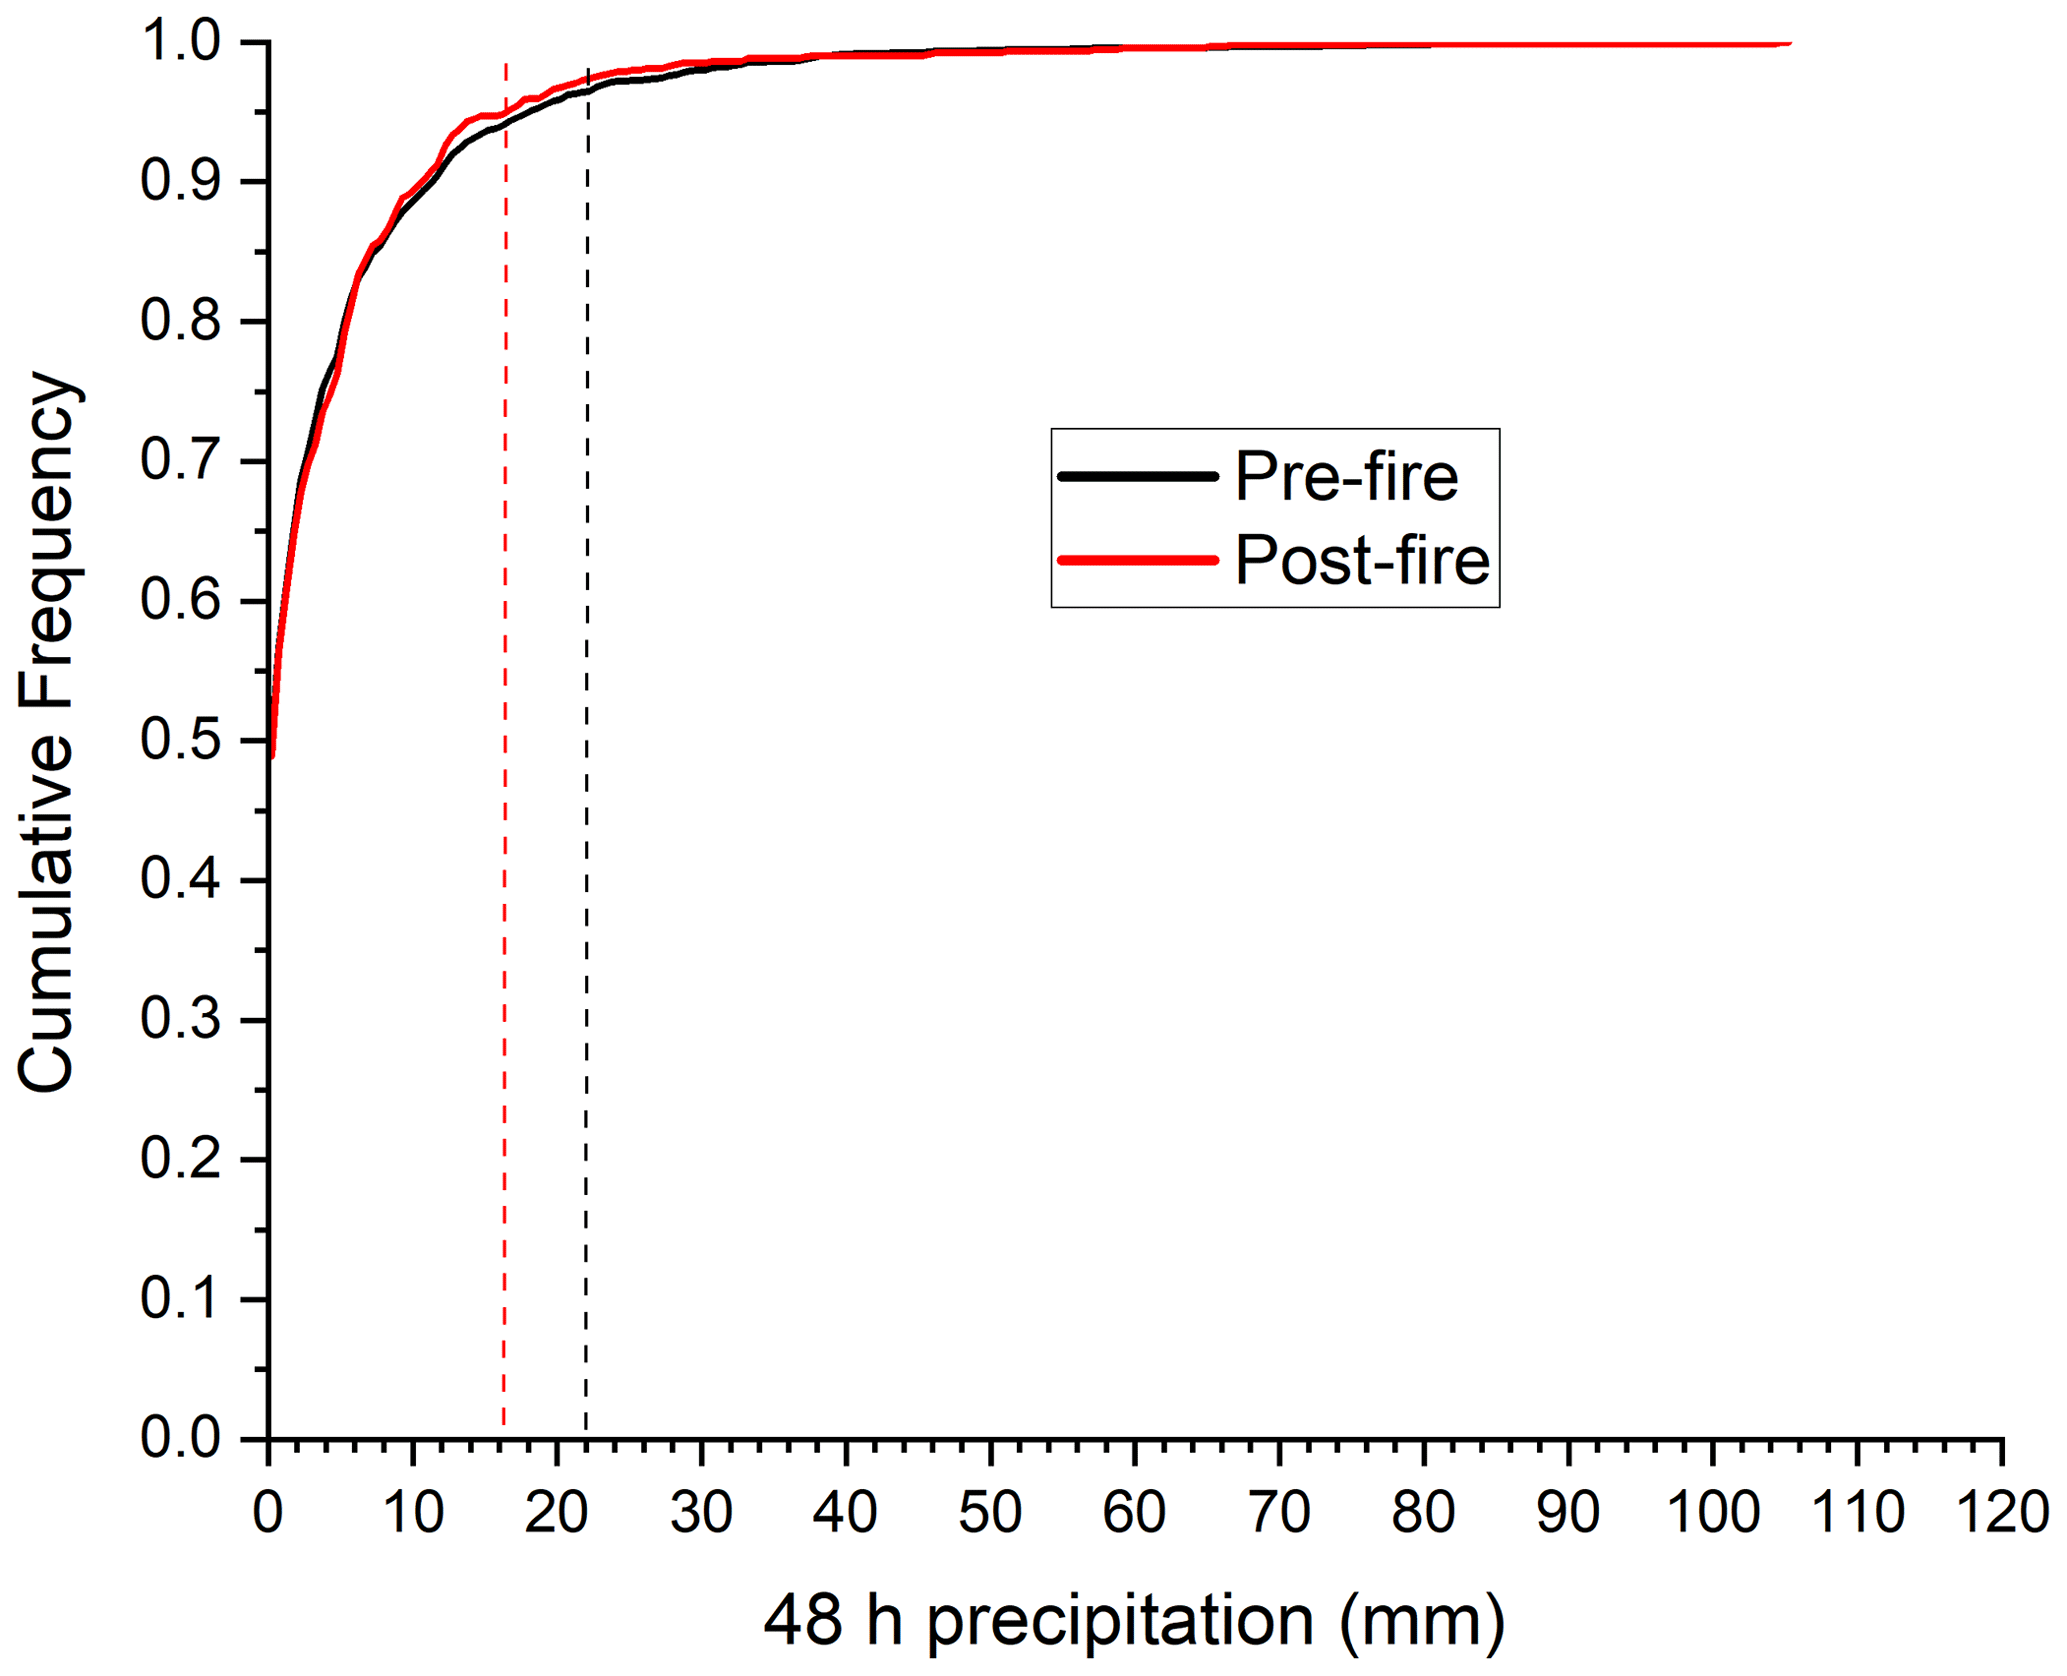
Figure 5Cumulative frequency of 48 h precipitation pre-fire (black) and post-fire (red). Dashed lines show the median rainfall recharge thresholds.
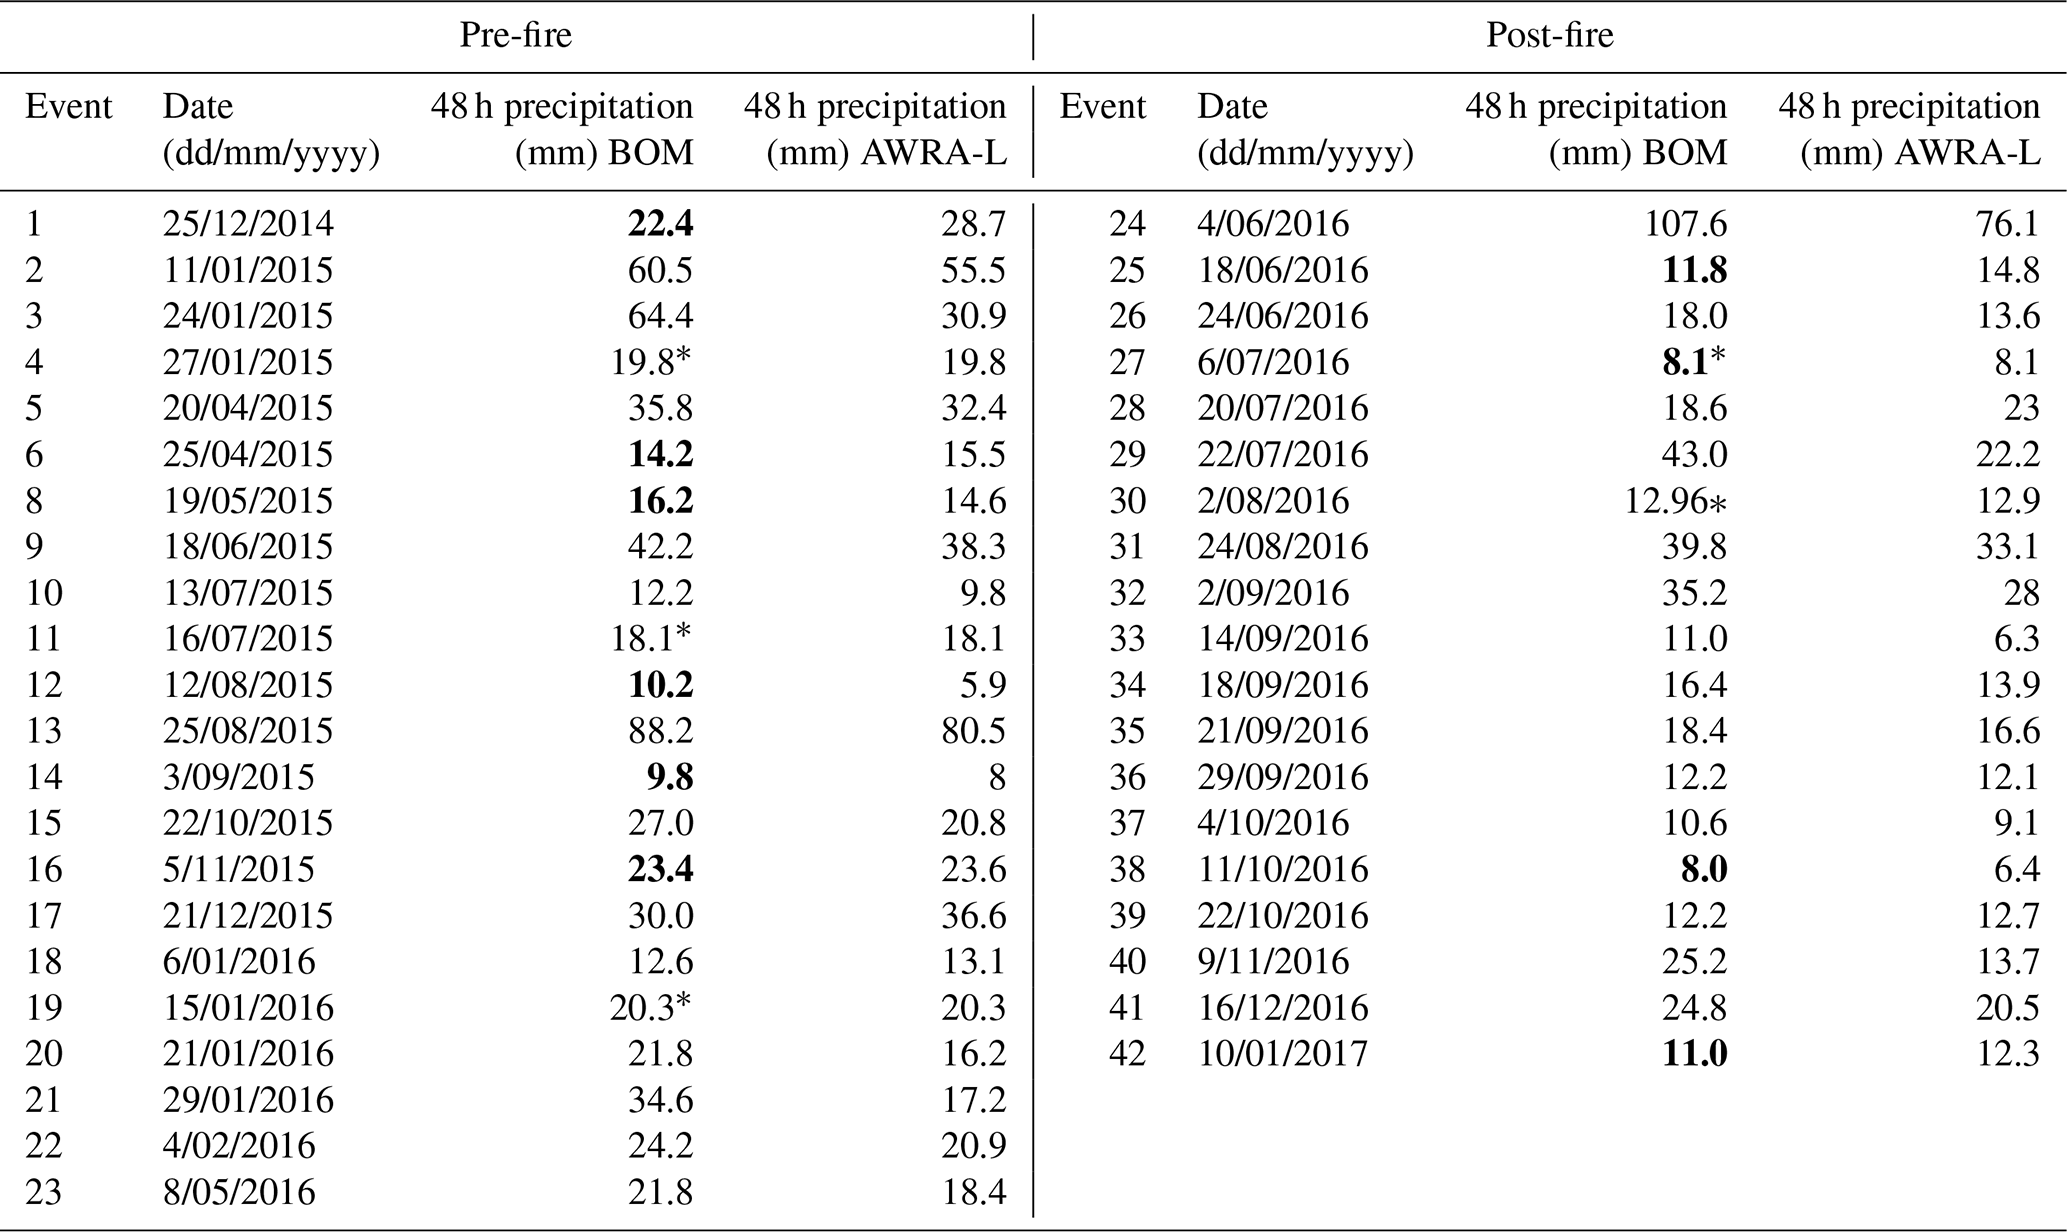
Five of the events occurred when there were incomplete daily precipitation returns from the BOM rain gauge, and for these events the gridded AWRA-L data were used. Comparison of the BOM and AWRA-L 48 h rainfall totals for those events where both BOM and AWRA-L data are available (data are presented in Table 1) suggests that AWRA-L 48 h precipitation is on average 17 % lower than the BOM gauge. No correction was applied.
Table 1Summary of recharge events. Data with asterisks: incomplete returns for the BOM station on these dates. AWRA-L data were used. Recharge event 7 occurred on 4 May 2015 and was a local rainfall event not captured in the gauge. The monthly minimum recharge thresholds presented in Fig. 6 are in bold.
Antecedent conditions were analysed for the 24, 48, 72, 96, 120, and 144 h prior to each observed recharge event (Fig. S1 in the Supplement). Considering all recharge events, compared to the 144 (6 d) sum antecedent precipitation, 48 % of all precipitation occurred in the first 24 h, and 69 % of all precipitation occurred within the 48 h prior to recharge. The relative contribution to the total percentage rainfall over 72, 96, and 120 h continued to decline, and therefore we use the 48 h antecedent total precipitation amount to determine rainfall recharge thresholds.
The 48 h rainfall recharge thresholds for all events are presented in Table 1. Figure 4 presents the rainfall recharge thresholds, plotted by month and whether before or after the fire (Fig. 4a) and for all recharge events (Fig. 4b) using data from the BOM gauge. The median 48 h rainfall recharge threshold is 19.8 mm (mean: 26.2 mm). The lowest minimum 48 h rainfall recharge threshold was 8.0 mm, observed after the fire in July and September, and the highest minimum was 25.2 mm, observed after the fire in November. Comparison between rain gauge and AWRA-L gridded daily precipitation yielded similar rainfall recharge thresholds (AWRA-L median: 17.2 mm; mean 22.0 mm).
48 h rainfall recharge thresholds were compared before and after the fire. Figure 6 shows a qualitative reduction in the recharge threshold post-fire using the minimum recharge in each month. The median 48 h rainfall needed to generate recharge was 22.1 mm before the fire (n= 22) and 16.4 mm after the fire (n= 19) (Fig. 7a). The pre- and post-fire monitoring periods were of different lengths, with no reliable post-fire monitoring in the late summer/early autumn of 2017, when rainfall recharge thresholds might be expected to be higher due to enhanced evapotranspiration, and a Kruskal–Wallis ANOVA indicates these rainfall recharge thresholds are not significantly different at the 95 % level.
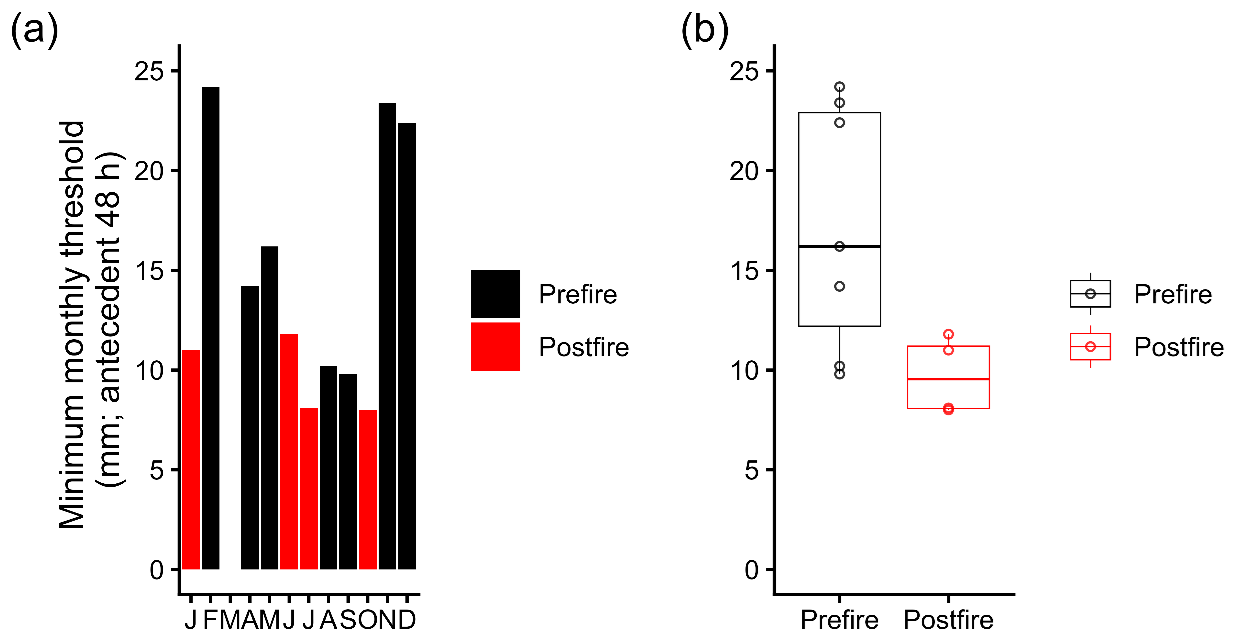
Figure 6Minimum 48 h precipitation required for recharge to occur for each month. Black indicates that the minimum recharge threshold occurred pre-fire, while red indicates that the minimum recharge threshold occurred post-fire. These values are bolded in Table 1.
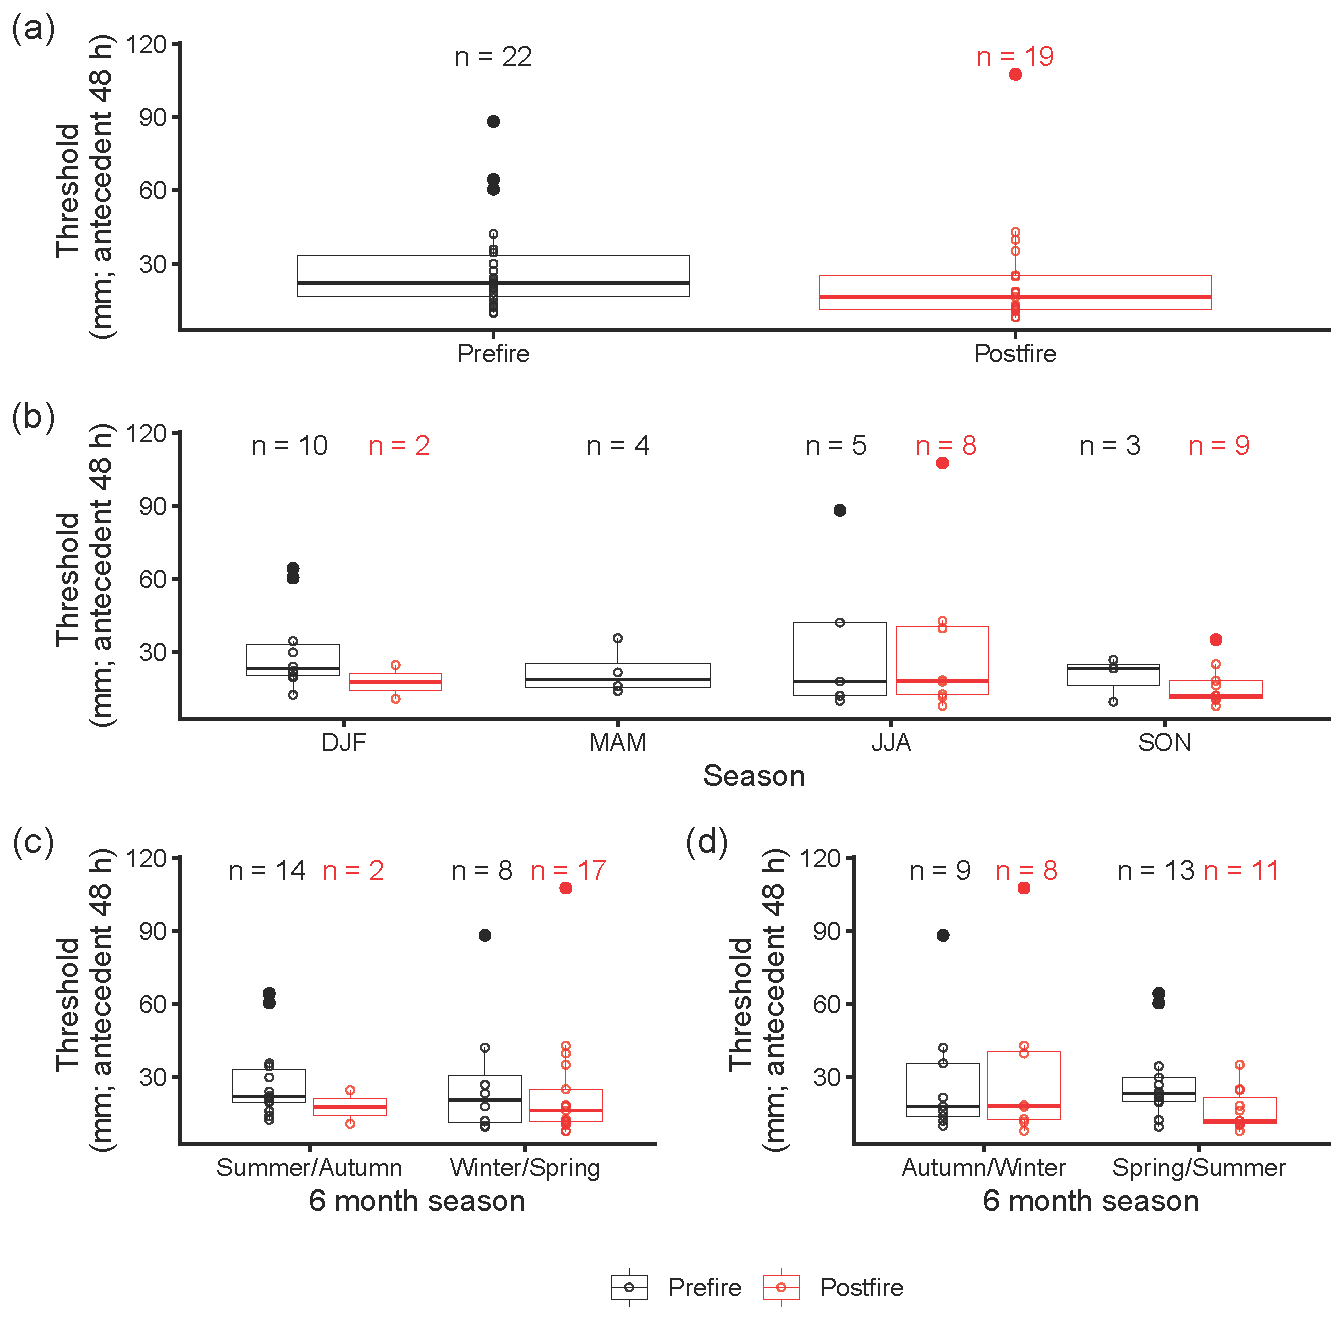
Figure 7Comparison of recharge thresholds pre-and post-fire using BOM data. (a) All recharge events, (b) all recharge events grouped by 3-month season, (c) all recharge events grouped by 6-month seasons summer/autumn and winter/spring, and (d) all recharge events grouped by 6-month seasons autumn/winter and spring/summer. Note that sample sizes are different depending on seasonal grouping, most comparable for panel (d), where autumn/winter have 9 samples for pre-fire and 8 samples for post-fire, and spring/summer have 13 samples for pre-fire and 11 samples for post-fire.
Considering December to February (DJF, summer), March to May (MAM, autumn), June to August (JJA, winter) and September to November (SON; spring)), there is qualitative evidence of a reduction in the post-fire recharge threshold in spring (SON) and summer (DJF) (Fig. 7b) (noting that there were 10 pre-fire events and 2 post-fire events in DJF and 3 pre-fire events and 9 post-fire events in SON). Aggregating these seasonal values into coarser categories (e.g. summer/autumn and winter/spring, Fig. 7c; and autumn/winter and spring/summer, Fig. 7d) highlights a reduction in the post-fire recharge threshold relative to the pre-fire threshold in both the spring/summer (3–9 months post fire) and summer/autumn (6–12 months post fire) categories, although the difference is more pronounced in the spring/summer data. While the summer/autumn and winter/spring categories are unevenly sampled, the autumn/winter and spring/summer categories are evenly sampled. Trends in the seasonal data are robust to the source of the precipitation information, identified in the thresholds calculated from both the BOM data (Fig.7) and the AWRA-L data (Fig. S2).
Figure 5 demonstrated very little difference in the daily rainfall distribution before and after the fire, indicating that these differences in rainfall recharge thresholds are unlikely to be due to differences in daily precipitation. The median rainfall recharge threshold at Wildman's Cave (19.8 mm in 48 h) is comparable to two other temperate climate sites using the same methodology in southeast Australia (Table 2). 41–67 mm per week of precipitation was needed before recharge occurred at the South Glory Cave, Yarrangobilly, Australia (Baker et al., 2021). 76–79 mm per week of precipitation was needed in caves in the Macleay region of New South Wales (Baker et al., 2020). The number of potential recharge events per year (20 per year) observed at Wildman's Cave is at the upper end of the range reported previously, with the most similar characteristics at monitoring site LR1 at Yarrangobilly, which had the most recharge events per year for that site (17) and the lowest rainfall recharge threshold (41 mm per week of precipitation) (Table 2).
Table 2Site information data from Baker et al. (2020, 2021) and this study. Cfa: temperate, no dry season, hot summer. Cfb: temperate, no dry season, warm summer.
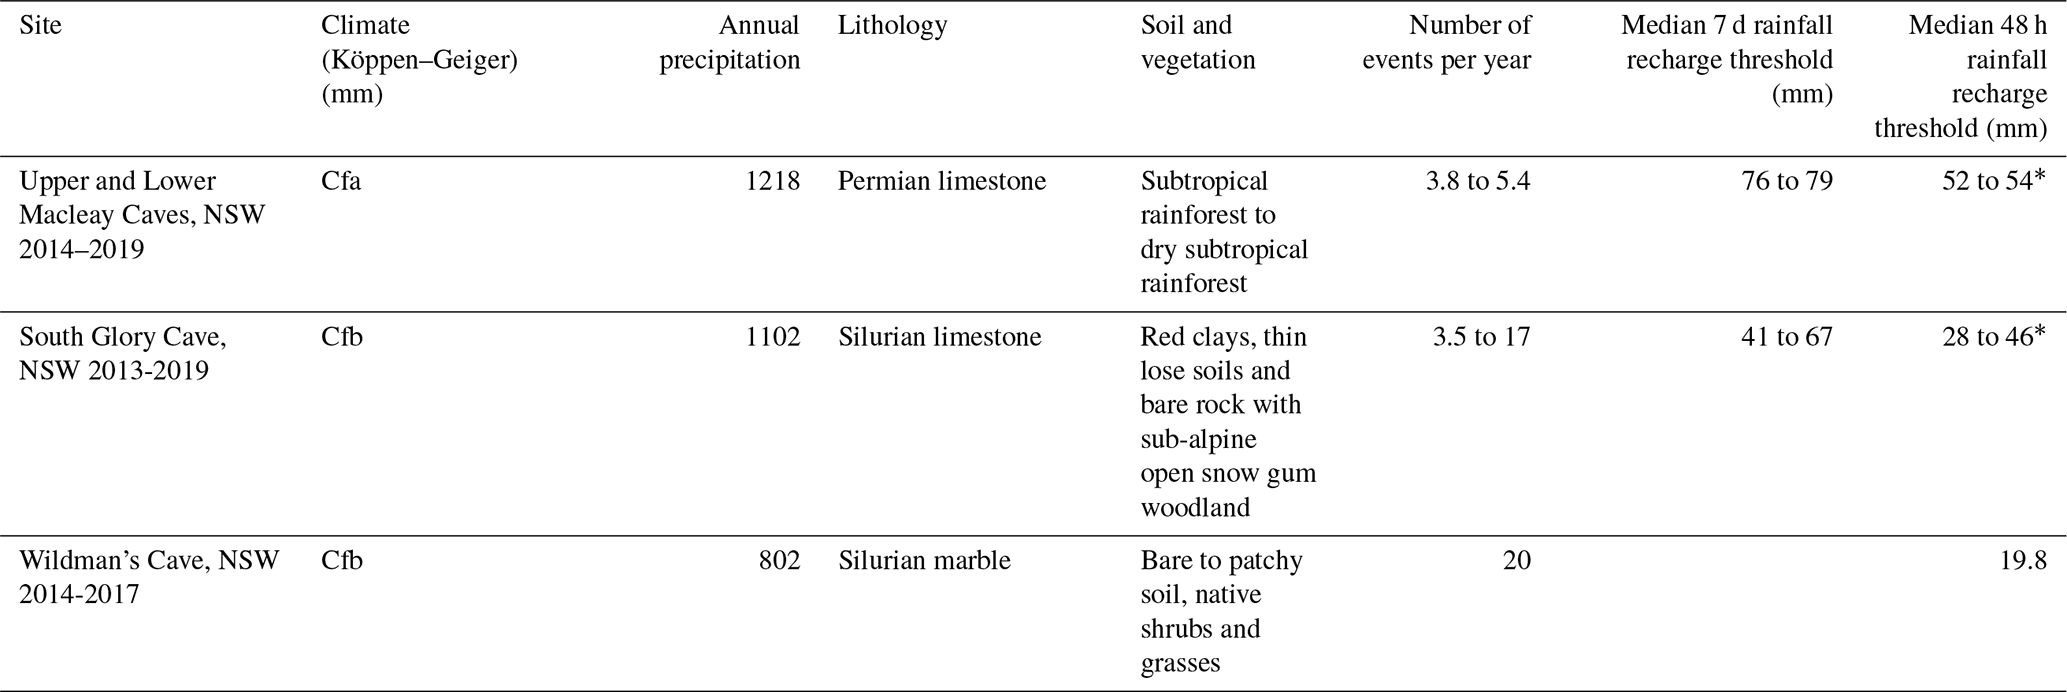
* inferred assuming 69 % of precipitation is within 48 h of the recharge event.
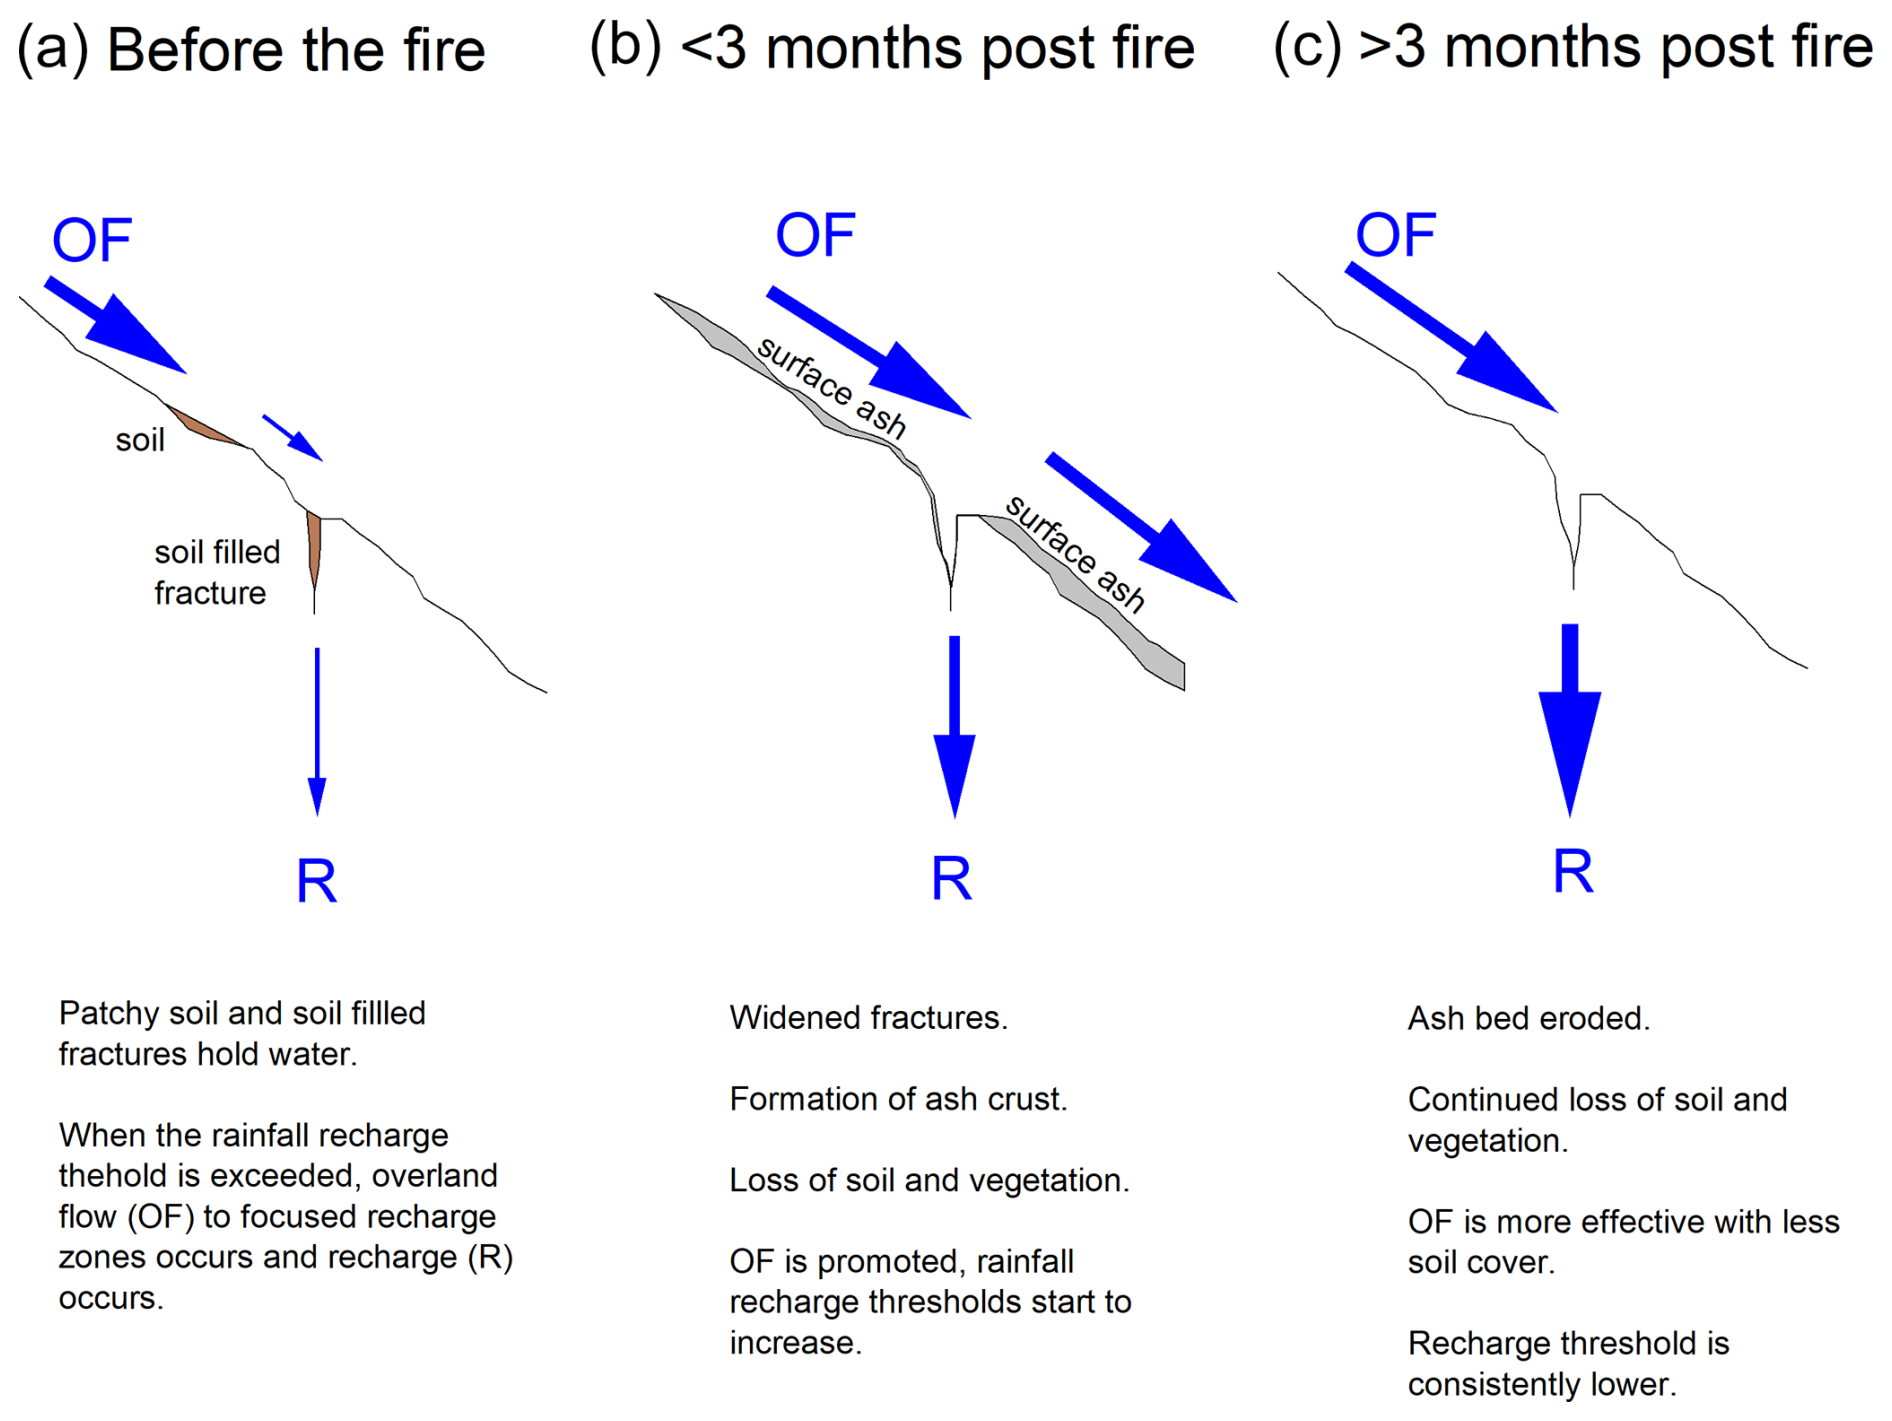
Figure 8Conceptual figure of the recharge processes (a) before the fire, (b) less than 3 months after the fire and (c) more than 3 months after the fire.
The effect of the intense fire on the rainfall recharge threshold is evident, with a decrease in the amount of rainfall needed post-fire, with this most evident in spring/summer, from 3 months after the fire. The decreased rainfall recharge threshold coincides with changed hydrograph characteristics observed by Bian et al. (2019), where post-fire recharge event hydrographs had higher peaks and were of shorter duration. Bian et al. (2019) also observed a rapid post-fire shift in cave drip water stable isotope (δ2H, δ18O) composition, interpreted as indicating that significant loss of existing soil and near-surface karst water had occurred during the fire due to evaporation. The isotope data took 6 months to return to the pre-fire baseline, suggesting that the epikarst water stores took 6 months to replenish and mix. Only limited evidence of ash-derived solutes was observed in the drip water post-fire, interpreted as an effect of volatilisation due to fire intensity.
We hypothesise that a post-fire loss of soil water storage would allow runoff generation to be more effective across areas of bare limestone to the zones of focused recharge (Fig. 8). These observations are consistent with the post-fire response in surface streams, which can include an increase in peak flow rates post-fire (Scott and Van Wyk, 1990), noting that the post-fire response of surface streams is variable and site specific (Moody et al., 2013). Figure 8a presents our conceptualisation of the pre-fire hydrology, with patchy soil and soil filled fractures retarding overland flow and storing water. Recharge occurs when overland flow occurs to focused recharge zones. The decrease in rainfall recharge threshold is not observed immediately post-fire, when the land surface above the cave was covered with thick ash deposits (see Fig. 1). Our observations at the site showed a thick and widespread ash cover immediately post-fire (Fig. 1) which was absent 4 months post-fire (Fig. S3), with bare rock and absence of shrubby vegetation observed 1 year post-fire (Fig. S4). This is compatible with the presence of ash produced by the high-severity experimental burn, combined with the moderate rainfall experienced in the days immediate post-fire (10.4 mm in the week following the experimental fire), resulting in the formation of an ash crust. The presence of an ash crust (Fig. 8b), combined with clogging of any remaining soil pores, is likely to have altered overland flow pathways to the recharge zones (Woods and Balfour, 2008; Balfour et al., 2014). Bian et al. (2019) demonstrate that recharge events at this time had peakier and shorter-duration hydrographs and an altered water isotope composition than pre-fire (Bian et al., 2019). We conceptualise this period as one where recharge and associated recharge thresholds could be impacted by the ash cover, and when recharge occurred, it was through fractures that were relatively free of soil, vegetation and water and which had been potentially widened during the fire.
When this ash was subsequently transported from the surface above the cave, as observed 4 months after the fire (Fig. S3), the loss of the retarding effects of the ash crust, combined with the effect of soil removal and karst fracture enhancement, led to enhanced infiltration and consistently resulted in reduced rainfall recharge thresholds (Fig. 8c). Recharge events that occurred at this time still had peakier and shorter-duration hydrographs than pre-fire (Bian et al., 2019) due to the loss of surface soil and increased area of bare rock and associated loss of soil storage and retardation of overland flow. Drip water isotope composition during this post-fire period returns to the pre-fire baseline, indicative of the replenishment of water in subsurface karst fractures and voids. Despite this replenishment, the combination of peakier and short duration hydrographs and decreased rainfall recharge thresholds suggests a longer-term change in hydrology, due to soil loss, increased bare rock and widened fractures, the combination of which enhanced overland flow and fracture flow.
Pre- and post-fire hydrological datasets, such as ours, that can be used to calibrate or validate water balance models of groundwater recharge are rare (Guzmán-Rojo et al., 2024). Our data provide quantified information on the evolution of the post-fire response, including the length of time post-fire where surface ash enhanced overland flow and limited recharge, and the subsequent decreased rainfall recharge threshold due to soil loss and enhanced fracturing that occurred after the ash had been transported from the land surface. This hydrological response is consistent with ParFlow-simulated surface and subsurface water balance changes for a water-limited site and high fire severity (Atchley et al., 2018).
Our results from Wildman's Cave, with a median 48 h rainfall recharge threshold of 19.8 mm and 20 events per year, falls at the lower end of the range of previously observed rainfall recharge thresholds and higher end of the range for the number of potential recharge events per year across sites in temperate southern and eastern Australia, which have a median 48 h rainfall recharge greater than 28 mm and fewer than 17 events per year. Future studies should investigate these recharge characteristics across a diverse range of sites.
We provide direct measurements of the impact on fire on the potential for groundwater recharge, observing a delayed decrease in the rainfall recharge threshold occurring 3 months after a severe fire. The delayed change to the threshold is likely due to the presence of a thick ash bed, which likely prevented infiltration of precipitation. While we have demonstrated that a severe wildfire results in a lower recharge threshold, it is unknown whether a less intense fire would have a similar effect. Similarly, this investigation was limited to 3 years of monitoring, and it is also not known whether this change in recharge threshold is permanent or if the system will return to “pre-fire”conditions following vegetation regrowth. Future work should aim to replicate this study with fires of different severities and should include hydrological monitoring for some years after vegetation regrowth.
The hydrology data are available at https://doi.org/10.6084/m9.figshare.28169672 (Baker, 2025). All other hydroclimate datasets are publicly available from the Australian Bureau of Meteorology Climate Data Online (http://www.bom.gov.au/climate/data/, Bureau of Meteorology, 2025b) and Australian Water Outlook web pages for daily climate data for station 063093 Wombeyan Caves, accessed at https://awo.bom.gov.au/products/historical/evapotranspiration-modelledActual/4.5,-28.797,134.283/pt,-34.306,149.925/a/d/2025-08-26 (Bureau of Meteorology, 2025a). The karst area overlay used in Fig. 1 is available at https://doi.org/10.25928/b2.21_sfkq-r406, and the map concept is described in Chen et al. (2017). The Sentinel S2 visible image used in Fig. 1 was retrieved from the Copernicus Dataspace (https://dataspace.copernicus.eu/explore-data/data-collections/sentinel-data/sentinel-2, Copernicus Sentinel data, 2024). The Wombeyan boundary is available from New South Wales government, The Sharing and Enabling Environmental Data Portal (https://datasets.seed.nsw.gov.au/dataset/nsw-national-parks-and-wildlife-service-npws-estate3f9e7, NSW Government Central Resource for Sharing and Enabling Environmental Data, 2025).
The supplement related to this article is available online at https://doi.org/10.5194/hess-29-4241-2025-supplement.
CS performed initial data analysis and interpretation, and MC provided additional data analysis and interpretation. AB undertook additional data analysis and wrote the first manuscript draft with contributions from all authors.
The contact author has declared that none of the authors has any competing interests.
Publisher’s note: Copernicus Publications remains neutral with regard to jurisdictional claims made in the text, published maps, institutional affiliations, or any other geographical representation in this paper. While Copernicus Publications makes every effort to include appropriate place names, the final responsibility lies with the authors.
we acknowledge Andy Spate, Sophia Meehan and the Linkage project team for their contributions to overall project design. We thank Andrew Baker (National Parks and Wildlife Service) for site selection and Katie Coleborn for project management and the team at Wombeyan Karst Conservation Reserve, especially the manager David Smith. We would like to thank Fang Bian for helpful discussions when undertaking this data reanalysis.
This research has been supported by the Australian Research Council (grant nos. LP13010017 and FL240100057).
This paper was edited by Gerrit H. de Rooij and reviewed by three anonymous referees.
Ajami, H.: Geohydrology: Groundwater, Encyclopedia of Geology, Second Edition, edited by: Alderton, D. and Elias, S. A., Academic Press, Oxford, 408–415 ISBN 9780081029084, 2021.
Atchley, A. L., Kinoshita, A. M., Lopez, S. R., Trader, L., and Middleton, R.: Simulating Surface and Subsurface Water Balance Changes Due to Burn Severity, Vadose Zone J., 17, 180099, https://doi.org/10.2136/vzj2018.05.0099, 2018.
Baker, A.: Wildman's Cave drip hydrology 2014–2017, figshare [data set], https://doi.org/10.6084/m9.figshare.28169672.v1, 2025.
Baker, A., Berthelin, R., Cuthbert, M. O., Treble, P. C., Hartmann, A., and the KSS Cave Studies Team: Rainfall recharge thresholds in a subtropical climate determined using a regional cave drip water monitoring network, J. Hydrol., 587, 125001, https://doi.org/10.1016/j.jhydrol.2020.125001, 2020.
Baker, A., Scheller, M., Oriani, F., Mariethoz, G., Hartmann, A., Wang, Z. and Cuthbert, M. O.: Quantifying temporal variability and spatial heterogeneity in rainfall recharge thresholds in a montane karst environment, J. Hydrol., 594, 125965, https://doi.org/10.1016/j.jhydrol.2021.125965, 2021.
Baker, A., Shanafield, M., Timms, W., Andersen, M. S., Priestley, S., and Melo Zurita, M.: An underground drip water monitoring network to characterize rainfall recharge of groundwater at different geologies, environments, and climates across Australia, Geosci. Instrum. Method. Data Syst., 13, 117–129, https://doi.org/10.5194/gi-13-117-2024, 2024.
Balfour, V. N., Doerr, S. H., and Robichaud, P. R.: The temporal evolution of wildfire ash and implications for post-fire infiltration, Int. J. Wildland Fire, 23, 733–745, https://doi.org/10.1071/WF13159, 2014.
Bian, F., Coleborn, K., Flemons, I., Baker, A., Treble, P. C., Hughes, C. E., Baker, A., Andersen, M. S., Tozer, M. G., Duan, W., Fogwill, C. J., and Fairchild, I. J.: Hydrological and geochemical responses of fire in a shallow cave system, Sci. Total Environ., 662, 180–191, 2019.
Boas, T. and Mallants, D.: Episodic extreme rainfall events drive groundwater recharge in arid zone environments of central Australia, J. Hydrol: Regional Studies, 40, 101005, https://doi.org/10.1016/j.ejrh.2022.101005, 2022.
Bodí, M. B., Martin, D. A., Balfour, V. N., Santín, C., Doerr, S. H., Pereira, P., Cerdà, A., and Mataix-Solera, J.: Wildland fire ash: Production, composition and eco-hydro-geomorphic effects, Earth-Sci. Rev., 130, 103–127, https://doi.org/10.1016/j.earscirev.2013.12.007, 2014.
Bureau of Meteorology: Australian Water Outlook, Bureau of Meteorology [data set], https://awo.bom.gov.au/products/historical/evapotranspiration-modelledActual/4.5,-28.797,134.283/pt,-34.306,149.925/a/d/2025-08-26 (last access: 26 August 2026), 2025a.
Bureau of Meteorology: Climate Data Online, http://www.bom.gov.au/climate/data/ (last access: 27 August 2025), 2025b
Cerdà, A.: Changes in overland flow and infiltration after a rangeland fire in a Mediterranean scrubland, Hydrol. Proccess., 12, 1031–1042, 1998.
Chen, Z., Goldscheider, N., Auler, A., Bakalowicz, M., Broda, S., Drew, D., Hartmann, J., Jiang, G., Moosdorf, N., Richts, A., Stevanovic, Z., Veni, G., Dumont, A., Aureli, A., Clos, P., and Krombholz, M.: World Karst Aquifer Map (WHYMAP WOKAM), BGR, IAH, KIT, UNESCO, https://doi.org/10.25928/b2.21_sfkq-r406, 2017.
Copernicus Sentinel data: Sentinel S2 true colour image, Copernicus Sentinel data [data set], https://dataspace.copernicus.eu/data-collections/copernicus-sentinel-data/sentinel-2 (last access: 9 December 2024), 2024.
Frost, A. J. and Shokri, A.: The Australian Landscape Water Balance model (AWRA-L v7). Technical Description of the Australian Water Resources Assessment Landscape model version 7, Bureau of Meteorology Technical Report, https://awo.bom.gov.au/assets/notes/publications/AWRA-Lv7_Model_Description_Report.pdf (last access: 27 August 2025), 2021.
Gabet, E. J. and Sternberg, P.: The effects of vegetative ash on infiltration capacity, sediment transport, and the generation of progressively bulked debris flows, Geomorphology, 101, 666–673, https://doi.org/10.1016/j.geomorph.2008.03.005, 2008.
Guzmán-Rojo, M., Fernandez, J., d'Abzac, P., and Huysmans, M.: Impacts of Wildfires on Groundwater Recharge: A Comprehensive Analysis of Processes, Methodological Challenges, and Research Opportunities, Water, 16, 2562, https://doi.org/10.3390/w16182562, 2024.
Healy, R. W. and Cook, P. G.: Using groundwater levels to estimate recharge, Hydrogeol. J., 10, 91–109, https://doi.org/10.1007/s10040-001-0178-0, 2002.
Kotchoni, D. O. V., Vouillamoz, J. M., Lawson, F. M. A., Adjomayi, P., Boukari, M., and Taylor, R. G.: Relationships between rainfall and groundwater recharge in seasonally humid Benin: a comparative analysis of long-term hydrographs in sedimentary and crystalline aquifers, Hydrogeol. J., 27, 447–457, https://doi.org/10.1007/s10040-018-1806-2, 2019.
Moody, J. A., Shakesby, R. A., Robichaud, P. R., Cannon, S. H., and Martin, D. A.: Current research issues related to post-wildfire runoff and erosion processes, Earth Sci. Rev., 122, 10–37, 2013.
Noori, R., Maghrebi, M., Jessen, S., Bateni, S. M., Heggy, E., Javadi, S., Noury, M., Pistre, S., Abolfathi, S., and AghaKouchak, A.: Decline in Iran's groundwater recharge, Nat. Commun., 14, 6674, https://doi.org/10.1038/s41467-023-42411-2, 2023.
NSW Government Central Resource for Sharing and Enabling Environmental Data (SEED): NSW National Parks and Wildlife Service (NPWS) Estate, SEED Portal [data set], https://datasets.seed.nsw.gov.au/dataset/nsw-national-parks-and-wildlife-service-npws-estate3f9e7 (last access: 28 August 2025), 2025.
Onda, Y., Dietrich, W. E., and Booker, F.: Evolution of overland flow after a severe forest fire, Point Reyes, California, Catena, 72, 13–20, https://doi.org/10.1016/j.catena.2007.02.003, 2008.
Osborne, R. A.: The History of Karstification at Wombeyan Caves, New South Wales, Australia, as revealed by Palaeokarst Deposits, Cave Science, 20, 1–8, 1993.
Pepler, A., Coutts-Smith, A., and Timbral, B.: The role of East Coast Lows on rainfall patterns and inter-annual variability across the East Coast of Australia, Int. J. Climatol., 34, 1011–2021, https://doi.org/10.1002/joc.3741, 2014.
Scott, D. F. and Van Wyk, D. B.: The effects of wildfire on soil wettability and hydrological behaviour of an afforested catchment, J. Hydrol., 121, 239–256, 1990.
Woods, S. W. and Balfour, V. N.: The effect of ash on runoff and erosion after a severe forest wildfire, Montana, USA, Int. J. Wildland Fire, 17, 535–548, https://doi.org/10.1071/WF07040, 2008.
Wylie, J. and Wylie, G.: The caves of Wombeyan: An annotated listing. In: Caves and Karst of Wombeyan, Sydney Speleological Society Occasional Paper, 13, 167–196, 2004.