the Creative Commons Attribution 4.0 License.
the Creative Commons Attribution 4.0 License.
 | 21 Aug 2025
When and where does near-surface runoff occur in a pre-Alpine headwater catchment?
Victor Aloyse Gauthier
Anna Leuteritz
Ilja van Meerveld
Although runoff processes have been described for many locations worldwide, there has been a lack of studies for poorly drained soils where most of the runoff may occur near the soil surface. Therefore, in this study, we aimed to improve the understanding of near-surface processes across a small headwater catchment with low-permeability gleysols that is typical for the Swiss pre-Alpine region. We installed 14 small (1 m×3 m) bounded runoff plots to collect overland flow (including biomat flow; OF) and shallow subsurface flow through the topsoil, which we refer to as topsoil interflow (TIF). The runoff plots were located at different topographic positions and had a range of vegetation covers. For 27 rainfall events during the summer of 2022, we determined the occurrence and amount of OF and TIF. OF and TIF occurred for approximately half of the events, but the frequency of occurrence depended on the topographic wetness index (TWI) and vegetation cover of the plot. The runoff ratios (ratio between total runoff and total precipitation) were highly variable and were generally higher for TIF than for OF. They increased with increasing precipitation and antecedent-wetness conditions but were not correlated with the rainfall intensity. Runoff ratios for OF were larger than 1 for some plots, indicating the occurrence of return flow from outside the plot. The runoff ratio did not change after removing the upper boundary of the plot, suggesting that the actual flow path lengths over the surface are short. Overall, this study highlights the importance of fast near-surface processes in pre-Alpine catchments underlain by low-permeability gleysols and the fact that these processes occur across a range of catchment locations and land covers.
- Article
(4043 KB) - Full-text XML
-
Supplement
(6032 KB) - BibTeX
- EndNote


Lateral flow from hillslopes is an important contributor to streamflow during rainfall and snowmelt events and can transport considerable amounts of nutrients, solutes and sediment to the stream network. However, hillslope runoff processes are spatially highly variable (e.g. Bachmair and Weiler, 2012) and nonlinear (e.g. Penna et al., 2011; Tromp-van Meerveld and McDonnell, 2006; Vreugdenhil et al., 2022), which means that not all hillslopes contribute equally to streamflow and that they do not contribute during all events (Ambroise, 2016; Anderson and Burt, 1978b; Rinderer et al., 2014; Uchida and Asano, 2010). Spatially, runoff generation depends on topography (Anderson and Burt, 1978a; Tromp-van Meerveld and McDonnell, 2006), microtopography (Appels et al., 2011; Polyakov et al., 2021), vegetation cover (Gerke et al., 2015; Mishra et al., 2022), and soil and bedrock characteristics (Descroix et al., 2001; Palmer and Smith, 2013; Uchida and Asano, 2010). Temporally, runoff generation varies with rainfall event characteristics (Tarboton, 2003; Weiler et al., 2005) and antecedent-wetness conditions (Bronstert and Bárdossy, 1999; Henninger et al., 1976) or the combination of rainfall and antecedent-wetness conditions (Detty and McGuire, 2010; Nanda and Safeeq, 2023; Penna et al., 2011; Saffarpour et al., 2016). Despite several decades of studies on hillslope runoff processes in temperate (Betson and Marius, 1969; Dunne and Black, 1970; Minea et al., 2019; Tanaka et al., 1988; Weiler and Naef, 2003), semi-arid (Mounirou et al., 2012; Puigdefabregas et al., 1998) and tropical (Bonell and Gilmour, 1978; Dunne and Dietrich, 1980; Zwartendijk et al., 2020) climates, there are still several open questions regarding the importance of hillslope runoff processes and the factors that control it (Blöschl et al., 2019). Most hillslope runoff studies in temperate climates have focused on hillslopes with well-drained soils, where overland flow (OF) is unlikely to occur (Barthold and Woods, 2015). Nevertheless, high-rainfall-intensity sprinkling experiments on vegetated hillslopes with low-permeability gleysols in Switzerland have shown that OF can be an important runoff pathway (e.g. Badoux et al., 2006; Scherrer et al., 2007; Weiler et al., 1999). For example, during sprinkling experiments on two 13 m2 forested plots in the Alptal, 20 % of the flow occurred in the humic A horizon, and 5 % occurred as OF (Feyen et al., 1996). Sprinkling experiments in nearby catchments suggested that OF was an even larger fraction of the precipitation (between 39 % and 94 % in the study by Badoux et al., 2006). Dye-staining experiments, furthermore, showed that most of the infiltrating water remained in the densely rooted organic-rich topsoil and did not infiltrate into the low-permeability clay below it (Schneider et al., 2014; Weiler et al., 1998). We refer to the lateral flow through this organic-rich topsoil as topsoil interflow (TIF) to differentiate it from the lateral subsurface flow (SSF) that is generated deeper in the soil profile (e.g. at the soil–bedrock interface). Studies in other parts of the world have, similarly, shown that OF can be important on vegetated hillslopes (e.g. Buttle and Turcotte, 1999; Gomi et al., 2008; Kim et al., 2014; Miyata et al., 2009) or highlighted the importance of flow through the litter layer or the organic-rich topsoil due to hydrophobicity at the interface of the organic layer and mineral soil (i.e. biomat flow; Sidle et al., 2007). Other studies have also pointed out the importance of exfiltrating subsurface flow for OF (Buttle, 1994; Buttle and McDonald, 2002; Feyen et al., 1996; Lapides et al., 2022; Tanaka, 1982).
Despite these previous studies, little is known about OF and TIF generation on vegetated hillslopes in temperate climates. In part, this is because previous studies mainly focused on observations (or rainfall simulation) at only a few plots. Understanding the spatiotemporal variability in OF and TIF requires measurements at various locations for a range of events. Therefore, we set up a hydrological measurement network consisting of 14 small runoff plots (1 m×3 m) across the 20 ha Studibach catchment in the Alptal valley, Switzerland. The plots represent a range of topographic conditions and vegetation covers. We measured OF (including biomat flow) in runoff gutters and TIF in trenches for 27 events during the 2022 snow-free season. We used these data to address the following questions:
-
How often do OF and TIF occur and how does this occurrence depend on the plot characteristics (vegetation, slope, topographic position)?
-
How is the spatial variation in the runoff ratios for OF and TIF related to the plot characteristics (vegetation, slope, topographic position)?
-
Is there a precipitation (amount or intensity) or antecedent-wetness threshold before considerable OF and TIF occur?
A better understanding of the spatial and temporal variation in OF and TIF is necessary to develop better models or to regionalise streamflow predictions (Barthold and Woods, 2015) and land management (Naef et al., 2002).
The research was conducted in the Studibach catchment, a typical pre-Alpine headwater catchment in the Alptal valley, located ∼40 km southeast of Zurich in Switzerland (coordinates: 47.038° N, 8.717° E). The geology, topography, land use and climate are typical for the Swiss pre-Alpine area. Because most areas have a restricted soil permeability (Fig. S1 in the Supplement), it is a region where we expected near-surface flow pathways to be important for runoff generation.
The 20 ha Studibach catchment ranges from 1270 to 1650 m a.s.l. in elevation and has a mean slope of 22°, varying between 0 and 69° (based on the 0.5 m digital elevation model (DEM; Swisstopo SwissAlti3D)). The climate is humid, with a mean annual temperature of 6 °C, varying from −1 °C in January to 14 °C in July (Schleppi et al., 1998). The mean annual precipitation is approximately 2300 mm yr−1, of which ∼30 % falls as snow (Stähli and Gustafsson, 2006). Precipitation is evenly distributed throughout the year, but the most intense rainfall events occur in summer (June to September), when it rains, on average, every second day (Fischer et al., 2017b; van Meerveld et al., 2019).
About 55 % of the catchment is covered by open coniferous forest (Fig. 1) dominated by Picea abies L., with an understorey of Vaccinium sp (Hagedorn et al., 2000). Approximately 45 % of the catchment (mainly in the flatter parts and depressions) is covered by grasslands and wetlands. About 10 % of the catchment (in the upper part) is used as a pasture in summer (Rinderer et al., 2016).
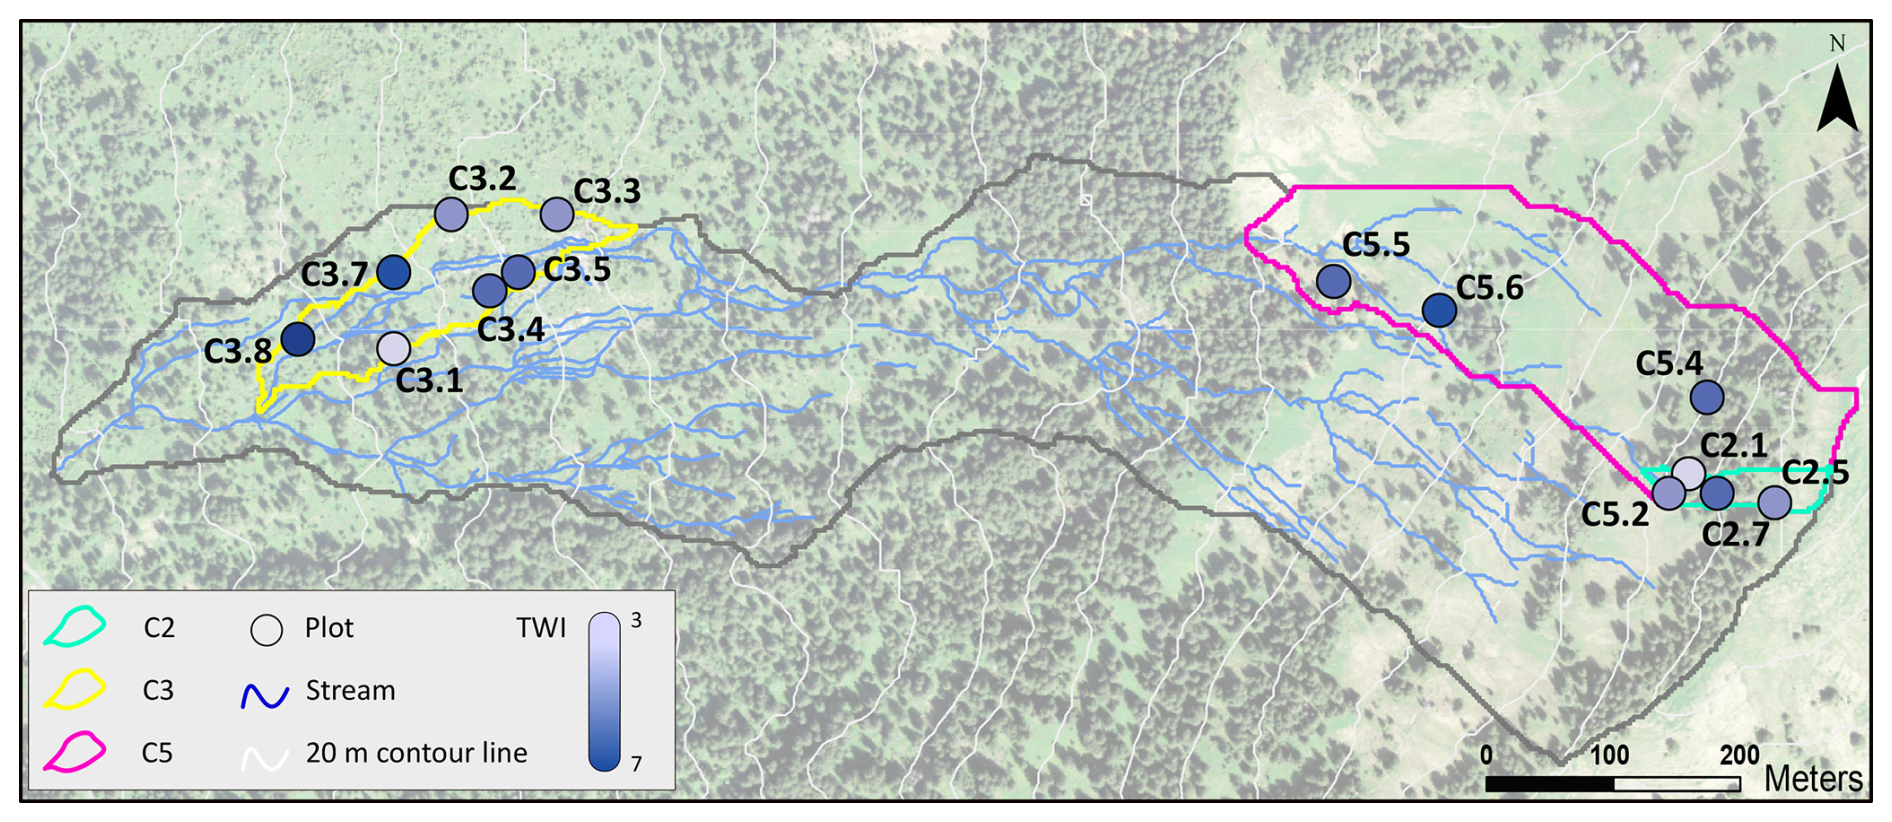
Figure 1Map of the Studibach catchment, with the location of the plots in the three subcatchments (C2, C3 and C5), the field-surveyed stream network (blue lines) and the 20 m contour lines (in grey). The background map (aerial photograph) shows the vegetation (source: Swisstopo SwissImage, 2023). The plots are colour-coded according to the topographic wetness index (TWI; darker-blue colour indicates a wetter location).
The soils are primarily silty clay and silt–clay–loam in texture. They are underlain by low-permeability, clay-rich flysch bedrock consisting of calcareous sandstone and argillite and bentonite schist layers (Mohn et al., 2000). Soil depths range from 0.5–1 m at the ridges to 2.5 m in depressions. The soil type in the steeper parts of the catchment is an umbric gleysol, with an oxidised Bw horizon below mor humus. In the flatter parts, where the water table is close to the surface, it is a mollic gleysol with a reduced Bg horizon below a muck humus layer (Hagedorn et al., 2001; Schleppi et al., 1998).
The wet climate and low-permeability soil and bedrock result in shallow groundwater levels throughout most of the catchment (Rinderer et al., 2016) and a dense drainage network (Fig. 1; van Meerveld et al., 2019). The streams respond quickly to precipitation (within tens of minutes). Although streamflow is dominated by pre-event water (Kiewiet et al., 2020), event water contributions can be >50 % (Fischer et al., 2017a; von Freyberg et al., 2018). In a recent study, Bujak-Ozga et al. (2025) showed that the event water flux is much larger than the precipitation falling on the flowing-stream network and must thus come from areas outside the flowing-stream network, except at the onset of the events.
3.1 Selection of runoff plot locations
We installed 14 small (1 m×3 m) bounded runoff plots in two parts of the catchment to cover the range in slope, vegetation and wetness conditions. The selection of the locations for the plots was based on the topographic wetness index (TWI; Beven and Kirkby, 1979) calculated for a 6 m resolution digital elevation model (DEM). Rinderer et al. (2014) determined the distribution of TWI values for seven subcatchments, divided each distribution into eight equally sized classes and installed a groundwater monitoring well in the pixels with the median TWI value for that class. We selected three subcatchments for the installation of the runoff plots: C2, C3 and C5 (Fig. 1). The C2 subcatchment, located in the lower Studibach catchment, has various slopes and is dominated by open coniferous forest (see Fig. S4 in the Supplement), natural clearings and wetlands. Subcatchment C3 is steeper and mainly forested, while C5 has moderate slopes and is mostly covered by grasslands and wetlands.
We installed trenched runoff plots within 6 m of each well in the selected subcatchments. The plots were located in an area with a relatively uniform vegetation cover and slope (Table 1). Because the groundwater levels and dynamics in the catchment are strongly related to the TWI (Rinderer et al., 2014, 2016), we assumed that stratification of the plots based on the TWI would result in a better representation of the variability in near-surface flow responses across the catchment than a random sampling design. Because of the stratification based on the TWI, the runoff plots differed not only in terms of topographic position and wetness conditions but also in terms of slope and vegetation cover (Table 1). Similarly to Rinderer et al. (2014), we refer to the plot locations as follows: “CX.Y”, where X represents the subcatchments, and Y corresponds to the TWI class, ranging from 1 (driest site) to 8 (wettest site) (Fig. 1; Table 1).
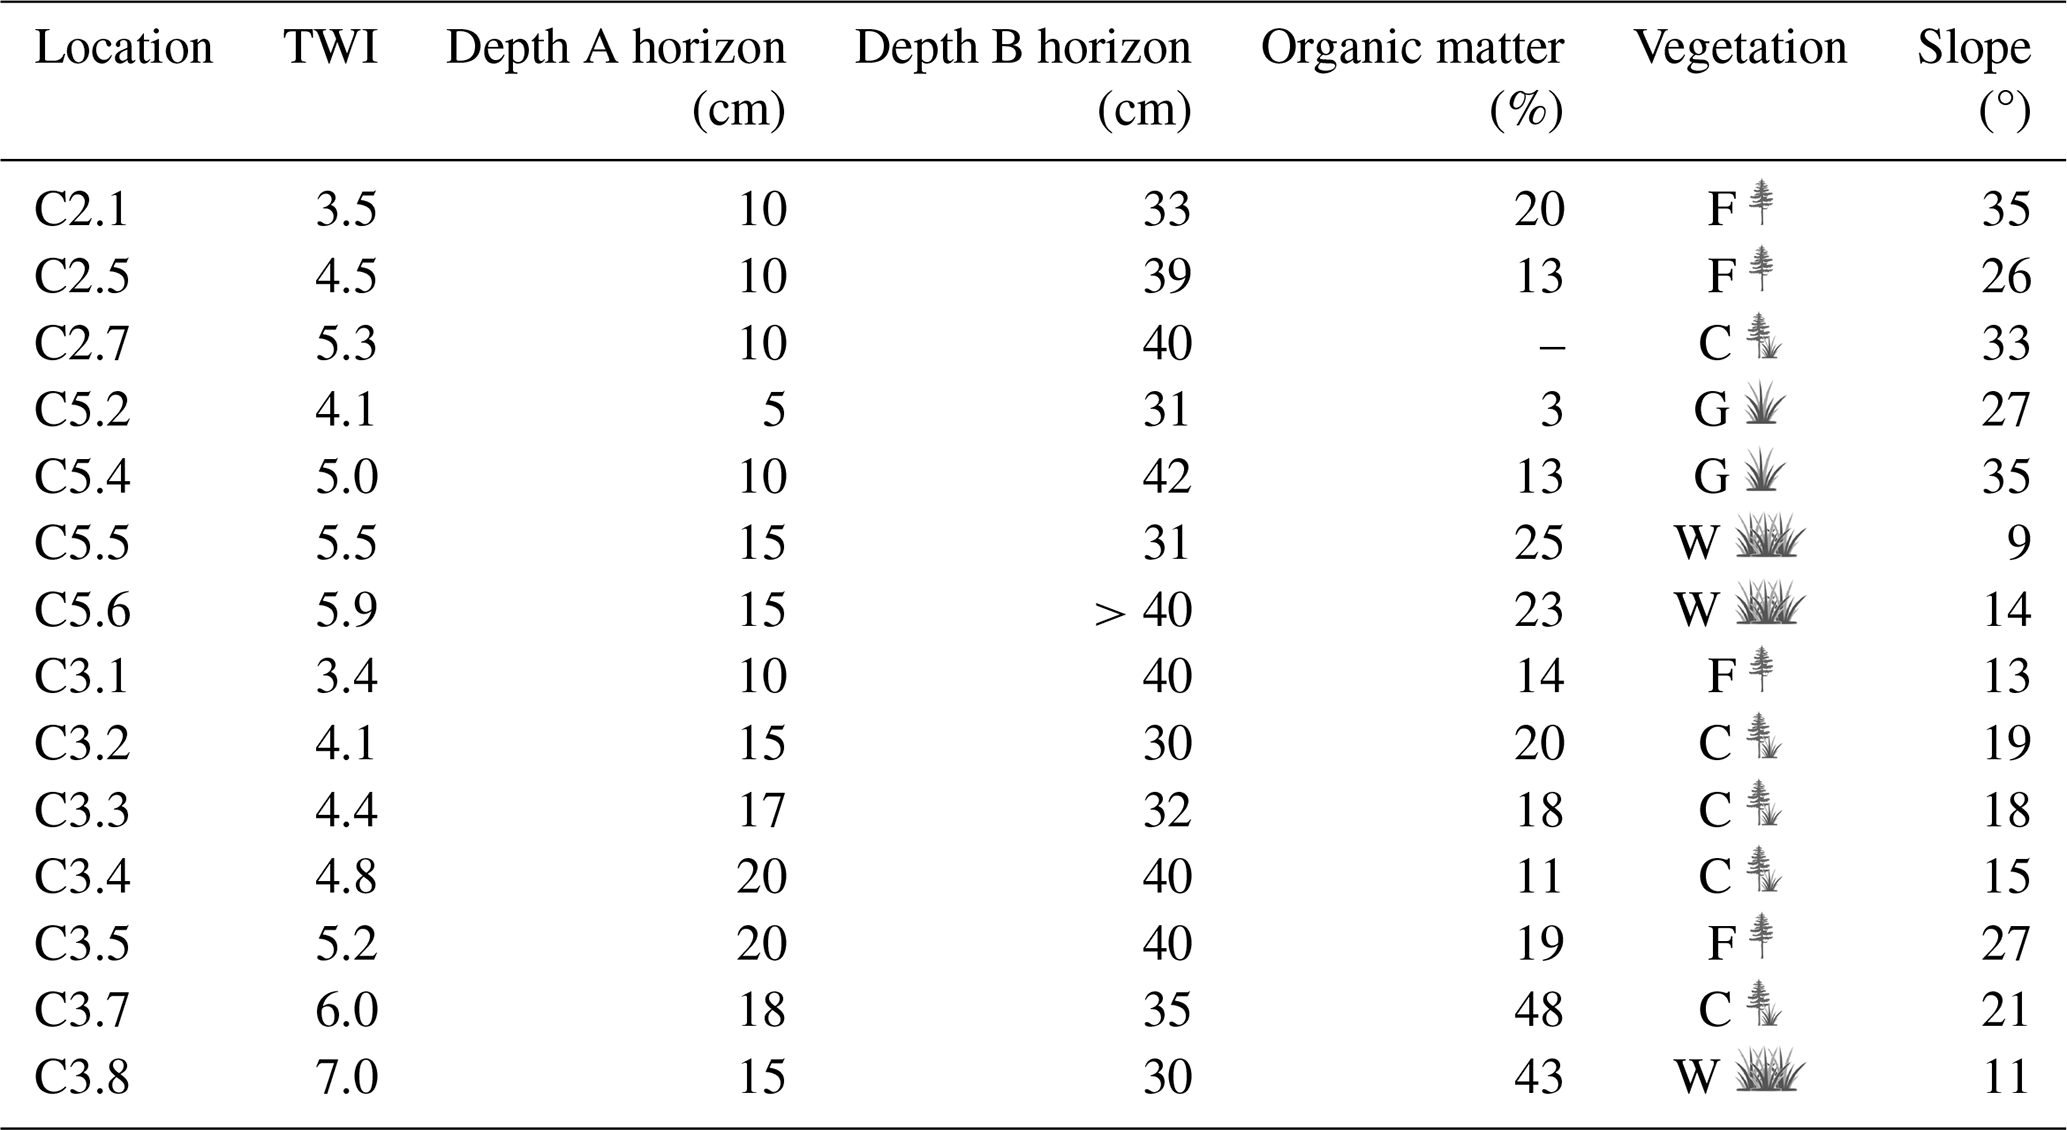
Table 1Main characteristics for the 14 plots: topographic wetness index (TWI), soil depth at the bottom of the A and B horizons, slope, and organic matter content at 10–15 cm depth. Vegetation cover: Forest (F), natural clearing (C), grassland (G), wetland (W).
3.2 Field measurements
3.2.1 Runoff plot construction and flow measurements
We installed the plots in the summer of 2021 and collected data between May and October 2022. At each selected location, we built a small (1 m×3 m) bounded runoff plot following the methodology of Maier and van Meerveld (2021) and Weiler et al. (1999). At the lower end of the plot, we dug a trench until the depth of the reduced clay layer (generally at ∼40 cm depth; Table 1), where there were only very few visible roots. We put drain foil on the trench face to block the lateral flow through the topsoil and a drainage tube at the bottom of the trench (rolled into the foil) to collect topsoil interflow (TIF) and to channel it via a hose to an upwelling Bernoulli tube (UBeTube; see Stewart et al., 2015) (Figs. S2 and S3 in the Supplement). Thus, the measured TIF consists of lateral flow from the topsoil between ∼3 and ∼40 cm depth. The trench was backfilled to ensure slope stability. An OF gutter was installed on the surface. Plastic foil was inserted down to ∼3 cm depth to guide the runoff into a 1 m long gutter. Flow from the OF gutter was routed to another UBeTube via a hose (Fig. S2). OF thus also includes biomat flow. A fibre glass roof covered the gutter to prevent any direct precipitation from entering into the gutter. At the sides and the upper end of the plots, we inserted plastic lawn edging 5 cm into the ground to minimise the flow of OF into or out of the plot (see photos in Figs. S3 and S4). The plastic lawn edging at the top of the plot was removed on 10 September 2022 for another experiment.
The UBeTubes were built from 10 cm diameter PVC pipes at the University of Zurich following the design of Stewart et al. (2015) using a water jet cutter (see Fig. S2b). All UBeTubes were screened for consistency in terms of the V notches before field installation.
In each UBeTube, we installed a conductivity, temperature and pressure logger (DCX-22-CTD, Keller Druck, Switzerland). To determine the water level from these pressure measurements, we installed eight barometric loggers (DCX-22, Keller Druck, Switzerland) throughout the catchment to measure the atmospheric pressure. Each barometric logger was wrapped in heat-reflecting foil to minimise temperature effects (Shannon et al., 2022). All loggers recorded the pressure at a 5 min interval.
The water levels in the UBeTubes were converted to flow rates (Q; L min−1) based on rating curves developed in the laboratory for 10 UBeTubes. Because the rating curves were similar for 9 out of the 10 UBeTubes, with the other one being visibly different (Morlang, 2022), we used the same rating curve for 26 out of 28 UBeTubes: Q=αhβ, where α and β are constants (respectively, 0.24 ± 0.08 and 1.88 ± 0.27), and h is the water level above the bottom of the V notch (in cm). For the two UBeTubes for which the V notch was visibly different, we used the rating curves corresponding to their V-notch shape (α=0.080, β=2.269). The flow into the UBeTubes, when the water level was below the V notch, was based on the diameter of the UBeTubes.
3.2.2 Soil moisture measurements
We installed soil moisture sensors (TEROS 12 and GS3, METER Group, USA) at 5, 20 and 30 cm below the surface at the edge of six of the plots: C3.1, C3.4, C3.8, C5.2, C5.4 and C5.6. The sensors were connected to ZL6 and EM50 data loggers (METER Group, USA) that recorded the soil moisture at a 5 min frequency.
3.2.3 Precipitation data
Precipitation was measured with a tipping bucket at the Erlenhöhe meteorological station, located ∼400 m from the Studibach outlet at 1215 m a.s.l. The data were provided by the Swiss Federal Institute for Forest, Snow and Landscape Research (WSL) and have a 10 min resolution.
3.3 Plot characteristics
For each plot, we determined several characteristics (Tables 1 and S2 in the Supplement). Many of these site characteristics are correlated with each other (Tables S3 and S4 in the Supplement). We classified the plots according to four main vegetation types: open forest (F), natural clearings in the open forest (C), grasslands (G) and wetlands (W). Forests are areas with large spruce trees, where the soil is covered mainly by moss or blueberry bushes (plots C2.1, C2.5, C3.1), or young trees (plot C3.5). Clearings are small open areas in the forest covered by grasses, mosses, horsetail, alpine flowers and blueberry bushes (i.e. they are natural open areas and not locations where the forest has been logged). Grasslands are large open areas dominated by grasses and alpine flowers. Wetlands are also open areas but are dominated by sphagnum moss, horsetail, alpine flowers and grasses.
During the trench installation, we determined the depth of the A and B horizons. In addition, soil samples were taken next to each plot at 10–15 cm below the soil surface to determine the organic matter (OM) content based on the loss on ignition. In addition, we determined the porosity and moisture content at field capacity and at wilting point for the soil cores using the Hydroprop (METER Group, Germany; data: Sonja Eisenring, 2023) and measured the steady-state infiltration rate using a large double-ring infiltrometer in the field to determine the saturated hydraulic conductivity (Wadman, 2023).
The topographic wetness index (TWI) of the plots was based on the analyses of Rinderer et al. (2014). The slope of the plots was determined by measuring the difference in elevation between the top and the bottom of the plots using a self-made microtopographic profiler (cf. Leatherman, 1987).
3.4 Data analysis
3.4.1 Precipitation event characteristics
We divided the measurement period into 27 events, defined as periods with more than 5 mm of precipitation, separated by at least 12 h without precipitation. For the plots in catchment C3, data were recorded for all 27 events. Measurements for the plots in subcatchments C2 and C5 started later, and so data are only available for the last 20 events (E7–E27, Table S1 in the Supplement). For each event, we determined the total precipitation (P), 10 min maximum precipitation intensity (I10), mean precipitation intensity over every 30 min period with precipitation (Imean) and the event duration (time between the start and end of the event; D) (Table S1). Not surprisingly, many of these event characteristics were correlated with each other (see Table S5 in the Supplement). We, furthermore, looked at the distribution of the mean intensities for the different events and divided the events into three categories corresponding to different danger classes in the northern part of the Alps (MétéoSuisse, 2021): low (<2 mm h−1), medium (2–4 mm h−1) and high (>4 mm h−1). To characterise the antecedent-wetness conditions for each event, we determined the antecedent soil moisture index (ASI; Haga et al., 2005) for the top 5 cm of the soil by multiplying the average moisture content measured at 5 cm depth at the start of the event by the 5 cm depth. To calculate the average soil moisture, we used three of the six soil moisture sensors (at C3.4, C3.8 and C5.2) that cover the range of TWI values and had the longest complete data record. We determined the ASI for other depth intervals using different sensors (e.g. 0–10, 0–15, 0–25 and 0–30 cm) as well, but these were all highly correlated (r2>0.99). Finally, we determined the sum of the ASI and P (ASI+P) for each event as a measure of the overall wetness conditions (Detty and McGuire, 2010; Penna et al., 2011).
3.4.2 Runoff response
For each event and plot, we calculated the total flow from the UBeTubes between the start of the event and 6 h after the precipitation stopped (QOF and QTIF), the time of the start of the response (ts) (i.e. when the flow from the UBeTubes started or when the flow started to increase), and the time of the peak flow rate (tp). We calculated the lag times from these data by relating them to the start of the precipitation event and the peak precipitation intensity. We determined the percentage of events for which the total amount of OF or TIF was >0.1 L (FOF and FTIF, respectively). We chose this threshold because of the uncertainties in the water level data (i.e. it was not always clear if the event caused a very small change in the water level in the UBeTubes (only a few mm) due to a minimal amounts of flow or if this small change was due to measurement uncertainties) and because such small flow amounts are insignificant. To compare the runoff responses for the different events, we calculated the runoff ratios for OF and TIF (ROF and RTIF, respectively) by dividing the total flow (QOF or QTIF) by the total precipitation (P) and the projected area of the plots. Here, we set all total flow amounts <0.1 L to zero. Finally, we determined the total amount of near-surface runoff () and the percentage of the near-surface flow caused by OF ().
3.4.3 Statistical analyses
To determine the influence of the event characteristics (P, I10, Imean, D, ASI, ASI+P) on the amount of flow (QOF or QTIF) or the runoff ratios (ROF or RTIF), we used the Spearman rank correlation (rs). This was done for each plot for which there were at least four events for which flow was measured. To determine the presence of a runoff threshold, segmented regressions were conducted for the relation between the ASI+P and ROF or RTIF for each plot using the “piecewise-regression” package (Pilgrim, 2021). As there was not always an evident threshold at the derived breakpoint, we defined some thresholds visually. Similarly, we used the Spearman rank correlation (rs) between the site characteristics (Table 2), the frequency of flow (FOF and FTIF) during the monitoring period, the runoff ratios (ROF and RTIF) and the percentage of total flow caused by OF (POF) for the 26 out of the 27 events for which flow was measured for at least four plots. As an overall measure of the relation between the site characteristics and the runoff ratios, we determined the average of the Spearman rank values across the 26 events. For the vegetation (categorical data), we used dummy variables based on the ranking (high to low) of the vegetation cover: forest (0), clearing (1), grassland (2) and wetland (3). All analyses were done in Python (version 3.12). In particular, we used the packages Pandas, SciPy, Matplotlib and Seaborn.
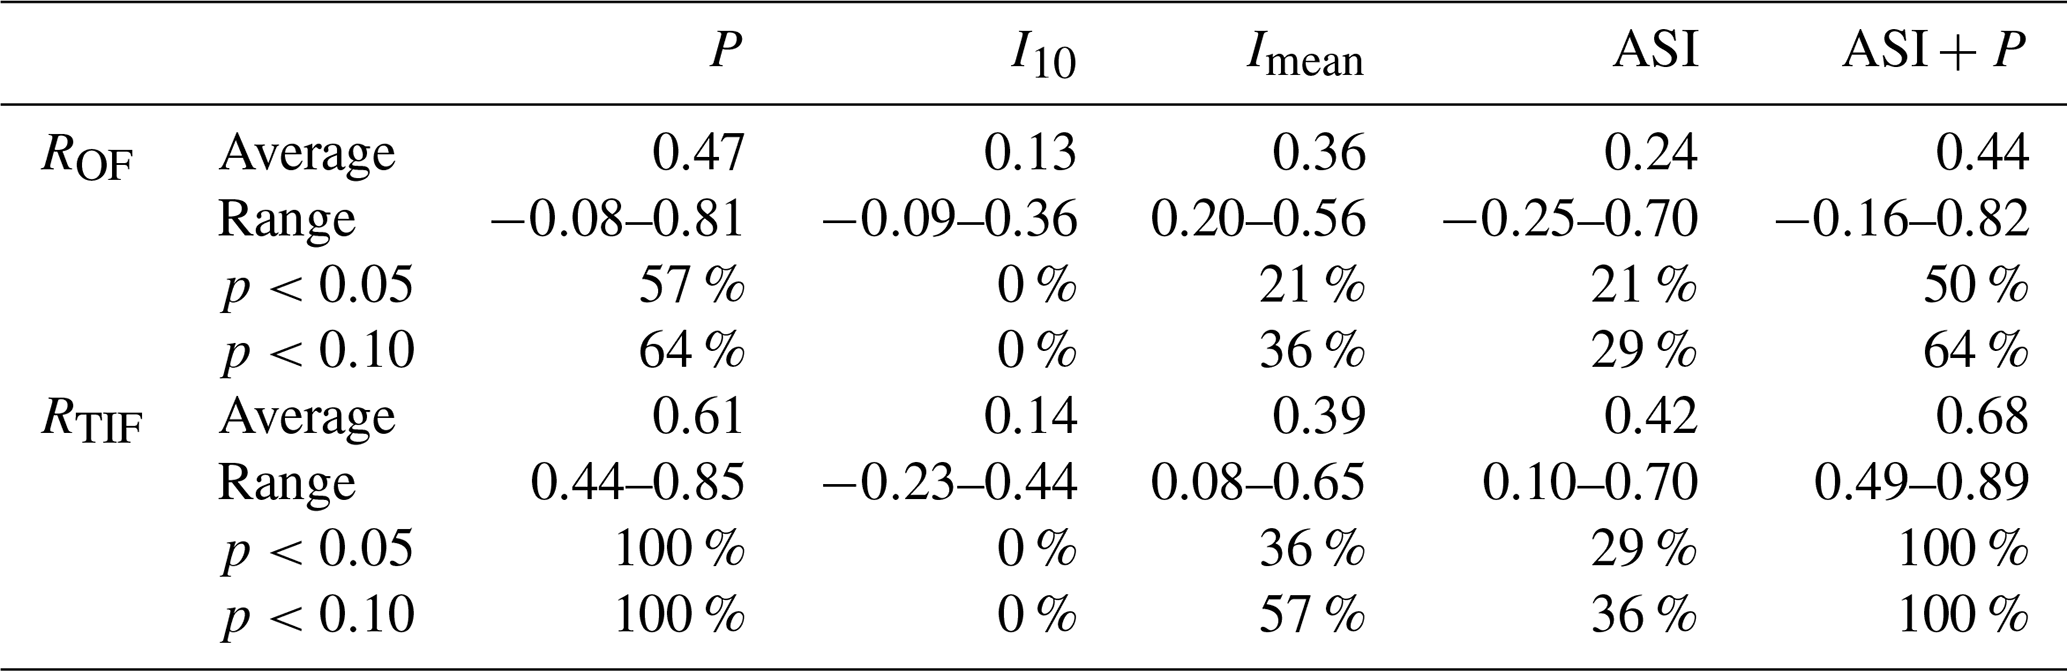
Table 2The average and range (min–max) of the Spearman rank correlation between the runoff ratio and the five event characteristics for overland flow (ROF) and topsoil interflow (RTIF), as well as the percentage of plots for which the correlation was statistically significant at the 0.05 and 0.10 levels. P: total precipitation (mm); I10: 10 min maximum precipitation intensity (mm h−1); Imean: mean precipitation intensity for every 30 min period with precipitation (mm h−1); ASI: antecedent soil moisture index for the top 5 cm of soil (mm); ASI+P: antecedent soil moisture index plus total precipitation (mm).
4.1 Occurrence of OF and TIF
Total precipitation for the 27 events ranged between 5 and 98 mm, and the 10 min maximum intensity varied between 4.8 to 63.0 mm h−1 (Table S1). Even though the summer of 2022 in the Alps was classified as relatively dry (Abegg and Mayer, 2023), we measured overland flow (OF) and topsoil interflow (TIF) for approximately half of the events (Fig. 2). However, the frequency of OF and TIF (FOF and FTIF, respectively) varied considerably from plot to plot (Fig. 2), ranging from 14 % to 78 % for FOF and between 19 % and 86 % for FTIF. For most of the plots, FOF and FTIF were similar (e.g. C3.8, C5.5 or C5.6), or FOF was lower than FTIF TIF (e.g. C2.7, C3.1). However, there were two clear exceptions: for the forested plots C2.1 and C2.5, OF was measured much more frequently than TIF (Fig. 2).
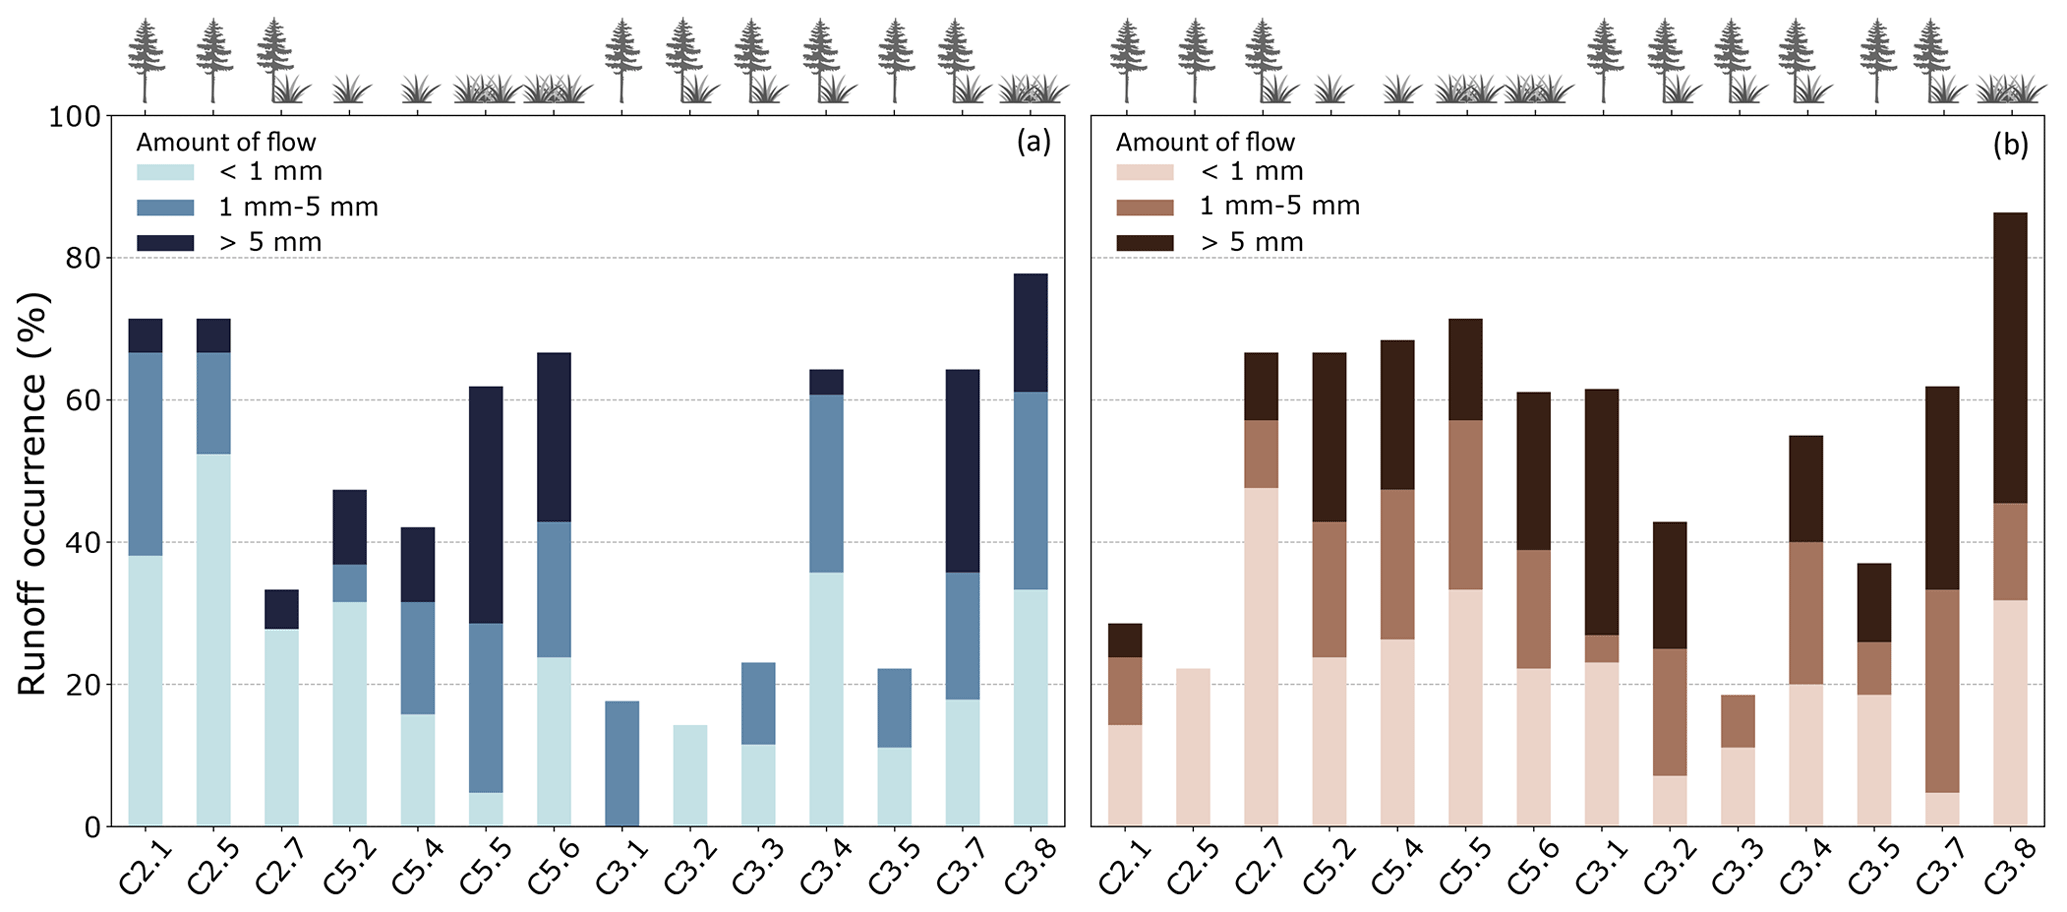
Figure 2Percentage of events for which overland flow (FOF; a) or topsoil interflow (FTIF; b) was measured during the summer of 2022 for each of the 14 plots (ordered by subcatchment and topographic wetness index (TWI)). Each bar is divided into three categories to indicate the frequency of very small (light colour), small (median colour) and considerable (dark colour) amounts of flow. The icons above the bars indicate the land cover. For other details about the plots, see Table 1.
4.2 Runoff ratios
The runoff ratios for OF and TIF (ROF and RTIF, respectively) were highly variable and varied from plot to plot and event to event (Fig. 3). ROF did not seem to be considerably affected by the opening of the plot border at the upper end of the plot on 10 September as the ratio between the average of ROF before and after 10 September was 1.06 (Fig. 4). The runoff ratios for OF were >1 at up to three plots during events E1, E5, E10 and E24. As the plot borders were not deep enough to block lateral inflow or outflow for TIF and because the contributing area was likely much larger than the plot for TIF, it is not surprising that the runoff ratios for TIF were >1 during these events (at up to nine plots).
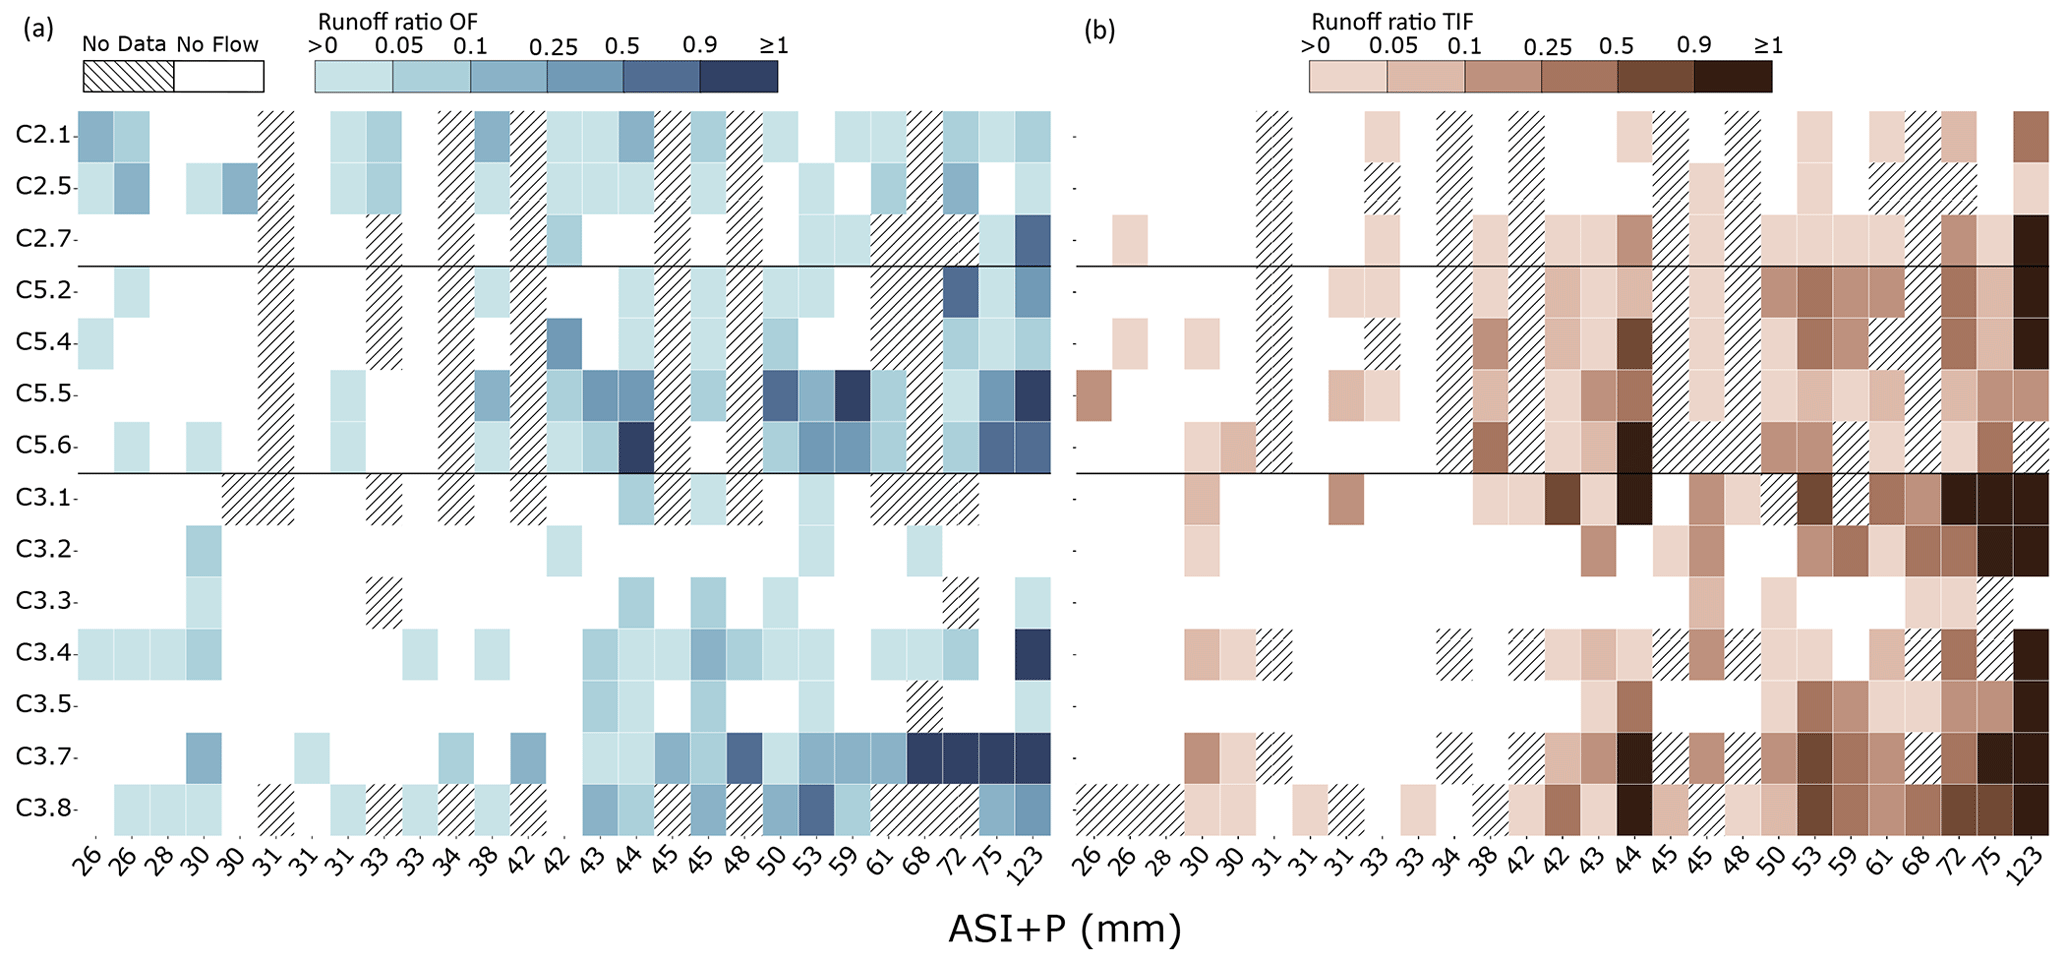
Figure 3Heatmap of the runoff ratio (R) for each event (x axis) and each plot (y axis) for overland flow (ROF; a) and topsoil interflow (RTIF; b). Events are ranked according to the ASI+P. For events that produced <0.1 L of flow, the runoff ratio is plotted as zero (white). All runoff ratios >1 were set to 1 for plotting. Events for which data are missing are indicated with hatched lines. See Figs. S5 and S6 for the heatmaps where the events are ordered according to the total precipitation (P) and the mean precipitation intensity (Imean), respectively.
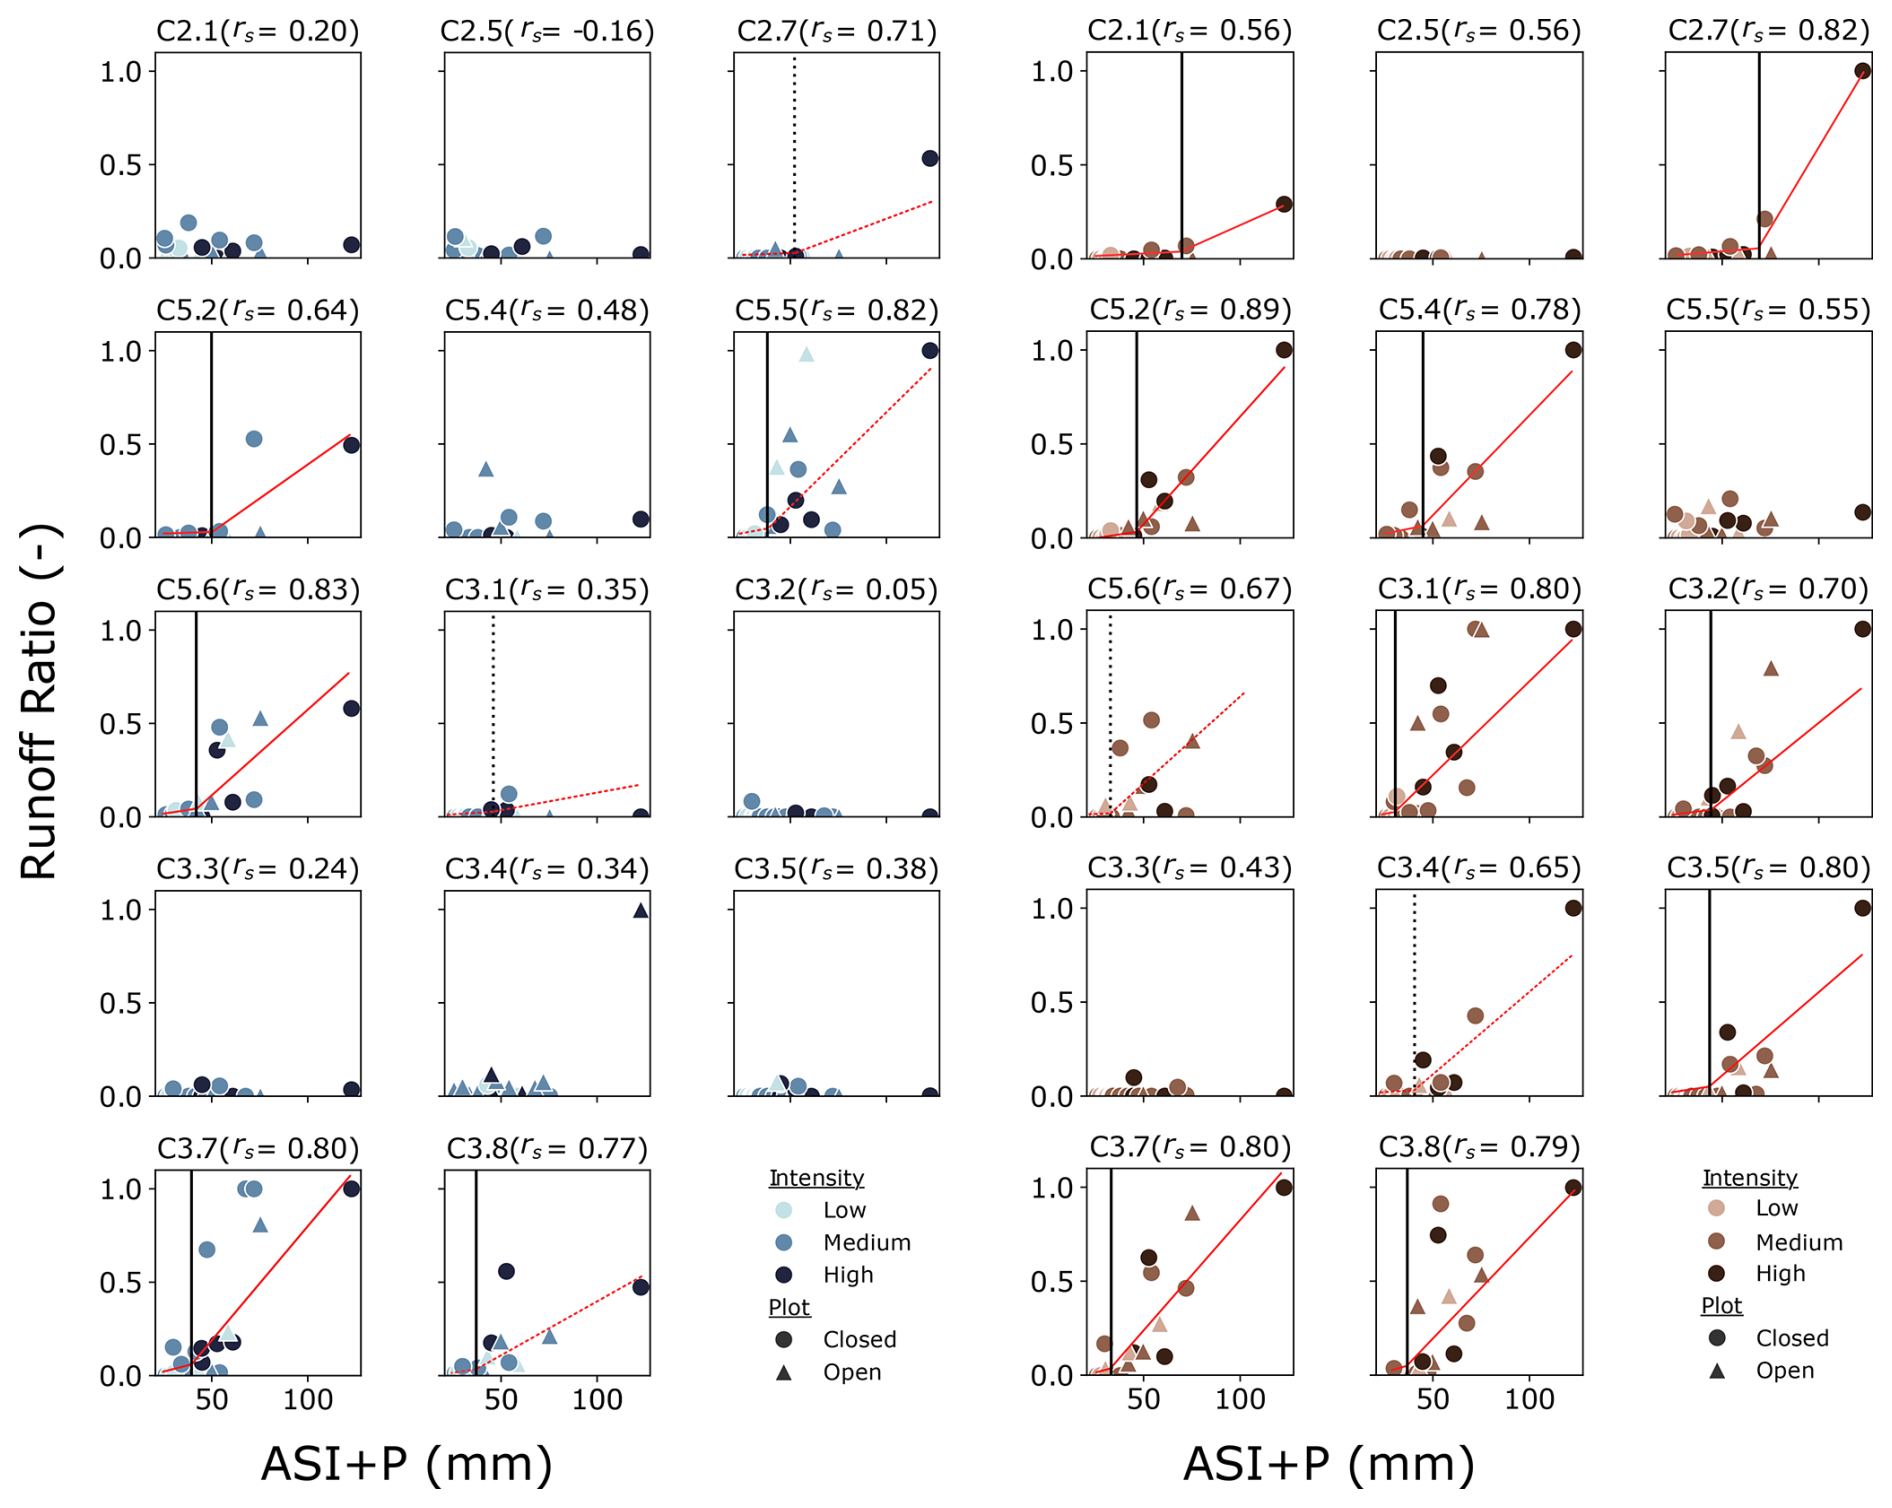
Figure 4Relation between the runoff ratio (R) and ASI+P (mm) for overland flow (ROF; left) and topsoil interflow (RTIF; right) for each plot. The red line indicates the results of the piecewise regression, and the black line indicates the threshold (computed: solid line; determined manually: dashed line). The Spearman rank correlations are printed above each subplot. Runoff ratios >1 are plotted as 1 for visual clarity. Each symbol represents one event, whereby circles represent events before 10 September when the upper border was closed, and triangles represent events when the upper border was open. The colour of the symbols represents the mean intensity class: low, medium and high.
4.2.1 Temporal variation in runoff ratios
The runoff ratios increased with increasing precipitation and antecedent-wetness conditions (ASI+P) for many plots (Figs. 3 and 4). However, this was not the case for some plots in the forest or natural clearings. For plots C2.1, C2.5 and C3.4, the runoff ratios for OF (ROF) were considerable for events with low ASI+P, but these did not increase in wetter conditions (Fig. 3).
For most plots, the runoff ratios for OF and TIF were high as soon as ASI+P was higher than ∼39 mm (Figs. 3 and 4). For seven of the plots, there was a clear runoff threshold for OF. For TIF, this was the case for 11 of the 14 plots (Fig. 4). The Spearman rank correlation between ASI+P and ROF varied between −0.16 and 0.82 (mean across all plots: 0.44) and was statistically significant for half of the plots. It was low (rs<0.5) and not significant for plots C2.1, C2.5, C3.1, C3.2, C3.3, C3.4 and C3.5. In general, the correlations between the runoff ratio for OF (ROF) and ASI+P were highest for the plots with a higher TWI (rs=0.77; p<0.01), but this was partly because more events resulted in flow for the plots with a higher TWI (Fig. 2). For TIF, the Spearman rank correlation between ASI+P and the runoff ratio (RTIF) varied between 0.49 and 0.89 (mean across all plots: 0.69) and was significant for all plots (Table 2). The correlation between ASI+P and RTIF was lowest for plots C2.1, C2.5, C3.3 and C5.5. The strength of the relation between ASI+P and RTIF was not related to the TWI (rs=0.01; p=0.74).
The correlations between the runoff ratios and total precipitation were fairly similar to those between the runoff ratios and ASI+P (compare Figs. 3 and S5 in the Supplement). This was not the case for the ASI alone. For plots with a low TWI, the OF ratios were negatively correlated with the ASI, while, for plots with a higher TWI, they were positively correlated with the ASI (Table 2; Fig. S7 in the Supplement). The Spearman rank correlation between the TWI and the correlation between the runoff ratio and the ASI was 0.87 for OF (p<0.001). This relation was not observed for TIF (rs=0.24; p=0.40).
Contrarily to our expectation, there was no statistically significant correlation between the 10 min maximum rainfall intensity (I10) and the runoff ratio (neither for ROF nor RTIF). The relation between the runoff ratio and the mean intensity was not clear either (rs ranged between 0.20 and 0.56 for OF and between 0.08 and 0.65 for TIF) (Table 2; Fig. S6 in the Supplement).
4.2.2 Spatial variation in runoff ratios
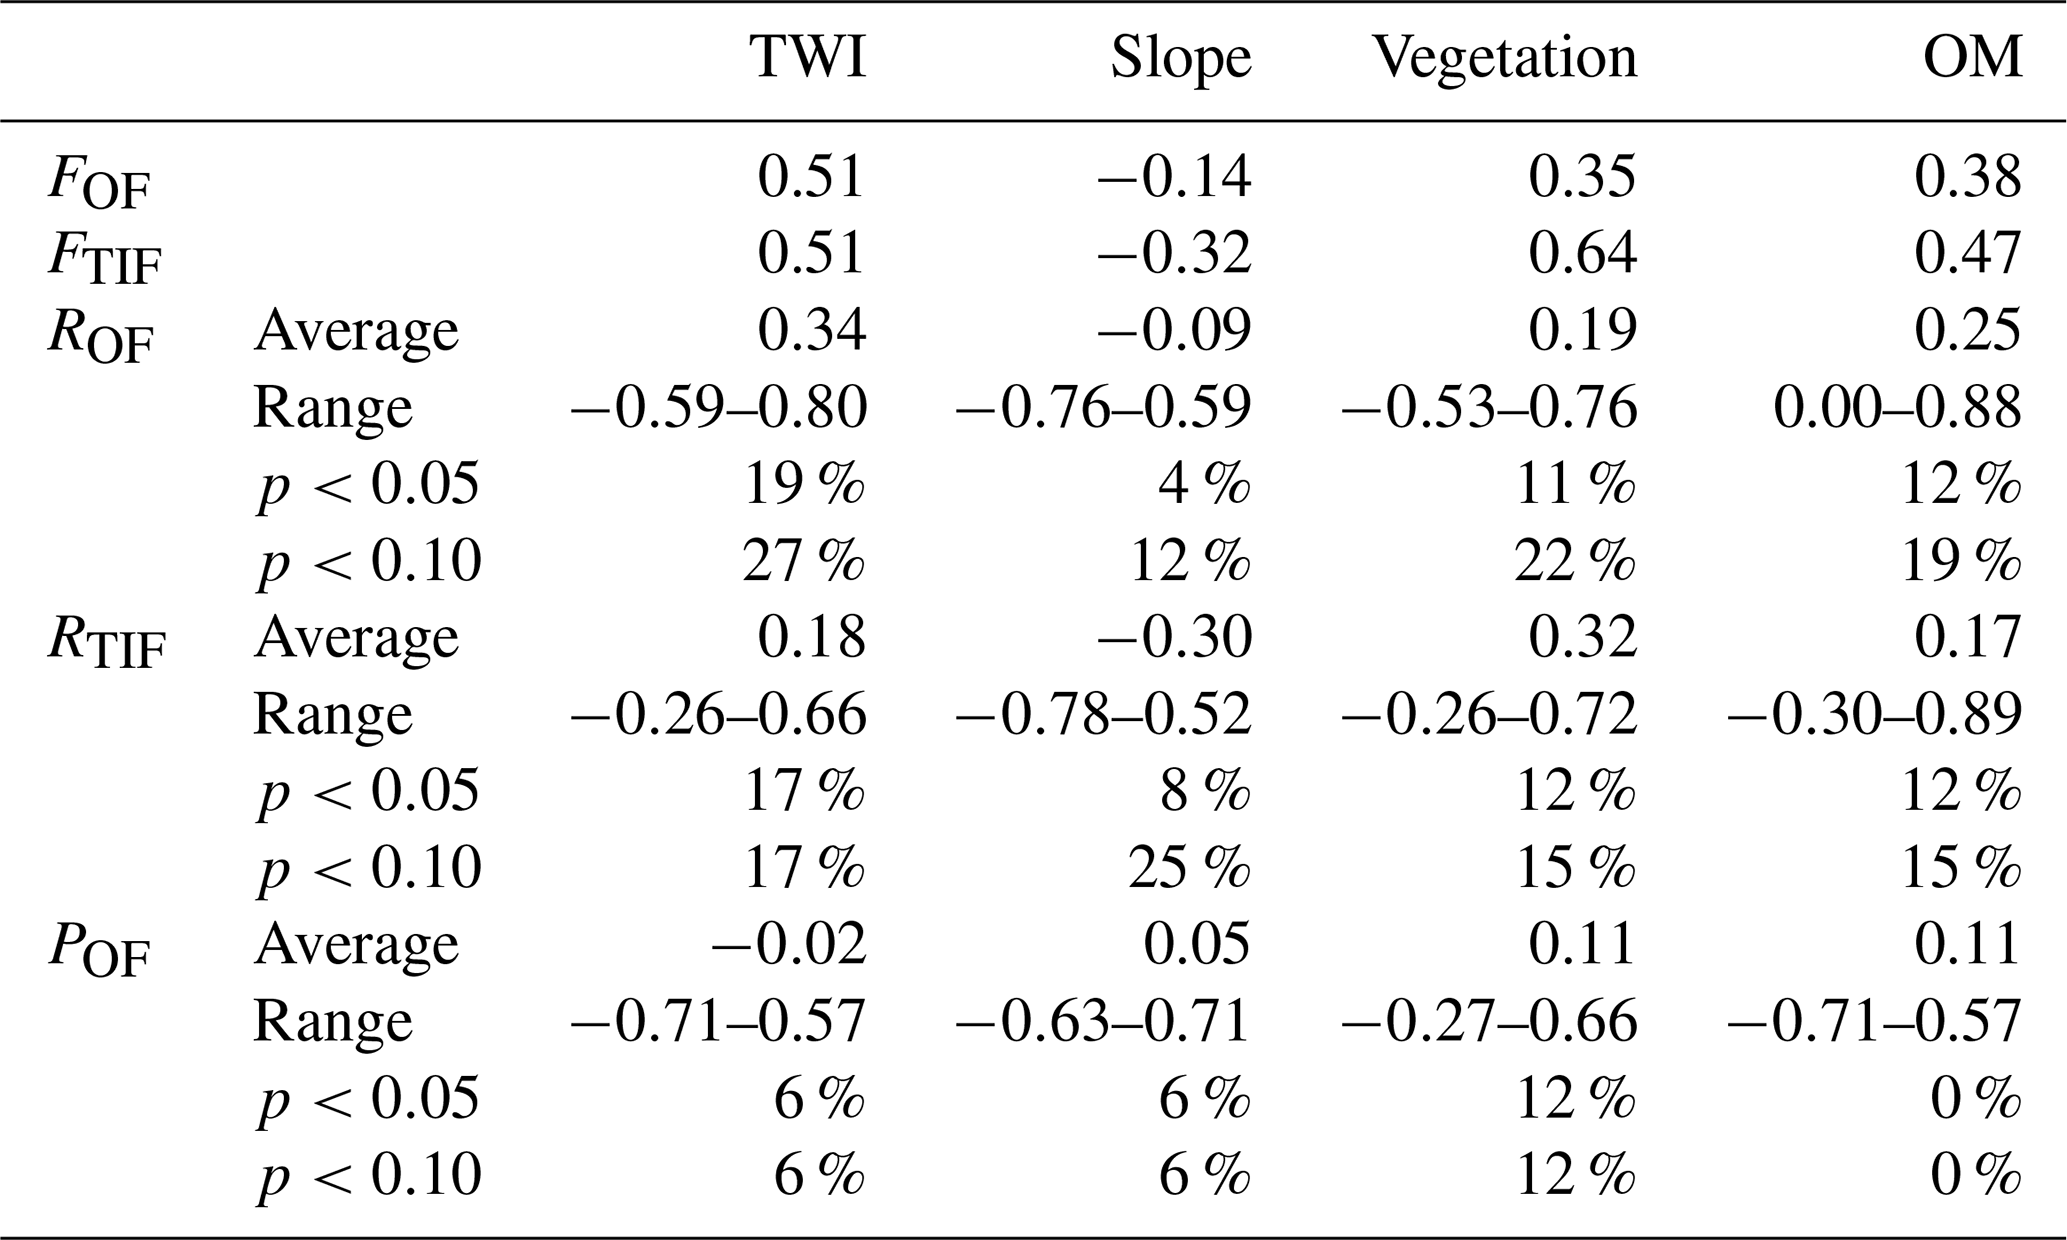
The runoff ratios of OF and TIF were positively related to the TWI (based on the contributing area and slope derived from the smoothed DEM) and negatively correlated with the local slope (i.e. the measured slope of the runoff plot), but these correlations were only statistically significant for a few events, generally the larger events with wet conditions (ASI+P >39 mm; Fig. S8 in the Supplement). The runoff ratios were also correlated with the vegetation cover and the organic matter content (Table 3). The correlations between ROF and the TWI and/or vegetation or organic matter content were higher for events with wet conditions. For RTIF, the correlations were highest for events with intermediate wetness conditions (ASI+P between 30 to 60 mm; Fig. S8). There were no clear relationships between the runoff ratios and soil characteristics, such as hydraulic conductivity, texture, porosity, drainable porosity and the field capacity (Table S6 in the Supplement). This might be partly due to the small variations in soil properties between the runoff plots (Table S2).
Table 3The Spearman rank correlation between the site characteristics (TWI, slope, vegetation and organic matter (OM) content) and the percentage of events for which OF and TIF were >0.1 L (FOF and FTIF), the average and range (min–max) of the Spearman rank correlations with the runoff ratios for OF and TIF (ROF and RTIF) and OF as a fraction of total near-surface flow (POF) for all events for which runoff was >0.1 L for four or more plots, and the percentage of events for which the correlations were statistically significant at the 0.05 and 0.10 levels.
4.3 Relative importance of OF and TIF
The fraction of total near-surface flow that flowed over the surface (POF) during an event varied spatially and from event to event. During dry conditions, most plots did not generate any OF or TIF, but for those that did (mainly the plots covered by moss in the forest (C2.1 and C2.5) and in the clearing (C3.4)), near-surface flow was dominated by OF (POF>0.5). POF decreased with increasing ASI+P for most plots (Fig. 5). The exceptions are two steep forested plots in the upper subcatchment (plots C2.1 and C2.5) and a wetland location (C5.5) that generated more OF than TIF for most events (see also Figs. 2 and 3).
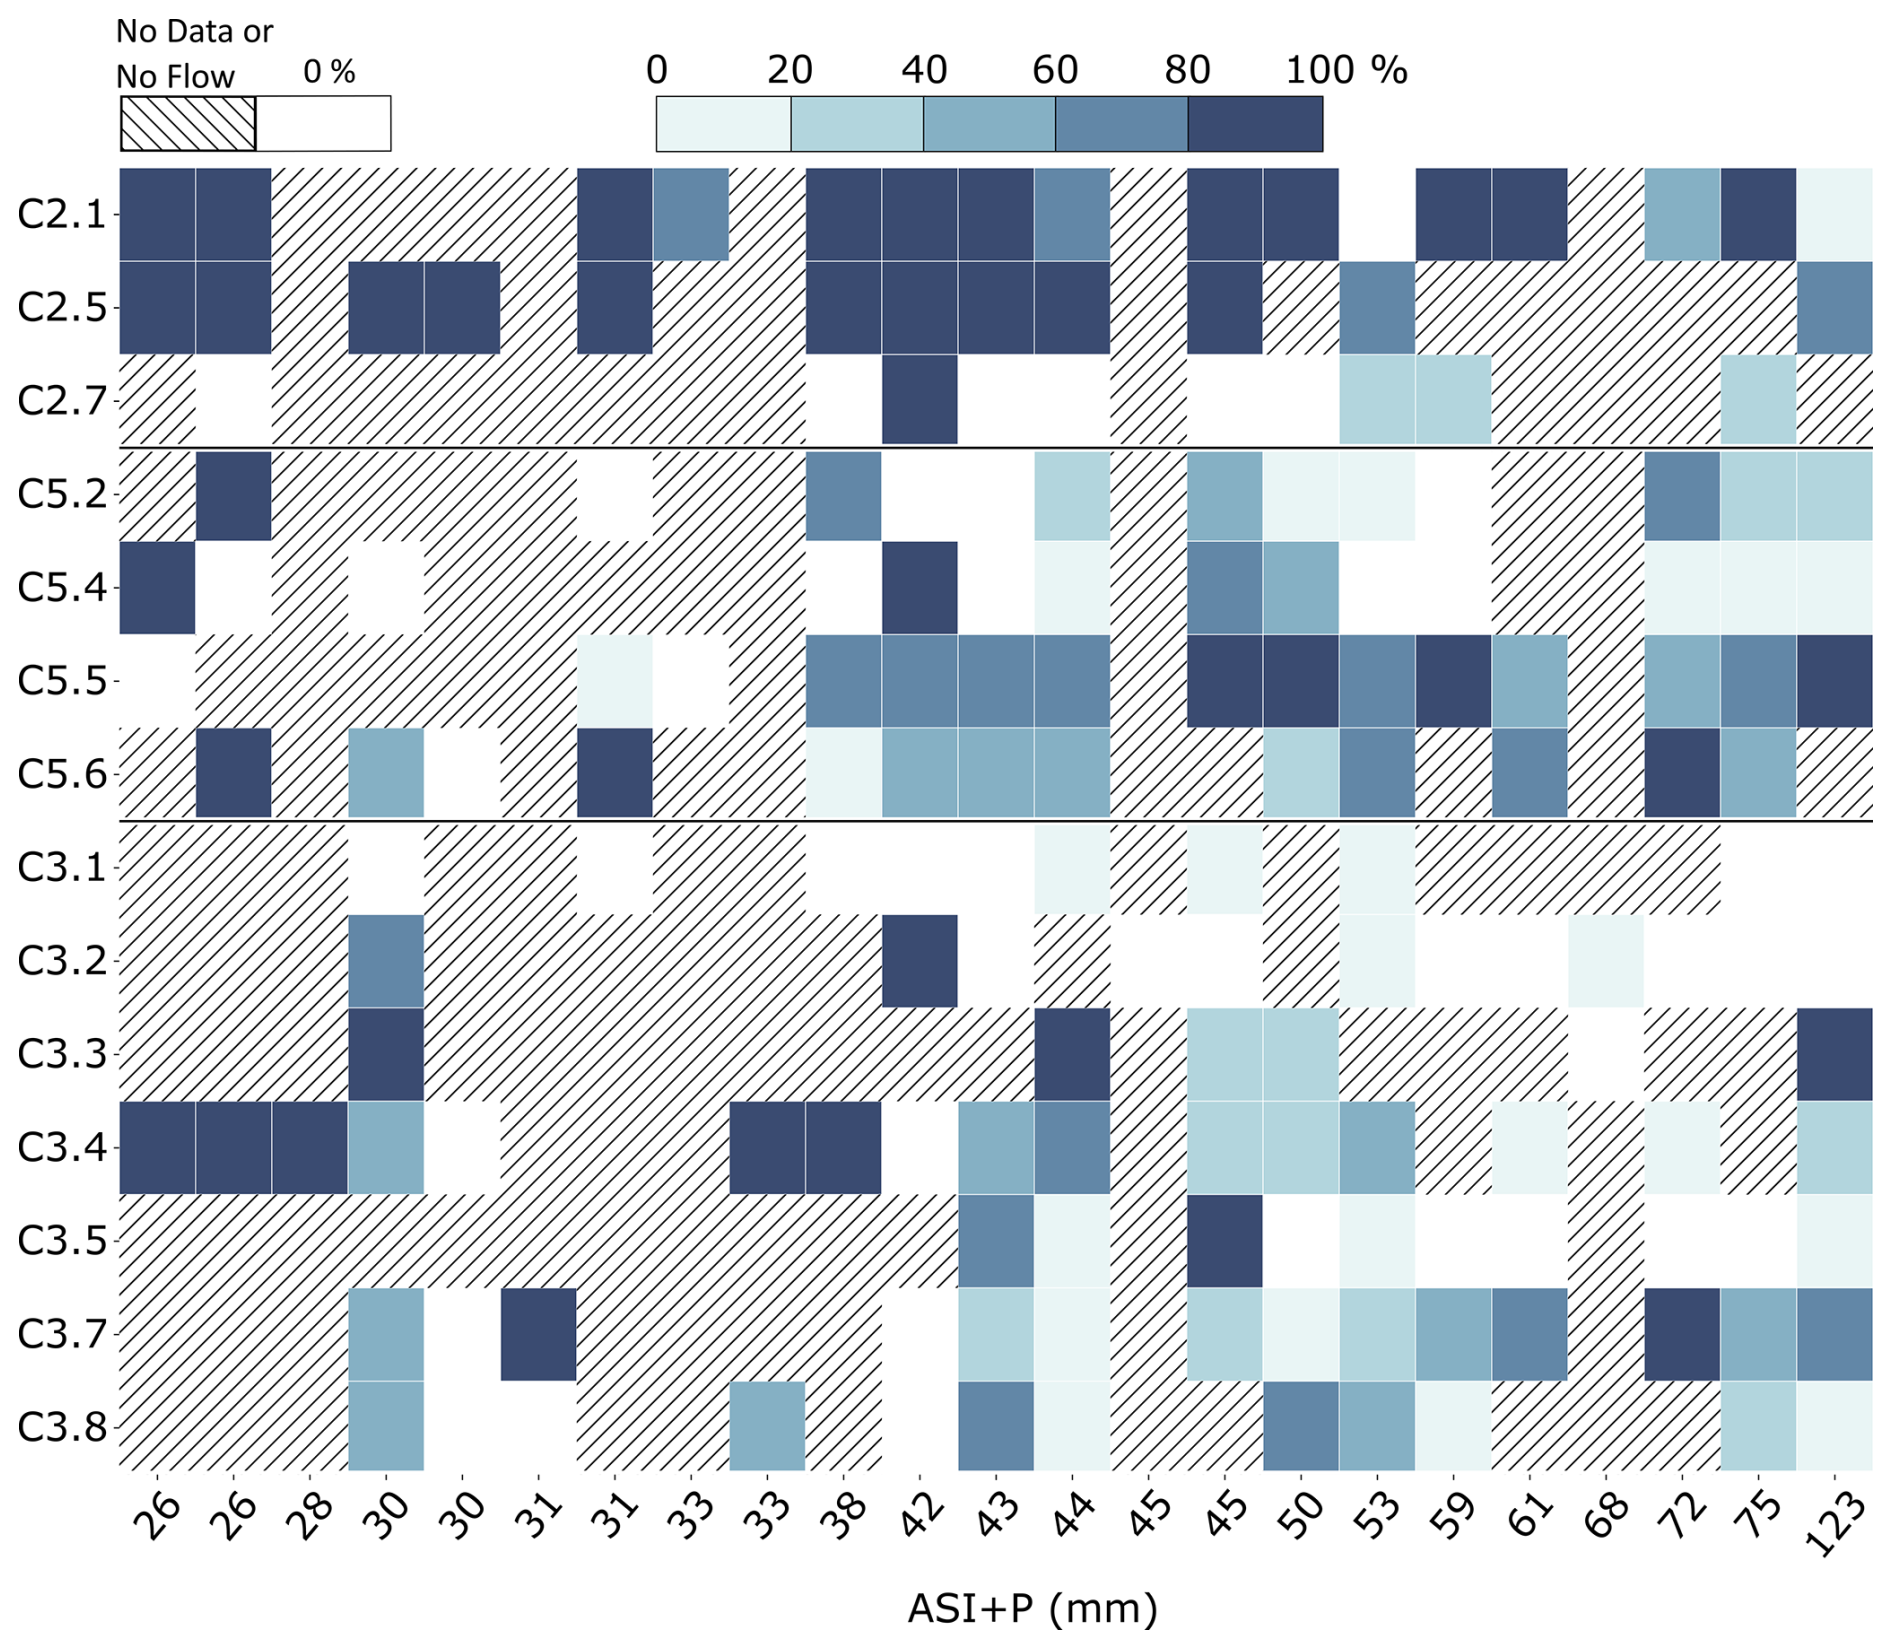
Figure 5The amount of OF as a fraction of total near-surface flow (POF) for each plot and event where at least one plot produced OF or TIF (ordered by ASI+P). White cells indicate the lack of OF or TIF. Hatched cells indicate a lack of data for either OF or TIF.
The relative importance of overland flow was not consistently correlated to the plot characteristics (Table 3) but depended on the wetness conditions. The correlation between POF and TWI increased from dry conditions () to wet conditions (rs=0.30), while the correlation between POF and slope tended to decrease from dry (rs=0.71) to wet conditions (; Fig. S9 in the Supplement).
4.4 Event responses and lag times
In Fig. 6, we show the time series of OF and TIF for event E19, a 20 mm rain event on 30 August 2022. All runoff plots, except C3.2, produced near-surface flow during this event. The runoff ratios during this event varied between 0.00 and 0.48 for OF and 0.01 and 0.91 for TIF. From this figure, it is clear that the amount of flow was largest for the plots with the highest TWI (as also indicated in Fig. 3 and Table 3 and seen for other rainfall events (Fig. S11 in the Supplement)). The runoff response is fast for all plots (median time to rise (tr): 0 min for OF and 5 min for TIF, both with a ±5 min uncertainty), except for plot C3.5, for which TIF only started 2 h after the start of the event. The responses to the two precipitation peaks during this event (at 2 and 4 h after the start of the event) highlight the sensitivity of the flow to rainfall intensity (median time to peak (tp): 13 min for OF and 15 min for TIF, both with ±5 min uncertainty). Although we observed two flow peaks for all plots that produced flow, this was clearest for the plots for which the flow rate for TIF was higher than for OF (e.g. C5.2 and C3.7).
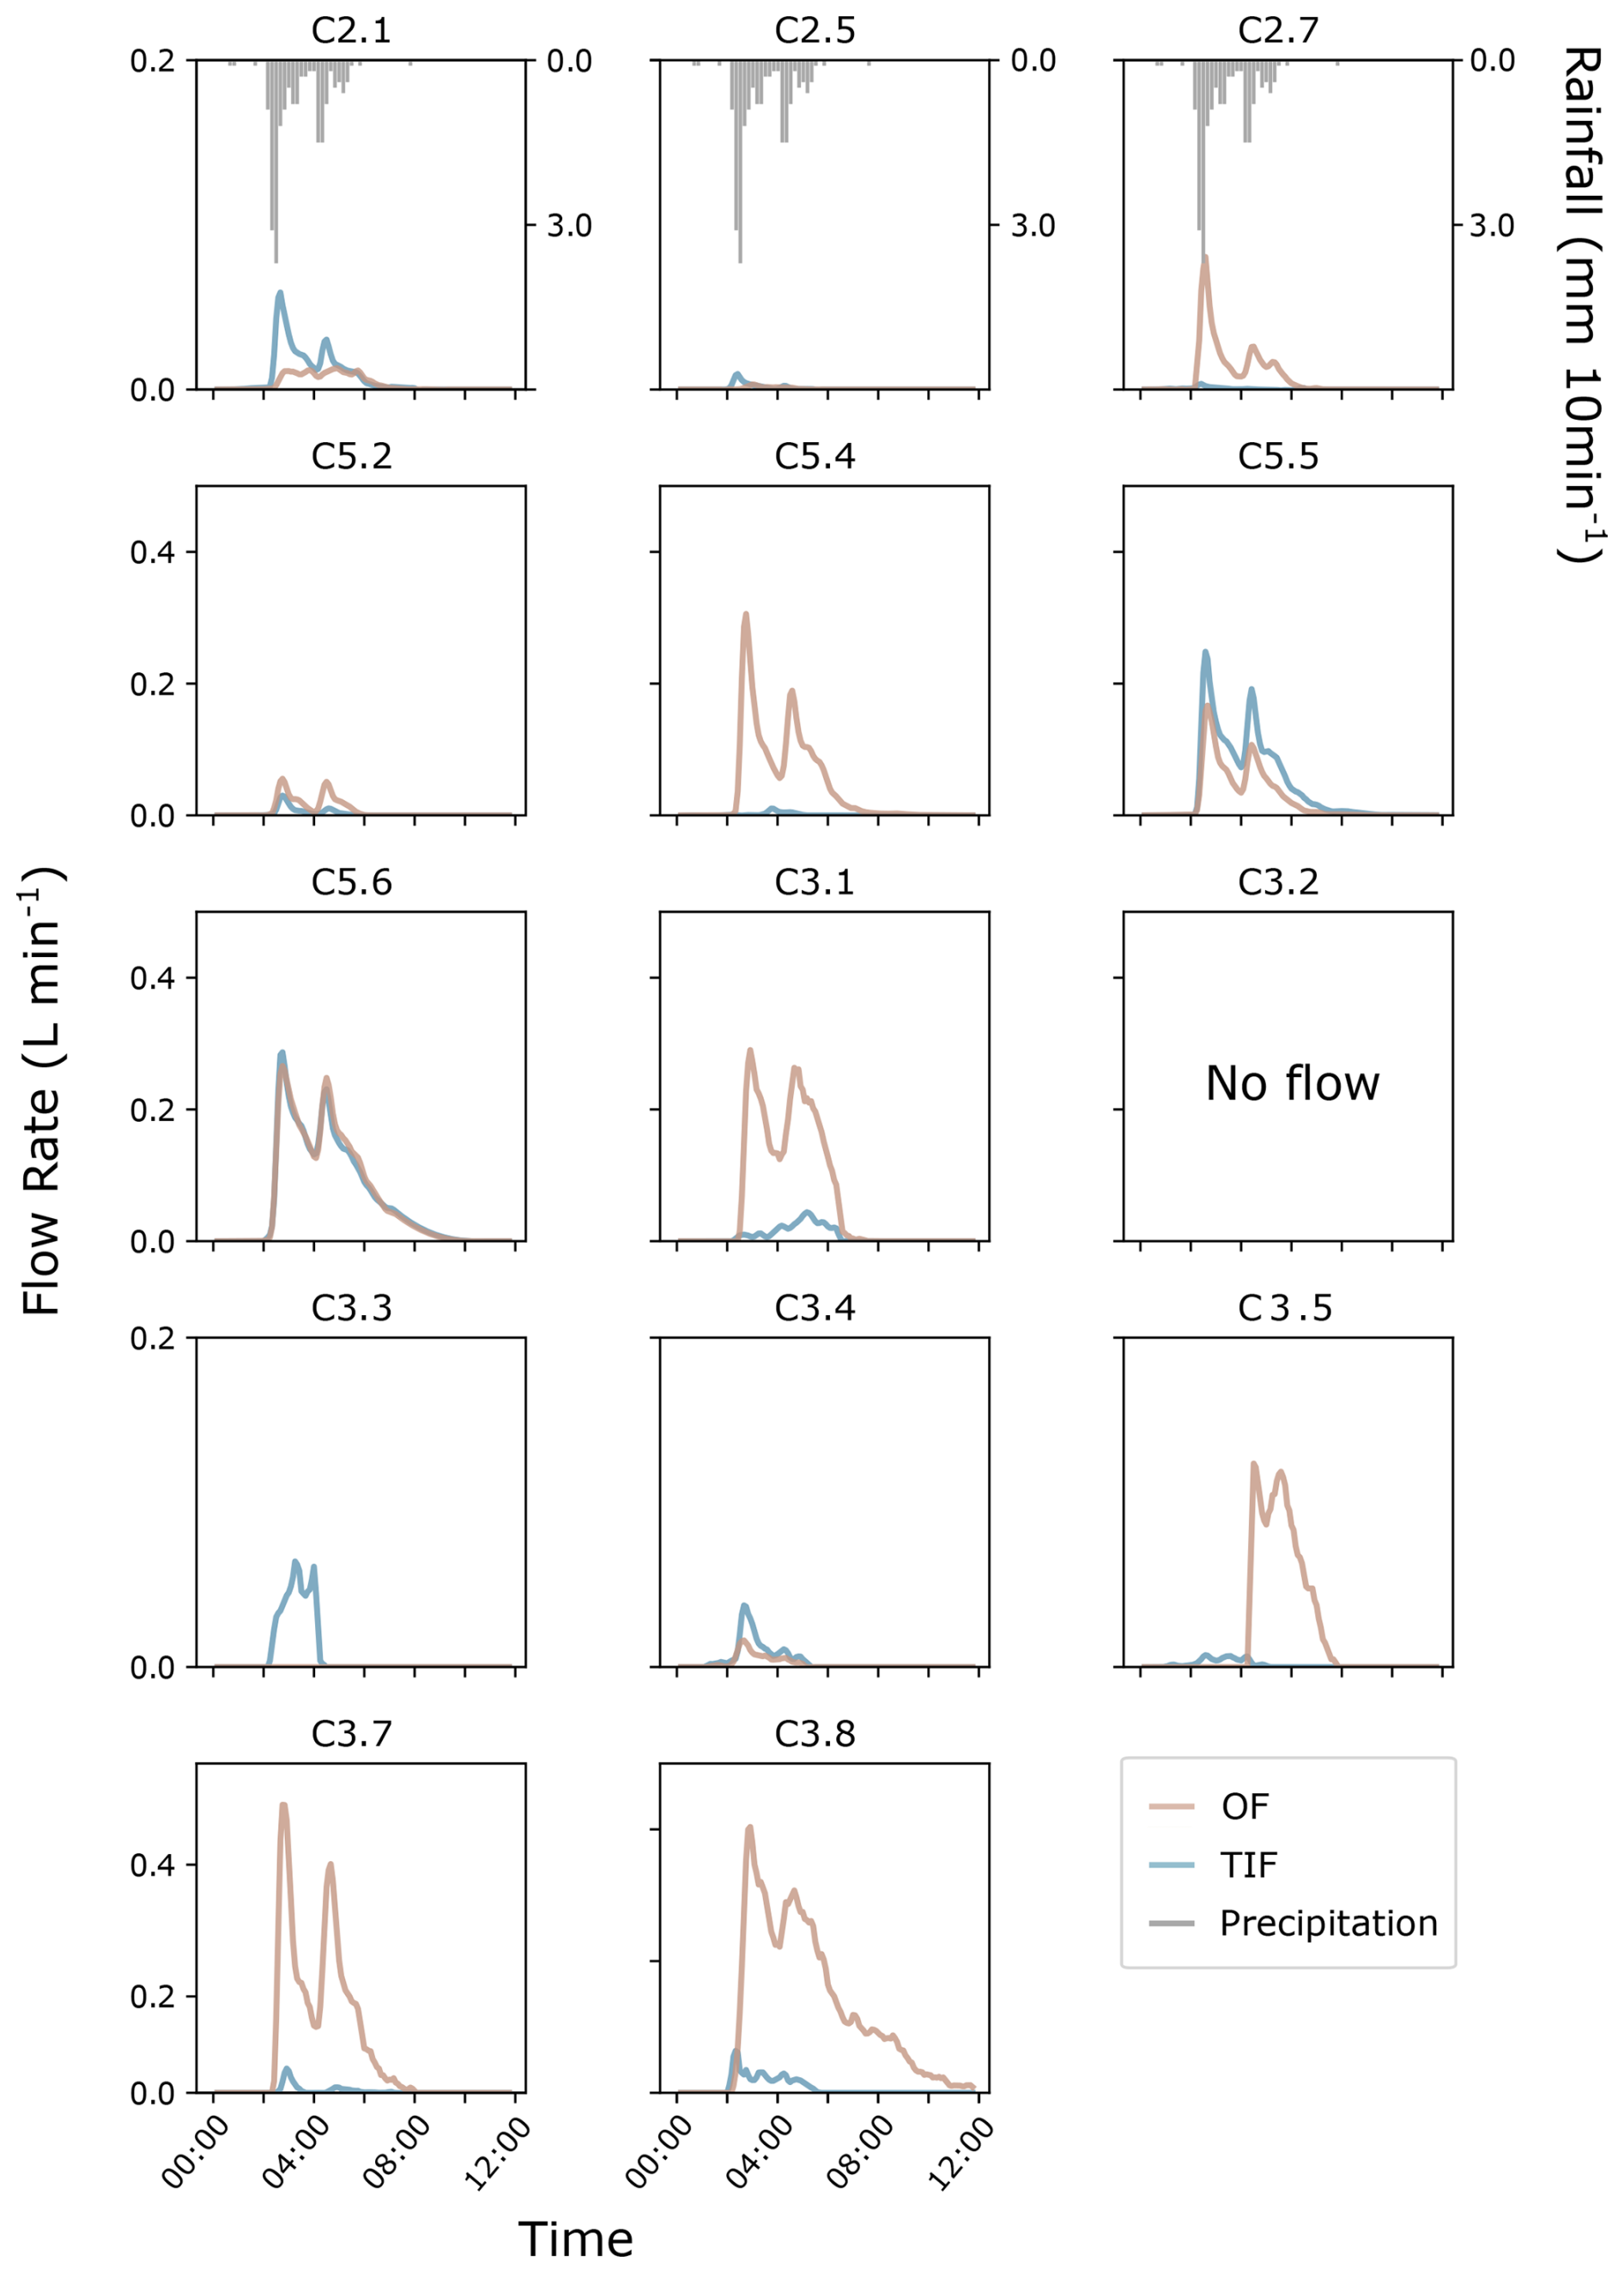
Figure 6Hydrographs for overland (OF; blue) and topsoil interflow (TIF; brown) for each plot during the 20 mm event on 30 August 2022 (event E19), as well as precipitation intensity (mm per 10 min; only shown for the upper row of figures). The same figure but with the y axis extending to the range of observed flow rates for each subplot is shown in Fig. S10 in the Supplement.
The fast responses during this event are exemplary for all events. The time between the start of the rainfall event and the time to rise (tr) was short over all events (median for all plots: 20 min for OF and 25 min for TIF, both with a ±5 min uncertainty). It was also short for the time between peak rainfall intensity and peak flow rate (tp) (median for all events and plots: 15 ± 5 min for OF and TIF). The lag times were, on average, shortest for the wetland locations and longest in the plots in the forest and clearings (Fig. S15 in the Supplement). The Spearman rank correlation between vegetation cover and the response lag times and peak lag times (tr and tp, respectively) were statistically significant for TIF ( and −0.51, respectively; p<0.06 for both) but not for OF (rs=0.19 and 0.19; p>0.5 for both). Although these response times are clearly short, they should be interpreted with caution as the precipitation was measured only at one location, and the onset of precipitation probably varied across the catchment.
For almost half (48 %) of the cases (i.e. combinations of events and plots for which OF and TIF occurred), OF responded first. For a third (34 %), TIF responded first, while for nearly a fifth of the cases (18 %), OF and TIF responded at the same time (i.e. within 5 min; Fig. 7). OF responded first more frequently for the plots in subcatchments C2 and C3 (48 % and 61 % of cases, respectively) than for the plots in subcatchment C5, where OF occurred first only for 30 % of the cases, and TIF responded first for 46 % of the cases. Whether OF or TIF responded first seemed to be unrelated to the event characteristics (Figs. 7 and S12 in the Supplement).
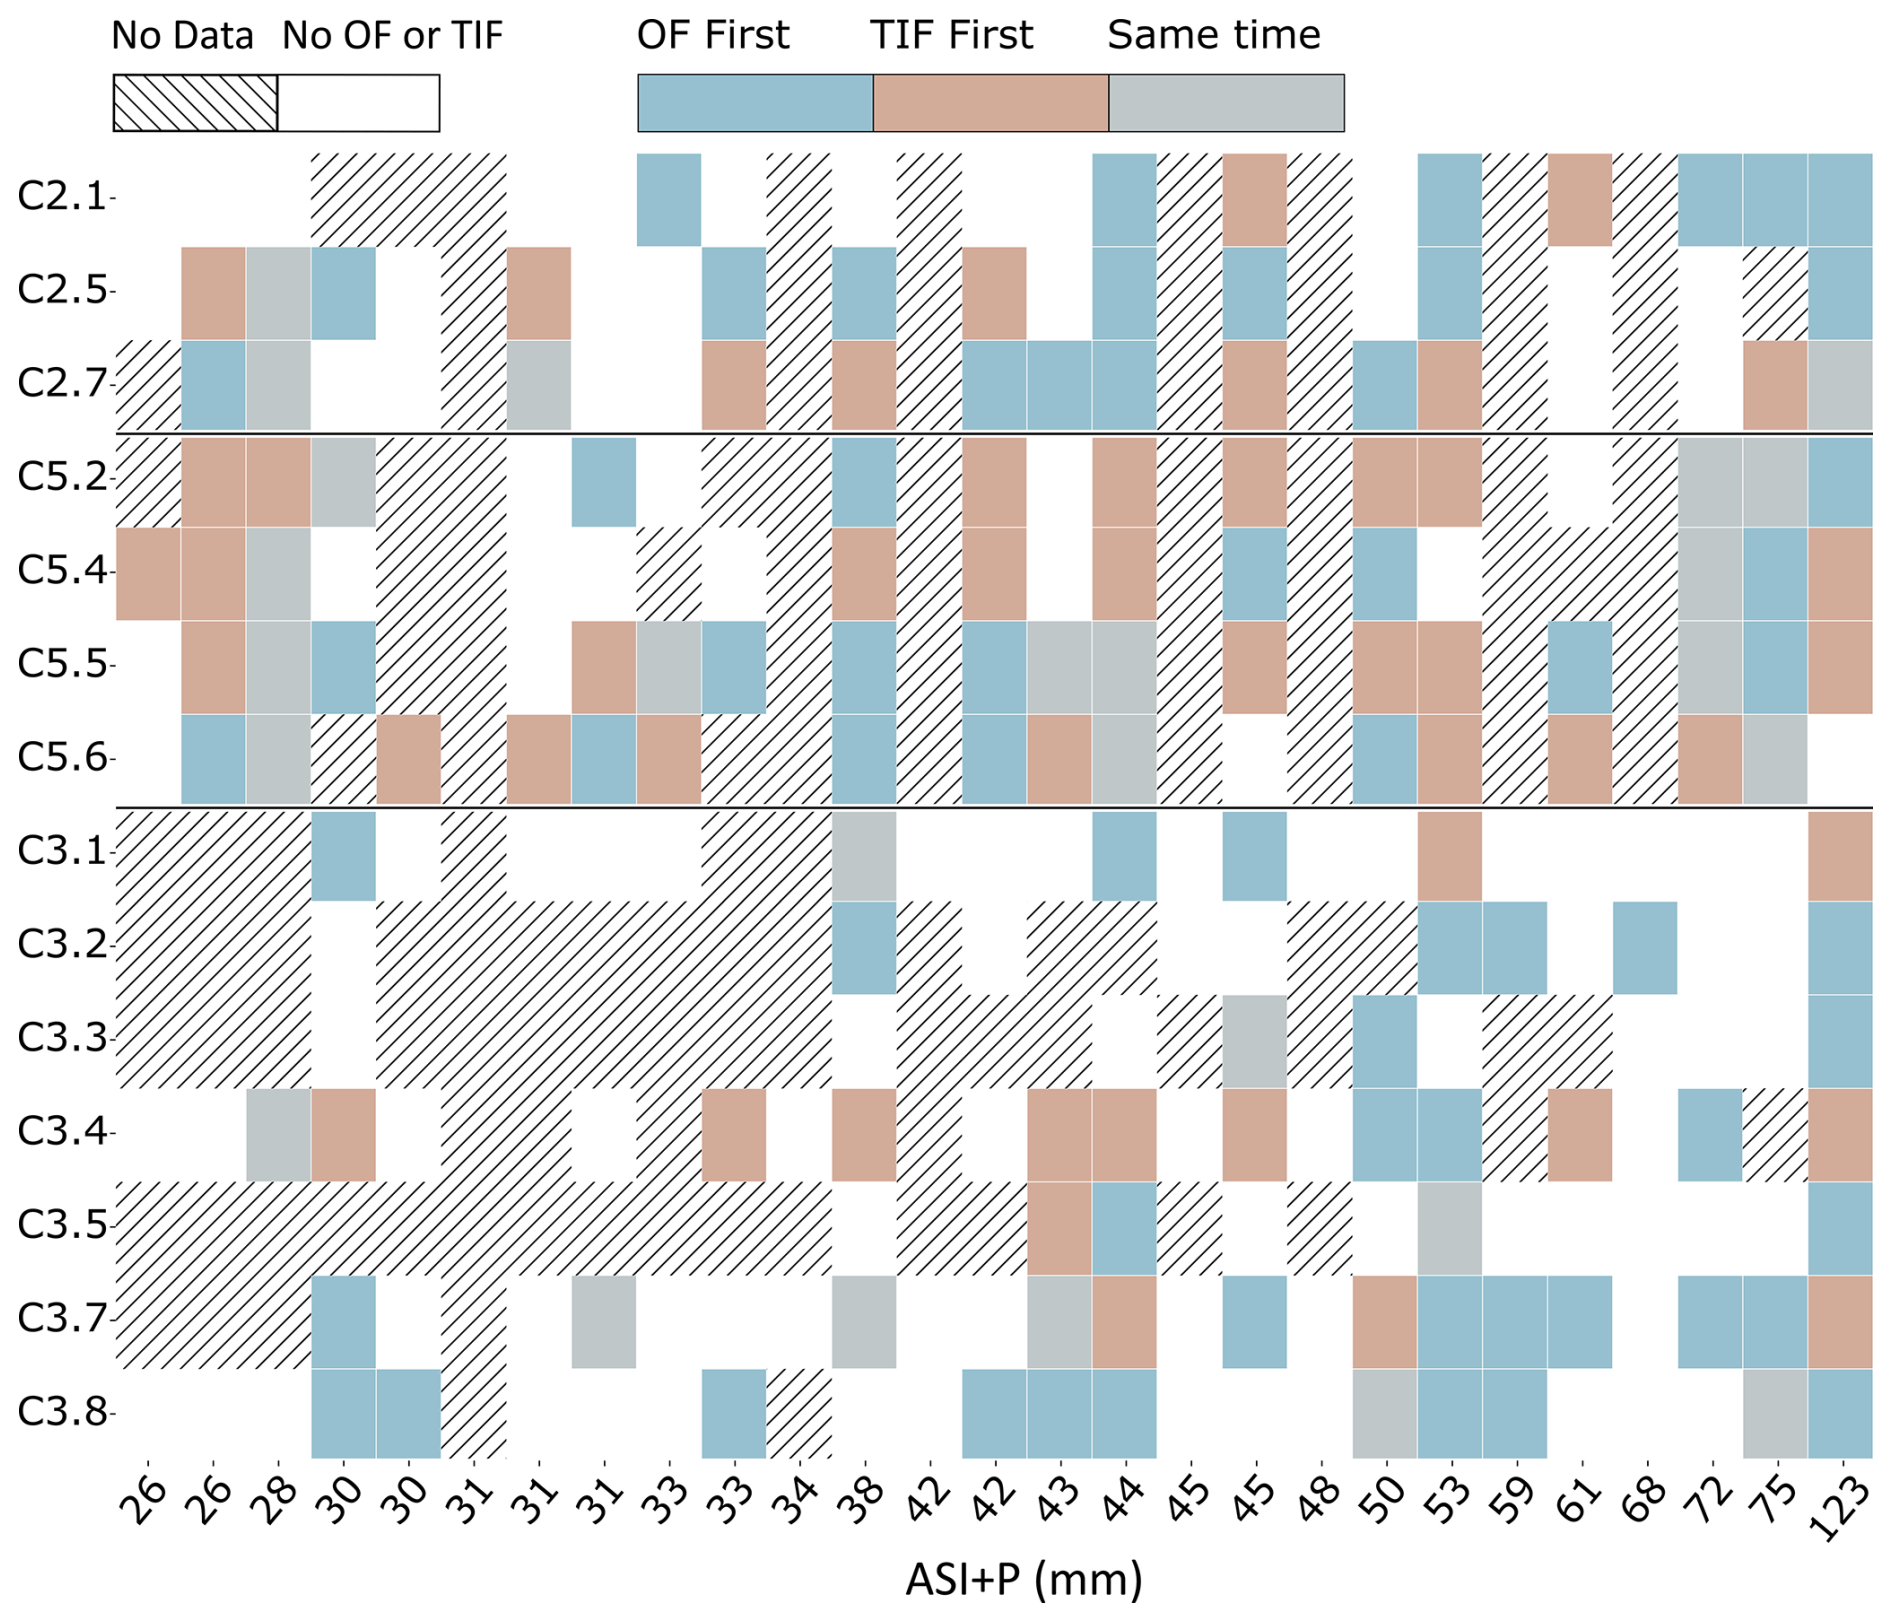
Figure 7Heatmap showing whether overland flow (OF, blue) or topsoil interflow (TIF, brown) responded first or if both responded within 5 min (same time, grey) for each rainfall event (ordered by increasing ASI+P) and plot (y axis). Hatched lines indicate the lack of OF and TIF for that particular event, while white cells indicate a lack of data for either OF or TIF. For a similar figure where the events are ranked by mean intensity, see Fig. S12.
Peak flow occurred first for OF for 41 % of the cases, first for TIF for 41 % of the cases, and at the same time for OF and TIF for 17 % of the cases (Figs. S13 and S14 in the Supplement). However, similarly to the results for the response time, there were differences between the subcatchments. For instance, OF peaked first more often for the plots in C2 (62 % of the cases), and TIF peaked first more often for the plots in C5 (41 % of the cases; Fig. S13).
5.1 Near-surface flow occurs frequently
Near-surface flow was observed for many events, suggesting that it is a common runoff process in the Studibach catchment, even during a relatively dry summer. For half of the events, the ASI+P was larger than the runoff generation threshold ( mm). A previous study by Sauter (2017), in which 50 cm long overland flow collectors (buried pipes) were used during the summer and autumn of 2016, also suggested that OF occurred frequently. To infer the frequency of occurrence for OF and TIF for periods beyond the summer–autumn monitoring period, we looked at historical precipitation records. The estimated threshold for precipitation to generate OF and TIF was ∼18 mm (range: 7–22 mm; Fig. S5), which coincides with the threshold between 9–21 mm of Schneider et al. (2014) for a similar catchment in the Swiss pre-Alps. Using this threshold and the hourly precipitation data from the last 38 years for the snow-free season (May to October), we infer that considerable amounts of OF and TIF occur for, on average, 28 events per year. When the Imean was mm h−1, more than half of the runoff plot generally started to produce OF and TIF (Fig. S6). If we use this threshold to estimate the occurrence of near-surface flow together with the hourly precipitation data, near-surface runoff occurred for, on average, 23 events per year.
There are few studies to compare these frequencies of OF and TIF with. Still, measurements with overland flow collectors suggested that OF occurred for 10 %–90 % of the events (depending on the location) in a forested catchment in Panama (Zimmermann et al., 2014) and for 44 % (range: 0 %–71 %) of the events in agricultural fields in Tanzania (Vigiak et al., 2006), while measurements at runoff plots suggested that OF occurred for 55 % of the events for fallow land in Madagascar (Zwartendijk et al., 2020). Similarly, biomat flow was observed for 50 % of the events in moso-bamboo forested sites in Japan (Ide et al., 2010). Thus, although these sites are all very different, the occurrence of near-surface runoff for almost half of the events does not seem to be exceptional.
5.2 Occurrence of near-surface flow varies spatially
The frequency of near-surface runoff varied spatially and ranged between 14 % and 78 % for OF and 19 % and 86 % for TIF. This variation was mainly linked to vegetation cover (rs=0.35 for OF and 0.64 for TIF) and the TWI (rs=0.51 for OF and 0.51 for TIF). In the Studibach catchment, these two variables are related to each other (rs=0.60 for the 14 plots; Table S3) as the steeper locations near the ridges with a low TWI are mainly covered by forests, and the wetter flatter areas with a high TWI are mostly wetlands. The fact that the frequency of near-surface flow is related to the TWI is not surprising as Rinderer et al. (2014) already demonstrated that less rain is needed for the groundwater levels to start rising for sites with a higher TWI. Indeed, for the wetlands for which the TWI was the highest, the occurrence of OF and TIF was highest (>70 %), and the lag times for OF and TIF were shortest (median tr: 17 min; tp: 15 min). Thus, vegetation and the TWI are good indicators of the spatial variation in the frequency of near-surface flow.
However, there were also exceptions to the relation between the frequency of OF and TIF and vegetation or TWI. For the forested plots C2.1 and C2.5, OF was measured much more frequently than TIF and more frequently than expected based on their TWI. These plots are covered by a thick moss layer (see photos in Figs. S3 and S4). It appears that the boundary between the biomat of the moss and the mineral soil may have a low infiltration capacity or may be hydrophobic (see Gall et al., 2024; Gerke et al., 2015), especially when the ASI was low, and promotes the occurrence of biomat flow (which was measured as OF). According to Pan et al. (2006), moss cover should reduce surface runoff by absorption and retention. As we frequently observed OF for these plots, this suggests that, on steep slopes, a thick moss layer could induce biomat flow. This inference is supported by the observation that the ROF for these plots remains similar with increasing wetness conditions (ASI; Fig. 4). In the lower Studibach (e.g. plots C3.1 and C3.5), the forested plots were covered by a scattered moss layer and grasses, as well as some forest litter (needles and leaves), which likely reduced surface runoff and increased infiltration. The rooting system can create fast infiltration and lateral subsurface flow, prompting TIF instead of OF (see also Sect. 5.3).
For two grassland locations, C5.2 and C5.3, the occurrence of TIF was high, but the occurrence of OF was relatively low, even though the sites have a relatively steep slope (mean=34°). These two locations were subject to cattle trampling, suggesting that they may quickly become saturated (Monger et al., 2022; Wheeler et al., 2002). Although we expected this to lead to more OF, they did not generate as much OF as expected (mean ROF over all events of 0.04 and 0.06, respectively) compared to TIF (mean RTIF over the events of 0.16 for both plots), suggesting that most of the flow occurred through the topsoil and that OF was generated locally. Thus, instead, it appears that the presence of holes from trampling could lead to ponding of water on the surface (Pietola et al., 2005), which promotes infiltration and increases the roughness for OF.
5.3 Threshold runoff response
The antecedent soil moisture index plus precipitation (ASI+P) thresholds (calculated for the top 5 cm of soil) ranged from 29 to 55 mm for OF and from 17 to 70 mm for TIF. They were generally lowest for the wetter locations (Fig. 4). The main factor influencing the runoff threshold was the TWI, a good indicator of the wetness conditions (Beven and Kirkby, 1979) and groundwater levels (Rinderer, et al., 2014). Indeed, the Spearman rank analysis indicates that ROF and POF were negatively correlated with the ASI (and ASI+P) for plots with a low TWI and positively correlated with the ASI for plots with a high TWI (Figs. S7 and S8).
For the dry locations (low TWI), the fraction of OF decreased from dry to wet antecedent conditions. It means that, during dry conditions, (some of) the water tends to flow more at the surface or through the biomat and does not infiltrate into the topsoil. We hypothesise that this might be due to the hydrophobicity of the (forested) soil during dry conditions, which would promote OF and biomat flow. When the soil is wetter (less hydrophobic), more water infiltrates, leading to more TIF and a lower runoff ratio for OF (ROF) and fraction of OF (POF).
For wet locations (high TWI), we expect no or less hydrophobicity. During dry conditions, water infiltrates to produce TIF, while, in wet conditions, the soil becomes saturated faster, leading to a higher fraction of saturated overland flow so that ROF and POF increase with wetter conditions. Thus, for the wetter sites, they are positively correlated with the ASI and ASI+P.
For TIF, the threshold increased with the slope gradient (rs=0.80; p<0.01), which is reflected in the inverse relation between RTIF and slope as well (Table 3). For OF, the relation with slope was less clear as, for some of the steeper plots (e.g. C2.1 and C2.5), we could not define a clear threshold (Fig. 4). Generally, OF rates increase with slope (Essig et al., 2009; Haggard and Moore, 2005; Morbidelli et al., 2013) but do not have to do so in a linear continuous way (Jourgholami et al., 2021; Komatsu et al., 2018). Interestingly, for the plots with a slope higher than 22°, TIF thresholds became higher than OF thresholds, suggesting that more rain is required to generate TIF than OF, which follows the findings saying that infiltration time reduces on steep slopes, inducing more OF (Battany and Grismer, 2000; Mumford and Neal, 1938). Nevertheless, the runoff ratios for the steeper slopes were smaller (mean ROF: 0.03) than for the other plots (mean ROF: 0.34; see Figs. 3 and 4), probably due to the lack of return flow from outside the plots (see Sect. 5.4).
5.4 Inference of runoff mechanisms
We did not observe a relation between near-surface runoff and the maximum precipitation intensity (Table 2 and Figs. S6 and S7). Instead, OF could be explained by the ASI+P threshold. This suggests that OF is predominantly saturated overland flow and not Hortonian (i.e. infiltration excess) overland flow. The runoff ratios >1 for OF suggest that, for some of the plots, OF consists at least partly of exfiltrating soil and groundwater (i.e. return flow from outside the plot). Return flow is likely to be more important for the flatter sites with wetland and grass vegetation, which explains the inverse relation between slope and OF ratios. Only for the forested sites with a thick moss cover do we frequently observe OF but no TIF. Biomat flow is likely to be an important runoff mechanism for these sites, e.g. flow through the moss layers in C2.1 and C2.5 (see Sect. 5.1), but also at other plots. Biomat flow can explain the earlier onset of OF compared to TIF for half of all of the events and plots (Fig. 7). However, both OF and TIF responded relatively quickly to rainfall (Fig. S15) and to changes in the rainfall intensity (Fig. 6), suggesting the presence of preferential flow and high celerity of the system.
The ASI+P threshold was very similar for OF and TIF. Together with the fact that, at most plots, OF and TIF both occurred and that both flow pathways responded quickly to changes in precipitation intensity, this suggests that these processes are strongly coupled. The fact that the runoff ratios for OF did not change considerably after we removed the border at the top of the plots (Fig. 4) suggests that OF flow pathways on the surface are rather short. Thus, there is likely to be considerable interaction between OF and TIF. It is most likely that OF water infiltrates into the surface after a short distance, while, at other location, TIF exfiltrates. However, this requires further research using tracers.
The runoff ratios for OF and TIF (median and mean over all plots and events of 0.8 % (0 %–5 %) and 17 % (0 %–147 %), respectively, for OF and 2 % (0 %–10 %) and 24 % (0 %–87 %), respectively, for TIF) are in the range of those for rainfall simulation studies in the Swiss pre-Alps (1 %–22 % for ROF; Schneider et al., 2014) and the Austrian Alps (0 %–85 % for ROF; Meißl et al., 2023). Some of the large responses during medium events (e.g. 0 % to 77 % (median: 4 %; mean: 13 %) for OF and 0 %–79 % (median: 7 %; mean: 16 %) for the 20 mm event on 30 August 2022; Fig. 6) suggest that these processes can be important for storm flow generation. However, further studies are needed to determine the connectivity of these near-surface flow pathways to the stream network and their importance at the catchment scale.
Overland flow (OF) and topsoil interflow (TIF) were measured for 14 small plots across a small pre-Alpine catchment during the summer and autumn of 2022. OF and TIF occurred frequently at almost all plots. For most plots, runoff occurred after antecedent soil moisture (ASI over the top 5 cm of the soil) and precipitation (P) exceeded 39 mm or after a precipitation threshold of ∼18 mm was reached. These conditions occur frequently and suggest that OF and TIF also occur frequently. However, there was considerable spatial variation in the occurrence and amount of OF and TIF across the catchment. The frequency of OF and TIF occurrence and the runoff ratios were correlated to the topographic wetness index (TWI) and vegetation cover. Wetter sites (grasslands and wetlands) produced more flow and did so more often. For the plots in the forest and natural clearings in the forest, the occurrence of OF and TIF was more variable, but, overall, they produced less runoff and did so less often. However, there were some exceptions. For some forested plots (e.g. C2.1 and C2.5), OF occurred frequently, and OF rates were higher than for TIF. For these plots, biomat flow at or through the moss layer was likely important. The high runoff ratios for OF for some sites (>1) highlight the importance of exfiltrating soil and groundwater (i.e. return flow) for OF generation. The runoff ratios for OF were not affected by the opening of the plot borders, suggesting that OF pathways are generally short. The fast response of both flow pathways and the evidence of return flow suggest the importance of preferential flow and considerable interaction between OF and TIF.
This is one of the few studies worldwide that collected field data of OF and TIF for a densely vegetated catchment in a humid temperate climate to study their spatiotemporal variability. These findings may contribute to the development and testing of models to estimate the relative importance of OF and TIF, as well as catchment-scale hydrological models for the region to ensure that they simulate the quick response to precipitation for the right reasons. Although these plot-scale studies highlight the frequent occurrence of near-surface runoff processes across the entire catchment, their importance for storm flow generation at the catchment scale depends on their connectivity to the stream network and thus requires further research.
Data can be provided by the corresponding authors upon request or can be accessed from the EnviDat.ch repository (https://doi.org/10.16904/envidat.658, Gauthier, 2025).
The supplement related to this article is available online at https://doi.org/10.5194/hess-29-3889-2025-supplement.
VAG and IvM conceptualised the study. VAG, AL and IvM organised the data collection. VAG and AL performed the data collection. VAG analysed the data. VAG wrote the paper draft. VAG, AL and IvM reviewed and edited the paper. IvM supervised the project.
The contact author has declared that none of the authors has any competing interests.
Publisher's note: Copernicus Publications remains neutral with regard to jurisdictional claims made in the text, published maps, institutional affiliations, or any other geographical representation in this paper. While Copernicus Publications makes every effort to include appropriate place names, the final responsibility lies with the authors.
We thank our colleagues from the Swiss Federal Institute for Forest, Snow and Landscape Research (WSL) and, especially, the Mountain Hydrology Group for collaborating in the Alptal and sharing the data from the Erlenhöhe meteorological station. We thank our colleagues from the Hydrology and Climate group (H2K) at the Department of Geography at the University of Zurich and Isabelle Gauthier and Marion Messey for their help in the field. We thank Manfred Stähli and Jan Seibert for their advice and comments on an earlier version of this paper. We thank the Oberallmeindkorporation Schwyz (OAK), the Department of Environment of the Canton of Schwyz and the municipality of Alptal for their cooperation. This research was conducted as part of the “TopFlow: (in)visible water flows near the surface”.
This research has been supported by the Swiss National Science Foundation (grant no. 197194).
This paper was edited by Patricia Saco and reviewed by two anonymous referees.
Abegg, B. and Mayer, M.: The exceptional year of 2022: “deathblow” to glacier summer skiing in the Alps?, Frontiers in Human Dynamics, 5, 1154245, https://doi.org/10.3389/fhumd.2023.1154245, 2023.
Ambroise, B.: Variable water-saturated areas and streamflow generation in the small Ringelbach catchment (Vosges Mountains, France): the master recession curve as an equilibrium curve for interactions between atmosphere, surface and ground waters, Hydrol. Process., 30, 3560–3577, https://doi.org/10.1002/hyp.10947, 2016.
Anderson, M. G. and Burt, T. P.: The role of topography in controlling throughflow generation, Earth Surf. Processes, 3, 331–344, 1978a.
Anderson, M. G. and Burt, T. P.: Time-synchronised stage recorders for the monitoring of incremental discharge inputs in small streams, J. Hydrol., 37, 101–109, 1978b.
Appels, W. M., Bogaart, P. W., and van der Zee, S. E. A. T. M.: Influence of spatial variations of microtopography and infiltration on surface runoff and field scale hydrological connectivity, Adv. Water Resour., 34, 303–313, https://doi.org/10.1016/j.advwatres.2010.12.003, 2011.
Bachmair, S. and Weiler, M.: Hillslope characteristics as controls of subsurface flow variability, Hydrol. Earth Syst. Sci., 16, 3699–3715, https://doi.org/10.5194/hess-16-3699-2012, 2012.
Badoux, A., Witzig, J., Germann, P. F., Kienholz, H., Lüscher, P., Weingartner, R., and Hegg, C.: Investigations on the runoff generation at the profile and plot scales, Swiss Emmental, Hydrol. Process., 20, 377–394, https://doi.org/10.1002/hyp.6056, 2006.
Barthold, F. K. and Woods, R. A.: Stormflow generation: A meta-analysis of field evidence from small, forested catchments, Water Resour. Res., 51, 3730–3753, https://doi.org/10.1002/2014WR016221, 2015.
Battany, M. C. and Grismer, M. E.: Rainfall runoff and erosion in Napa Valley vineyards: Effects of slope, cover and surface roughness, Hydrol. Process., 14, 1289–1304, https://doi.org/10.1002/(SICI)1099-1085(200005)14:7<1289::AID-HYP43>3.0.CO;2-R, 2000.
Betson, R. P. and Marius, J. B.: Source Areas of Storm Runoff, Water Resour. Res., 5, 574–582, 1969.
Beven, K. J. and Kirkby, M. J.: A physically based, variable contributing area model of basin hydrology, Hydrol. Sci. B., 24, 43–69, https://doi.org/10.1080/02626667909491834, 1979.
Blöschl, G., Bierkens, M. F. P., Chambel, A., et al.: Twenty-three unsolved problems in hydrology (UPH) – a community perspective, Hydrolog. Sci. J., 64, 1141–1158, https://doi.org/10.1080/02626667.2019.1620507, 2019.
Bonell, M. and Gilmour, D. A.: The development of overland flow in tropical rain-forest catchment, J. Hydrol., 39, 365–382, 1978.
Bronstert, A. and Bárdossy, A.: The role of spatial variability of soil moisture for modelling surface runoff generation at the small catchment scale, Hydrol. Earth Syst. Sci., 3, 505–516, https://doi.org/10.5194/hess-3-505-1999, 1999.
Bujak-Ozga, I., von Freyberg, J., Zimmer, M., Rinaldo, A., Benettin, P., and van Meerveld, I.: Changes in the flowing drainage network and stream chemistry during rainfall events for two pre-Alpine catchments, Hydrol. Earth Syst. Sci., 29, 2339–2359, https://doi.org/10.5194/hess-29-2339-2025, 2025.
Buttle, J. M.: Isotope hydrograph separations and rapid delivery of pre-event water from drainage basins, Prog. Phys. Geog., 18, 16–41, 1994.
Buttle, J. M. and McDonald, D. J.: Coupled vertical and lateral preferential flow on a forested slope, Water Resour. Res., 38, 18-1–18-16, https://doi.org/10.1029/2001wr000773, 2002.
Buttle, J. M. and Turcotte, D. S.: Runoff Processes on a Forested Slope on the Canadian Shield, Nordic Hydrol., 30, 1–20, https://doi.org/10.2166/nh.1999.0001, 1999.
Descroix, L., Viramontes, D., Vauclin, M., Gonzalez Barrios, J. L., and Esteves, M.: Influence of soil surface features and vegetation on runoff and erosion in the Western Sierra Madre (Durango, Northwest Mexico), Catena, 43, 115–135, 2001.
Detty, J. M. and McGuire, K. J.: Threshold changes in storm runoff generation at a till-mantled headwater catchment, Water Resour. Res., 46, W07525, https://doi.org/10.1029/2009WR008102, 2010.
Dunne, T. and Black, R. D.: Partial Area Contributions to Storm Runoff in a Small England Watershed, Water Resour. Res., 5, 1296–1311, 1970.
Dunne, T. and Dietrich, W. E.: Experimental study of Horton overland flow on tropical hillslopes 1. Soil conditions, infiltration and frequency of runoff by, Z. Geomorphol., 35, 40–59, 1980.
Eisenring, S.: Spatial Variation in Soil Hydraulic Properties in the Studibach Catchment and its Effects on Simulated Infiltration, University of Zurich, Zurich, 2023.
Essig, E. T., Corradini, C., Morbidelli, R., and Govindaraju, R. S.: Infiltration and deep flow over sloping surfaces: Comparison of numerical and experimental results, J. Hydrol., 374, 30–42, https://doi.org/10.1016/j.jhydrol.2009.05.017, 2009.
Feyen, H., Papritz, A., Gysi, M., Flühler, H., Schleppi, P., and Leuenberger, J.: Runoff processes in catchments with a small scale topography, Phys. Chem. Earth, 21, 177–181, https://doi.org/10.1016/S0079-1946(97)85581-4, 1996.
Fischer, B. M. C., Stähli, M., and Seibert, J.: Pre-event water contributions to runoff events of different magnitude in pre-alpine headwaters, Hydrol. Res., 48, 28–47, https://doi.org/10.2166/nh.2016.176, 2017a.
Fischer, B. M. C., van Meerveld, H. J., and Seibert, J.: Spatial variability in the isotopic composition of rainfall in a small headwater catchment and its effect on hydrograph separation, J. Hydrol., 547, 755–769, https://doi.org/10.1016/j.jhydrol.2017.01.045, 2017b.
Gall, C., Nebel, M., Scholten, T., Thielen, S. M., and Seitz, S.: Water's path from moss to soil Vol. 2: how soil-moss combinations affect soil water fluxes and soil loss in a temperate forest, Biologia, 80, 1101–1113, https://doi.org/10.1007/s11756-024-01666-w, 2024.
Gauthier, V.: Overland and topsoil interflow time series from the Studibach – summer 2022, EnviDat, https://doi.org/10.16904/envidat.658, 2025.
Gerke, K. M., Sidle, R. C., and Mallants, D.: Preferential flow mechanisms identified from staining experiments in forested hillslopes, Hydrol. Process., 29, 4562–4578, https://doi.org/10.1002/hyp.10468, 2015.
Gomi, T., Sidle, R. C., Miyata, S., Kosugi, K., and Onda, Y.: Dynamic runoff connectivity of overland flow on steep forested hillslopes: Scale effects and runoff transfer, Water Resour. Res., 44, W08411, https://doi.org/10.1029/2007WR005894, 2008.
Haga, H., Matsumoto, Y., Matsutani, J., Fujita, M., Nishida, K., and Sakamoto, Y.: Flow paths, rainfall properties, and antecedent soil moisture controlling lags to peak discharge in a granitic unchanneled catchment, Water Resour. Res., 41, 1–14, https://doi.org/10.1029/2005WR004236, 2005.
Hagedorn, F., Schleppi, P., Peter, W., and Hannes, F.: Export of dissolved organic carbon and nitrogen from Gleysol dominated catchments-the significance of water flow paths, Biogeochemistry, 50, 137–161, 2000.
Hagedorn, F., Schleppi, P., Bucher, J., and Flühler, H.: Retention and leaching of elevated N deposition in a forest ecosystem with gleysols, Water Air Soil Poll., 129, 119–142, 2001.
Haggard, B. E., Moore Jr., P. A., and Brye, K. R.: Effect of Slope on Runoff From a Small Variable Slope Box-Plot, J. Environ. Hydrol., 13, 25 pp., 2005.
Henninger, D. L., Petersen, G. W., and Engman, E. T.: Surface soil moisture within a watershed-variations, factors influencing, and relationship to surface runoff, Soil Sci. Soc. Am. J., 40, 773–776, 1976.
Ide, J., Shinohara, Y., Higashi, N., Komatsu, H., Kuramoto, K., and Otsuki, K.: A preliminary investigation of surface runoff and soil properties in a moso-bamboo (Phyllostachys pubescens) forest in western Japan, Hydrological Research Letters, 4, 80–84, https://doi.org/10.3178/hrl.4.80, 2010.
Jourgholami, M., Karami, S., Tavankar, F., Lo Monaco, A., and Picchio, R.: Effects of slope gradient on runoff and sediment yield on machine-induced compacted soil in temperate forests, Forests, 12, 1–19, https://doi.org/10.3390/f12010049, 2021.
Kiewiet, L., van Meerveld, I., Stähli, M., and Seibert, J.: Do stream water solute concentrations reflect when connectivity occurs in a small, pre-Alpine headwater catchment?, Hydrol. Earth Syst. Sci., 24, 3381–3398, https://doi.org/10.5194/hess-24-3381-2020, 2020.
Kim, J. K., Onda, Y., Kim, M. S., and Yang, D. Y.: Plot-scale study of surface runoff on well-covered forest floors under different canopy species, Quatern. Int., 344, 75–85, https://doi.org/10.1016/j.quaint.2014.07.036, 2014.
Komatsu, Y., Kato, H., Zhu, B., Wang, T., Yang, F., Rakwal, R., and Onda, Y.: Effects of slope gradient on runoff from bare-fallow purple soil in China under natural rainfall conditions, J. Mt. Sci., 15, 738–751, https://doi.org/10.1007/s11629-017-4714-3, 2018.
Lapides, D. A., Hahm, W. J., Rempe, D. M., Dietrich, W. E., and Dralle, D. N.: Controls on Stream Water Age in a Saturation Overland Flow-Dominated Catchment, Water Resour. Res., 58, e2021WR031665, https://doi.org/10.1029/2021WR031665, 2022.
Leatherman, S. P.: Field Measurement of Microtopography, J. Coastal Res., 3, 233–235, 1987.
Maier, F. and van Meerveld, I.: Long-Term Changes in Runoff Generation Mechanisms for Two Proglacial Areas in the Swiss Alps I: Overland Flow, Water Resour. Res., 57, e2021WR030221, https://doi.org/10.1029/2021WR030221, 2021.
Meißl, G., Klebinder, K., Zieher, T., Lechner, V., Kohl, B., and Markart, G.: Influence of antecedent soil moisture content and land use on the surface runoff response to heavy rainfall simulation experiments investigated in Alpine catchments, Heliyon, 9, e18597, https://doi.org/10.1016/j.heliyon.2023.e18597, 2023.
Minea, G., Ioana-Toroimac, G., and Moroşanu, G.: The dominant runoff processes on grassland versus bare soil hillslopes in a temperate environment – An experimental study, J. Hydrol. Hydromech., 67, 297–304, https://doi.org/10.2478/johh-2019-0018, 2019.
Mishra, P. K., Rai, A., Abdelrahman, K., Rai, S. C., and Tiwari, A.: Land Degradation, Overland Flow, Soil Erosion, and Nutrient Loss in the Eastern Himalayas, India, Land-Basel, 11, 179, https://doi.org/10.3390/land11020179, 2022.
Miyata, S., Kosugi, K., Gomi, T., and Mizuyama, T.: Effects of forest floor coverage on overland flow and soil erosion on hillslopes in Japanese cypress plantation forests, Water Resour. Res., 45, W06402, https://doi.org/10.1029/2008WR007270, 2009.
Mohn, J., Èrmann, A. S., Hagedorn, F., Schleppi, P., and Bachofen, R.: Increased rates of denitrification in nitrogen-treated forest soils, Forest Ecol. Manag., 137, 113–119, 2000.
Monger, F., Bond, S., Spracklen, D. V., and Kirkby, M. J.: Overland flow velocity and soil properties in established semi-natural woodland and wood pasture in an upland catchment, Hydrol. Process., 36, e14567, https://doi.org/10.1002/hyp.14567, 2022.
Morbidelli, R., Corradini, C., Saltalippi, C., Flammini, A., and Govindaraju, R. S.: The role of slope on the overland flow production, WIT Trans. Ecol. Envir., 172, 63–71, https://doi.org/10.2495/RBM130061, 2013.
Morlang, M.: Calibration of Upwelling Bernoulli Tubes, University of Zurich, 2022.
Mounirou, L. A., Yacouba, H., Karambiri, H., Paturel, J. E., and Mahé, G.: Measuring runoff by plots at different scales: Understanding and analysing the sources of variation, C. R. Geosci., 344, 441–448, https://doi.org/10.1016/j.crte.2012.08.004, 2012.
Mumford, F. B. and Neal, J. H.: The Effect of the Degree of Slope and Rainfall Characteristics on Runoff and Soil Erosion, Columbia, https://core.ac.uk/reader/62791020 (last access: 15 August 2025), 1938.
Naef, F., Scherrer, S., and Weiler, M.: A process based assessment of the potential to reduce flood runoff by land use change, J. Hydrol., 267, 74–79, 2002.
Nanda, A. and Safeeq, M.: Threshold controlling runoff generation mechanisms in Mediterranean headwater catchments, J. Hydrol., 620, e14567, https://doi.org/10.1016/j.jhydrol.2023.129532, 2023.
Office Fédéral de Météorologie et Climatologie MétéoSuisse: Description des différents degrés de danger, https://www.meteosuisse.admin.ch/meteo/dangers/explications-aux-degres-de-danger/pluie.html (last access: 15 August 2025), 2021.
Palmer, R. C. and Smith, R. P.: Soil structural degradation in SW England and its impact on surface-water runoff generation, Soil Use Manage., 29, 567–575, https://doi.org/10.1111/sum.12068, 2013.
Pan, C., Shangguan, Z., and Lei, T.: Influences of grass and moss on runoff and sediment yield on sloped loess surfaces under simulated rainfall, Hydrol. Process., 20, 3815–3824, https://doi.org/10.1002/hyp.6158, 2006.
Penna, D., Tromp-van Meerveld, H. J., Gobbi, A., Borga, M., and Dalla Fontana, G.: The influence of soil moisture on threshold runoff generation processes in an alpine headwater catchment, Hydrol. Earth Syst. Sci., 15, 689–702, https://doi.org/10.5194/hess-15-689-2011, 2011.
Pietola, L., Horn, R., and Yli-Halla, M.: Effects of trampling by cattle on the hydraulic and mechanical properties of soil, Soil Till. Res., 82, 99–108, https://doi.org/10.1016/j.still.2004.08.004, 2005.
Pilgrim, C.: piecewise-regression (aka segmented regression) in Python, J. Open Source Softw., 6, 3859, https://doi.org/10.21105/joss.03859, 2021.
Polyakov, V., Li, L., and Nearing, M. A.: Correction factor for measuring mean overland flow velocities on stony surfaces under rainfall using dye tracer, Geoderma, 390, 114975, https://doi.org/10.1016/j.geoderma.2021.114975, 2021.
Puigdefabregas, J., Del Barrio, G., Boer, M. M., Gutierrez, L., and Sole, A.: Differential responses of hillslope and channel elements to rainfall events in a semi-arid area, Geomorphology, 23, 337–351, 1998.
Rinderer, M., van Meerveld, H. J., and Seibert, J.: Topographic controls on shallow groundwater levels in a steep, prealpine catchment: When are the TWI assumptions valid?, Water Resour. Res., 50, 6067–6080, https://doi.org/10.1002/2013WR015009, 2014.
Rinderer, M., van Meerveld, I., Stähli, M., and Seibert, J.: Is groundwater response timing in a pre-alpine catchment controlled more by topography or by rainfall?, Hydrol. Process., 30, 1036–1051, https://doi.org/10.1002/hyp.10634, 2016.
Saffarpour, S., Western, A. W., Adams, R., and McDonnell, J. J.: Multiple runoff processes and multiple thresholds control agricultural runoff generation, Hydrol. Earth Syst. Sci., 20, 4525–4545, https://doi.org/10.5194/hess-20-4525-2016, 2016.
Sauter, T.: Occurrence and Chemical Composition of Overland Flow in a Pre-alpine Catchment, Alptal (CH), Department of Geography, University of Zurich, 79 pp., 2017.
Scherrer, S., Naef, F., Faeh, A. O., and Cordery, I.: Formation of runoff at the hillslope scale during intense precipitation, Hydrol. Earth Syst. Sci., 11, 907–922, https://doi.org/10.5194/hess-11-907-2007, 2007.
Schleppi, P., Muller, N., Feyen, H., Papritz, A., Bucher, J. B., and Flühler, H.: Nitrogen budgets of two small experimental forested catchments at Alptal, Switzerland, Forest Ecol. Manag., 101, 177–185, 1998.
Schneider, P., Pool, S., Strouhal, L., and Seibert, J.: True colors – experimental identification of hydrological processes at a hillslope prone to slide, Hydrol. Earth Syst. Sci., 18, 875–892, https://doi.org/10.5194/hess-18-875-2014, 2014.
Shannon, J., Liu, F., Van Grinsven, M., Kolka, R., and Pypker, T.: Magnitude, consequences and correction of temperature-derived errors for absolute pressure transducers under common monitoring scenarios, Hydrol. Process., 36, https://doi.org/10.1002/hyp.14457, 2022.
Sidle, R. C., Hirano, T., Gomi, T., and Terajima, T.: Hortonian overland flow from Japanese forest plantations – An aberration, the real thing, or something in between?, Hydrol. Process., 21, 3237–3247, https://doi.org/10.1002/hyp.6876, 2007.
Stähli, M. and Gustafsson, D.: Long-term investigations of the snow cover in a subalpine semi-forested catchment, Hydrol. Process., 20, 411–428, https://doi.org/10.1002/hyp.6058, 2006.
Stewart, R. D., Liu, Z., Rupp, D. E., Higgins, C. W., and Selker, J. S.: A new instrument to measure plot-scale runoff, Geosci. Instrum. Method. Data Syst., 4, 57–64, https://doi.org/10.5194/gi-4-57-2015, 2015.
Swiss Federal Office of Topography: aerial image no. 20000090712703, resolution: 1m, 2022-06-14, SwissImage, 2023.
Tanaka, T.: The role of subsurface water exfiltration in soil erosion processes, IAHS Publ., https://doi.org/10.1080/02626668209491103, 1982.
Tanaka, T., Yasuhara, M., Sakai, H., and Marui, A.: The Hachioji experimental basin study- Storm runoff processes and the mechanism of its generation, J. Hydrol., 102, 13–164, 1988.
Tarboton, D. G.: Rainfall Runoff Processes. Civil and Environmental Engineering Faculty Publications, Utah State University, 2570, https://digitalcommons.usu.edu/cee_facpub/2570 (last accesds: 15 August 2025), 2003.
Tromp-van Meerveld, H. J. and McDonnell, J. J.: Threshold relations in subsurface stormflow: 1. A 147-storm analysis of the Panola hillslope, Water Resour. Res., 42, W02410, https://doi.org/10.1029/2004WR003778, 2006.
Uchida, T. and Asano, Y.: Spatial variability in the flowpath of hillslope runoff and streamflow in a meso-scale catchment, Hydrol. Process., 24, 2277–2286, https://doi.org/10.1002/hyp.7767, 2010.
van Meerveld, H. J. I., Kirchner, J. W., Vis, M. J. P., Assendelft, R. S., and Seibert, J.: Expansion and contraction of the flowing stream network alter hillslope flowpath lengths and the shape of the travel time distribution, Hydrol. Earth Syst. Sci., 23, 4825–4834, https://doi.org/10.5194/hess-23-4825-2019, 2019.
Vigiak, O., van Dijck, S. J. E., van Loon, E. E., and Stroosnijder, L.: Matching hydrologic response to measured effective hydraulic conductivity, Hydrol. Process., 20, 487–504, https://doi.org/10.1002/hyp.5916, 2006.
von Freyberg, J., Studer, B., Rinderer, M., and Kirchner, J. W.: Studying catchment storm response using event- and pre-event-water volumes as fractions of precipitation rather than discharge, Hydrol. Earth Syst. Sci., 22, 5847–5865, https://doi.org/10.5194/hess-22-5847-2018, 2018.
Vreugdenhil, M., Széles, B., Salinas, J. L., Strauß, P., Oismueller, M., Hogan, P., Wagner, W., Parajka, J., and Blöschl, G.: Non-linearity in event runoff generation in a small agricultural catchment, Hydrol. Process., 36, e14667, https://doi.org/10.1002/hyp.14667, 2022.
Wadman, M.: Spatial variability of infiltration in a pre-alpine catchment, Wageningen University, Wageningen, 2023.
Weiler, M. and Naef, F.: An experimental tracer study of the role of macropores in infiltration in grassland soils, Hydrol. Process., 17, 477–493, https://doi.org/10.1002/hyp.1136, 2003.
Weiler, M., Naef, F., and Leibundgut, C.: Study of runoff generation on hillslopes using tracer experiments and a physically based numerical hillslope model, IAHS-AISH P., 248, 353–360, 1998.
Weiler, M., Scherrer, S., Naef, F., and Burlando, P.: Hydrograph separation of runoff components based on measuring hydraulic state variables, tracer experiments, and weighting methods, IAHS-AISH P., 258, 249–255, 1999.
Weiler, M., McDonnell, J. J., Tromp-van Meerveld, I., and Uchida, T.: Subsurface Stormflow, in: Encyclopedia of Hydrological Sciences, John Wiley and Sons, Ltd., https://doi.org/10.1002/0470848944.hsa119, 2005.
Wheeler, M. A., Trlica, M. J., Frasier, G. W., and Reeder, J. D.: Seasonal Grazing Affects Soil Physical Properties of a Montane Riparian Community, J. Range Manage., 55, 49–56, 2002.
Zimmermann, B., Zimmermann, A., Turner, B. L., Francke, T., and Elsenbeer, H.: Connectivity of overland flow by drainage network expansion in a rain forest catchment, Water Resour. Res., 50, 1457–1473, https://doi.org/10.1002/2012WR012660, 2014.
Zwartendijk, B. W., van Meerveld, H. J., Ghimire, C. P., Ravelona, M., Lahitiana, J., and Bruijnzeel, L. A.: Soil water- and overland flow dynamics in a tropical catchment subject to long-term slash-and-burn agriculture, J. Hydrol., 582, 124287, https://doi.org/10.1016/j.jhydrol.2019.124287, 2020.