the Creative Commons Attribution 4.0 License.
the Creative Commons Attribution 4.0 License.
Effects of different climatic conditions on soil water storage patterns
Annelie Ehrhardt
Jannis Groh
Horst H. Gerke
The soil water storage (SWS) defines the crop productivity of a soil and varies under different climatic conditions.
Pattern identification and quantification of these variations in SWS remain difficult due to the non-linear behaviour of SWS changes over time. Wavelet analysis (WA) provides a tool to efficiently visualize and quantify these patterns by transferring the time series from the time domain into the frequency domain.
We applied WA to an 8-year time series of SWS, precipitation (P), and actual evapotranspiration (ETa) in similar soils of lysimeters in a colder and drier location and in a warmer and wetter location within Germany. Correlations between SWS, P, and ETa at these sites might reveal the influence of altered climatic conditions but also of subsequent wet and dry years on SWS changes.
We found that wet and dry years exerted an influence over SWS changes by leading to faster or slower response times of SWS changes in relation to precipitation with respect to normal years. The observed disruption of annual patterns in the wavelet spectra of both sites was possibly caused by extreme events. Extreme precipitation events were visible in SWS and P wavelet spectra. Time shifts in correlations between ETa and SWS became smaller at the wetter and warmer site over time in comparison to at the cooler and drier site, where they stayed constant. This could be attributed to an earlier onset of the vegetation period over the years and, thus, to an earlier ETa peak every year. This reflects the impact of different climatic conditions on soil water budget parameters.
- Article
(10343 KB) - Full-text XML
- BibTeX
- EndNote
The soil water storage capacity (SWSC) is defined as the amount of water stored within the plant-root-accessible upper part of the vadose zone (e.g. Kutílek and Nielsen, 1994). Both the SWSC and the process of soil water storage (SWS) within the root zone are important for defining the crop productivity (e.g. Stocker et al., 2023). The SWS in the vadose zone, i.e. the region between surface and groundwater table, has furthermore been considered to be key for understanding ecohydrological interactions within the soil–water–atmosphere continuum (Vereecken et al., 2022).
The SWS is a dynamic component of the soil or ecosystem water balance equation and varies within the usually assumed constant SWSC. The SWS has been determined in the field by vertically integrating the soil water content obtained by point measurements using either soil moisture sensors or soil samples (gravimetric method) (e.g. Kutílek and Nielsen, 1994). Observation methods for quantification of the soil water balance for larger soil volumes include lysimeters, hydro-gravimeters, or cosmic-ray neutron sensor networks (Heistermann et al., 2022). The SWS increases due to infiltration by rainfall, snowfall, irrigation, non-rainfall events (e.g. Groh et al., 2018), or upward-directed water movement from deeper soil layers or groundwater and lateral subsurface flow at hillslopes (e.g. Rieckh et al., 2014). The SWS decreases due to actual evapotranspiration (ETa), lateral outflow, or vertical drainage. Annual changes in SWS have been used to quantify the impacts of climate variability on plant growth and crop production (He and Wang, 2019) or to analyse the susceptibility of soils to floods and droughts (Shah and Mishra, 2021). The analysis of SWS changes was used to explain the effects soil moisture variability on nutrient (Li et al., 2010; Shen et al., 2022) or carbon cycling (Lal, 2019) and on ETa in different land use systems (Yang et al., 2016; Rahmati et al., 2020). The SWS depends on soil texture (e.g. Tafasca et al., 2020), soil structure (e.g. Rabot et al., 2018), organic carbon content (e.g. Hu et al., 2017), and vegetation properties (Trautmann et al., 2022). Recent studies have shown that reoccurring drought years since 2015 have left severe deficits in the total water storage of catchments (Laaha et al., 2017) and continents (Boergens et al., 2020) that are unprecedented in relation to the past 2110 years (Büntgen et al., 2021). Groh et al. (2020a) found that droughts can have an impact on the long-term SWS. The observation showed that SWS declined after a drought in 2015 and remained depleted until the end of the observation period, which implies long-term effects of droughts (e.g. on the SWSC) and, more importantly, the carry-over of the drought from one growing season to the next one. However, the SWS dynamics and their feedback to climate systems have been considered to be difficult to observe and comprehend (Vereecken et al., 2022, Groh et al., 2020a; Herbrich and Gerke, 2017).
A common concept is that the SWS dynamics in the northern temperate climate zones have a dominant annual cycle (Stahl and McColl, 2022), with a decrease during the growing period (ETa > P) and an increase during the non-growing winter period (P > ETa). In the longer term, the SWS approaches a soil- and site-specific mean value, which is usually defined according to the situation in the late spring (Groh et al., 2020a) just before the beginning of the growing period. The soil moisture conditions at this time of the year can be assumed to be optimally rewetted and in hydrostatic equilibrium. Water balance calculations are mostly assuming that the SWS approaches approximately the same value at field capacity in late spring and that the SWSC remains constant.
Of course, the SWS patterns may differ within the annual cycles for agricultural crops and natural vegetation (Jia et al., 2013). Longer-term changes in SWS patterns and SWSC can be expected when the soil properties are changing, which has been reported from situations of soil degradation and amelioration, as well as of changes in land use and soil management (e.g. Palese et al., 2014; Yu et al., 2015). However, the effects of changing climatic conditions on temporal patterns in SWS time series have not been widely reported. Identification of such patterns might help to elucidate the impact of climate change on SWS as an important component of the ecosystem water balance. Robinson et al. (2016) demonstrated a drought-induced alteration of soil hydraulic properties and a decrease in SWS but only indirectly using soil moisture observations that are not representative of the effective root zone but rather of a small fraction of the soil. This lack of studies results from methodical difficulties in determining dynamic changes because of the complex effects that account for changes in SWS at shorter and longer timescales (Chen et al., 2023).
To analyse these dynamics and derive reoccurring patterns in time series of SWS, a variety of methods, including principal component analysis, empirical orthogonal functions, wavelet transform, unsupervised learning like self-organizing maps, and empirical mode decomposition, have been applied (Vereecken et al., 2016). However, these approaches do not allow us to localize these patterns in time and, in particular, do not allow us to determine annual or daily cycles within a signal or time series over the entire period or whether these patterns are interrupted in time, as could be done with a wavelet analysis (WA). WA provides such a tool by decomposing a time series into several components, each accounting for a certain frequency band by comparing the signal with a set of wavelet functions of known frequency, similarly to Fourier transform, which uses a set of sinusoidal functions. However, since the wavelet function has zero mean, it is localized in time (Farge, 1992). Thus, the dominant frequencies of a time series can be derived with WA for each moment in time. In contrast, Fourier analysis calculates only the dominant frequency across the entire time series (Torrence and Compo, 1998). In addition, it may be important to find correlations between two time series, which often consist of non-stationary datasets (Ritter et al., 2009). The wavelet coherency analysis (WCA) can reveal the similarity of two signals that might have been overlooked by traditional correlation analysis (Grinsted et al., 2004). For example, if two time series contain similar frequencies but are only shifted in time against each other, Pearson correlation indicates only little similarity between the signals in contrast to WCA (Bravo et al., 2020).
Wavelet coherence analysis has been applied to reveal different temporal correlations between matric potential and precipitation for grasslands and croplands (Yang et al., 2016). Liu et al. (2017) showed that a difference in the water uptake strategies between grasslands and woodlands was manifested in a decreasing correlation between soil moisture and precipitation. Graf et al. (2014) investigated the spatiotemporal relations in a forested catchment between water budget components and soil water content (SWC) using the WCA to identify the main source of uncertainty when closing the water balance at smaller timescales (daily, weekly). Using WCA, it was possible not only to derive correlations across different scales from non-linear SWC or ETa time series but also to determine the temporal shifts in the correlation patterns (e.g. Rahmati et al., 2020). To identify the differences in the temporal onset of soil water movement between a lysimeter and an arable field soil, indicating the possible occurrence of lateral subsurface flow, Ehrhardt et al. (2021) applied WCA to soil moisture time series. A faster SWC increase in the field soil in comparison to that of the lysimeter was attributed to water entering the field soil laterally from higher terrain positions. Ding et al. (2013) showed that pulses of irrigation water changed the time shift between ETa and SWC at a daily scale, thereby demonstrating that irrigation can control the temporal variability of ETa.
As an extension of WCA, multiple WCA (MWC) and partial WCA (PWC) have been developed (Hu and Si, 2016, 2021). MWC allows correlations with three or more variables, as demonstrated for the influence of meteorological factors on streamflow generation (Su et al., 2019) or soil physical parameters on soil water content (Hu et al., 2017). PWC can be applied when, in bivariate relationships, both variables are dependent on each other, as, for example, to determine precipitation amount and duration as controlling factors of groundwater flow in humid and arid areas (Gu et al., 2022).
When analysing the effect of climate variability on SWS, it is plausible to compare time series of similar soils under different climatic conditions (i.e. space-for-time substitution approach, e.g. Groh et al., 2020a). If deviations in soil type and crop rotation can be excluded, deviations in SWS patterns between the two places must be attributed to different climatic conditions. The hypothesis is that if there are no differences in SWS patterns between the two sites then climatic conditions do not affect SWS. However, as the soil develops differently under each local climate, the same soil can hardly be found under a different climate. The situation can only be created experimentally. Within the TERENO-SOILCan lysimeter-network (TERrestrial ENvironmental Observatories; Pütz et al., 2016), lysimeters extracted (monolithically) from different land use types (natural and managed grassland, arable land), and soil types were transferred according to a modified space-for-time approach to sites with differing climatic conditions. This setup allows us to evaluate the impact of altered climatic conditions on agricultural ecosystems (Pütz et al., 2016) and to quantify changes in the soil water cycle and crop production due to climate variability. In previous studies, the soil water balance components of the lysimeter at the original location have been compared with those of the transferred lysimeter to define the impact of different climatic and management conditions on nitrogen leaching (Fu et al., 2017), to evaluate precipitation measurement methods (Schnepper et al., 2023), and to improve the modelling of the hydrological processes and ecosystem productivity of the same soil but under different climatic conditions for arable-land and grassland ecosystems (Jarvis et al., 2022; Groh et al., 2022). Rahmati et al. (2020) demonstrated that, due to increasing dryness, the SWS is more strongly controlled by ETa in a grassland soil. They explained declining phase shifts between ETa and SWS at the annual scale over a 7-year period with increasing dryness and suggested that this might also be the case for cropland soil.
Still, long-term studies on trend analysis and pattern detection in SWS time series aiming to derive the effect of changing climate on SWS components in croplands are limited and restricted to larger scales like satellite observations (e.g. GRACE-REC, Humphrey and Gudmundsson, 2019). Agboma and Itensifu (2020) observed increasing periodicity in SWS changes with increasing soil depth that might be relevant for seasonal soil moisture regime forecasting. They concluded that such studies are still missing for cultivated croplands because most monitoring sites for SWS observation are in grasslands. Chen et al. (2023) identified different governing parameters on SWS stability in winter and summer, highlighting the need for these analyses on long-term data to derive the impacts of extreme climate change on hydrological variables.
To gain more insights into SWS patterns evolving for the same soil under different climatic conditions in croplands for an 8-year observation period (2014 until 2021), we employ WCA to compare SWS time series of a soil at its original location to SWS of this soil transferred to a wetter and warmer climate. We want to analyse whether SWS patterns can be assumed to be independent of the site-specific climatic conditions and thus be assumed to be entirely dependent on the soil conditions. We hypothesize that there is no variation in the SWS of the similarly managed arable soils at the two sites if SWS patterns are independent of the climatic conditions. Our objectives are (i) to detect temporal patterns in SWS changes (SWS) of the same soil under two different climatic conditions (drier and colder vs. wetter and warmer) with WA and (ii) to visualize how other soil water balance components (precipitation P, ETa, net drainage) are affected or affect the SWS under different climatic conditions. We expect a quantitative temporal offset between the daily, seasonal, and annual changes in the components of the soil water balance and the effects on SWS patterns, changing from those of a period with wet climatic conditions (2015–2017) to those in subsequent dry years (2018–2020) due to carry-over effects.
2.1 Site description
The study areas are located in Selhausen ( N, E) and Dedelow ( N, E) (Fig. 1). A total of nine high-precision weighing lysimeters (precision: 10 g, METER Group) were filled with intact eroded Luvisol soil monoliths in Dedelow. Three out of nine lysimeters were installed in Dedelow, three were transferred to Selhausen, and three were transferred to Bad Lauchstädt to expose the extracted soil to different climate regimes. For the purposes of this study, we will only address the lysimeter measurements at the Dedelow and Selhausen sites. The transfer from Dedelow to Selhausen corresponds to an increase in annual precipitation of 112 mm and an increase in average annual temperature of 1.6 °C throughout the study period (2014–2021) (Luecke et al., 2024). Thus, within these 8 years, the lysimeters from Dedelow were exposed to slightly wetter and warmer weather conditions caused by a more oceanic climate in Selhausen as compared to the more continental one in Dedelow. Also, considering the two sites with the different climatic conditions, the weather was characterized by extreme rainfall events (2017), as well as relatively wet (2017, 2021) and dry (2018) periods within the observation period. Compared with the longer-term periods, these extremes seem to be exceptional.
The experimental set-up is part of the TERENO-SOILCan lysimeter network (Pütz et al., 2016). The lysimeters are 1.5 m deep and have a surface area of 1 m2. The soil water dynamics at the lysimeter bottom were adjusted to field conditions by a bi-directional pumping control system that adjusts the measured pressure head at the bottom of the lysimeter in relation to the measured pressure head in a similar depth in the field. During drainage periods, water from the lysimeter was collected via a suction rake at the bottom of the lysimeter in a weighable seepage tank (precision: 1 g). In periods with an upward-directed water flow from capillary rise, the water was pumped back into the lysimeter from the seepage tank. For more details on the lysimeter set-up and equipment, refer to Groh et al. (2020a, b). The lysimeters were embedded within larger fields in Selhausen (0.025 ha) and Dedelow (2.3 ha), where the plant management methods in the lysimeter and in the field were identical during the observation period.
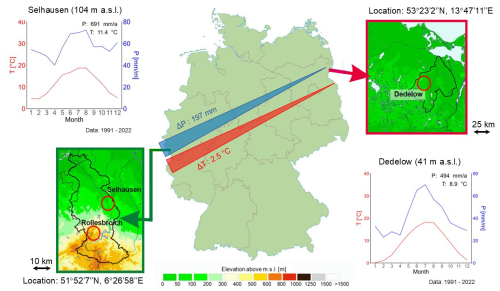
Figure 1Location of the sites Dedelow and Selhausen in Germany with climatic diagrams comparing the 30-year average values of monthly precipitation (P, mm m−1) and average monthly temperature (T, °C). The gradients in annual mean precipitation (ΔP) and mean annual temperature (ΔT) between the site Selhausen (left, located in the west of Germany) and Dedelow (right, located in the northeast of Germany) for the period 1991–2022 are indicated by the elongated red and blue triangles. Dedelow receives, on average, 197 mm yr−1 less P than Selhausen, and, on average, the annual temperature is about 2.5 °C less than at the site in western Germany. Elevation scale refers to the topographic maps.
The climate in Dedelow, with an average annual P sum of 494 mm and an average annual temperature of 8.9 °C (1991–2022), is more continental than the climate in Selhausen, with an average annual P sum of 691 mm and an average annual temperature of 11.4 °C (1991–2022). The P distribution is unimodal at both sites, with a peak in summer. Average monthly temperatures in Dedelow experience a minimum in January, with 0.1 °C, and a maximum in July, with 18.3 °C, whereas temperatures in Selhausen vary between 4.5 °C in February and 18.8 °C in August, indicating a slightly smaller annual temperature amplitude between winter and summer for Selhausen. Average monthly temperatures and P (Fig. 1) were obtained from automated weather stations in Dedelow (SYNMET/LOG, LAMBRECHT meteo GmbH) and Selhausen (weather station of the Forschungszentrum Jülich; the data are available at https://teodoor.icg.kfa-juelich.de/ibg3searchportal2/index.jsp (TERENO Data Discovery Portal, 2024), station ID ru_k_001). During the observation period, the Selhausen site was subject to a slightly lower wind speed (0.3 m s−1) than Dedelow.
All soils are Haplic Luvisols. The soil monoliths were extracted at a mid-slope position along a 20 m transect of an agricultural field site and were extracted as closely as possible to each other (∼ 3 m apart; Herbrich and Gerke, 2017). The texture of the Ap, E+Bt, and elCv horizons was described as loamy sand. The clay content in the Bt horizon is slightly higher than in the other horizons, indicating a more loamy texture (Table 1). A detailed description of the horizons of the single lysimeters can be found in the Supplement of Groh et al. (2022). The variation between the different lysimeters is relatively small, as is the variation in horizon depth between the lysimeters, and so only the mean values between the different lysimeter soils are reported in Table 1.
Table 1Horizon depths, soil bulk density (ρb), porosity (ε), and texture (sand: 2.0 to 0.063 mm; silt: 0.063 to 0.002 mm; clay: < 0.002 mm) for the lysimeter Dd_1, located in Dedelow. The other lysimeters differed only in the thickness of the diagnostic horizons below the Ap horizons. Data are from Herbrich and Gerke (2017). For supporting information (e.g. soil hydraulic properties), see also Groh et al. (2022).

* Horizons named according to FAO classification (IUSS Working Group WRB, 2015).
The field crops varied each year (Table 2) but were similar for Dedelow and Selhausen except in 2014, when oat was grown in Selhausen and Persian clover was grown in Dedelow. However, as the different crops were planted at the beginning rather than in the middle of the time period, the impact was expected to be minimal. In addition, in 2015–2016, winter wheat was planted in Dedelow instead of winter barley. As both crops are winter cereals, only minor deviations are expected.
2.2 Soil water storage, actual evapotranspiration, and precipitation data
The long-term weather observations (1991–2022) were obtained from close-by stations at Selhausen and Dedelow. The lysimeters were established in 2010, and the P and ETa data were obtained from mass changes in the lysimeters (Schrader et al., 2013; Schneider et al., 2021). Weight changes (i.e. the changes in mass) of the lysimeters were collected at a 1 min resolution and were aggregated to hourly values. The raw data were checked manually and automatically according to Pütz et al. (2016) and Schneider et al. (2021). To further reduce the impact of noise on the determination of ETa and P data, the adaptive window and threshold filter (AWAT, Peters et al., 2017) was applied. Missing data were gap-filled on an aggregated hourly basis within the post-processing scheme. In a first step, a linear regression model was applied that used the mean value of ETa and P calculated from values of all available lysimeters with the corresponding soil. In a second step, remaining gaps were gap-filled by a linear regression model that used reference data from a rain gauge or reference evapotranspiration (grass) according to the Penman–Monteith method (Allen, 1998). A detailed comparison between P data from lysimeters and standard rain gauges can be found in Schnepper et al. (2023).
Values of hourly soil water storage changes ΔSWS [mm h−1] were calculated according to the following:
where Qnet refers to the hourly sum of net water flux [mm h−1] across the lysimeter bottom (Qnet > 0: drainage, Qnet<0: capillary rise).
The cumulative change in total soil water storage SWSt [mm] from the value at the beginning of the measurements SWS0 [mm] was obtained by integrating (i.e. which, here, is identical with summing hourly values) ΔSWS as follows:
This is done for every hour i until the end (N=70 080 h) and for each of the lysimeters.
For the following analysis (WA and WCA), the mean between three replicate lysimeters was calculated for each hour and component of the soil water balance.
2.3 Wavelet analysis and wavelet coherence analysis
The complex Morlet wavelet (wavenumber k0=6) was selected as a mother wavelet for the continuous wavelet transform of the time series. The Morlet wavelet is well suited for the analysis of environmental signal due to its good balance of time and frequency resolution (Grinsted et al., 2004). Also, due to its complex nature, the amplitude and frequency of the signal can be reproduced (Torrence and Compo, 1998). As a background spectrum, a first-order autoregressive process (red noise) was chosen to test the significance of the wavelet spectra. For the visualization of the wavelet spectra and the wavelet coherence spectra, a significance level of 10 % against this background spectrum was applied. A total of 300 Monte Carlo simulations were conducted to find the regions of significant periodicities. For smoothing of the wavelet spectra, a Blackman window was selected to amplify the significance within the single wavelet spectra (Torrence and Compo, 1998). For the time series, no detrending was performed. Calculation of the wavelet plots and wavelet coherence plots was performed according to Torrence and Webster (1999) and was executed in the R software v. 3.6.2 (R Core team, 2019) with the package WaveletComp (Roesch and Schmidbauer, 2018). Variables used for the WCA were the SWS, P, ETa, and Qnet in Dedelow and Selhausen. For correlations between the two locations, the data set from Dedelow was the base signal and the data from Selhausen acted as the second signal. P and ETa were used as the base signals for correlations between P and SWS and between ETa and SWS.
WCA does not only derive times and scales of correlation between two signals but also shows how the periodic fluctuations of the time series are shifted in time against each other. General trends in phase shifts are indicated by the arrows within the significant parts of wavelet coherence spectra. They can be quantified by analysing the phase angle derived from the imaginary and real parts of the cross-wavelet spectrum (Si, 2008). The phase angle is calculated in radians in the range from −π to +π. Depending on the scale of interest, π corresponds to a time shift of 12 h at the daily (24 h) scale and to a time shift of 4380 h at the annual (8760 h) scale.
For more details on the theoretical background of wavelet and wavelet coherence analysis, refer to Si and Zeleke (2005) and Grinsted et al. (2004).
3.1 Comparison of SWS, ETa, and P under different climatic conditions
Throughout the observation period (2014–2021), the SWS values ranged from −100 to +100 mm relative to the initial value of SWS0 at the beginning of the period for Dedelow and between −300 and +25 mm for Selhausen (Fig. 2). The annual fluctuations in SWS were more pronounced in Selhausen (wetter and warmer climate) as compared to Dedelow (drier and colder climate). For Selhausen, the year 2015 brought an extreme decline in SWS (−300 mm) due to a drought that spread not only to the local region but also to large parts of Europe (Ionita et al., 2017). For Dedelow, the years 2018 and 2019, which included the extreme drought in 2018 (Büntgen et al., 2021), were characterized by extremely dry conditions, which led to a decrease in SWS and an early ripening of the oat crop (Groh et al., 2019).
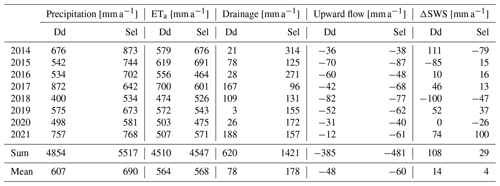
Wetter years with a more than average P amount were 2014 (+37 % above average) and 2017 (+77 %) for Dedelow and 2014 (+26 %) for Selhausen (Table A1 in the Appendix). From 2014 to 2021, the total amount of P per year decreased, with minimum values of 400 mm a−1 in 2018 for Dedelow and 534 mm a−1 in 2018 for Selhausen. Note that the average value of P (2014–2021) was significantly higher than the P for the respective reference period (1991–2022) determined by standard rainfall gauges, which underestimate P as compared to the more realistic lysimeter P data (Schnepper et al., 2023). In addition, P amounts determined with lysimeters include water from non-rainfall events (i.e. dew formation), which contributed 7.2 % at the annual scale of total P for the period 2015–2018, at least for Selhausen and the nearby Eifel region (Forstner et al., 2021; Groh et al., 2020b).
Note the extreme increase in SWS in both locations in July 2021 that was caused by an extreme precipitation event, with up to 174 mm in Dedelow and 103 mm in Selhausen within 2 d, causing major flooding within the Eifel–Ardennes Mountains in Germany (Lehmkuhl et al., 2022).
Daily ETa rates experienced annual cycles, with a maximum in 2015 for Selhausen (691 mm a−1) and in 2017 for Dedelow (700 mm a−1), which was 22 % and 24 % more than the average annual ETa value at the corresponding site (Table A1). The bottom drainage of the lysimeters was much smaller in Dedelow than in Selhausen (Fig. 2), corresponding to the drier climatic conditions at the more continental experimental site.
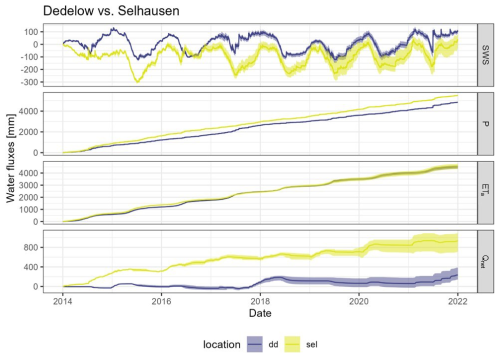
Figure 2Hourly soil water storage change (SWS) and cumulative sum of precipitation (P), actual evapotranspiration (ETa), and bottom flux (upwards and downwards, Qnet) of the lysimeters since 1 January 2014 in Dedelow (dd) and Selhausen (sel). The shaded areas represent the cumulative minimum and maximum values of the hourly data derived from the three lysimeters at each of the two sites.
These annual variations in SWS and ETa observed in the time series were reflected in the wavelet spectra (Fig. 3). For SWS, both wavelet spectra in Selhausen and Dedelow showed significant periodicities (area within the white edging) at the annual scale (period = 8760 h) over the entire observation period (Fig. 3a, b). Such annual patterns in SWS changes have been also found by Liu et al. (2020) for the Shale Hills catchment in Pennsylvania, USA. They related these fluctuations to seasonal variations due to water consumption by plants (transpiration) and soil evaporation. We assume that, in our study, the crop transpiration is also the main reason for the observed seasonal fluctuations. At the daily scale (period = 24 h), a diurnal variation throughout the vegetation period was vaguely perceptible, as indicated by the bright sky-blue band at the 24 h scale (Fig. 3a, b). This diurnal fluctuation was, however, not significant against the red-noise background spectrum.
The influence of wet and dry years was visible in the wavelet spectra of the SWS changes (Fig. 3a, b). At scales higher than the annual scale, significant periodicities were found for Dedelow between 2017 and 2021 and for Selhausen between 2015 and 2018 at the 2-year scale. Significant periodicities in SWS changes extended towards smaller scales (semi-annual to monthly) in Dedelow in 2015, 2017, and 2021 that correspond to years with more than average P (Table A1) that is also visible in the wavelet spectra of P (Fig. 3c). For Selhausen, significant periodicities were found at smaller scales (e.g. monthly) in the years 2014 and 2021, corresponding to years with an increased P amount (Table A1) like in Dedelow. In the wavelet spectra of P for Selhausen, periodicities extending to monthly scales were found also for the year 2016 (Fig. 3d), which has been characterized by an extremely low ETa (−18 % compared to an average year). Also, in 2016, Selhausen received 200 mm more P throughout the vegetation period (Table 2), possibly explaining the differing SWS patterns in comparison to those for Dedelow.
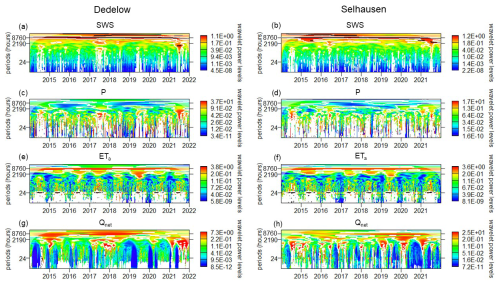
Figure 3Wavelet spectra of the soil water storage change (SWS), P, ETa, and bottom drainage Qnet (upward and downward flux) of the lysimeters in Dedelow and Selhausen. Time is depicted on the x axis, and the y axis denotes the periodicity in hours (24 h is the daily scale, and 8760 h is the annual scale). The colour indicates the wavelet power level that shows the similarity of the frequency of the wavelet in relation to the frequency of the time series at the given scale and at the point in time. Areas in the wavelet spectrum that deviate significantly from the red-noise background spectrum (significance level = 10 %) are surrounded by the white edging. Since, at smaller scales, the white rim (indicating significant areas in the wavelet plots) is rather omnipresent, the average significant periodicities are indicated by black lines (e.g. panel f). A logarithmic scale for the wavelet power levels was chosen to amplify differences in wavelet coefficients between different parts of the spectra visually. The shaded area at the edge of the plot at higher scales is called the cone of influence. Here, edge effects due to the padding of the time series with zeroes at the beginning and the end might influence the appearance of the wavelet spectrum and thus should be interpreted with caution.
As already shown for Dedelow, the years 2014 and 2021, with increased P, were also visible in the significant areas of the wavelet spectrum for Selhausen (Fig. 3d).
Extreme drought events and vegetation periods are reflected in the wavelet spectra for ETa in Dedelow and Selhausen that showed distinct annual cycles (Fig. 3e, f). Also, the periodicities at the daily scale were significant throughout the vegetation period at both sites, indicating the influence of vegetation on increased ETa. In 2019, the spectra of both sites showed significant periodicities extending to smaller scales, corresponding to a year with extreme drought in Germany (Boeing et al., 2022).
The wavelet spectra of Qnet of the lysimeters showed a distinct annual fluctuation in Dedelow from 2014 to 2019, whereas, in Selhausen, this annual cycle occurred between 2016 and 2021 (Fig. 3g, h). At the drier site in Dedelow, the years with more P were distinguishable by significant periodicities extending towards smaller scales (Fig. 3g). In Selhausen, these patterns were observed almost every year (Fig. 3h).
The higher amplitude in the annual fluctuations of SWS in Selhausen (Fig. 2 – SWS: 300 mm) in comparison to Dedelow (Fig. 2 – SWS: 200 mm) was reflected in the global wavelet power that is obtained when averaging the wavelet coefficients of a time series over an entire scale (Fig. 4a, d).
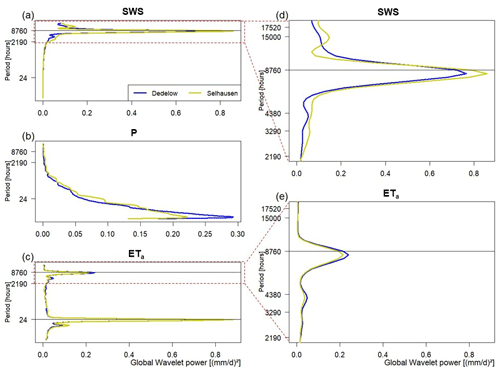
Figure 4Global wavelet coefficients of soil water storage (a), precipitation (b), and actual evapotranspiration (c) across different scales in Dedelow and Selhausen. Panels (d) and (e) are close-ups of the SWS and ETa at the annual scale, respectively.
This could be attributed to the higher annual P amount in Selhausen in contrast to Dedelow, especially since the ETa was similar for both sites on average (Table A1). In contrast to Dedelow, a small peak around a period of approximately 16 500 h was found in Selhausen (Fig. 4d), indicating a 2-year cycle that was already found in the wavelet spectra (Fig. 3b).
For P, no annual pattern was found in the global wavelet spectra, but at a periodicity of approximately 6 h, a peak was observed in both spectra (Fig. 4b). This peak was more pronounced for the drier site in Dedelow; however, the global wavelet power was much smaller in comparison to SWS and ETa.
For ETa, strong peaks in the global wavelet spectra were found at the daily scale and at the annual scale (Fig. 4c, e). Also, a small peak at a periodicity of around 4380 h was observed for ETa, responding to a semi-annual cycle attributed to the length of the vegetation period. Note that the peaks in SWS changes and ETa values around the annual scale occurred slightly below a periodicity of 8760 h, which corresponded to the exact number of hours per year. This could indicate a temporal shifting of the annual cycles, possibly caused by different climatic conditions. For example, Rahmati et al. (2023) showed that, in Europe, since 1981, the start of the vegetation period and the dry period was shifted towards earlier times in the year. Thus, the total difference in days between the start of the vegetation period of the preceding year and the following year decreases over time, leading to a shift in annual cycles towards lower periodicities.
3.2 Correlation and time shifts between soil water budget variables of both sites reflect dominant climatic patterns
Correlating the SWS, P, and ETa fluctuations between Dedelow and Selhausen by WCA might reveal the effects of changing climatic conditions on the soil water budget that were not directly visible from the time series itself (e.g. Biswas and Si, 2011).
Carry-over effects of dry years are found in the WCA spectra when correlating SWS changes from the drier and colder site with those from the wetter and warmer site. The coherence plot of SWS between Dedelow and Selhausen revealed a highly significant correlation pattern at the annual scale, which is only interrupted in 2017 (Fig. 5a). The year 2017 has been denoted as an extreme wet year in Dedelow, with almost 77 % more P than average (1991–2022). On the 2-year scale, significant correlations between the two experimental sites were found from 2020 to 2021, with a positive phase shift indicating an earlier rewetting phase in Dedelow than in Selhausen (Fig. 5b, i). This trend is opposite to the phase shifts found at the annual (Fig. 5b, ii) and semi-annual scale (Fig. 5b, iii). It could indicate the carry-over effect of the SWS deficit from the previous drought year, 2020, as already described by Groh et al. (2020a) for different soils at the experimental site in Bad Lauchstädt.
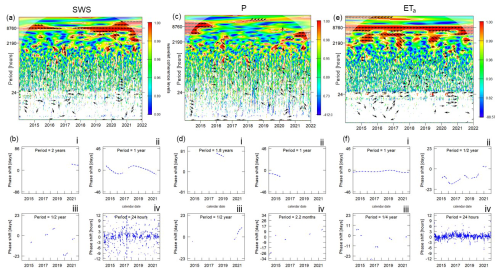
Figure 5Wavelet coherence plots showing the correlation between Dedelow and Selhausen in terms of SWS (a), precipitation (c), and actual evapotranspiration (e). For an explanation of the plot layout, refer to Fig. 3. The black arrows indicate the phase shift in the correlation of these variables between Dedelow and Selhausen. Arrows pointing to the right indicate a perfect correlation without any shift in time. Arrows pointing upwards indicate a leading pattern for the plots in Dedelow, whereas arrows pointing downwards show a leading pattern for Selhausen. These phase shifts can be expressed quantitatively in hours or days (b, d, f) for a given scale within in significant parts of the WCA spectrum. Negative and positive phase shifts correspond to a leading pattern for Dedelow and Selhausen, respectively.
Significant correlations extended towards smaller scales (semi-annual and quarterly scales) in spring 2015, autumn 2017 and 2018, winter 2019–2020, and spring 2021, possibly reflecting the influence of plant growth on SWS (Fig. 5a). In 2016, no correlations between the two sites were found that might be attributed to the much smaller P amount throughout the vegetation period in Dedelow compared to Selhausen (Table 2).
The influence of wet and dry years was reflected in changing phase shifts between the two sites. No considerable temporal deviations in SWS changes at the annual scale were found between Dedelow and Selhausen, as shown in Fig. 5a (arrows indicting phase shift). However, when directly plotting the phase shift from the significant parts of the WCA spectrum, a slightly negative offset was found until 2017 at the annual and semi-annual scales (Fig. 5b) for the variable SWS change. This refers to, in general, a faster decrease in SWS in Selhausen than in Dedelow. In 2017, this trend was reverted into a positive phase shift, showing a faster change in SWS in Dedelow than in Selhausen due to the exceptionally high P during this year in Dedelow. After the drought year 2020, again, negative phase shifts were observed at the annual and semi-annual scales. Thus, wetter and drier years exerted an influence over SWS changes by leading to faster or slower response times in SWS as compared to normal years.
At the daily scale, significant correlations in SWS between the two sites were found throughout the entire observation period (Fig. 5a) without any time shifts (Fig. 5b, iv), indicating similar diurnal patterns at both sites.
Dominant climatic deviations in P input and in the onset between the drier and the wetter site were found when correlating the P time series of Dedelow and Selhausen. The P patterns showed significant correlations at the annual scale at the beginning of the observation period in 2014–2015 (Fig. 5c). A slightly negative phase shift indicated a faster onset of P in Selhausen compared to in Dedelow (Fig. 5d, ii) that could be attributed to the western wind drift dominating the weather patterns in middle Europe. From 2018 to 2019, a 2-year cycle was observed with a positive phase shift (Fig. 5d, i). Likewise, changed patterns in the SWS could be attributed to carry-over effects of low P in drought years. In 2021, a significant area in the WCA spectrum was found at the semi-annual scale, with a positive phase shift of approximately 12 d (Fig. 5d, iii), indicating a faster onset of P at Dedelow compared to at Selhausen. This corresponds well to the temporal shift between the heavy P events at these two sites in July 2021. In Dedelow, 174 mm of P was recorded from 30 June to 1 July 2023; 12 d later, Selhausen received 103 mm of P from 13 to 14 July 2023. The time shift between the P events was also found at the quarterly scale (Fig. 5d, iv). This demonstrates the efficiency of WCA in deriving information about time shifts that cannot directly be conceived by regular time series analysis. These time shifts in the P are most likely caused by deviations due to the different longitude of both locations, and the pattern is related to the European western wind drift (Hu et al., 2022).
The shift of the start of vegetation periods towards earlier times of the year over the observation period could be deduced from the WCA spectra of ETa. ETa showed high correlations between Dedelow and Selhausen at the annual scale over the entire period (Fig. 5e). The correlations were well in phase, showing no time shift between the patterns of the two sites (Fig. 5f). At the semi-annual scale, significant correlations occurred throughout the vegetation period (Fig. 5f, ii). Between 2015 and 2020, the phase shifts at the semi-annual scale were negative. Since ETa was directly related to the plant development, this indicates a faster onset of the vegetation period in Selhausen than in Dedelow, with delays of 5 to 15 d, as is found from calculating the onset of the vegetation period from temperature data (Fig. 8). Only in 2021 was this shift inverted to a positive phase shift. As already indicated in the wavelet spectra (Fig. 3e, f), a highly significant correlation between ETa in Dedelow and Selhausen was found at the daily scale. The phase shift oscillated around 0 h (Fig. 5f, iv), indicating similar diurnal patterns for the two sites, as was found for the SWS changes (Fig. 5b, iv).
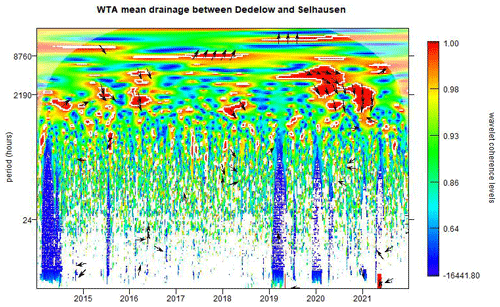
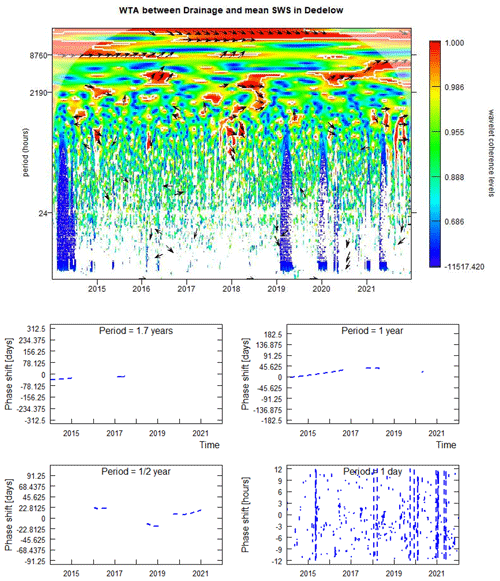
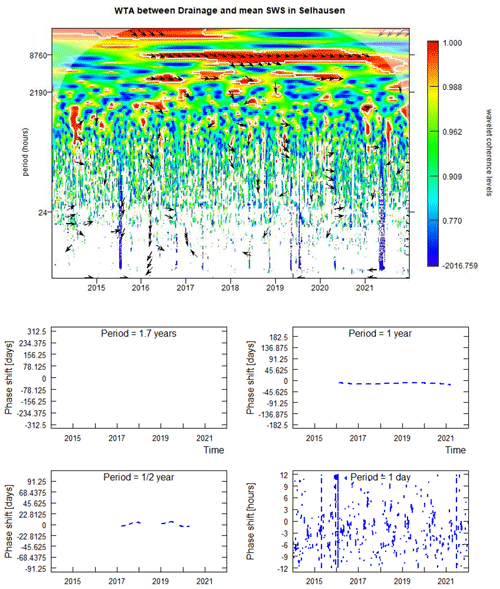
For Qnet, our analysis showed, for most years, a clear shift between the sites, indicating that the rewetting of the same soil started at the wetter site, Selhausen, earlier in the non-growing season compared to at the drier site in Dedelow (Fig. C1). Only for the very wet year of 2017 is a shift towards earlier rewetting in Dedelow visible. At smaller scales, this is also visible for the extreme P event in 2021, where the P occurred earlier in Dedelow than in Selhausen (Figs. C2 and C3).
These results imply that climatic conditions indeed have distinct effects on SWS patterns, which are found in extreme years in particular. As the climate is about to become more extreme (e.g. as suggested by Rahmstorf, 2024) due to a weakening of the gulf stream in northern Europe, these patterns might persist over the years. Temporal changes in SWS that increase over wintertime and decrease over summertime may then affect crop production or the infiltration capacity of soils during extreme events.
3.3 Correlation and time shifts between soil water budget components at each site
The response time of the SWS to P input was deduced from the WCA spectra between P and SWS. The correlation between P and SWS in Dedelow and Selhausen occurred mainly at smaller scales, corresponding to the return periods of P (Fig. 6a, c). P and SWS had positive phase shifts across all scales (black arrows pointing upwards), showing that SWS changes were lagging behind P inputs. At a weekly scale, this phase shift oscillates around 48 h for Dedelow and Selhausen, indicating that approximately 2 d need to pass before changes caused by P lead to an increase in SWS (Fig. 6b; d, iv). Similar temporal delays (0.375 weeks) have been observed for correlations between P and the soil matric potential in croplands (Yang et al., 2016).
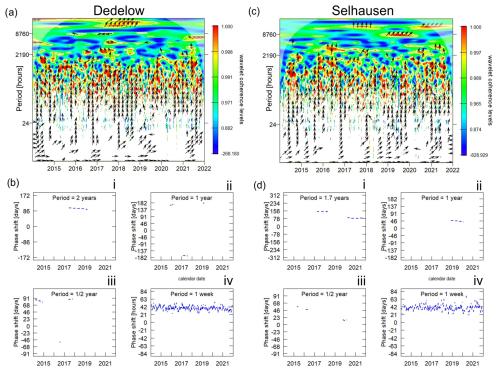
Figure 6WCA between P and SWS in Dedelow (a) and in Selhausen (c) and time shifts expressed in days and hours for selected scales in Dedelow (b) and in Selhausen (d). For an explanation of the plot layout, refer to Fig. 5.
Carry-over effects of dry and wet years towards subsequent years were also found when correlating P and SWS changes. At a 2-year scale, significant correlations between P and SWS were identified to occur between 2017 and 2019 for Dedelow and from 2017 to 2019 and from 2020 to 2022 for Selhausen (Fig. 6b, i; d, i). This might be attributed to extreme wet (2017 in Dedelow) and dry conditions (2018–2020 in Dedelow and Selhausen) that were only revealed in significant correlations at scales greater than 1 year. Note that the phase shift between the two variables at this scale from 2017 to 2019 was much larger for Selhausen (∼ 150 d) than for Dedelow (∼ 100 d). A reason for this could be the small Qnet in Dedelow in 2017: during periods of high P in Dedelow, very little water was drained from the lysimeter, leading to greater and probably faster changes in SWS in Dedelow as compared to in Selhausen. However, the patterns at the 2-year scale indicate that subsequent extreme years might lead to a carry-over effect in SWS responses to P that can be derived from deviations in phase shifts in WCA spectra. Groh et al. (2020a) also observed this increased vulnerability in SWS changes in response to droughts. They found that SWS after a drought year was not fully restored to its original value after winter when lysimeters were transferred to a site with a drier and warmer climate. Likewise, at the catchment scale, Laaha et al. (2017) demonstrated that, after the severe summer drought in 2015, SWS has not recovered. Also, Boergens et al. (2020) showed that this water deficit event increased for the summer droughts from 2018 to 2019 in comparison to 2015. This might explain why the water deficit was only visible in the WCA plots at scales greater than 1 year after 2018 and not before.
Changing time shifts in the correlation between ETa and SWS indicated a shift in the onset of the vegetation period towards earlier times of the year for the site under a wetter and warmer climate but not for the drier and colder site. A strong correlation was found between ETa and SWS in Dedelow and Selhausen at the annual scale. The phase shift was negative, indicating that ETa was reacting to SWS changes (Fig. 7a, c).
From a hydrological perspective, it is interesting that ETa and SWS are related over such a long timescale (> 100 d – Fig. 7a; c; b, ii; d, ii) since ETa should respond rather quickly to changes in the SWS. The time delay in the relation between ETa and changes in SWS at shorter timescales (i.e. hourly, daily) is, however, relatively more strongly affected by other water balance components. Still, the timescale we are looking at is the annual scale; thus, the variations observed here are more related to seasonal fluctuations than to shorter-term daily fluctuations. At a seasonal scale, the SWS starts decreasing around 90 d earlier than the ETa (Fig. 7b, ii; d, ii), which could mean that the decrease in ETa could be buffered by taking up water from deeper layers of the soil. Thus, the SWS will decrease but not the ETa. This shows the importance of SWS as a variable for crop productivity.
For Dedelow, the phase shift between ETa and SWS remained constant for around 120 d over the entire observation period, whereas, for Selhausen, a decrease in temporal deviations from 136 to 90 d was observed (Fig. 7b, ii; 7d, ii). This corresponded to the maximum peak in the global spectra for ETa and SWS occurring on slightly smaller scales than the annual scale (Fig. 4). Rahmati et al. (2020) found a similar trend as in Selhausen for grassland lysimeters located in two different climate regimes. They attributed the decrease in phase shift to a shift of the maximum ETa towards earlier times in the year while, at the same time, the maximum peak in SWS was delayed over the years. As suggested by these authors, we could demonstrate that an identical phenomenon occurred in croplands. This is most likely caused due to increasing temperature over the period and the earlier onset of plant decay due to drought, as found by Rahmati et al. (2023). They showed that, despite an earlier onset of the vegetation period, the length of the growing season has been decreasing to the level of 1981 over Europe due to an earlier onset of plant dormancy.
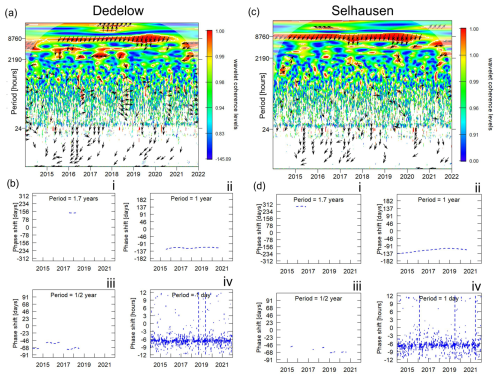
Figure 7WCA between ETa and SWS in Dedelow (a) and in Selhausen (c) and time shifts expressed in days and hours for selected scales in Dedelow (b) and in Selhausen (d). For an explanation of the plot layout, we refer to Fig. 5.
However, we did not find such a decreasing phase shift for the soil under the drier and colder climate in Dedelow at the annual scale (Fig. 7b, ii; d, ii). The phase shift in Dedelow was about 136 d, whereas, in Selhausen, it decreased from 136 to 90 d. One possible reason could be the differing growing-season length in Dedelow and Selhausen, which influenced the amount of ETa and SWS. For example, if the vegetation period started earlier every year at one site but not at the other site then this might explain the differences found in the WCA spectra. The length of the vegetation period at both sites was calculated from daily temperature data according to Ernst and Loeper (1976) (Fig. 8) over a 30-year period from 1992 to 2021 and over the 8-year observation period from 2014 to 2021. The changing length of the vegetation period was calculated for the 30-year period since the trends were more clearly visible in the longer period in comparison to the shorter 8-year period. For both periods, the growing season is longer in Selhausen in comparison to Dedelow, as indicated by the earlier start and later end of the vegetation period in Selhausen. When trying to explain the different time shifts between ETa and SWS in Selhausen and Dedelow, one needs to consider the fact that the soils were relocated according to the space-for-time approach from the drier and colder climate with the shorter growing season in Dedelow to Selhausen, where the growing season is longer and the climate is warmer and wetter. Now, the decreasing phase shift between ETa and SWS that was observed for Selhausen but not for Dedelow might indicate exactly the longer growing season in Selhausen that is reflected in earlier maximum peaks of ETa and later maximum peaks in SWS every year. The soils in Dedelow did not experience such a change since they were not subjected to different climatic conditions, whereas the relocated soil had to adapt to the longer vegetation period in Selhausen. With this, the influence of changing climatic conditions over the soil water budget parameters of similar soils was detectable.
Interestingly, over the last 30 years, the end of the growing season has been shifted more strongly towards later times in Dedelow as compared to in Selhausen (Fig. 8a). However, the end of the vegetation period for crops is determined by the harvest and not by the actual drop in temperatures in croplands. Therefore, the shift in the start of the growing season towards earlier times is more relevant. Thus, the difference in the end of the vegetation period cannot be used to explain the observed differences in SWS patterns between Dedelow and Selhausen.
All in all, the observed temporal changes in SWS patterns could have implications for crop production. Crops will have to be planted and harvested earlier due to an earlier onset of water deficits in summer, as already suggested by some agricultural authorities (e.g. Guddat and Schwabe, 2012, Thüringer Landesanstalt für Landwirtschaft).
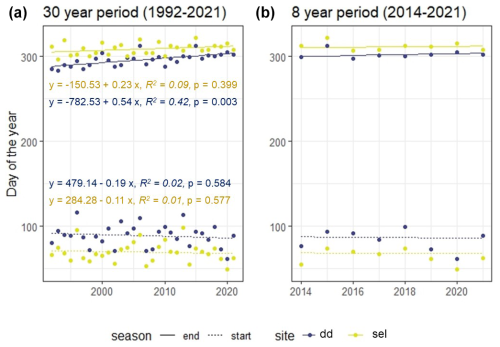
Figure 8Variation of the beginning and end of the vegetation period in Dedelow (DD) and Selhausen (SE) over a 30-year period from 1992 to 2021 (a) and over the observation period of 8 years from 2014 to 2021 (b). Calculations were executed according to Ernst and Loeper (1976) with hourly temperature data. “End” indicates the days of each year when the growing season stopped, whereas “start” indicates the days of each year when the growing season started.
Soil water storage (SWS) dynamics are important indicators of the impacts of environmental changes on the soil–water–atmosphere continuum. Temporal pattern detection and analysis of these changes might help to understand the long-term impacts of droughts on plant and crop productivity.
As hypothesized, wavelet coherence analysis (WCA) of soil water balance components from lysimeters with the same soils but under different climatic conditions (drier and colder, wetter and warmer) detected differing temporal patterns with temporal shifts when correlating time series of SWS changes and actual evapotranspiration (ETa) between both sites. Extreme wet and dry years led to a change in the temporal offset of SWS changes between the two sites. In particular, years with more precipitation (P) led to a faster response in SWS changes than years with less P as both a lower ETa and an earlier rewetting phase in summer and autumn led to a faster reaction in the SWS changes. This shows how P affects the change in SWS under different climate conditions.
The impact of droughts on SWS changes was reflected in significant periodic patterns of more than 1 year. This implies that dry years led to a carry-over effect in SWS; i.e. the SWS deficit of a dry year affected SWS of the following years. This suggests that crop production might be affected by the carry-over effect due to an earlier onset of summer drought.
Most interestingly, the earlier onset of vegetation periods deduced from the correlation between ETa and SWS was only found for the site with a wetter and warmer climate and not for the site with a colder and drier climate. The soil water limitations at the drier site could be related to the relatively later start of the vegetation in spring, along with the cooler temperatures, and the abrupt change in climatic conditions after the transfer of the soil monoliths towards the warmer site (space-for-time substitution approach) may have led to changes in the SWS. The results suggest that SWS patterns are not independent of climatic conditions. Thus, our hypothesis that there is no variation in SWS of the similarly managed arable soils at the two sites must be rejected. These results could be a first indication that a change in climatic conditions altered the soil water storage capacity. The longer-term adaption of the soil water retention properties to the new climatic conditions could be a topic of future studies. The results of the present study also suggest that long-term time series of SWS changes are important for understanding and quantifying the environmental impact of climatic extreme events on soils and cropping systems. The limitations of the study that occur due to the co-dependency of SWS, P, ETa, and Qnet should be solved by applying partial WCA in future studies.
Code will be made available upon request.
Data will be made available upon request.
AE: conceptualization, formal analysis, investigation, methodology, software, validation, visualization, writing (original draft preparation), writing (review and editing). JG: conceptualization, data curation, formal analysis, investigation, methodology, resources, software, writing (review and editing). HHG: conceptualization, funding acquisition, methodology, project administration, resources, supervision, writing (review and editing).
The contact author has declared that none of the authors has any competing interests.
Publisher’s note: Copernicus Publications remains neutral with regard to jurisdictional claims made in the text, published maps, institutional affiliations, or any other geographical representation in this paper. While Copernicus Publications makes every effort to include appropriate place names, the final responsibility lies with the authors.
The research was funded by the Leibniz Centre for Agricultural Landscape Research (ZALF), which is a research institution of the Leibniz Association in the legal form of a non-profit registered association. ZALF is financed, in equal part, by the Federal Ministry of Food and Agriculture (BMEL) and the Ministry for Science, Research and Culture of the State of Brandenburg (MWFK). The study was also funded by Fachagentur Nachwachsende Rohstoffe e.V. (FNR) under grant no. 22404117. Jannis Groh was funded by the Deutsche Forschungsgemeinschaft (DFG, German Research Foundation) – project no. 460817082. We acknowledge the support of TERENO and SOILCan, which were funded by the Helmholtz Association (HGF) and the Federal Ministry of Education and Research (BMBF). We thank Werner Küpper, Philipp Meulendick, Gernot Verch, and Jörg Haase for the instrument operation and data processing at both sites.
We would like to thank Patrizia Ney from Forschungszentrum Jülich for providing the climate data for the study site Selhausen.
The publication of this article was funded by the Leibniz Centre of Agricultural Landscape Research (ZALF).
This paper was edited by Roberto Greco and reviewed by three anonymous referees.
Agboma, C. and Itenfisu, D.: Investigating the Spatio-Temporal dynamics in the soil water storage in Alberta's Agricultural region, J. Hydrol., 588, 125104, https://doi.org/10.1016/j.jhydrol.2020.125104, 2020.
Allen, R. G.: Crop Evapotranspiration-Guideline for computing crop water requirements, FAO Irrigation and drainage paper, 56, 300 pp., ISBN 92-5-104219-5, 1998.
Biswas, A. and Si, B. C.: Identifying scale specific controls of soil water storage in a hummocky landscape using wavelet coherency, Geoderma, 165, 50–59, https://doi.org/10.1016/j.geoderma.2011.07.002, 2011.
Boeing, F., Rakovec, O., Kumar, R., Samaniego, L., Schrön, M., Hildebrandt, A., Rebmann, C., Thober, S., Müller, S., Zacharias, S., Bogena, H., Schneider, K., Kiese, R., Attinger, S., and Marx, A.: High-resolution drought simulations and comparison to soil moisture observations in Germany, Hydrol. Earth Syst. Sci., 26, 5137–5161, https://doi.org/10.5194/hess-26-5137-2022, 2022.
Boergens, E., Güntner, A., Dobslaw, H., and Dahle, C.: Quantifying the Central European Droughts in 2018 and 2019 With GRACE Follow-On, Geophys. Res. Lett., 47, 179, https://doi.org/10.1029/2020GL087285, 2020.
Bravo, S., González-Chang, M., Dec, D., Valle, S., Wendroth, O., Zúñiga, F., and Dörner, J.: Using wavelet analyses to identify temporal coherence in soil physical properties in a volcanic ash-derived soil, Agr. Forest Meteorol., 285–286, 107909, https://doi.org/10.1016/j.agrformet.2020.107909, 2020.
Büntgen, U., Urban, O., Krusic, P. J., Rybníček, M., Kolář, T., Kyncl, T., Ač, A., Koňasová, E., Čáslavský, J., Esper, J., Wagner, S., Saurer, M., Tegel, W., Dobrovolný, P., Cherubini, P., Reinig, F., and Trnka, M.: Recent European drought extremes beyond Common Era background variability, Nat. Geosci., 14, 190–196, https://doi.org/10.1038/s41561-021-00698-0, 2021.
Chen, Y., Liu, X., Ma, Y., He, J., He, Y., Zheng, C., Gao, W., and Ma, C.: Variability analysis and the conservation capacity of soil water storage under different vegetation types in arid regions, CATENA, 230, 107269, https://doi.org/10.1016/j.catena.2023.107269, 2023.
Ding, R., Kang, S., Vargas, R., Zhang, Y., and Hao, X.: Multiscale spectral analysis of temporal variability in evapotranspiration over irrigated cropland in an arid region, Agr. Water Manage., 130, 79–89, https://doi.org/10.1016/j.agwat.2013.08.019, 2013.
Ehrhardt, A., Groh, J., and Gerke, H. H.: Wavelet analysis of soil water state variables for identification of lateral subsurface flow: Lysimeter vs. field data, Vadose Zone J., 20, 149, https://doi.org/10.1002/vzj2.20129, 2021.
Ernst, P. and Loeper, E. G.: Temperaturentwicklung und Vegetationsbeginn auf dem Grunland, Wirtschaftseigene Futter, ISSN 0049-7711, 1976.
Farge, M.: Wavelet transforms and their applications to turbulence, Annu. Rev. Fluid Mech., 24, 395–458, 1992.
Forstner, V., Groh, J., Vremec, M., Herndl, M., Vereecken, H., Gerke, H. H., Birk, S., and Pütz, T.: Response of water fluxes and biomass production to climate change in permanent grassland soil ecosystems, Hydrol. Earth Syst. Sci., 25, 6087–6106, https://doi.org/10.5194/hess-25-6087-2021, 2021.
Fu, J., Gasche, R., Wang, N., Lu, H., Butterbach-Bahl, K., and Kiese, R.: Impacts of climate and management on water balance and nitrogen leaching from montane grassland soils of S-Germany, Environ. Pollut., 229, 119–131, https://doi.org/10.1016/j.envpol.2017.05.071, 2017.
Graf, A., Bogena, H. R., Drüe, C., Hardelauf, H., Pütz, T., Heinemann, G., and Vereecken, H.: Spatiotemporal relations between water budget components and soil water content in a forested tributary catchment, Water Resour. Res., 50, 4837–4857, https://doi.org/10.1002/2013WR014516, 2014.
Grinsted, A., Moore, J. C., and Jevrejeva, S.: Application of the cross wavelet transform and wavelet coherence to geophysical time series, Nonlin. Processes Geophys., 11, 561–566, https://doi.org/10.5194/npg-11-561-2004, 2004.
Groh, J., Pütz, T., Gerke, H. H., Vanderborght, J., and Vereecken, H.: Quantification and Prediction of Nighttime Evapotranspiration for Two Distinct Grassland Ecosystems, Water Resour. Res., 55, 2961–2975, https://doi.org/10.1029/2018WR024072, 2019.
Groh, J., Slawitsch, V., Herndl, M., Graf, A., Vereecken, H., and Pütz, T.: Determining dew and hoar frost formation for a low mountain range and alpine grassland site by weighable lysimeter, J. Hydrol., 563, 372–381, https://doi.org/10.1016/j.jhydrol.2018.06.009, 2018.
Groh, J., Vanderborght, J., Pütz, T., Vogel, H.-J., Gründling, R., Rupp, H., Rahmati, M., Sommer, M., Vereecken, H., and Gerke, H. H.: Responses of soil water storage and crop water use efficiency to changing climatic conditions: a lysimeter-based space-for-time approach, Hydrol. Earth Syst. Sci., 24, 1211–1225, https://doi.org/10.5194/hess-24-1211-2020, 2020a.
Groh, J., Diamantopoulos, E., Duan, X., Ewert, F., Herbst, M., Holbak, M., Kamali, B., Kersebaum, K.-C., Kuhnert, M., Lischeid, G., Nendel, C., Priesack, E., Steidl, J., Sommer, M., Pütz, T., Vereecken, H., Wallor, E., Weber, T. K. D., Wegehenkel, M., Weihermüller, L., and Gerke, H. H.: Crop growth and soil water fluxes at erosion-affected arable sites: Using weighing lysimeter data for model intercomparison, Vadose Zone J., 19, e20058, https://doi.org/10.1002/vzj2.20058, 2020b.
Groh, J., Diamantopoulos, E., Duan, X., Ewert, F., Heinlein, F., Herbst, M., Holbak, M., Kamali, B., Kersebaum, K.-C., Kuhnert, M., Nendel, C., Priesack, E., Steidl, J., Sommer, M., Pütz, T., Vanderborght, J., Vereecken, H., Wallor, E., Weber, T. K. D., Wegehenkel, M., Weihermüller, L., and Gerke, H. H.: Same soil, different climate: Crop model intercomparison on translocated lysimeters, Vadose Zone J., 21, 303, https://doi.org/10.1002/vzj2.20202, 2022.
Gu, X., Sun, H., Zhang, Y., Zhang, S., and Lu, C.: Partial Wavelet Coherence to Evaluate Scale-dependent Relationships Between Precipitation/Surface Water and Groundwater Levels in a Groundwater System, Water Resour. Manage., 36, 2509–2522, https://doi.org/10.1007/s11269-022-03157-6, 2022.
Guddat, C. and Schwabe, I.: Thüringer Pflanzenbau im Klimawandel; Thüringer Landesanstalt für Landwirtschaft, https://www.tlllr.de/www/daten/agraroekologie/klima/klimawandel/pflanzenbau_klimawandel_thueringen.pdf (last access: 25 October 2024), 2012.
He, D. and Wang, E.: On the relation between soil water holding capacity and dryland crop productivity, Geoderma, 353, 11–24, https://doi.org/10.1016/j.geoderma.2019.06.022, 2019.
Heistermann, M., Bogena, H., Francke, T., Güntner, A., Jakobi, J., Rasche, D., Schrön, M., Döpper, V., Fersch, B., Groh, J., Patil, A., Pütz, T., Reich, M., Zacharias, S., Zengerle, C., and Oswald, S.: Soil moisture observation in a forested headwater catchment: combining a dense cosmic-ray neutron sensor network with roving and hydrogravimetry at the TERENO site Wüstebach, Earth Syst. Sci. Data, 14, 2501–2519, https://doi.org/10.5194/essd-14-2501-2022, 2022.
Herbrich, M. and Gerke, H. H.: Scales of Water Retention Dynamics Observed in Eroded Luvisols from an Arable Postglacial Soil Landscape, Vadose Zone J., 16, 1–17, https://doi.org/10.2136/vzj2017.01.0003, 2017.
Hu, H.-M., Trouet, V., Spötl, C., Tsai, H.-C., Chien, W.-Y., Sung, W.-H., Michel, V., Yu, J.-Y., Valensi, P., Jiang, X., Duan, F., Wang, Y., Mii, H.-S., Chou, Y.-M., Lone, M. A., Wu, C.-C., Starnini, E., Zunino, M., Watanabe, T. K., Watanabe, T., Hsu, H.-H., Moore, G. W. K., Zanchetta, G., Pérez-Mejías, C., Lee, S.-Y., and Shen, C.-C.: Tracking westerly wind directions over Europe since the middle Holocene, Nat. Commun., 13, 7866, https://doi.org/10.1038/s41467-022-34952-9, 2022.
Hu, W. and Si, B. C.: Technical note: Multiple wavelet coherence for untangling scale-specific and localized multivariate relationships in geosciences, Hydrol. Earth Syst. Sci., 20, 3183–3191, https://doi.org/10.5194/hess-20-3183-2016, 2016.
Hu, W. and Si, B.: Technical Note: Improved partial wavelet coherency for understanding scale-specific and localized bivariate relationships in geosciences, Hydrol. Earth Syst. Sci., 25, 321–331, https://doi.org/10.5194/hess-25-321-2021, 2021.
Hu, W., Si, B. C., Biswas, A., and Chau, H. W.: Temporally stable patterns but seasonal dependent controls of soil water content: Evidence from wavelet analyses, Hydrol. Process., 31, 3697–3707, https://doi.org/10.1002/hyp.11289, 2017.
Humphrey, V. and Gudmundsson, L.: GRACE-REC: a reconstruction of climate-driven water storage changes over the last century, Earth Syst. Sci. Data, 11, 1153–1170, https://doi.org/10.5194/essd-11-1153-2019, 2019.
Ionita, M., Tallaksen, L. M., Kingston, D. G., Stagge, J. H., Laaha, G., Van Lanen, H. A. J., Scholz, P., Chelcea, S. M., and Haslinger, K.: The European 2015 drought from a climatological perspective, Hydrol. Earth Syst. Sci., 21, 1397–1419, https://doi.org/10.5194/hess-21-1397-2017, 2017.
Jarvis, N., Groh, J., Lewan, E., Meurer, K. H. E., Durka, W., Baessler, C., Pütz, T., Rufullayev, E., and Vereecken, H.: Coupled modelling of hydrological processes and grassland production in two contrasting climates, Hydrol. Earth Syst. Sci., 26, 2277–2299, https://doi.org/10.5194/hess-26-2277-2022, 2022.
Jia, X., Shao, M.'a., Wei, X., and Wang, Y.: Hillslope scale temporal stability of soil water storage in diverse soil layers, J. Hydrol., 498, 254–264, https://doi.org/10.1016/j.jhydrol.2013.05.042, 2013.
Kutílek, M. and Nielsen, D. R.: Soil hydrology: texbook for students of soil science, agriculture, forestry, geoecology, hydrology, geomorphology and other related disciplines, Catena Verlag, ISBN 978-3-923381-26-5, 1994.
Laaha, G., Gauster, T., Tallaksen, L. M., Vidal, J.-P., Stahl, K., Prudhomme, C., Heudorfer, B., Vlnas, R., Ionita, M., Van Lanen, H. A. J., Adler, M.-J., Caillouet, L., Delus, C., Fendekova, M., Gailliez, S., Hannaford, J., Kingston, D., Van Loon, A. F., Mediero, L., Osuch, M., Romanowicz, R., Sauquet, E., Stagge, J. H., and Wong, W. K.: The European 2015 drought from a hydrological perspective, Hydrol. Earth Syst. Sci., 21, 3001–3024, https://doi.org/10.5194/hess-21-3001-2017, 2017.
Lal, R.: Carbon Cycling in Global Drylands, Curr. Clim. Change Rep., 5, 221–232, https://doi.org/10.1007/s40641-019-00132-z, 2019.
Lehmkuhl, F., Schüttrumpf, H., Schwarzbauer, J., Brüll, C., Dietze, M., Letmathe, P., Völker, C., and Hollert, H.: Assessment of the 2021 summer flood in Central Europe, Environ. Sci. Eur., 34, 107, https://doi.org/10.1186/s12302-022-00685-1, 2022.
Li, H., Sivapalan, M., Tian, F., and Liu, D.: Water and nutrient balances in a large tile-drained agricultural catchment: a distributed modeling study, Hydrol. Earth Syst. Sci., 14, 2259–2275, https://doi.org/10.5194/hess-14-2259-2010, 2010.
Liu, H., Yu, Y., Zhao, W., Guo, L., Liu, J., and Yang, Q.: Inferring Subsurface Preferential Flow Features From a Wavelet Analysis of Hydrological Signals in the Shale Hills Catchment, Water Resour. Res., 56, 1–21, https://doi.org/10.1029/2019WR026668, 2020.
Liu, Q., Hao, Y., Stebler, E., Tanaka, N., and Zou, C. B.: Impact of Plant Functional Types on Coherence Between Precipitation and Soil Moisture: A Wavelet Analysis, Geophys. Res. Lett., 44, 12197–12207, https://doi.org/10.1002/2017GL075542, 2017.
Luecke, A., Puetz, T., and Schmidt, M.: TERENO data from station(s) SE_BDK_002 with parameter(s) AirHumidity, AirPressure, AirTemperature, Precipitation, WindSpeed for time period 2014-01-01 to 2021-12-31, https://hdl.handle.net/20.500.11952/TERENO.SE_BDK_02.1716629716483 (last access: 14 October 2024), 2024.
Palese, A. M., Vignozzi, N., Celano, G., Agnelli, A. E., Pagliai, M., and Xiloyannis, C.: Influence of soil management on soil physical characteristics and water storage in a mature rainfed olive orchard, Soil Till. Res., 144, 96–109, https://doi.org/10.1016/j.still.2014.07.010, 2014.
Peters, A., Groh, J., Schrader, F., Durner, W., Vereecken, H., and Pütz, T.: Towards an unbiased filter routine to determine precipitation and evapotranspiration from high precision lysimeter measurements, J. Hydrol., 549, 731–740, https://doi.org/10.1016/j.jhydrol.2017.04.015, 2017.
Pütz, T., Kiese, R., Wollschläger, U., Groh, J., Rupp, H., Zacharias, S., Priesack, E., Gerke, H. H., Gasche, R., Bens, O., Borg, E., Baessler, C., Kaiser, K., Herbrich, M., Munch, J.-C., Sommer, M., Vogel, H.-J., Vanderborght, J., and Vereecken, H.: TERENO-SOILCan: a lysimeter-network in Germany observing soil processes and plant diversity influenced by climate change, Environ. Earth Sci., 75, 138, https://doi.org/10.1007/s12665-016-6031-5, 2016.
Rabot, E., Wiesmeier, M., Schlüter, S., and Vogel, H.-J.: Soil structure as an indicator of soil functions: A review, Geoderma, 314, 122–137, https://doi.org/10.1016/j.geoderma.2017.11.009, 2018.
Rahmati, M., Groh, J., Graf, A., Pütz, T., Vanderborght, J., and Vereecken, H.: On the impact of increasing drought on the relationship between soil water content and evapotranspiration of a grassland, Vadose Zone J., 19, 175, https://doi.org/10.1002/vzj2.20029, 2020.
Rahmati, M., Graf, A., Poppe Terán, C., Amelung, W., Dorigo, W., Franssen, H.-J. H., Montzka, C., Or, D., Sprenger, M., Vanderborght, J., Verhoest, N. E. C., and Vereecken, H.: Continuous increase in evaporative demand shortened the growing season of European ecosystems in the last decade, Commun. Earth Environ., 4, 236, https://doi.org/10.1038/s43247-023-00890-7, 2023.
Rahmstorf, S.: Is the atlantic overturning circulation approaching a tipping point?, Ocenanography, 37, 16–29, https://doi.org/10.5670/oceanog.2024.501, 2024.
Rieckh, H., Gerke, H. H., Siemens, J., and Sommer, M.: Water and Dissolved Carbon Fluxes in an Eroding Soil Landscape Depending on Terrain Position, Vadose Zone J., 13, 1–14, https://doi.org/10.2136/vzj2013.10.0173, 2014.
Ritter, A., Regalado, C. M., and Muñoz-Carpena, R.: Temporal Common Trends of Topsoil Water Dynamics in a Humid Subtropical Forest Watershed, Vadose Zone J., 8, 437–449, https://doi.org/10.2136/vzj2008.0054, 2009.
Robinson, D. A., Jones, S. B., Lebron, I., Reinsch, S., Domínguez, M. T., Smith, A. R., Jones, D. L., Marshall, M. R., and Emmett, B. A.: Experimental evidence for drought induced alternative stable states of soil moisture, Sci. Rep., 6, 20018, https://doi.org/10.1038/srep20018, 2016.
Roesch, A. and Schmidbauer, H.: WaveletComp: Computational Wavelet Analysis, R-package version 1.1, repository: CRAN, https://CRAN.R-project.org/package=WaveletComp (last access: 25 July 2024), 2018.
Schneider, J., Groh, J., Pütz, T., Helmig, R., Rothfuss, Y., Vereecken, H., and Vanderborght, J.: Prediction of soil evaporation measured with weighable lysimeters using the FAO Penman–Monteith method in combination with Richards' equation, Vadose Zone J., 20, 49, https://doi.org/10.1002/vzj2.20102, 2021.
Schnepper, T., Groh, J., Gerke, H. H., Reichert, B., and Pütz, T.: Evaluation of precipitation measurement methods using data from a precision lysimeter network, Hydrol. Earth Syst. Sci., 27, 3265–3292, https://doi.org/10.5194/hess-27-3265-2023, 2023.
Schrader, F., Durner, W., Fank, J., Gebler, S., Pütz, T., Hannes, M., and Wollschläger, U.: Estimating Precipitation and Actual Evapotranspiration from Precision Lysimeter Measurements, Procedia Environ. Sci., 19, 543–552, https://doi.org/10.1016/j.proenv.2013.06.061, 2013.
Shah, D. and Mishra, V.: Strong Influence of Changes in Terrestrial Water Storage on Flood Potential in India, J. Geophys. Res.-Atmos., 126, D06113, https://doi.org/10.1029/2020JD033566, 2021.
Shen, R., Yang, H., Rinklebe, J., Bolan, N., Hu, Q., Huang, X., Wen, X., Zheng, B., and Shi, L.: Seasonal flooding wetland expansion would strongly affect soil and sediment organic carbon storage and carbon-nutrient stoichiometry, Sci. Total Environ., 828, 154427, https://doi.org/10.1016/j.scitotenv.2022.154427, 2022.
Si, B. C.: Spatial Scaling Analyses of Soil Physical Properties: A Review of Spectral and Wavelet Methods, Vadose Zone J., 7, 547–562, https://doi.org/10.2136/vzj2007.0040, 2008.
Si, B. C. and Zeleke, T. B.: Wavelet coherency analysis to relate saturated hydraulic properties to soil physical properties, Water Resour. Res., 41, 395, https://doi.org/10.1029/2005WR004118, 2005.
Stahl, M. O. and McColl, K. A.: The Seasonal Cycle of Surface Soil Moisture, J. Climate, 35, 4997–5012, https://doi.org/10.1175/JCLI-D-21-0780.1, 2022.
Stocker, B. D., Tumber-Dávila, S. J., Konings, A. G., Anderson, M. C., Hain, C., and Jackson, R. B.: Global patterns of water storage in the rooting zones of vegetation, Nat. Geosci., 16, 250–256, https://doi.org/10.1038/s41561-023-01125-2, 2023.
Su, L., Miao, C., Duan, Q., Lei, X., and Li, H.: Multiple-Wavelet Coherence of World's Large Rivers With Meteorological Factors and Ocean Signals, J. Geophys. Res.-Atmos., 124, 4932–4954, https://doi.org/10.1029/2018JD029842, 2019.
Tafasca, S., Ducharne, A., and Valentin, C.: Weak sensitivity of the terrestrial water budget to global soil texture maps in the ORCHIDEE land surface model, Hydrol. Earth Syst. Sci., 24, 3753–3774, https://doi.org/10.5194/hess-24-3753-2020, 2020.
TERENO Data Discovery Portal: weather station of the Forschungszentrum Jülich, station ID ru_k_001, TERENO Data Discovery Portal [data set], https://teodoor.icg.kfa-juelich.de/ibg3searchportal2/index.jsp (last access: 14 October 2024), 2024.
Torrence, C. and Compo, G. P.: A practical guide to wavelet analysis, B. Am. Meteorol. Soc., 79, 61–78, 1998.
Torrence, C. and Webster, P. J.: Interdecadal changes in the ENSO–monsoon system, J. Climate, 12, 2679–2690, 1999.
Trautmann, T., Koirala, S., Carvalhais, N., Güntner, A., and Jung, M.: The importance of vegetation in understanding terrestrial water storage variations, Hydrol. Earth Syst. Sci., 26, 1089–1109, https://doi.org/10.5194/hess-26-1089-2022, 2022.
Vereecken, H., Pachepsky, Y., Simmer, C., Rihani, J., Kunoth, A., Korres, W., Graf, A., Franssen, H. J.-H., Thiele-Eich, I., and Shao, Y.: On the role of patterns in understanding the functioning of soil-vegetation-atmosphere systems, J. Hydrol., 542, 63–86, https://doi.org/10.1016/j.jhydrol.2016.08.053, 2016.
Vereecken, H., Amelung, W., Bauke, S. L., Bogena, H., Brüggemann, N., Montzka, C., Vanderborght, J., Bechtold, M., Blöschl, G., and Carminati, A.: Soil hydrology in the Earth system, Nat. Rev. Earth Environ., 3, 573–587, 2022.
Yang, Y., Wendroth, O., and Walton, R. J.: Temporal Dynamics and Stability of Spatial Soil Matric Potential in Two Land Use Systems, Vadose Zone J., 15, 1–15, https://doi.org/10.2136/vzj2015.12.0157, 2016.
Yu, M., Zhang, L., Xu, X., Feger, K.-H., Wang, Y., Liu, W., and Schwärzel, K.: Impact of land-use changes on soil hydraulic properties of Calcaric Regosols on the Loess Plateau, NW China, J. Plant Nutr. Soil Sci., 178, 486–498, https://doi.org/10.1002/jpln.201400090, 2015.
- Abstract
- Introduction
- Materials and methods
- Results and discussion
- Conclusions
- Appendix A: Annual precipitation, actual evapotranspiration (ETa), drainage, upward water flow, and change in soil water storage (SWS) for Dedelow (Dd) and Selhausen (Sel) calculated from the lysimeter weights
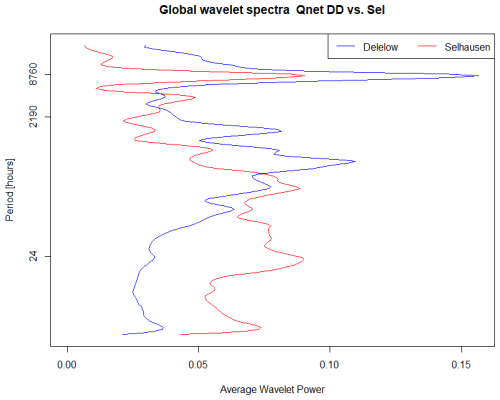
- Appendix B: Global wavelet spectra of Qnet in Dedelow and Selhausen
- Appendix C: Drainage – WCA between Dedelow and Selhausen and WCA between drainage and SWS in Dedelow and Selhausen
- Code availability
- Data availability
- Author contributions
- Competing interests
- Disclaimer
- Acknowledgements
- Financial support
- Review statement
- References


