the Creative Commons Attribution 4.0 License.
the Creative Commons Attribution 4.0 License.
 | 16 Jun 2025
Development of a land–river–ocean coupled model for compound floods jointly caused by heavy rainfall and storm surges in large river delta regions
Anyifang Zhang
The simultaneous or sequential occurrence of different flood processes, including extreme storm surges and heavy precipitation, tends to trigger compound floods, which are often destructive to life and property. However, numerical models that fully represent the effect of various flood processes and their interactions have not yet been firmly established. In this study, a coupled land–river–ocean model is developed that considers storm surges, storm waves, astronomical tides, river flow, and precipitation. The coupled model is applied to the simulation of compound floods induced by tropical cyclones in the Pearl River Delta. The numerical results obtained on river flow and ocean surface elevation are shown to agree well with observations for cases considered, with Willmott skill values of 0.96 and 0.88, respectively. The coastal inundation area obtained with the model covers approximately 80 % of the area identified by remote sensing. An attribution analysis implies that ocean processes contribute to more than half of the total flood volume, while precipitation accounts for 5 % to 15 % through a tropical cyclone event in the Pearl River Delta region. Significantly, the contribution of river base flow varies from 2 % to 30 % depending on the landfall time of the tropical cyclone. It is also emphasized that the completeness of the coupling method substantially affects the numerical accuracy.
- Article
(10649 KB) - Full-text XML
-
Supplement
(7162 KB) - BibTeX
- EndNote


In major river deltas, devastating floods frequently result from the simultaneous or sequential occurrence of multiple events, including severe storm surges and heavy regional rainfall (Zscheischler et al., 2020). The synergistic impact of multiple events may substantially amplify the spatial extent and time duration of inundation, resulting in more severe damage than a linear addition of the damage caused by each contributing factor. The problem is further exacerbated since climate change leads to an increase in the temporal and spatial frequency of extreme flooding events (Wahl et al., 2015), while rapid urbanization of major river deltas (Chan et al., 2021) results in the annual escalation of losses due to compound floods.
The study of compound floods has attracted the increasing attention of the scientific community in recent decades. Considerable research efforts have been devoted to elucidating the statistical dependencies among the various mechanisms of flood events, which are crucial to risk assessment. Wahl et al. (2015) reported the temporal variability in the relationship between storm surge and precipitation for coastal cities in America. Their findings indicated a significant increase in compound flooding events over the past century, as evidenced by rising Kendall correlation coefficients. Moftakhari et al. (2017) evaluated the bivariate return period of the sea level and river discharge in a future scenario, which indicated that both the failure probability and degree of flood drivers will likely worsen due to global warming.
A close relationship between compound floods and tropical cyclone (TC) events has been widely recognized (Wahl et al., 2015; Fang et al., 2021; Lai et al., 2021; Hendry et al., 2019). TCs, often characterized by a simultaneous occurrence of heavy rainfall, storm surges, and storm waves, are the most typical weather systems causing compound floods. In a TC-induced compound flood, it is possible that none of the component events reach extreme conditions, but their interdependent occurrence can be historically disastrous.
Simulation of TC-induced compound floods in a major river delta region requires coupled models. An ocean circulation model can be used to describe the ocean surface elevation and the ocean flow jointly caused by storm surges and astronomical tides; an ocean wave model is able to predict the wind wave spectrum; a river flow model usually results in the water level and the flow rate within the river channel; a hydrologic model may be used to represent the rainfall–runoff process. When all or parts of these models are integrated into a system, the framework of a land–river–ocean coupled model becomes available. The degree of coupling determines whether the synergistic effect of multiple events can be reasonably obtained. A properly coupled model system can simulate different kinds of compound floods as long as the atmospheric forcing can be provided (Gori et al., 2020b; Feng et al., 2022; Revel et al., 2023; Xu et al., 2024; Du et al., 2024; Zhong et al., 2024). Lee et al. (2019) proposed a coupled model for TC landfall in South Korea, highlighting the importance of the rainfall–runoff process in studying inundation. Gori et al. (2020a) coupled a hydrologic model with river and ocean dynamic models to investigate the compound flood induced by six TCs in the Cape Fear estuary, with an emphasis on the effect of the rainfall structure on compound floods. Most of the existing models, however, are oversimplified in some parts or limited in the coupling degree. Particularly, an accurate estimation of the air–sea momentum exchange in extreme wind speeds (Zhang and Yu, 2024) has not been taken into consideration when modeling TC-induced compound floods.
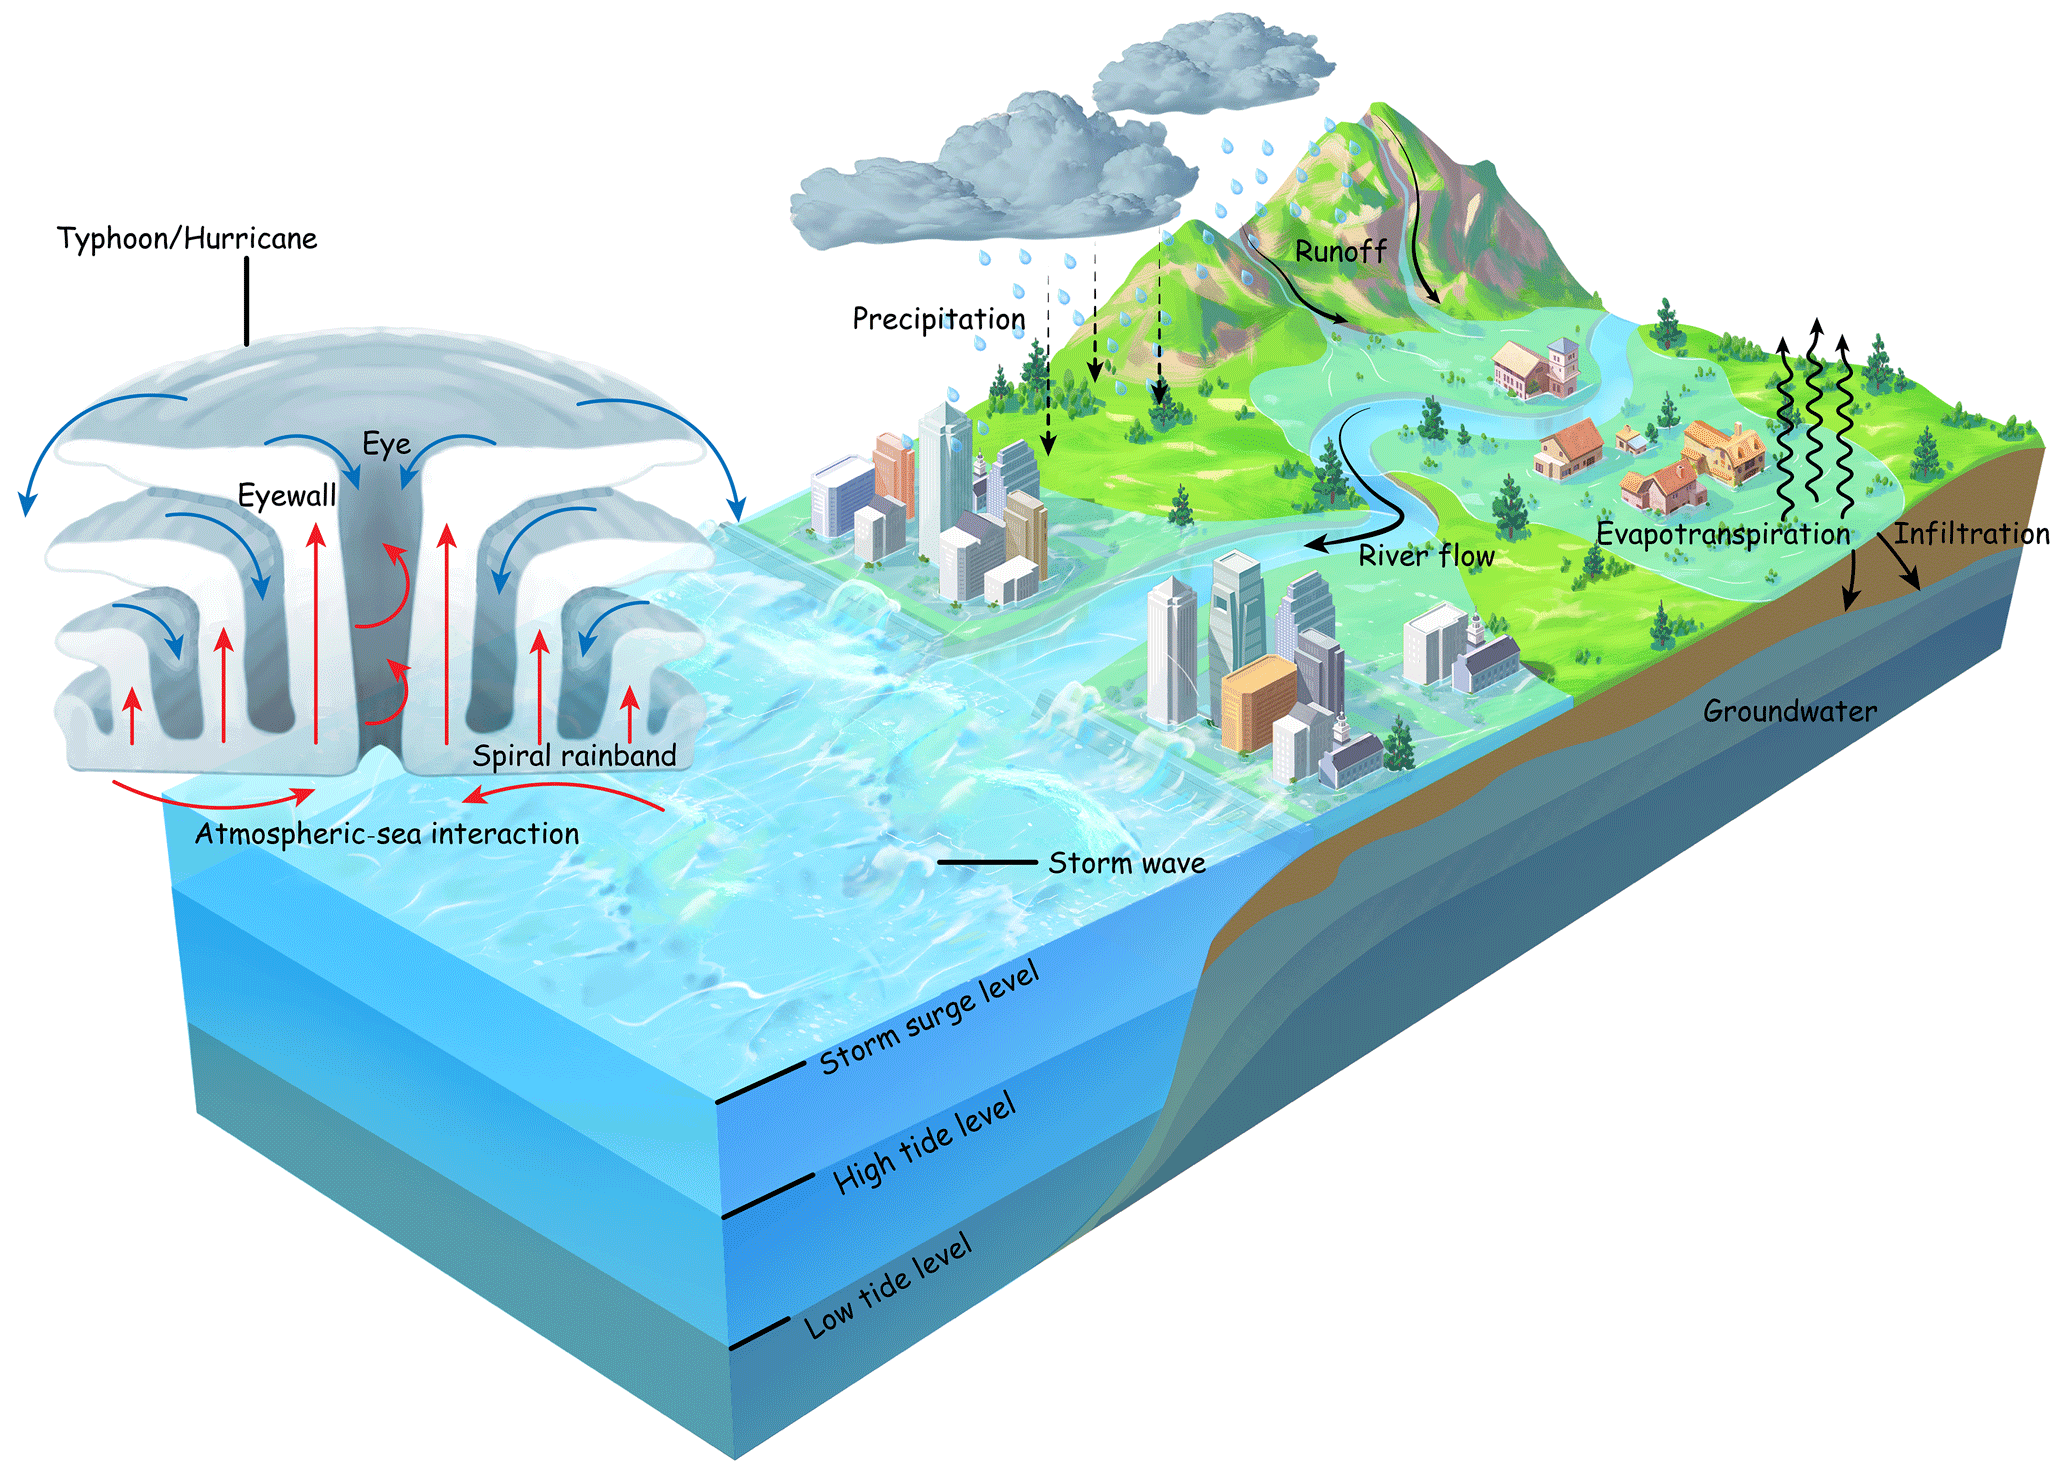
In this study, a land–river–ocean coupled model is developed that can comprehensively describe the dynamic details of storm surges, storm waves, astronomical tides, river flow, inundation, and precipitation, as well as their interactions (Fig. 1). An atmospheric wave boundary layer model is employed to improve the accuracy of the atmospheric forcing applied to the ocean. The coupled model is then applied to the simulation of TC-induced compound flooding in the Pearl River Delta. The computed water surface elevation, river discharge, and inundation areas during typical TC events are satisfactorily verified by measured data.
2.1 General description
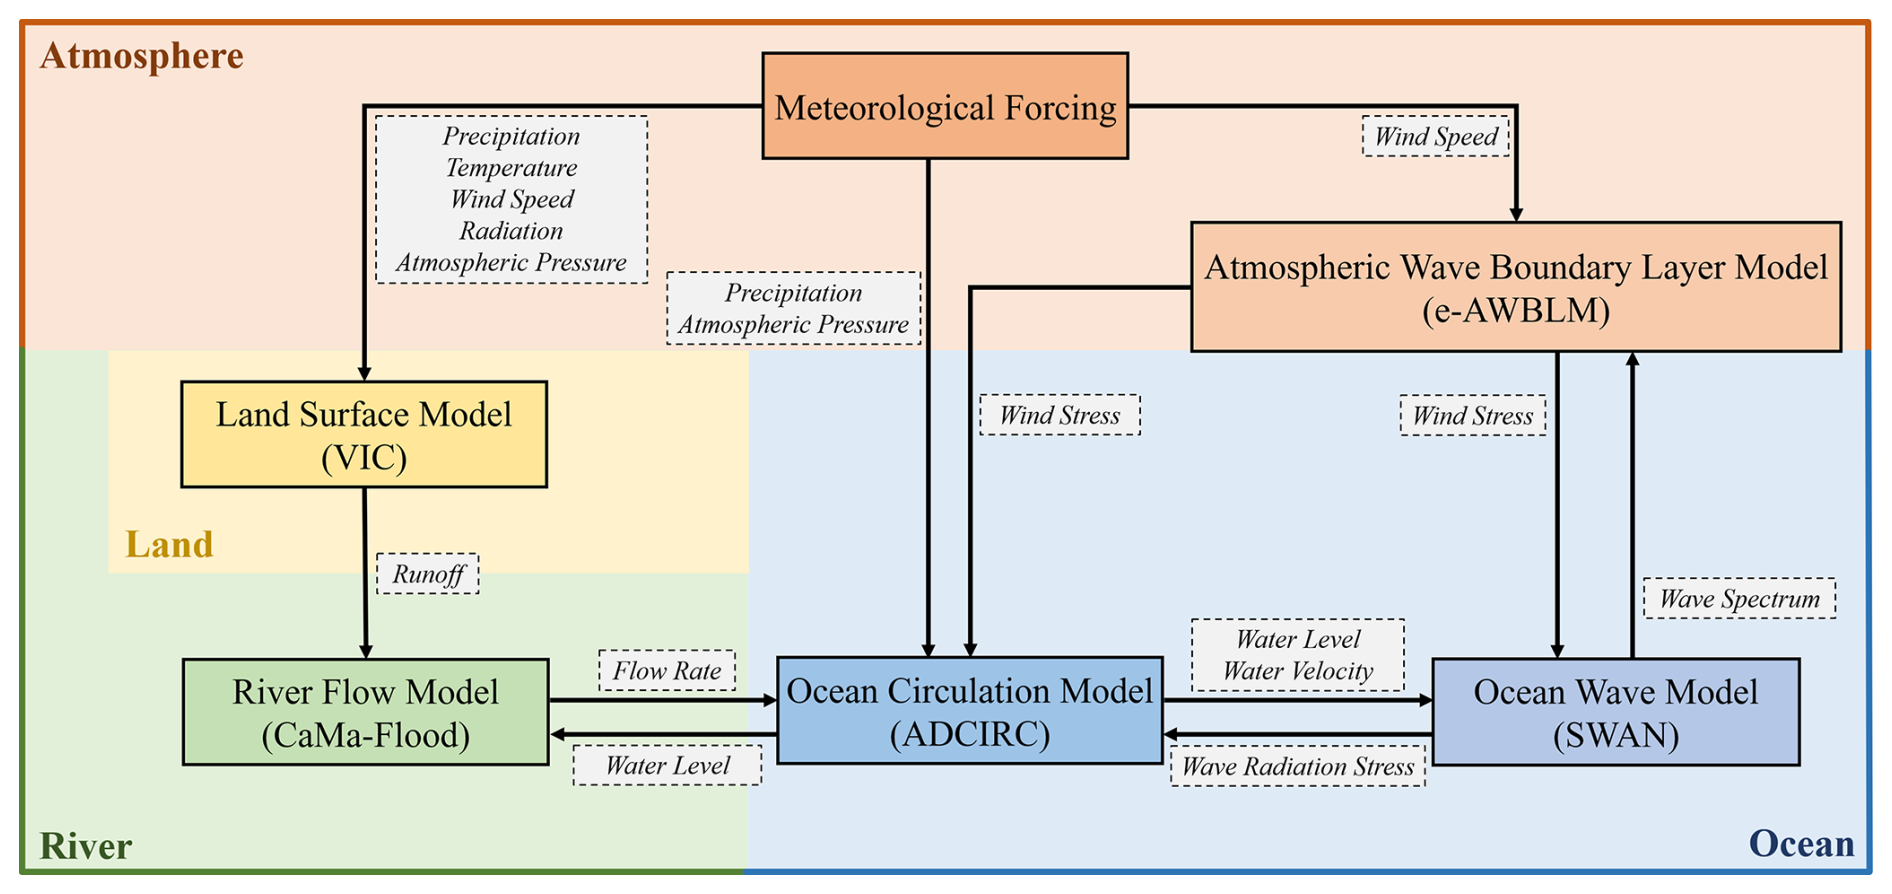
The coupled model system to be established in this study aims to correctly represent the temporal and spatial variation in the water surface elevation and flow rate in rivers and the coastal ocean, as well as in the inundation area if overflows occur, which are jointly caused by storm surges, storm waves, astronomical tides, river flow, and regional rainfall. The details of the model system, as well as the method of coupling, are shown in Fig. 2.
A complete model system may also require a general atmospheric circulation model, usually called a general circulation model (GCM) by meteorologists (Satoh, 2013), so that the wind flow velocity, atmospheric pressure, precipitation, etc., can be numerically determined. In the present study, however, the atmospheric forcing is directly derived from reliable reanalysis data for a past event, and it may have to be obtained with numerical weather prediction for a coming event. We may rely on an appropriate long-term climate model for a future scenario.
As a basic feature, we require that the model we established can resolve the instantaneous water surface elevation and flow rate caused by both astronomical tides and storm surges. The astronomical tides are considered to be oscillations forced at open boundaries. The storm surges are jointly caused by the wind shear at the air–water interface, the air pressure acting on the ocean surface, and the effect of the radiation stresses originating from the ocean surface waves. The storm waves should also be given attention not only because they contribute to the mean water level variation but also because they directly cause a significant elevation of the water surface. The storm-wave-induced water flows are not fully resolved in our model because their contribution to the wave-filtered water level is of a second order, meaning it is only enough to include the effect of wave radiation stress (Longuet-Higgins and Stewart, 1964; Dietrich et al., 2012a). Since the wind stress acting on the free water surface is an important parameter for both storm surge and ocean wave modeling, an enhanced atmospheric wave boundary layer model is necessary when considering the conditions of strong wind and shallow water (Zhang and Yu, 2024).
We also require that the model we established can accurately describe the physical process of the flow routing in the river system, consisting of main streams and their tributaries that receive runoff generated by a land surface model. The flow routing model, with which the water depth and the flow discharge must be determined, may be based on the governing equations for unsteady open-channel flows or a significantly simplified conceptual model preferred by applied hydrologists. The land surface model must be able to yield the runoff given the precipitation and other necessary parameters related to atmospheric forcing, land cover, and soil properties.
2.2 Components of the model system
2.2.1 Ocean circulation model
ADvanced CIRCulation (ADCIRC; Luettich et al., 1992), which solves the two-dimensional shallow-water equations, is adopted to determine the water surface elevation and the vertically averaged flow rate in the ocean. The shallow-water theory assumes that the water depth is much smaller than the length scale in the horizontal directions of the problem. Therefore, ADCIRC can represent only long waves, such as astronomical tides and storm surges, and not wind waves. The contribution of precipitation has been considered a source term in the mass conservation equation (Bilskie et al., 2021). The astronomical-tide-induced water surface elevation is forced at the otherwise undisturbed open boundaries. A smooth water surface and continuous flow rate are required at the boundary where the ocean circulation model and the river flow model match. Along the coastline, free run-up conditions are specified at beaches and no-penetration conditions are given at seawalls.
2.2.2 Ocean wave model
Simulating WAves Nearshore (SWAN; Booij et al., 1999) is utilized to predict the evolution of the phase-averaged wave energy spectrum, from which the wave height can be evaluated in a statistical sense. The governing equation of the model is based on the conservation of wave action, which is generalized from the conservation of wave energy when there is a steady current present. Wind energy input, wave energy dissipation, and wave energy redistribution due to nonlinear wave–wave interactions are treated as sources for wind wave development.
2.2.3 Atmospheric wave boundary layer model
The enhanced atmospheric wave boundary layer model (e-AWBLM; Zhang and Yu, 2024) is employed to estimate the wind stress acting on the ocean surface, which is an indicator of the intensity of momentum transfer through the air–sea interface and an important parameter in both the ocean circulation model and the ocean wave model. The model is essentially based on the momentum and energy conservation within the atmospheric wave boundary layer over the ocean surface. It was recently improved to correctly describe the effect of wave breaking under conditions of very strong wind and also the effect of finite water depth (Chen and Yu, 2016; Xu and Yu, 2021; Zhang and Yu, 2024).
2.2.4 River flow model
Catchment-based Macro-scale Floodplain (CaMa-Flood; Yamazaki et al., 2011) is chosen to determine the flow rate and water depth in the river system, consisting of a main stream and its tributaries. The model is based on a significantly simplified form of the basic equations for open-channel flows in order to achieve a high computational efficiency. The lateral inflow is given by a land surface model. The river mouth is connected to the ocean, and the matching boundary conditions must be satisfied. If truncated at any place, an inflow condition, called the river base flow, must be prescribed at the upper end of the main stream. A significant advantage of CaMa-Flood, compared to many other river flow models, is that inundation can be simulated.
2.2.5 Land surface model
Variable Infiltration Capacity (VIC; Hamman et al., 2018a), a distributed macroscale hydrologic model, is employed to estimate the runoff into the river system. The model takes key hydrologic processes, including evaporation, infiltration, moisture movement, and runoff generation, into consideration. With known meteorological forcings, the surface runoff and the base flow are evaluated based on the variable soil moisture capacity curve (Liang et al., 1994) and the ARNO model (Franchini and Pacciani, 1991), respectively.
This study hindcasts five TC events (Hagupit (2008), Koppu (2009), Vicente (2012), Hato (2017), Mangkhut (2018)) that caused destructive floods in the Pearl River Delta region in the past 2 decades to validate the effectiveness of the model in describing compound floods. The landfall intensity of Koppu (2009) is classified as typhoon (TY) and the other TC events are classified as severe typhoon (STY) according to the China Meteorological Administration (Lu et al., 2016). It is worth mentioning that all five TC events made landfall in the southwest part of the Pearl River Delta, with the right-front quadrant, i.e., the prolonged stronger-wind and lower-pressure conditions, covering the area under our consideration (Fig. 3a).
The boundary between rivers and the ocean is set at the cross-sections of the major tributaries of the river system where the 10 m topographic contour crosses. In the Pearl River Delta region, there are seven cross-sections, from which the discharge accounts for more than 97 % of the rainfall–runoff generated in the entire catchment (Fig. 3b).
3.1 Discretization of the river system
We discretize the seven sub-catchments, each with over 2000 km2 of drainage area controlled by the cross-section where a river flows into the ocean (Fig. 3b). In the VIC model, the soil with a three-layer structure and the surface vegetation are parameterized with OpenLandMap (Tomislav, 2018) and the Global Land Cover Facility (GLCF; Hansen et al., 2000), respectively. The soil properties, including infiltration capacity, saturated hydraulic conductivity, bulk density, and wilting point, are estimated according to the soil type (Twarakavi et al., 2010; Cosby et al., 1984). A database on global river widths for large rivers is used to estimate the width of large rivers, i.e., river widths larger than 300 m in this study (Yamazaki et al., 2014). For small rivers, the river width and the river depth are estimated with empirical formulas (Yamazaki et al., 2011). The meteorological forcings, including precipitation, wind speed, temperature, surface radiation, pressure, and humidity, are obtained from the ERA5-Land dataset (Hersbach et al., 2020). Square grid cells are adopted for both VIC and CaMa-Flood. The total number of land surface cells for VIC is 6141 with a spatial resolution of 5′, while the total number of river channel elements for CaMa-Flood is 14 397 with a spatial resolution of 3′. The computational time step is set to 1 h in VIC and 10 min in CaMa-Flood.
3.2 Discretization of the coastal ocean
An unstructured mesh covering the Pearl River Delta region, which consists of very complex river networks, is carefully built (Roberts et al., 2019; Qiu et al., 2022). The land–ocean boundary extends from the coastline to the inland location to which the 10 m contour reaches in order to fully include the floodplain (Fig. 3c). The shoreline of the South China Sea is obtained from GSHHG (Global Self-consistent, Hierarchical, High-resolution Geography Database), and the outline of the river network at Pearl River Delta is obtained from OpenStreetMap. The bathymetry data are from two different sources. The bathymetry of the open sea is obtained from GEBCO (General Bathymetric Chart of the Oceans), which provides the global ocean bottom elevation with a spatial resolution of 15′. The bathymetry of the Pearl River Delta, which has a higher resolution of 80 m, is obtained from the Pearl River Water Resources Commission with special permission. FABDEM (Forest And Buildings removed Copernicus DEM; Hawker et al., 2022), which removes trees and buildings to represent bare-land terrain, is utilized to determine the land elevation. The mesh resolution along the river and tributaries is refined to 50 m to resolve storm surge propagation within the river system and inundation over the land (Fig. 3d). The computational domain consists of 1 413 038 elements and 721 704 nodes. The bottom friction of the land region is estimated based on Manning friction law. In the ocean circulation model, spatial variations in the hydraulic roughness are considered based on the variability in the land cover type (Mattocks and Forbes, 2008; Yang and Huang, 2021). The spatial variation in the land cover type and the relevant value of the Manning coefficient are shown in Fig. S1 and Table S1 in the Supplement.
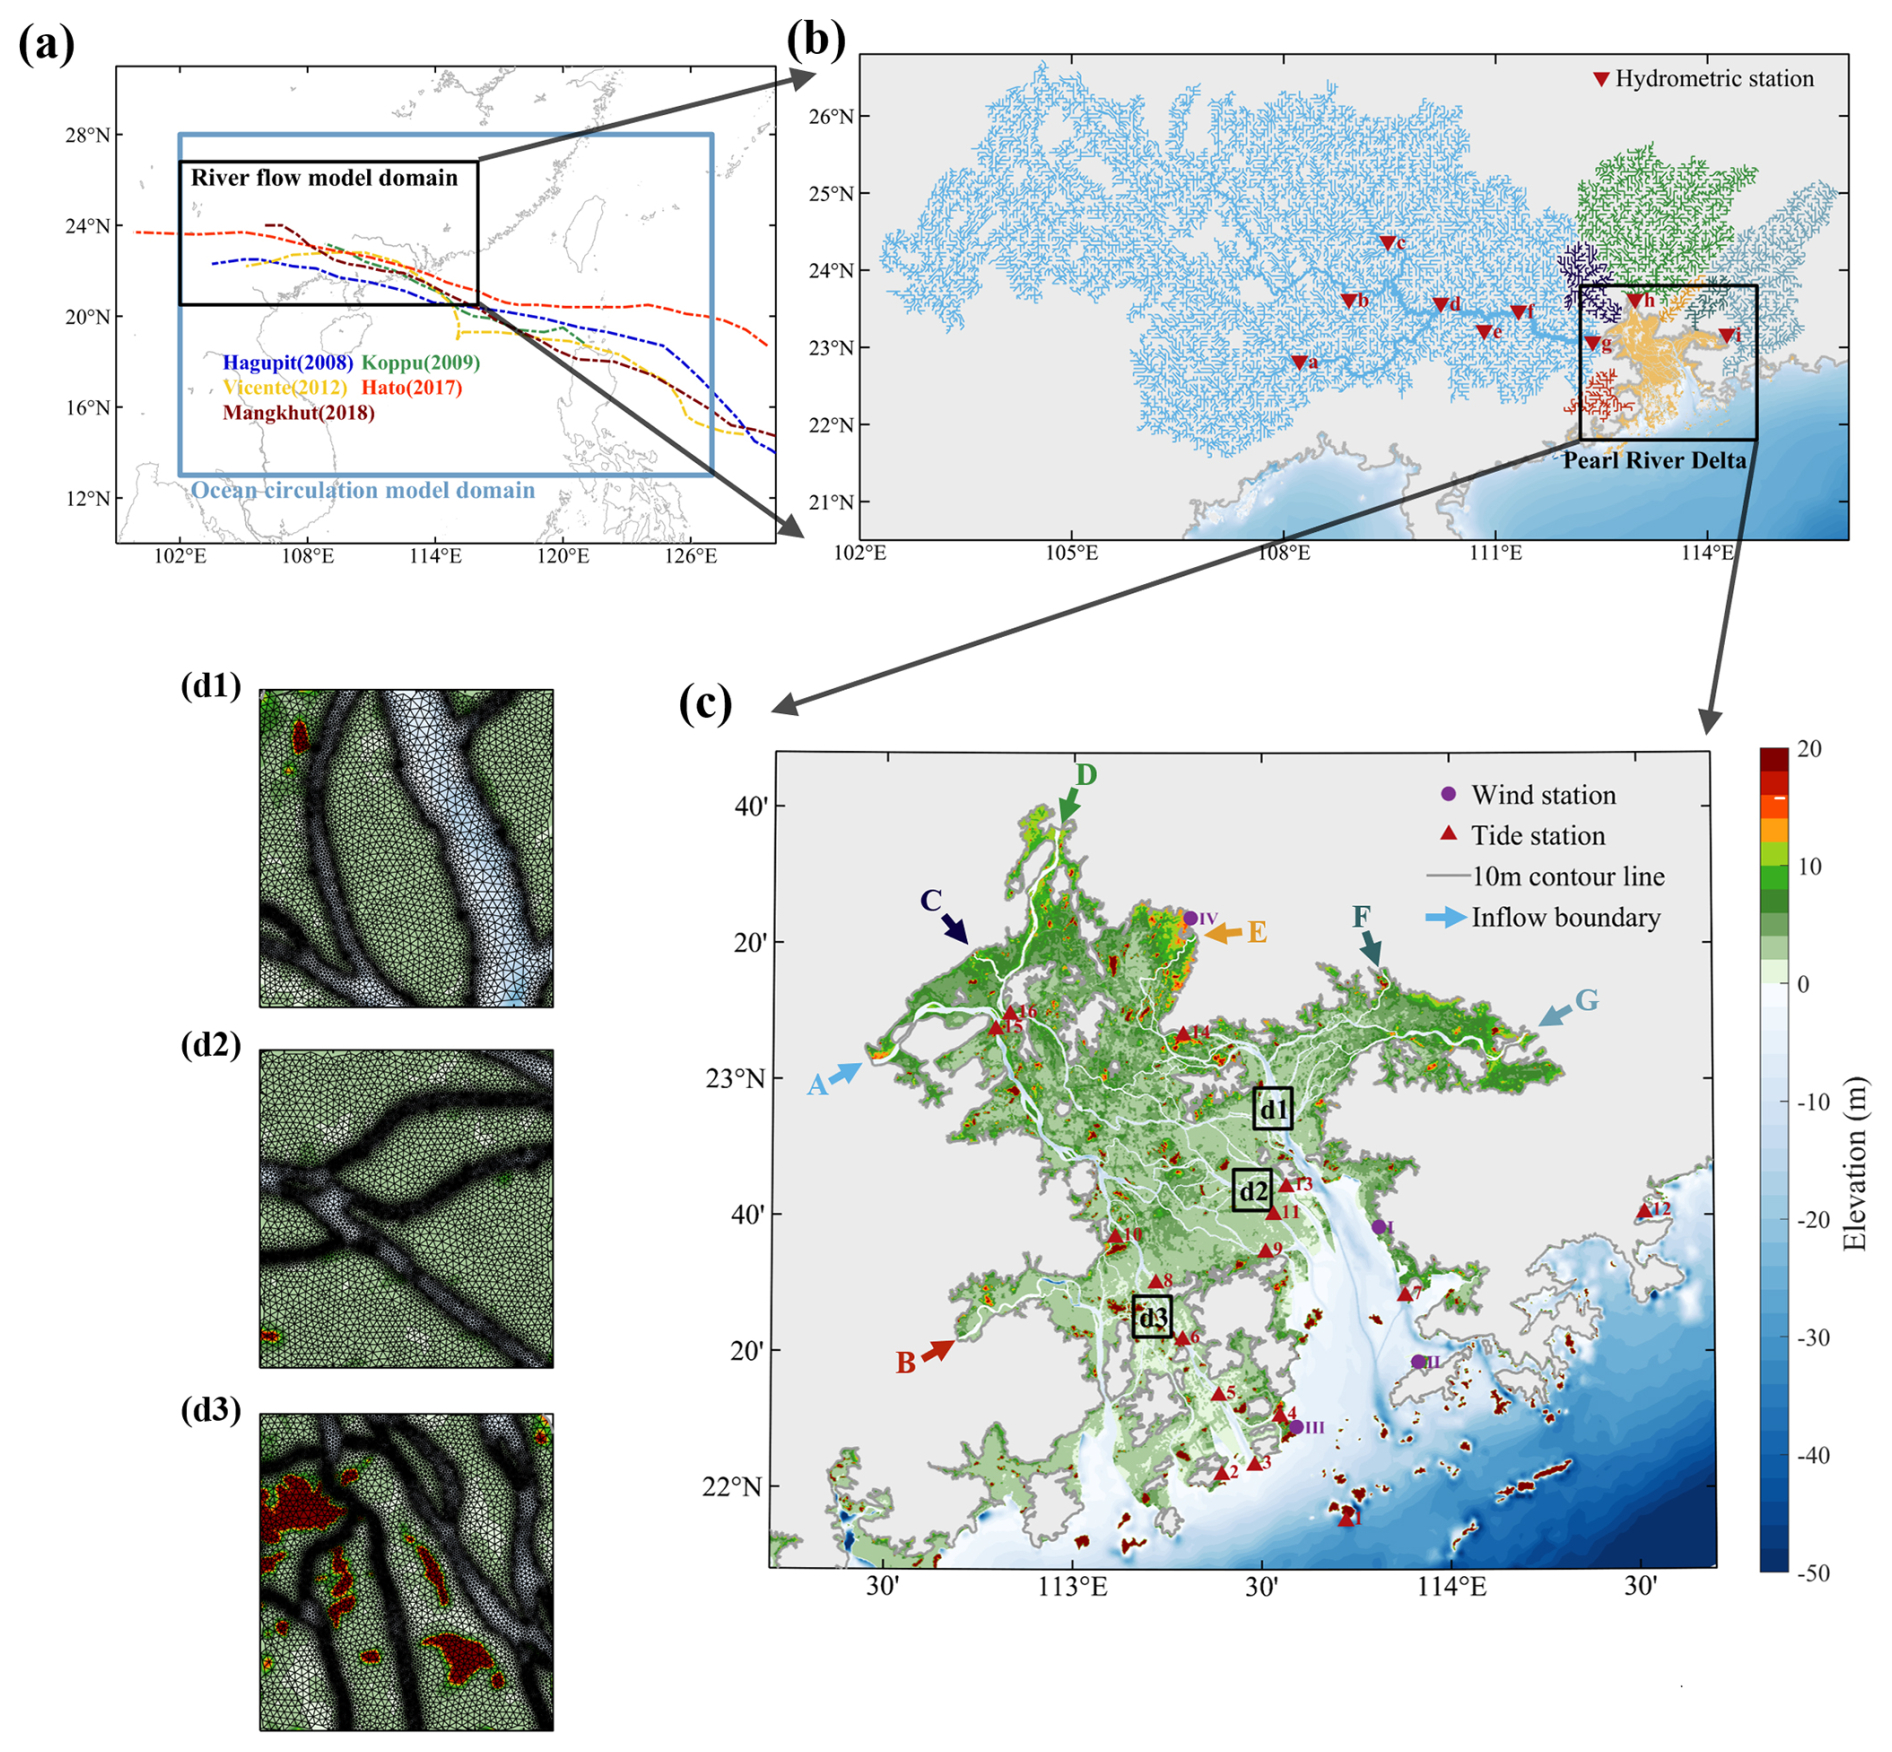
Figure 3Detailed depiction of the compound flood model applied in the Pearl River Delta. (a) The computational domain and the tracks of selected TCs. (b) The river network in the seven sub-catchments of the Pearl River basin. The inverted red triangles marked with a–i are the locations of discharge stations. (c) Elevation of the Pearl River Delta region used in the ocean circulation model. The red triangles marked with 1–16 are the locations of tide stations. The purple circles marked with I–IV are the locations of meteorological stations. The arrows marked with A–G are the inflow boundaries. The color of the river networks in (b) corresponds to the inflow boundaries in (c). (d) Enlarged views of the refined mesh along the river channel.
Note that the seven inflow boundaries in the ocean circulation model are also the outflow boundaries of the relevant sub-catchment in the river flow model. The computational time step for coupling at the river–ocean confluences is set to 1 h. The astronomical tide, which consists of 13 tidal constituents (M2, S2, N2, K2, K1, O1, P1, Q1, MF, MM, M4, MS4, and MN4) from TPXO (Egbert and Erofeeva, 2002a), is forced hourly at the open boundary. Moving boundaries in ADCIRC are treated with the conventional dry-and-wet approach. For numerical stability, the drying and wetting threshold is set to 0.1 m, and the computational time step is set to 1 s in ADCIRC. SWAN is dynamically coupled with ADCIRC every 10 min. In SWAN, the frequency range is set to 0.0157–1.57 Hz and the directional resolution is set to 10°. The data required to run the model, except for the high-precision bathymetry data for the delta region, are all publicly available and globally covered, which means that the model established in this study has potentially global applicability.
Parametric models are employed to determine the wind velocity and the air pressure within a circular area surrounding the TC center obtained from the best-track dataset (Lu et al., 2016). More specifically, the wind velocity and the air pressure are computed using the empirical models proposed by Emanuel and Rotunno (2011) and Holland (1980). The radius of max wind speed in the models is estimated using the formula proposed by Willoughby and Rahn (2004). When applied to the ocean circulation model and ocean wave model, the inflow angle (Bretschneider, 1972), the translational velocity of moving TCs (Jelesnianski, 1966), the spatial conversion factor (Georgiou et al., 1983), and the time conversion factor (Powell et al., 1996) are involved to obtain the 10 m–10 min (10 m above the mean sea level and 10 min average) wind velocity field. Far away from the TC center, the meteorological forcings are derived from the reanalysis data in ERA5 (Hersbach et al., 2020). The eventual forcing fields are then weighted by the empirical results and reanalysis data in terms of the distance from the position of interest to the TC center (Carr and Elsberry, 1997). Detailed information on the construction of the meteorological forcings due to the presence of TCs can be found in previous studies (Lin et al., 2012; Yang et al., 2019; Xu and Yu, 2023; Zhang and Yu, 2024). The wind velocity fields are validated as demonstrated in Figs. S2–S6.
4.1 River discharge
The river flow model is validated by comparing the computed and measured daily discharge at nine hydrometric stations (Fig. 4). The simulated results show satisfactory agreement with measured data in general, with a Willmott skill level of 0.960. Exceptions are noted at the upstream stations such as Qianjiang and Liuzhou during the dry season. The discrepancy is considered to be caused by an omission of the reservoir operation further upstream of the Pearl River basin. It is worth emphasizing that the model is capable of capturing the peak discharge events rather accurately.
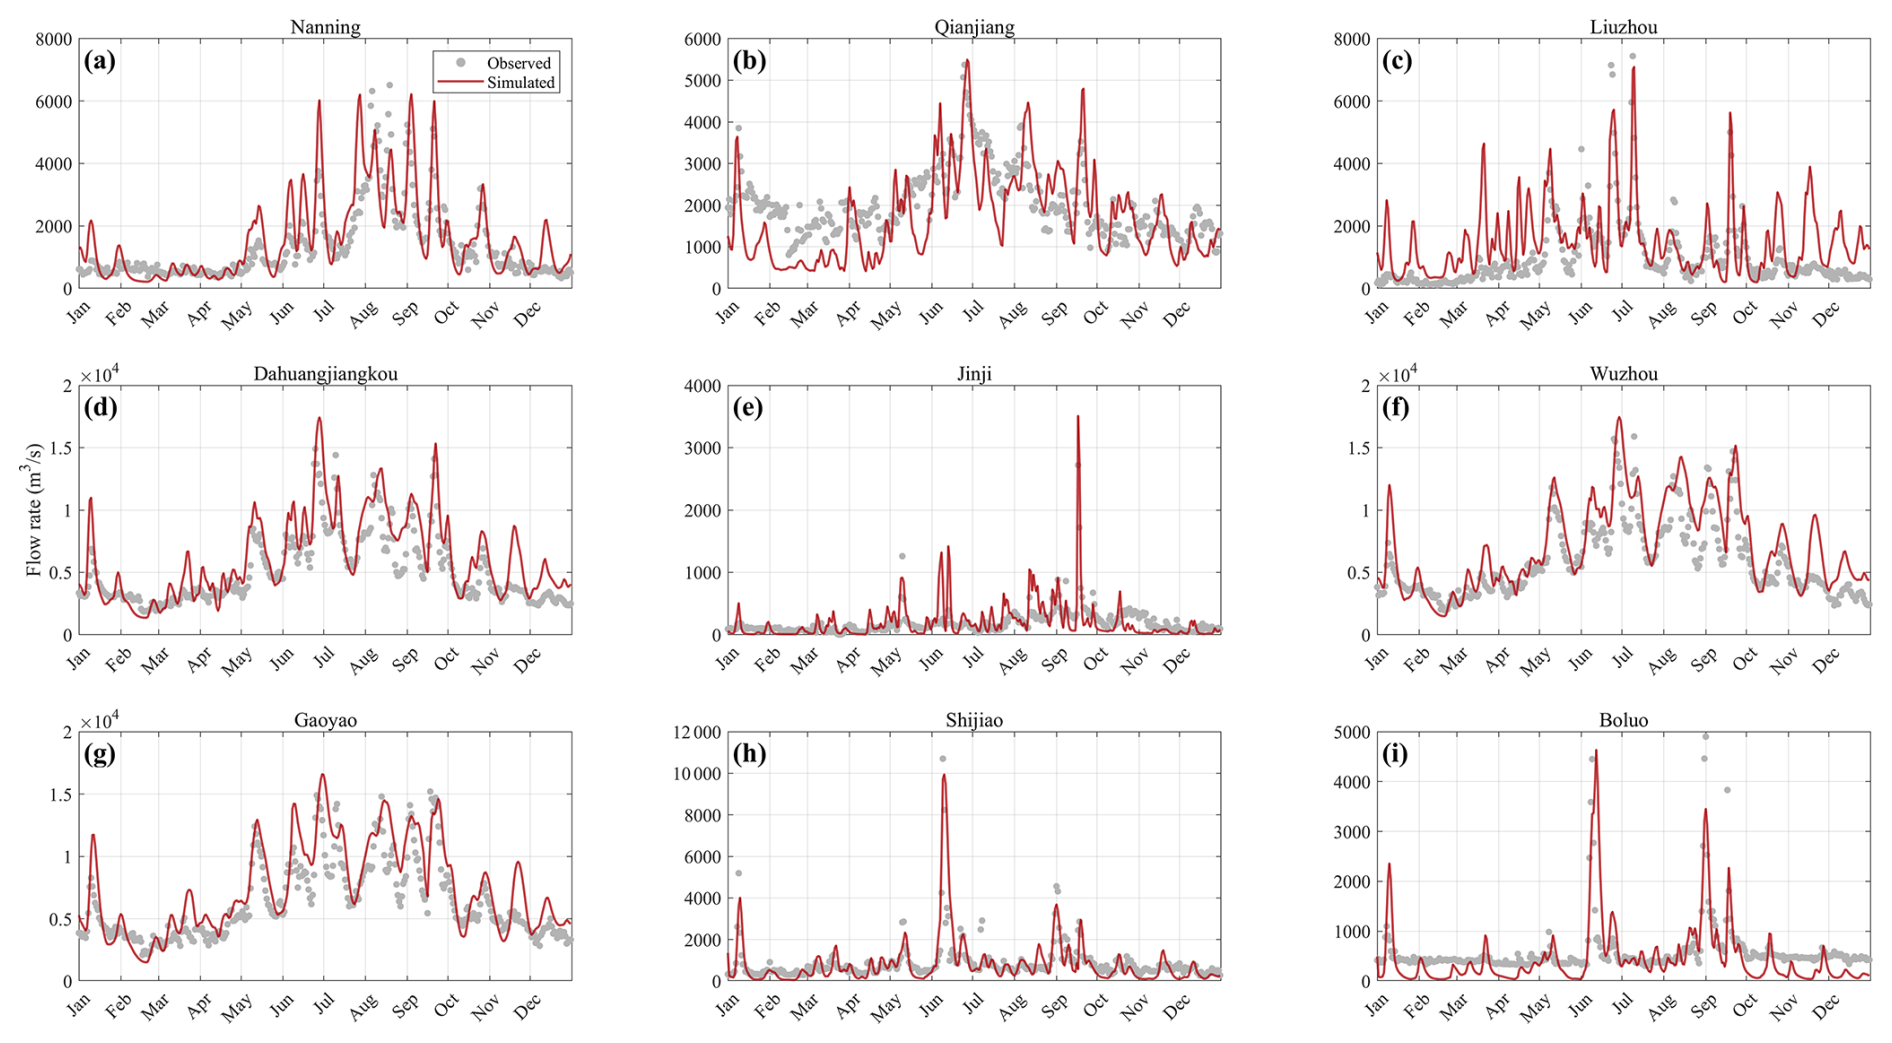
Figure 4The simulated (red lines) and observed (gray points) river flow rate in 2018 compared at different stations.
4.2 Storm surge
The computed water level elevation due to storm surges is compared with the observations at the tide gauge stations, as shown in Fig. 5. The agreement between computational and observational results is very good in general. Some discrepancies at particular places are known to be caused by a mismatch between available topographic data and the actual situation due to human activities (Zhang et al., 2021). It is worth mentioning that all storm surges nearly coincided with the high tide level, especially during Typhoon Mangkhut (2018) and Typhoon Hagupit (2008). Since the maximum surge levels are the primary concern from a disaster prevention point of view, good agreement between the computed and observed maximum surge levels, with a Willmott skill level of 0.887, is very important. To emphasize the advantage of an improved description of the air–sea momentum exchange, the wind drag formula of Garratt (1977), which is a default setting in ADCIRC, is also used to hindcast the selected storm events (Fig. 6). It is clearly shown that the maximum surge levels obtained with e-AWBLM are more accurate. We may also have to mention that our coupled model overestimates the maximum surge level by about 0.5 m at stations 15 and 16 during Typhoon Hato (2017). Even so, the present results are significantly better when compared to the previous ones, which were overestimated by about 2 m (Qiu et al., 2022; Zhang and Yu, 2024). Previous overestimations are partially due to an incomplete coupling between river and coastal flows and partially due to an omission of possible inundation. In Fig. S7, we demonstrate the effect of the completeness of the coupling method on storm surge simulation. The one-way coupling approach is shown to overestimate the maximum surge levels and the surge recession phase. This overestimation is related to a fake accumulation of storm water at the ocean side of the river–ocean boundary in the one-way coupling approach.
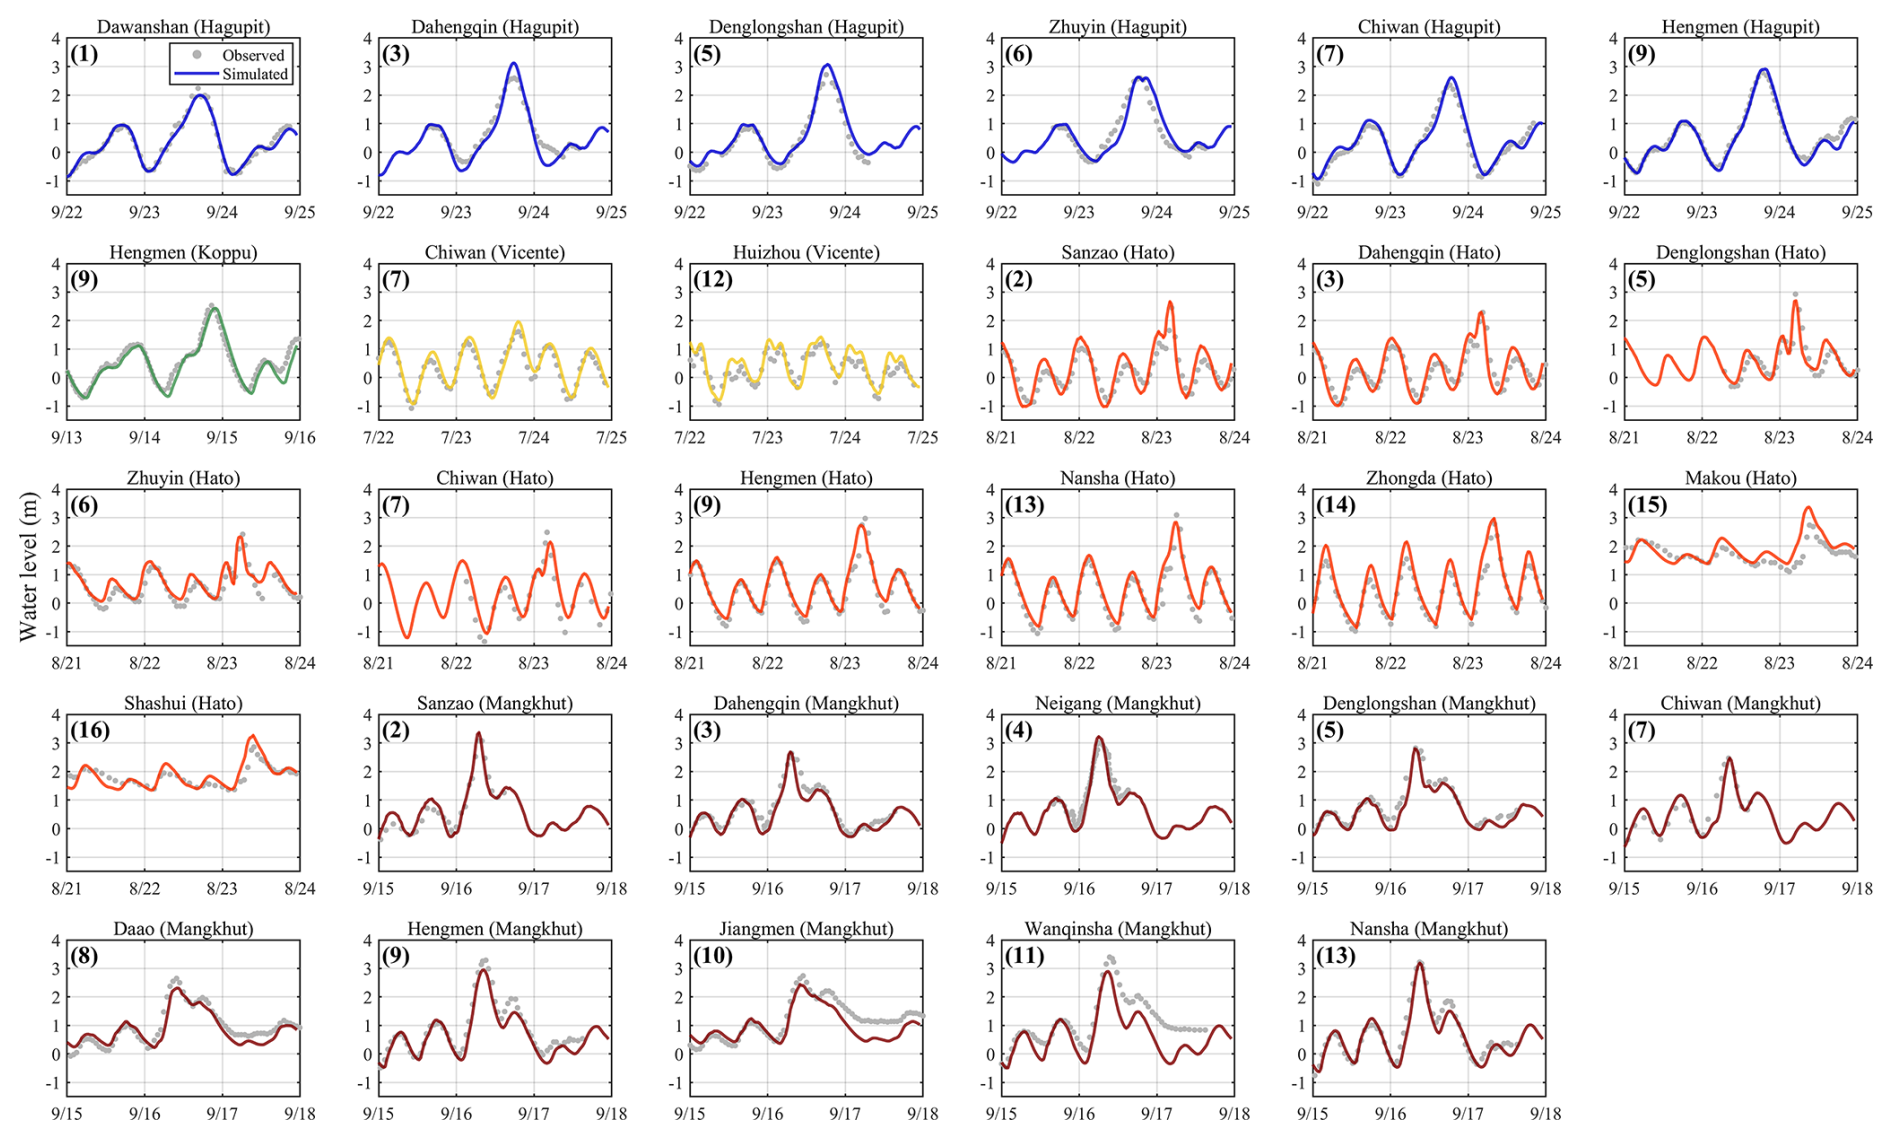
Figure 5The simulated (solid lines) and observed (gray points) storm tides compared for selected typhoons.
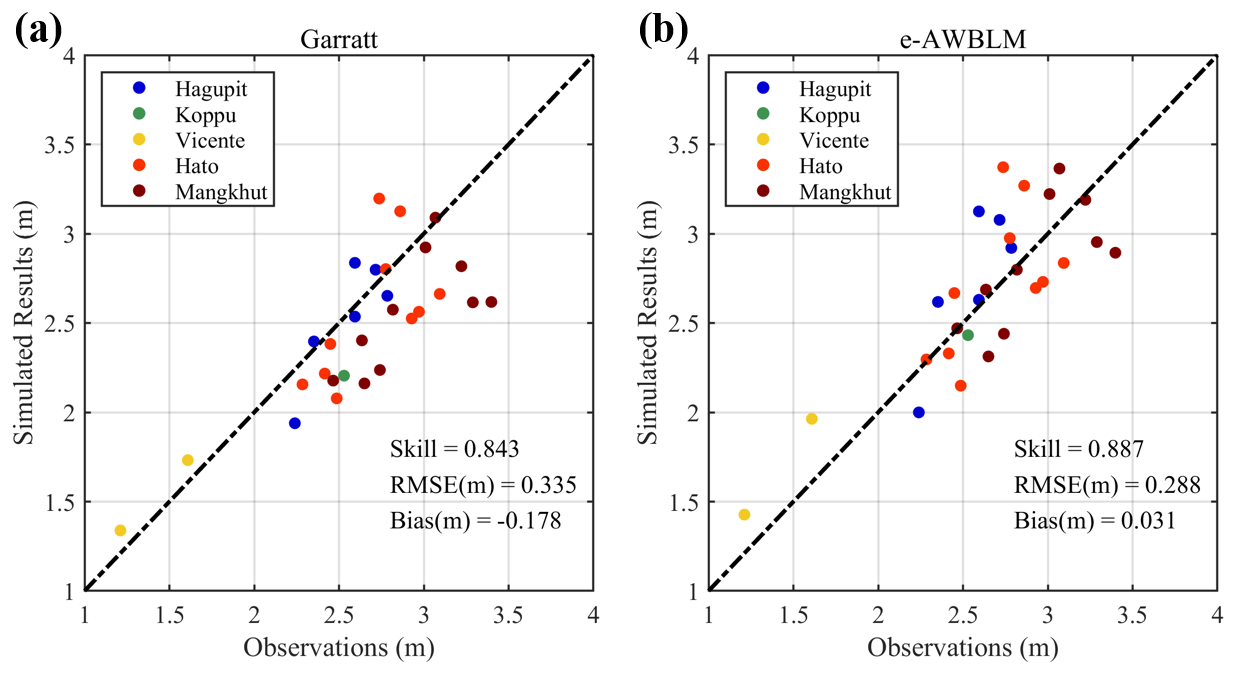
Figure 6The simulated maximum surge levels are compared with observations according to two methods: (a) Garratt (1977) and (b) e-AWBLM.
4.3 Inundation
We employed the daily Moderate Resolution Imaging Spectrometer (MODIS, https://ladsweb.modaps.eosdis.nasa.gov, last access: 30 May 2025) dataset, with a resolution of 500 m, to identify inundation areas during each typhoon event. Starting from the landfall time of each typhoon, 7 d is selected for each event to ensure a comprehensive assessment of the inundation extent. Despite some problems caused by cloud cover, remote sensing techniques have been widely used for flood identification (Brakenridge et al., 2013). The identification approach and threshold utilized in this study followed Tellman et al. (2021).
The computed inundation area during Typhoon Mangkhut (2018) is compared with the satellite results derived from MODIS, as presented in Fig. 7. Comparisons for other typhoon events are demonstrated in Figs. S8–S11. We introduce two metrics to assess the performance of the numerical model in describing inundation. The common area of the remotely sensed and numerically simulated flooded areas is defined as the verified zone. R1 represents the proportion of the verified zone to the remotely sensed flooded area, while R2 represents the proportion of the verified zone to the numerically simulated flooded area. As shown in Figs. 7 and S8–S11, the numerical model leads to satisfactory results for inundation areas. Most of the flooded regions identified by remote sensing are covered by the simulated results, as indicated by an average value of R1 equal to 0.79. On the other hand, the simulated flooded area is usually broader than that obtained with remote sensing, indicated by an average value of R2 equal to 0.51. Given that the cloud cover removal technique of Tellman et al. (2021) is known to result in an underestimation of the flooded area, it is rather reasonable that the numerically simulated inundation range exceeds the remotely sensed area to some extent.
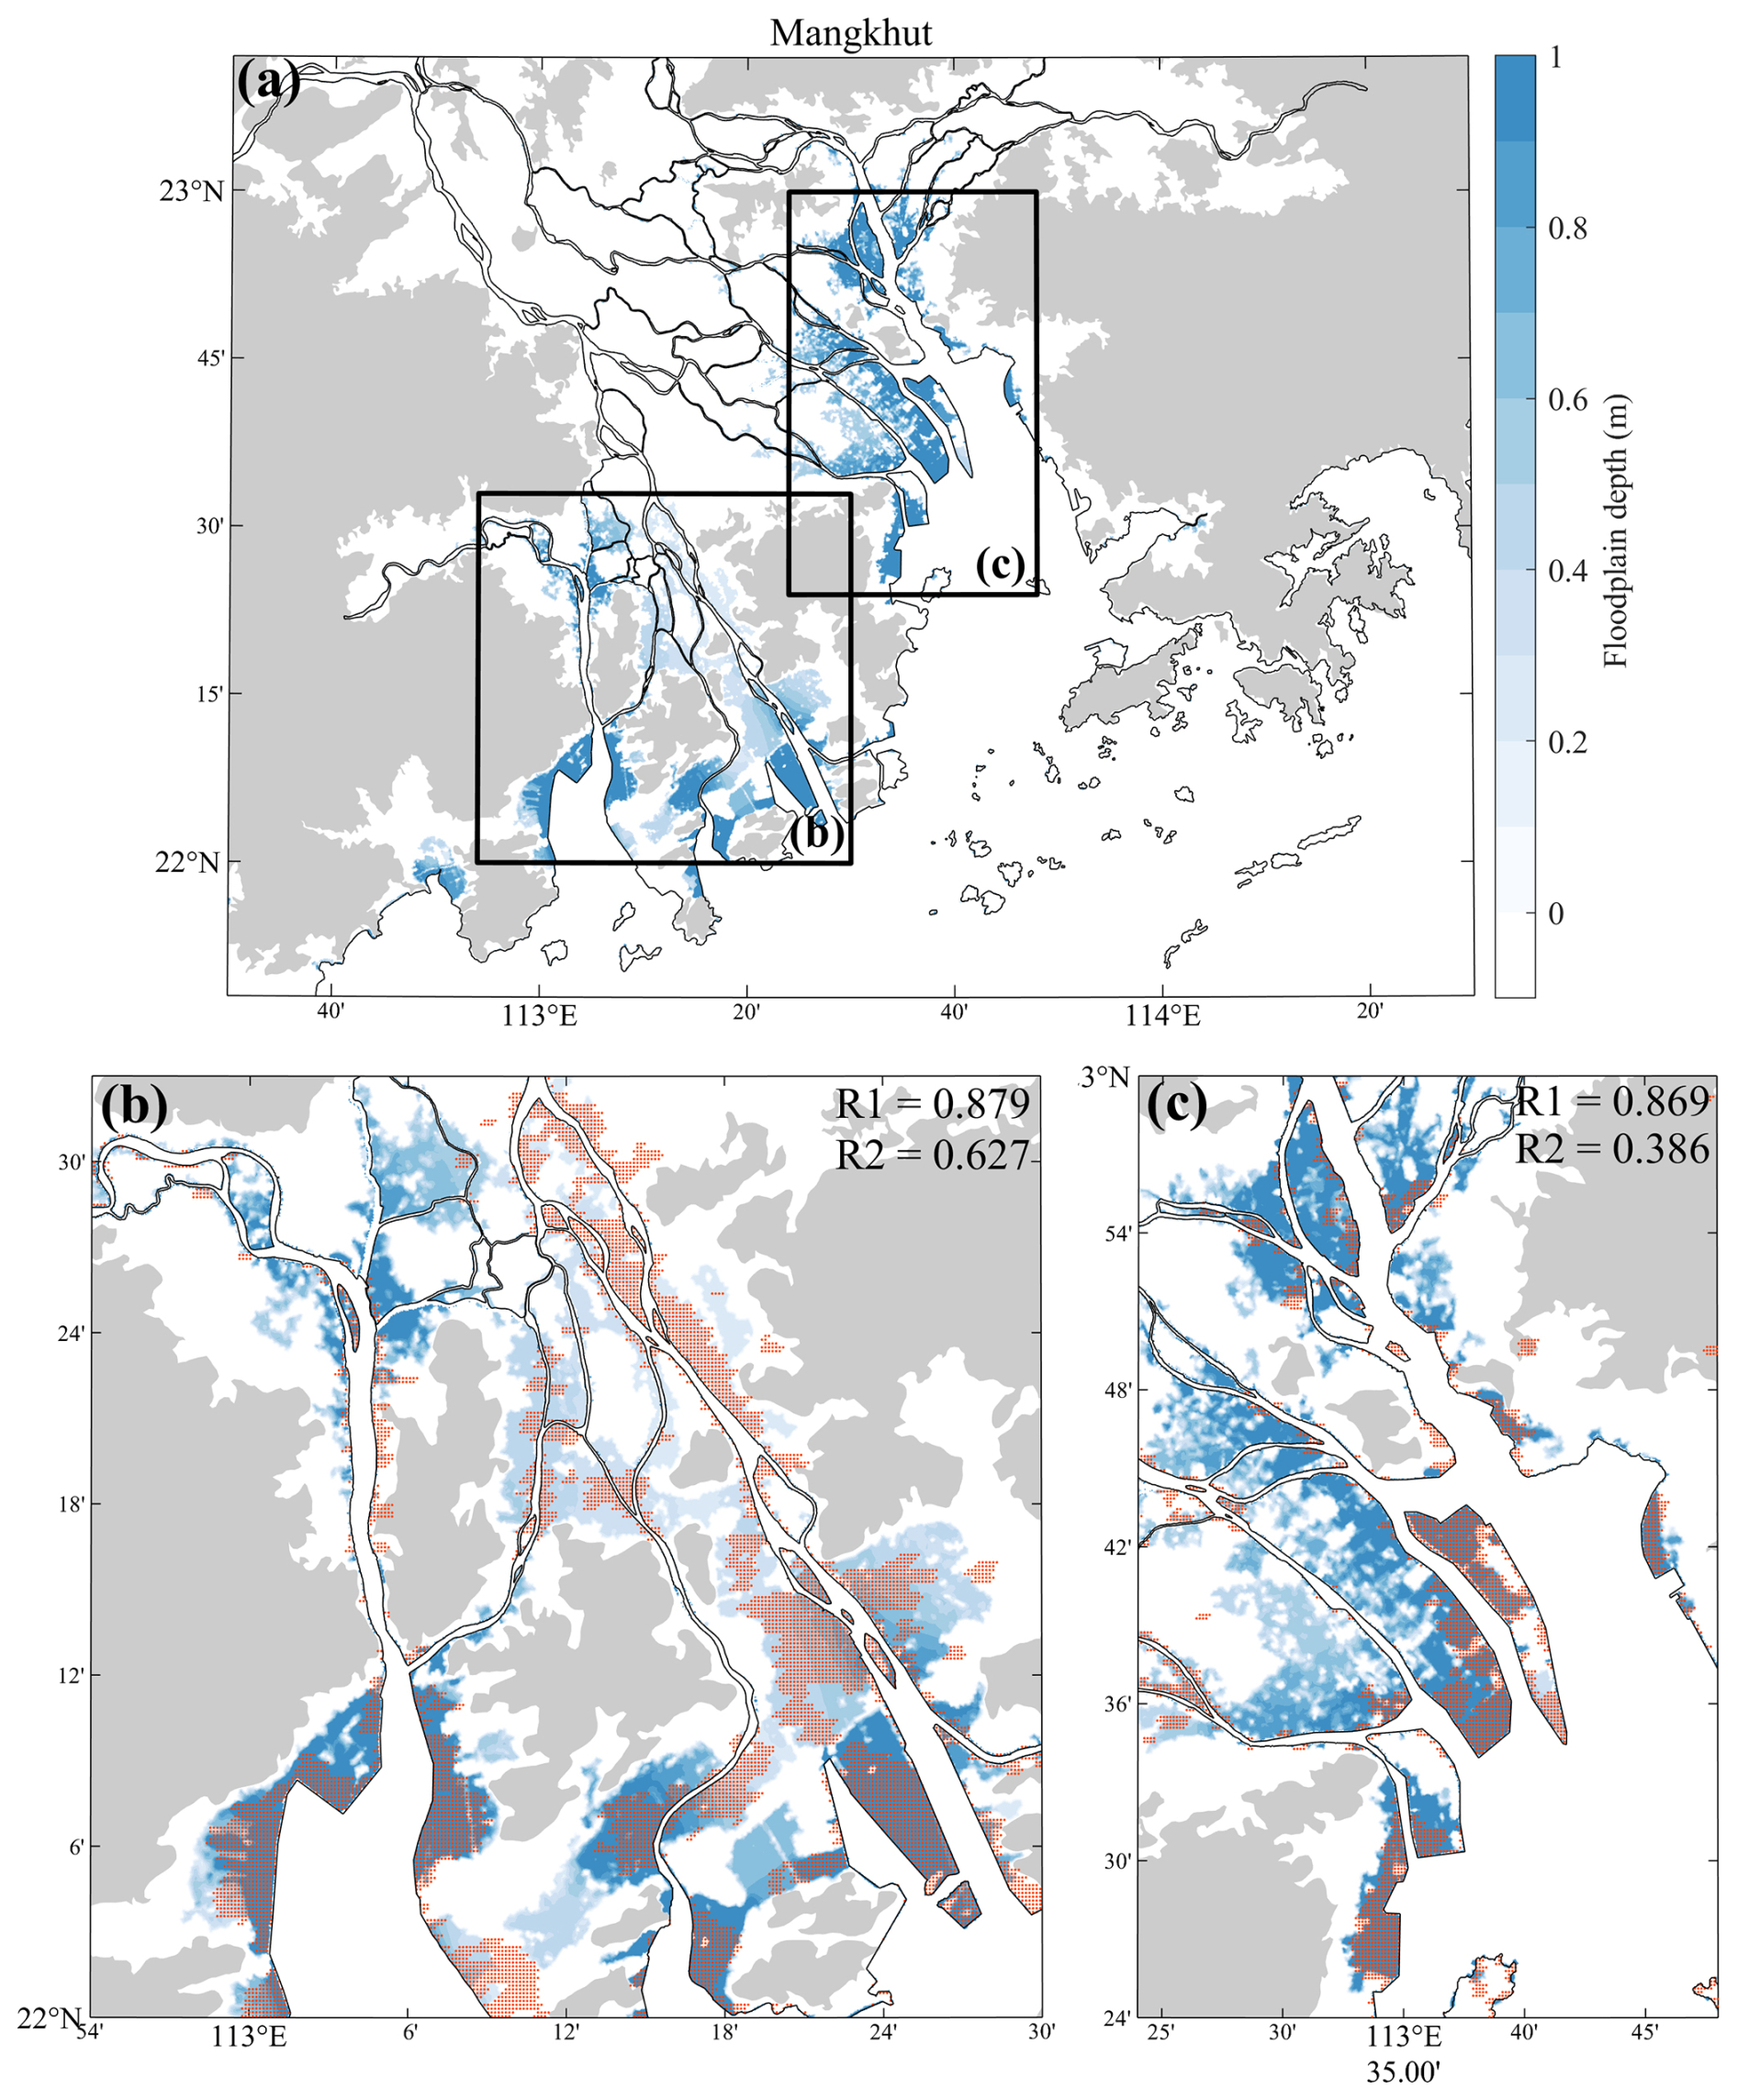
Figure 7A contour plot (blue) of simulated inundation depth caused by Typhoon Mangkhut. The orange dots show the inundation range estimated by MODIS datasets.
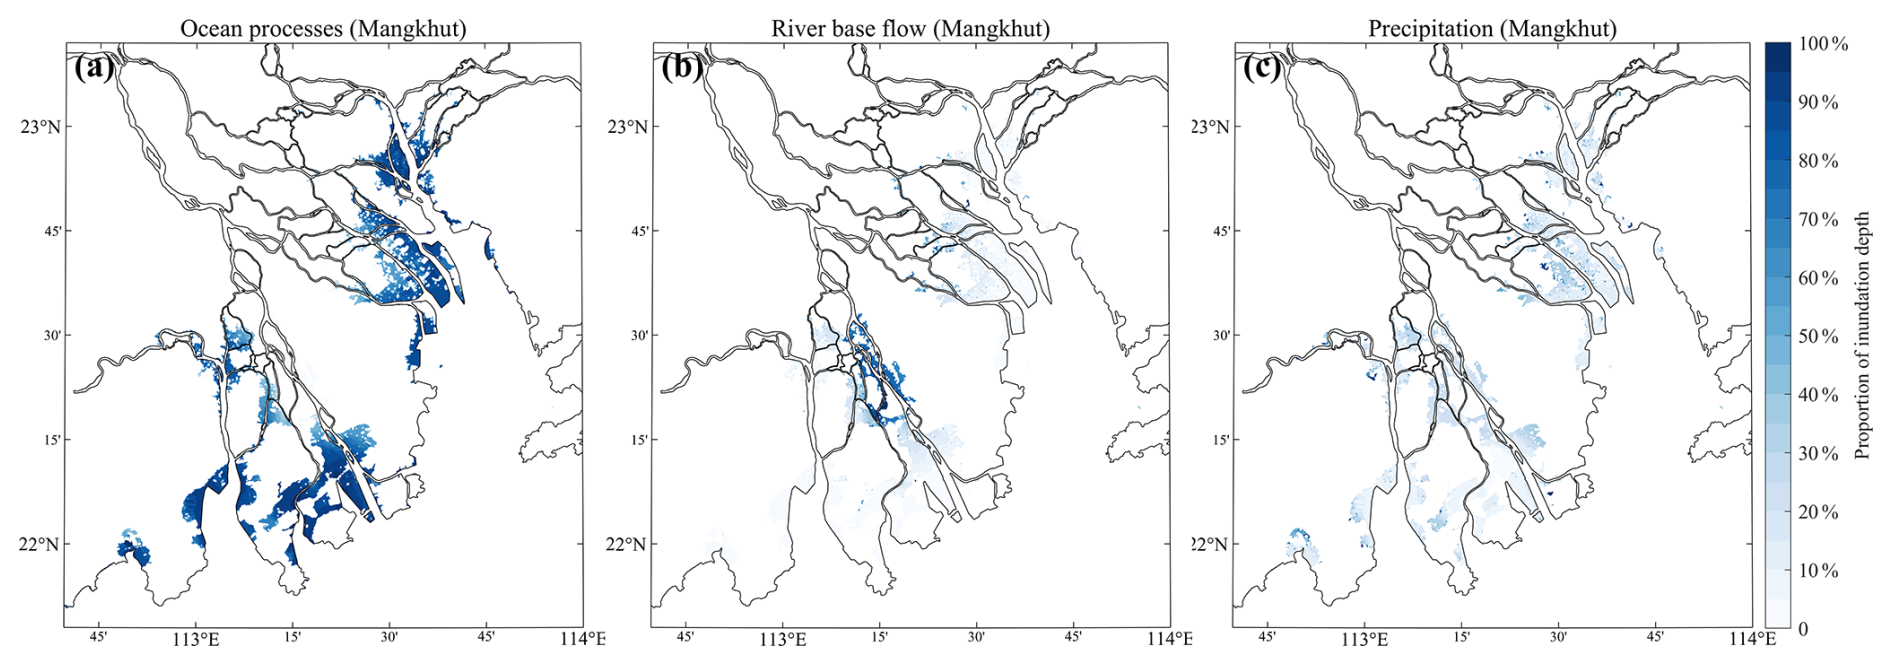
Figure 8The spatial distribution of inundation depth due to (a) ocean processes, (b) river base flow, and (c) precipitation during Typhoon Mangkhut (2018).
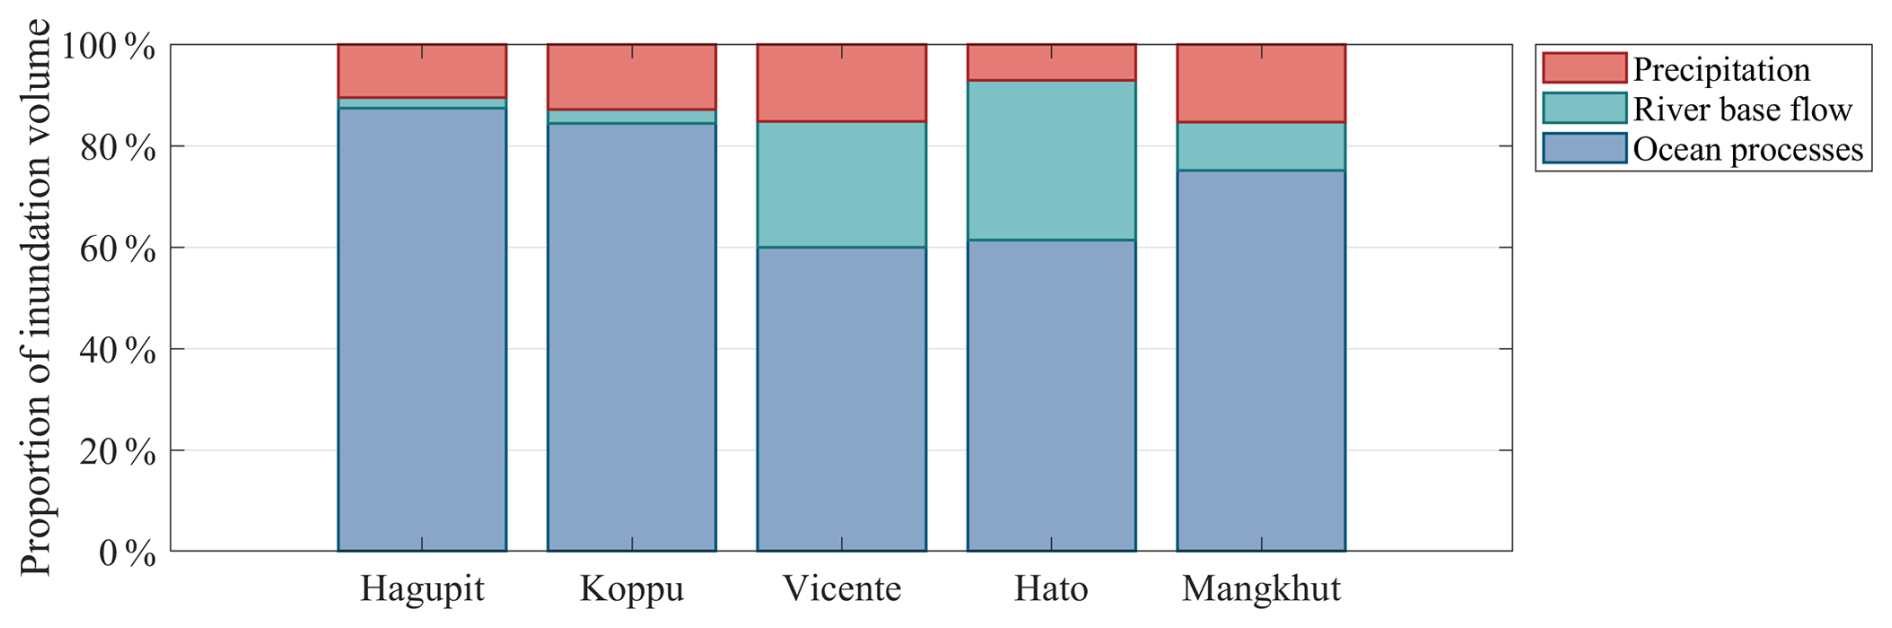
Figure 9The attribution of flooding volume to ocean processes, river base flow, and precipitation during disastrous typhoon events.
5.1 Attribution analysis of compound floods
It may be useful to understand the contribution of the land, river, and ocean processes to a compound flood in the Pearl River Delta region (Fig. 3c). For this purpose, two additional scenarios are computed for each typhoon case, i.e., ocean processes plus river base flow only and ocean processes plus precipitation only. To isolate the contributions of precipitation and river base flow, we can thus subtract the results of these two scenarios from the inclusive results (ocean processes plus river base flow and precipitation). The residual may then be attributed to the ocean processes, which include storm surges, storm waves, and astronomical tides. It is worth acknowledging that the nonlinear interactions among the various contributing factors are completely neglected in such an approach (Bilskie and Hagen, 2018). Nonetheless, it is still reasonable to consider the ocean processes to be the dominant contributor to the compound flood and discuss the additional roles of precipitation and river base flow in the ocean processes.
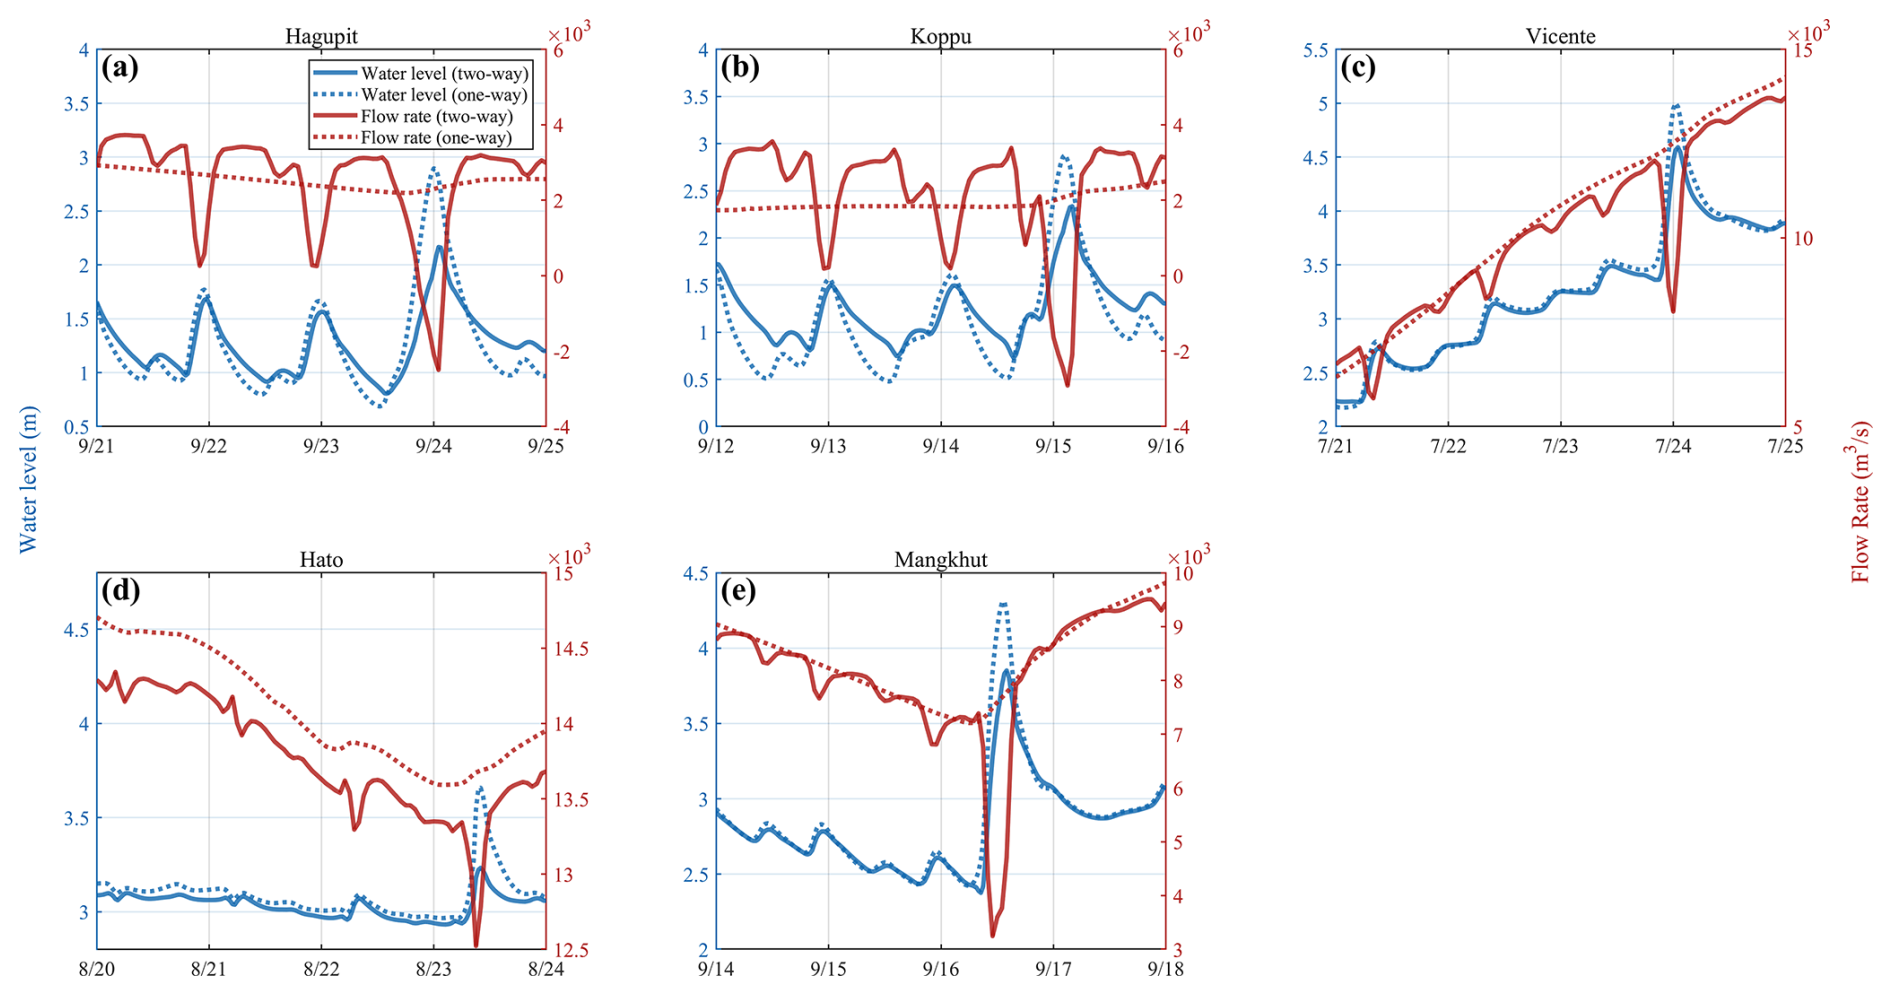
Figure 10The water level and flow rate at coupled boundary A (Fig. 3c). The solid lines and dashed lines are the results of two-way and one-way coupling approaches, respectively.
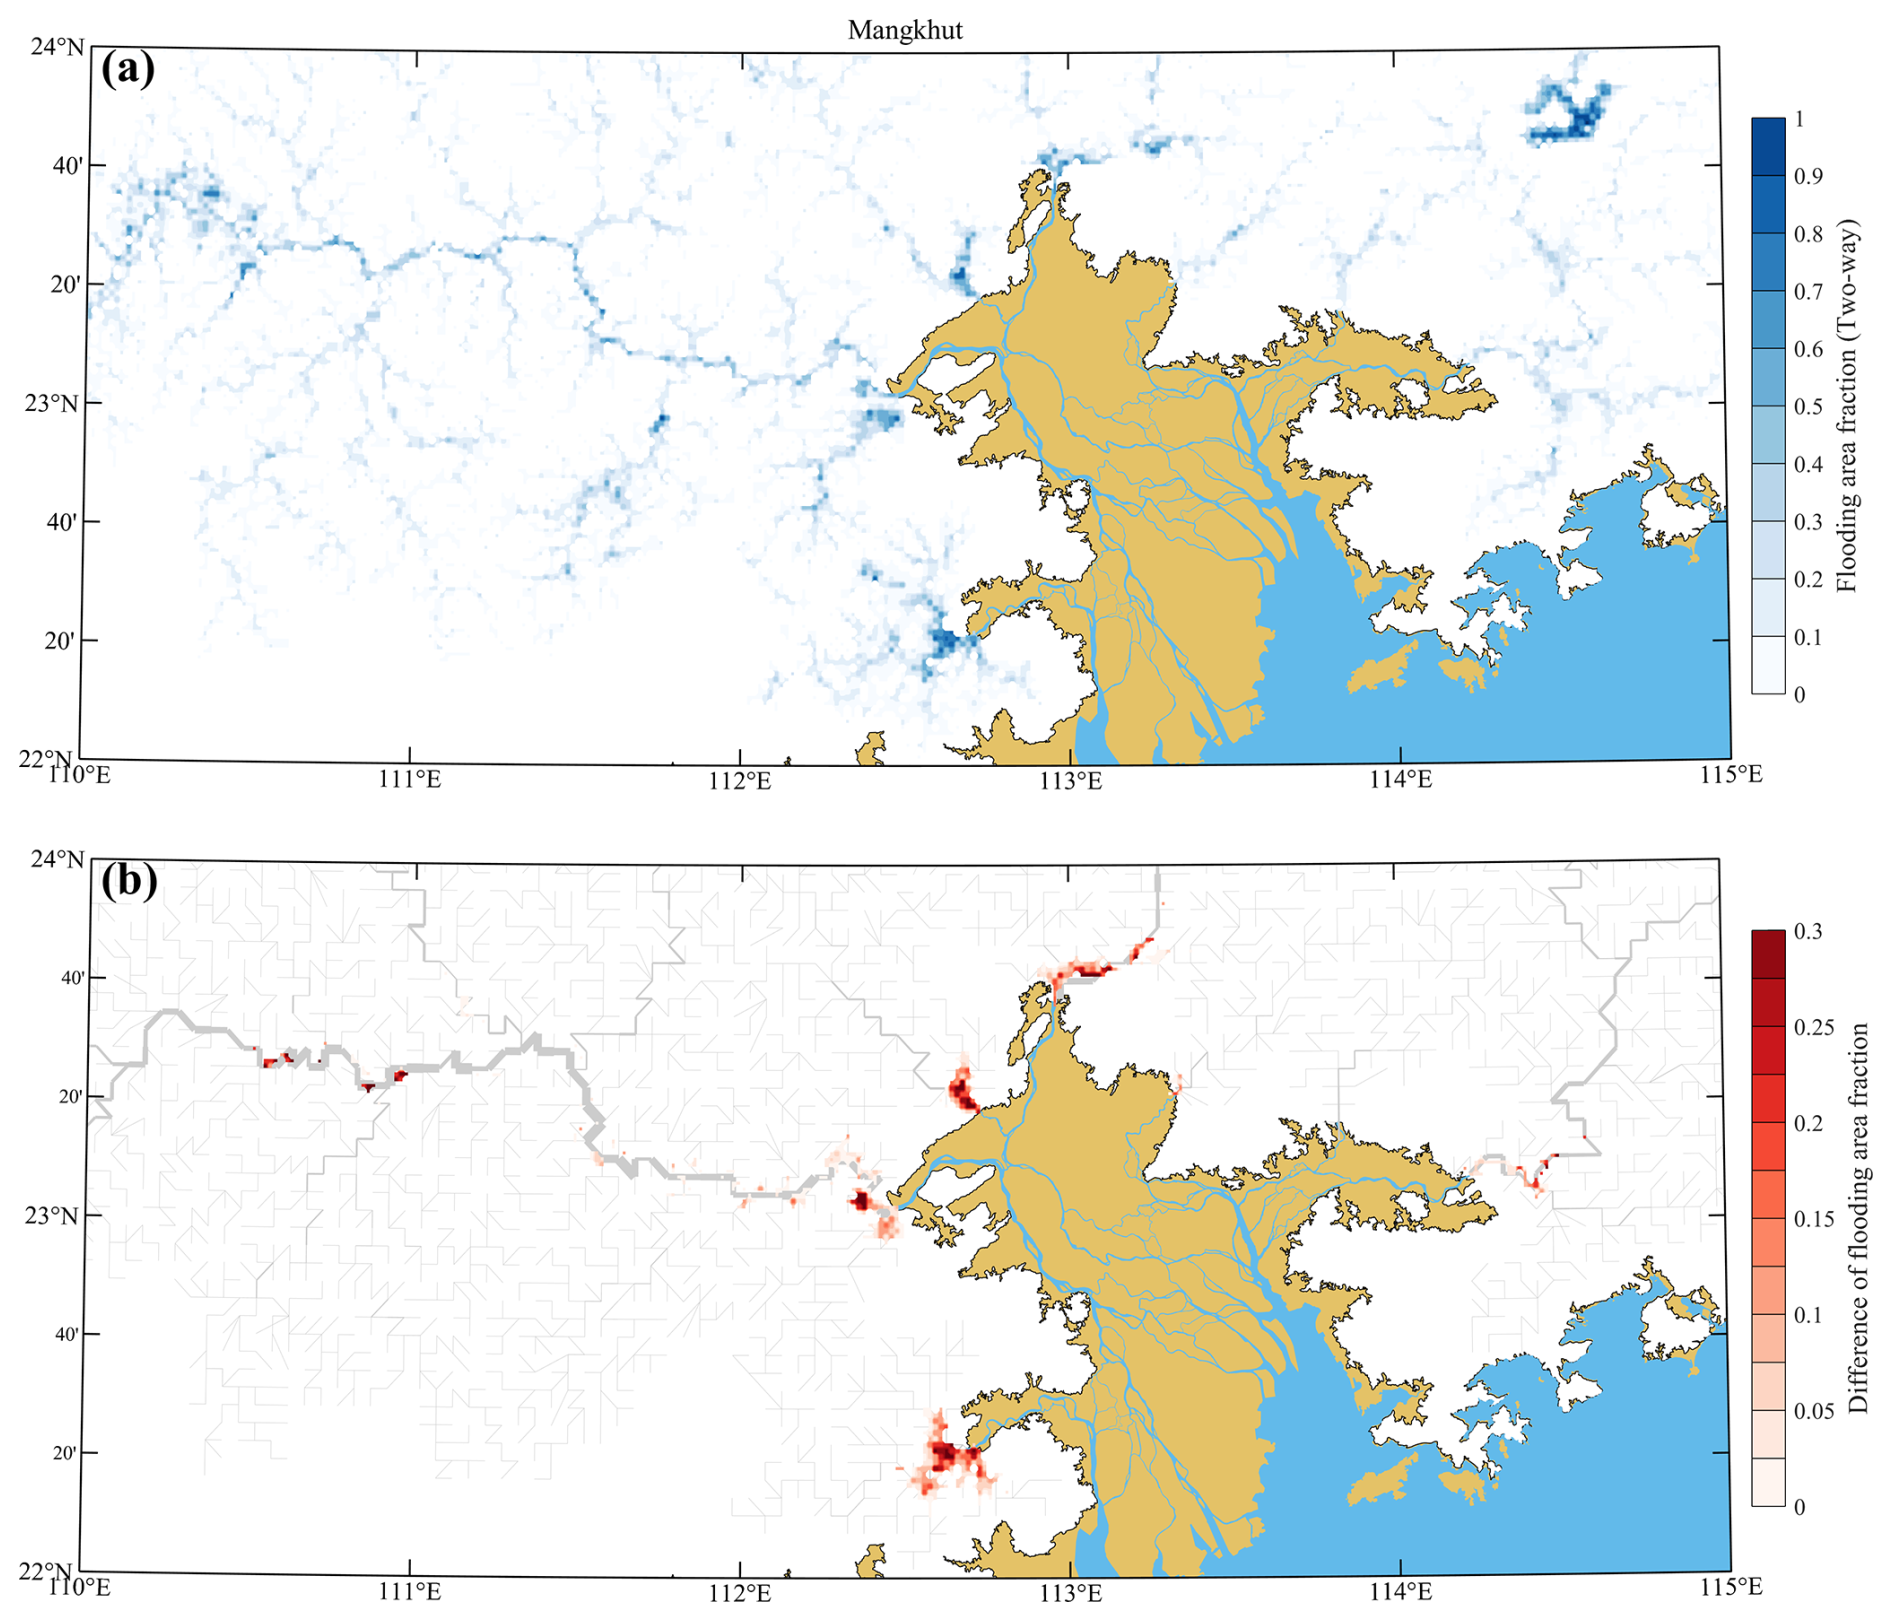
Figure 11(a) The fraction of flooded area during Typhoon Mangkhut (2018) estimated by the CaMa-Flood model with the two-way coupling approach. (b) The difference in the fraction of the flooded area between the two-way and one-way coupling approaches. The river channels are marked with gray lines, with the width of the river channel indicated by the line thickness.
The spatial distributions of the inundation depth due to the ocean processes, the river base flow, and the precipitation during Typhoon Mangkhut (2018) are presented in Fig. 8. The distributions of the inundation depth during other typhoon events can be found in Figs. S12–S15. It is demonstrated that the ocean processes, as anticipated, cause inundation near the coastline. In most cases, the inundation areas due to ocean processes account for over 90 % of the total inundation areas (Fig. 8a). River base flow, on the other hand, plays a vital role in the upstream regions along the river channels (Fig. 8b). Precipitation affects a broader area but with some concentrations in locally lower inland regions (Fig. 8c).
These distribution characteristics remain almost the same for all typhoon events, although some quantitative discrepancies do exist among different events. For instance, Typhoon Hagupit (2008), which was more significantly affected by ocean processes, caused heavy flooding in coastal regions (Fig. S12), while Typhoon Hato (2017), which occurred when the river base flow was considerably strong, resulted in a large inundation area in inland regions (Fig. S15).
To further quantify the contribution of each factor, we estimate the inundation volume due to the precipitation, the river base flow, and the ocean processes based on numerical results presented in Figs. 8 and S12–S15. For all typhoon events under our consideration, the flooding volume caused by precipitation is relatively small, ranging from 5 % to 15 %. In contrast, the ocean processes are responsible for more than half of the flooding volume. Inundation caused by river base flow varies from approximately 30 % during Typhoon Vicente (2012) and Typhoon Hato (2017) to around 2 % to 10 % during Typhoon Hagupit (2008), Typhoon Koppu (2009), and Typhoon Mangkhut (2018) (Fig. 9). Note that Typhoon Vicente (2012) and Typhoon Hato (2017) made landfall on 23 July and 22 August, respectively, when the daily average discharge of the river base flow was 10 975 and 13 389 m3 s−1, respectively. In contrast, Typhoon Hagupit (2008), Typhoon Koppu (2009), and Typhoon Mangkhut (2018) made later landfall, on 23, 14, and 16 September, respectively, when the daily average river discharge was 2967, 2829, and 7172 m3 s−1, respectively.
5.2 Comparison of two-way and one-way coupling
Existing coupled models for simulating compound floods often adopt the one-way coupling approach; i.e., the river flow model transfers information to the ocean circulation model without receiving feedback (Deb et al., 2023; Gori et al., 2020b; Du et al., 2024; Bakhtyar et al., 2020). To illustrate the differences between the two-way and one-way coupling between the river flow model and ocean circulation model, the discharge and water level at cross-section A, where the largest sub-catchment meets the ocean (Fig. 3b and c), are compared in Fig. 10. The actual discharge shows rhythmic fluctuations due to the influence of astronomical tides, which are omitted in the one-way approach. This may lead to an underestimation of the extent of inland inundation resulting from the river flow model on some occasions. The compound flood induced by the ocean processes and rainfall–runoff resulting from the river flow model is shown in Figs. 11 and S16–S19, where the inundation area is mainly located along the river channels. Compared to the two-way model, the one-way coupled model significantly underestimates the inundation area, especially near the boundaries where rivers meet the ocean. It may be interesting to note that the ocean surface oscillations affect a longer distance of the tidal river when the river flows are relatively weak (Figs. 11, S16, and S17) and vice versa (Figs. S18 and S19).
A land–river–ocean coupled model is developed in this study for simulating compound floods, considering the possible effect of storm surges, astronomical tides, storm waves, precipitation, and river flow. In the proposed model, the air–sea interactions, as well as the river–ocean interactions, are given special attention. It is demonstrated that the coupled model provides a more physically reasonable description of the complex interactions among various flood processes and more accurate numerical results while maintaining satisfactory computational efficiency. The model is applied to the hindcasting of the compound floods induced by five typhoon events that occurred in the Pearl River Delta region. The numerical results obtained on river flow and ocean surface elevation are shown to agree well with observations for all cases. The coastal inundation area obtained with the model covers approximately 80 % of the area identified through remote sensing, which is a significant success considering that incomplete cloud cover removal leads to an underestimation of the remotely sensed flooded area. Based on numerical results from the coupled model, the contribution of land, river, and ocean processes to compound floods can be assessed in the Pearl River Delta region. The ocean processes are demonstrated to be the dominant contributor in all events, while the land and river processes also play indispensable roles. It is shown that the one-way coupling approach results in an underestimation of the inundation area given by the river flow model owing to the absence of feedback from the ocean circulation model. However, the improved coupling approach requires a more than doubled computational cost.
All models employed in this study are open-source. The source code of e-AWBLM can be downloaded from https://github.com/anyifang/e-AWBLM (last access: 30 May 2025; DOI: https://doi.org/10.5281/zenodo.15542922, Zhang, 2025). The source code of coupled SWAN and ADCIRC can be requested at https://adcirc.org (Dietrich et al., 2012b). The source code of CaMa-Flood can be downloaded from https://hydro.iis.u-tokyo.ac.jp/~yamadai/cama-flood (Yamazaki et al., 2021). The source code of VIC can be downloaded from https://github.com/UW-Hydro/VIC (Hamman et al., 2018b).
Meteorological forcings on ocean and land were obtained at https://doi.org/10.24381/cds.adbb2d47 (Hersbach et al., 2023) and https://doi.org/10.24381/cds.e9c9c792 (Copernicus Climate Change Service, Climate Data Store, 2024). Tropical cyclone parameters were obtained at https://tcdata.typhoon.org.cn/ (Ying et al., 2014). Bathymetry of the South China Sea was obtained at https://download.gebco.net/ (GEBCO, 2024). The shoreline of the South China Sea was obtained at https://www.ngdc.noaa.gov/mgg/shorelines/shorelines.html (Wessel and Smith, 1996). The outline of the river network in the Pearl River Delta was obtained from https://www.openstreetmap.org (OpenStreetMap contributors, 2025). Land elevation was obtained at https://doi.org/10.5523/bris.25wfy0f9ukoge2gs7a5mqpq2j7 (Hawker and Neal, 2021). The land cover type was obtained at https://doi.org/10.5281/zenodo.5210928 (Jie and Xin, 2021). The surface vegetation type was obtained at http://app.earth-observer.org/data/basemaps/images/global/LandCover_512/LandCoverUMD_512/LandCoverUMD_512.html (Hansen et al., 1998). The soil type was obtained at https://doi.org/10.5281/zenodo.2525817 (Hengl, 2018). Tide information was obtained at https://g.hyyb.org/archive/Tide/TPXO/TPXO_WEB/ (Egbert and Erofeeva, 2002b).
The supplement related to this article is available online at https://doi.org/10.5194/hess-29-2505-2025-supplement.
Conceptualization, methodology: AZ and XY. Formal analysis, validation, visualization, and writing (original draft): AZ. Project management, writing (review and editing): XY. Both authors have read and agreed to the submitted version of the paper.
The contact author has declared that neither of the authors has any competing interests.
Publisher’s note: Copernicus Publications remains neutral with regard to jurisdictional claims made in the text, published maps, institutional affiliations, or any other geographical representation in this paper. While Copernicus Publications makes every effort to include appropriate place names, the final responsibility lies with the authors.
This article is part of the special issue “Methodological innovations for the analysis and management of compound risk and multi-risk, including climate-related and geophysical hazards (NHESS/ESD/ESSD/GC/HESS inter-journal SI)”. It is not associated with a conference.
We thank Dai Yamazaki for installing the CaMa-Flood model. We also thank Yue Xu and Joel Casey Dietrich for their support in running coupled SWAN and ADCIRC. We want to thank the two anonymous reviewers for their valuable comments, which have significantly enhanced the quality of our paper.
This research has been supported by the National Natural Science Foundation of China (grant no. 41961144014).
This paper was edited by Xing Yuan and reviewed by two anonymous referees.
Bakhtyar, R., Maitaria, K., Velissariou, P., Trimble, B., Mashriqui, H., Moghimi, S., Abdolali, A., Van der Westhuysen, A., Ma, Z., and Clark, E.: A new 1D/2D coupled modeling approach for a riverine-estuarine system under storm events: Application to Delaware River Basin, J. Geophys. Res.-Oceans, 125, e2019JC015822, https://doi.org/10.1029/2019JC015822, 2020.
Bilskie, M. and Hagen, S.: Defining flood zone transitions in low-gradient coastal regions, Geophys. Res. Lett., 45, 2761–2770, https://doi.org/10.1002/2018GL077524, 2018.
Bilskie, M. V., Zhao, H., Resio, D., Atkinson, J., Cobell, Z., and Hagen, S. C.: Enhancing flood hazard assessments in coastal Louisiana through coupled hydrologic and surge processes, Front. Water, 3, 609231, https://doi.org/10.3389/frwa.2021.609231, 2021.
Booij, N., Ris, R. C., and Holthuijsen, L. H.: A third-generation wave model for coastal regions: 1. Model description and validation, J. Geophys. Res.-Oceans, 104, 7649–7666, https://doi.org/10.1029/98JC02622, 1999.
Brakenridge, G. R., Syvitski, J., Overeem, I., Higgins, S., Kettner, A., Stewart-Moore, J., and Westerhoff, R.: Global mapping of storm surges and the assessment of coastal vulnerability, Nat. Hazards, 66, 1295–1312, https://doi.org/10.1007/s11069-012-0317-z, 2013.
Bretschneider, C. L.: A non-dimensional stationary hurricane wave model, Offshore Technology Conference, Houston, Texas, USA, April 1972, https://doi.org/10.4043/1517-MS, 1972.
Carr III, L. E. and Elsberry, R. L.: Models of tropical cyclone wind distribution and beta-effect propagation for application to tropical cyclone track forecasting, Mon. Weather Rev., 125, 3190–3209, https://doi.org/10.1175/1520-0493(1997)125<3190:MOTCWD>2.0.CO;2, 1997.
Chan, F. K. S., Yang, L. E., Scheffran, J., Mitchell, G., Adekola, O., Griffiths, J., Chen, Y., Li, G., Lu, X., and Qi, Y.: Urban flood risks and emerging challenges in a Chinese delta: The case of the Pearl River Delta, Environ. Sci. Policy, 122, 101–115, https://doi.org/10.1016/j.envsci.2021.04.009, 2021.
Chen, Y. and Yu, X.: Enhancement of wind stress evaluation method under storm conditions, Clim. Dynam., 47, 3833–3843, https://doi.org/10.1007/s00382-016-3044-4, 2016.
Copernicus Climate Change Service, Climate Data Store: ERA5-land post-processed daily-statistics from 1950 to present, Copernicus Climate Change Service (C3S) Climate Data Store (CDS) [data set], https://doi.org/10.24381/cds.e9c9c792, 2024.
Cosby, B., Hornberger, G., Clapp, R., and Ginn, T.: A statistical exploration of the relationships of soil moisture characteristics to the physical properties of soils, Water Resour. Res., 20, 682–690, https://doi.org/10.1029/WR020i006p00682, 1984.
Deb, M., Sun, N., Yang, Z., Wang, T., Judi, D., Xiao, Z., and Wigmosta, M. S.: Interacting effects of watershed and coastal processes on the evolution of compound flooding during Hurricane Irene, Earth's Future, 11, e2022EF002947, https://doi.org/10.1029/2022EF002947, 2023.
Dietrich, J. C., Tanaka, S., Westerink, J. J., Dawson, C. N., Luettich, R., Zijlema, M., Holthuijsen, L. H., Smith, J., Westerink, L., and Westerink, H.: Performance of the unstructured-mesh, SWAN+ ADCIRC model in computing hurricane waves and surge, J. Sci. Comput., 52, 468–497, https://doi.org/10.1007/s10915-011-9555-6, 2012a.
Dietrich, J. C., Tanaka, S., Westerink, J. J., Dawson, C. N., Luettich, R., Zijlema, M., Holthuijsen, L. H., Smith, J., Westerink, L., and Westerink, H.: SWAN+ADCIRC, Coastal & Computational Hydraulics Team, ADCIRC [code], https://adcirc.org (last access: 30 May 2025), 2012b.
Du, H., Fei, K., Wu, J., and Gao, L.: An integrative modelling framework for predicting the compound flood hazards induced by tropical cyclones in an estuarine area, Environ. Modell. Softw., 175, 105996, https://doi.org/10.1016/j.envsoft.2024.105996, 2024.
Egbert, G. D. and Erofeeva, S. Y.: Efficient inverse modeling of barotropic ocean tides, J. Atmos. Ocean. Technol., 19, 183–204, https://doi.org/10.1175/1520-0426(2002)019<0183:EIMOBO>2.0.CO;2, 2002a.
Egbert, G. D. and Erofeeva, S. Y.: OSU Tidal Data Inversion [data set], https://g.hyyb.org/archive/Tide/TPXO/TPXO_WEB/ (last access: 30 May 2025), 2002b.
Emanuel, K. and Rotunno, R.: Self-stratification of tropical cyclone outflow. Part I: Implications for storm structure, J. Atmos. Sci., 68, 2236–2249, https://doi.org/10.1175/JAS-D-10-05024.1, 2011.
Fang, J., Wahl, T., Fang, J., Sun, X., Kong, F., and Liu, M.: Compound flood potential from storm surge and heavy precipitation in coastal China: dependence, drivers, and impacts, Hydrol. Earth Syst. Sci., 25, 4403–4416, https://doi.org/10.5194/hess-25-4403-2021, 2021.
Feng, D., Tan, Z., Engwirda, D., Liao, C., Xu, D., Bisht, G., Zhou, T., Li, H.-Y., and Leung, L. R.: Investigating coastal backwater effects and flooding in the coastal zone using a global river transport model on an unstructured mesh, Hydrol. Earth Syst. Sci., 26, 5473–5491, https://doi.org/10.5194/hess-26-5473-2022, 2022.
Franchini, M. and Pacciani, M.: Comparative analysis of several conceptual rainfall-runoff models, J. Hydrol., 122, 161–219, https://doi.org/10.1016/0022-1694(91)90178-K, 1991.
Garratt, J.: Review of drag coefficients over oceans and continents, Mon. Weather Rev., 105, 915-929, https://doi.org/10.1175/1520-0493(1977)105<0915:RODCOO>2.0.CO;2, 1977.
General Bathymetric Chart of the Oceans (GEBCO): Gridded Bathymetry Data, British Oceanographic Data Centre [data set], https://download.gebco.net/ (last access: 30 May 2025), 2024.
Georgiou, P., Davenport, A. G., and Vickery, B.: Design wind speeds in regions dominated by tropical cyclones, J. Wind Eng. Ind. Aerodyn., 13, 139–152, https://doi.org/10.1016/0167-6105(83)90136-8, 1983.
Gori, A., Lin, N., and Smith, J.: Assessing compound flooding from landfalling tropical cyclones on the North Carolina coast, Water Resour. Res., 56, e2019WR026788, https://doi.org/10.1029/2019WR026788, 2020a.
Gori, A., Lin, N., and Xi, D.: Tropical cyclone compound flood hazard assessment: From investigating drivers to quantifying extreme water levels, Earth's Future, 8, e2020EF001660, https://doi.org/10.1029/2020EF001660, 2020b.
Hamman, J. J., Nijssen, B., Bohn, T. J., Gergel, D. R., and Mao, Y.: The Variable Infiltration Capacity model version 5 (VIC-5): infrastructure improvements for new applications and reproducibility, Geosci. Model Dev., 11, 3481–3496, https://doi.org/10.5194/gmd-11-3481-2018, 2018a.
Hamman, J. J., Nijssen, B., Bohn, T. J., Gergel, D. R., and Mao, Y.: The Variable Infiltration Capacity model version 5 (VIC-5), GitHub [code], https://github.com/UW-Hydro/VIC (last access: 30 May 2025), 2018b.
Hansen, M., DeFries, R., Townshend, J. R. G., and Sohlberg, R.: UMD Global Land Cover Classification, 1 Kilometer, 1.0, Department of Geography, University of Maryland [data set], http://app.earth-observer.org/data/basemaps/images/global/LandCover_512/LandCoverUMD_512/LandCoverUMD_512.html (last access: 30 May 2025), 1998.
Hansen, M. C., DeFries, R. S., Townshend, J. R., and Sohlberg, R.: Global land cover classification at 1 km spatial resolution using a classification tree approach, Int. J. Remote Sens., 21, 1331–1364, https://doi.org/10.1080/014311600210209, 2000.
Hawker, L. and Neal, J.: FABDEM V1-0, University of Bristol [data set], https://doi.org/10.5523/bris.25wfy0f9ukoge2gs7a5mqpq2j7, 2021.
Hawker, L., Uhe, P., Paulo, L., Sosa, J., Savage, J., Sampson, C., and Neal, J.: A 30 m global map of elevation with forests and buildings removed, Environ. Res. Lett., 17, 024016, https://doi.org/10.1088/1748-9326/ac4d4f, 2022.
Hendry, A., Haigh, I. D., Nicholls, R. J., Winter, H., Neal, R., Wahl, T., Joly-Laugel, A., and Darby, S. E.: Assessing the characteristics and drivers of compound flooding events around the UK coast, Hydrol. Earth Syst. Sci., 23, 3117–3139, https://doi.org/10.5194/hess-23-3117-2019, 2019.
Hengl, T.: Soil texture classes (USDA system) for 6 soil depths (0, 10, 30, 60, 100 and 200 cm) at 250 m (v0.2), Zenodo [data set], https://doi.org/10.5281/zenodo.2525817, 2018.
Hersbach, H., Bell, B., Berrisford, P., Hirahara, S., Horányi, A., Muñoz-Sabater, J., Nicolas, J., Peubey, C., Radu, R., and Schepers, D.: The ERA5 global reanalysis, Q. J. Roy. Meteor. Soc., 146, 1999–2049, https://doi.org/10.1002/qj.3803, 2020.
Hersbach, H., Bell, B., Berrisford, P., Biavati, G., Horányi, A., Muñoz Sabater, J., Nicolas, J., Peubey, C., Radu, R., Rozum, I., Schepers, D., Simmons, A., Soci, C., Dee, D., and Thépaut, J.-N.: ERA5 hourly data on single levels from 1940 to present, Copernicus Climate Change Service (C3S) Climate Data Store (CDS) [data set], https://doi.org/10.24381/cds.adbb2d47, 2023.
Holland, G. J.: An Analytic Model of the Wind and Pressure Profiles in Hurricanes, Mon. Weather Rev., 108, 1212–1218, https://doi.org/10.1175/1520-0493(1980)108<1212:AAMOTW>2.0.CO;2, 1980.
Jelesnianski, C. P.: Numerical computations of storm surges without bottom stress, Mon. Weather Rev., 94, 379–394, https://doi.org/10.1175/1520-0493(1966)094<0379:NCOSSW>2.3.CO;2, 1966.
Jie, Y. and Xin, H.: The 30 m annual land cover datasets and its dynamics in China from 1990 to 2020, Zenodo [data set], https://doi.org/10.5281/zenodo.5210928, 2021.
Lai, Y., Li, J., Gu, X., Liu, C., and Chen, Y. D.: Global compound floods from precipitation and storm surge: Hazards and the roles of cyclones, J. Climate, 34, 8319–8339, https://doi.org/10.1175/JCLI-D-21-0050.1, 2021.
Lee, C., Hwang, S., Do, K., and Son, S.: Increasing flood risk due to river runoff in the estuarine area during a storm landfall, Estuar. Coast. Shelf Sci., 221, 104–118, https://doi.org/10.1016/j.ecss.2019.03.021, 2019.
Liang, X., Lettenmaier, D. P., Wood, E. F., and Burges, S. J.: A simple hydrologically based model of land surface water and energy fluxes for general circulation models, J. Geophys. Res.-Atmos., 99, 14415–14428, https://doi.org/10.1029/94JD00483, 1994.
Lin, N., Emanuel, K., Oppenheimer, M., and Vanmarcke, E.: Physically based assessment of hurricane surge threat under climate change, Nat. Clim. Change, 2, 462–467, https://doi.org/10.1038/nclimate1389, 2012.
Longuet-Higgins, M. S. and Stewart, R.: Radiation stresses in water waves; a physical discussion, with applications, Deep sea research and oceanographic abstracts, 11, 529–562, https://doi.org/10.1016/0011-7471(64)90001-4, 1964.
Lu, X., Zhuang, Q., Liu, Y., Zhou, Y., and Aghakouchak, A.: A large-scale methane model by incorporating the surface water transport, J. Geophys. Res.-Biogeosci., 121, 1657–1674, https://doi.org/10.1002/2016JG003321, 2016.
Luettich, R. A., Westerink, J. J., and Scheffner, N. W.: ADCIRC: An Advanced Three-Dimensional Circulation Model for Shelves, Coasts, and Estuaries. Report 1. Theory and Methodology of ADCIRC-2DDI and ADCIRC-3DL, Coastal Engineering Research Center, Vicksburg, Mississippi, https://archive.org/details/DTIC_ADA261608/mode/2up (last access: 30 May 2025), 1992.
Mattocks, C. and Forbes, C.: A real-time, event-triggered storm surge forecasting system for the state of North Carolina, Ocean Model., 25, 95–119, https://doi.org/10.1016/j.ocemod.2008.06.008, 2008.
Moftakhari, H. R., Salvadori, G., AghaKouchak, A., Sanders, B. F., and Matthew, R. A.: Compounding effects of sea level rise and fluvial flooding, P. Natl. Acad. Sci. USA, 114, 9785–9790, https://doi.org/10.1073/pnas.1620325114, 2017.
OpenStreetMap contributors: OpenStreetMap database [data set], https://www.openstreetmap.org, last access: 30 May 2025.
Powell, M. D., Houston, S. H., and Reinhold, T. A.: Hurricane Andrew's landfall in south Florida. Part I: Standardizing measurements for documentation of surface wind fields, Weather Forecast., 11, 304–328, https://doi.org/10.1175/1520-0434(1996)011<0304:HALISF>2.0.CO;2, 1996.
Qiu, J., Liu, B., Yang, F., Wang, X., and He, X.: Quantitative Stress Test of Compound Coastal-Fluvial Floods in China's Pearl River Delta, Earth's Future, 10, e2021EF002638, https://doi.org/10.1029/2021EF002638, 2022.
Revel, M., Zhou, X., Yamazaki, D., and Kanae, S.: Assimilation of transformed water surface elevation to improve river discharge estimation in a continental-scale river, Hydrol. Earth Syst. Sci., 27, 647–671, https://doi.org/10.5194/hess-27-647-2023, 2023.
Roberts, K. J., Pringle, W. J., and Westerink, J. J.: OceanMesh2D 1.0: MATLAB-based software for two-dimensional unstructured mesh generation in coastal ocean modeling, Geosci. Model Dev., 12, 1847–1868, https://doi.org/10.5194/gmd-12-1847-2019, 2019.
Satoh, M.: Atmospheric circulation dynamics and general circulation models, Springer Science & Business Media, https://doi.org/10.1007/978-3-642-13574-3, 2013.
Tellman, B., Sullivan, J. A., Kuhn, C., Kettner, A. J., Doyle, C. S., Brakenridge, G. R., Erickson, T. A., and Slayback, D. A.: Satellite imaging reveals increased proportion of population exposed to floods, Nature, 596, 80–86, https://doi.org/10.1038/s41586-021-03695-w, 2021.
Tomislav, H.: Soil texture classes (USDA system) for 6 soil depths (0, 10, 30, 60, 100 and 200 cm) at 250 m (Version v02), Zenodo [data set], https://doi.org/10.5281/zenodo.1475451, 2018.
Twarakavi, N. K., Šimůnek, J., and Schaap, M.: Can texture-based classification optimally classify soils with respect to soil hydraulics?, Water Resour. Res., 46, W01501, https://doi.org/10.1029/2009WR007939, 2010.
Wahl, T., Jain, S., Bender, J., Meyers, S. D., and Luther, M. E.: Increasing risk of compound flooding from storm surge and rainfall for major US cities, Nat. Clim. Change, 5, 1093–1097, https://doi.org/10.1038/nclimate2736, 2015.
Wessel, P. and Smith, W. H. F.: A global, self-consistent, hierarchical, high-resolution shoreline database, National Oceanic and Atmospheric Administration (NOAA) [data set], https://www.ngdc.noaa.gov/mgg/shorelines/shorelines.html (last access: 30 May 2025), 1996.
Willoughby, H. and Rahn, M.: Parametric representation of the primary hurricane vortex. Part I: Observations and evaluation of the Holland (1980) model, Mon. Weather Rev., 132, 3033–3048, https://doi.org/10.1175/MWR2831.1, 2004.
Xu, H., Ragno, E., Jonkman, S. N., Wang, J., Bricker, J. D., Tian, Z., and Sun, L.: Combining statistical and hydrodynamic models to assess compound flood hazards from rainfall and storm surge: a case study of Shanghai, Hydrol. Earth Syst. Sci., 28, 3919–3930, https://doi.org/10.5194/hess-28-3919-2024, 2024.
Xu, Y. and Yu, X.: Enhanced atmospheric wave boundary layer model for evaluation of wind stress over waters of finite depth, Prog. Oceanogr., 198, 102664, https://doi.org/10.1016/j.pocean.2021.102664, 2021.
Xu, Y. and Yu, X.: Dynamic interdependence of wind stress and sea state under action of a tropical cyclone moving from deep to shallow waters, Ocean Dynam., 73, 639–661, https://doi.org/10.1007/s10236-023-01574-8, 2023.
Yamazaki, D., Kanae, S., Kim, H., and Oki, T.: A physically based description of floodplain inundation dynamics in a global river routing model, Water Resour. Res., 47, W04501, https://doi.org/10.1029/2010WR009726, 2011.
Yamazaki, D., O'Loughlin, F., Trigg, M. A., Miller, Z. F., Pavelsky, T. M., and Bates, P. D.: Development of the global width database for large rivers, Water Resour. Res., 50, 3467–3480, https://doi.org/10.1002/2013WR014664, 2014.
Yamazaki, D., Revel, M., Hanazaki, R., Zhou, X., and Nitta, T.: CaMa-Flood, The University of Tokyo [code], https://hydro.iis.u-tokyo.ac.jp/~yamadai/cama-flood (last access: 30 May 2025), 2021.
Yang, J. and Huang, X.: The 30 m annual land cover dataset and its dynamics in China from 1990 to 2019, Earth Syst. Sci. Data, 13, 3907–3925, https://doi.org/10.5194/essd-13-3907-2021, 2021.
Yang, J., Li, L., Zhao, K., Wang, P., Wang, D., Sou, I. M., Yang, Z., Hu, J., Tang, X., and Mok, K. M.: A comparative study of Typhoon Hato (2017) and Typhoon Mangkhut (2018) – Their impacts on coastal inundation in Macau, J. Geophys. Res.-Oceans, 124, 9590–9619, https://doi.org/10.1029/2019JC015249, 2019.
Ying, M., Zhang, W., Yu, H., Lu, X., Feng, J., Fan, Y., Zhu, Y., and Chen, D.: Tropical Cyclone Database, China Meteorological Administration (CMA) [data set], https://tcdata.typhoon.org.cn/ (last access: 30 May 2025), 2014.
Zhang, A.: e-AWBLM (v1.2), Zenodo [code] https://doi.org/10.5281/zenodo.15542922, 2025.
Zhang, A. and Yu, X.: A Major Improvement of Atmospheric Wave Boundary Layer Model for Storm Surge Modeling by Including Effect of Wave Breaking on Air-Sea Momentum Exchange, J. Phys. Oceanogr., 54, 1153–1168, https://doi.org/10.1175/JPO-D-23-0233.1, 2024.
Zhang, P., Yang, Q., Wang, H., Cai, H., Liu, F., Zhao, T., and Jia, L.: Stepwise alterations in tidal hydrodynamics in a highly human-modified estuary: The roles of channel deepening and narrowing, J. Hydrol., 597, 126153, https://doi.org/10.1016/j.jhydrol.2021.126153, 2021.
Zhong, M., Xiao, L., Li, X., Mei, Y., Jiang, T., Song, L., and Chen, X.: A study on compound flood prediction and inundation simulation under future scenarios in a coastal city, J. Hydrol., 628, 130475, https://doi.org/10.1016/j.jhydrol.2023.130475, 2024.
Zscheischler, J., Martius, O., Westra, S., Bevacqua, E., Raymond, C., Horton, R. M., van den Hurk, B., AghaKouchak, A., Jézéquel, A., and Mahecha, M. D.: A typology of compound weather and climate events, Nat. Rev. Earth Environ., 1, 333–347, https://doi.org/10.1038/s43017-020-0060-z, 2020.
- Abstract
- Introduction
- Model integration
- Model application in the Pearl River Delta region
- Numerical results
- Discussions
- Conclusions
- Code availability
- Data availability
- Author contributions
- Competing interests
- Disclaimer
- Special issue statement
- Acknowledgements
- Financial support
- Review statement
- References
- Supplement