the Creative Commons Attribution 4.0 License.
the Creative Commons Attribution 4.0 License.
 | 19 May 2025
Substantial root-zone water storage capacity observed by GRACE and GRACE/FO
Erica L. McCormick
Geruo A
Alexandra G. Konings
Bailing Li
Root-zone water storage capacity (Sr) – the maximum water volume available for vegetation uptake – bolsters ecosystem resilience to droughts and heatwaves, influences land–atmosphere exchange, and controls runoff and groundwater recharge. In land models, Sr serves as a critical parameter to simulate water availability for vegetation and its impact on processes like transpiration and soil moisture dynamics. However, Sr is difficult to measure, especially at large spatial scales, hindering an accurate understanding of many biophysical processes, such as photosynthesis, evapotranspiration, tree mortality, and wildfire risk. Here, we present a global estimate of Sr using measurements of total water storage (TWS) anomalies from the Gravity Recovery and Climate Experiment (GRACE) and GRACE Follow-On satellite missions. We find that the median Sr value for global vegetated regions is at least 220±40 mm, which is over 50 % larger than the latest estimate derived from tracking storage change via water fluxes and 380 % larger than that calculated using a typical soil and rooting-depth parameterization. These findings reveal that plant-available water stores exceed the storage capacity of 2 m deep soil in nearly half of Earth's vegetated surface, representing a notably larger extent than previous estimates. Applying our Sr estimates in a global hydrological model improves evapotranspiration simulations compared to other Sr estimates across much of the globe, particularly during droughts, highlighting the robustness of our approach. Our study highlights the importance of continued refinement and validation of Sr estimates and provides a new observational approach for further exploring the impacts of Sr on water resource management and ecosystem sustainability.
- Article
(5960 KB) - Full-text XML
- BibTeX
- EndNote


During periods of insufficient precipitation, vegetation relies on water stored underground to survive (Miguez-Macho and Fan, 2021). The larger the root-zone water storage capacity (Sr), the more water the root zone can store during wet periods for use in droughts (Teuling et al., 2006). Sr, therefore, plays an important role in regulating ecosystem resilience to droughts and heatwaves and in affecting wildfire outbreaks and mortality risk (Callahan et al., 2022; Chen et al., 2013; Goulden and Bales, 2019; Hahm et al., 2019; Humphrey et al., 2018; Stocker et al., 2023). It is also an essential parameter for modeling plant carbon uptake, transpiration, soil evaporation, streamflow, and groundwater (Maxwell and Condon, 2016; Zhao et al., 2022; Peterson et al., 2021). Despite its critical role in modulating the carbon and water cycles, global patterns of Sr remain poorly characterized.
Sr is typically calculated as the integration of plant rooting depth and soil-texture-dependent water-holding capacity (Seneviratne et al., 2010; Vereecken et al., 2022; Speich et al., 2018; Federer et al., 2003). However, this approach (hereafter referred to as the rooting-depth-based estimation) suffers from uncertainties associated with plant rooting depth and substrate hydraulic properties, particularly at depth, both of which undermine the accuracy of the calculated Sr (Vereecken et al., 2022; Novick et al., 2022). Moreover, this approach assumes a static root zone confined to the near-surface unsaturated soil layer. However, recent studies have shown that this assumption is not always accurate. In many ecosystems, plant roots can penetrate beyond the shallow soil layer into weathered bedrock, accessing rock moisture and tapping into groundwater, especially during prolonged dry periods (Li et al., 2015; Hahm et al., 2020; McCormick et al., 2021; Rempe and Dietrich, 2018; Maxwell and Condon, 2016; Fan et al., 2017; Baldocchi et al., 2021). Thus, the rooting-depth-based estimation may significantly underestimate Sr.
More recently, Earth observations of precipitation (P) and evapotranspiration (ET) have been used to estimate Sr. Several studies (Stocker et al., 2023; Wang-Erlandsson et al., 2016; Gao et al., 2014; McCormick et al., 2021) have proxied Sr using the maximum cumulative difference in ET and P during dry periods (when ET > P), which reflects the largest water volume that an ecosystem has withdrawn from its root zone. This method (hereafter referred to as the water-deficit-based estimation) is based on mass balance and thus eliminates the need for assumptions about plant access to rock moisture and groundwater, rooting depth, and soil and bedrock hydraulics. However, obtaining accurate P and ET data is challenging at scale (Sun et al., 2018; Miralles et al., 2016), and errors in these data can accumulate and deteriorate Sr calculations. Here, to avoid this shortcoming, we estimated root-zone storage dynamics directly from total water storage (TWS) anomalies measured by the Gravity Recovery and Climate Experiment (GRACE) and GRACE Follow-On (GRACE-FO) satellite missions (hereafter GRACE/FO). With these observations, we characterized global patterns of Sr and found that both the rooting-depth-based estimate and the water-deficit-based estimate have significantly underestimated Sr.
2.1 GRACE/FO TWS
We use monthly measurements of the TWS anomaly from GRACE for the years 2002–2017 and from GRACE-FO for the years 2018–2022. These measurements were obtained from the Jet Propulsion Laboratory (JPL) RL06 solutions (Watkins et al., 2015; Wiese et al., 2016), which provide monthly average anomalies of the gravity field over an equal-area 3° × 3° mass concentration block (mascon). We opted for the JPL mascon solutions because each JPL mascon is relatively uncorrelated with neighboring mascons and thus offers more localized spatial variations than other mascon solutions and the spherical harmonic solutions (Watkins et al., 2015; Wiese et al., 2016). We did not fill the 11-month gap (July 2017 to May 2018) between GRACE and GRACE-FO. However, we linearly interpolated other missing months from the nearest previous and subsequent non-missing values (Rodell et al., 2018; Zhao et al., 2021). Because we aimed to estimate root-zone storage capacity Sr, we only included mascon locations with over 50 % fractional vegetation cover based on the land cover product (MCD12Q1) version 6.1 from the Moderate Resolution Imaging Spectroradiometer (MODIS) (Sulla-Menashe and Friedl, 2018).
2.2 Sr from TWS drawdown and uncertainty estimate
Ecosystem use of land water storage for ET is reflected in TWS drawdowns, which are consecutive declines in TWS despite seasonal or intermittent recharge and after accounting for long-term trends due to anthropogenic groundwater use. An example is illustrated in Fig. 1 at a mascon location in southern Idaho, where the largest TWS drawdowns are annotated. From the water balance, a TWS drawdown over a time period Δt is equal to
where ∑P, ∑ET, and ∑R are the total precipitation, total evapotranspiration, and net runoff out of the mascon over Δt, respectively. Based on Eq. (1), when precipitation exceeds runoff (), any TWS drawdown (or negative ΔTWS) must be influenced by a change in storage due to ET. To determine if precipitation exceeds runoff during GRACE/FO-observed TWS drawdowns, we compared R estimates from a multi-forcing observation-based global runoff reanalysis (Ghiggi et al., 2021) to P estimates from the Global Precipitation Climatology Project (Gebremichael et al., 2003). We found that, in nearly all analyzed mascon locations, the average P−R is positive during, at least, the five largest TWS drawdowns (Fig. A1 in the Appendix), confirming that these TWS drawdowns reflect root-zone water storage transpired by ecosystems and not loss of water in the mascon due to runoff.
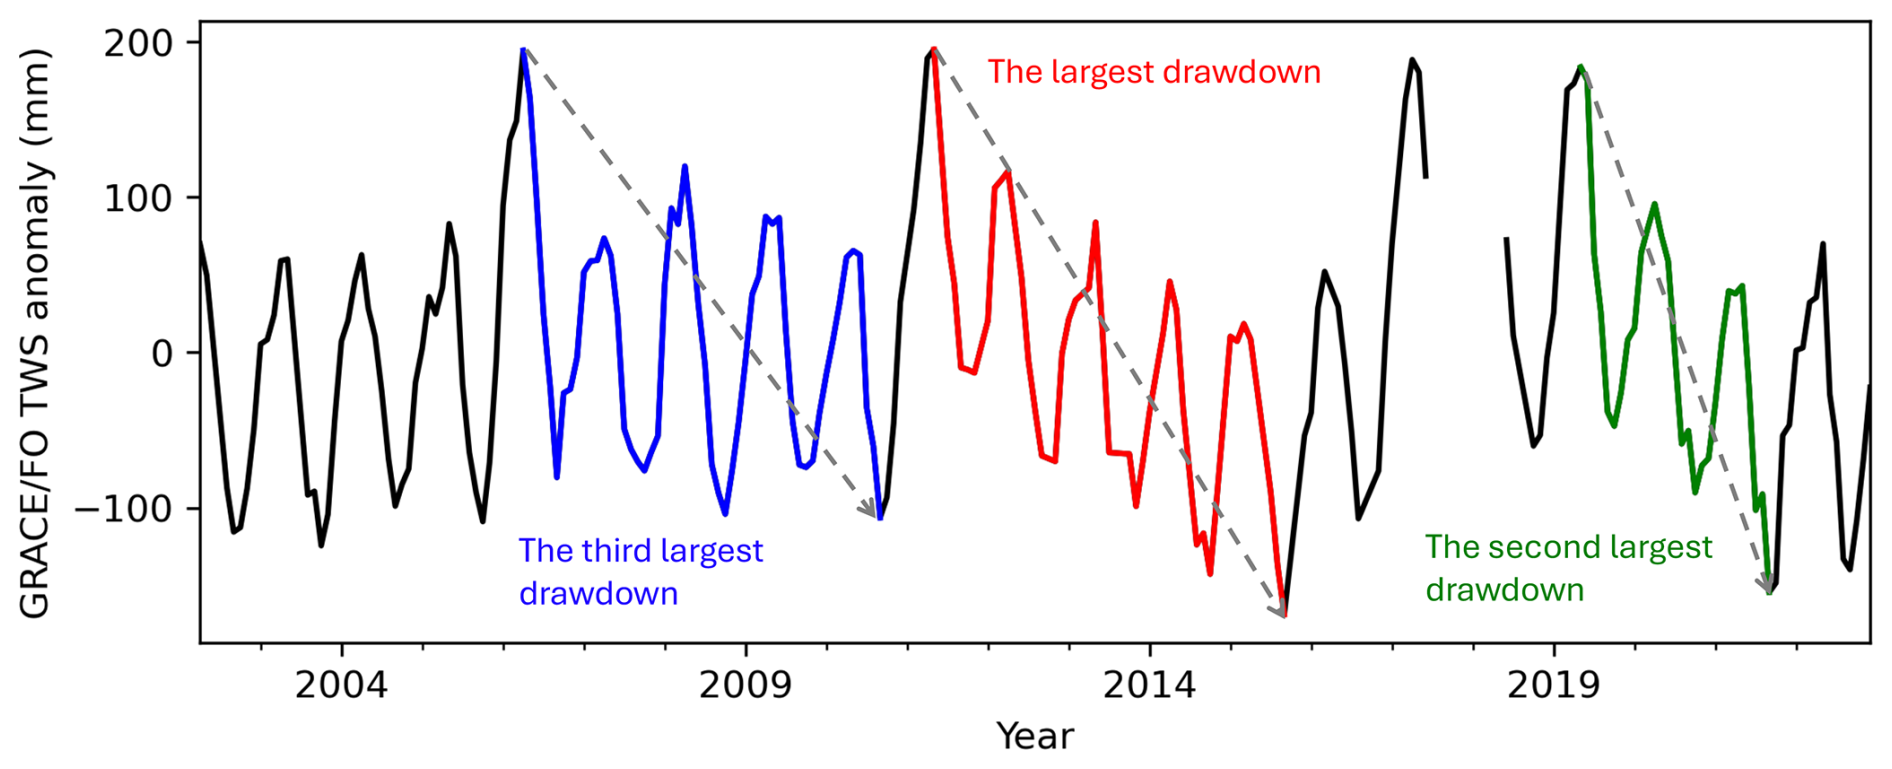
Figure 1TWS time series showing the three largest drawdowns at a mascon location in southern Idaho.
We estimated root-zone water storage capacity Sr to be the largest TWS drawdown during the record period of GRACE/FO (denoted as ). To avoid overestimating Sr, we removed the impact of groundwater pumping, snow, and surface water on TWS drawdowns. Anthropogenic groundwater use often manifests as a negative long-term trend in the TWS time series (Rodell et al., 2018; Rodell et al., 2009; Feng et al., 2013). For example, regions showing significant decreasing trends in TWS largely coincide with well-known groundwater irrigation areas identified in AQUASTAT data (Fig. A2). To avoid conflating this drawdown with Sr, we first calculated the TWS trend by simultaneously fitting an annual and a semi-annual signal, a linear trend, and a constant to the GRACE/FO time series (Fig. A2). Then, we assumed that any negative trend was attributable to groundwater pumping and removed the negative trend from the original GRACE/FO time series before calculating the TWS drawdowns. In high-latitude and mountainous regions, the maximum TWS anomaly during drawdowns may include snow. To avoid attributing snow storage to root-zone water storage, we first determined the largest drawdown from the full GRACE/FO time series and then calculated Sr using the maximum and minimum TWS anomaly with a monthly mean air temperature above 5 °C. We obtained air temperature data from the fifth-generation European Centre for Medium-Range Weather Forecasts atmospheric reanalysis of the global climate (ERA5) (Hersbach et al., 2020). Following Wang et al. (2023a), we used total runoff from Ghiggi et al. (2021), which includes both surface runoff and subsurface runoff, as a proxy for surface water storage change (i.e., ΔSW =R) and removed it from TWS drawdowns to isolate Δ SW contributions (water stored in rivers, lakes, and reservoirs) to the GRACE/FO signal. This approach assumes that (1) R contributes directly to an increase in surface water levels within the drainage network, and (2) it takes approximately 1 month for R to exit the drainage system, aligning with the monthly time step of GRACE/FO data. Note that total runoff from Ghiggi et al. (2021) stopped in 2019, and we used monthly climatology values between 2002 and 2019 to extend the data to 2022 and to align with the GRACE/FO record length. Other contributions to TWS drawdowns, such as changes in water intercepted by leaf and branch surfaces and internal plant water storage, are too small to be detected by GRACE/FO (Rodell et al., 2005) and are unlikely to significantly affect our estimates. Our method also implicitly includes moisture stored in the topsoil for soil evaporation (Stoy et al., 2019). However, the contribution of soil evaporation to ET decreases quickly as TWS draws down (Stocker et al., 2023), and we expect that the magnitude of the largest drawdown will be determined by the root-zone depletion magnitude reflected at the end of the drawdown.
We calculated the random error of by adding the errors of the two GRACE/FO measurements and the uncertainty of groundwater pumping and surface water signals in quadrature. To calculate the GRACE/FO measurement error, we used the formal error product provided by the JPL mascon solutions (Watkins et al., 2015; Wiese et al., 2016). For the uncertainty of groundwater pumping and surface water signals, we assumed a ±50 % error based on the magnitude of our calculated signals, following Zhao et al. (2021). This assumption implies that the uncertainty range is equal to the signals themselves, leading to what is likely to be a conservative error estimate.
2.3 Comparison to other Sr estimates
We compared our estimate to two other Sr datasets. These datasets represent the typical approach covering rooting depth and soil-texture-dependent water-holding capacity (referred to as ) and the water deficit accumulation approach (referred to as ). We chose the estimate from Stocker et al. (2023) because it used the latest Earth-observation-constrained estimates of precipitation and evapotranspiration. We used their SCWDX80 product, which was estimated based on cumulative water deficit extremes occurring with a return period of 80 years. We calculated using existing datasets on rooting depths and soil texture. The approach requires knowing effective rooting depths (Federer et al., 2003; Speich et al., 2018; Stocker et al., 2023; Bachofen et al., 2024). We obtained effective rooting depths from Yang et al. (2016), who derived them using an analytical model that balances the marginal carbon costs and benefits of deeper roots. While such model-based datasets are valuable for providing comprehensive coverage and insights into complex processes, they do not incorporate direct observational data for validation or correction. Soil water-holding capacity, defined as the difference between field capacity and permanent wilting point, is calculated based on soil texture information from the Harmonized World Soil Database version 1.2 (Wieder et al., 2014) and pedo-transfer functions based on Balland et al. (2008). The Harmonized World Soil Database provides information for depths of 0–0.3 and 0.3–1 m. For depths greater than 1 m, we assume texture values from the 0.3–1 m depth following Stocker et al. (2023). For consistency, we spatially averaged both and estimates to match the GRACE/FO spatial scale (3° × 3°).
2.4 Evaluation using the USGS monthly hydrologic model
Validating large-scale Sr remains inherently difficult because direct measurement of Sr is challenging. Previous studies have primarily employed two indirect methods: comparison to measured rooting depths and hydrological modeling. Stocker et al. (2023) converted their deficit-based Sr estimates (∼ 5 km resolution) into rooting depths using soil texture and water-holding-capacity parameters and then compared them to field rooting-depth measurements aggregated at biome levels to mitigate the scale mismatch. However, this approach is not suitable for our study as GRACE/FO-derived Sr (∼ 300 km) encompasses multiple biome types within the effective resolution of GRACE/FO data, making biome-level aggregation less meaningful. Additionally, the rooting-depth method overlooks groundwater and rock moisture contributions to Sr, which Stocker et al. (2023) found to be significant in over half of their root measurement sites. This omission will likely become more critical at the spatial scale of GRACE/FO, which averages larger areas and includes more diverse biome types. These factors make the rooting-depth comparison unsuitable for evaluating GRACE/FO-derived Sr. Wang-Erlandsson et al. (2016) used deficit-based Sr estimates in a simple hydrological model and assessed improvements in simulating hydrologic time series. While this approach better aligns with the scale of GRACE/FO, it is constrained by the limited availability of high-quality global hydrologic data. This can lead to a circular use of the same data for both Sr estimation and model evaluation, as seen when Wang-Erlandsson et al. (2016) used satellite-based ET data for both Sr estimation and model evaluation, reducing the independence of the validation process. We also note that existing gridded ET products generally have assumed ecosystem responses to water stress in their algorithms and thus are highly uncertain (Miralles et al., 2016).
To address these challenges, we evaluated the relative accuracy of , , and by separately parameterizing a hydrological model with each estimate; these are referred to as HydroModel(), HydroModel(), and HydroModel(). We then assessed their accuracy in simulating ET using an independent dataset: version 4.1 of the Global Land Evaporation Amsterdam Model (GLEAM) ET (Miralles et al., 2025a). This dataset was not involved in the calculation of , , or , ensuring independence and avoiding the circular validation that affected previous studies (e.g., Wang-Erlandsson et al., 2016). Furthermore, the GLEAM ET product provides several key improvements over other gridded ET products. For example, it combines hybrid learning from eddy covariance and sap flow to better capture vegetation responses to drought (Koppa et al., 2022) and explicitly accounts for plant access to groundwater (Hulsman et al., 2023). The atmospheric-forcing data and model parameters were identical across simulations, with Sr being the only variable parameter. Therefore, differences in model performance reflect the relative accuracy of the three Sr estimates. A monthly hydrologic model developed by the United States Geological Survey (USGS) (McCabe and Markstrom, 2007) was used due to its simplicity and transparency with regard to physical processes. Specifically, the model relies on a straightforward specification of Sr as a “water bucket” depth rather than an indirect specification through prescribed rooting depth, soil texture, and pedo-transfer functions across the profile. This allows us to parameterize the model directly with , , and . The USGS model was run at each GRACE mascon location with air temperature forcing from ERA5 and precipitation forcing from the GPCP. We used climate forcing from 1993 to 2001 to spin up the model and performed water cycle simulations for the study period from 2002 to 2022. No calibrations were carried out.
To mitigate the impact of possible biases embedded in GLEAM ET and in the forcing data and those caused by model uncertainty (as the USGS model is uncalibrated), we used standardized ET anomalies (i.e., z scores) as the target of validation and focused on assessing whether Sr improves the temporal dynamics of ET simulations (i.e., seasonal and interannual variations) rather than the absolute values of ET. The Nash–Sutcliffe model efficiency (NSE) coefficient was used to assess the predictive skill of each USGS hydrologic model, defined as follows:
where X represents the standardized ET anomaly; is the mean of the observed X; and and are the observed and modeled X at time t, respectively (Nash and Sutcliffe, 1970). An NSE value closer to 1 indicates a better model performance in simulating X, while an NSE value less than 0 indicates that the mean observed value is a better predictor than the simulated value, suggesting an unsatisfactory model performance (Nash and Sutcliffe, 1970). If HydroModel(), HydroModel(), and HydroModel() all yield negative NSE values, the efficacy of using the USGS hydrologic model to evaluate the relative accuracy of the three Sr estimates is compromised.
3.1 Sr from GRACE/FO ()
We find a substantial root-zone water storage capacity worldwide. Across the global vegetated domain, (or the largest TWS drawdown) spans from 22 to 2131 mm (Fig. 2a). The distribution of is positively skewed, with a median value of 221 mm (129–389 mm interquartile range; note that, hereafter, values in parentheses always refer to the interquartile range). Larger values are associated with densely vegetated regions like tropical rainforests, the southeastern US, the Pacific Northwest, and the southern part of China. By contrast, smaller values are found in sparsely vegetated regions like central Asia, much of Australia, and some Arctic regions (Fig. 2a). Figure 2b shows the duration of the maximum TWS drawdown, with a global median of 2.8 years (1.6–5.2 years). We find no correlation between the duration and the magnitude of the largest TWS drawdown across different regions (Fig. 2a–b). The impact of random error sources on our estimate remains moderate, with a global median relative error of 18 % (13 %–26 %) (Fig. 2c).
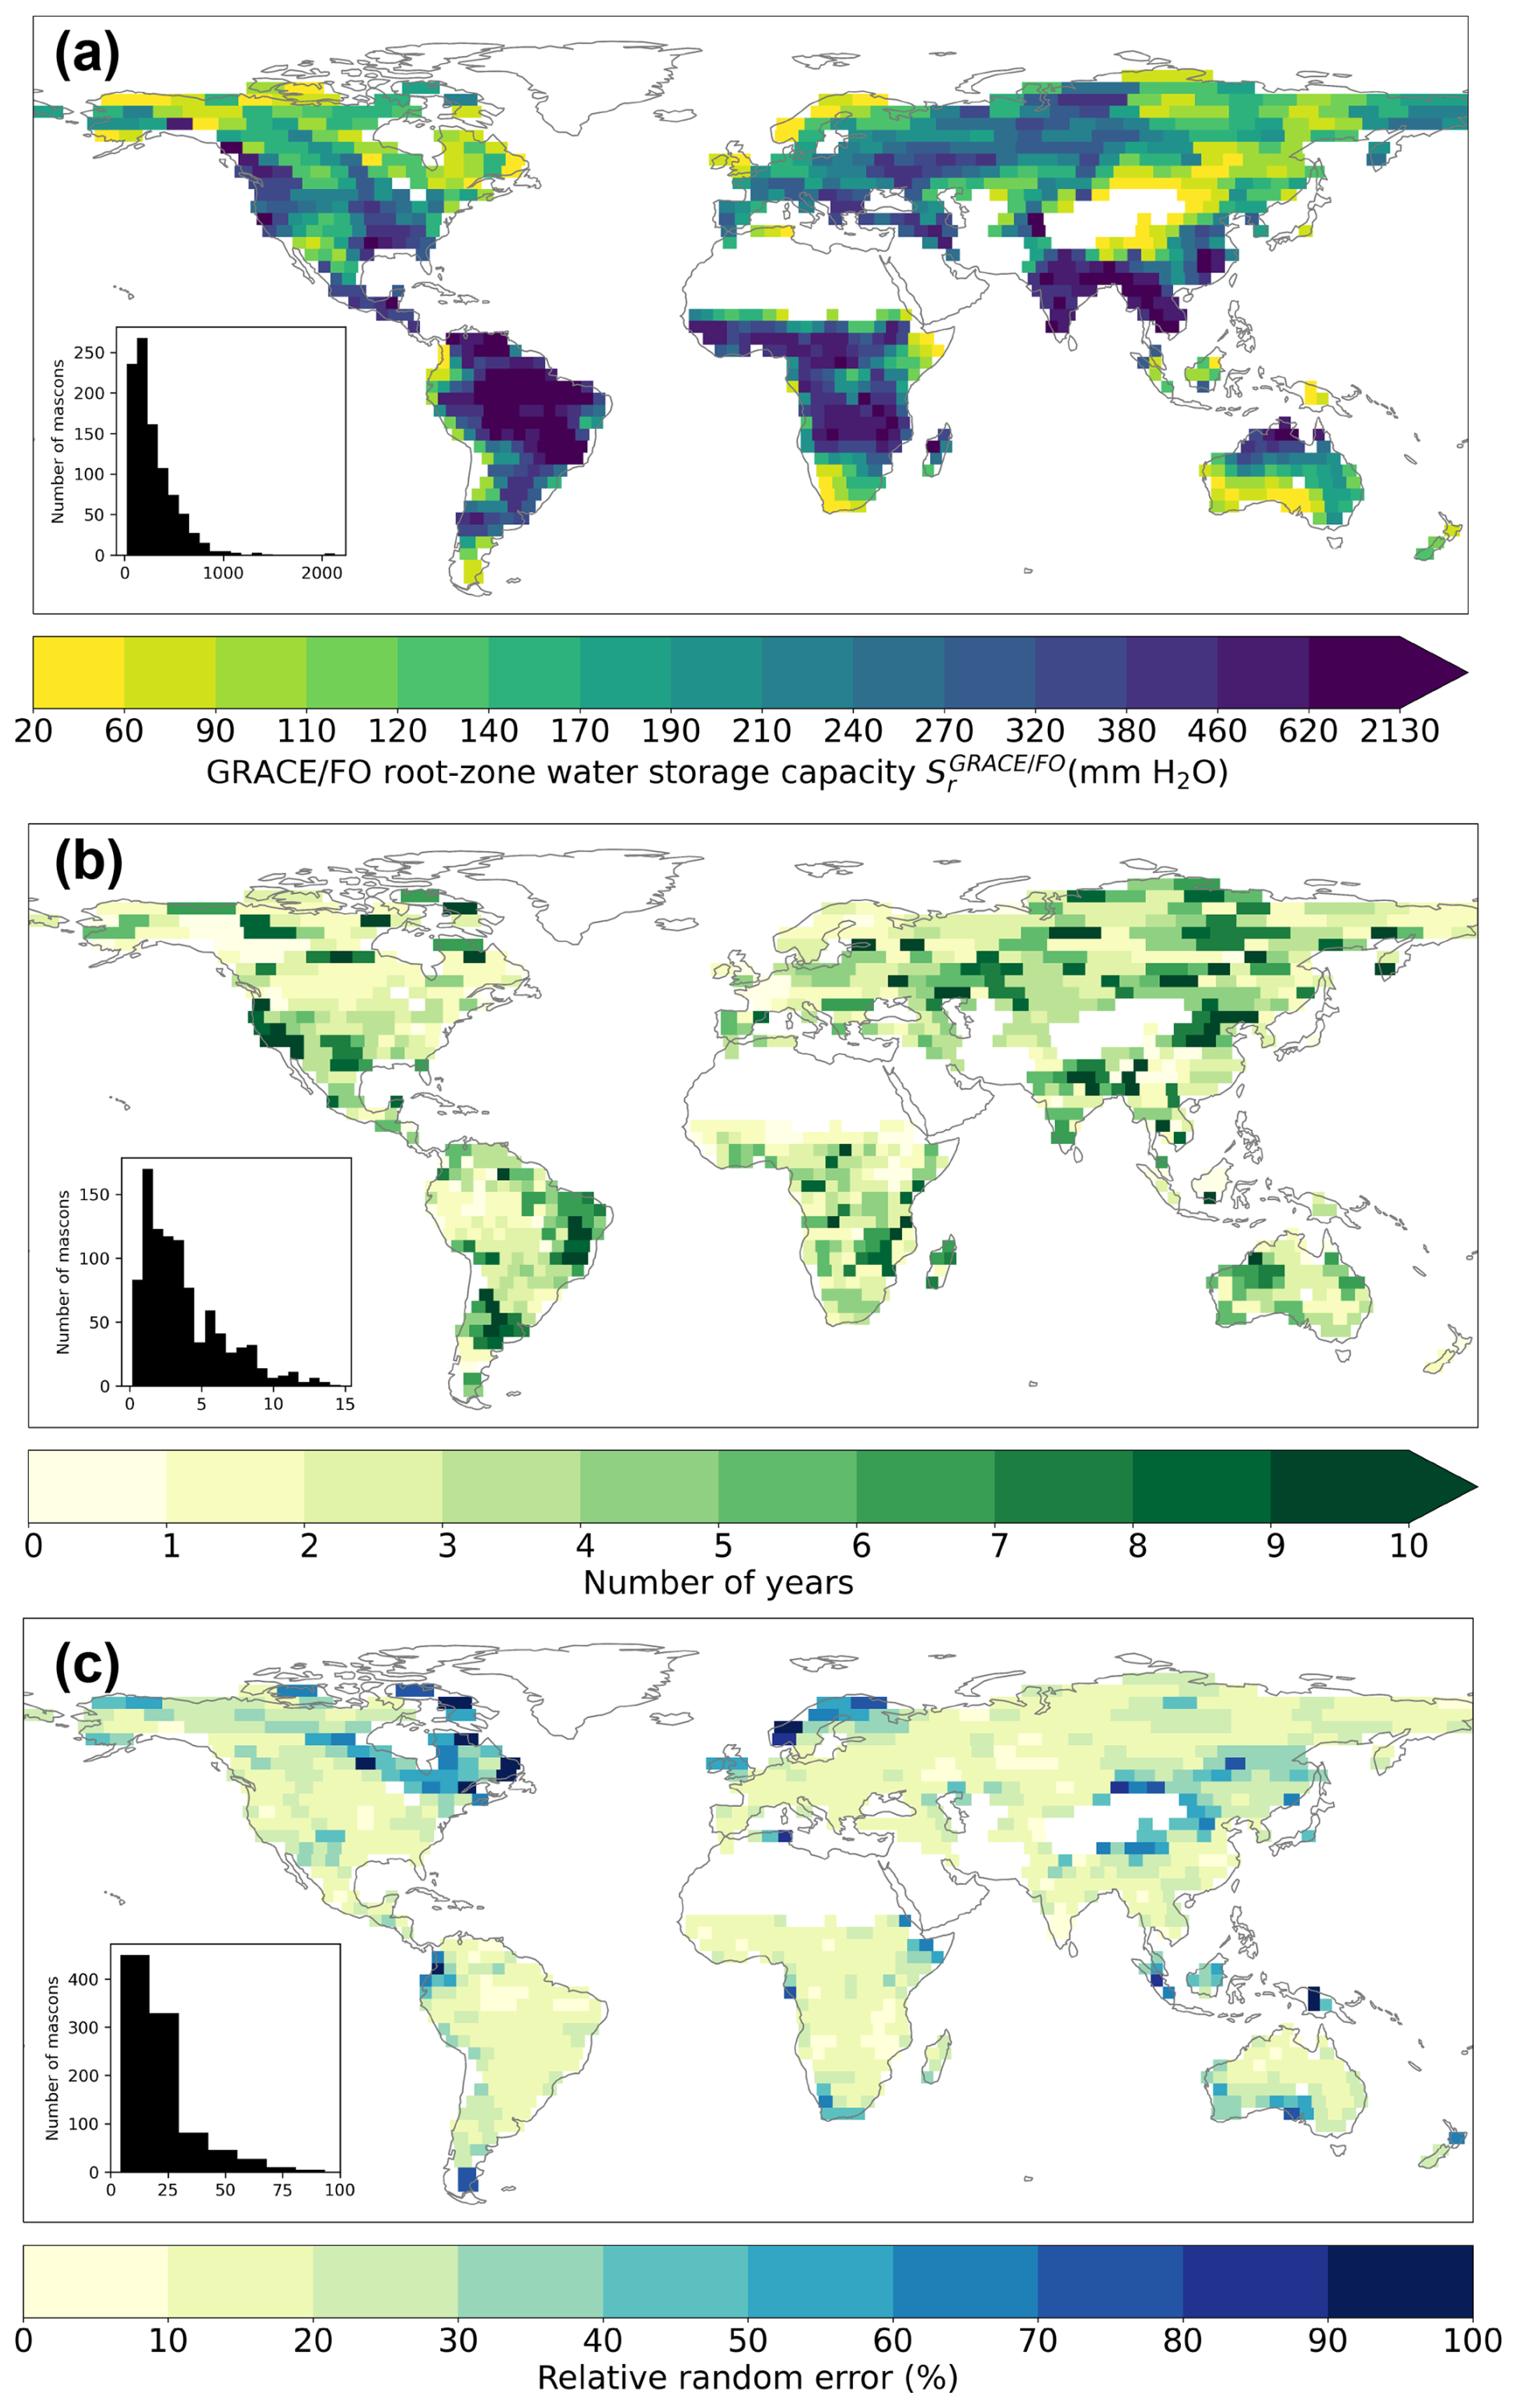
Figure 2Sr estimated from GRACE/FO total water storage (TWS) anomaly. (a) Global patterns of for Earth's vegetated regions. (b) The duration of the maximum TWS drawdown. (c) Global patterns in the random error of . Insets in (a)–(c) show the histograms of corresponding mapping variables across our study area. White spaces on land represent mascon locations with less than 50 % vegetation cover.
To characterize the utilization of root-zone water storage capacity, we compared the second- and third-largest TWS drawdowns to . We find that, on average, the second-largest TWS drawdown consumes 83 % (71 %–92 %) of the estimate (Fig. 3a), while the third-largest uses 68 % (54 %–82 %) (Fig. 3b). The average duration of the second- and third-largest TWS drawdowns decreases from 1.6 years (1.1–3.2 years) to 1.2 years (0.5–1.7 years) (Fig. 3c–d). In about 40 % of our analyzed mascons, the longest TWS drawdown period does not coincide with the largest drawdown magnitude. These findings underscore the nuanced dynamics of water storage use within the root zone, suggesting variability in both magnitude and duration across different regions.
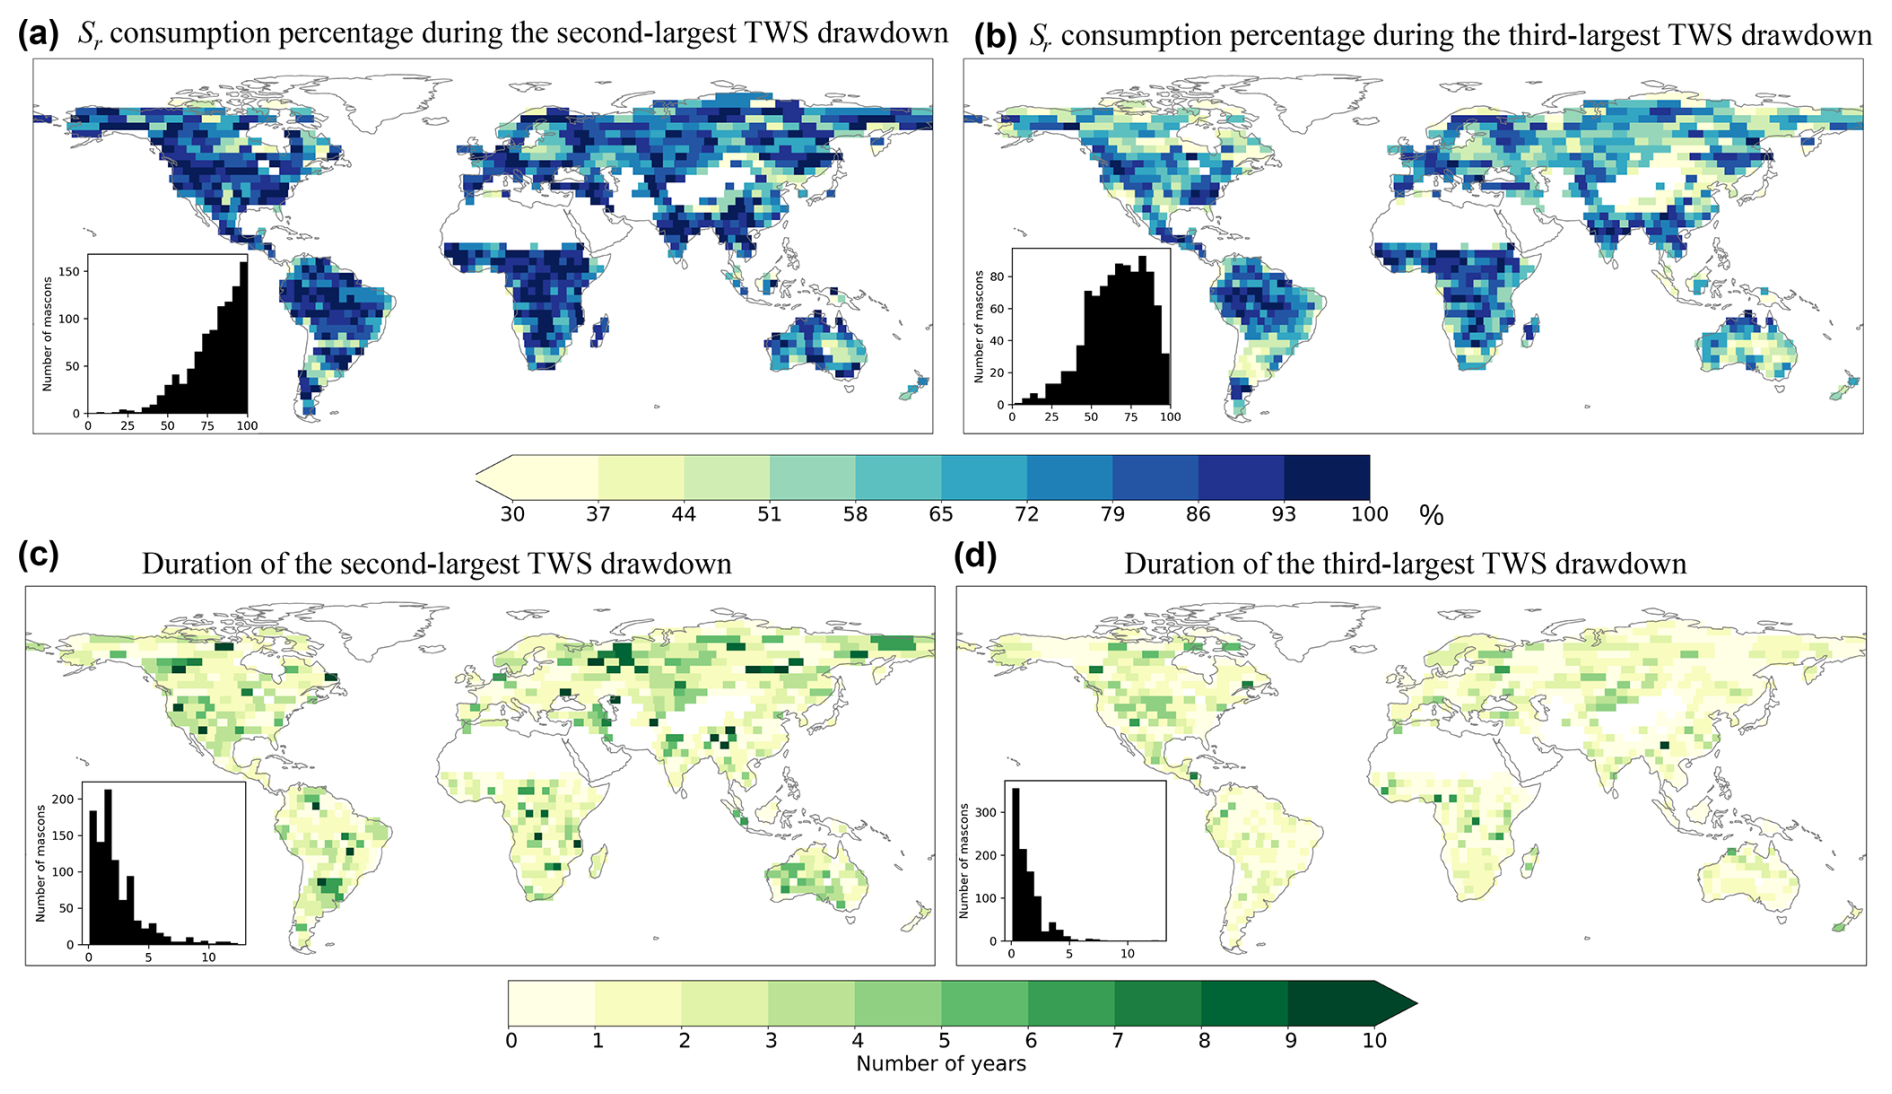
Figure 3Utilization of root-zone water storage capacity. Panels (a) and (b) are consumption percentages of during the second- and third-largest TWS drawdowns. Panels (c) and (d) are the durations of the second- and third-largest TWS drawdowns. Insets in (a)–(d) show the histograms of corresponding mapped variables.
3.2 Comparison with other Sr estimates
Our estimate is larger than those of and over much of the globe. Figure 4a–b show the difference of compared to and , respectively. Across the global vegetated domain, surpasses in over 90 % of mascon locations, with a median value that is 175 mm (or 380 %) higher than that of . The exceeds in over 70 % of the study area, with a median value that is 77 mm (or 53 %) higher than that of , despite exhibiting lower values in many regions of Africa, India, Mexico, and northeastern Brazil (Fig. 4b). Notably, these differences are greater than the random error of , emphasizing that the underestimations by and are significant.
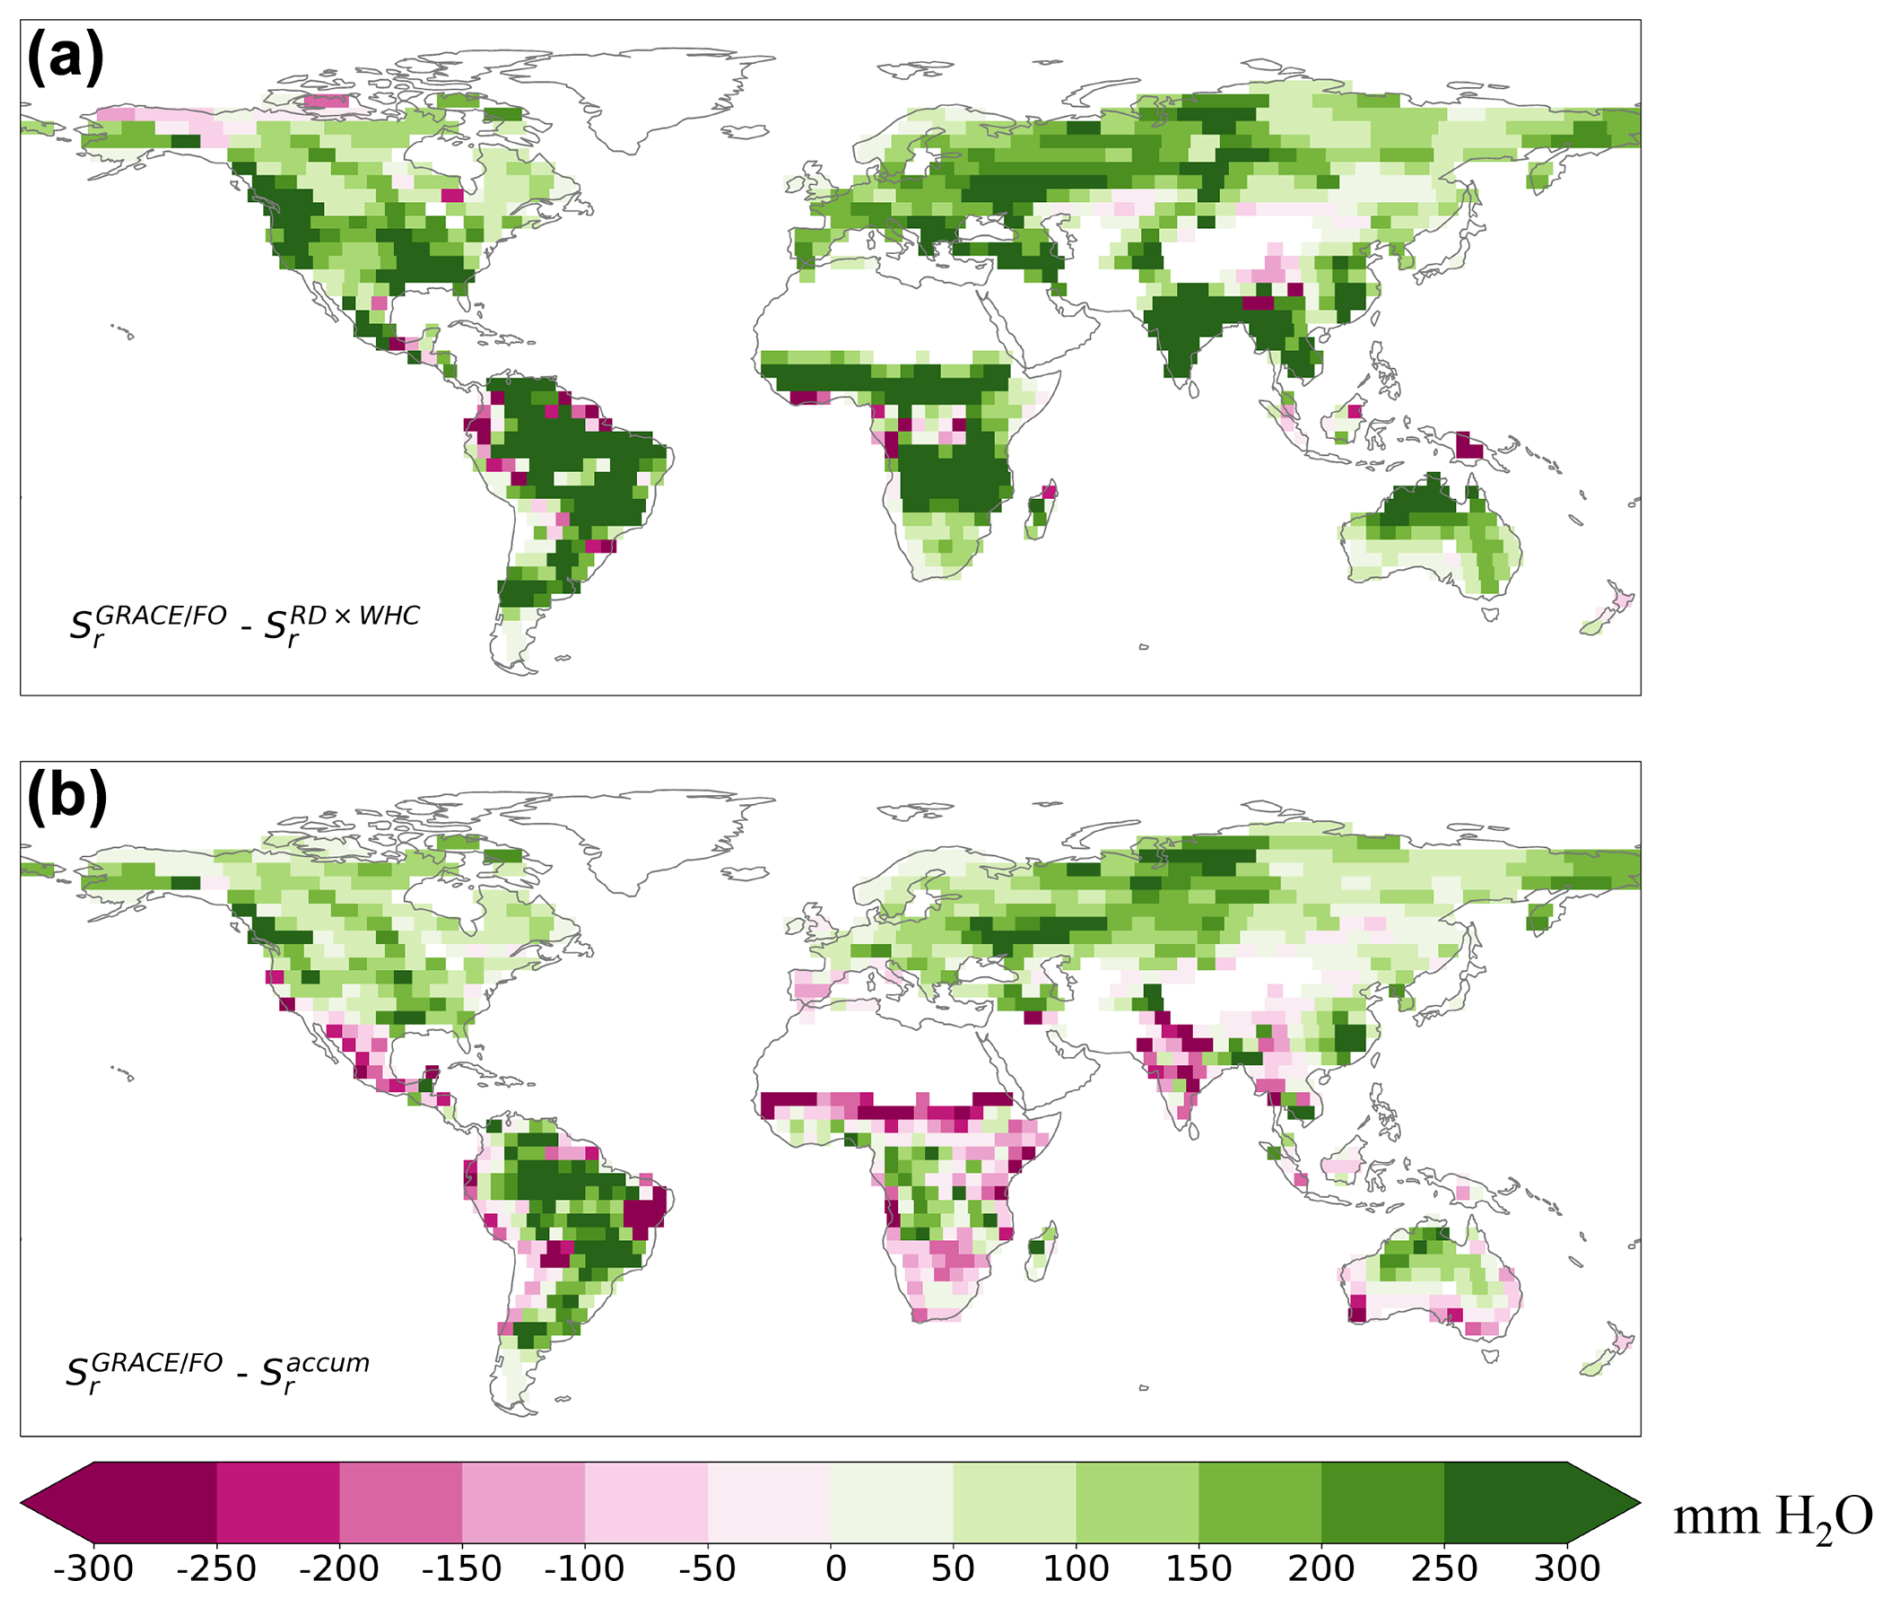
Figure 4 values are notably larger than those of other datasets over much of the globe. (a) The difference between and . (b) The difference between and .
3.3 Implementation in the USGS hydrologic model
To assess whether is an improvement over and , we used each of them to separately parameterize the USGS hydrologic model. We first evaluated the accuracy of HydroModel(), HydroModel(), and HydroModel() in replicating the full time series of standardized GLEAM ET anomalies. For over 95 % of the global vegetated domain, at least one model achieved a positive NSE value. In these regions, the average NSE for HydroModel() is 0.73 (0.65–0.89), that for HydroModel() is 0.69 (0.63–0.86), and that for HydroModel() is 0.72 (0.64–0.87). These relatively high NSE values indicate that the USGS model is effective in simulating ET. While the global average NSE values for the three models are similar, HydroModel() demonstrates slightly superior performance, outperforming HydroModel() in 66 % of the vegetated regions and HydroModel() in 59 % of these regions (Fig. 5).
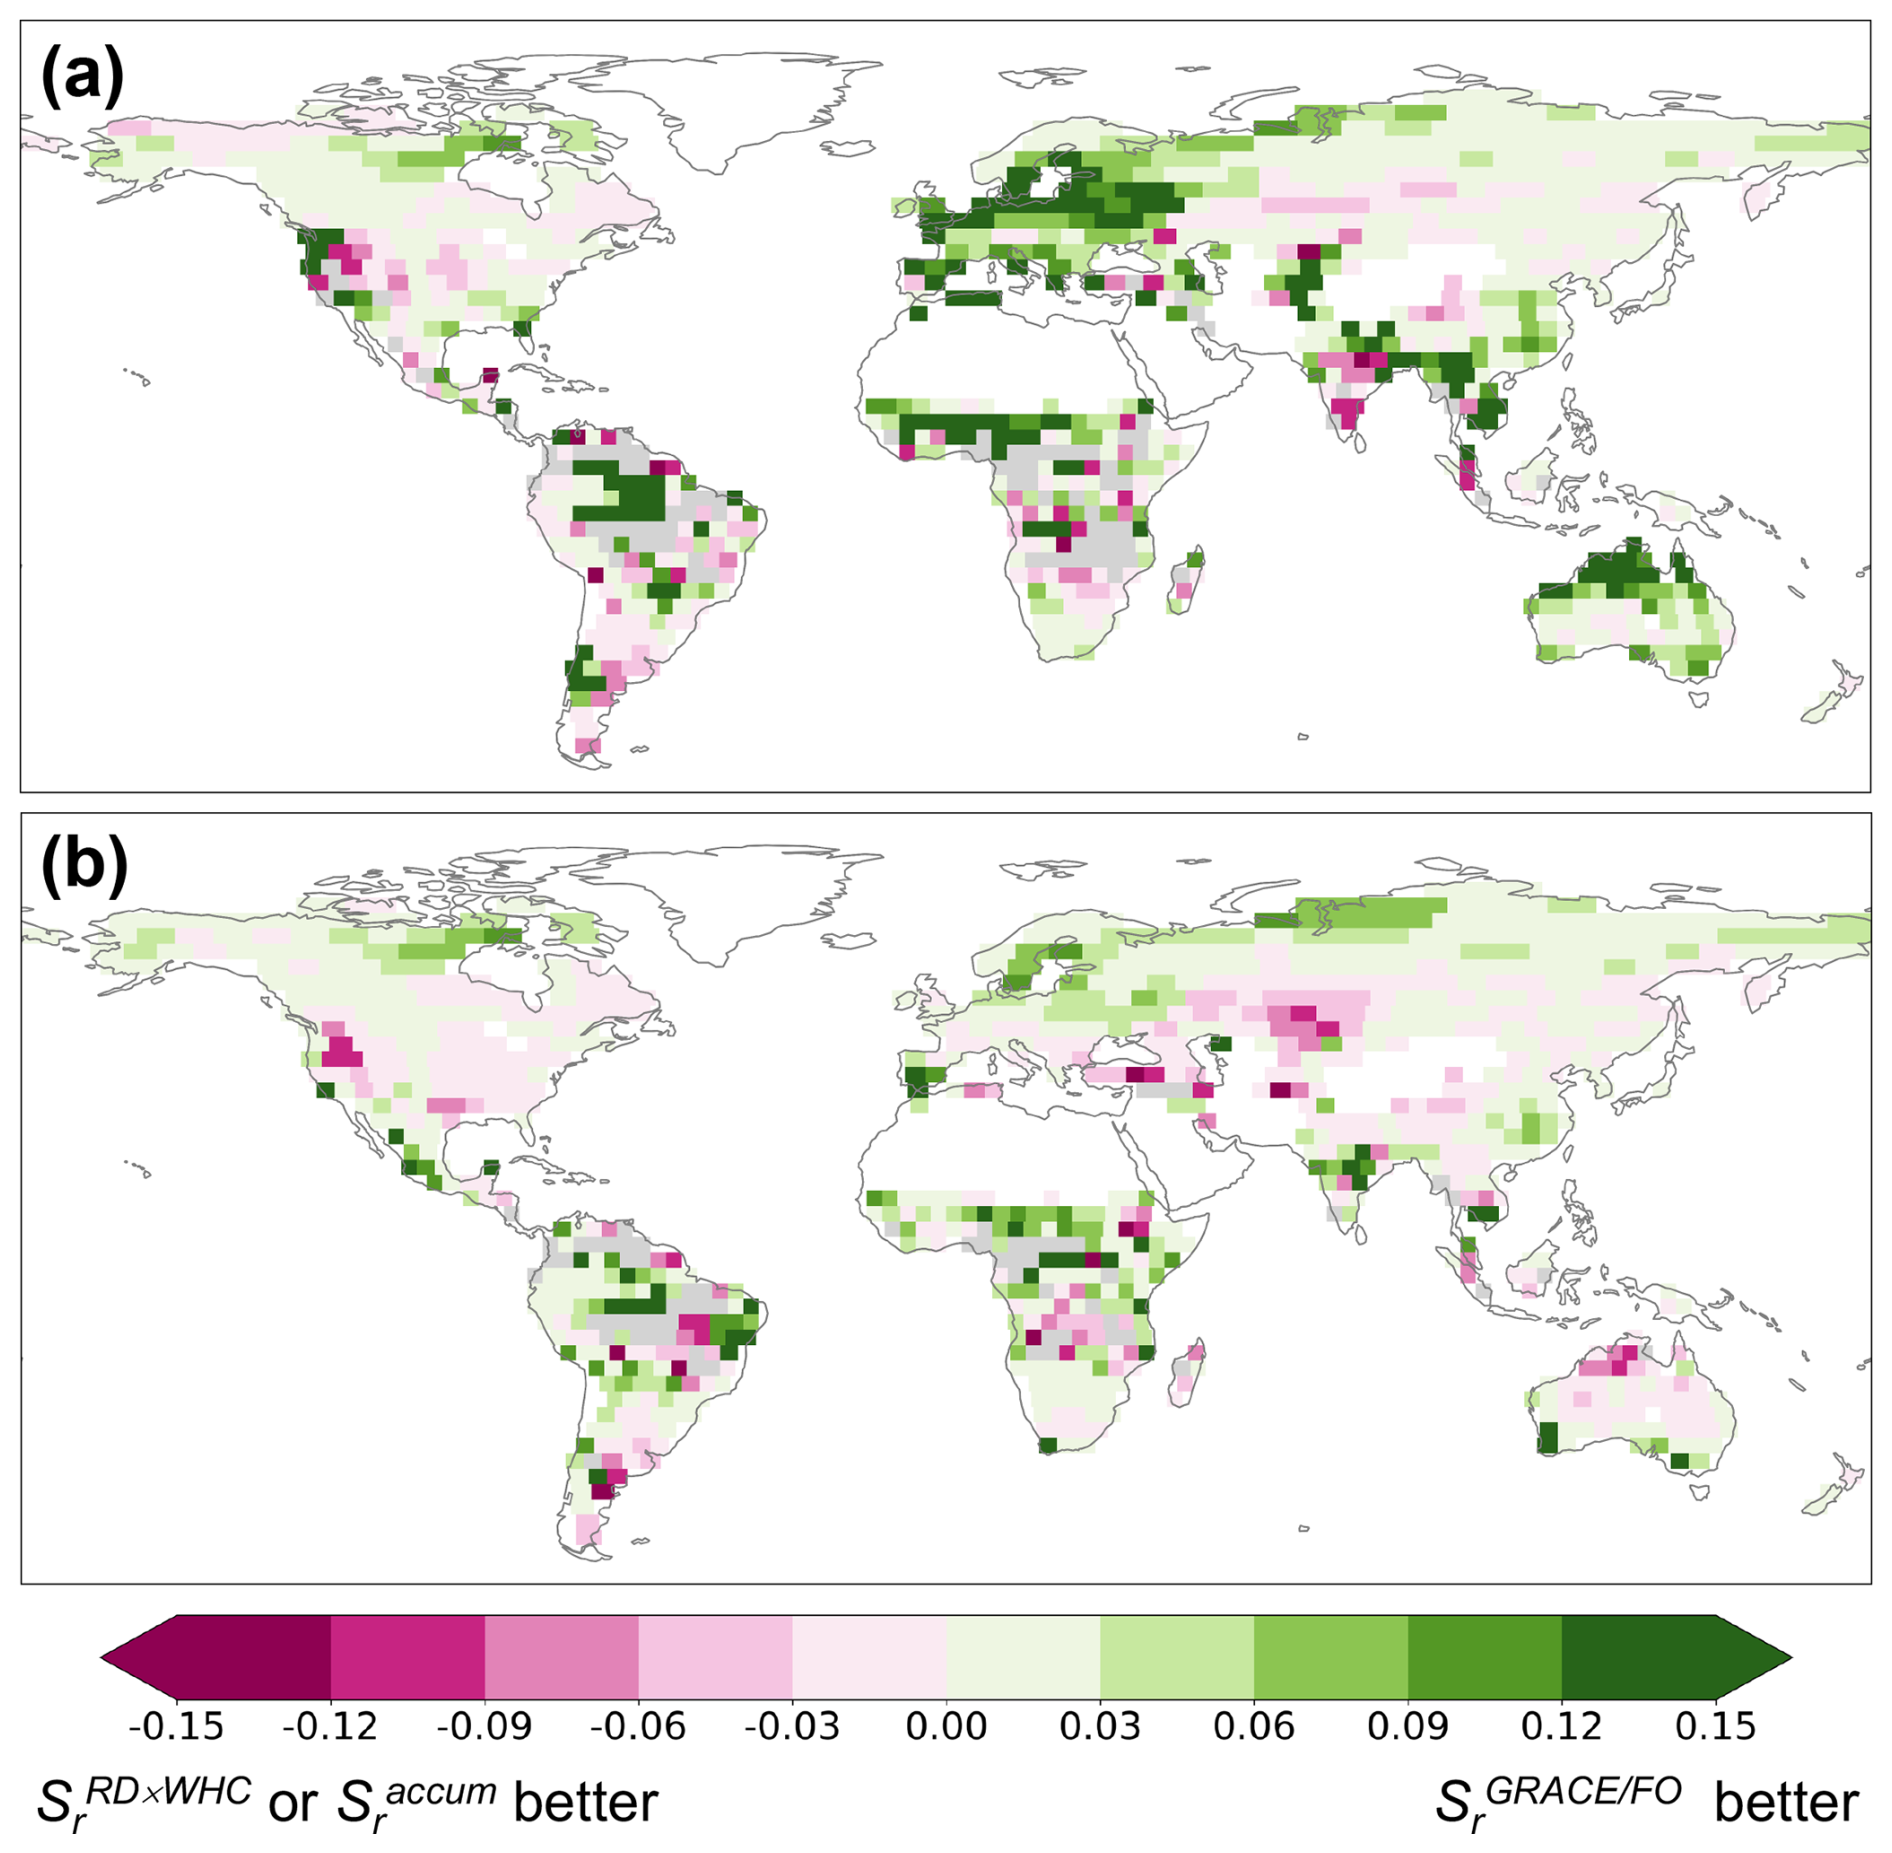
Figure 5 improves overall model performance in simulating standardized ET anomalies over much of the globe. (a) The NSE difference between HydroModel() and HydroModel() for full time series. (b) The NSE difference between HydroModel() and HydroModel() for full time series. Gray areas indicate regions where all models fail to achieve a positive NSE value.
We hypothesized that a more accurate Sr would have a greater impact on improving ET simulations during drought periods when ET is more dependent on deep subsurface water storage. To test this, we calculated NSE values specifically for drought periods, defined as when the 3-month standardized precipitation index was less than −1.2, indicative of severe drought conditions (McKee et al., 1993). Across 87 % of the global vegetated domain, at least one model achieved a positive NSE value. In these regions, the average NSE for HydroModel() is 0.65 (0.52–0.86), that for HydroModel() is 0.52 (0.40–0.81), and that for HydroModel() is 0.61 (0.48–0.84). These lower NSE values compared to the full ET time series reflect the challenges faced by the USGS model in simulating ET during droughts, consistently with previous findings (e.g., Zhao et al., 2022). However, HydroModel() showed notable improvement over the other two models, particularly in high-latitude regions (Fig. 6). These results suggest that, while provides only marginal improvements for the full time series of standardized GLEAM ET anomalies, its superiority over and becomes more pronounced during drought conditions.
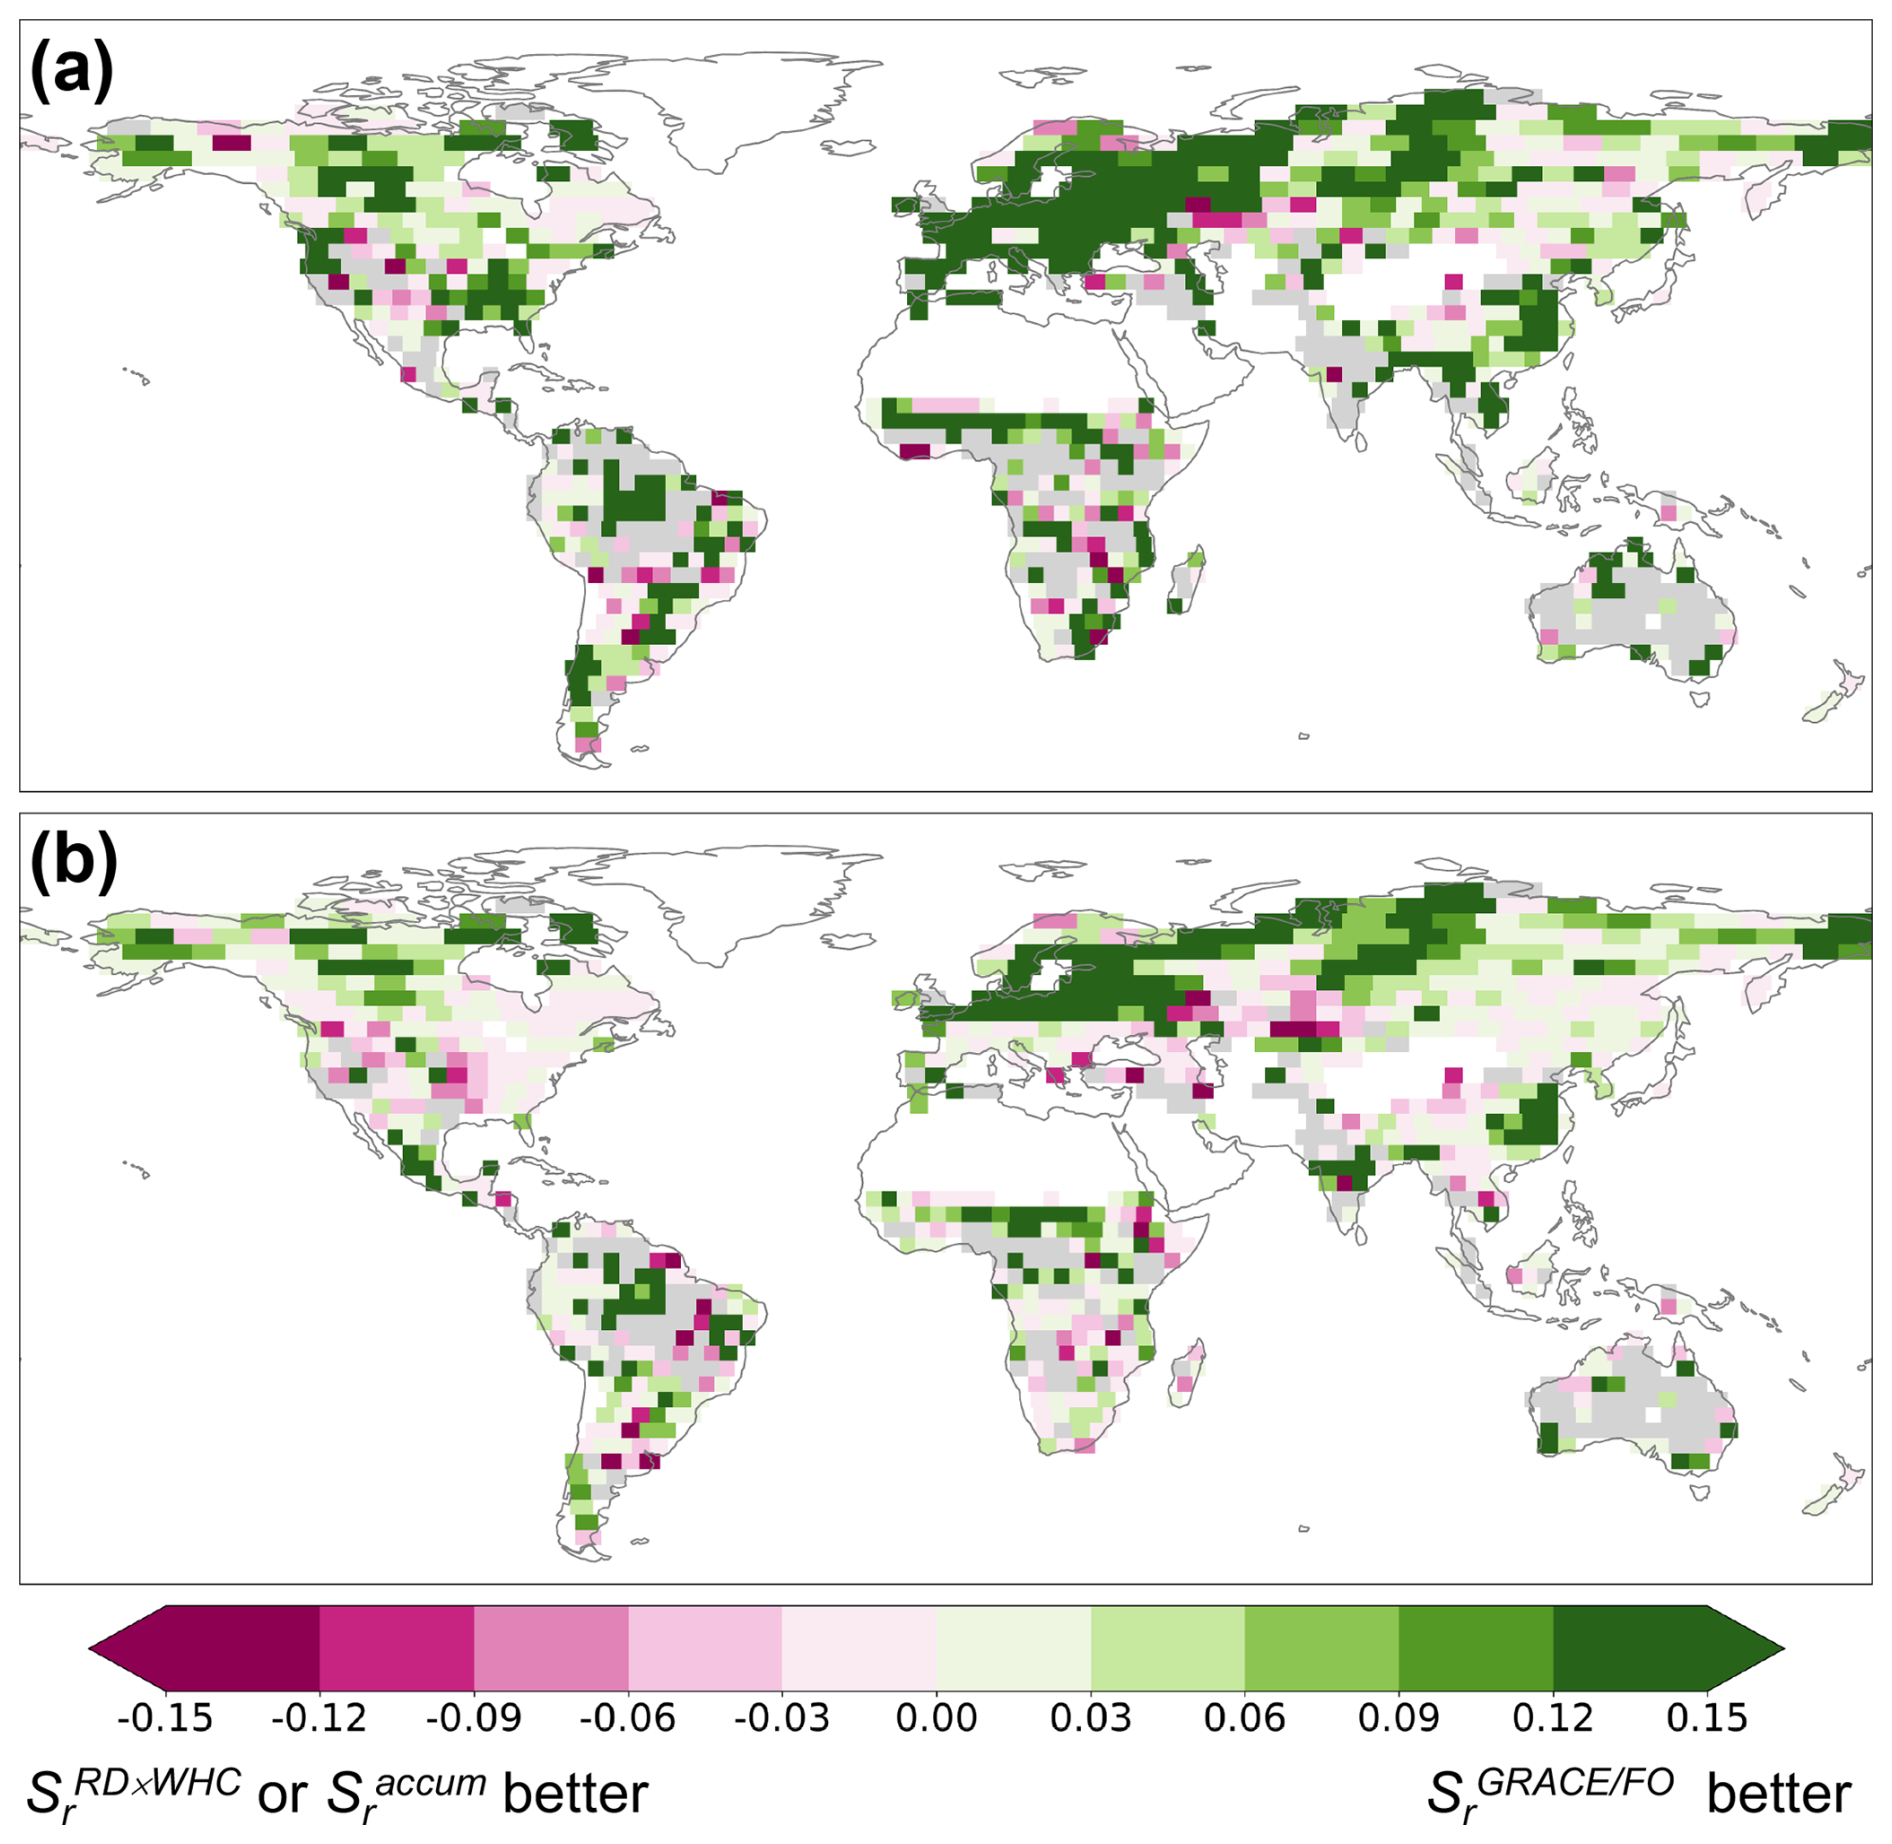
Figure 6 improves model performance notably in simulating standardized ET anomalies during drought periods across much of the globe. Panels (a) and (b) are similar to Fig. 5a and b, respectively, except they are for drought time periods. Gray areas indicate regions where all models fail to achieve a positive NSE value.
4.1 Limitations of and uncertainty in
Our estimate provides a conservative lower bound for Sr because the largest TWS drawdown during the GRACE/FO record period may not cover a period during which ET from storage exhausts the entire root-zone water storage capacity, particularly in areas experiencing water accumulation in the root zone due to increases in precipitation. This likely explains why our estimate is lower than that of in northern and eastern Africa, where strong increasing TWS trends were observed (Figs. 3b and A2) in response to increasing precipitation trends (e.g., Rodell et al., 2018). Additionally, our approach to account for groundwater pumping and surface water may overestimate these signals' actual magnitudes and, thus, likely contributes to underestimating Sr. Specifically, we assumed all negative TWS trends to be caused by groundwater withdrawals and removed them from . However, intense groundwater withdrawals are concentrated in specific regions such as northwestern India, California's Central Valley, and the North China Plain (Rodell et al., 2009; Feng et al., 2013; Liu et al., 2022). Consequently, we may have removed TWS depletion trends caused by natural variability, as seen in the drought-stricken southeast of Brazil (Rodell et al., 2018). This likely explains why is lower than there (Fig. 3b). Furthermore, we used total runoff (which includes surface runoff, snowmelt, and groundwater discharge) as a proxy to remove surface water storage change from the TWS drawdown. We used total runoff – as opposed to surface runoff alone (Wang et al., 2023a) – due to observational data availability, though doing so may lead to an overestimation of surface water storage change and, therefore, an underestimation of Sr.
4.2 vs. : impact of multi-year drawdowns and drought return period assumption
Despite being conservative, reveals a substantially larger volume of root-zone water storage capacity than . One reason for this discrepancy may be the lack of interannual storage variability considered in the calculation (Stocker et al., 2023). Although Stocker et al. (2023) used a cumulative water deficit approach to infer root-zone water storage drawdown, akin to our TWS drawdown approach, they found that the annual totals of P exceeded those of ET at almost all locations. The fact that their method resets the calculation whenever accumulated P − ET is positive suggests that their method was generally unable to account for carryover storage and multi-year drawdowns of root-zone storage. Our use of GRACE/FO TWS, which allows for multi-year drawdowns, is supported by recent observations (Goulden and Bales, 2019; McCormick et al., 2021; Pérez-Ruiz et al., 2022; Peterson et al., 2021; Scott and Biederman, 2019) and modeling efforts (Miguez-Macho and Fan, 2021; Livneh and Hoerling, 2016) suggesting widespread carryover storage effects. Our calculations of found that the largest TWS drawdown period lasted a median of 2.8 years, with an interquartile range between 1.6 and 5.2 years (Fig. 2c). Even the second- and third-largest TWS drawdowns had a median duration of more than 1 year globally (Fig. 3c–d). These findings align with the results reported in the previously referenced studies on carryover storage effects.
The discrepancy between and is further influenced by differences in how drought return periods are defined. values reported in Stocker et al. (2023) are statistically scaled to represent an 80-year drought return period rather than being directly derived from observed drought events. This extrapolation assumes a fixed probability distribution of drought occurrence, which may not fully capture real-world hydrological variability. In contrast, is based on observed multi-year TWS drawdowns from the period of 2002–2022, directly reflecting droughts that occurred over the past 2 decades. A more comparable approach would require using the unscaled , which was derived using Earth observations of precipitation and ET from the period of 2003–2018 without statistical adjustments. However, the unscaled is not publicly available. Given that the 80-year return period scaling inflates values and that is still substantially larger, it follows that the unscaled would be even lower, further supporting the conclusion that the approach underestimates root-zone storage capacity compared to .
4.3 Groundwater and rock moisture in and differences compared to
The estimate falls notably below that of both and . This discrepancy may be attributed to the approach ignoring plant access to moisture stored beneath the soil, such as in weathered and fractured bedrock and groundwater. These deep moisture sources are known to affect ET significantly, thus contributing to Sr (e.g., Fan et al., 2017; Rempe and Dietrich, 2018; McCormick et al., 2021). Unlike , the definitions of and incorporate natural variability in these deep moisture reserves, broadening the traditional root-zone concept beyond the unsaturated soil layer. This expanded definition acknowledges the dynamic nature of the root zone, with plants accessing deep groundwater and rock moisture during prolonged droughts and periods of high transpiration demand (Gao et al., 2024). Indeed, root-accessible water does not require roots to physically occupy the entire storage domain. Processes like capillary rise can move deep water upward to the traditional root zone for vegetation transpiration, especially during dry seasons and droughts.
The importance of including groundwater and rock moisture in Sr is well-supported by recent evidence. Studies using in situ groundwater (Fan et al., 2017; Thompson et al., 2011; Baldocchi et al., 2021; Li et al., 2015), remote sensing observations (Koirala et al., 2017; Rohde et al., 2024), and modeling efforts (Miguez-Macho and Fan, 2021; Hain et al., 2015) have demonstrated that plants can access these deep moisture sources and have highlighted their critical role in sustaining ET, especially during extreme droughts. In many ecosystems, water stress can stimulate root growth into deep subsurface layers through the capillary rise effect, with roots extending to the capillary fringe and the water table, as observed in both field and laboratory studies (Naumburg et al., 2005; Orellana et al., 2012; Fan et al., 2017; Kuzyakov and Razavi, 2019). Although individual shallow-rooted plants (e.g., grassland sites) may not directly tap into groundwater or rock moisture, the large spatial scale of GRACE/FO likely captures water uptake across diverse vegetation types. Even in areas primarily covered by shallow-rooted vegetation, deeper-rooted plants within the same GRACE/FO mascon may redistribute water upward through hydraulic redistribution, making it available for shallow-rooted plants to use (e.g., Espeleta et al., 2004; Orellana et al., 2012). In fact, satellite observations have confirmed widespread plant–groundwater interactions at large spatial scales (Koirala et al., 2017), even in dryland regions dominated by grasslands (Rohde et al., 2024; Wang et al., 2023b). Recognizing and incorporating groundwater and bedrock moisture into root-zone storage capacity can enhance our understanding of land–atmosphere interactions (Maxwell and Condon, 2016; Schlemmer et al., 2018; Dong et al., 2022), improve runoff simulations (Hahm et al., 2019), and provide a more accurate representation of vegetation resilience to droughts and heatwaves (Jiménez-Rodríguez et al., 2022; Esteban et al., 2021).
The approach, while useful for simplifying root-zone complexity, overlooks critical aspects of root density, its vertical and lateral distribution, and the ability of plants to access deep water stores – factors that have significant implications for understanding ecosystem water uptake and improving land models. For instance, this approach reduces the complexity of rooting systems into a single effective rooting-depth parameter (Federer et al., 2003; Speich et al., 2018), which tends to be shallower than both the maximum rooting depth (Federer et al., 2003) and the depth that contains the upper 95 % of the root biomass (Yang et al., 2016). These deeper layers, however, often play a disproportionately important role in ecosystem water uptake (Fan et al., 2017; Jackson et al., 1999; Bachofen et al., 2024). Additionally, when dividing with the same water-holding capacity (WHC) used in to calculate effective rooting depth, this depth exceeds 2 m in nearly 50 % of global vegetated areas, which is in contrast to Yang et al.'s (2016) estimate of 10 % and Stocker et al.'s (2023) estimate of 37 %. These results indicate that the potential for plants to tap into deep water stores is more prevalent than previously understood. For land models that do not explicitly incorporate Sr as a variable, this suggests that models with a soil depth of less than 2 m (e.g., the Noah model within the Global Land Data Assimilation System (GLDAS)) may be unable to accurately simulate these deeper water drawdowns. Consequently, this limitation could impact studies of groundwater that rely on GLDAS to separate soil moisture from TWS (e.g., Rodell et al., 2009).
4.4 Strengths and limitations of validation
Although direct observations of Sr at large spatial scales are limited, our validation effort for shows two notable strengths. First, we used an independent dataset for the validation of USGS models parameterized by different Sr estimates, unlike a previous study (Wang-Erlandsson et al., 2016), which relied on a dataset already used in their Sr calculation. Second, the GLEAM ET dataset used here for validation addresses key limitations of other gridded ET products by using a data-driven embedding of plant–water relationships (rather than explicitly assuming these a priori as most ET products do) and by explicitly accounting for groundwater contributions to ET (Miralles et al., 2025a).
Despite these strengths, our validation effort is not without limitations. First, the mechanistic linkage between Sr and commonly used hydrological indicators (e.g., ET and streamflow) is complex. Identifying decisive indicators that are highly sensitive to Sr is an ongoing research challenge. In this context, our findings provide an initial step towards understanding this relationship, demonstrating that a more accurate Sr improves simulations of drought-time ET anomalies more effectively than all-time variations (Figs. 5 and 6). However, resolving such a complex relationship is further complicated by model structural errors or uncertainties in other model parameters, which can obscure the true impact of accurate Sr parameterization on ecohydrological processes. For example, in our study, streamflow simulated by the USGS model is mainly driven by precipitation and shows limited sensitivity to Sr (results not shown). This aligns with the findings of another simple hydrologic model used by Wang-Erlandsson et al. (2016), as discussed in their open peer review file, where streamflow measurements were also not used for model evaluation. Second, we used standardized ET anomalies (z scores) as the validation target, focusing on temporal dynamics such as seasonal and interannual variations rather than absolute ET values. While this approach effectively mitigates the impact of data biases and ensures consistency, it narrows the scope of the validation.
4.5 Implications for high-resolution land surface models
Despite the coarse resolution of GRACE/FO observations, and our proposed approach remain valuable for improving the operational configuration of higher-resolution land models. First, can be used to evaluate and refine default Sr parameterizations within models once aggregated to the coarse scale of GRACE/FO data in conjunction with other diagnostic analyses. For instance, if a model underestimates ET during droughts in a region where its Sr value is significantly lower than that of , the default Sr value may be increased based on even if the model's resolution is much higher than that of . Second, in the future, our methodology can be extended to downscaled GRACE/FO products, leveraging techniques such as data assimilation systems or artificial intelligence to improve the spatial resolution of (Li et al., 2019; Gou and Soja, 2024).
We used GRACE/FO TWS observations to estimate root-zone water storage capacity (Sr), an essential yet challenging-to-observe variable. The overall improved performance of HydroModel() in simulating ET, particularly during droughts, implies that more accurately reflects the real-world root-zone water storage capacity compared to and . Overall, our results suggest that Sr is, on average, at least 50 % larger than the water-deficit-based estimate and a staggering 380 % larger compared to the rooting-depth-based estimate. The underestimations by and exceed the random error of , underscoring the need for continued refinement and validation of Sr. Underestimating Sr may lead to overestimating ecosystem sensitivity to water stress, potentially biasing predictions of future carbon cycles (Ukkola et al., 2021; Giardina et al., 2023). Given the strong coupling between the carbon and water cycles, underestimating Sr may also lead to underestimating ecosystem water consumption and overestimating human-available water resources, particularly during droughts and heatwaves, with important implications for water resource planning (Zhao et al., 2022; Mastrotheodoros et al., 2020).
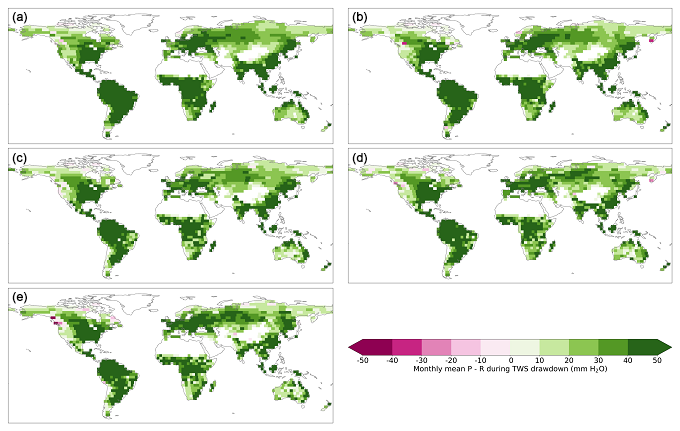
Figure A1The average P−R during the largest (a), the second-largest (b), the third-largest (c), the fourth-largest (d), and the fifth-largest (e) TWS drawdowns.
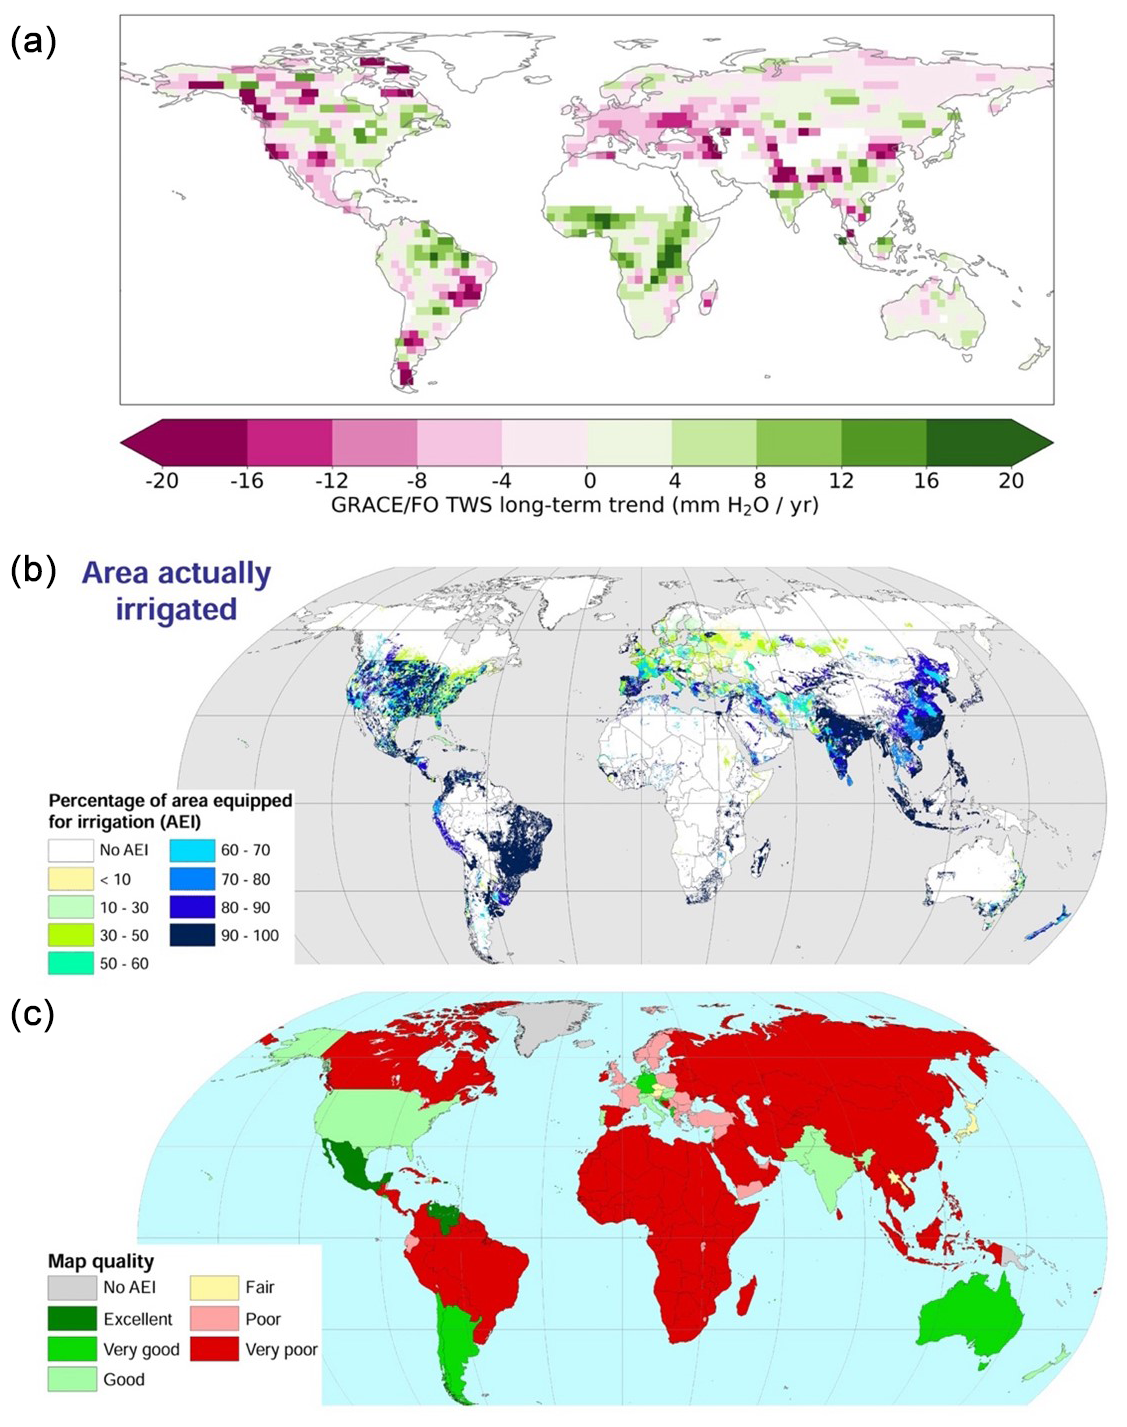
Figure A2(a) Trends in TWS obtained from GRACE/FO observations from 2002 to 2022. (b) Percentage of area equipped for irrigation that is actually irrigated. (c) Map quality marks assigned to each country for area equipped for irrigation in (b). Panels (b)–(c) are from the Global Map of Irrigation Areas version 5.0 by AQUASTAT.
The Python code for retrieving Sr from GRACE/FO is archived on Zenodo at https://doi.org/10.5281/zenodo.14970062 (Zhao, 2025).
The dataset is archived on Zenodo at https://doi.org/10.5281/zenodo.14970062 (Zhao, 2025). GRACE and GRACE-FO TWS data are available from the NASA JPL (https://grace.jpl.nasa.gov/data/get-data/jpl_global_mascons/, Wiese et al., 2018). The GPCP version 2.3 combined precipitation dataset is available at https://psl.noaa.gov/data/gridded/data.gpcp.html (Adler et al., 2003). The ERA5 reanalysis is available at https://www.ecmwf.int/en/forecasts/dataset/ecmwf-reanalysis-v5 (Hersbach et al., 2023). MODIS land cover data are available at https://lpdaac.usgs.gov/products/mcd12c1v006/ (Friedl and Sulla-Menashe, 2015). G-RUN global runoff reconstruction data are available at https://figshare.com/articles/dataset/GRUN_Global_Runoff_Reconstruction/9228176 (Ghiggi et al., 2019). GLEAM ET version 4.1 is available at https://doi.org/10.5281/zenodo.14056080 (Miralles et al., 2025b).
MZ: conceptualization, data curation, formal analysis, funding acquisition, methodology, writing (original draft). ELM: methodology, writing (review and editing). GA: methodology, writing (review and editing). AGK: writing (review and editing). BL: writing (review and editing).
The contact author has declared that none of the authors has any competing interests.
Publisher’s note: Copernicus Publications remains neutral with regard to jurisdictional claims made in the text, published maps, institutional affiliations, or any other geographical representation in this paper. While Copernicus Publications makes every effort to include appropriate place names, the final responsibility lies with the authors.
This study was funded by the USGS grant no. G24AP00031 to the University of Idaho. In addition, Erica L. McCormick was funded by the NSF Graduate Research Fellowship program, and Alexandra G. Konings was funded by the NSF DEB grant no. 1942133 and the Alfred P. Solan Foundation.
This research has been supported by the US Geological Survey (grant no. G24AP00031).
This paper was edited by Harrie-Jan Hendricks Franssen and reviewed by three anonymous referees.
Adler, R. F., Huffman, G. J., Chang, A., Ferraro, R., Xie, P., Janowiak, J., Rudolf, B., Schneider, U., Curtis, S., Bolvin, D., Gruber, A., Susskind, J., and Arkin, P.: The Version 2 Global Precipitation Climatology Project (GPCP) Monthly Precipitation Analysis (1979–Present), NOAA PSL, Boulder, Colorado, USA [data set], https://psl.noaa.gov/data/gridded/data.gpcp.html (last access: 14 May 2025), 2003.
Bachofen, C., Tumber-Dávila, S. J., Mackay, D. S., McDowell, N. G., Carminati, A., Klein, T., Stocker, B. D., Mencuccini, M., and Grossiord, C.: Tree water uptake patterns across the globe, New Phytol., 242, 1891–1910, https://doi.org/10.1111/nph.19762, 2024.
Baldocchi, D., Ma, S., and Verfaillie, J.: On the inter- and intra-annual variability of ecosystem evapotranspiration and water use efficiency of an oak savanna and annual grassland subjected to booms and busts in rainfall, Glob. Change Biol., 27, 359–375, https://doi.org/10.1111/gcb.15414, 2021.
Balland, V., Pollacco, J. A., and Arp, P. A.: Modeling soil hydraulic properties for a wide range of soil conditions, Ecol. Model., 219, 300–316, 2008.
Callahan, R. P., Riebe, C. S., Sklar, L. S., Pasquet, S., Ferrier, K. L., Hahm, W. J., Taylor, N. J., Grana, D., Flinchum, B. A., and Hayes, J. L.: Forest vulnerability to drought controlled by bedrock composition, Nat. Geosci., 15, 714–719, 2022.
Chen, Y., Velicogna, I., Famiglietti, J. S., and Randerson, J. T.: Satellite observations of terrestrial water storage provide early warning information about drought and fire season severity in the Amazon, J. Geophys. Res.-Biogeo., 118, 495–504, https://doi.org/10.1002/jgrg.20046, 2013.
Dong, J., Lei, F., and Crow, W. T.: Land transpiration-evaporation partitioning errors responsible for modeled summertime warm bias in the central United States, Nat. Commun., 13, 336, https://doi.org/10.1038/s41467-021-27938-6, 2022.
Espeleta, J. F., West, J. B., and Donovan, L. A.: Species-specific patterns of hydraulic lift in co-occurring adult trees and grasses in a sandhill community, Oecologia, 138, 341–349, https://doi.org/10.1007/s00442-003-1460-8, 2004.
Esteban, E. J. L., Castilho, C. V., Melgaço, K. L., and Costa, F. R. C.: The other side of droughts: wet extremes and topography as buffers of negative drought effects in an Amazonian forest, New Phytol., 229, 1995–2006, https://doi.org/10.1111/nph.17005, 2021.
Fan, Y., Miguez-Macho, G., Jobbágy, E. G., Jackson, R. B., and Otero-Casal, C.: Hydrologic regulation of plant rooting depth, P. Natl. Acad. Sci. USA, 114, 10572–10577, https://doi.org/10.1073/pnas.1712381114, 2017.
Federer, C., Vörösmarty, C., and Fekete, B.: Sensitivity of annual evaporation to soil and root properties in two models of contrasting complexity, J. Hydrometeorol., 4, 1276–1290, 2003.
Feng, W., Zhong, M., Lemoine, J.-M., Biancale, R., Hsu, H.-T., and Xia, J.: Evaluation of groundwater depletion in North China using the Gravity Recovery and Climate Experiment (GRACE) data and ground-based measurements, Water Resour. Res., 49, 2110–2118, https://doi.org/10.1002/wrcr.20192, 2013.
Friedl, M. and Sulla-Menashe, D.: MCD12C1 MODIS/Terra+Aqua Land Cover Type Yearly L3 Global 0.05Deg CMG V006, NASA EOSDIS Land Processes Distributed Active Archive Center [data set], https://lpdaac.usgs.gov/products/mcd12c1v006/ (last access: 14 May 2025), 2015.
Gao, H., Hrachowitz, M., Schymanski, S. J., Fenicia, F., Sriwongsitanon, N., and Savenije, H. H. G.: Climate controls how ecosystems size the root zone storage capacity at catchment scale, Geophys. Res. Lett., 41, 7916–7923, https://doi.org/10.1002/2014GL061668, 2014.
Gao, H., Hrachowitz, M., Wang-Erlandsson, L., Fenicia, F., Xi, Q., Xia, J., Shao, W., Sun, G., and Savenije, H. H. G.: Root zone in the Earth system, Hydrol. Earth Syst. Sci., 28, 4477–4499, https://doi.org/10.5194/hess-28-4477-2024, 2024.
Gebremichael, M., Krajewski, W. F., Morrissey, M., Langerud, D., Huffman, G. J., and Adler, R.: Error Uncertainty Analysis of GPCP Monthly Rainfall Products: A Data-Based Simulation Study, J. Appl. Meteorol., 42, 1837–1848, https://doi.org/10.1175/1520-0450(2003)042<1837:Euaogm>2.0.Co;2, 2003.
Ghiggi, G., Gudmundsson, L., and Humphrey, V.: G-RUN: Global Runoff Reconstruction, figshare [data set], https://figshare.com/articles/dataset/GRUN_Global_Runoff_Reconstruction/9228176 (last access: 14 May 2025), 2019.
Ghiggi, G., Humphrey, V., Seneviratne, S. I., and Gudmundsson, L.: G-RUN ENSEMBLE: A Multi-Forcing Observation-Based Global Runoff Reanalysis, Water Resour. Res., 57, e2020WR028787, https://doi.org/10.1029/2020WR028787, 2021.
Giardina, F., Gentine, P., Konings, A. G., Seneviratne, S. I., and Stocker, B. D.: Diagnosing evapotranspiration responses to water deficit across biomes using deep learning, New Phytol., 240, 968–983, https://doi.org/10.1111/nph.19197, 2023.
Gou, J. and Soja, B.: Global high-resolution total water storage anomalies from self-supervised data assimilation using deep learning algorithms, Nature Water, 2, 139–150, https://doi.org/10.1038/s44221-024-00194-w, 2024.
Goulden, M. L. and Bales, R. C.: California forest die-off linked to multi-year deep soil drying in 2012–2015 drought, Nat. Geosci., 12, 632–637, https://doi.org/10.1038/s41561-019-0388-5, 2019.
Hahm, W. J., Rempe, D., Dralle, D., Dawson, T., and Dietrich, W.: Oak transpiration drawn from the weathered bedrock vadose zone in the summer dry season, Water Resour. Res., 56, e2020WR027419, https://doi.org/10.1029/2020WR027419, 2020.
Hahm, W. J., Dralle, D. N., Rempe, D. M., Bryk, A. B., Thompson, S. E., Dawson, T. E., and Dietrich, W. E.: Low Subsurface Water Storage Capacity Relative to Annual Rainfall Decouples Mediterranean Plant Productivity and Water Use From Rainfall Variability, Geophys. Res. Lett., 46, 6544–6553, https://doi.org/10.1029/2019GL083294, 2019.
Hain, C. R., Crow, W. T., Anderson, M. C., and Yilmaz, M. T.: Diagnosing Neglected Soil Moisture Source–Sink Processes via a Thermal Infrared–Based Two-Source Energy Balance Model, J. Hydrometeorol., 16, 1070–1086, https://doi.org/10.1175/JHM-D-14-0017.1, 2015.
Hersbach, H., Bell, B., Berrisford, P., Hirahara, S., Horányi, A., Muñoz-Sabater, J., Nicolas, J., Peubey, C., Radu, R., Schepers, D., Simmons, A., Soci, C., Abdalla, S., Abellan, X., Balsamo, G., Bechtold, P., Biavati, G., Bidlot, J., Bonavita, M., De Chiara, G., Dahlgren, P., Dee, D., Diamantakis, M., Dragani, R., Flemming, J., Forbes, R., Fuentes, M., Geer, A., Haimberger, L., Healy, S., Hogan, R. J., Hólm, E., Janisková, M., Keeley, S., Laloyaux, P., Lopez, P., Lupu, C., Radnoti, G., de Rosnay, P., Rozum, I., Vamborg, F., Villaume, S., and Thépaut, J.-N.: The ERA5 global reanalysis, Q. J. Roy. Meteor. Soc., 146, 1999–2049, https://doi.org/10.1002/qj.3803, 2020.
Hersbach, H., Bell, B., Berrisford, P., Biavati, G., Horányi, A., Muñoz Sabater, J., Nicolas, J., Peubey, C., Radu, R., Rozum, I., Schepers, D., Simmons, A., Soci, C., Dee, D., and Thépaut, J.-N.: ERA5 monthly averaged data on pressure levels from 1940 to present, Copernicus Climate Change Service (C3S) Climate Data Store (CDS) [data set], https://www.ecmwf.int/en/forecasts/dataset/ecmwf-reanalysis-v5 (last access: 14 May 2025), 2023.
Hulsman, P., Keune, J., Koppa, A., Schellekens, J., and Miralles, D. G.: Incorporating Plant Access to Groundwater in Existing Global, Satellite-Based Evaporation Estimates, Water Resour. Res., 59, e2022WR033731, https://doi.org/10.1029/2022WR033731, 2023.
Humphrey, V., Zscheischler, J., Ciais, P., Gudmundsson, L., Sitch, S., and Seneviratne, S. I.: Sensitivity of atmospheric CO2 growth rate to observed changes in terrestrial water storage, Nature, 560, 628–631, https://doi.org/10.1038/s41586-018-0424-4, 2018.
Jackson, R. B., Moore, L. A., Hoffmann, W. A., Pockman, W. T., and Linder, C. R.: Ecosystem rooting depth determined with caves and DNA, P. Natl. Acad. Sci. USA, 96, 11387–11392, https://doi.org/10.1073/pnas.96.20.11387, 1999.
Jiménez-Rodríguez, C. D., Sulis, M., and Schymanski, S.: Exploring the role of bedrock representation on plant transpiration response during dry periods at four forested sites in Europe, Biogeosciences, 19, 3395–3423, https://doi.org/10.5194/bg-19-3395-2022, 2022.
Koirala, S., Jung, M., Reichstein, M., de Graaf, I. E. M., Camps-Valls, G., Ichii, K., Papale, D., Ráduly, B., Schwalm, C. R., Tramontana, G., and Carvalhais, N.: Global distribution of groundwater-vegetation spatial covariation, Geophys. Res. Lett., 44, 4134–4142, https://doi.org/10.1002/2017GL072885, 2017.
Koppa, A., Rains, D., Hulsman, P., Poyatos, R., and Miralles, D. G.: A deep learning-based hybrid model of global terrestrial evaporation, Nat. Commun., 13, 1912, https://doi.org/10.1038/s41467-022-29543-7, 2022.
Kuzyakov, Y. and Razavi, B. S.: Rhizosphere size and shape: Temporal dynamics and spatial stationarity, Soil Biol. Biochem., 135, 343–360, https://doi.org/10.1016/j.soilbio.2019.05.011, 2019.
Li, B., Rodell, M., and Famiglietti, J. S.: Groundwater variability across temporal and spatial scales in the central and northeastern U.S, J. Hydrol., 525, 769–780, https://doi.org/10.1016/j.jhydrol.2015.04.033, 2015.
Li, B., Rodell, M., Kumar, S., Beaudoing, H. K., Getirana, A., Zaitchik, B. F., de Goncalves, L. G., Cossetin, C., Bhanja, S., and Mukherjee, A.: Global GRACE data assimilation for groundwater and drought monitoring: Advances and challenges, Water Resour. Res., 55, 7564–7586, 2019.
Liu, P.-W., Famiglietti, J. S., Purdy, A. J., Adams, K. H., McEvoy, A. L., Reager, J. T., Bindlish, R., Wiese, D. N., David, C. H., and Rodell, M.: Groundwater depletion in California's Central Valley accelerates during megadrought, Nat. Commun., 13, 7825, https://doi.org/10.1038/s41467-022-35582-x, 2022.
Livneh, B. and Hoerling, M. P.: The Physics of Drought in the U.S. Central Great Plains, J. Climate, 29, 6783–6804, https://doi.org/10.1175/JCLI-D-15-0697.1, 2016.
Mastrotheodoros, T., Pappas, C., Molnar, P., Burlando, P., Manoli, G., Parajka, J., Rigon, R., Szeles, B., Bottazzi, M., Hadjidoukas, P., and Fatichi, S.: More green and less blue water in the Alps during warmer summers, Nat. Clim. Change, 10, 155–161, https://doi.org/10.1038/s41558-019-0676-5, 2020.
Maxwell, R. M. and Condon, L. E.: Connections between groundwater flow and transpiration partitioning, Science, 353, 377–380, https://doi.org/10.1126/science.aaf7891, 2016.
McCabe, G. J. and Markstrom, S. L.: A monthly water-balance model driven by a graphical user interface, US Geological Survey Reston, VA, USA, https://doi.org/10.3133/ofr20071088, 2007.
McCormick, E. L., Dralle, D. N., Hahm, W. J., Tune, A. K., Schmidt, L. M., Chadwick, K. D., and Rempe, D. M.: Widespread woody plant use of water stored in bedrock, Nature, 597, 225–229, https://doi.org/10.1038/s41586-021-03761-3, 2021.
McKee, T. B., Doesken, N. J., and Kleist, J.: The relationship of drought frequency and duration to time scales, Proceedings of the 8th Conference on Applied Climatology, Anaheim, California, USA, 17–22 January 1993, 179–183, https://www.droughtmanagement.info/literature/AMS_Relationship_Drought_Frequency_Duration_Time_Scales_1993.pdf (last access: 14 May 2025), 1993.
Miguez-Macho, G. and Fan, Y.: Spatiotemporal origin of soil water taken up by vegetation, Nature, 598, 624–628, https://doi.org/10.1038/s41586-021-03958-6, 2021.
Miralles, D. G., Bonte, O., Koppa, A., Baez-Villanueva, O. M., Tronquo, E., Zhong, F., Beck, H. E., Hulsman, P., Dorigo, W., Verhoest, N. E., and Haghdoost S.: GLEAM4: global land evaporation and soil moisture dataset at 0.1 resolution from 1980 to near present, Scientific Data, 12, 416, https://doi.org/10.1038/s41597-025-04610-y, 2025a.
Miralles, D. G., Bonte, O., Koppa, A., Baez-Villanueva, O. M., Tronquo, E., Zhong, F., Beck, H. E., Hulsman, P., Dorigo, W., Verhoest, N. E. C., and Haghdoost, S.: GLEAM4 (v4.1), Zenodo [data set], https://doi.org/10.5281/zenodo.14056080, 2025b.
Miralles, D. G., Jiménez, C., Jung, M., Michel, D., Ershadi, A., McCabe, M. F., Hirschi, M., Martens, B., Dolman, A. J., Fisher, J. B., Mu, Q., Seneviratne, S. I., Wood, E. F., and Fernández-Prieto, D.: The WACMOS-ET project – Part 2: Evaluation of global terrestrial evaporation data sets, Hydrol. Earth Syst. Sci., 20, 823–842, https://doi.org/10.5194/hess-20-823-2016, 2016.
Nash, J. E. and Sutcliffe, J. V.: River flow forecasting through conceptual models part I – A discussion of principles, J. Hydrol., 10, 282–290, 1970.
Naumburg, E., Mata-gonzalez, R., Hunter, R. G., McLendon, T., and Martin, D. W.: Phreatophytic Vegetation and Groundwater Fluctuations: A Review of Current Research and Application of Ecosystem Response Modeling with an Emphasis on Great Basin Vegetation, Environ. Manage., 35, 726–740, https://doi.org/10.1007/s00267-004-0194-7, 2005.
Novick, K. A., Ficklin, D. L., Baldocchi, D., Davis, K. J., Ghezzehei, T. A., Konings, A. G., MacBean, N., Raoult, N., Scott, R. L., Shi, Y., Sulman, B. N., and Wood, J. D.: Confronting the water potential information gap, Nat. Geosci., 15, 158–164, https://doi.org/10.1038/s41561-022-00909-2, 2022.
Orellana, F., Verma, P., Loheide II, S. P., and Daly, E.: Monitoring and modeling water-vegetation interactions in groundwater-dependent ecosystems, Rev. Geophys., 50, RG3003, https://doi.org/10.1029/2011RG000383, 2012.
Pérez-Ruiz, E. R., Vivoni, E. R., and Sala, O. E.: Seasonal carryover of water and effects on carbon dynamics in a dryland ecosystem, Ecosphere, 13, e4189, https://doi.org/10.1002/ecs2.4189, 2022.
Peterson, T. J., Saft, M., Peel, M. C., and John, A.: Watersheds may not recover from drought, Science, 372, 745–749, https://doi.org/10.1126/science.abd5085, 2021.
Rempe, D. M. and Dietrich, W. E.: Direct observations of rock moisture, a hidden component of the hydrologic cycle, P. Natl. Acad. Sci. USA, 115, 2664–2669, https://doi.org/10.1073/pnas.1800141115, 2018.
Rodell, M., Velicogna, I., and Famiglietti, J. S.: Satellite-based estimates of groundwater depletion in India, Nature, 460, 999–1002, https://doi.org/10.1038/nature08238, 2009.
Rodell, M., Chao, B. F., Au, A. Y., Kimball, J. S., and McDonald, K. C.: Global biomass variation and its geodynamic effects: 1982–98, Earth Interact., 9, 1–19, 2005.
Rodell, M., Famiglietti, J. S., Wiese, D. N., Reager, J. T., Beaudoing, H. K., Landerer, F. W., and Lo, M. H.: Emerging trends in global freshwater availability, Nature, 557, 651–659, https://doi.org/10.1038/s41586-018-0123-1, 2018.
Rohde, M. M., Albano, C. M., Huggins, X., Klausmeyer, K. R., Morton, C., Sharman, A., Zaveri, E., Saito, L., Freed, Z., Howard, J. K., Job, N., Richter, H., Toderich, K., Rodella, A.-S., Gleeson, T., Huntington, J., Chandanpurkar, H. A., Purdy, A. J., Famiglietti, J. S., Singer, M. B., Roberts, D. A., Caylor, K., and Stella, J. C.: Groundwater-dependent ecosystem map exposes global dryland protection needs, Nature, 632, 101–107, https://doi.org/10.1038/s41586-024-07702-8, 2024.
Schlemmer, L., Schär, C., Lüthi, D., and Strebel, L.: A Groundwater and Runoff Formulation for Weather and Climate Models, J. Adv. Model. Earth Sy., 10, 1809–1832, https://doi.org/10.1029/2017MS001260, 2018.
Scott, R. L. and Biederman, J. A.: Critical Zone Water Balance Over 13 Years in a Semiarid Savanna, Water Resour. Res., 55, 574–588, https://doi.org/10.1029/2018WR023477, 2019.
Seneviratne, S. I., Corti, T., Davin, E. L., Hirschi, M., Jaeger, E. B., Lehner, I., Orlowsky, B., and Teuling, A. J.: Investigating soil moisture–climate interactions in a changing climate: A review, Earth-Sci. Rev., 99, 125–161, https://doi.org/10.1016/j.earscirev.2010.02.004, 2010.
Speich, M. J. R., Lischke, H., and Zappa, M.: Testing an optimality-based model of rooting zone water storage capacity in temperate forests, Hydrol. Earth Syst. Sci., 22, 4097–4124, https://doi.org/10.5194/hess-22-4097-2018, 2018.
Stocker, B. D., Tumber-Dávila, S. J., Konings, A. G., Anderson, M. C., Hain, C., and Jackson, R. B.: Global patterns of water storage in the rooting zones of vegetation, Nat. Geosci., 16, 250–256, https://doi.org/10.1038/s41561-023-01125-2, 2023.
Stoy, P. C., El-Madany, T. S., Fisher, J. B., Gentine, P., Gerken, T., Good, S. P., Klosterhalfen, A., Liu, S., Miralles, D. G., Perez-Priego, O., Rigden, A. J., Skaggs, T. H., Wohlfahrt, G., Anderson, R. G., Coenders-Gerrits, A. M. J., Jung, M., Maes, W. H., Mammarella, I., Mauder, M., Migliavacca, M., Nelson, J. A., Poyatos, R., Reichstein, M., Scott, R. L., and Wolf, S.: Reviews and syntheses: Turning the challenges of partitioning ecosystem evaporation and transpiration into opportunities, Biogeosciences, 16, 3747–3775, https://doi.org/10.5194/bg-16-3747-2019, 2019.
Sulla-Menashe, D. and Friedl, M. A.: User guide to collection 6 MODIS land cover (MCD12Q1 and MCD12C1) product, USGS: Reston, VA, USA, 1–18, https://lpdaac.usgs.gov/documents/438/MCD12Q1_User_Guide_V51.pdf (last access: 14 May 2025), 2018.
Sun, Q., Miao, C., Duan, Q., Ashouri, H., Sorooshian, S., and Hsu, K.-L.: A Review of Global Precipitation Data Sets: Data Sources, Estimation, and Intercomparisons, Rev. Geophys., 56, 79–107, https://doi.org/10.1002/2017RG000574, 2018.
Teuling, A. J., Seneviratne, S. I., Williams, C., and Troch, P. A.: Observed timescales of evapotranspiration response to soil moisture, Geophys. Res. Lett., 33, L23403, https://doi.org/10.1029/2006GL028178, 2006.
Thompson, S. E., Harman, C. J., Konings, A. G., Sivapalan, M., Neal, A., and Troch, P. A.: Comparative hydrology across AmeriFlux sites: The variable roles of climate, vegetation, and groundwater, Water Resour. Res., 47, W00J07, https://doi.org/10.1029/2010WR009797, 2011.
Ukkola, A. M., De Kauwe, M. G., Roderick, M. L., Burrell, A., Lehmann, P., and Pitman, A. J.: Annual precipitation explains variability in dryland vegetation greenness globally but not locally, Glob. Change Biol., 27, 4367–4380, https://doi.org/10.1111/gcb.15729, 2021.
Vereecken, H., Amelung, W., Bauke, S. L., Bogena, H., Brüggemann, N., Montzka, C., Vanderborght, J., Bechtold, M., Blöschl, G., Carminati, A., Javaux, M., Konings, A. G., Kusche, J., Neuweiler, I., Or, D., Steele-Dunne, S., Verhoef, A., Young, M., and Zhang, Y.: Soil hydrology in the Earth system, Nature Reviews Earth & Environment, 3, 573–587, https://doi.org/10.1038/s43017-022-00324-6, 2022.
Wang, S., Li, J., and Russell, H. A. J.: Methods for Estimating Surface Water Storage Changes and Their Evaluations, J. Hydrometeorol., 24, 445–461, https://doi.org/10.1175/JHM-D-22-0098.1, 2023a.
Wang, T., Wu, Z., Wang, P., Wu, T., Zhang, Y., Yin, J., Yu, J., Wang, H., Guan, X., Xu, H., Yan, D., and Yan, D.: Plant-groundwater interactions in drylands: A review of current research and future perspectives, Agr. Forest Meteorol., 341, 109636, https://doi.org/10.1016/j.agrformet.2023.109636, 2023b.
Wang-Erlandsson, L., Bastiaanssen, W. G. M., Gao, H., Jägermeyr, J., Senay, G. B., van Dijk, A. I. J. M., Guerschman, J. P., Keys, P. W., Gordon, L. J., and Savenije, H. H. G.: Global root zone storage capacity from satellite-based evaporation, Hydrol. Earth Syst. Sci., 20, 1459–1481, https://doi.org/10.5194/hess-20-1459-2016, 2016.
Watkins, M. M., Wiese, D. N., Yuan, D.-N., Boening, C., and Landerer, F. W.: Improved methods for observing Earth's time variable mass distribution with GRACE using spherical cap mascons, J. Geophys. Res.-Sol. Ea., 120, 2648–2671, https://doi.org/10.1002/2014JB011547, 2015.
Wieder, W., Boehnert, J., Bonan, G., and Langseth, M.: Regridded Harmonized World Soil Database v1.2, Oak Ridge National Laboratory Distributed Active Archive Center, Oak Ridge, Tennessee, USA [data set], https://doi.org/10.3334/ORNLDAAC/1247, 2014.
Wiese, D. N., Landerer, F. W., and Watkins, M. M.: Quantifying and reducing leakage errors in the JPL RL05M GRACE mascon solution, Water Resour. Res., 52, 7490–7502, https://doi.org/10.1002/2016WR019344, 2016.
Wiese, D. N., Yuan, D.-N., Boening, C., Landerer, F. W., and Watkins, M. M.: JPL GRACE Mascon Ocean, Ice, and Hydrology Equivalent Water Height Release 06 Coastal Resolution Improvement (CRI) Filtered Version 1.0, PO.DAAC, CA, USA [data set], https://grace.jpl.nasa.gov/data/get-data/jpl_global_mascons/ (last access: 14 May 2025), 2018.
Yang, Y., Donohue, R. J., and McVicar, T. R.: Global estimation of effective plant rooting depth: Implications for hydrological modeling, Water Resour. Res., 52, 8260–8276, https://doi.org/10.1002/2016WR019392, 2016.
Zhao, M.: Substantial root-zone water storage capacity observed by GRACE and GRACE/FO, Zenodo [data set] and [code], https://doi.org/10.5281/zenodo.14970062, 2025.
Zhao, M., A, G., Liu, Y., and Konings, A. G.: Evapotranspiration frequently increases during droughts, Nat. Clim. Change, 12, 1024-1030, https://doi.org/10.1038/s41558-022-01505-3, 2022.
Zhao, M., A, G., Zhang, J., Velicogna, I., Liang, C., and Li, Z.: Ecological restoration impact on total terrestrial water storage, Nature Sustainability, 4, 56–62, https://doi.org/10.1038/s41893-020-00600-7, 2021.