the Creative Commons Attribution 4.0 License.
the Creative Commons Attribution 4.0 License.
 | 19 May 2025
Delayed stormflow generation in a semi-humid forested watershed controlled by soil water storage and groundwater dynamics
Zhen Cui
Recent research by Cui et al. (2024) identified a distinct threshold governing bimodal rainfall–runoff events in a semi-humid mountainous forested watershed in north China, where delayed stormflow was influenced by shallow groundwater dynamics. Building on these findings, this study further investigates the mechanisms driving these bimodal events, focusing on the interactions between soil water content (SWC) and groundwater level (GWL) during storm events. The results show that delayed stormflow is primarily governed by the interplay between SWC and GWL. Delayed stormflow is initiated when SWC exceeds the soil's water storage capacity, and its timing and magnitude are further modulated by GWL fluctuations. During rainfall, SWC increases rapidly but stabilizes after the rain ceases if the soil's water-holding capacity is not reached. Conversely, when SWC surpasses the storage capacity, the excess rainwater infiltrates into the subsurface, recharging groundwater and causing a gradual rise in GWL. As GWL rises, enhanced hydraulic conductivity facilitates the lateral movement of shallow groundwater towards the stream channel, generating delayed stormflow. When the GWL surpasses a critical threshold, its responses across the watershed become synchronized, significantly boosting groundwater discharge and reducing lag times. In extreme cases, the delayed stormflow peak converges with the direct stormflow peak. These findings enhance the understanding of delayed stormflow mechanisms in semi-humid mountainous watersheds and refine runoff generation theories by elucidating the threshold-driven processes governing the timing and magnitude of delayed stormflow.
- Article
(3374 KB) - Full-text XML
- BibTeX
- EndNote


-
Threshold dynamics between soil water content and groundwater levels govern delayed stormflow generation.
-
Groundwater fluctuations regulate the timing, magnitude, and merging of delayed and direct stormflow peaks.
-
Hydrological connectivity and hydraulic conductivity increase with rising groundwater levels, driving delayed stormflow.
Stormflow processes in the Xitaizi experimental watershed (XEW), located in north China, frequently exhibit bimodal stormflow hydrographs (Fig. A1), which are often associated with significant stormflow and associated localized inundation. Analysis of 15 such events over the past decade revealed that the onset of these bimodal hydrographs is governed by threshold behavior. Specifically, delayed streamflow peaks tend to emerge when the combined total of the event rainfall and antecedent soil moisture index exceeds 200 mm. The authors' findings suggest that shallow groundwater contributions are primarily responsible for these delayed stormflow events (Cui et al., 2024). However, the mechanisms behind the development of these bimodal hydrographs, which represent complex emergent hydrological behaviors, remain poorly understood. Understanding the formation of delayed stormflow is critical for advancing our comprehension of runoff generation processes and improving flood forecasting.
Bimodal hydrographs, characterized by dual streamflow peaks, typically occur during the wetting-up phases of catchments. Extensive research has identified several factors that influence dual streamflow peaks, including antecedent soil moisture, antecedent precipitation, groundwater levels, soil water storage, and rainfall amount (Haga et al., 2005; Graeff et al., 2009; Anderson and Burt, 1978; Padilla et al., 2015; Martínez-Carreras et al., 2016). Despite these advancements, the specific mechanisms that lead to threshold behavior and the question of how these mechanisms produce the diverse shapes of stormflow hydrographs remain inadequately explained. For instance, Martínez-Carreras et al. (2016) found that a delayed peak only occurred when watershed storage reached a critical threshold of 113 mm in their specific study area. However, the precise reasons for this threshold and the underlying processes remain unclear.
The occurrence of bimodal hydrographs reflects a nonlinear runoff response, which offers a valuable insight into the complex interactions between rainfall and runoff. The nonlinear pattern, characterized by both the timing and the magnitude of the response, plays a crucial role in understanding stormflow processes. Recent decades have seen an increase in research on nonlinear and threshold changes in rainfall–runoff responses, contributing to a deeper understanding of stormflow generation mechanisms. Nonlinear patterns, often characterized by rapid runoff responses that may lead to flooding, have been extensively documented in recent decades (Detty and McGuire, 2010; Farrick and Branfireun, 2014; Graham et al., 2010; Tromp-van Meerveld and McDonnell, 2006a; Penna et al., 2011; Scaife et al., 2020). However, many studies have yet to fully explore the intricate post-threshold mechanisms of these nonlinear shifts, leaving a gap in our understanding of stormflow generation across various catchments. While threshold behaviors are widely recognized, the detailed processes governing these shifts and their subsequent runoff dynamics remain underexplored.
Bimodal stormflow responses present an opportunity to investigate the relationship between rainfall thresholds and runoff generation, offering new perspectives on the timing and variability of stormflow. Despite this, many studies fail to distinguish between unimodal and bimodal streamflow responses. For example, Detty and McGuire (2010) focused on hydrological threshold responses but did not differentiate between unimodal and bimodal hydrographs as their study primarily addressed general nonlinear rainfall–runoff processes. Similarly, Martínez-Carreras et al. (2016) observed delayed peaks and identified catchment storage as a key factor influencing streamflow responses. However, they did not explicitly differentiate the underlying mechanisms between unimodal and bimodal responses. Such limitations often arise because the second peak in bimodal responses typically occurs after the rainfall event has ended, whereas many studies focus on streamflow changes during the event. Additionally, bimodal responses are influenced by catchment-specific topography and geology, making them less observable in certain regions. These challenges highlight the need for a deeper understanding of bimodal streamflow responses. Such research would enable the grouping of similar hydrologic responses and facilitate comparisons between stormflow generation processes across different watersheds (Graham and McDonnell, 2010; Tromp-van Meerveld and McDonnell, 2006a, b).
Numerous studies across diverse regions have explored the role of soil water content and groundwater levels in generating delayed peaks in stormflow. Detty and McGuire (2010) emphasized subsurface flow thresholds in a forested catchment in the USA, while Farrick and Branfireun (2014) analyzed soil moisture and groundwater interactions in Canadian wetlands. Penna et al. (2011) examined antecedent soil moisture and storage thresholds in alpine catchments in New Zealand. These studies, along with others from Japan (Haga et al., 2005) and Europe (Graeff et al., 2009), contribute to our understanding of threshold behavior in stormflow. However, while these studies highlight the occurrence of thresholds, the complex interactions that drive post-threshold runoff processes remain insufficiently understood.
Investigating stormflow events in semi-humid regions, such as XEW, is challenging due to the relatively arid climate and low runoff coefficients. Over nearly a decade, 95 storm events were identified and analyzed in XEW, offering a rare and valuable dataset for examining bimodal stormflow responses in such regions. This study builds on prior findings to uncover the processes underlying delayed stormflow patterns. We hypothesize that the generation of delayed stormflow is governed by threshold-dependent interactions between the soil water content (SWC) and groundwater level (GWL). The primary objectives of this study are (1) to analyze the temporal dynamics of SWC and GWL during storm events, (2) to elucidate the mechanisms driving the threshold behavior observed in bimodal hydrographs, and (3) to reveal the underlying processes responsible for delayed stormflow in XEW.
2.1 Study site
The study was conducted in the Xitaizi experimental watershed (XEW), a 4.22 km2 catchment located in north China (40°32′ N, 116°37′ E), approximately 70 km northeast of Beijing (Fig. 1). The watershed's elevation ranges from 676 to 1201 m above sea level, and the region experiences a monsoon-influenced semi-humid climate. The average annual precipitation is 625 mm, with 80 % concentrated between June and September. The mean annual temperature is 11.5 °C, with an average relative humidity of 59.1 %. Forests cover 98 % of the watershed, with broad-leaved species and shrubberies accounting for 54.2 % and 33.0 %, respectively.
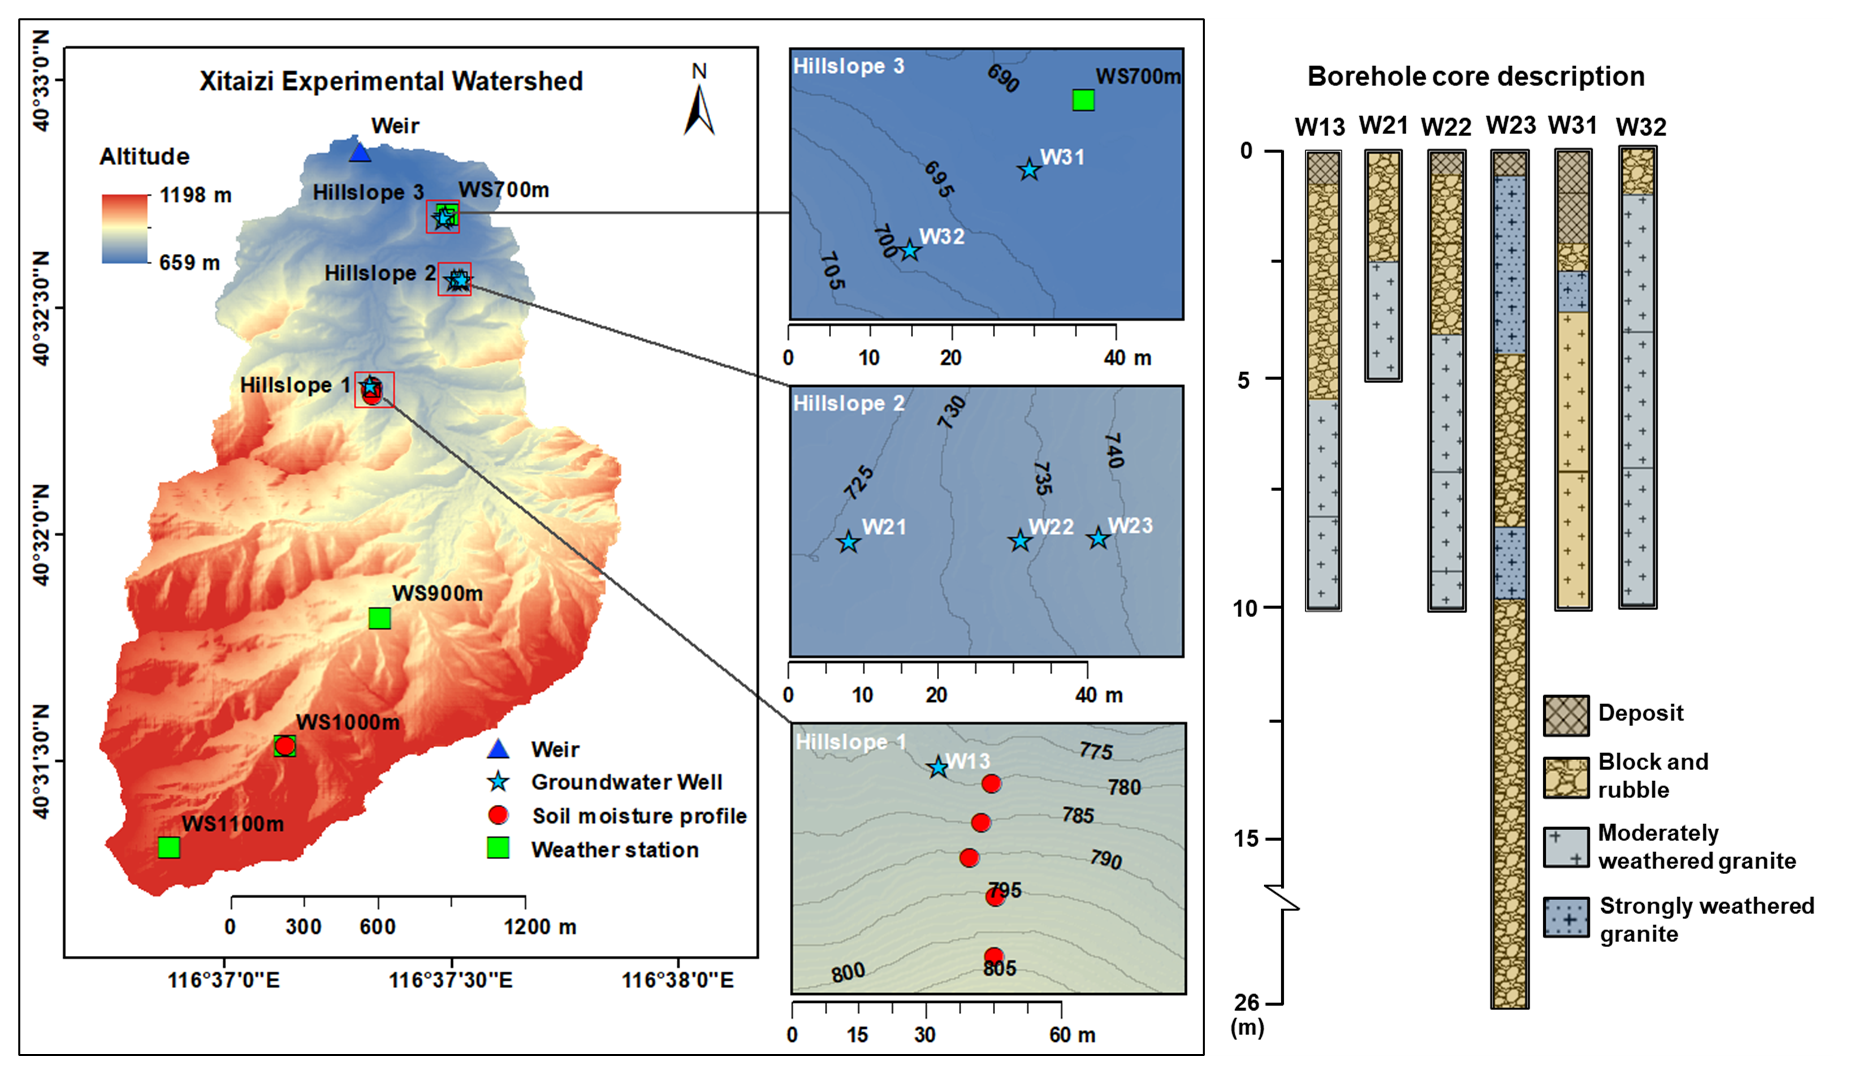
Figure 1Location of the Xitaizi experimental watershed (XEW) and a simple description of the borehole cores. This figure shows the distribution of monitoring instruments, including four weather stations (WS700, WS900, WS1000, and WS1100), an outlet weir, six groundwater observation wells, and eight soil moisture observation profiles. Of the eight soil moisture profiles, five are located on Hillslope 1, while the remaining three are positioned on the slope near WS1000. Research hillslopes (Hillslope 1, Hillslope 2, and Hillslope 3) are delineated as key zones for hydrological and geological investigations.
The soils in XEW are primarily brown earth and cinnamon soils, with a maximum depth of 1.5 m and an average saturated hydraulic conductivity of m s−1. The surface soil is rich in organic matter, enhancing infiltration and reducing surface runoff potential. Underlying geology is predominantly compacted and deeply weathered granite, covering 80 % of the area, with smaller portions of gneiss and dolomite. Fractured granite facilitates vertical and lateral subsurface flow, contributing to delayed groundwater responses. Slug tests estimated that the saturated hydraulic conductivity of weathered granite ranges from to m s−1.
2.2 Research hillslopes and instrumentation
Three research hillslopes (Hillslope 1, Hillslope 2, and Hillslope 3) were selected to investigate hydrological processes under varying geological and topographical conditions. Hillslope 1 (HS1) features thick soils overlying fractured granite, Hillslope 2 (HS2) has a highly permeable fractured block layer, and Hillslope 3 (HS3) consists of shallow soils over weakly weathered bedrock.
To capture spatial variability, SWC probes and boreholes were installed along hilltops, mid-slopes, and footslopes. Groundwater boreholes, ranging from 5 to 26 m deep, were equipped with HOBO capacitance water level loggers to record GWL (Fig. 1).
2.3 Meteorological and streamflow data collection
Meteorological data spanning 11 years, from 2013 to 2023, were collected from four GRWS100 automatic weather stations (WS700, WS900, WS1000, and WS1100) positioned at elevations of 700, 900, 1000, and 1100 m, respectively. Rainfall was recorded at 10 min intervals using six tipping-bucket rain gauges near the weather stations, and the data were spatially averaged across the gauges for each time step for analysis.
Streamflow was measured at the catchment outlet using a Parshall flume, with water levels logged every 5 min since 2014. Data from some events were excluded due to sensor malfunctions or poor data quality, including key rainfall events in 2018 and 2019. Despite these exclusions, 95 rainfall–runoff events were analyzed, offering robust data for investigating bimodal stormflow characteristics.
2.4 Soil water content and groundwater level monitoring
Volumetric SWC was monitored at eight sites using CS616 time-domain reflectometry (TDR) probes installed at 10 cm intervals from the surface to 80 cm depth. Five profiles were located along HS1, and three were near WS1000. Measurements were recorded every 10 min, and the arithmetic mean of SWC values across the monitoring sites was computed for each time step.
GWLs (below the ground surface) were observed in six boreholes distributed across the hillslopes. Hourly data were recorded using HOBO capacitance water level loggers. To facilitate comparisons across wells with varying absolute GWL ranges, we normalized the GWLs following the method described by Detty and McGuire (2010). Specifically, for each well, GWLs were normalized to their total observed range, assigning a value of 0 to the shallowest GWL and 1 to the deepest. The arithmetic means of these normalized values across all boreholes, referred to as the groundwater index (IG), effectively represent the overall GWL dynamics in the watershed. Given that lower IG values indicate higher GWLs and higher IG values correspond to deeper GWLs, figures presenting IG trends (e.g., Figs. 12 and A1) use an inverted vertical axis to visually align with hydrological intuition.
Rainfall, streamflow, and SWC data were aggregated to hourly intervals for alignment with GWL data. Preliminary analysis confirmed that the delayed second streamflow peak had response times exceeding the hourly scale, rendering this aggregation sufficient for the study's purposes.
2.5 Rainfall–runoff event identification and hydrograph analysis
Rainfall events were identified using an intensity-based automatic algorithm (Tian et al., 2012) that defines an event as periods with hourly averaged rainfall intensity exceeding 0.1 mm h−1 separated by at least 6 consecutive hours with intensities below this threshold. Events with cumulative rainfall >5 mm were retained for analysis.
Bimodal rainfall–runoff events were manually identified based on two criteria: (1) the presence of a secondary, arch-shaped runoff peak occurring after rainfall cessation or during minimal intermittent rainfall and (2) a distinct separation between the direct (sharp) and delayed (broad) peaks. Further details on classification can be found in Cui et al. (2024).
The combination of automatic event delineation and manual identification ensured the accurate selection of 14 rainfall–runoff events with well-defined delayed peaks for subsequent analysis. Streamflow was separated into storm runoff and baseflow using the HYSEP program with the constant slope method (Hewlett and Hibbert, 1967; Sloto and Crouse, 1996) supplemented by manual adjustments for complex hydrographs. Throughout the paper, stormflow refers to the total discharge, while the event stormflow volume (qs) is calculated as the total discharge minus baseflow.
2.6 Hydrological connectivity analysis
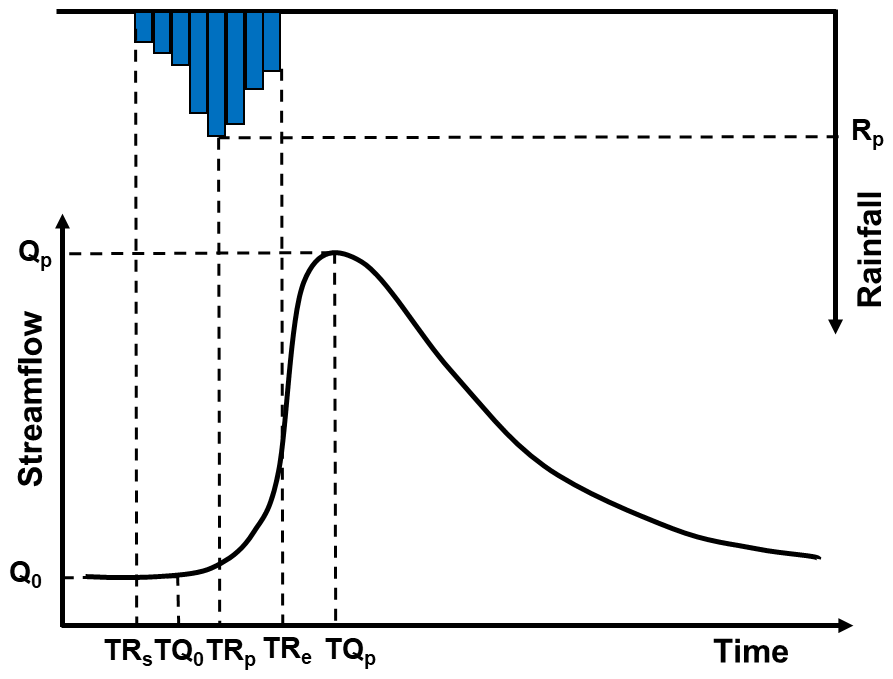
Hydrological connectivity among streamflow, SWC, and GWL were analyzed to examine the interplay of subsurface flow pathways. Rainfall–runoff events were analyzed based on their total rainfall (>5 mm) and corresponding streamflow peaks. As illustrated in Fig. 2, the peak rainfall intensity (Rp) was determined based on the maximum 1 h rainfall intensity, with the time of occurrence recorded as TPp. Metrics such as initial streamflow (Q0) and peak streamflow (Qp) were determined alongside their respective times (TQ0 and TQp).
Similar metrics were calculated for SWC and GWL, including initial values (SWC0 and IG0) and peak values (SWCp and ), with corresponding times of occurrence (TS0, TIG0, TSp, and TIGp). These metrics allowed for a comprehensive evaluation of the soil water–groundwater–streamflow response relationship across 95 distinct rainfall–runoff events.
3.1 Hillslope-scale dynamics of SWC and GWL during rainfall–runoff events
The temporal evolution of SWC and GWL was analyzed across 95 rainfall–runoff events to understand their dynamic interaction. Our analysis revealed a clear relationship between SWC and GWL dynamics, with SWC initially increasing rapidly during rainfall, followed by stabilization or a decline once a threshold was reached. In contrast, GWL showed a more delayed response (Fig. 3). Three distinct patterns of SWC–GWL interaction were identified.
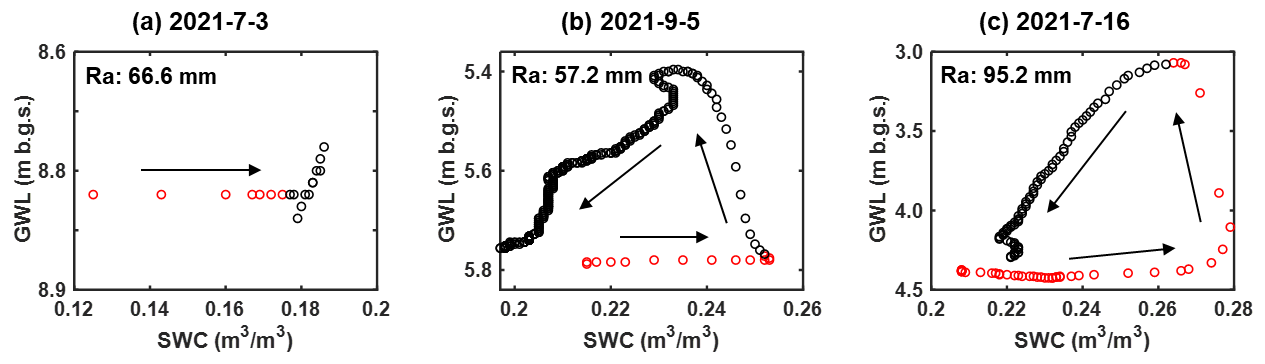
Figure 3Three typical SWC-GWL dynamics patterns during rainfall–runoff events. Ra represents the rainfall amount. Arrows indicate the temporal evolution of the events. Red circles indicate periods of rainfall, whereas black circles denote post-rainfall periods.
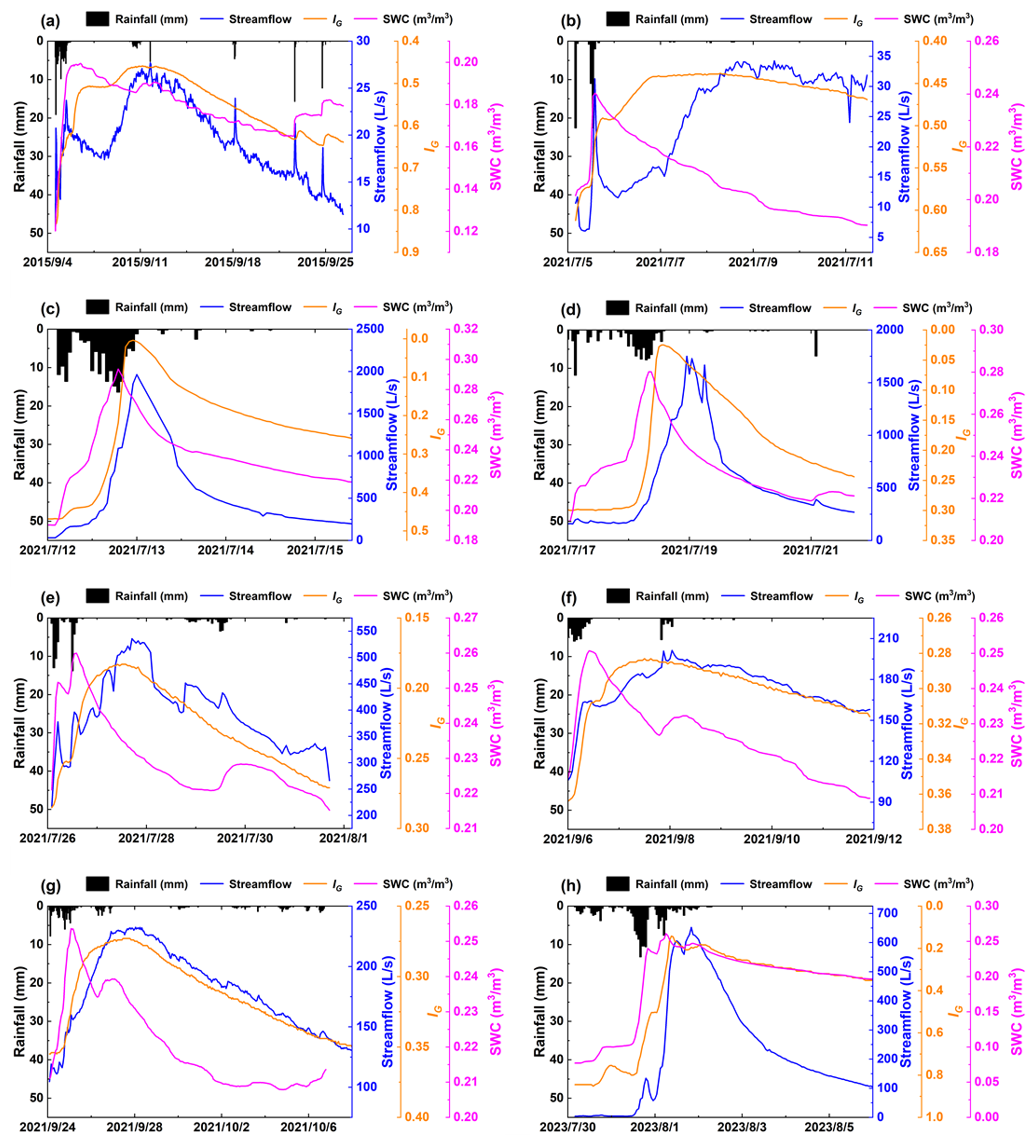
Figure 3 illustrates the dynamics of SWC and GWL during three representative events. These events were selected to demonstrate the variability in SWC and GWL patterns identified across the 95 rainfall–runoff events. The selected events all occurred within the same year to minimize inter-annual variability and ensure comparability. Red circles indicate rainfall periods, while black circles represent post-rainfall periods. Under dry conditions, despite receiving 66.6 mm of rainfall, SWC remained relatively low (<0.20), exhibiting a gradual increase during the rainfall event and stabilizing thereafter. In contrast, GWL displayed minimal response (Fig. 3a).
In events with wet conditions, both SWC and GWL showed significant increases. However, the timing of GWL rise varied: in some cases, GWL rose after the cessation of rainfall, while in other cases, it began rising before the rainfall ended. The primary distinction between these patterns lies in the timing of the GWL rise: in Fig. 3b (57.2 mm rainfall), GWL begins to rise after the rainfall ceased, whereas in Fig. 3c (95.2 mm rainfall), GWL starts to rise noticeably before rainfall ended.
In the case represented by Fig. 3b, SWC increased significantly, surpassing 0.20, while GWL showed a delayed rise after the rainfall ceased. A counterclockwise hysteresis was observed as SWC continued to increase, while GWL remained largely unchanged during rainfall. Figure 3c, which typically represents intense storm events, shows a sharp increase in both SWC and GWL, with SWC exceeding 0.25. GWL began to rise before the rainfall ended, reaching a peak as rainfall continued, and both variables showed a substantial decline after rainfall ceased. These representative events highlight the variability in the SWC–GWL relationship, including timing differences in the rise in GWL and distinct hysteresis patterns during moderate and extreme events.
We further quantified the frequency distribution of SWC and GWL increases or decreases across the 95 rainfall–runoff events (Fig. 4). Notably, in 49 events, SWC increased, while GWL increased in 43 events. In contrast, SWC declined in 26 events, and GWL declined in 15 events. Notably, 15 events showed a simultaneous decline in both SWC and GWL, which was associated with delayed stormflow and larger stormflow volumes. One such event, on 15 August 2021, exhibited fluctuating SWC and GWL values throughout the rainfall event due to the more dispersed rainfall distribution. As a result, our subsequent analysis primarily focused on the remaining 14 events with well-defined response characteristics.
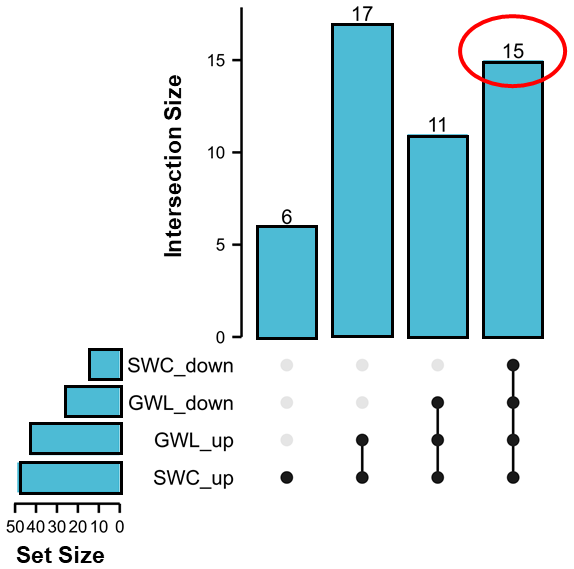
Figure 4UpSet plot of the response characteristics of SWC and GWL during rainfall–runoff events.
3.2 SWC dynamics across rainfall–runoff events
Figure 5 presents the SWC dynamics observed during 14 distinct rainfall–runoff events, each characterized by minimal or no intermittent rainfall during the recession period. To facilitate a clear comparison of SWC changes across events, the peak of each event was aligned with a horizontal axis value of 0.
During the initial rainfall phase, SWC increased rapidly, reaching a peak value. As the rainfall ceased, SWC began to decline, though at a slower rate, eventually stabilizing at a specific value. To quantify the threshold at which SWC stabilizes, we conducted a statistical analysis of the stabilized SWC during these events. The stable phase was defined as the period following the recession phase, during which SWC exhibited minimal variation before subsequent rainfall. The statistical analysis of the stable SWC revealed a mean of 0.197±0.004, with a 95 % confidence interval of 0.188–0.207. These results validate the visually observed threshold of 0.20 for SWC stabilization. The general pattern of SWC variation is schematically illustrated in Fig. 6.
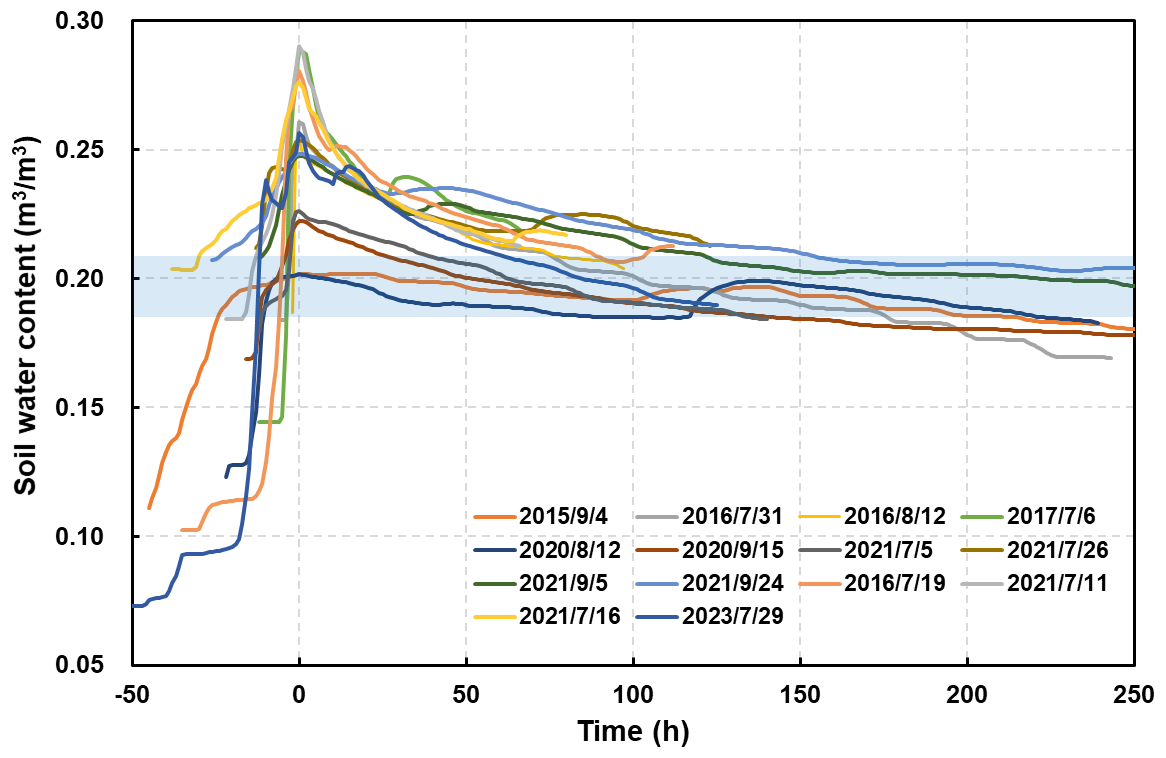
Figure 5SWC dynamics during different storm events. The blue strip indicates the 95 % confidence interval of stable SWC.
The SWC response to rainfall is rapid. Upon rainfall onset, SWC increased sharply. Once the rainfall ceased, the subsequent behavior of SWC depended on whether the peak value exceeded the 0.20 threshold. If SWC remains below or at 0.20, it either stabilizes or declines slowly. However, when SWC exceeds 0.20, it decreases rapidly before stabilizing around the 0.20 threshold. The magnitude of the peak above 0.20 influences the speed of the subsequent decline in SWC: the greater the peak, the faster the decline.
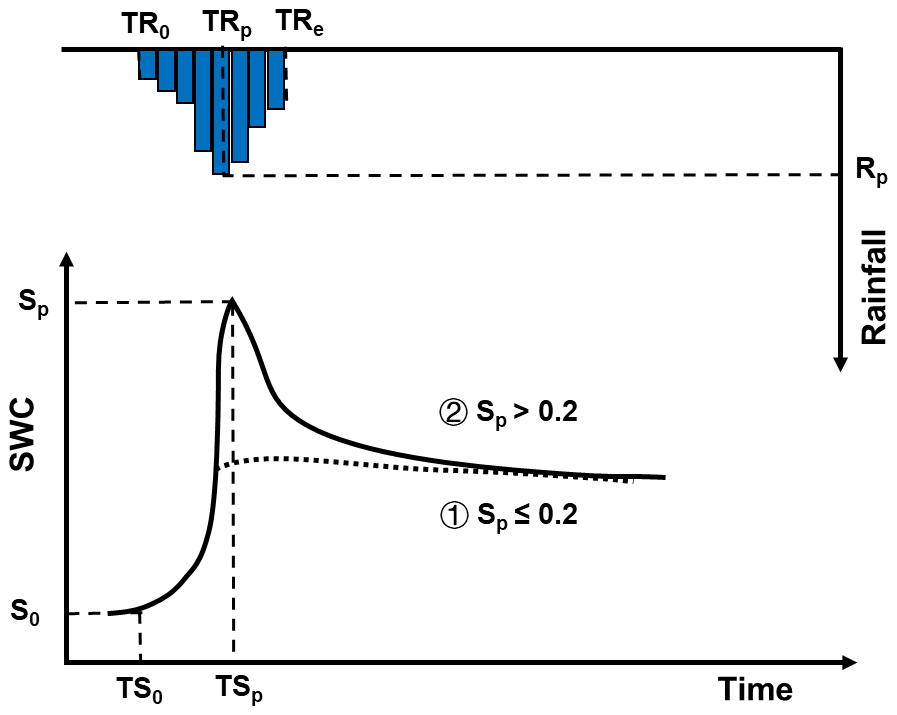
Figure 6Conceptual diagram of SWC response during storm events. Sp is the maximum SWC value.
3.3 GWL dynamics and response types
This section examines GWL dynamics during 14 selected rainfall–runoff events chosen for their clear and consistent GWL and SWC patterns. These events facilitate a detailed investigation into groundwater response to storm events. Two distinct GWL response types – quick and slow – were identified and are conceptually illustrated in Fig. 7. It is important to note that Fig. 7 is a conceptual representation that is not based on specific rainfall–runoff events and does not include rainfall depth data.
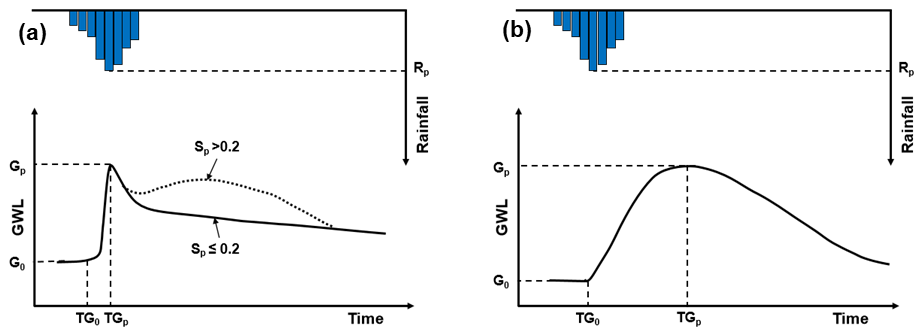
Figure 7Conceptual diagram of the GWL response during storm events. G0 and Gp represent the initial and maximum values of GWL, respectively. Sp denotes the maximum SWC value.
In events exhibiting a quick response, the GWL rises rapidly, closely aligning with the SWC peak. The GWL response typically lags behind the SWC peak, ranging from 0 to 6 h (Fig. 7a). For events where SWC exceeds 0.20 (and particularly when it surpasses 0.24), the GWL often shows a secondary rise following the initial peak, as indicated by the dotted line in Fig. 7a. Conversely, the slow response occurs when SWC declines sharply after reaching its peak, resulting in a delayed rise in GWL (Fig. 7b).
An analysis of GWL responses across various hillslopes revealed spatial variability. For instance, the GWL at HS2 (wells W21–23) exhibited a quick response (Fig. 7a), whereas the GWL at HS1 (W13) and HS3 (W31 and W32) displayed slow response characteristics (Fig. 7b). These findings suggest that the GWL dynamics are influenced by not only SWC but also the underlying geological structure of each hillslope.
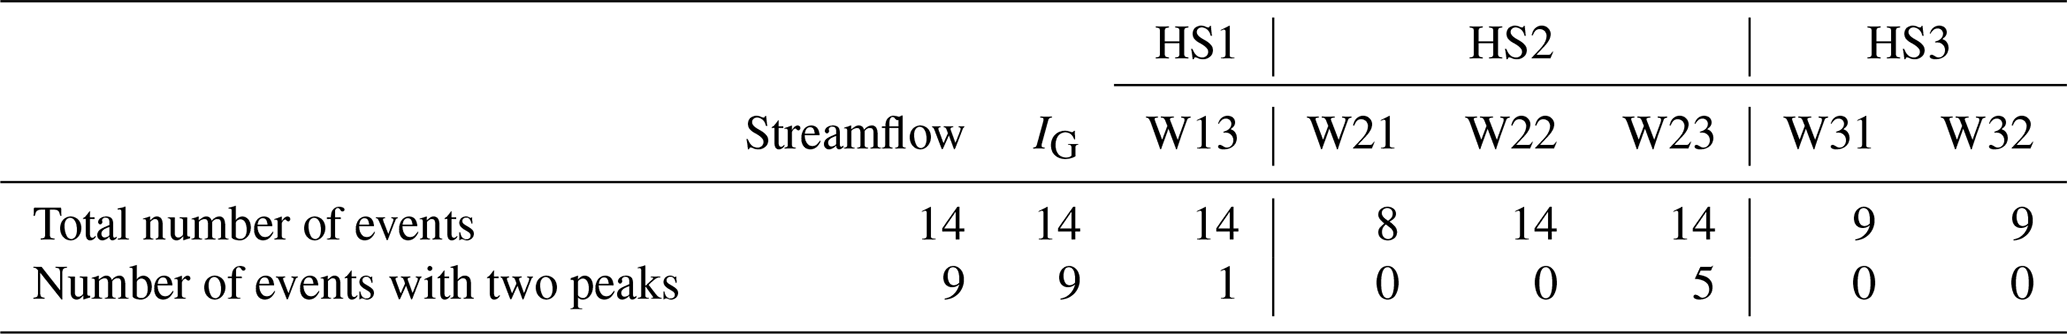
At the watershed scale, GWL response to storm events demonstrated considerable spatial variability. IG, which represents the average normalized GWL across multiple wells, was used to capture the catchment-scale groundwater response. IG often exhibited two distinct peaks during storm events. Among the 14 events analyzed, 9 events displayed dual IG peaks, coinciding with the 2 peaks in streamflow. However, at the individual well level, only W13 (HS1) and W23 (HS2) exhibited dual GWL peaks. Specifically, W13 showed two peaks during one event, while W23 exhibited two peaks during five events. The remaining wells displayed only a single peak across all events analyzed (see Table 1).
Table 1Statistical results of response characterization of streamflow, IG, and groundwater levels.
3.4 GWL responses across hillslope positions
Further examination of GWL responses across various locations is presented in Fig. 8, which shows the magnitude of GWL increases and their lag times relative to rainfall onset. While variations in GWL were observed among the monitoring wells, the differences in GWL increments were generally modest, with mean increases ranging from 1 to 2 m. Notably, smaller GWL changes were recorded at the foot of the hillslope (e.g., W21 and W31). Within the same hillslope, GWL increments tended to increase progressively from the foot to the top, as seen in HS2 (W21–W23) and HS3 (W31 and W32).
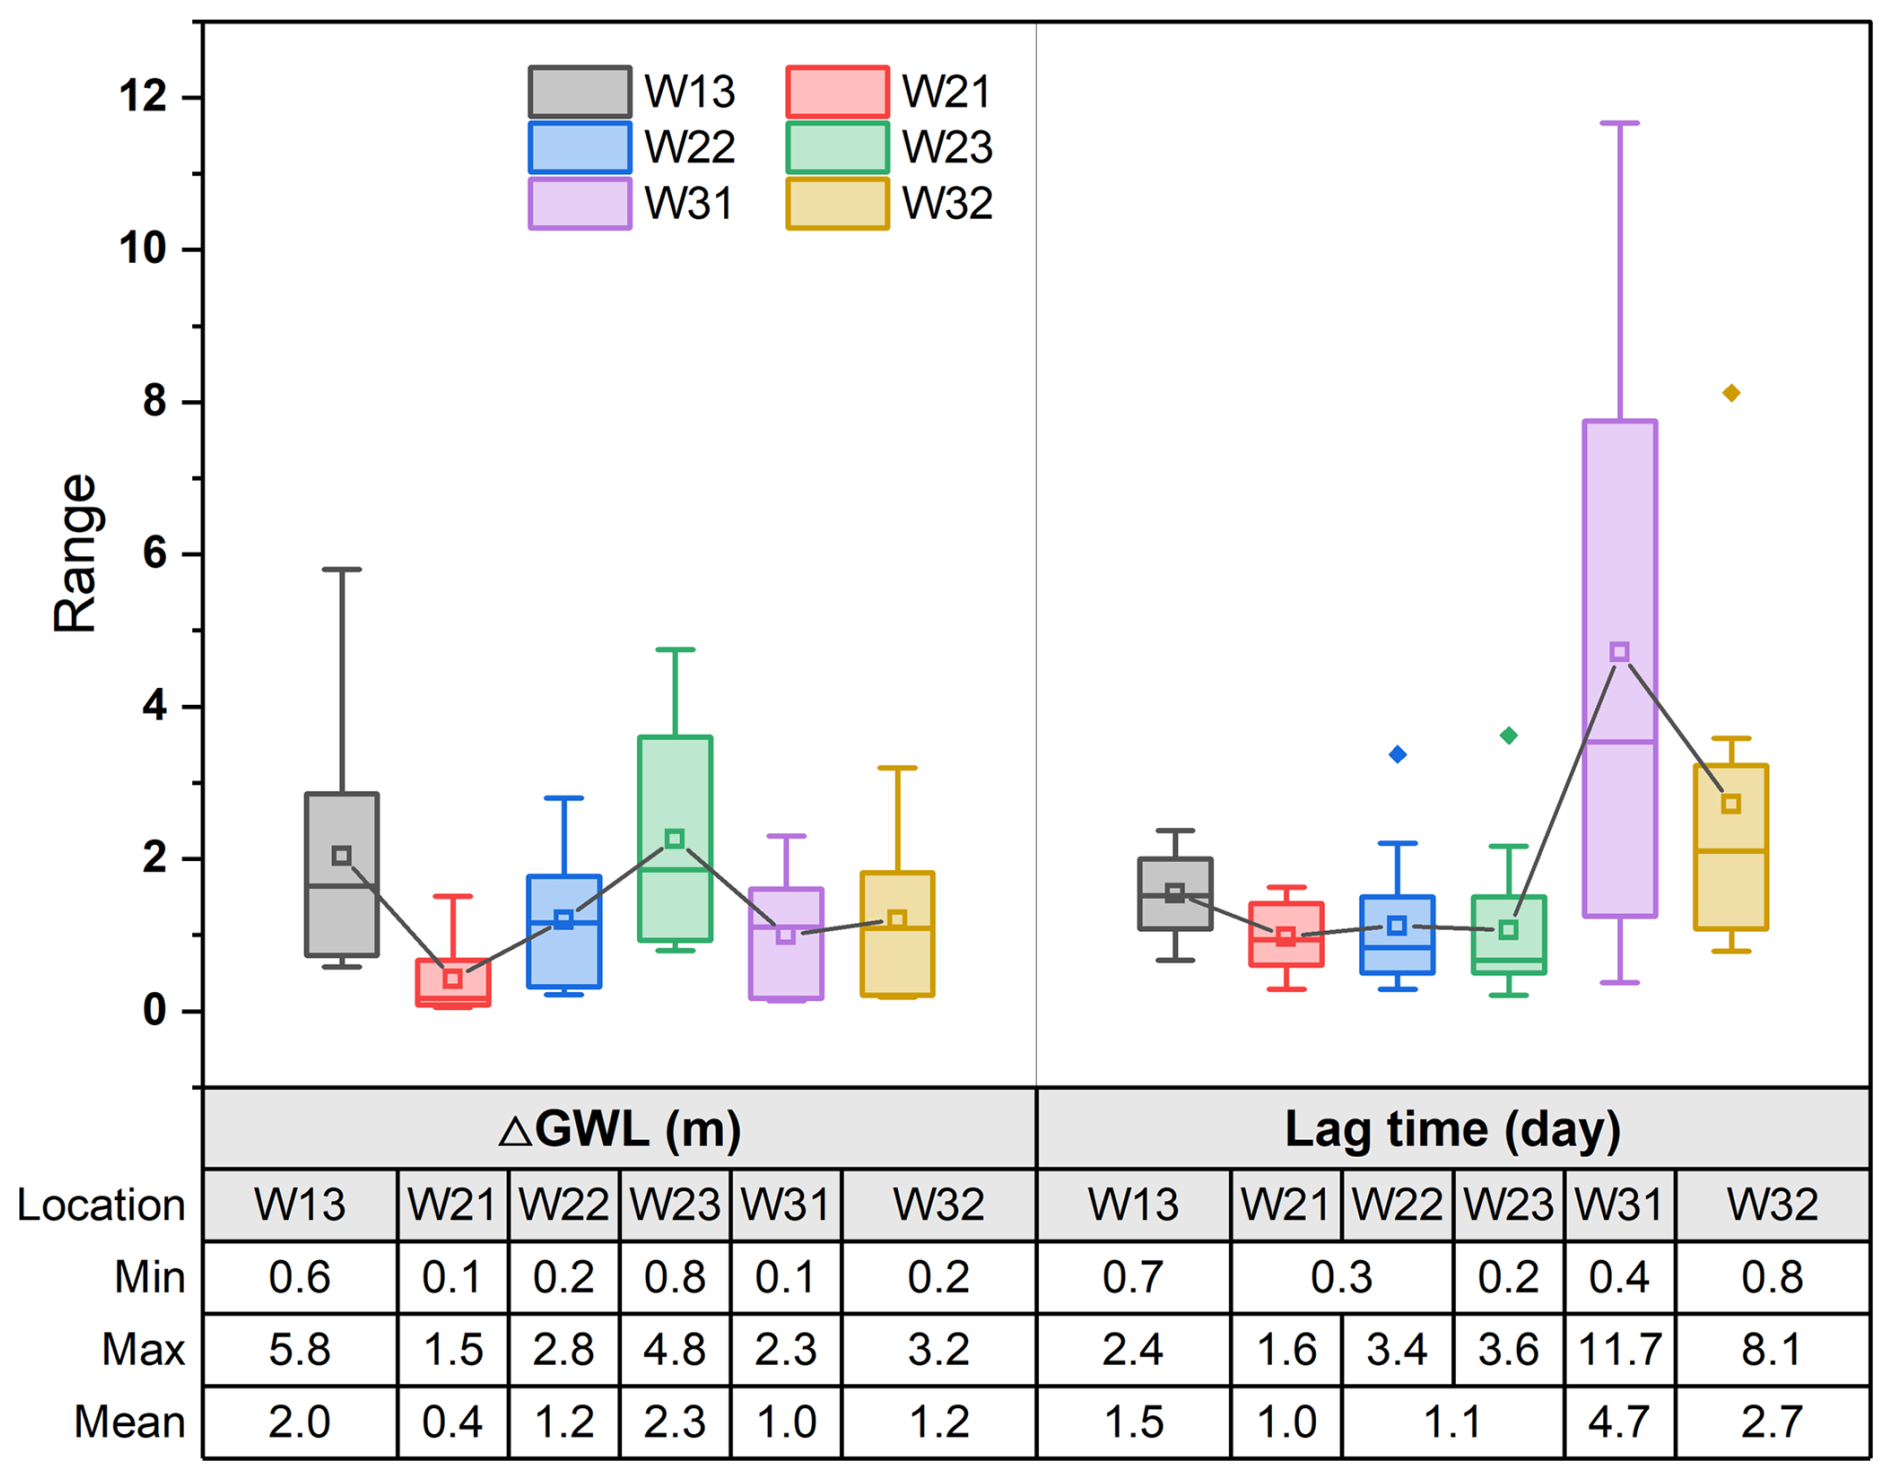
Figure 8GWL increments (ΔGWL) and lag time of peak GWL relative to rainfall onset at different locations.
In contrast, the lag times for maximum GWL exhibited greater variation across locations. For instance, at HS3, lag times ranged from 0.4 to 11.7 d at W31 and from 0.8 to 8.1 d at W32, which are significantly longer times than those at HS1 (from 0.7 to 2.4 d) and HS2 (from 0.2 to 3.6 d). Interestingly, within a single hillslope, no consistent relationship was found between the lag time of maximum GWL and its distance from the foot of the hillslope.
To further investigate these dynamics, the relationship between GWL increments and SWC was analyzed across 14 storm events (Fig. 9). The analysis focused on six observation wells (W13, W21–W23, W31, and W32) located on three hillslopes (see Fig. 1 for well locations). The variability in GWL response types – quick versus slow – were attributed to spatial differences in SWC thresholds and hillslope geological structures.
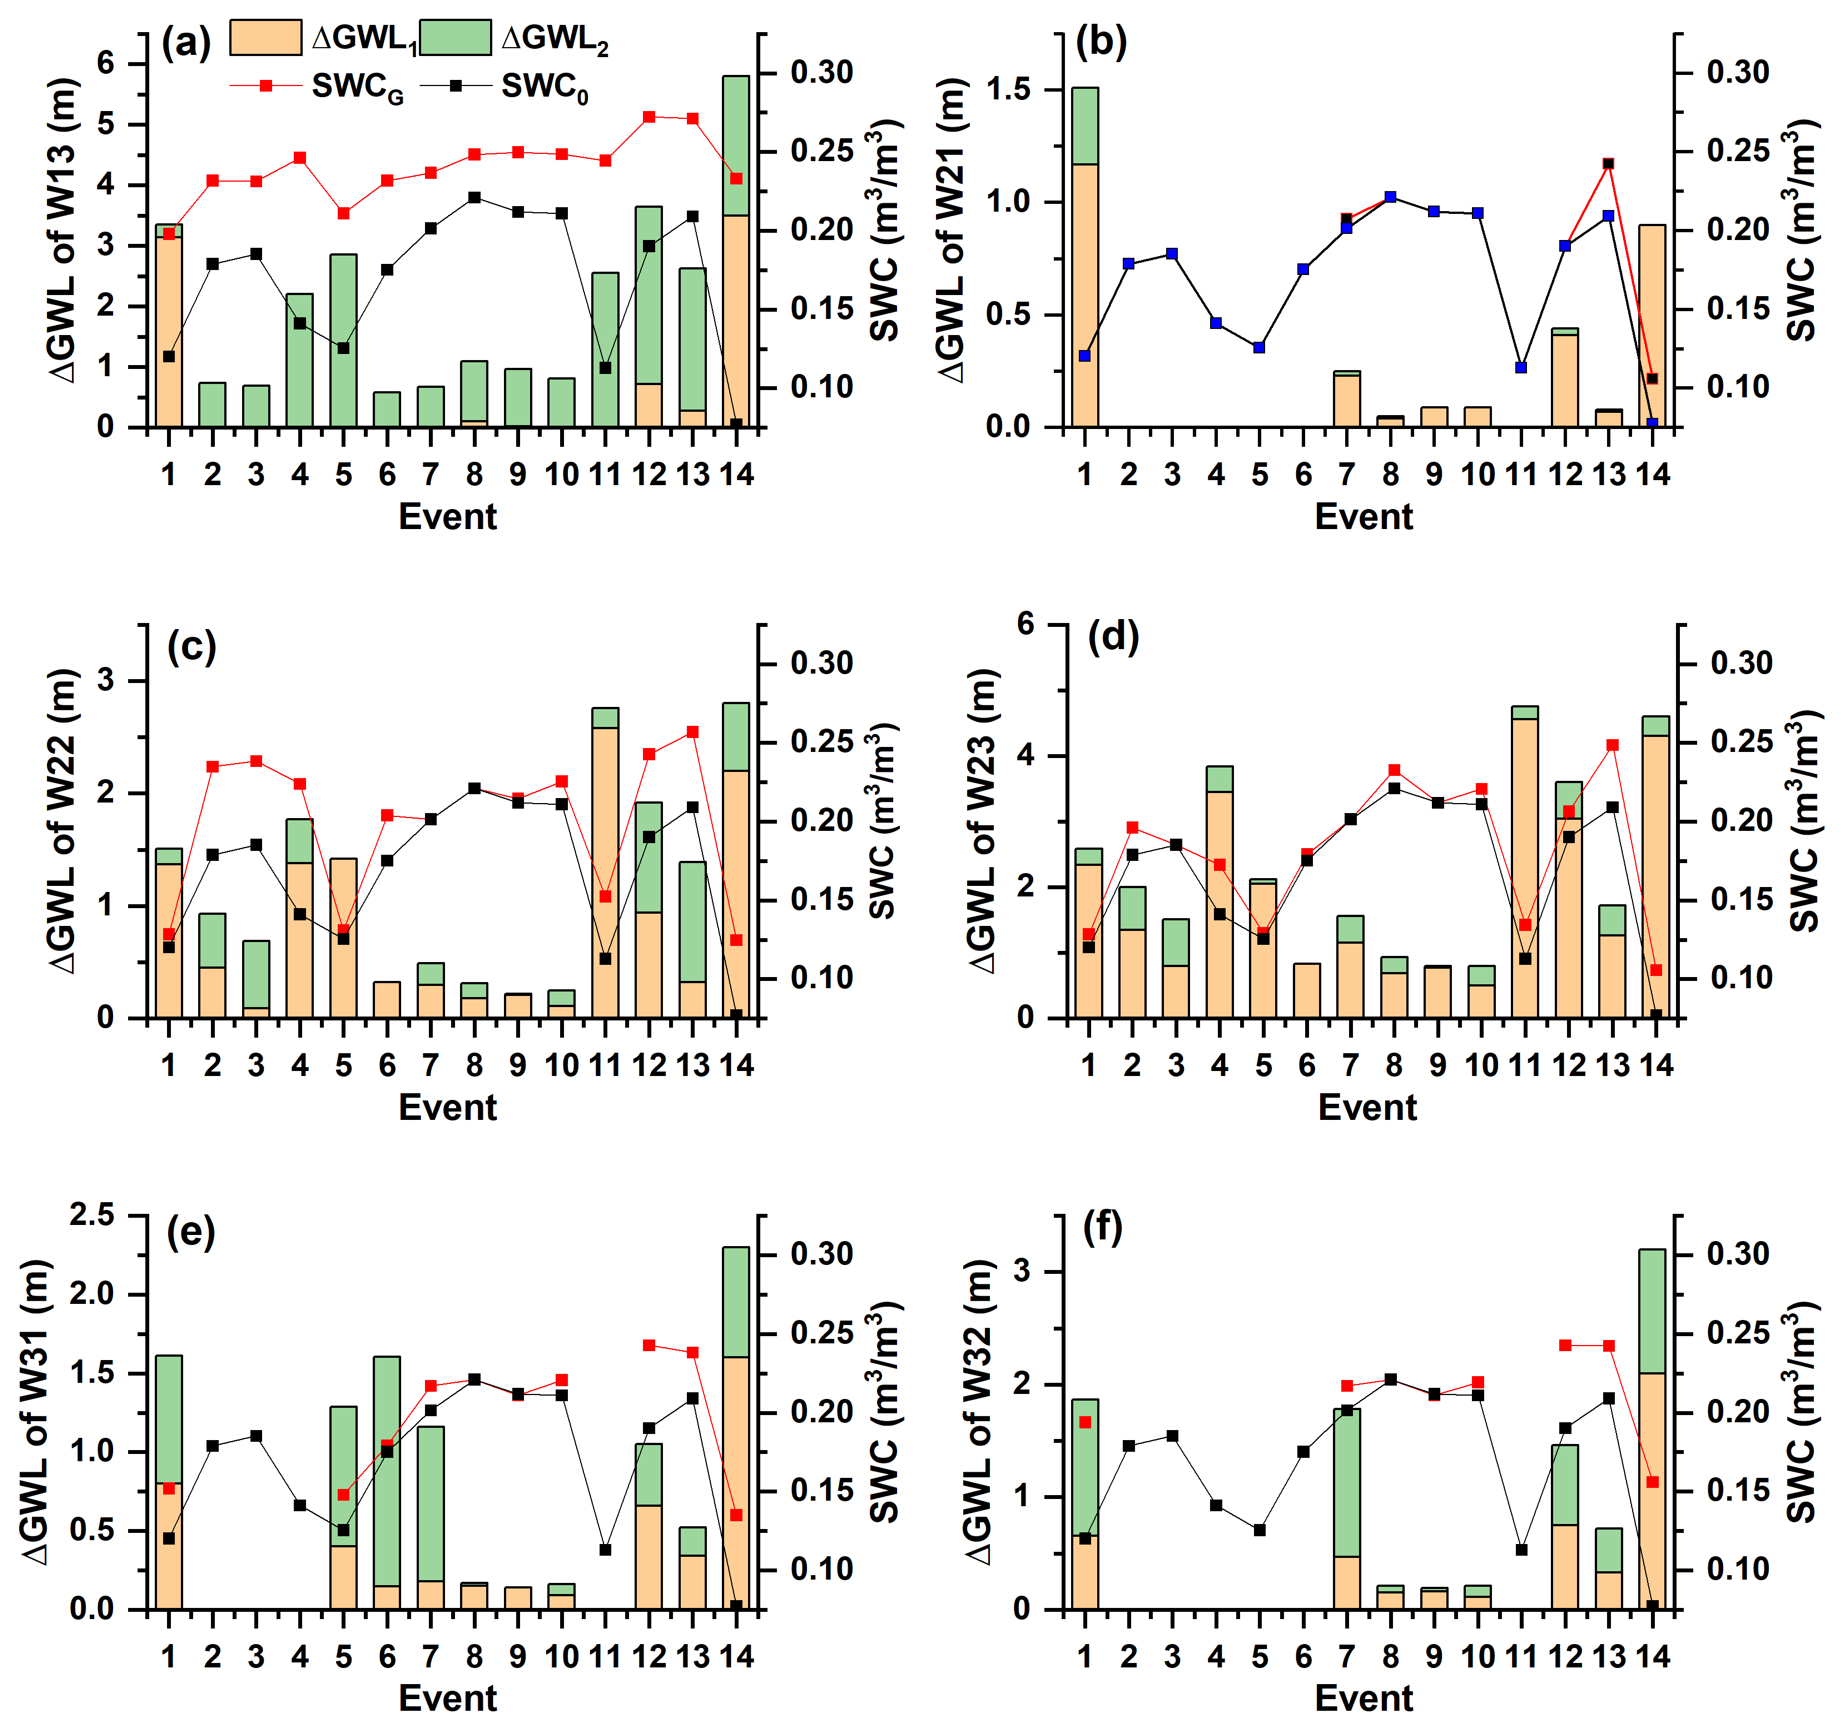
Figure 9GWL increments (ΔGWL) across various locations during 14 storm events, along with initial SWC (SWC0) and SWC at the onset of GWL rise (SWCG). The orange bars represent ΔGWL during the SWC increase phase, while the green bars represent ΔGWL during the SWC decline phase. The red and black lines denote SWCG and SWC0, respectively.
In Fig. 9, the orange bars represent GWL increments during the SWC increase phase (up to its peak), while the green bars indicate GWL increments during the SWC decline phase (from its peak to when GWL reached its maximum). The black and red lines with dots mark the initial SWC (SWC0) and the SWC at the onset of GWL rise (SWCG), respectively. Missing data for some locations are indicated by the absence of bars in Fig. 9b, e, and f.
The analysis revealed that the magnitude of the SWC increase following rainfall onset is a key determinant of delayed GWL responses. Specifically, a greater difference between SWCG and SWC0 corresponded to the onset of GWL rise. Conversely, when SWCG and SWC0 were similar, GWL rose almost simultaneously with the SWC increase.
At HS1 (W13), GWL began to rise only after SWC exceeded 0.20. Most of the GWL increase occurred during the SWC decline phase, suggesting that soil wetness exerts a threshold effect on GWL dynamics. This delayed response aligns with the slow response type. At HS2 (W21–23), GWL responses were more immediate, with GWL increasing closely following a rise in SWC. SWCG values at these locations ranged widely (from 0.13 to 0.26) but were generally close to SWC0, indicating that GWL responses at HS2 are less dependent on SWC thresholds and exhibit a quick response type.
HS3 demonstrated both quick and slow GWL responses. Initial rises occurred soon after the onset of the SWC increase, but the majority of GWL increments took place during the prolonged SWC decline phase following its peak. This pattern suggests a more complex interaction between immediate and delayed factors influencing GWL dynamics at HS3.
These findings highlight a strong relationship between the emergence of quick and slow GWL response types and SWC dynamics. In quick response types, GWL increments occur primarily during the SWC increase phase, resulting in a steep response curve. In slow responses, GWL increments predominantly occur during the SWC decline phase, producing an arch-shaped response curve. These distinctions underscore the pivotal role of SWC dynamics in regulating the timing and magnitude of GWL responses across different hillslopes.
3.5 Characterization of groundwater response at the watershed scale
Figure 10 illustrates the timing of IG peaks relative to SWC response. The first IG peak occurred rapidly following rainfall, initiating less than 2 h after the SWC began to rise and reaching its peak 0 to 9 h later (mean: 3.7 h) after SWC reached its maximum. In contrast, the second IG peak typically occurred post-rainfall, lagging behind the SWC peak by 10–65 h (mean: 28 h). These patterns align with the quick and slow GWL response types identified in Sect. 3.2. The occurrence of dual IG peaks can be attributed to the superimposition of groundwater contributions from different hillslopes with differing response rates. The first (quick) GWL response is tightly coupled to rainfall onset and SWC increases, while the second (slow) GWL response reflects gradual infiltration and groundwater recharge occurring over a broader timescale.
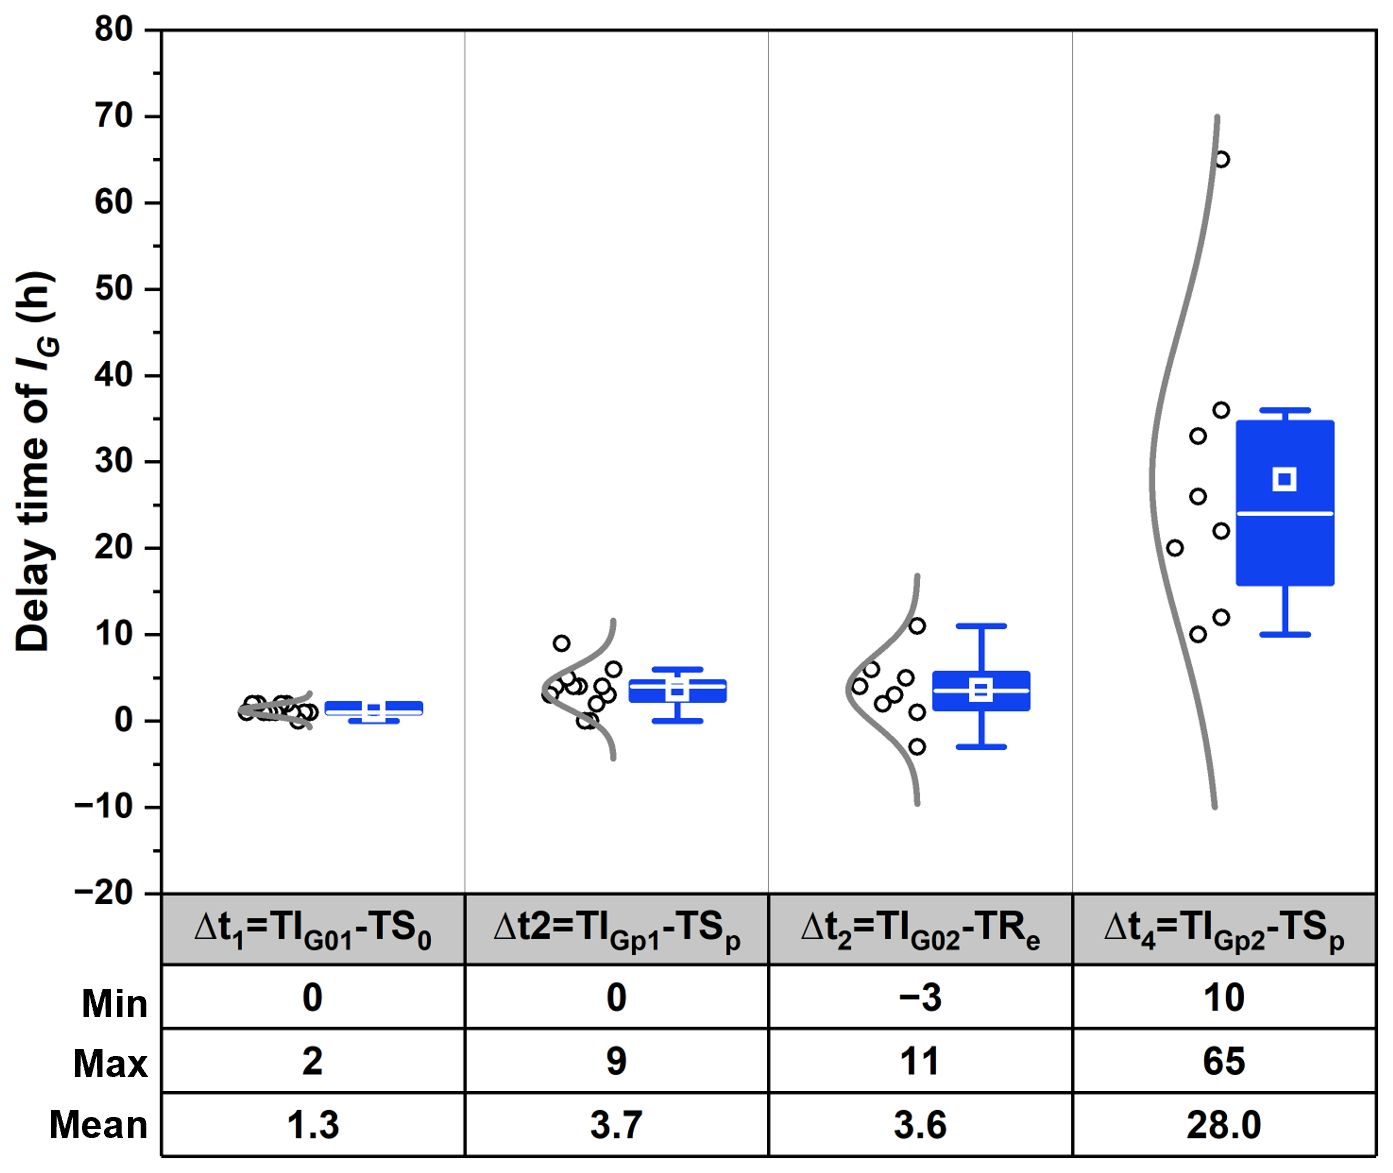
Figure 10Delay time of IG peaks relative to peak SWC. TIG01 and TIG02 represent the onset times of the first and second peaks of IG, respectively. TS0 and TSp indicate the time when SWC started to increase and peaked, respectively. TIGp1 and TIGp2 represent the time when IG started to increase and peaked, respectively. TRe indicates the end of rainfall.
The growth rates of IG towards the two peaks were also quantified (Fig. 11). A notable disparity was observed between the growth rates of the first (r1) and second (r2) IG peak. The first IG peak exhibited a markedly faster rate (ranging from 0.03 to 0.98 d−1, with a mean of 0.38 d−1) than the second peak (ranging from 0.01 to 0.31 d−1, with a mean of 0.07 d−1). These differences reflect the contrasting dynamics of quick and slow GWL responses across hillslopes. In events featuring dual IG peaks, the maximum IG was typically observed at the second peak. However, in events with higher GWLs (indicating lower IG), the disparity between the growth rates diminished, making the two peaks harder to distinguish between (e.g., Events 9 and 10). In Events 11–14, where GWLs were significantly higher, only a single IG peak was observed.
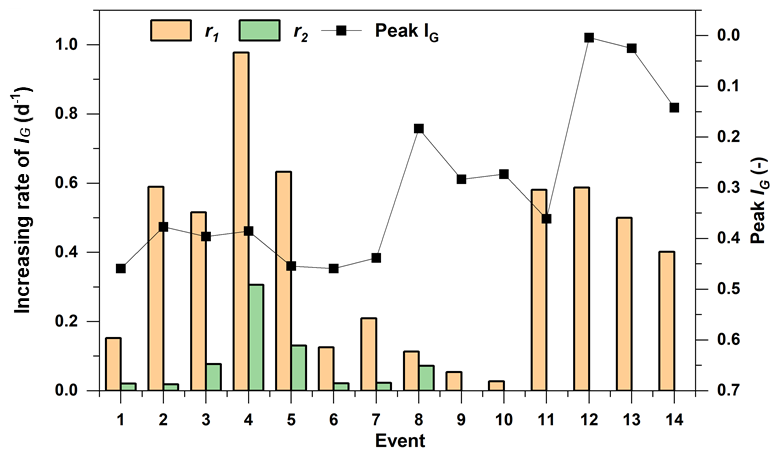
Figure 11Growth rates of IG and the maximum IG value across storm events. r1 and r2 denote the ascent rates during the first and second peaks, respectively.
The contrasting dynamics of the two IG peaks highlight their distinct formation mechanisms. The first IG peak, occurring during rainfall, is closely associated with the rapid rise in SWC. Conversely, the second IG peak emerges post-rainfall, coinciding with soil drainage and groundwater recharge processes. As reported by Dang et al. (2023), rainfall induces pressure waves that rapidly expel soil water from the lower soil column, while infiltrated rainwater migrates downwards at a slower pace. Pressure-driven displacement generates a near-instantaneous GWL response during the initial phase of rainfall.
We conjecture that the rapid IG peak is linked to kinematic wave triggered by increased SWC, which displaces pre-existing “old” soil water and groundwater, leading to a synchronized GWL rise (e.g., Anderson and Burt, 1978). Despite the slow percolation of water through soil and bedrock, the theoretical celerity of this kinematic response is near-instantaneous, accounting for the rapid GWL rise. Furthermore, drilling data suggest that there is a presence of faults in the bedrock of HS2, which may facilitate a faster groundwater response on this hillslope compared to others.
The second, slow IG peak is likely driven by the gradual infiltration of rainwater into deeper soil and bedrock layers, ultimately recharging the groundwater. This process is regulated by the soil's water storage threshold. Before reaching this threshold, the soil retains all incoming rainfall. Once exceeded, excess water drains rapidly into deeper layers, leading to a decline in SWC and a concurrent rise in GWL due to groundwater recharge.
4.1 Inter-hillslope GWL dynamics
GWL variations in lag times and response magnitudes across hillslopes can be attributed to differences in geological conditions. HS1 and HS3 are primarily underlain by fully to strongly weathered granite, with upper layers comprising significant soil–rock mixtures. These features lead to relatively slower GWL responses, likely due to the limited permeability of the regolith and underlying materials. In contrast, HS2 is characterized by a fractured rock layer at depths varying from 10 to 30 m (see Fig. 1), which enhances subsurface flow and facilitates faster GWL responses. These geological contrasts explain the observed differences in GWL response times among the hillslopes.
Among the three hillslopes, HS3 exhibited the slowest GWL responses, characterized by the longest lag times. This distinct behavior makes HS3 a crucial reference for understanding inter-hillslope variations in GWL dynamics. A previous study by Cui et al. (2024) highlighted the fact that GWL response times are closely linked to delayed stormflow timing, emphasizing the importance of examining GWL dynamics. Comparing the GWL response times of HS1 and HS2 with those of HS3 provides an insight into how geological structures and SWC thresholds influence delayed stormflow generation.
Furthermore, the deeply weathered regolith and extensive fracturing in HS2 promote more rapid stormflow generation as water stored in the regolith layer contributes to streamflow over extended periods. This finding aligns with previous studies (Kosugi et al., 2011; Padilla et al., 2015), which demonstrated that geological features such as fracture density and weathering depth influence subsurface flow paths and, ultimately, groundwater dynamics.
To deepen our understanding of the inter-hillslope differences in GWL responses, we calculated the lag times between rainfall onset and peak GWL responses for all observation wells on each hillslope, incorporating spatial variability. Average lag times, denoted as tS1, tS2, and tS3 for HS1, HS2, and HS3, respectively, were used to calculate the time differences and . These time differences were then analyzed for their correlation with IG, as illustrated in Fig. 12.
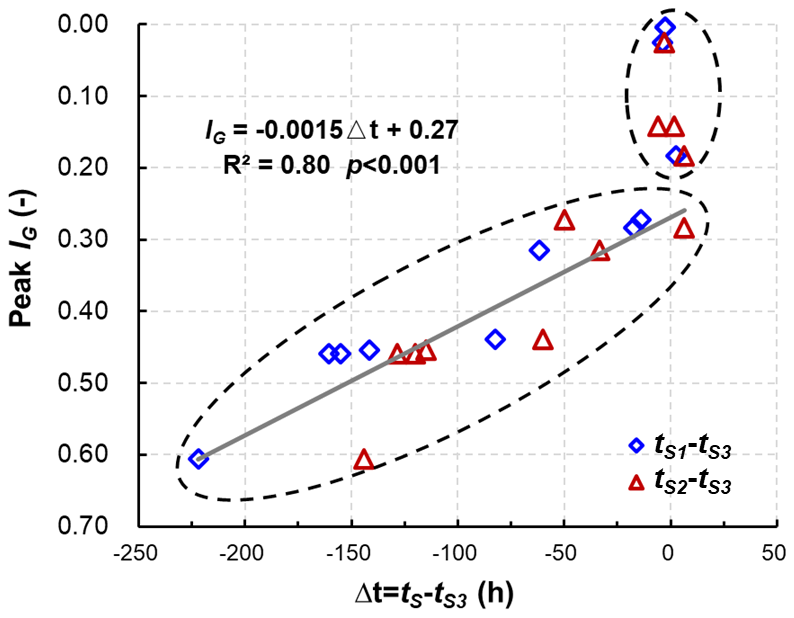
Figure 12Correlation between peak IG and the time differences from peak GWL responses on HS1 and HS2 to HS3 (), where tS1, tS2 and tS3 are the average lag times of peak GWLs on HS1, HS2, and HS3, respectively. Note that the IG axis is inverted: IG is a normalized groundwater index where lower values indicate higher GWLs and higher values represent deeper GWLs.
In Fig. 12, blue diamonds represent , while red triangles represent . Both pairs exhibit a significant negative correlation with peak IG, as described by the equation (R2=0.80, p<0.001). These results indicate that lower IG values correspond to shorter inter-hillslope lag times, suggesting enhanced hydrological connectivity and transmissivity feedback mechanisms, as described in previous studies (Kendall et al., 1999; Bishop et al., 2011).
As peak IG approaches 0.30, Δt converges to near zero with minimal fluctuations, particularly during extreme storm events. This finding supports the results presented in Fig. 11, which demonstrate that elevated GWLs synchronize GWL responses across the watershed. This synchronization reflects a critical hydrological mechanism driven by the transmissivity feedback, which amplifies groundwater movement, reduces lag times, and enhances watershed-scale connectivity. This dynamic is consistent with the work of Padilla et al. (2015), who reported shorter lag times in bedrock aquifers with high-transmissivity conduits, and with Scaife et al. (2020), who noted that increased connectivity during high-GWL conditions reduces lag times and enhances watershed-scale hydrological responses.
Furthermore, although Fig. 12 uses IG to represent watershed-wide GWL status, a similar pattern emerges when substituting IG with site-specific GWL values, acknowledging that GWL thresholds may vary among observation sites. These observations reinforce the idea that watershed-scale groundwater dynamics are influenced by the interplay between spatially variable geological conditions and temporal variations in GWL.
4.2 Delayed stormflow processes linked to GWL dynamics
Previous studies have shown that streamflow in XEW frequently exhibits a bimodal hydrograph during heavy rainfall, with delayed stormflow likely originating from shallow groundwater outflow (Cui et al., 2024). Understanding the timing and lag between groundwater and streamflow responses is crucial for identifying dominant runoff generation mechanisms (Beiter et al., 2020). Discrepancies in these timings can indicate contributions from different water sources to the stream channel. Figure 13 illustrates the relative timing of maximum IG () and maximum SWC (SWCp) for eight storm events alongside rainfall duration.
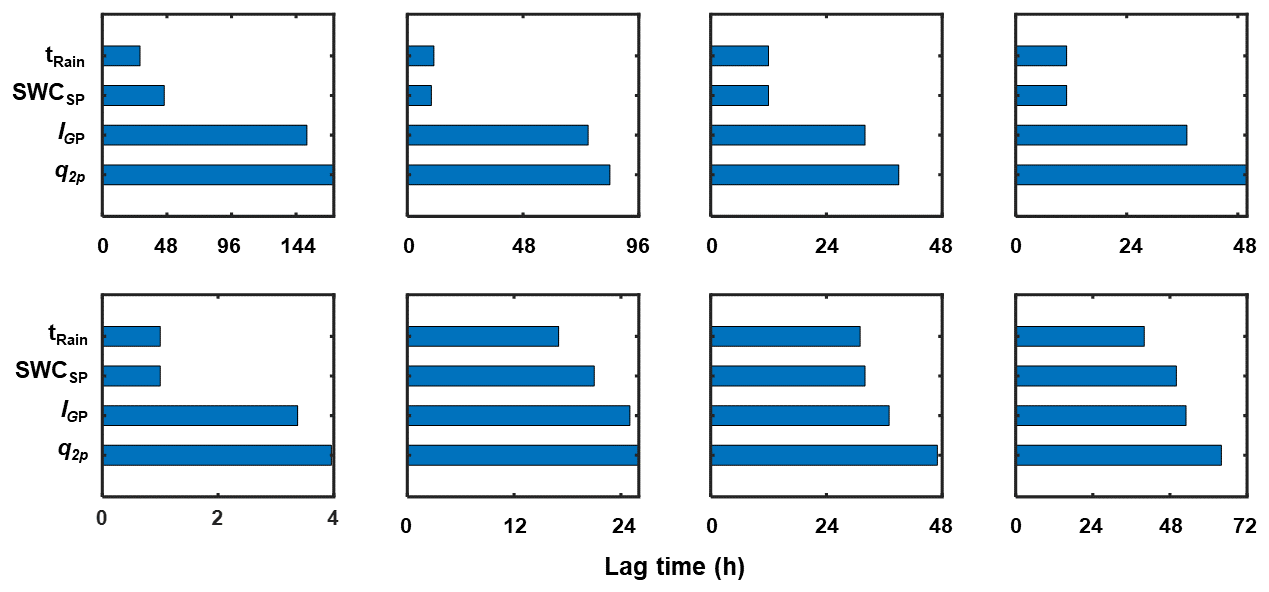
Figure 13Lag times of maximum SWC and GWL relative to rainfall onset. Each bar indicates the rise and peak times of the corresponding variable, with tRain indicating rainfall duration. SWCSP and IGP represent the maximum SWC and IG, respectively, while q2p denotes the delayed streamflow peak.
Rainfall durations for the analyzed events ranged from 11 to 40 h. SWC, IG, and delayed stormflow (q2p) followed a clear sequence in their peak timings relative to rainfall onset. SWC responded rapidly, with its peak occurring 10 to 50 h after rainfall began, usually coinciding with or slightly after rainfall cessation. In contrast, IG continued to increase after the SWC peak and reached its maximum before the delayed stormflow peak (q2p). While the lag times between SWCp, , and q2p varied among events, the lag between and q2p remained relatively consistent.
This pattern aligns with findings from Haught and Meerveld (2011) and Rinderer et al. (2016), who suggest that when groundwater response precedes or synchronizes with streamflow, it indicates strong hillslope–stream connectivity, with groundwater serving as the primary driver of streamflow. Our results corroborate this view, showing that q2p timing is predominantly governed by groundwater dynamics. This relationship is further validated by the strong linear correlation between the lag times of q2p (t2p) and (), as indicated by the regression equation , with a slope of 1.11, showing a high determination coefficient (R2=0.995, p<0.01) (Fig. 14).
Conversely, the correlation between t2p and the lag time of SWCp () was weak (R2=0.029, p=0.688), indicating that the timing of SWCp has minimal influence on the delayed streamflow peak. Additionally, the IG pattern during the delayed stormflow period closely mirrored the shape of the streamflow hydrograph (Fig. A1), reinforcing the dominant role of IG in controlling delayed stormflow.
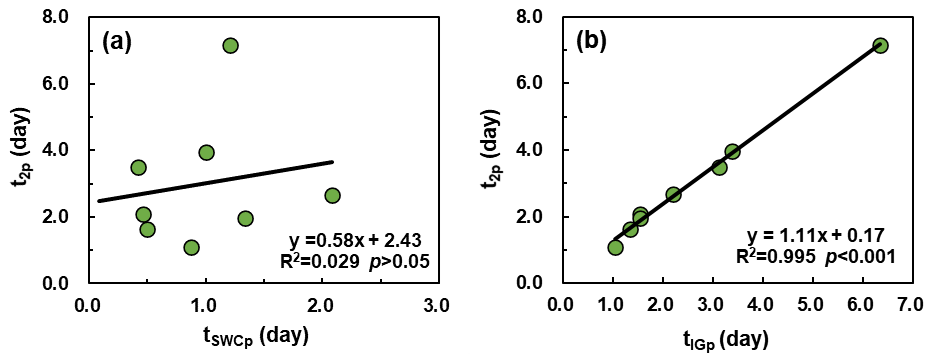
Figure 14Lag times of maximum (a) SWC and (b) IG relative to delayed streamflow peaks (t2p). and denote the peak times of the SWC and IG, respectively.
Quantitative analysis revealed a strong exponential relationship between streamflow and IG during the delayed stormflow period (Fig. 15). In the non-rainfall phase of the eight bimodal events, streamflow increased exponentially with GWL (IGp), exhibiting a highly significant correlation (p<0.001) and a determination coefficient of R2=0.90. This exponential increase in streamflow is attributed to the increase in lateral hydraulic conductivity as the water table approaches the surface. Similar findings have been reported by Detty and McGuire (2010) and Kendall et al. (1999), where groundwater outflow dominates during storm events.
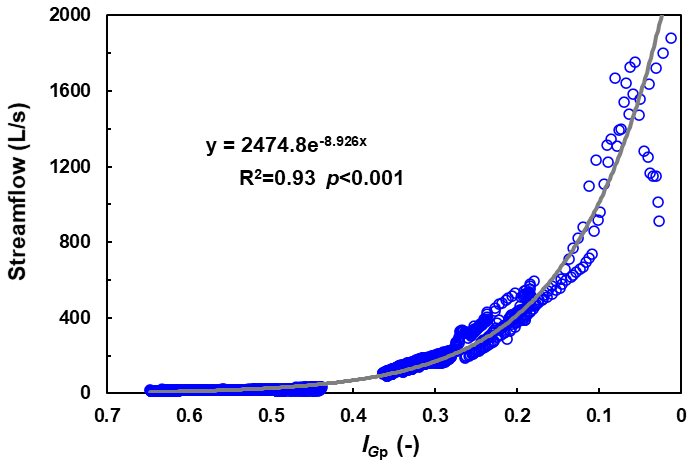
At higher GWLs, the curve of GWL vs. streamflow begins to flatten, suggesting a feedback mechanism. As the rising water table mobilizes shallow groundwater outflow, water is rapidly transported to the stream via shallow flow paths. This process, often referred to as transmissivity feedback, is consistent with the description of groundwater dynamics during delayed stormflow periods in Lundin (1982).
4.3 Delayed stormflow processes linked to GWL dynamics
Understanding the critical thresholds that govern the movement of water within landscapes is essential for accurately predicting delayed stormflow, as emphasized by McDonnell et al. (2021). This study identified a strong relationship between delayed stormflow and the gradual response of GWL, which is primarily influenced by a sharp decline in SWC when it exceeds a critical threshold of 0.20.
To identify the threshold for delayed stormflow initiation in XEW, we analyzed 63 out of 95 rainfall–runoff events with complete streamflow data. The relationship between SWCp and qs for these events is illustrated in Fig. 16. A clear threshold behavior emerged: when SWC remained below 0.20, qs remained minimal, which is consistent with unimodal events. However, as SWC exceeded 0.20, qs exhibited a noticeable increase, indicating the initiation of delayed stormflow in certain events. Specifically, when SWC surpassed 0.23, a pronounced surge in stormflow volume occurred accompanied by the emergence of a secondary stormflow peak in all events. These findings suggest that the critical threshold for delayed stormflow initiation lies within the SWC range of 0.20 to 0.23.
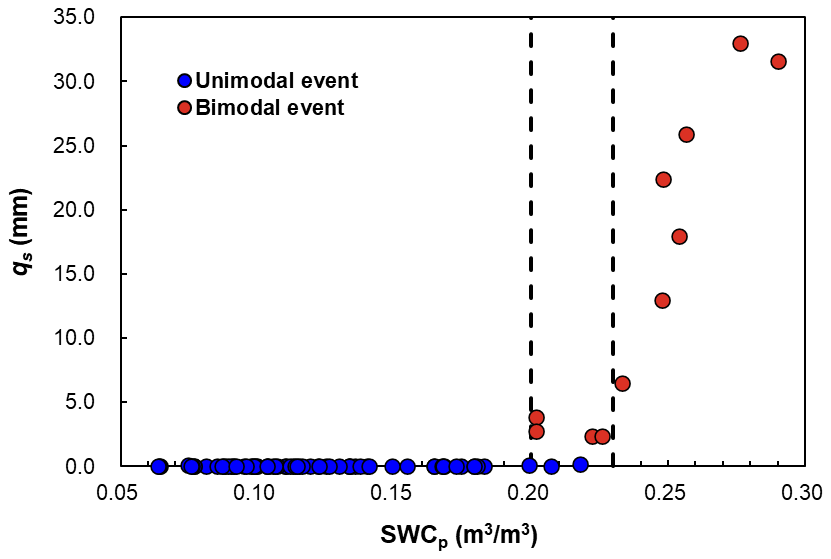
These results underscore the pivotal role of the surface soil layer's water deficit or water-holding capacity in triggering delayed stormflow. During rainfall events, the soil retains water until its water-holding capacity is exceeded. Once SWC surpasses the threshold of 0.20, the soil begins to release water more rapidly, initiating delayed stormflow. Additionally, during unimodal events, stormflow (qs) remained consistently below 1 mm despite variations in SWC, indicating that stormflow in these cases arises mainly from direct rainfall interception by the channel rather than delayed soil water release.
While the depth and distribution of soil layers likely influence the watershed's overall water storage capacity, observed SWC data showed minimal spatial variability across locations within the watershed. This suggests that SWC can serve as a reasonable proxy for the watershed's overall soil water storage capacity.
One limitation of this study lies in the indirect estimation of field capacity using observed SWC thresholds instead of direct measurements or modeling. Although this approach aligns with observed patterns and simplifies the analysis, it does not fully capture the spatial variability of field capacity or its dependence on soil depth. Future work should incorporate direct field capacity measurements or modeling to refine the relationship between SWC and delayed stormflow initiation, thereby improving the accuracy of threshold predictions.
4.4 Conceptual model of runoff generation in XEW
This section presents a conceptual model elucidating the runoff generation mechanisms in XEW, with a particular focus on the interplay between soil water storage and GWL dynamics. Soil water storage is identified as the critical factor driving the transition from initial to delayed runoff generation. Once the soil water deficit is replenished, the gradually rising GWL becomes the dominant control in the delayed stormflow process. Figure 17 illustrates the conceptual framework, which incorporates transmissivity feedback mechanisms to explain the formation of distinct hydrograph patterns.
4.4.1 Runoff generation under dry conditions (Fig. 17b)
In dry watershed conditions, characterized by low antecedent moisture and light rainfall, rainwater primarily infiltrates and is retained in the soil profiles. Streamflow during such events consists of two primary components: (1) a rapid yet modest streamflow peak driven by direct rainfall onto the channel and (2) a relatively stable baseflow originating from the gradual release of deep groundwater reservoirs.
Under these conditions, baseflow is primarily sustained by the gradual release of groundwater from deeper aquifers. The limited rainfall input fails to establish substantial connectivity between hillslopes and the channel.
4.4.2 Delayed stormflow during moderate storms (Fig. 17c)
As rainfall intensity and duration increase, moderate storm events lead to the replenishment of soil water deficits, resulting in the exceedance of soil storage capacity. Initially, the runoff response mirrors the one observed under dry conditions, with a rapid streamflow peak generated by direct channel rainfall. However, as rainfall continues, excess water infiltrates more deeply, elevating the GWL and expanding the saturated zone.
This process enhances the hydraulic connectivity between the stream channel and adjacent hillslopes, facilitating the lateral transport of shallow groundwater to the channel. As the GWL rises into more conductive soil layers, a delayed stormflow peak emerges, typically occurring after rainfall ceases. This secondary peak reflects the combined effects of deep infiltration, gradual GWL rise, and increased transmissivity in the subsurface, which accelerate shallow groundwater movement towards the channel.
4.4.3 Runoff generation during extreme storm events (Fig. 17d)
Extreme storm events, characterized by high rainfall intensity and large volumes, result in a sharp and widespread rise in GWL across the entire watershed. During such events, the rapid expansion of saturated areas and the increased hydraulic conductivity of the subsurface enable the swift mobilization of shallow groundwater. This synchronous response generates a pronounced flood peak within a short time frame.
In the riparian zones, GWLs may rise into the soil profile or even reach the ground surface, facilitating direct water flow into the channel via subsurface pathways. Observational data from extreme events corroborate this mechanism as significant increases in SWC are recorded in the deeper soil layers of riparian zones after rainfall ends. This pattern suggests that groundwater from adjacent hillslopes contributes to the replenishment of soil water in these zones, thereby enhancing the lateral transport of subsurface flow towards the channel.
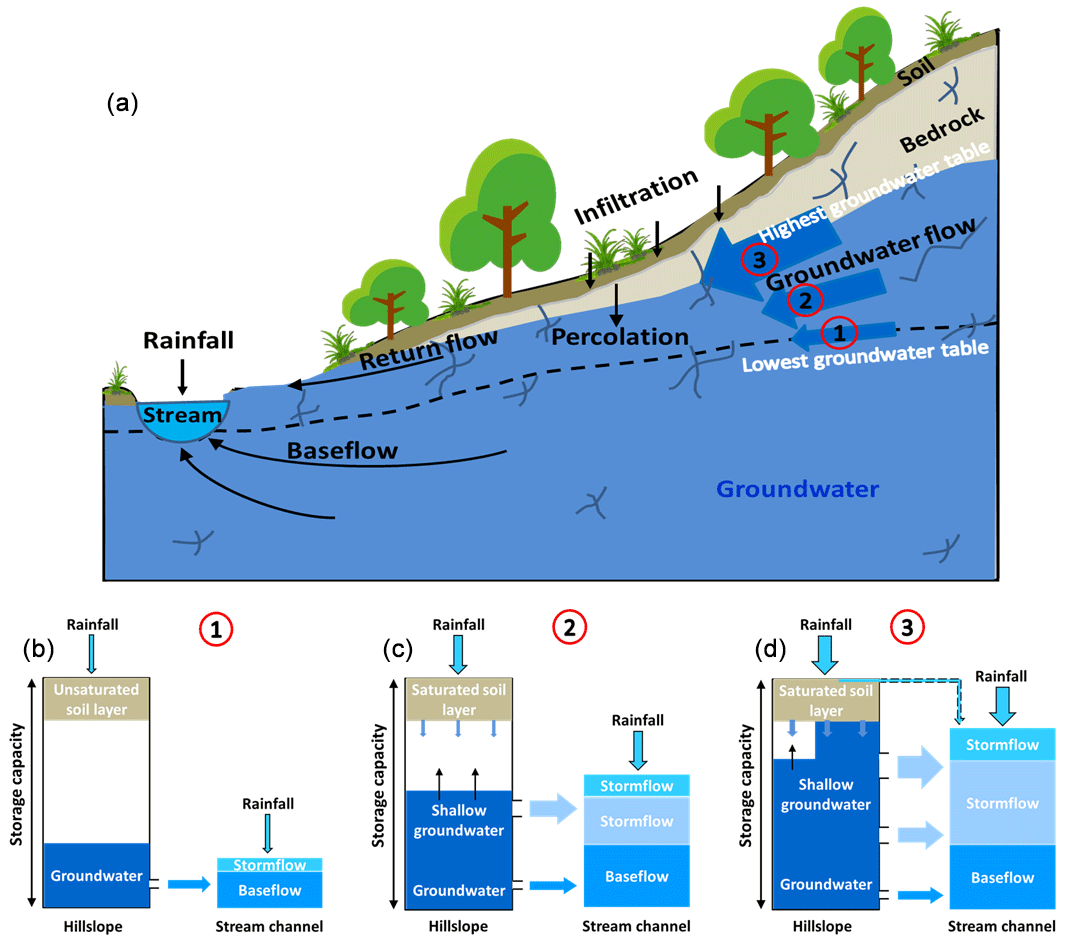
Figure 17Conceptual model illustrating stormflow generation associated with the transmissivity feedback.
The progression from the runoff generation under dry conditions (Fig. 17b) to moderate storm scenarios (Fig. 17c) and ultimately extreme events (Fig. 17d) reflects the progressive wetting-up of the watershed. Abrupt changes in stormflow volume and timing are initially governed by soil water storage thresholds and subsequently controlled by the bedrock hydraulic conductivity.
This conceptual model provides a theoretical framework for understanding how variations in hydrological conditions influence runoff generation processes in XEW. By integrating soil water storage dynamics, GWL responses, and transmissivity feedback mechanisms, the model offers an insight into the nonlinear behavior of runoff processes under different rainfall scenarios.
Building upon previous work that identified and characterized bimodal streamflow patterns in XEW, this study quantitatively analyzes SWC and GWL dynamics at the event scale to elucidate the mechanisms driving delayed stormflow generation. The findings reveal that when soil water storage surpasses its holding capacity, a secondary increase in streamflow is triggered. This secondary, or delayed, stormflow is primarily governed by GWL dynamics, which dictate both the magnitude and the timing of the delayed response.
During rainfall events, SWC responds rapidly, increasing until the soil's water storage capacity is reached or exceeded. If the amount of stored water remains below this capacity, SWC stabilizes or decreases gradually after rainfall ceases, eventually leveling off near the field capacity. The rate of this decrease is closely linked to the extent of SWC exceeding the field capacity. When SWC begins to decline, excess rainwater percolates deeper into the soil, raising the GWL. Once GWL begins to rise, it becomes the dominant driver of the delayed stormflow process.
As GWL rises, increased transmissivity facilitates enhanced groundwater flux from hillslopes to the stream channel. This process expands the effective connectivity between the channel and adjacent hillslopes. When GWL exceeds certain thresholds, synchronized responses across multiple hillslopes significantly amplify stormflow volume. This synchronized behavior shortens the lag time and increases the delayed stormflow volume, often causing the delayed peak to merge with the direct stormflow peak.
These findings offer a critical insight into the nonlinear processes governing stormflow generation and the formation of bimodal hydrographs. By elucidating the mechanisms underpinning these dynamics, the study advances hydrological theory and provides actionable knowledge for improving flood modeling and prediction.
The data supporting this study are available on the Zenodo website at https://doi.org/10.5281/zenodo.12581739 (Cui, 2024).
ZC contributed the conceptualization, formal analysis, investigation, and writing. FT contributed the conceptualization, formal analysis, and revision.
At least one of the (co-)authors is a member of the editorial board of Hydrology and Earth System Sciences. The peer-review process was guided by an independent editor, and the authors also have no other competing interests to declare.
Publisher's note: Copernicus Publications remains neutral with regard to jurisdictional claims made in the text, published maps, institutional affiliations, or any other geographical representation in this paper. While Copernicus Publications makes every effort to include appropriate place names, the final responsibility lies with the authors.
The authors sincerely appreciate the editor and reviewers for their insightful comments and constructive suggestions, which have greatly enhanced the quality of this manuscript. The authors would also like to gratefully acknowledge the financial support provided by the foundations and programs mentioned in the “Financial support” section.
This research has been supported by the National Key Research and Development Program of China (grant no. 2022YFC3002902) and the National Natural Science Foundation of China (grant no. 51825902).
This paper was edited by Mauro Giudici and reviewed by Kegan Farrick and two anonymous referees.
Anderson, M. G. and Burt, T. R.: The role of topography in controlling throughflow generation, Earth Surf. Process., 3, 331–334, https://doi.org/10.1002/esp.3290030402, 1978.
Beiter, D., Weiler, M., and Blume, T.: Characterising hillslope–stream connectivity with a joint event analysis of stream and groundwater levels, Hydrol. Earth Syst. Sci., 24, 5713–5744, https://doi.org/10.5194/hess-24-5713-2020, 2020.
Bishop, K., Seibert, J., Nyberg, L., and Rodhe, A.: Water storage in a till catchment. II: Implications of transmissivity feedback for flow paths and turnover times, Hydrol. Process., 25, 3950–3959, https://doi.org/10.1002/hyp.8355, 2011.
Cui, Z.: Xitaizi Experimental Watershed dataset, Beijing, China, Zenodo [data set], https://doi.org/10.5281/zenodo.12581739, 2024.
Cui, Z., Tian, F., Zhao, Z., Xu, Z., Duan, Y., Wen, J., and Khan, M. Y. A.: Bimodal hydrographs in a semi-humid forested watershed: characteristics and occurrence conditions, Hydrol. Earth Syst. Sci., 28, 3613–3632, https://doi.org/10.5194/hess-28-3613-2024, 2024.
Dang, L., Xie, Y. Q., Wang, C., Chang, Y., Zeng, X. K., and Wu, J. C.: Precipitation-induced Pressure Wave Propagation in Unsaturated Zone and Its Effect on Rapid Groundwater Discharge, Geol. J. China Univ., 29, 580–589, https://doi.org/10.16108/j.issn1006-7493.2021104, 2023.
Detty, J. M. and McGuire, K. J.: Threshold changes in storm runoff generation at a till-mantled headwater catchment, Water Resour. Res., 46, W07525, https://doi.org/10.1029/2009WR008102, 2010.
Farrick, K. K. and Branfireun, B. A.: Soil water storage, rainfall and runoff relationships in a tropical dry forest catchment, Water Resour. Res., 50, 9236–9250, https://doi.org/10.1002/2014WR016045, 2014.
Graeff, T., Zehe, E., Reusser, D., Lück, E., Schröder, B., Wenk, G., John, H., and Bronstert, A.: Process identification through rejection of model structures in a mid-mountainous rural catchment: observations of rainfall-runoff response, geophysical conditions and model inter-comparison, Hydrol. Process., 23, 702–718, https://doi.org/10.1002/hyp.7171, 2009.
Graham, C. B. and McDonnell, J. J.: Hillslope threshold response to rainfall: (2) development and use of a macroscale model, J. Hydrol., 393, 77–93, https://doi.org/10.1016/j.jhydrol.2010.03.008, 2010.
Graham, C. B., Woods, R. A., and McDonnell, J. J.: Hillslope threshold response to rainfall: (1) A field based forensic approach, J. Hydrol., 393, 65–76, https://doi.org/10.1016/j.jhydrol.2009.12.015, 2010.
Haga, H., Matsumoto, Y., Matsutani, J., Fujita, M., Nishida, K., and Sakamoto, Y.: Flow paths, rainfall properties, and antecedent soil moisture controlling lags to peak discharge in a granitic unchanneled catchment, Water Resour. Res., 41, W2179–W2187, https://doi.org/10.1029/2005wr004236, 2005.
Haught, D. R. W. and Meerveld, H. J.: Spatial variation in transient water table responses: differences between an upper and lower hillslope zone, Hydrol. Process., 25, 3866–3877, https://doi.org/10.1002/hyp.8354, 2011.
Hewlett, J. D. and Hibbert, A. R.: Factors affecting the response of small watersheds to precipitation in humid areas, Int. Symp. For. Hydrol., 1, 275–290, https://doi.org/10.1177/0309133309338118, 1967.
Kendall, K. A., Shanley, J. B., and McDonnell, J. J.: A hydrometric and geochemical approach to test the transmissivity feedback hypothesis during snowmelt, J. Hydrol., 219, 188–205, https://doi.org/10.1016/S0022-1694(99)00059-1, 1999.
Kosugi, K., Fujimoto, M., Katsura, S., Kato, H., Sando, Y., and Mizuyama, T.: Localized bedrock aquifer distribution explains discharge from a headwater catchment, Water Resour. Res., 47, W07111, https://doi.org/10.1029/2010WR009884, 2011.
Lundin, L.: Soil moisture and ground water in till soil and the significance of soil type for runoff, PhD Thesis, Uppsala University, UNGI Report No. 56, 216 pp., 1982.
Martínez-Carreras, N., Hissler, C., Gourdol, L., Klaus, J., Juilleret, J., Iffly, J. F., and Pfister, L.: Storage controls on the generation of double peak hydrographs in a forested headwater catchment, J. Hydrol., 543, 255–269, https://doi.org/10.1016/j.jhydrol.2016.10.004, 2016.
McDonnell, J. J., Spence, C., Karran, D. J., Van Meerveld, H. J., and Harman, C. J.: Fill-and-spill: A process description of runoff generation at the scale of the beholder, Water Resour. Res., 57, e2020WR027514, https://doi.org/10.1029/2020WR027514, 2021.
Padilla, C., Onda, Y., and Iida, T.: Interaction between runoff–bedrock groundwater in a steep headwater catchment underlain by sedimentary bedrock fractured by gravitational deformation, Hydrol. Process., 29, 4398–4412, https://doi.org/10.1002/hyp.10498, 2015.
Penna, D., Tromp-van Meerveld, H. J., Gobbi, A., Borga, M., and Dalla Fontana, G.: The influence of soil moisture on threshold runoff generation processes in an alpine headwater catchment, Hydrol. Earth Syst. Sci., 15, 689–702, https://doi.org/10.5194/hess-15-689-2011, 2011.
Rinderer, M., van Meerveld, I., Stähli, M., and Seibert, J.: Is groundwater response timing in a pre-alpine catchment controlled more by topography or by rainfall?, Hydrol. Process., 30, 1036–1051, https://doi.org/10.1002/hyp.10634, 2016.
Scaife, C. I., Singh, N. K., Emanuel, R. E., Miniat, C. F., and Band, L. E.: Non-linear quickflow response as indicators of runoff generation mechanisms, Hydrol. Process., 34, 2949–2964, https://doi.org/10.1002/hyp.13780, 2020.
Sloto, R. A. and Crouse, M. Y.: HYSEP: A computer program for streamflow hydrograph separation and analysis, US Geol. Surv., https://doi.org/10.3133/wri964040, 1996.
Tian, F., Li, H., and Sivapalan, M.: Model diagnostic analysis of seasonal switching of runoff generation mechanisms in the blue river basin, Oklahoma, J. Hydrol., 418–419, 136–149, https://doi.org/10.1016/j.jhydrol.2010.03.011, 2012.
Tromp-van Meerveld, H. J. and McDonnell, J. J.: Threshold relations in subsurface stormflow: 1. A 147-storm analysis of the Panola hillslope, Water Resour. Res., 42, W02410, https://doi.org/10.1029/2004WR003778, 2006a.
Tromp-van Meerveld, H. J. and McDonnell, J. J.: Threshold relations in subsurface stormflow: 2. The fill and spill hypothesis, Water Resour. Res., 42, W02411, https://doi.org/10.1029/2004WR003800, 2006b.