the Creative Commons Attribution 4.0 License.
the Creative Commons Attribution 4.0 License.
 | 19 May 2025
A 60-year drought analysis of meteorological data in the western Po River basin
Emanuele Mombrini
Stefania Tamea
Alberto Viglione
Roberto Revelli
Since the start of the 21st century, increasing focus has been put on drought and its wide range of environmental and socioeconomic effects, particularly in the context of climate change. The identification of changes in drought occurrence has been done at different spatiotemporal scales and using different approaches, with results that may not be fully comparable. This study aims to analyse drought trends in the northwestern region of Italy, encompassing the Piedmont and Aosta Valley regions, characterized by diverse topography and warming rates. The analysis is carried out over the last 60 years using the Standardized Precipitation Index (SPI) and the Standardized Precipitation Evapotranspiration Index (SPEI) at 3- and 12-month timescales and deriving drought events at the local and regional spatial scales. By leveraging on a continuous and spatially coherent precipitation and temperature dataset, we explore the temporal and spatial variability of drought conditions and compare results obtained with different approaches.
Our results reveal widespread drying trends in the region, with temperature playing a crucial role. The SPEI indicates more extensive and steeper negative trends than the SPI due to temperature increases. However, the onset and cessation of drought events are predominantly driven by precipitation anomalies, while temperature plays a key role in longer-term drought conditions. Both the SPI and SPEI consistently identify local and regional drought events. In the 1990–2020 period, drought event severity, duration, and intensity generally increased compared to during the 1960–1990 period, even though this increase is less significant than the one shown by the SPI and SPEI. Nevertheless, the spatial scale of the analysis plays a significant role in interpreting these trends. Local-drought characteristics are more influenced by temperature increases in the SPEI, whereas regional droughts are more affected by precipitation patterns, as seen in the SPI, with more frequent short-term droughts aggregating into longer-term deficits. Drying trends are more pronounced in lower, less rugged areas, while alpine regions show fewer drought trends. Interestingly, drought characteristics and trends are found to be more correlated with terrain ruggedness than with mean elevation. In fact, a clear drying trend is not found at a region-wide level but is instead found when considering homogeneous areas defined by terrain ruggedness. Furthermore, changes in the number of drought episodes and in their severity, duration, and intensity are found to be correlated with terrain ruggedness at all timescales.
These findings emphasize the need for high-resolution, region-specific studies to better understand how droughts evolve in complex terrains like the northwestern Italian Alps. Future research should investigate whether similar outcomes are found in other regions and what the potential causes are as this is instrumental for evaluating how these trends may continue to evolve under projected climate change scenarios.
- Article
(7634 KB) - Full-text XML
- BibTeX
- EndNote


Drought is considered to be one of the main natural disasters, with widespread effects affecting large portions of the world's population (Wallemacq et al., 2015) and causing severe financial losses (García-León et al., 2021) and ecosystem impacts (Crausbay et al., 2020). Drought also has both short- and long-term effects on water availability (IDMP, 2022), which are relevant when considering the global increase in water demand in the past and the predicted challenges in meeting that demand in the future (UNESCO, 2018; Wada et al., 2016; Burek et al., 2016). These drought-related phenomena are also likely to become more impactful as droughts are predicted to become more severe and frequent under climate change conditions (Dai, 2011, 2013; Trenberth et al., 2014; Ward et al., 2020; Pörtner et al., 2022). Understanding if and how changes will occur on a local scale is thus necessary in order to develop adequate adaptation responses.
Several studies on meteorological-drought trends exist at the global and continental scales (e.g. Ault, 2020; Vicente-Serrano et al., 2022; Ayugi et al., 2022). Many studies have also been carried out in northern Italy – often in the context of the wider Mediterranean or Alpine region – analysing either precipitation series (Bordi and Sutera, 2002; Brunetti et al., 2002; Hoerling et al., 2012; Haslinger and Blöschl, 2017; Pavan et al., 2019) or precipitation and temperature series (Hanel et al., 2018; Falzoi et al., 2019; Arpa Piemonte and Regione Piemonte, 2020; Baronetti et al., 2020; Vogel et al., 2021). Overall, these studies have found an increase in meteorological-drought occurrence in northwestern Italy, particularly after the 1970s, even in the cases in which recent drought events have not been found to be exceptional when compared to historical records (Haslinger and Blöschl, 2017; Hanel et al., 2018). Despite some agreement about the changes in precipitation, the seasonality reported by the studies differs significantly, with precipitation decreases found either in the winter (Brunetti et al., 2002; Hoerling et al., 2012) or summer season (Haslinger et al., 2012; Hanel et al., 2018; Pavan et al., 2019). Among these studies, those also considering temperature values consistently showed rising temperatures – and, thus, a rise in evaporative demand – to be a main factor in drought increases.
Besides drought trends in wider areas, interest in regional expressions of climate change has also been growing. One of the most investigated regional phenomena is the enhancement of warming rates with elevation or elevation-dependent warming, explored on the basis of both surface measurement (e.g. Mountain Research Initiative EDW Working Group, 2015) and of climate models (e.g. Palazzi et al., 2019). In general, despite conflicting results regarding the presence of an elevation effect on warming rates and the lack of adequate climate data for mountainous regions, a consensus on enhanced warming rates at higher altitudes emerges (Rangwala and Miller, 2012; Pepin et al., 2022). The change in orographic precipitation gradients, i.e. the elevation-dependent precipitation change, has also been widely investigated, with less consensus on the results. A comprehensive meta-analysis of both in situ studies of precipitation data from mountainous regions (including the Alps) and global gridded databases from the early 1950s to the late 2010s reported a relative decrease in precipitation compared to in lowlands, although without high confidence (Pepin et al., 2022). Furthermore, analyses such as that of Giorgi et al. (2016) have shown the importance of the spatial resolution in understanding processes in topographically complex regions, reporting that increases in summer precipitation in higher-elevation areas of the Alpine range could only be detected by dense observation networks and described by high-resolution regional climate models.
Several studies on meteorological droughts are based on evaluating drought indices, such as the SPI (Standardized Precipitation Index) and the SPEI (Standardized Precipitation Evapotranspiration Index), giving a statistical interpretation of the temporal variability of meteorological data. Besides the temporal variability of wetting and drying events, droughts are further characterized by the duration and intensity of these events, which are relevant and independent indicators of drought characteristics. Less investigated is the spatial variability in drought characteristics and the change in indices obtained by averaging over different areas (Haslinger et al., 2012) and possibly leading to different outcomes in terms of drought magnitude and trends. The spatial dimension is relevant not only when larger or smaller regions experience the adverse effects of droughts but also when droughts occur on complex terrains, ranging from lowlands to hills and mountains. In this case, drought characteristics may differ among terrains, and the frequency of occurrence of drought periods of a certain magnitude may be diversified. Elevation is thus a main factor to be considered to describe this complexity but may not be the only one.
Given these considerations, in this study, we aim to tackle the following research questions:
-
Are there temporal trends in drought indices such as the SPI and SPEI and how do these trends translate into changes in the characteristics of drought events, e.g. duration, severity, and intensity?
-
Is there a relationship between drought trends and the topographical characteristics of a landscape? If so, is elevation the topographical variable most correlated to these trends?
-
Do these conclusions change if drought events are defined at different spatial scales?
To investigate these questions, an area such as the western Po River basin is particularly suitable. The region is part of the European Alps that divides the Mediterranean and continental Europe, with opposite projected changes in precipitation and different responses to climate oscillations. Also, the region comprises wide plains, hilly areas, and high mountains, with possible effects of elevation gradients and topography on drought characteristics and trends. Despite the presence, as detailed above, of studies on drought in the chosen region, these lack either the needed spatial resolution or the focus on different choices for drought characterization and on possible effects of terrain characteristics on drought conditions. Here, a high-resolution gridded dataset of precipitation and temperature values obtained from gauging stations distributed at different elevations throughout the domain and spanning more than 60 years is analysed by calculating the SPI and SPEI at 3- and 12-month timescales. The index series are analysed in order to find trends in drought conditions, as well as changes in drought event characteristics (duration, severity, intensity) at both the point and areal scale. Section 2.1 describes the study area; Sect. 2.2 the meteorological dataset; and Sect. 3 the analysis methods, including the SPI and SPEI. In Sect. 4, the results obtained from each analysis are reported, while in Sect. 5, the general conclusions derived from the study are discussed.
2.1 Study area
The considered area includes the Piedmont region and the Aosta Valley (Fig. 1), located in the northwest of Italy, measuring more than 28 000 km2 and, together, representing the headwaters of the Po River basin. Orographically, it is mainly a mountainous area surrounded by the Alpine chain, with mountain ranges occupying half of the area and with the highest peaks lying in the Aosta Valley, while the plains lie in the central and eastern parts of the region.
The relief of the area plays a key role in defining climate variability (Arpa Piemonte, 2007): continental air masses from the Po Plain, moist currents from the Mediterranean Sea, and northwestern Atlantic currents interact with the terrain's features, leading to a complex and spatially variable climate (Ciccarelli et al., 2008). Annual precipitation ranges from 700 to more than 1700 mm, with a mean of 1000 mm. Annual precipitation is lowest in the central western area and in the northwestern Aosta Valley, while it is highest in the northern area (Fig. 1). Seasonality in precipitation is bimodal, i.e. is characterized by a bimodal distribution, with maxima in spring and autumn and minima in summer and winter. For most of the region (close to 90 %), winter is the season with minimum precipitation, and only in the southwestern area is the minimum in summer; for the western and southern sides of the territory (close to 60 % of the overall area), the maximum precipitation occurs in autumn, while, for the central eastern part, it occurs in spring (Perosino and Zaccara, 2006). Mean annual temperatures range from slightly over 13°C near the eastern border to slightly under −3.6°C at the highest altitudes. The diurnal temperature range varies from 2°C to more than 12 °C, is highest in summer, and is also generally inversely correlated with elevation.
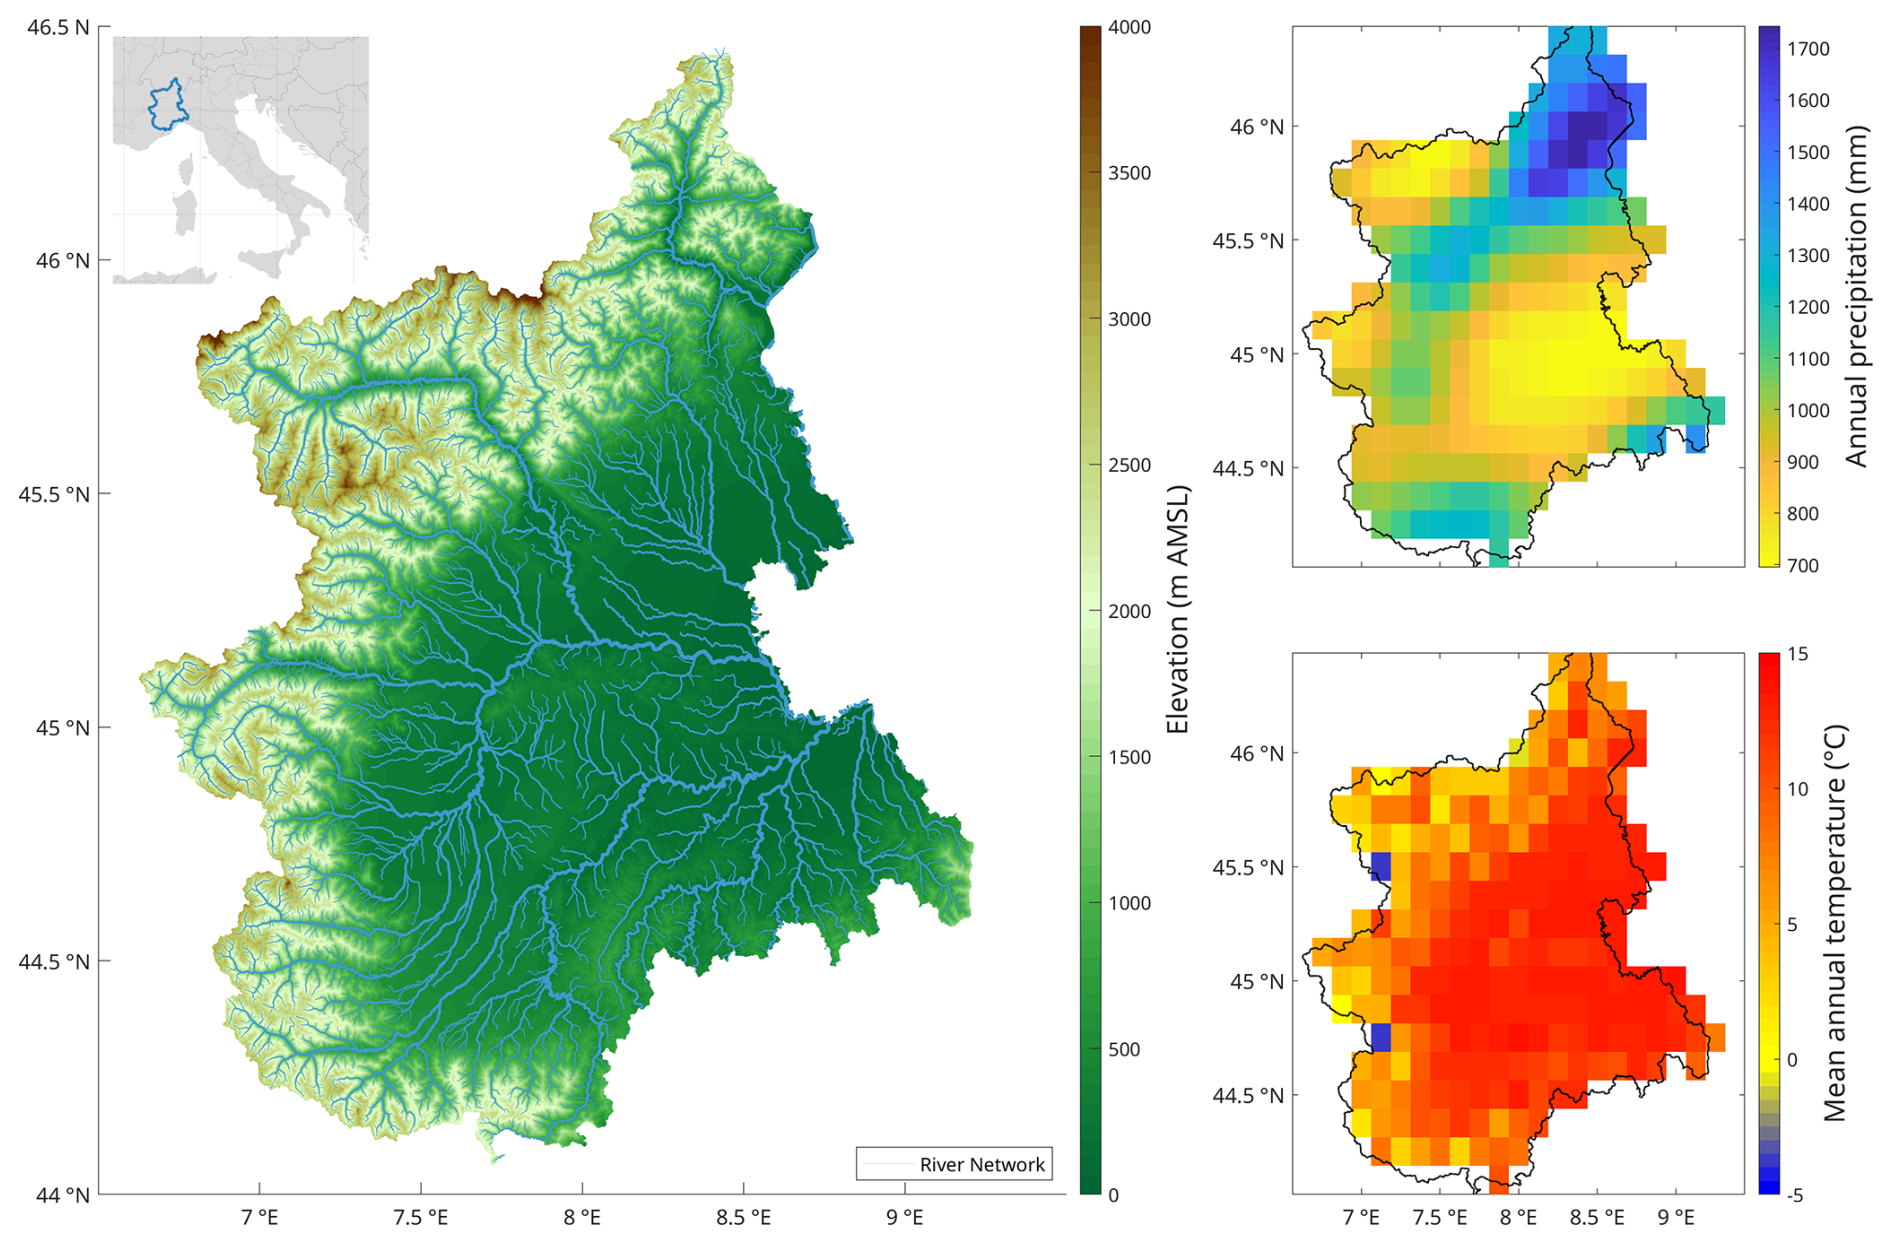
Figure 1 Map of the study area, including elevation, river network, mean annual precipitation, and mean temperature values.
2.2 Meteorological data source and processing
The data used in the analysis are obtained from the North Western Italy Optimal Interpolation (NWIOI) dataset (Arpa Piemonte, Dipartimento Sistemi Provisionali, 2011), calculated and published by the Forecast Systems Department of the Regional Environmental Protection Agency of Piedmont (Dipartimento Sistemi Previsionali – Arpa Piemonte). The dataset contains daily precipitation and maximum and minimum temperature values over a regular grid covering the domain area with a 0.125° resolution. The data were obtained through an analysis of the region's meteorological station network data via the optimal interpolation method, as detailed in Uboldi et al. (2008).
The method spatially interpolates station data by correcting a previously defined background field based on an “area of influence” for each station. This area of influence is both horizontal and vertical in the case of temperature stations (tri-dimensional interpolation) and only horizontal in the case of precipitation stations (two-dimensional interpolation). In any case, no direct trend relation between the meteorological values and elevation has been evaluated and removed from or added to the data. The data used in the interpolation method are provided by a gauging network covering both low- and high-altitude areas, with changing availability in terms of the number of available stations in time. The number of precipitation stations was about 120 until the mid-1980s and gradually rose to the current 386 sites of today. There were only about 25 temperature stations for the first period, though these have risen to the current 371. This is why the background field based on ERA40 has been used (see https://www.arpa.piemonte.it/scheda-informativa/spazializzazione-dei-dati-temperatura-precipitazione-griglia, last access: 13 May 2025). Even though the change in the number of stations in time – and, therefore, in information – may have an effect on the analyses described below, especially regarding local extreme drought situations, we believe that the advantage of having a long-term (1950s–2020s) and spatially consistent database is superior to the disadvantages due to its potential lack of temporal homogeneity. The NWIOI grid is based on information from a much higher number of stations than contained in other available datasets for the area (Turco et al., 2013), and it is therefore considered to be the most accurate and homogeneous data product of meteorological variables for the region. For the purpose of the subsequent analysis, 227 (the number of NWIOI dataset grid points inside the domain) series of 783 monthly values (December 1957–February 2023) of precipitation and maximum and minimum temperature are calculated.
2.3 Land classification based on elevation
In order to study possible correlations between drought indices in relation to terrain characteristics, elevation values for the studied domain are obtained from the EarthEnv-DEM90 digital elevation model (Robinson et al., 2014) with a 90 m resolution. Two sets of values are then obtained for each grid cell: the mean elevation (average of the elevation values inside a cell) and the terrain ruggedness. The terrain ruggedness (also known as surface roughness or topographic heterogeneity) is defined as the “deviations in the direction of the normal vector of a real surface from its ideal or intended form” (Whitehouse, 1994) and quantifies the irregularity of terrain; similarly to other studies, it is calculated here as the standard deviation of the elevation values inside every grid cell (Habib, 2021).
The landscape is classified in terms of areas with similar topography. Four distinct areas of an almost equal number of cells are identified based on terrain ruggedness: the plains, the hilly region, and the lower and higher mountains. Figure A1 in the Appendix shows the classified areas and the fact that mean elevation and terrain ruggedness are highly correlated. However, the advantage of using terrain ruggedness over mean elevation is that, in our study area, the hills in the central southern part of the region are distinguished from the eastern flat part of the region despite having similar mean elevation. Regardless of its simplicity, our terrain ruggedness classification is consistent with what one would obtain with the K3 mountain classification (Karagulle et al., 2017), a much more complex categorization based on the Global Mountain Explorer 2.0 platform (Sayre et al., 2018).
This section presents the methods adopted to tackle the three research questions stated in the Introduction of the paper. The two drought indices, the SPI and SPEI, are introduced in Sect. 3.1 and 3.2. Then, we explain the methods used for assessing their trends in time (Sect. 3.3), for deriving drought events at the local and regional scales (Sect. 3.4 and 3.5), and for assessing temporal changes in drought characteristics (Sect. 3.6). An explanation of the methods to analyse the relationship with terrain characteristics (mean elevation and local terrain ruggedness) is given in Sect. 3.3, 3.4, and 3.6.
3.1 Standardized Precipitation Index (SPI)
Monthly precipitation values are used to calculate the Standardized Precipitation Index (McKee et al., 1993) at 3- and 12-month scales. The probability distribution chosen for the index calculation is the gamma distribution because, although other possible distributions have been proposed in the literature (Angelidis et al., 2012), including empirical ones (Laimighofer and Laaha, 2022), no single one was shown to be markedly better than the gamma distribution. Following the standard procedure found in the literature (Tigkas et al., 2015; Angelidis et al., 2012; Bordi and Sutera, 2002; Hayes et al., 1999), the index is thus obtained by fitting the gamma probability distribution to the precipitation values of each month of the year. To do this, the shape parameter a and the scale parameter b of the gamma distribution are calculated for each series of non-zero values of each month using the maximum likelihood method (Choi and Wette, 1969). The cumulative probability FX is calculated as follows:
where j is the month index (); i is the year index (, with n years of records); and Γ(aj) is the gamma function, i.e. .
To take the probability of zero values into account (given that the gamma distribution is defined for ), the zero-inflated model is defined as follows:
where qj is the probability of zero precipitation for the jth month of the year. Finally, the SPI is calculated as the normal inverse function of HX via the following formula:
where Φ−1 is the inverse of the complementary error function.
The SPI obtained through this method is thus a series of positive and negative values belonging to a normal distribution (μ=0, σ=1): negative (positive) values represent precipitation below (above) the mean, with values lower than −1 denoting drought conditions (World Meteorological Organization, 2012). To calculate the index at a different timescale, a moving average is first applied to each monthly value, with the length being equal to the desired timescale and with only previous data included; data that do not have enough preceding values to calculate the moving average are discarded. After calculating the SPI based on these data, each monthly value of the index describes how the conditions for a period with length equal to the timescale and ending in one particular month compare with all others in the series. For example, the SPI at a 3-month timescale (SPI-3) for the month of July of a particular year indicates how dry or wet the previous 3 months have been compared with all other May–July periods in the series. In-built MATLAB® functions are used for both the incomplete gamma function and its scale and shape parameter calculations and the calculation of the normal inverse function.
3.2 Standardized Precipitation Evapotranspiration Index (SPEI)
In order to take into account the effect of evaporative demand on drought episodes and for comparison with SPI values, the Standardized Precipitation Evapotranspiration Index (Vicente-Serrano et al., 2010) is calculated at 3- and 12-month scales. The procedure for calculating the index is the same as for the SPI, but the data analysed are a series of monthly precipitation minus reference evapotranspiration (ET0, in mm) values, and a log-logistic probability distribution is used. Temperature data were used to calculate monthly ET0 values using the Hargreaves formula (Hargreaves and Samani, 1985), following the recommendations for SPEI calculation (Beguería et al., 2014). Probability-weighted moments (PWMs) using Hosking's unbiased method (Hosking, 1986) were used to calculate the α, β, and γ parameters of the log-normal distribution for each month of the year according to the following formulae (again according to the recommendations for the index calculations found in Beguería et al., 2014):
where di,j denotes the precipitation minus ET0 values for a given month j of the year i, and denotes the s order of the PWM for the month j. Using the αj, βj, and γj parameters, the log-logistic distribution is calculated as follows:
Finally, this FD distribution is transformed into a normal distribution to obtain the SPEI values. Again, moving-average windows are applied to the input data in order to obtain different timescales. The distribution was shown to be well suited to analysing the data as calculations obtained a finite solution for all series.
3.3 Trend analysis
Drought index series are analysed in order to search for significant (at 5 % significance) trends. The trends are estimated using the Theil–Sen slope estimator (Theil, 1950; Sen, 1968), i.e. by calculating the median slope between the index values for all possible month pairs. The significance test is performed through the Mann–Kendall test (Mann, 1945), which is a non-parametric (distribution-free) alternative to the linear regression slope test available in regression analysis. To improve the power of the test, deseasonalization and pre-whitening of the data are performed. Deseasonalization is performed by subtracting the mean of the detrended temperature series for each month using the Climate Data Toolbox (Greene et al., 2019). The autocorrelation of the series (given that a moving average is applied at 3- and 12-month timescales) is taken into account by also applying different pre-whitening methods before performing trend analysis. These method are the simple pre-whitening method (PW, Kulkarni and Storch, 1995), the trend-free pre-whitening method (TFPW, Yue et al., 2002), and the variance-corrected trend-free pre-whitening method (VCTFPW, Wang et al., 2015). The different results are used to obtain one trend evaluation by applying the 3PW algorithm (Collaud Coen et al., 2020), which, for the purpose of this study, is as follows:
- (a)
If the lag-1 autocorrelation of the data is significant (following a normal distribution at the two-sided 95 % confidence interval), the PW and TFPW series are obtained from the original series.
- (b)
The trend is considered to be significant if both processed series return significant trends using the Mann–Kendall test.
- (c)
The slope of the significant trend is given as the Sen's slope of the VCTFPW series. If the lag-1 autocorrelation of a series is found not to be significant, trend analysis is performed on the un-modified data.
In order to identify whether different trends in the drought indices occur in areas with different landscape characteristics, the classification of the research area into four classes is used, as described in Sect. 2.3.
3.4 Local-drought analysis
Each SPI and SPEI series obtained for the cells of the data grid (Sect. 2) is analysed pixel by pixel through a “run analysis” at 3- and 12-month timescales in order to identify local-drought events and to study local-drought characteristics. A drought run is considered to be a series of consecutive months under a certain threshold (set as −1, corresponding to a moderately dry condition in the SPI classification, similarly to run theory analysis; Yevjevich, 1967), including the negative values leading up to and following the period under the threshold, in order to capture events where a deficit is not fully recovered from (see Fig. 2a). Drought run characteristics are then calculated for each local-drought event (Caloiero et al., 2021):
-
Drought duration (DDL) is the length of the drought run, reported in months for this study.
-
Drought severity (DSL) is the cumulative value of the index during each run.
-
Drought intensity (DIL) is the ratio between the DSL and DDL values of a run, i.e. the average index value during the run.
Given a series of drought runs calculated from an index series, the average values of these characteristics for all runs are reported as , , and . Pedex L indicates that these are local drought characteristics calculated for a single grid point as opposed to drought characteristics calculated over multiple grid points (see next section).
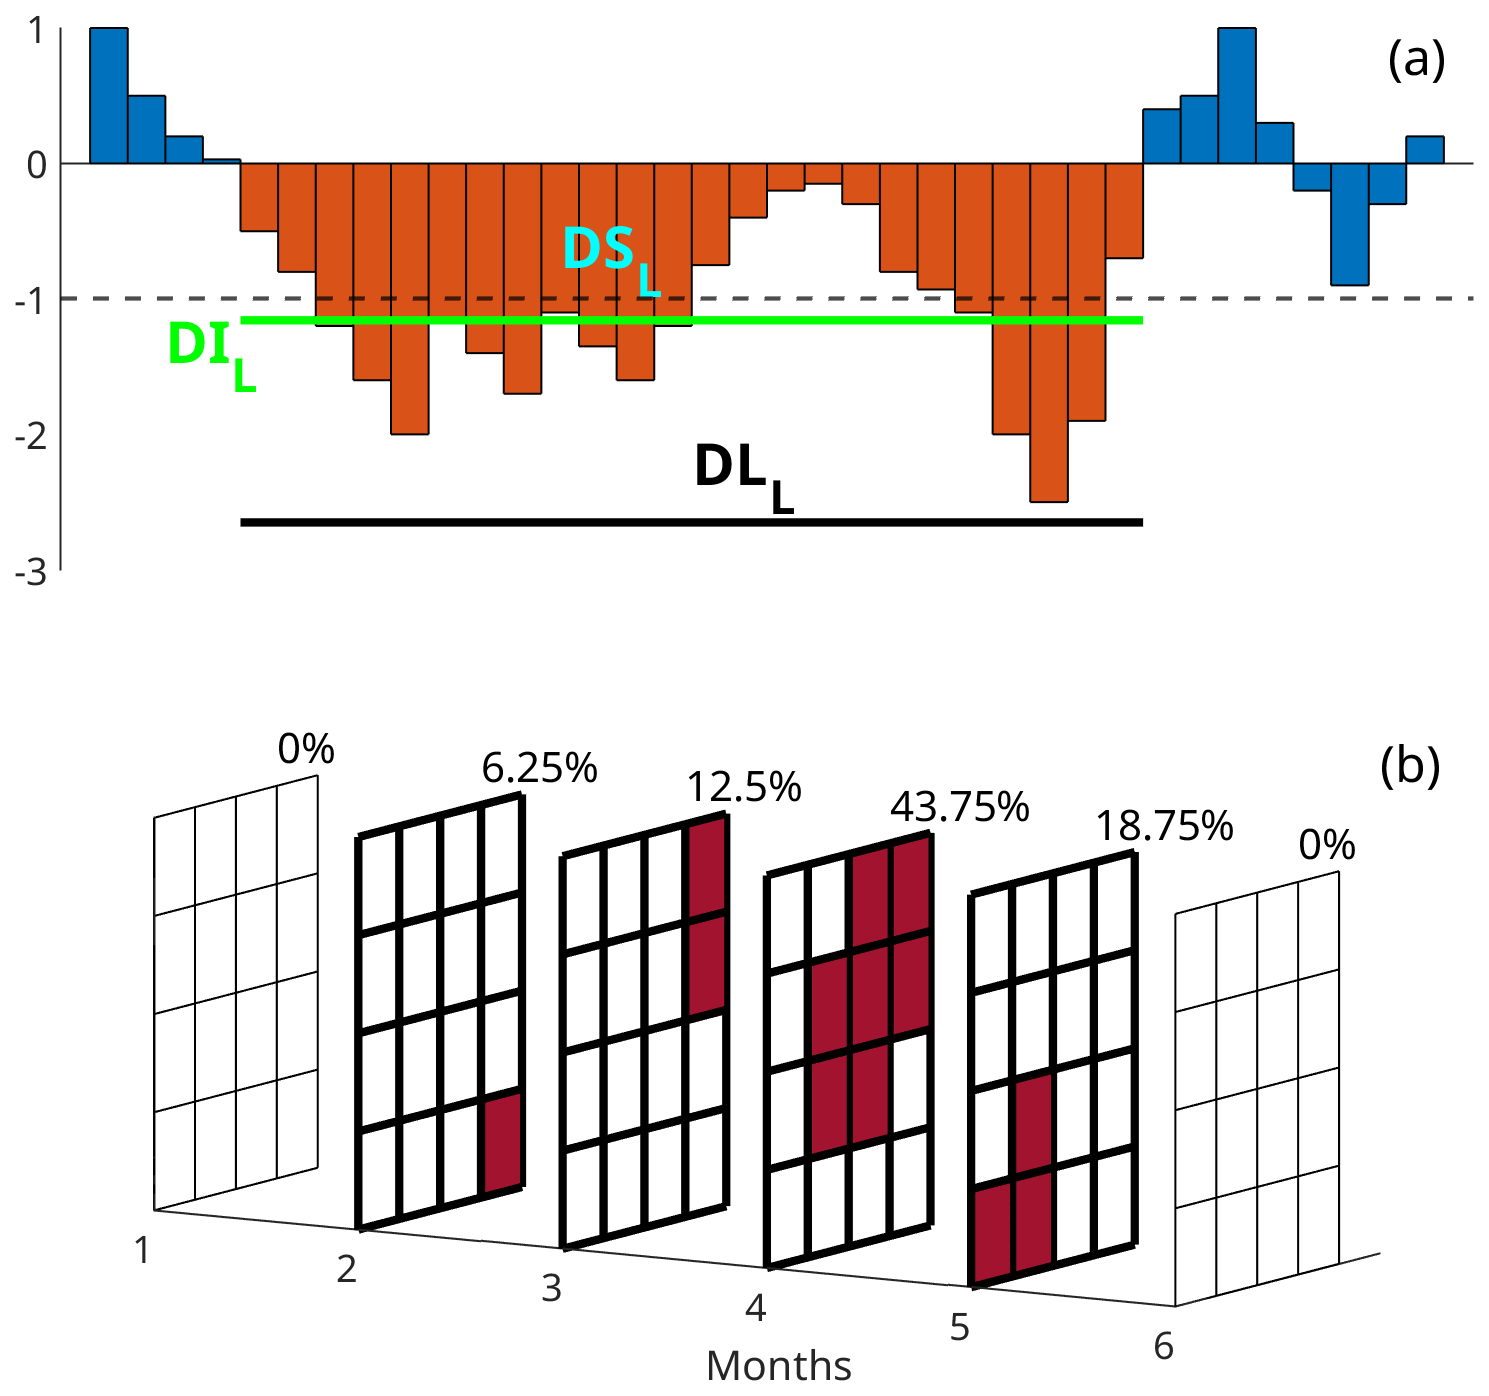
Figure 2Examples of the method used for drought event definition. (a) Local-drought events defined by a threshold and by including their onset and offset, i.e. all negative values before and after the values under the threshold. DSL is the sum of the index value during the run, DDL is the length of each run, and DIL is the mean index value during the run. (b) Region-wide drought events calculated for the entire study area, starting when at least 25 % of cells have a drought index lower than −1 (represented as dark red in the figure) and including all preceding and following months with some cells with a lower than −1 index value. Months considered to be part of the drought event are highlighted by bolder grid lines in the figure.
To quantify the level of correspondence between local droughts by means of the SPI and SPEI, each cell's series is transformed into a binary series of zeros and ones, where 1 denotes the occurrence of a drought, and the Cohen's kappa (Cohen, 1960) between the series is calculated as a measure of agreement, with 0 and 1 denoting no agreement and complete agreement, respectively.
To identify whether different trends in the drought indices occur in areas with different landscape characteristics, correlations between terrain characteristics and trend values are quantified by calculating both the Pearson and the Spearman correlation coefficients (Shevlyakov and Oja, 2016).
3.5 Region-wide drought event analysis
In order to include the spatial dimension in the study of droughts and to describe the coupled spatiotemporal characteristics of drought runs, i.e. to define region-wide drought events, the following approach is taken, similarly to González-Hidalgo et al. (2018). In contrast to local droughts, which are calculated from a series of index values for a single cell, region-wide drought events are evaluated by considering what happens in the entire region. During a region-wide drought event, a certain number of cells will have a drought index lower than −1 for that month, comprising a drought area. Region-wide drought events are identified when at least 25 % of the domain's cells fall under the −1 threshold. Moreover, the drought events' onset and offset, i.e. the periods below the 25 % drought area threshold before and after a period above the threshold, are also included in the drought event itself (see Fig. 2b). This approach is useful in considering persisting drought conditions as one continuous event while still maintaining well-defined episodes, similarly to the proposed definition of local drought. Note that the additional threshold for the minimum duration of 3 weeks used in González-Hidalgo et al. (2018) is always met as monthly data are used in this analysis.
Similarly to local drought, different characteristics are calculated for each region-wide drought event:
-
Drought event duration (DDE) is the length of the drought event.
-
Drought event severity (DSE) is the sum of the drought index of each cell experiencing drought conditions for the duration of the event, divided by the total number of cells in the domain.
-
Drought event intensity (DIE) is the mean of the local intensity for each cell that has been part of the drought event. Intensity for each cell is calculated as the sum of the drought index below the −1 threshold divided by the number of months where the index was lower than −1.
-
Drought area (DAE) is the average number of cells experiencing drought condition during the event.
Given a series of region-wide drought events calculated from the index series for all cells in the domain, the average values of these characteristics for all events are reported as , , , and .
3.6 Change analysis of drought characteristics
In order to evaluate the significance of the change in average drought characteristics between the periods 1958–1990 and 1990–2023 (approximately the first and second half of the series), the two-sample t test (Rasch et al., 2011) is applied to , , and (as well as to , , , and ) calculated for the drought periods starting before and after January 1990, respectively. After obtaining the values pre- and post-1990, their sample mean and standard deviations are calculated, and the test statistic t is calculated as
where is the mean of a certain drought characteristic for all drought runs or events before and after 1990 and s:
where σ is the standard deviation of a certain drought characteristic for all drought runs or events before and after 1990, and n is the number of runs or events for the two periods. t is then compared with the critical value of the statistic at a 5 % significance level. Given that no assumptions about the variance of the two ensembles were made and given the different number of runs in the two periods, the degrees of freedom needed for the calculation of the critical value were approximated through the Welch–Satterthwaite equation (Welch, 1947).
Similarly to what is done for trends in drought indices, the correlation between changes in local-drought characteristics and in terrain characteristics (mean elevation and ruggedness) are quantified by the Pearson and the Spearman correlation coefficients (Shevlyakov and Oja, 2016).
The following sections report the results of the analyses of drought indices (Sect. 4.1) and local-drought events (Sect. 4.2), with the correlation of temporal trends with the topographic characteristics of the landscape reported in each section. The results from the analysis of region-wide drought events are reported in Sect. 4.3.
4.1 Trends in the drought indices
Drought indices, i.e. the SPI and SPEI, calculated from the precipitation and temperature series of each cell in the region are analysed in order to find possible trends in drought conditions. Given the nature of the SPI, as described in Sect. 3.1, negative trends indicate a tendency for precipitation to be below the series's mean value. This means that both wet and dry periods have seen, on average, reduced precipitation and, thus, that drought conditions, when occurring, have become worse. For the SPEI, described in Sect. 3.2, the trend interpretation is the same, but instead of precipitation, a climatic water balance between precipitation and potential evapotranspiration is considered. Furthermore, trend analysis on indices at the shorter 3-month timescale and the longer 12-month timescale indicates how drought conditions might have evolved, respectively, over smaller timescales, closer to the response time of soil moisture conditions to meteorological conditions, and over larger timescales, closer to the response time of reservoirs and groundwater levels to meteorological conditions.
Trend analysis on SPI-3 and SPI-12 values shows a majority of cells with significant negative trends (and, thus, a tendency towards dryer conditions). A majority of cells (almost 70 %) show negative SPI trends at both 3- and 12-month timescales, although the SPI-12 indicates dryer conditions over time compared to the SPI-3 (Fig. 3a and b). Trend analysis for the SPEI-3 and SPEI-12 displays a similar timescale effect, with the longer timescales having a higher number of cells with significant trends (although with 79 % of cells showing trends for both timescales) and, on average, greater slope coefficients (Fig. 3c and d). The clearest differences emerge by comparing the results obtained by the SPI and SPEI. At both timescales, the SPEI shows a far wider region heading towards dryer conditions (more than twice the cells found with the SPI) and at a faster rate, given the slope coefficients (Fig. 3e).
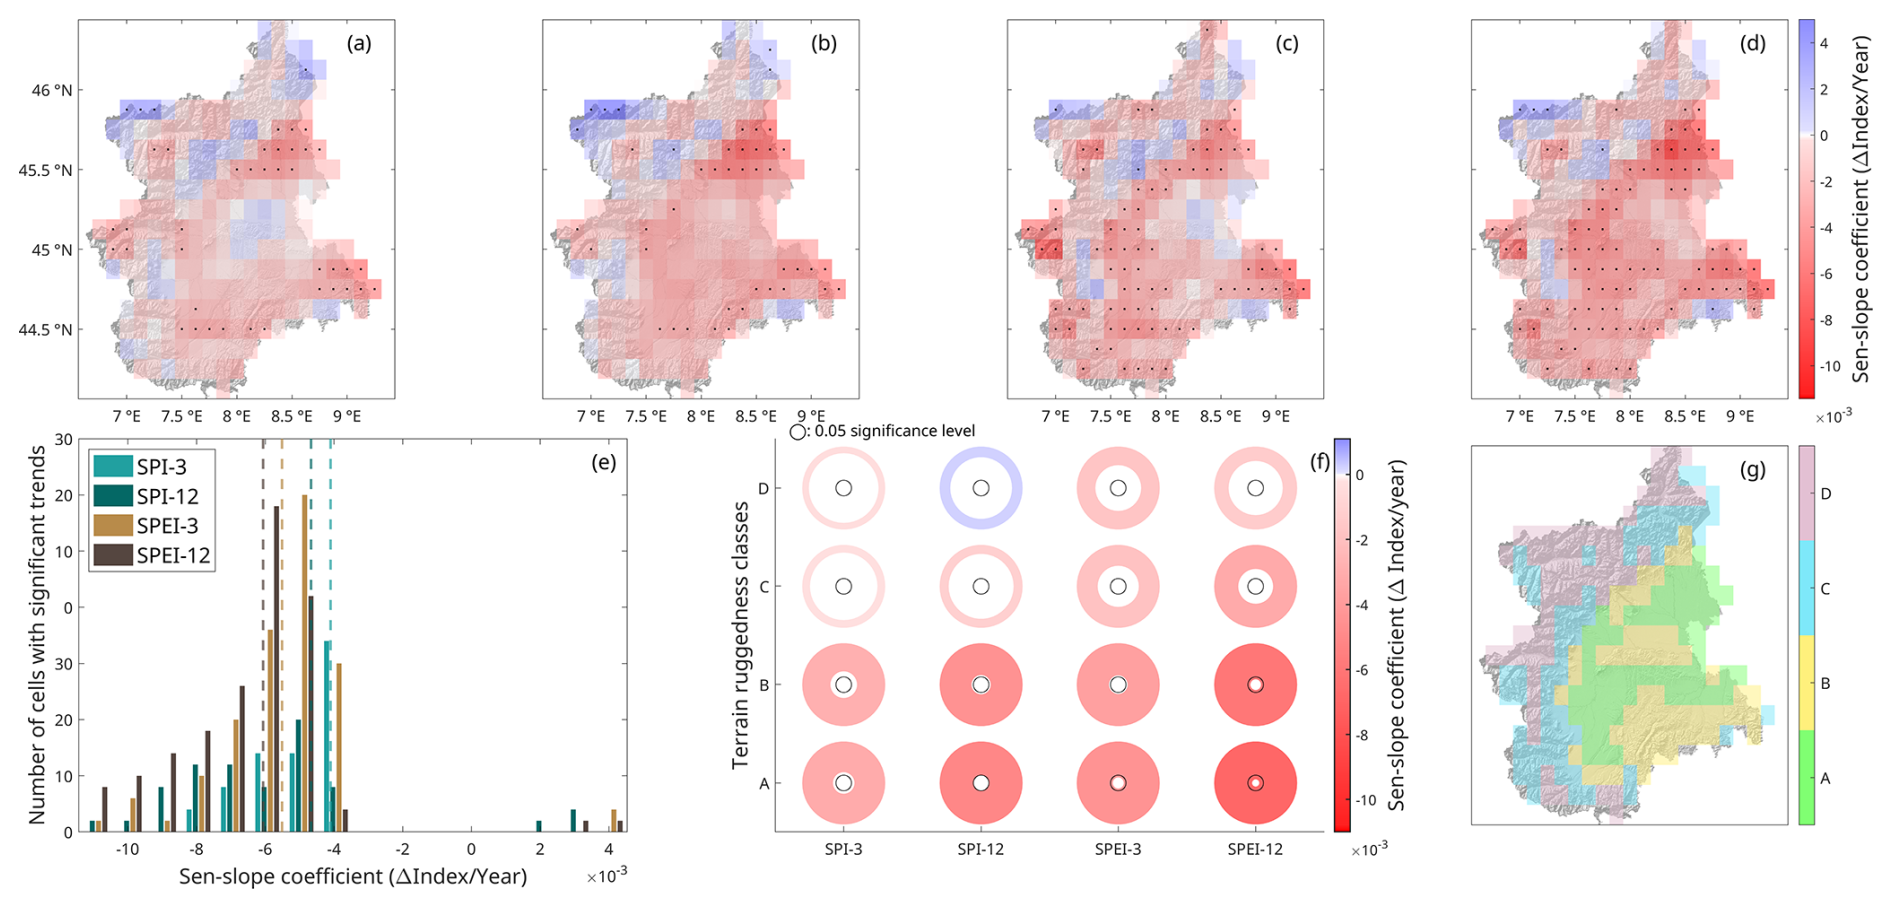
Figure 3 Trend analysis on drought indices. (a) SPI-3 trends. (b) SPEI-3 trends. (c) SPI-12 trends. (d) SPEI-12 trends. Cells containing a dot denote trends at 5 % significance. (e) Frequency histogram of significant Sen slope coefficients, with dashed lines representing the respective mean values of index slopes. (f) Trend analysis on drought indices calculated from data belonging to areas defined by terrain ruggedness inside cells. The colour of the circles represents the slope coefficient of the trend, while the inner radius of the circles represents the significance of the trend (a smaller inner radius represents a more significant trend). The black circles denote a significance level of 5 %. (g) Representation of terrain ruggedness classes (see Fig. A1 for more details on their definition).
From observing panels (a)–(d) of Fig. 3, clear and consistent spatial patterns are visible. The terrain characteristics align well, especially for the SPEI analysis. Even though terrain elevation is to be considered to be a potential variable correlated to trend patterns, an expert observer (who is familiar with the region) would spot the fact that the majority of the significant positive trends occur in flat areas. Figure 3f and g show that, if terrain ruggedness is used to subdivide the area into regions with similar sizes, the low-elevation areas (classes A and B), especially the flat ones (class A), show the strongest and most significant trends for both the SPI and SPEI at both 3- and 12-month timescales. Classifying the area by mean elevation (not shown here) gives similar results, i.e. a significant difference between the alpine range and the plain area of the domain with worsening drought conditions for the latter but with smaller differences between the two classes with lower elevations.
4.2 Local-drought analysis
After analysing how the general drought conditions in the region have changed over time, the effects of such changes on the characteristics of local-drought periods are investigated through a run analysis (see Sect. 3.4). First, the characteristics of local droughts in the region are described as a baseline; then, possible temporal changes in their number, severity, duration, and intensity are investigated.
4.2.1 Local-drought characteristics
Despite the differences in observed trends detailed in the previous section, the detection of local droughts by means of the SPI and SPEI shows a high level of correspondence for both 3- and 12-month timescales. The mean Cohen's kappa (Cohen, 1960) value, used to quantify agreement between the identification of local-drought periods based on the SPI and SPEI, is slightly higher at the 3-month scale (mean kappa equal to 0.86) than at the 12-month scale (mean kappa equal to 0.81) but is always higher than 0.5, indicating that there is always good to excellent agreement. Therefore, given that the SPI drought runs are based only on precipitation values, it can be stated that a majority of local droughts are determined by precipitation deficits, with temperature itself having a smaller influence on single events but a greater influence on overall trends (as seen in Sect. 4.1).
In the analysis of local-drought characteristics, the longer timescale shows, as expected, a lower number of runs but with higher severity (DSL) and duration (DDL) for both the SPI and SPEI. Drought intensity (DIL) values are, instead, similar between the two timescales, although they are slightly greater at the 3-month scale. Despite the difference in absolute values, drought analysis indicates a higher number of local droughts and a higher and for the SPEI runs compared to for the SPI runs at both timescales. Thus, when considering both precipitation and ET0, a greater number of longer and more severe drought periods is detected compared to the less numerous and shorter periods detected using only precipitation.
One significant difference emerges when comparing the mean drought intensity () values (Fig. 4d, h, n, and r). Average drought intensity is lower for the SPEI-3 runs compared to the SPI-3 while being slightly greater for the SPEI-12 compared to the SPI-12. This seems to be due to the lower index values reported by the SPI-3 compared with the SPI-12. The mean negative minimum values during the drought runs are lower for the SPI than for the SPEI at both 3-month ( for the SPI and for the SPEI) and 12-month ( for the SPI and for the SPEI) timescales, but, while the SPEI values remain almost constant, the SPI values show less negative mean minimum values at the longer timescale. This fact, combined with the similarly longer SPEI droughts at both timescales, leads to the slightly higher for the SPEI-12.
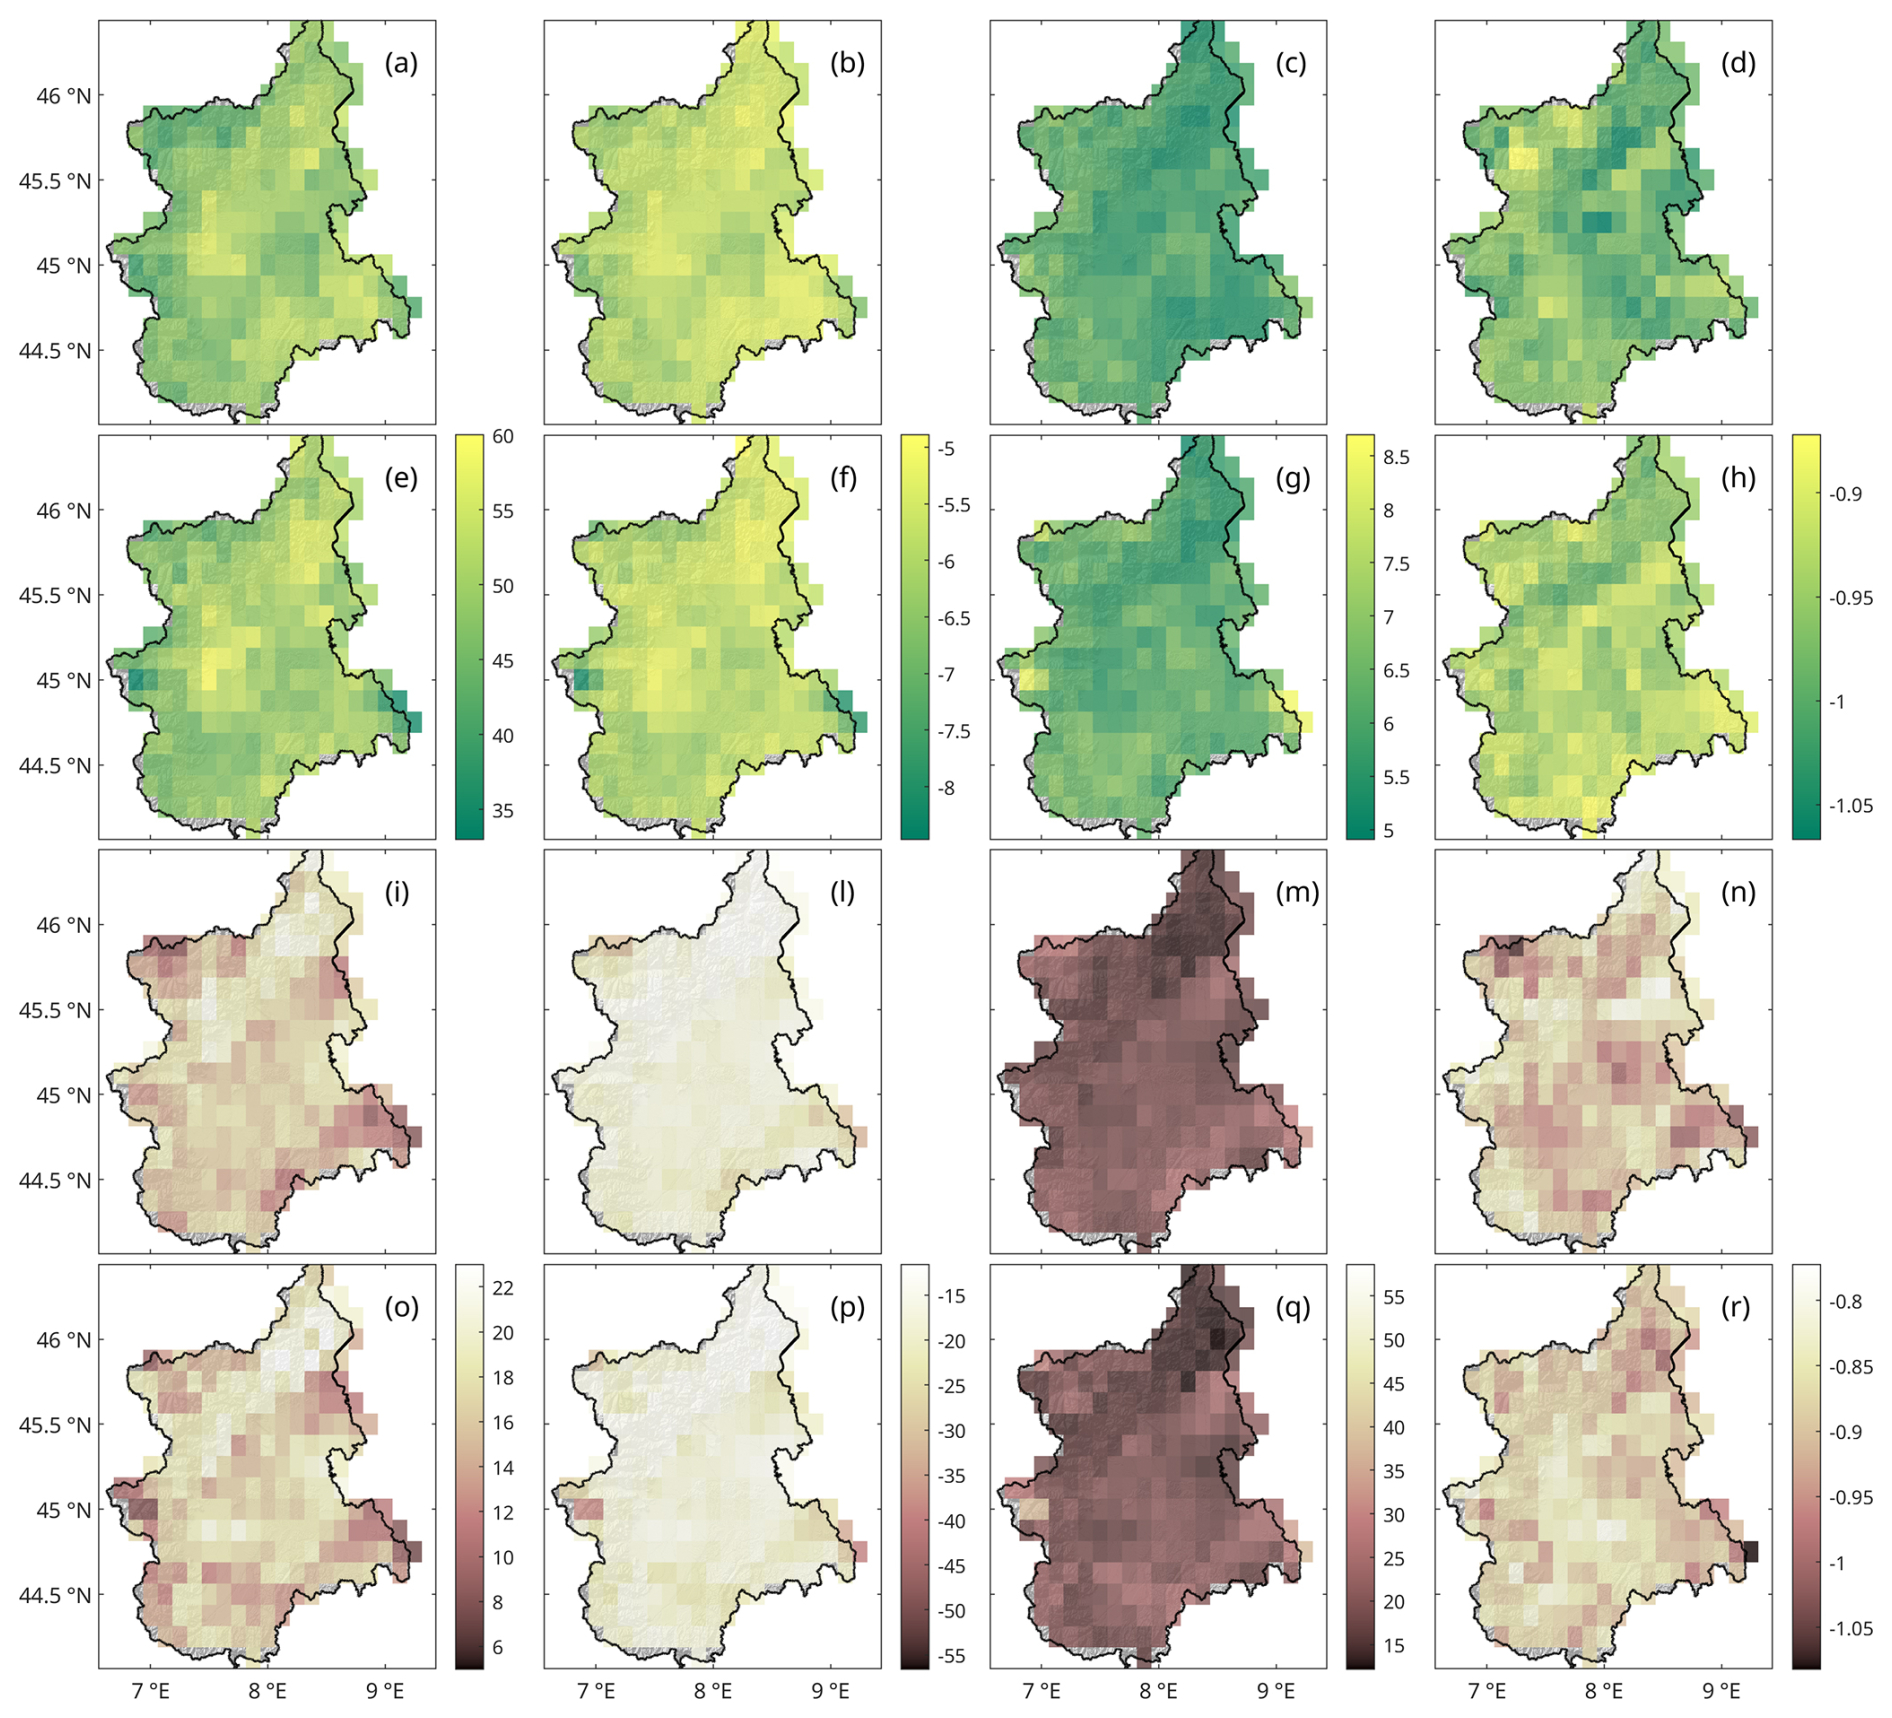
Figure 4Spatial distribution of drought run characteristics at 3- and 12-month timescales. The SPI-3's number of runs (a), average severity of local drought (b), average length of local drought (c), and average intensity of local drought (d). The SPEI-3's number of runs (e), (f), (g), and (h). The SPI-12's number of runs (i), average severity of local drought (l), average length of local drought (m), and average intensity of local drought (n). The SPEI-12's number of runs (o), (p), (q), and (r).
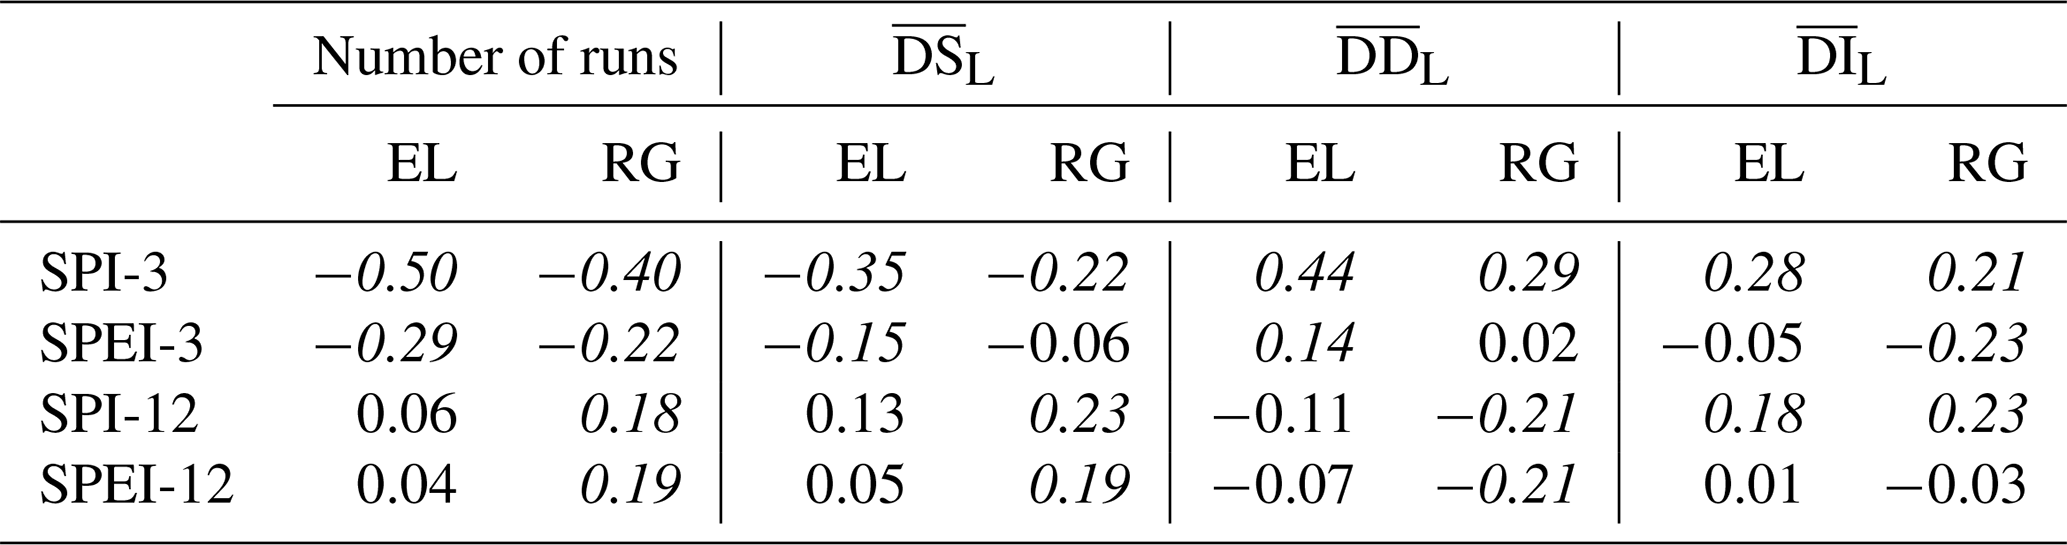
Regarding the spatial distribution of mean local-drought characteristics (number of runs, , , and ), the SPI and SPEI show similar results when compared at the same timescale while deviating significantly between 3- and 12-month timescales. The SPI-3 and SPEI-3 drought characteristics do not display clear spatial gradients but do display some correlation with mean elevation and terrain ruggedness (as seen in Table 1). In particular, when areas at a higher mean elevation are considered, a lower number of more severe; longer; and, for the SPI-3 only, less intense droughts is reported (although with some differences in the degree of correlation). Altogether, these results indicate that, on shorter timescales, droughts in higher-mean-elevation areas tend to be more clustered. Even so, visual inspection of the spatial distribution of local-drought characteristics for the SPI-3 and SPEI-3 (see Fig. 4a–h) shows a high spatial variability of characteristics. However, the higher mean elevation points of the mountainous part of the domain do show quite uniform drought characteristics that are consistent with the observed correlations. It can therefore be stated that, despite some significant effects of the mean elevation on the characteristics of drought periods, heterogeneous local orography and meteorological conditions play a key role. When considering terrain ruggedness, the resulting correlation values are generally less significant than for mean elevation at the 3-month scale but more significant at the 12-month scale. The SPI-12 and SPEI-12 run characteristics display no correlation with longitude or latitude (see Fig. 4i–r) and no correlation with mean elevation in terms of the number, severity, and duration of runs. The only statistically significant correlation found is with the SPI-12's , with higher mean elevation areas reporting less intense events, consistently with the results obtained for the SPI-3. Conversely, indices at the 12-month scale have significant correlations with terrain ruggedness for the number of runs and their and , with rugged terrain reporting less numerous, less severe, and shorter droughts.
Table 1Pearson correlation coefficients between mean drought characteristics and mean elevation (EL) or terrain ruggedness (RG) for both the SPI and SPEI at 3- an 12-month timescales. Values in italic font denote significant correlations at 5 % significance. Spearman correlation coefficients are not reported as they show very similar results.
4.2.2 Temporal analysis of local-drought characteristics
Trend analysis based on the obtained local-drought characteristics reports only a few cells (always less than 3 % of the domain) showing significant changes for drought duration, severity, and intensity (DDL, DSL, and DIL) (not shown here). In comparison, the SPEI-3 shows a far greater number of cells, slightly more than 10 % of the total area, with significant increasing trends for DSL and DIL, distributed almost exclusively along the Alpine chain, particularly near the southern border. The yearly average change, in terms of the percentage of the relative for the cell, ranges from 1 % to 11 % and 0.01 % to 1 % for severity and intensity, respectively.
Despite the overall lack of significant trends, clear differences can be found between the characteristics of drought runs that started before and after 1990. The SPI-3 and SPEI-3 display, on average, an increase in the number of droughts (more markedly in the case of the SPEI-3) and in their DIL. Opposite results are found in terms of DSL and DDL, with the SPI-3 indicating a shift towards less severe and shorter droughts and vice-versa for the SPEI-3. Significantly, this difference seems to be caused mainly by cells located in the flat part of the region, where the SPEI-3 indicates a shift towards greater DSL and DDL (not shown here). The rest of the region shows similar results for the two indices. The Alpine chain, especially in the north, shows a shift towards a higher number of less severe, shorter, and less intense droughts. The SPI-12 and SPEI-12, on the other hand, report agreeing results and show, on average, a change towards a lower number of more severe, longer, and more intense droughts across the domain. The only exception is the Alpine chain, where, for a small but continuous area, a change towards less numerous, less severe, shorter, and less intense droughts is found.
These relative changes are highly correlated to the mean cell elevation and, even more so, to the ruggedness of the area (as confirmed by Table 2). For example, at the 3-month scale, the flat part of the region sees a change towards less numerous, more severe, longer, and more intense droughts, while the Alpine chain shows an opposite change. Changes in the SPEI-12 run characteristics also display a similar correlation for , , and but the opposite in terms of the number of droughts. Therefore, it seems that the SPEI-12 droughts got more numerous, more severe, longer, and more intense in the lowlands, and, although not quite as strongly, the opposite has happened in the Alpine chain. The SPI-12 does show an increase in the number, severity, and duration of droughts in the lowlands and a decrease in the mountains but no correlation for .
Table 2Pearson correlation coefficients between change in mean drought characteristics pre- and post-1990 and mean elevation (EL) and terrain ruggedness (RG) for both the SPI and SPEI at 3- and 12-month timescales. Values in italic font denote significant correlations at 5 % significance. Spearman correlation coefficients are not reported as they show very similar results.
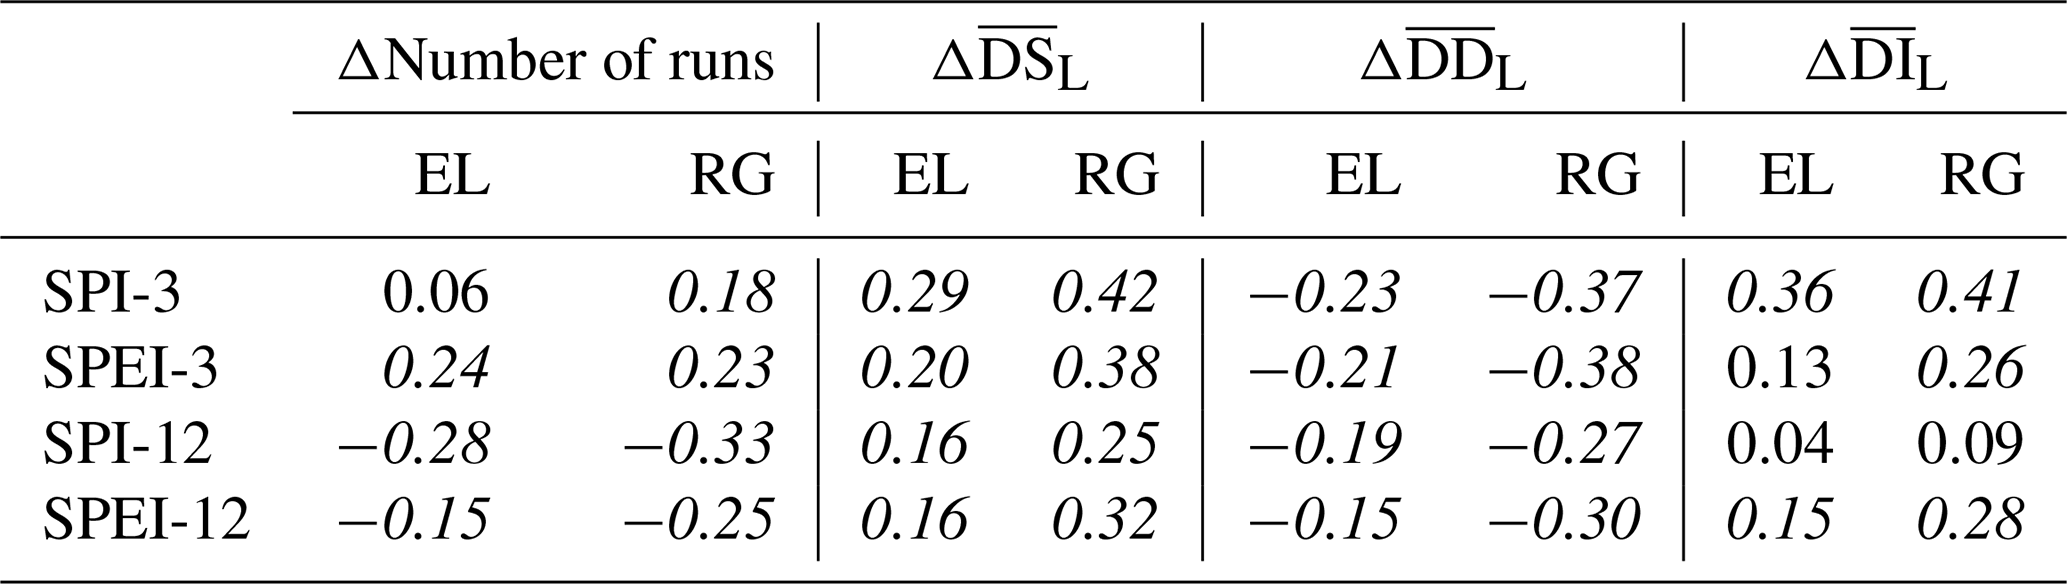
Changes in local-drought characteristics, as opposed to average values, report higher correlations with terrain ruggedness than with mean elevation. Overall, correlation values are also higher than those found for average local-drought characteristics, and visual inspection of the spatial distribution (not shown here) does show quite a homogeneous distribution of drought characteristic changes between the mountains (especially on the windward side, i.e. the one facing the Po Plain) and the plains and hills. The only outliers are the Aosta Valley in the northwest and another valley close to the western border, with changes that are often similar to those in the lowlands.
Still, most of the changes found by comparing the two periods are not found to be significant according to the two-sample t test and, thus, do not denote a change in the probability distribution of local-drought characteristics. The cells with significant changes (reported in Fig. 5) are mostly distributed between two areas: changes towards more severe (according to the SPI-12, SPEI-3, and SPEI-12), longer (according to both indices at the 3-month scale), and more intense (according to both indices at the 12-month scale) droughts are reported for the eastern-most part of the domain; changes towards less severe and shorter droughts are reported mostly in the northern part of the Alpine chain for the SPI and SPEI at the 3-month scale, while almost no significant shifts towards less intense local droughts are found.
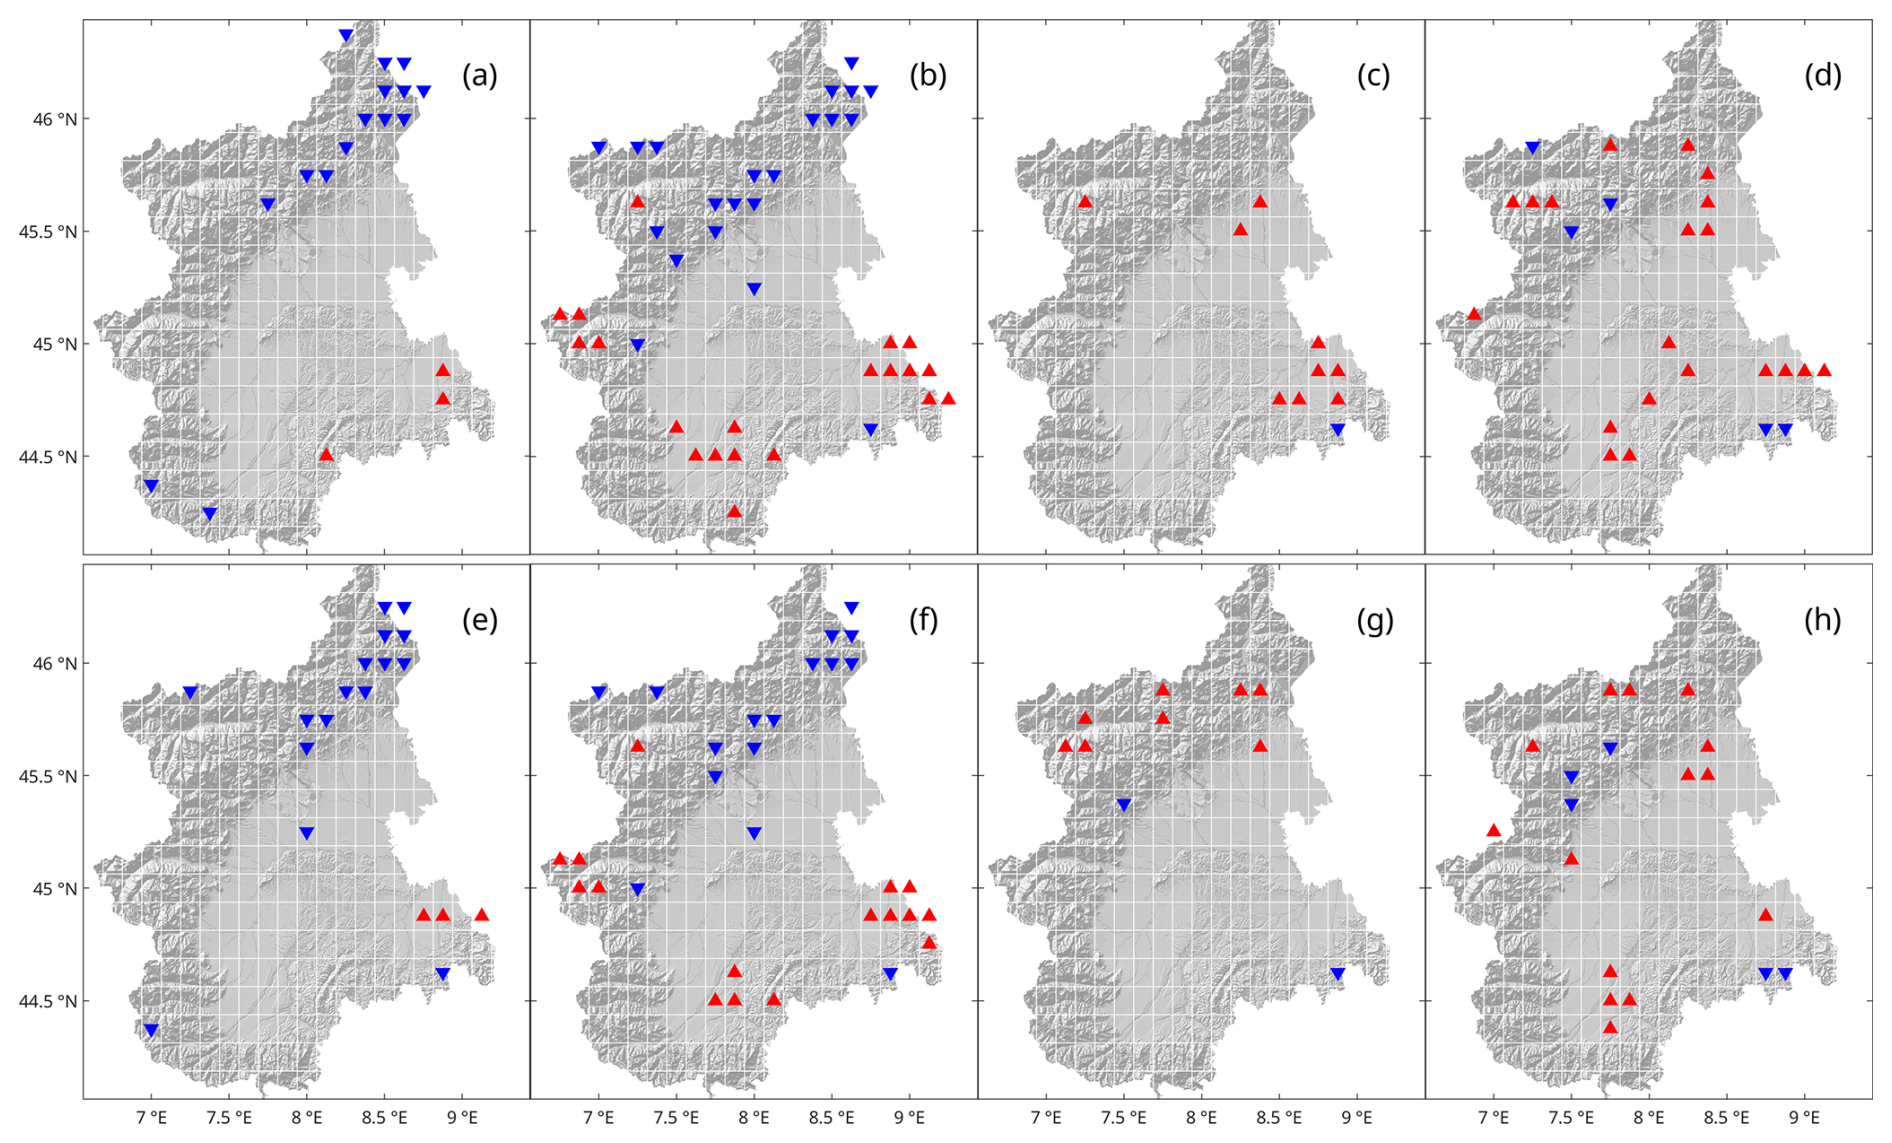
Figure 5Cells with significant changes between the mean drought characteristics for the 1958–1990 and 1990–2023 periods according to the two-sample t test. (a–d) Mean drought severity () change for the SPI-3 (a), SPEI-3 (b), SPI-12 (c), and SPEI-12 (d). (e–h) Mean drought duration () change for the SPI-3 (e), SPEI-3 (f), SPI-12 (g), and SPEI-12 (h). Red and blue arrows indicate a worsening and bettering of drought conditions (i.e. higher or lower severity and longer or shorter duration).
4.3 Region-wide drought event analysis
This section shows the results obtained from the analysis of region-wide drought events (see Sect. 4.3). Similarly to the previous sections, both the characteristics of drought events and their change over time are discussed.
4.3.1 Region-wide drought event characteristics
Region-wide drought events are calculated from the SPI and SPEI series at 3- and 12-month scales. As the most interesting example, Fig. 6 shows the result for the SPEI-12. The analysis displays similar results between the two indices at the same timescale, with all main events being identified by both the SPI and SPEI and with high agreement between the extent of the area in drought conditions over time. The analysis at the 3-month scale reports about 60 events (see Fig. A2), while the analysis at the 12-month scale reports less than 20 events (for the SPEI-12, see Fig. 6; for the SPI-12, see Fig. A2). Region-wide drought events at the longer timescale are more severe and longer than those at the shorter timescale, as expected, but intensity and area values are similar. Regarding relative differences between the drought characteristics of the SPI and SPEI at both timescales, is similar between the two indices, is higher for the SPEI, and both and are higher for the SPI. On the other hand, when considering the mean highest area affected by drought conditions in every single event, both indices report similar results at both timescales. Overall, this indicates that the same deficit tends to affect a slightly wider area with a higher intensity but for less time when only precipitation is considered, while it tends to affect the same overall area with less intensity and for a longer time when both precipitation and temperature are considered.
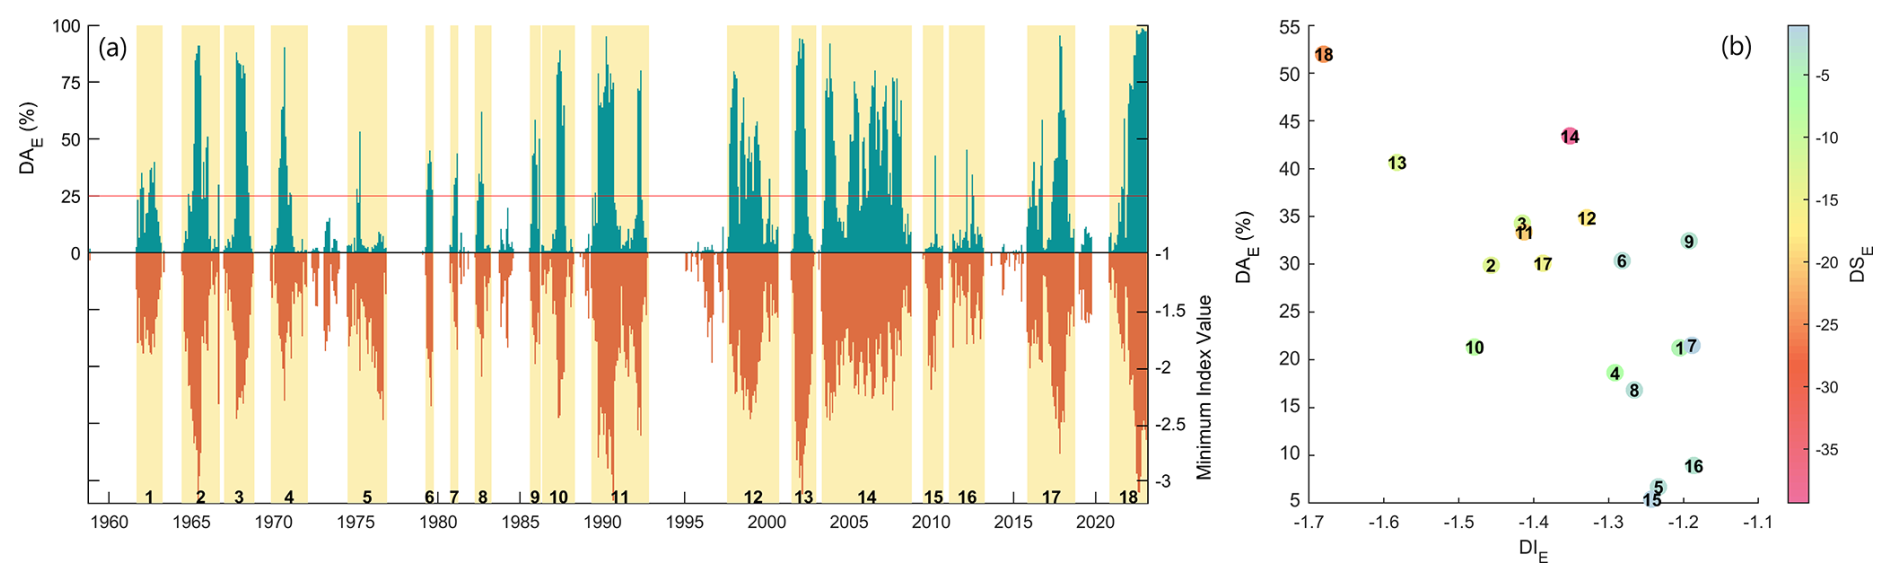
Figure 6Region-wide drought event analysis conducted on the SPEI-12. (a) Time series of percentage of cells experiencing drought conditions (only the portion below the −1 threshold, upper part of the diagram) and minimum index value in the domain (lower part of the diagram). Each event is highlighted in yellow and labelled. (b) Drought event characteristics: drought intensity (DIE), mean drought area (DAE), and drought severity (DSE).
Region-wide drought event analysis on the SPI-12 and SPEI-12 was also useful in indicating the main drought events that happened in the region in the last 60 years. Of these, the last one, starting in the winter of 2021 and still ongoing at the end of the available data time series, was identified as perhaps the most extreme in the series. In particular, the wide area affected by drought during this event and its severity, second only to the longest 2001–2008 event, mark it as an exceptional drought for the region. The intensity value is also the highest of all detected events, but this may not be significant given that this last event had not yet ended at the time the analysis was done. Certainly, the fact that its severity is higher than the severity of the 2001–2002 event as detected by the SPEI-12 also adds to how exceptional this last event is.
4.3.2 Temporal analysis of region-wide drought event characteristics
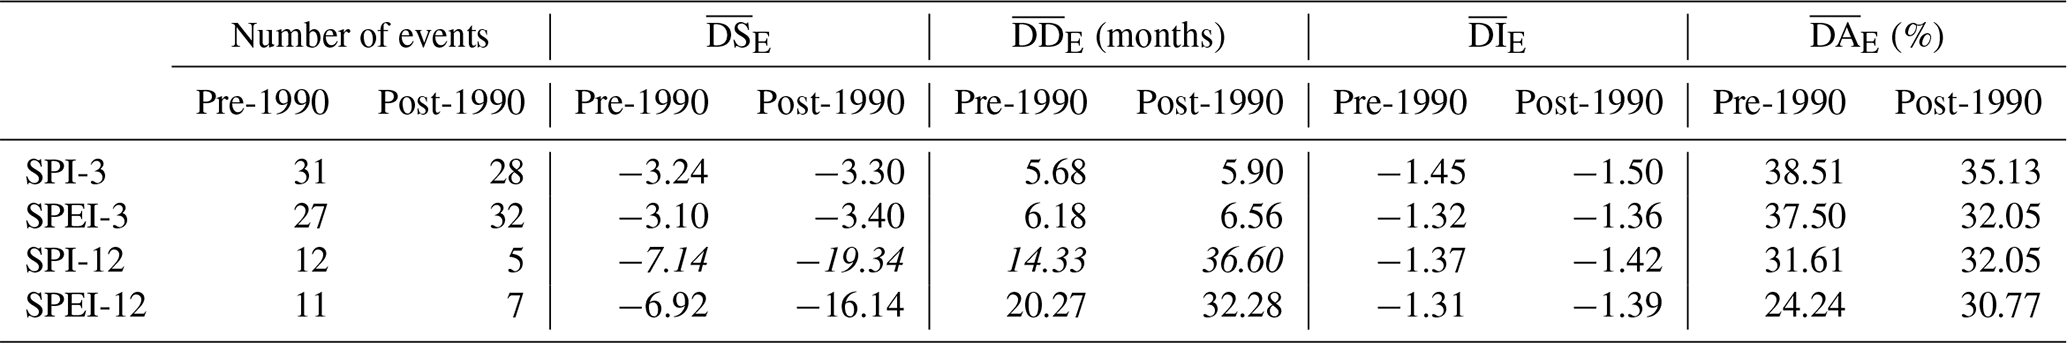
Trend analysis reports no significant results for the drought characteristics of region-wide drought events. Comparing the values before and after 1990 does show results that are consistent with those found for local droughts (Table 3): drought events have become more severe, longer, and more intense at both timescales. Also, similarly to drought runs, the number of drought events has increased at the shorter 3-month timescale while having decreased at the longer 12-month scale. Another difference is in the , which has decreased at the 3-month timescale and has increased at the 12-month timescale. Overall, this seems to indicate that, on a region-wide level, drought conditions worsened between the periods 1960–1990 and 1990–2020, with short-term deficits becoming more common over slightly smaller areas, leading to more generalized deficits over wider areas at the longer timescales. Despite many of the described changes not being significant according to the two-sample t test, and for the SPI-12 do show a statistically significant shift in the mean before and after 1990. Changes in and for the SPEI-12 also show p values close to the 5 % level, although these do not fall below the 5 % threshold. This seems to confirm that the shift towards worse region-wide drought conditions (higher severity and longer duration) is more evident at longer timescales and that this shift is mainly caused by a change in precipitation patterns. Despite the apparent importance of precipitation, the only significant trend in terms of the percentage of the domain experiencing drought conditions (index lower than −1) over time is found for the SPEI-12, with a slope coefficient of yr−1.
Table 3Drought event characteristics before and after 1990. Values in italic font denote significant differences between the two distributions at 5 % significance.
In this study, 60 years of precipitation and temperature data are analysed in order to characterize changes in drought conditions in the Piedmont and Aosta Valley areas. In Sect. 1, three questions were posed. The first question asked whether there are temporal trends in drought indices such as the SPI and SPEI and how these trends translate into changes in the characteristics of drought events (in terms of duration, severity, and intensity). Evidence of widespread drying trends in the region is found through the trend analysis of the SPI and SPEI series. Temperature plays a key role in defining these drying trends as the SPEI reports negative trends for wider areas and with greater slope coefficients than the SPI. This is to be expected given the clear trends in temperature due to climate change and is consistent with other studies conducted in the area (see, for example, Falzoi et al., 2019; Baronetti et al., 2020). Still, the areas showing the more severe drying trends do not coincide with the areas showing the highest warming rates, indicating that changes in droughts are governed by the interplay between temperature and precipitation. When moving from drought indices to drought event identification, it is interesting to note that the start and end of single drought periods seem to be mainly determined by precipitation anomalies, which is in contrast to the importance of temperature in determining long-term conditions. Despite the worsening of drought conditions related to precipitation and temperature being clear, the effects on the characteristics of individual drought events are weaker. Some evidence of an increase in the severity, duration, and intensity of drought periods after 1990 is found, although this is often not statistically significant. A tendency for drought periods at the 3-month timescale to become more numerous and for drought periods at the 12-month timescale to become less numerous is observed at both a local and regional scale. Thus, while the percentage of time under drought conditions has become greater at both timescales, it seems that a larger amount of short-term deficits aggregate into long-term deficits with higher duration. In addition to this, a significant positive trend in the percentage of the area under drought conditions according to the SPEI-12 is detected. Overall, however, changes in local-drought characteristics between the two halves of the analysed series are seldom significant, making it difficult to assess whether the increase in severity, duration, and intensity of drought periods is actually part of a general tendency, which would be coherent with the detected worsening drought conditions.
The higher resolution of the analysed data, compared to previous studies, makes it possible to show quite heterogeneous results with regard to the presence of drying and/or wetting trends, as well as drought characteristics, in different portions of the region. As a possible explanation of this result, our analysis studies relations between terrain characteristics and drought characteristics, finding several significant correlations. This type of analysis is in common with a growing body of literature focused on the elevation effects on drought characteristics, with studies conducted in the Qinghai–Tibet plateau (Feng et al., 2020), the Lorestan Province in Iran (Hosseini et al., 2020), the Indus River basin (Dubey et al., 2023), and the Canary Islands (Carrillo et al., 2023). These studies, using mean elevation as a topographic variable, find different results with regards to the distribution of drought trends at high and low elevations, and, as such, no general claim about the tendency of different elevation areas to show drying and/or wetting trends can be made. The second question in the introductory section asked whether there is a relationship between drought trends and the topographical characteristics of the landscape and, if so, whether elevation is the topographical variable most correlated to these trends. Terrain characteristics and mean elevation show a significant influence on the observed trends and changes in drought characteristics, with drying trends being more severe the as the area becomes lower and less rugged. In fact, when the mountainous parts and the flat part of the domain are considered separately, the first shows no significant drought trends, while the second reports significant drying trends for both the SPI and SPEI at multiple timescales. This is particularly true for the flat areas of the region, where trends are stronger than in low-elevation rugged (hilly) areas. In the case of drought period characteristics, decreases in severity, duration, and intensity are mostly found in the Alpine range, while increases are mostly found in the smoother and lower-lying areas. Overall, drought characteristics and changes in time seem to be better correlated to the terrain ruggedness than to elevation alone. Thus, our finding of more severe drying trends and worsening drought characteristics in the lower-altitude part of the region proves the importance of considering topographic effects in areas with highly diverse terrain. More importantly, our study shows that mean elevation, although certainly a variable to be considered, should not be the only topographic variable taken into account.
The third question in the introductory section asked whether the outcomes depend on the chosen spatial scale of the analysis. Interestingly, the local-drought analysis and the region-wide analysis result in some differences. Changes in the characteristics of local-drought periods are affected by temperature increases as drought periods obtained from the SPEI series show more pronounced increases in severity, duration, and intensity than those obtained from the SPI series. Contrarily to this, drought events at a region-wide scale show more marked shifts in severity and duration for the SPI than for the SPEI, denoting a more significant influence of regional precipitation patterns than of temperature on droughts at a regional scale. It would be of interest to understand if this is valid for the region of interest, northwestern Italy, or if a similar result could be valid in other areas of the world and, more generally, what the causes could be from a meteorological and climatic point of view.
The same consideration can be made for the other results of our analyses. Although strong correlations between drought trends and the mean elevation and ruggedness of the terrain are found, the attribution of these results to physical phenomena is not straightforward. The presented methodology does not focus on this aspect, and, given the complexity of the involved phenomena, attribution is outside the scope of our study. However, our finding of different meteorological conditions between the Alpine chain and the surrounding Po Plain is consistent with other studies concerning the presence of an increase in alpine summer convective precipitation not in common with the surrounding areas (Giorgi et al., 2016; Grose et al., 2019).
In this study, we restrict our focus to near-past and current conditions and do not consider predictions of future conditions (although strong drying trends in some portions of the study area are detected). Further research is needed to study how the local and regional drought characteristics of areas at different elevations and with different reliefs may evolve under climate change. Still, the results presented in this paper can be useful not only for the Piedmont and Aosta Valley regions, where they could be the input for analyses of soil moisture and hydrological droughts, but also for other areas and for drought research in general, showing the need to conduct drought studies at different spatiotemporal scales and underscoring the importance of considering areas with distinct topographical features, as well as giving an indication of which areas are more likely to face dryer conditions.
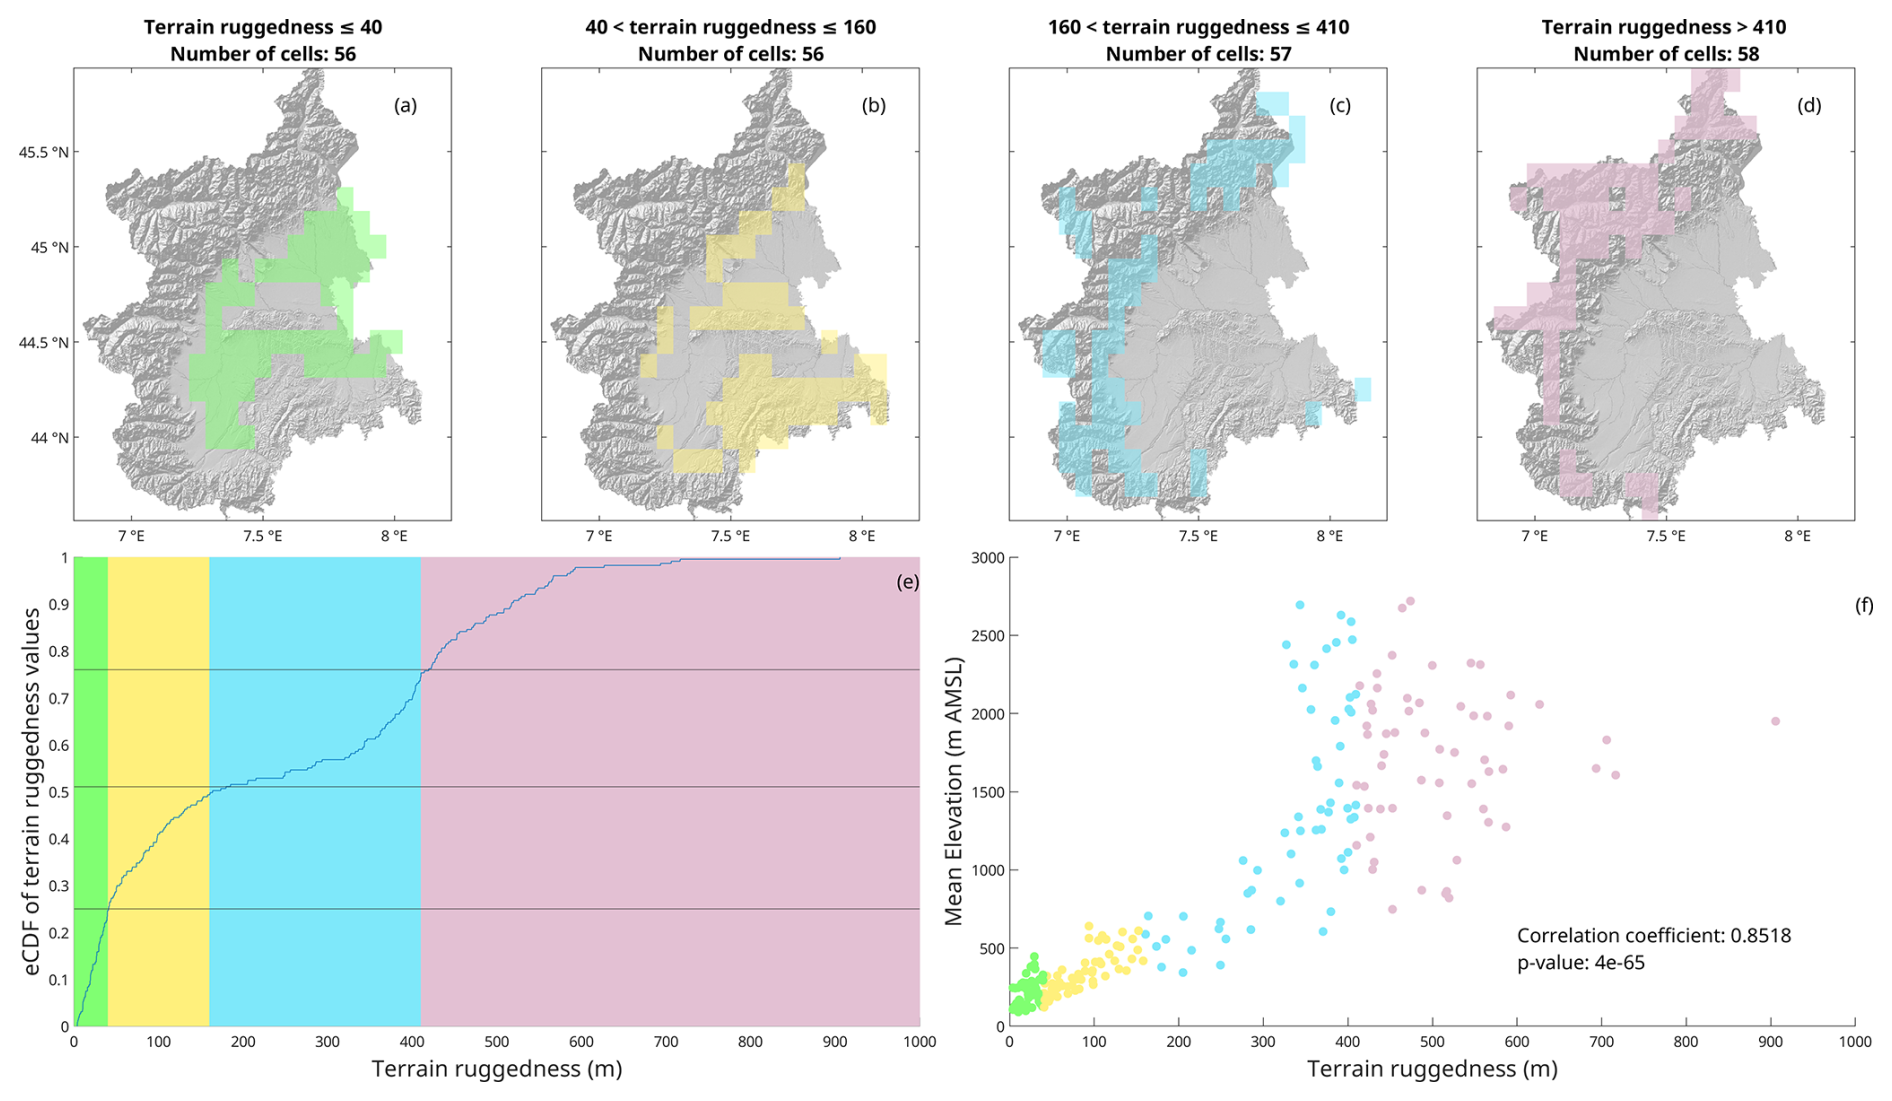
Figure A1 Areas classified using mean cell elevation and terrain ruggedness, calculated as the standard deviation of elevation values inside each cell. (a–d) Areas belonging to classes defined based on terrain ruggedness, corresponding to the areas cited in Fig. 3a–d. (e) Empirical cumulative distribution function (eCDF) of the terrain ruggedness values. (f) Scatterplot between terrain ruggedness and mean elevation for each cell and relative Pearson correlation coefficient.
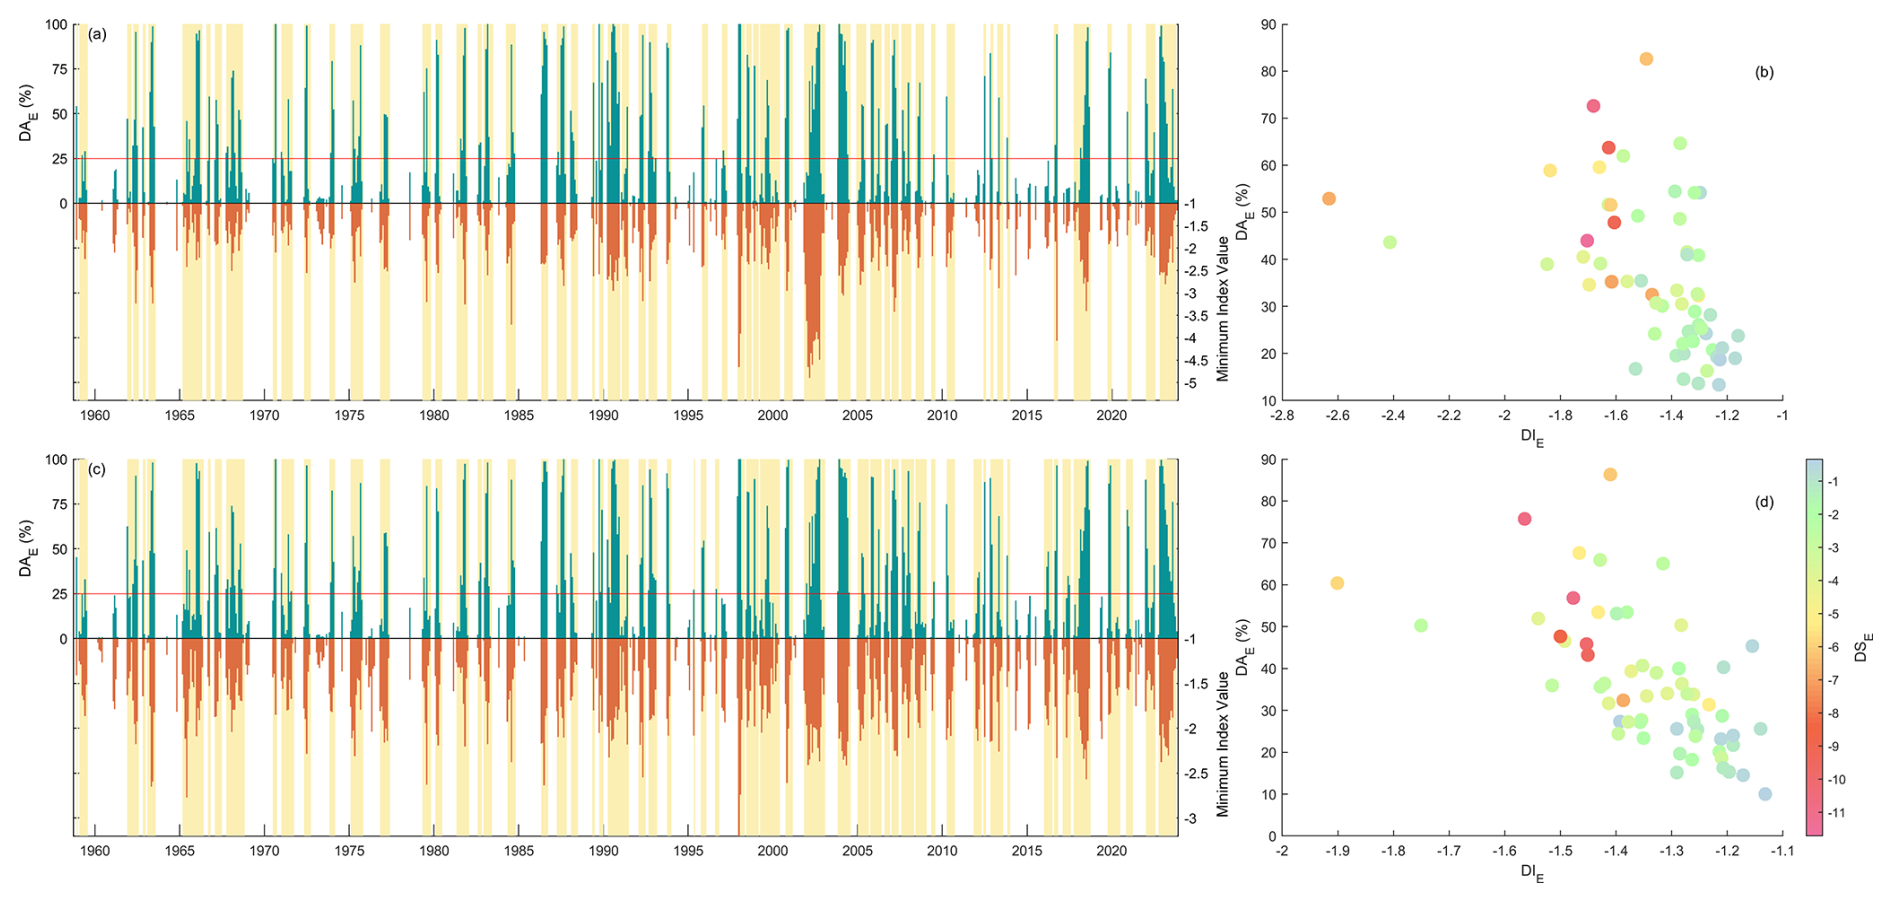
Figure A2Region-wide drought event analysis conducted on the indices at 3-month scale. (a) Series of percentage of cells experiencing drought conditions (below the −1 threshold) and the minimum index value in the domain for the SPI-3. (b) Drought event characteristics for the SPI-3. (c) Series of percentage of cells experiencing drought conditions (below the −1 threshold) and the minimum index value in the domain for the SPEI-3. (d) Drought event characteristics for the SPEI-3.
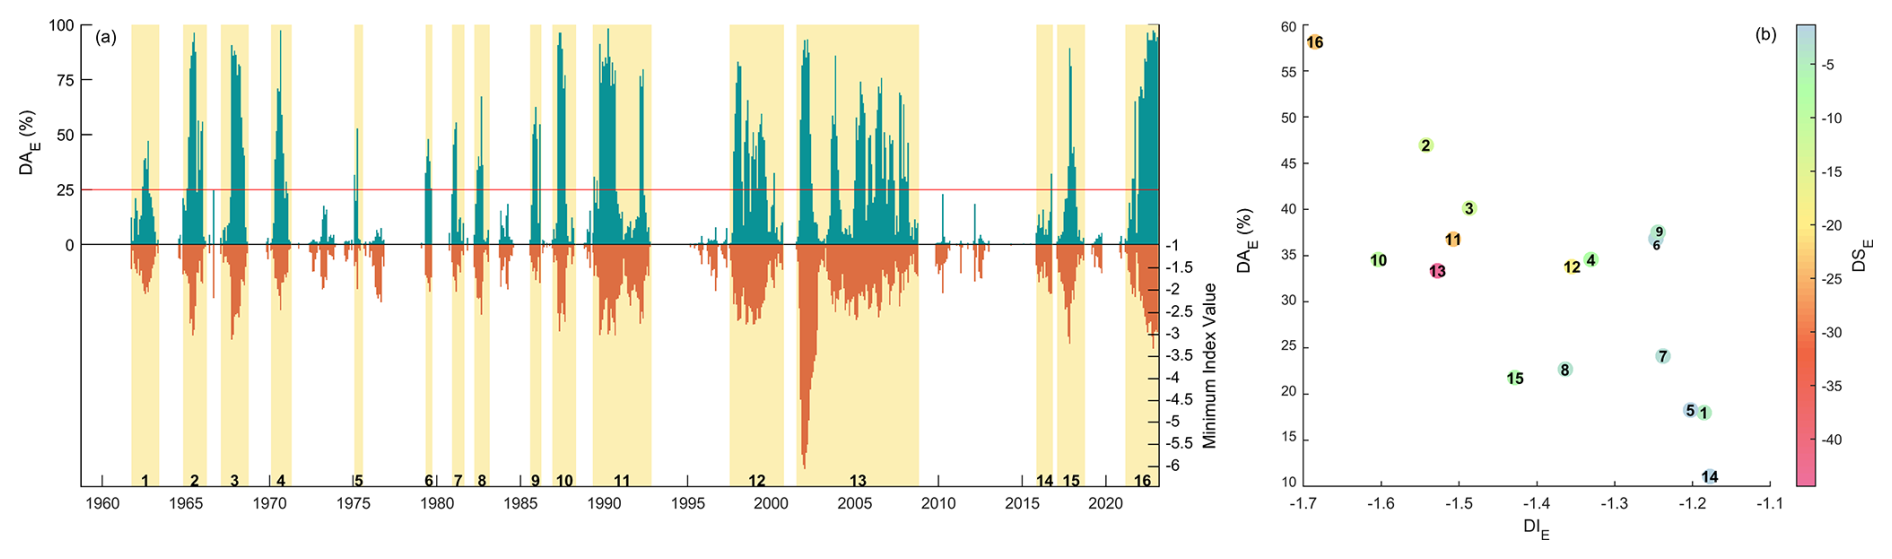
Figure A3Region-wide drought event analysis conducted on the SPI-12. (a) Series of percentage of cells experiencing drought conditions (below the −1 threshold) and the minimum index value in the domain. Each event is highlighted in yellow and labelled. (b) Drought event characteristics.
The data that support the findings of this study are openly available in the NWIOI dataset at https://www.arpa.piemonte.it/scheda-informativa/dataset-griglia-nwioi (Arpa Piemonte, Dipartimento Sistemi Provisionali, 2011), maintained and updated by the Forecast Systems Department of the Regional Environmental Protection Agency of Piedmont (Dipartimento Sistemi Previsionali – Arpa Piemonte).
EM, ST, AV, and RR contributed to the design of the research, to the analysis of the results, and to the writing of the paper. EM carried out the analysis.
The contact author has declared that none of the authors has any competing interests.
Publisher's note: Copernicus Publications remains neutral with regard to jurisdictional claims made in the text, published maps, institutional affiliations, or any other geographical representation in this paper. While Copernicus Publications makes every effort to include appropriate place names, the final responsibility lies with the authors.
We would like to thank Micha Werner and the two anonymous reviewers for their constructive comments and valuable suggestions, which have significantly improved the quality of the paper. Thank you, Roberto, for inspiring our research well beyond your contribution to this work.
This study was carried out within the RETURN Extended Partnership and received funding from the European Union NextGenerationEU (National Recovery and Resilience Plan – NRRP, Mission 4, Component 2, Investment 1.3 – D.D. 1243 2 August 2022, grant no. PE0000005).
This paper was edited by Micha Werner and reviewed by Micha Werner and two anonymous referees.
Angelidis, P., Maris, F., Kotsovinos, N., and Hrissanthou, V.: Computation of drought index SPI with alternative distribution functions, Water Resour. Manag., 26, 2453–2473, https://doi.org/10.1007/s11269-012-0026-0, 2012. a, b
Arpa Piemonte: Il Piemonte nel Cambiamento Climatico, https://www.yumpu.com/it/document/read/15520449/pdf-il-piemonte-nel-cambiamento-climatico-alpine-spaceorg (last access: 13 May 2025), 2007. a
Arpa Piemonte, Dipartimento Rischi Naturali e Ambientali e Dipartimento Sistemi Previsionali and Regione Piemonte, Direzione Ambiente, Energia e Territorio e Settore Progettazione Strategica e Green Economy: Analisi degli scenari di clima regionale del periodo 2011–2100, https://www.regione.piemonte.it/web/sites/default/files/media/documenti/2021-02/analisi_scenari_clima_regionale_periodo_2011-_2100.pdf (last access: 13 May 2025), 2020. a
Arpa Piemonte, Dipartimento Sistemi Provisionali: NWIOI [data set], https://www.arpa.piemonte.it/scheda-informativa/dataset-griglia-nwioi (last acces: 12 February 2024), 2011. a, b
Ault, T. R.: On the essentials of drought in a changing climate, Science, 368, 256–260, https://doi.org/10.1126/science.aaz5492, 2020. a
Ayugi, B., Eresanya, E. O., Onyango, A. O., Ogou, F. K., Okoro, E. C., Okoye, C. O., Anoruo, C. M., Dike, V. N., Ashiru, O. R., Daramola, M. T., Mumo, R., and Ongoma, V.: Review of meteorological drought in Africa: historical trends, impacts, mitigation measures, and prospects, Pure Appl. Geophys., 179, 1365–1386, https://doi.org/10.1007/s00024-022-02988-z, 2022. a
Baronetti, A., González Hidalgo, J. C., Vicente Serrano, S. M., Acquaotta, F., and Fratianni, S.: A weekly spatio temporal distribution of drought events over the Po Plain (North Italy) in the last five decades, Int. J. Climatol., 40, 4463–4476, https://doi.org/10.1002/joc.6467, 2020. a, b
Beguería, S., Vicente-Serrano, S. M., Reig, F., and Latorre, B.: Standardized precipitation evapotranspiration index (SPEI) revisited: parameter fitting, evapotranspiration models, tools, datasets and drought monitoring, Int. J. Climatol., 34, 3001–3023, https://doi.org/10.1002/joc.3887, 2014. a, b, c
Bordi, I. and Sutera, A.: An analysis of drought in Italy in the last fifty years, Il Nuovo Cimento C, 25, 185–206, 2002. a, b
Brunetti, M., Maugeri, M., Nanni, T., and Navarra, A.: Droughts and extreme events in regional daily Italian precipitation series, Int. J. Climatol., 22, 543–558, https://doi.org/10.1002/joc.751, 2002. a, b
Burek, P., Satoh, Y., Fischer, G. W., Kahil, M. T., Scherzer, A., Tramberend, S., Nava, L. F., Wada, Y., Eisner, S., Flörke, M., Hanasaki, N., Magnuszewski, P., Cosgrove, B., and Wiberg, D.: Water Futures and Solution – Fast Track Initiative, IIASA Working Paper, IIASA, Laxenburg, Austria: WP-16-006, http://pure.iiasa.ac.at/id/eprint/13008/ (last access: 13 May 2025), 2016. a
Caloiero, T., Caroletti, G. N., and Coscarelli, R.: IMERG-based meteorological drought analysis over Italy, Climate, 9, 65, https://doi.org/10.3390/cli9040065, 2021. a
Carrillo, J., Hernández-Barrera, S., Expósito, F. J., Díaz, J. P., González, A., and Pérez, J. C.: The uneven impact of climate change on drought with elevation in the Canary Islands, npj Climate and Atmospheric Science, 6, 31, https://doi.org/10.1038/s41612-023-00358-7, 2023. a
Choi, S. C. and Wette, R.: Maximum likelihood estimation of the parameters of the gamma distribution and their bias, Technometrics, 11, 683–690, https://doi.org/10.1080/00401706.1969.10490731, 1969. a
Ciccarelli, N., Von Hardenberg, J., Provenzale, A., Ronchi, C., Vargiu, A., and Pelosini, R.: Climate variability in north-western Italy during the second half of the 20th century, Global Planet. Change, 63, 185–195, https://doi.org/10.1016/j.gloplacha.2008.03.006, 2008. a
Cohen, J.: A coefficient of agreement for nominal scales, Educ. Psychol. Meas., 20, 37–46, https://doi.org/10.1177/001316446002000104, 1960. a, b
Collaud Coen, M., Andrews, E., Bigi, A., Martucci, G., Romanens, G., Vogt, F. P. A., and Vuilleumier, L.: Effects of the prewhitening method, the time granularity, and the time segmentation on the Mann–Kendall trend detection and the associated Sen's slope, Atmos. Meas. Tech., 13, 6945–6964, https://doi.org/10.5194/amt-13-6945-2020, 2020. a
Crausbay, S. D., Betancourt, J., Bradford, J., Cartwright, J., Dennison, W. C., Dunham, J., Enquist, C. A., Frazier, A. G., Hall, K. R., Littell, J. S., Luce, C. H., Palmer, R., Ramirez, A. R., Rangwala, I., Thompson, L., Walsh, B. M., and Carter, S.: Unfamiliar territory: emerging themes for ecological drought research and management, One Earth, 3, 337–353, https://doi.org/10.1016/j.oneear.2020.08.019, 2020. a
Dai, A.: Drought under global warming: a review, WIREs Clim. Change, 2, 45–65, https://doi.org/10.1002/wcc.81, 2011. a
Dai, A.: Increasing drought under global warming in observations and models, Nat. Clim. Change, 3, 52–58, https://doi.org/10.1038/nclimate1633, 2013. a
Dubey, A., Swami, D., Gupta, V., and Joshi, N.: From the peaks to the plains: investigating the role of elevation in governing drought dynamics over the Indus river basin, Atmos. Res., 291, 106824, https://doi.org/10.1016/j.atmosres.2023.106824, 2023. a
Falzoi, S., Acquaotta, F., Pulina, M. A., and Fratianni, S.: Hydrological drought analysis in Continental Temperate and Mediterranean environment during the period 1981–2017, Ital. J. Agrometeorol., 3, 13–23, https://doi.org/10.13128/IJAM-798, 2019. a, b
Feng, W., Lu, H., Yao, T., and Yu, Q.: Drought characteristics and its elevation dependence in the Qinghai–Tibet plateau during the last half-century, Sci. Rep.-UK, 10, 14323, https://doi.org/10.1038/s41598-020-71295-1, 2020. a
García-León, D., Standardi, G., and Staccione, A.: An integrated approach for the estimation of agricultural drought costs, Land Use Policy, 100, 104923, https://doi.org/10.1016/j.landusepol.2020.104923, 2021. a
Giorgi, F., Torma, C., Coppola, E., Ban, N., Schär, C., and Somot, S.: Enhanced summer convective rainfall at Alpine high elevations in response to climate warming, Nat. Geosci., 9, 584–589, https://doi.org/10.1038/ngeo2761, 2016. a, b
González-Hidalgo, J. C., Vicente-Serrano, S. M., Peña-Angulo, D., Salinas, C., Tomas-Burguera, M., and Beguería, S.: High-resolution spatio-temporal analyses of drought episodes in the western Mediterranean basin (Spanish mainland, Iberian Peninsula), Acta Geophys., 66, 381–392, https://doi.org/10.1007/s11600-018-0138-x, 2018. a, b
Greene, C. A., Thirumalai, K., Kearney, K. A., Delgado, J. M., Schwanghart, W., Wolfenbarger, N. S., Thyng, K. M., Gwyther, D. E., Gardner, A. S., and Blankenship, D. D.: The climate data toolbox for MATLAB, Geochem. Geophy. Geosy., 20, 3774–3781, https://doi.org/10.1029/2019GC008392, 2019. a
Grose, M. R., Syktus, J., Thatcher, M., Evans, J. P., Ji, F., Rafter, T., and Remenyi, T.: The role of topography on projected rainfall change in mid-latitude mountain regions, Clim. Dynam., 53, 3675–3690, https://doi.org/10.1007/s00382-019-04736-x, 2019. a
Habib, M.: Evaluation of DEM interpolation techniques for characterizing terrain roughness, Catena, 198, 105072, https://doi.org/10.1016/j.catena.2020.105072, 2021. a
Hanel, M., Rakovec, O., Markonis, Y., Máca, P., Samaniego, L., Kyselý, J., and Kumar, R.: Revisiting the recent European droughts from a long-term perspective, Sci. Rep.-UK, 8, 9499, https://doi.org/10.1038/s41598-018-27464-4, 2018. a, b, c
Hargreaves, G. H. and Samani, Z. A.: Reference crop evapotranspiration from temperature, Appl. Eng. Agric., 1, 96–99, https://doi.org/10.13031/2013.26773, 1985. a
Haslinger, K. and Blöschl, G.: Space-time patterns of meteorological drought events in the European Greater Alpine Region over the past 210 years: space-time patterns of drought events, Water Resour. Res., 53, 9807–9823, https://doi.org/10.1002/2017WR020797, 2017. a, b
Haslinger, K., Chimani, B., and Böhm, R.: 200 years of liquid and solid precipitation in major river systems originating in the Greater Alpine Region, EGU General Assembly Conference Abstracts. 2012, p. 1798, https://www.researchgate.net/profile/Klaus-Haslinger/publication/258615196_200_years_of_liquid_and_ solid_precipitation_in_major_river_systems_originating_in_the _Greater_Alpine_Region/links/58e1e1da92851c36954b299c/200-years-of-liquid-and-solid-precipitation-in-major-river-systems-originating-in-the-Greater-Alpine-Region.pdf, (last access: 13 May 2025), 2012. a, b
Hayes, M., Svoboda, M., Wilhite, D., and Vanyarkho, O.: Monitoring the 1996 drought using the standardized precipitation index, B. Am. Meteorol. Soc., 80, 429–438, https://doi.org/10.1175/1520-0477(1999)080<0429:MTDUTS>2.0.CO;2, 1999. a
Hoerling, M., Eischeid, J., Perlwitz, J., Quan, X., Zhang, T., and Pegion, P.: On the increased frequency of Mediterranean drought, J. Climate, 25, 2146–2161, https://doi.org/10.1175/JCLI-D-11-00296.1, 2012. a, b
Hosking, J. R.: The theory of probability weighted moments, IBM Research Division, TJ Watson Research Center New York, USA, 160 pp., https://www.researchgate.net/publication/391011383_Technical _note_What_does_the_Standardized_Streamflow_Index_ actually_reflect_Insights_and_implications_for_ hydrological_drought_analysis (last access: 13 May 2025), 1986. a
Hosseini, T. S. M., Hosseini, S. A., Ghermezcheshmeh, B., and Sharafati, A.: Drought hazard depending on elevation and precipitation in Lorestan, Iran, Theor. Appl. Climatol., 142, 1369–1377, https://doi.org/10.1007/s00704-020-03386-y, 2020. a
IDMP: Drought and Water Scarcity, no. 1284 in WMO, Global Water Partnership, Stockholm, Sweden, https://library.wmo.int/idurl/4/54351 (last access: 13 May 2025), 2022. a
Karagulle, D., Frye, C., Sayre, R., Breyer, S., Aniello, P., Vaughan, R., and Wright, D.: Modeling global Hammond landform regions from 250-m elevation data, T. GIS, 21, 1040–1060, https://doi.org/10.1111/tgis.12265, 2017. a
Kulkarni, A. and Storch, H. V.: Monte Carlo experiments on the effect of serial correlation on the Mann-Kendall test of trend, Meteorol. Z., 4, 82–85, https://doi.org/10.1127/metz/4/1992/82, 1995. a
Laimighofer, J. and Laaha, G.: How standard are standardized drought indices? Uncertainty components for the SPI & SPEI case, J. Hydrol., 613, 128385, https://doi.org/10.1016/j.jhydrol.2022.128385, 2022. a
Mann, H. B.: Nonparametric tests against trend, Econometrica, 13, 245, https://doi.org/10.2307/1907187, 1945. a
McKee, T. B., Doesken, N. J., and Kleist, J. R.: The Relationship of Drought Frequency and Duration to Time Scales, in: Proceedings of the 8th Conference on Applied Climatology, 1993. American Meteorological Society Boston, MA, 179–183, https://climate.colostate.edu/pdfs/relationshipofdroughtfrequency.pdf (last access: 13 May 2025), 1993. a
Mountain Research Initiative EDW Working Group: Elevation-dependent warming in mountain regions of the world, Nat. Clim. Change, 5, 424–430, https://doi.org/10.1038/nclimate2563, 2015. a
Palazzi, E., Mortarini, L., Terzago, S., and Von Hardenberg, J.: Elevation-dependent warming in global climate model simulations at high spatial resolution, Clim. Dynam., 52, 2685–2702, https://doi.org/10.1007/s00382-018-4287-z, 2019. a
Pavan, V., Antolini, G., Barbiero, R., Berni, N., Brunier, F., Cacciamani, C., Cagnati, A., Cazzuli, O., Cicogna, A., De Luigi, C., Di Carlo, E., Francioni, M., Maraldo, L., Marigo, G., Micheletti, S., Onorato, L., Panettieri, E., Pellegrini, U., Pelosini, R., Piccinini, D., Ratto, S., Ronchi, C., Rusca, L., Sofia, S., Stelluti, M., Tomozeiu, R., and Torrigiani Malaspina, T.: High resolution climate precipitation analysis for north-central Italy, 1961–2015, Clim. Dynam., 52, 3435–3453, https://doi.org/10.1007/s00382-018-4337-6, 2019. a, b
Pepin, N. C., Arnone, E., Gobiet, A., Haslinger, K., Kotlarski, S., Notarnicola, C., Palazzi, E., Seibert, P., Serafin, S., Schöner, W., Terzago, S., Thornton, J. M., Vuille, M., and Adler, C.: Climate changes and their elevational patterns in the mountains of the world, Rev. Geophys., 60, e2020RG000730, https://doi.org/10.1029/2020RG000730, 2022. a, b
Perosino, G. C. and Zaccara, P.: Elementi climatici del Piemonte, http://www.crestsnc.it/divulgazione/media/clima-piemonte.pdf (last access: 24 April 2025), 2006. a
Pörtner, H.-O., Roberts, D., Tignor, M., Poloczanska, E., Mintenbeck, K., Alegría, A., Craig, M., Langsdorf, S., Löschke, S., Möller, V., Okem, A., Rama, B., Belling, D., Dieck, W., Götze, S., Kersher, T., Mangele, P., Maus, B., Mühle, A., and Weyer, N.: Climate Change 2022: Impacts, Adaptation and Vulnerability Working Group II Contribution to the Sixth Assessment Report of the Intergovernmental Panel on Climate Change, Cambridge University Press, Cambridge University Press, Cambridge, UK and New York, NY, USA, 3056 pp., https://doi.org/10.1017/9781009325844, 2022. a
Rangwala, I. and Miller, J. R.: Climate change in mountains: a review of elevation-dependent warming and its possible causes, Climatic Change, 114, 527–547, https://doi.org/10.1007/s10584-012-0419-3, 2012. a
Rasch, D., Kubinger, K. D., and Moder, K.: The two-sample t test: pre-testing its assumptions does not pay off, Stat. Pap., 52, 219–231, https://doi.org/10.1007/s00362-009-0224-x, 2011. a
Robinson, N., Regetz, J., and Guralnick, R. P.: EarthEnv-DEM90: A nearly-global, void-free, multi-scale smoothed, 90m digital elevation model from fused ASTER and SRTM data, ISPRS J. Photogramm., 87, 57–67, https://doi.org/10.1016/j.isprsjprs.2013.11.002, 2014. a
Sayre, R., Frye, C., Karagulle, D., Krauer, J., Breyer, S., Aniello, P., Wright, D. J., Payne, D., Adler, C., Warner, H., VanSistine, D. P., and Cress, J.: A New high-resolution map of world mountains and an online tool for visualizing and comparing characterizations of global mountain distributions, Mt. Res. Dev., 38, 240–249, https://doi.org/10.1659/MRD-JOURNAL-D-17-00107.1, 2018. a
Sen, P. K.: Estimates of the regression coefficient based on Kendall's Tau, J. Am. Stat. Assoc., 63, 1379–1389, https://doi.org/10.1080/01621459.1968.10480934, 1968. a
Shevlyakov, G. L. and Oja, H.: Robust correlation: theory and applications, Wiley series in probability and statistics, Wiley, Chichester, West Sussex, UK, https://doi.org/10.1002/9781119264507, 2016. a, b
Theil, H.: A rank-invariant method of linear and polynomial regression analysis, 3; confidence regions for the parameters of polynomial regression equations, KNAW, Proceedings of the Royal Netherlands Academy of Sciences, 53, 386–392, https://doi.org/10.1007/978-94-011-2546-8_20, 1950. a
Tigkas, D., Vangelis, H., and Tsakiris, G.: DrinC: a software for drought analysis based on drought indices, Earth Sci. Inform., 8, 697–709, https://doi.org/10.1007/s12145-014-0178-y, 2015. a
Trenberth, K. E., Dai, A., Van Der Schrier, G., Jones, P. D., Barichivich, J., Briffa, K. R., and Sheffield, J.: Global warming and changes in drought, Nat. Clim. Change, 4, 17–22, https://doi.org/10.1038/nclimate2067, 2014. a
Turco, M., Zollo, A. L., Ronchi, C., De Luigi, C., and Mercogliano, P.: Assessing gridded observations for daily precipitation extremes in the Alps with a focus on northwest Italy, Nat. Hazards Earth Syst. Sci., 13, 1457–1468, https://doi.org/10.5194/nhess-13-1457-2013, 2013. a
Uboldi, F., Lussana, C., and Salvati, M.: Three-dimensional spatial interpolation of surface meteorological observations from high-resolution local networks, Meteorol. Appl., 15, 331–345, https://doi.org/10.1002/met.76, 2008. a
UNESCO (Ed.): Nature-based solutions for water, no. 2018 in The United Nations world water development report, UNESCO, Paris, ISBN 978-92-3-100264-9, 2018. a
Vicente-Serrano, S. M., Beguería, S., and López-Moreno, J. I.: A multiscalar drought index sensitive to global warming: the standardized precipitation evapotranspiration index, J. Climate, 23, 1696–1718, https://doi.org/10.1175/2009JCLI2909.1, 2010. a
Vicente-Serrano, S. M., Peña-Angulo, D., Beguería, S., Domínguez-Castro, F., Tomás-Burguera, M., Noguera, I., Gimeno-Sotelo, L., and El Kenawy, A.: Global drought trends and future projections, Philos. T. Roy. Soc. A, 380, 20210285, https://doi.org/10.1098/rsta.2021.0285, 2022. a
Vogel, J., Paton, E., Aich, V., and Bronstert, A.: Increasing compound warm spells and droughts in the Mediterranean Basin, Weather and Climate Extremes, 32, 100312, https://doi.org/10.1016/j.wace.2021.100312, 2021. a
Wada, Y., Flörke, M., Hanasaki, N., Eisner, S., Fischer, G., Tramberend, S., Satoh, Y., van Vliet, M. T. H., Yillia, P., Ringler, C., Burek, P., and Wiberg, D.: Modeling global water use for the 21st century: the Water Futures and Solutions (WFaS) initiative and its approaches, Geosci. Model Dev., 9, 175–222, https://doi.org/10.5194/gmd-9-175-2016, 2016. a
Wallemacq, P., Guha-Sapir, D., McClean, D., CRED, and UNISDR: The Human Cost of Natural Disasters – A global Perspective, https://www.preventionweb.net/publication/human-cost-natural-disasters-global-perspective#downloads (last access: 13 May 2025), 2015. a
Wang, W., Chen, Y., Becker, S., and Liu, B.: Variance correction prewhitening method for trend detection in autocorrelated data, J. Hydrol., 20, 04015033, https://doi.org/10.1061/(ASCE)HE.1943-5584.0001234, 2015. a
Ward, P. J., Blauhut, V., Bloemendaal, N., Daniell, J. E., de Ruiter, M. C., Duncan, M. J., Emberson, R., Jenkins, S. F., Kirschbaum, D., Kunz, M., Mohr, S., Muis, S., Riddell, G. A., Schäfer, A., Stanley, T., Veldkamp, T. I. E., and Winsemius, H. C.: Review article: Natural hazard risk assessments at the global scale, Nat. Hazards Earth Syst. Sci., 20, 1069–1096, https://doi.org/10.5194/nhess-20-1069-2020, 2020. a
Welch, B. L.: The generalization of `Student's' problem when several different population variances are involved, Biometrika, 34, 28, https://doi.org/10.2307/2332510, 1947. a
Whitehouse, D. J.: Handbook of surface metrology, Institute of Physics Publishing, Bristol, https://doi.org/10.1201/9780203752609 1994. a
World Meteorological Organization: Standardized Precipitation Index User Guide, no. 1090 in WMO, Geneva, Switzerland, ISBN 978-92-63-11091-6, oCLC: 874098624, 2012. a
Yevjevich, V. M.: Objective approach to definitions and investigations of continental hydrologic droughts, An, PhD Thesis, Colorado State University: Libraries, http://hdl.handle.net/10217/61303 (last access: 13 May 2025), 1967. a
Yue, S., Pilon, P., Phinney, B., and Cavadias, G.: The influence of autocorrelation on the ability to detect trend in hydrological series, Hydrol. Process., 16, 1807–1829, https://doi.org/10.1002/hyp.1095, 2002. a