the Creative Commons Attribution 4.0 License.
the Creative Commons Attribution 4.0 License.
 | 23 Apr 2025
Pluvial and potential compound flooding in a coupled coastal modeling framework: New York City during post-tropical Cyclone Ida (2021)
Philip M. Orton
David K. Ralston
John C. Warner
Many coastal urban areas are prone to extreme pluvial flooding due to limitations in stormwater system capacity, with the additional potential for flooding compounded by storm surge, tides, and waves. Understanding and simulating these processes can improve prediction and flood risk management. Here, we adapt the Coupled Ocean–Atmosphere–Wave–Sediment Transport modeling framework (COAWST) to simulate pluvial flooding from post-tropical Cyclone Ida (2021) in the Jamaica Bay watershed of New York City (NYC). We modify the model to capture the volumetric effects of rainfall and parameterize soil infiltration and a stormwater conveyance system as the drainage rate. We generate a spatially continuous flood map of Ida with a root-mean-square error (RMSE) of 20 cm when compared to high-water marks, useful for understanding Ida's impacts and subsequent mitigation planning. Results show that over 23 km2 and 4621 buildings were flooded deeper than 0.3 m during Ida. Sensitivity analyses are used to study the broader risk from events like Ida (pluvial flooding) as well as potential compound (pluvial–coastal) flooding. Spatial shifting of the storm track within a typical 12 h forecast uncertainty reveals a worst-case scenario that increases this flooded area to 62 km2 (5907 buildings). Shifting Ida's rainfall to coincide with high tide increases this flooded area by 1 km2, a relatively small change due to the lack of significant storm surge. The application of COAWST to this storm event addresses a broader goal of developing the capability to model compound pluvial–coastal flooding by simultaneously representing coastal storm processes such as rain, tide, waves, erosion, and atmosphere–wave–ocean interactions. The sensitivity analysis results underscore the need for detailed flood risk assessments, showing that Ida, already NYC's worst rain event, could have been even more devastating with slight shifts in the storm track.
- Article
(9667 KB) - Full-text XML
-
Supplement
(1968 KB) - BibTeX
- EndNote


Coastal regions offer numerous socio-economic and ecological advantages to humans yet face an increasing susceptibility to the detrimental impacts of coastal storms and rising sea levels. Such disturbances precipitate a cascade of geomorphological and hydrodynamic changes along shorelines, defined by intense wave action, coastal inundation, erosion, and strong currents, which pose severe threats to human life. An increase in flooding is anticipated due to the influence of global warming, which raises sea levels and augments the atmospheric capacity for moisture retention, thereby increasing the frequency of intense rainfall events (Slater and Villarini, 2016; Trenberth, 2011; Zhu, 2013). In the United States, coastal counties, which house nearly 40 % of the population, face substantial risks of flooding due to their low-lying, densely populated, and often extensively developed nature (National Oceanic and Atmospheric Administration, 2018). As such, communities and authorities in flood-prone areas are increasingly confronted with the need to prepare for or respond to these escalating risks (Zinda et al., 2021).
Understanding the underlying mechanisms of these coastal processes and improving predictive models are imperative for informed coastal management and storm preparedness. These improvements can upgrade emergency management by capturing more aspects of coastal storm hazards in forecasts. They can also enable planners and coastal managers to increase awareness, minimize loss of life and property, and support sustainable development by better managing coastal resources.
Coastal flooding can arise from tides, storm surges, waves and intense precipitation, with the latter influencing direct runoff (pluvial) or increased river discharge (fluvial). The concurrence of these flood drivers, termed compound flooding, amplifies the potential for inundation of low-lying coastal areas, surpassing the risk associated with each mechanism in isolation (Wahl et al., 2015). Recent studies of compound pluvial–coastal flooding have primarily been statistical, bivariate copula that assess the joint probability of water level variability due to the tides or storm surge and rainfall (Zellou and Rahali, 2019; Jane et al., 2022; Kim et al., 2022). A bivariate copula is a statistical tool used in compound flood research to capture and analyze the joint dependance of variables such as river discharge and coastal water levels (Genest and Favre, 2007). An investigation of historical data showed a higher possibility of co-occurrence of storm surge and heavy rainfall for the Atlantic and Gulf coasts in comparison with the Pacific coast (Wahl et al., 2015). The same study found an increase in this type of compound event in some coastal cities, including New York City (NYC), over the past century due to a shift in weather patterns.
Modeling tools have been a limiting factor in research on compound flooding, as in the field of flood modeling, development of coupled hydrologic, hydraulic, and coastal models is rare (Santiago-Collazo et al., 2024). While coastal total water level modeling, forecasting, and hazard assessments are common, hydrologic and hydraulic models (H&H models) are rarely applied to these problems, and when they are, it is typically in a one-way coupled approach (Santiago-Collazo et al., 2019). A key challenge for development of these models is the difficulty of obtaining the comprehensive data required for stormwater modeling, especially for older neighborhoods and private property. A review of flood modeling methods underscored a concerning neglect of the pluvial flood driver in compound-flood-risk assessment, showing the essential need for more comprehensive models (Bulti and Abebe, 2020). This is particularly concerning for highly urbanized coastal areas where dense populations, infrastructure, and distinct hydrology exacerbate flood risks.
A recent review of coastal compound flooding recommended the development of modeling frameworks that can comprehensively represent the dynamic Earth systems driving compound flooding (Green et al., 2024). The Coupled Ocean–Atmosphere–Wave–Sediment Transport (COAWST) coastal system model couples the Regional Ocean Modeling System (ROMS) with atmospheric, wave, and sediment transport models, enabling the simulation of interactions and feedbacks between these systems (Bao et al., 2022). However, the COAWST model has heretofore lacked the ability to simulate pluvial flood processes. While models such as the Hydrologic Engineering Center's Hydrologic Modeling System (HEC-HMS) (Peters, 1998); Interconnected Channel and Pond Routing (ICPR), which is now called StormWise (Schroeder et al., 2022); and Stormwater Management Model (SWMM) (Rossman and Huber, 2016) focus on inland hydrological and stormwater system processes, COAWST also incorporates three-dimensional hydrodynamics, which is important for accurately predicting baroclinic and stratification effects on storm tides in coastal and estuarine areas (Orton et al., 2012; Ye et al., 2020).
This study improves COAWST to enable pluvial and compound (pluvial–coastal) flood simulations. We simulate Ida's flooding in the Jamaica Bay watershed of New York City in 2021, including exploring different counterfactual scenarios of a shifted storm track causing more intense rainfall and shifted storm timing causing the rain to peak at high tide, causing compound flooding. Section 2 outlines the methodology behind the coupled modeling framework, which simulates pluvial flooding by accounting for the volumetric effects of rainfall and a simplified representation of urban stormwater drainage. In Sect. 3, the model is calibrated and validated using flood depth observations, and a sensitivity analysis of flooding in three counterfactual scenarios is presented. Section 4 has a discussion of the study's findings and their broader implications, as well as the model's predictive strengths and areas of potential improvement. Lastly, Sect. 5 provides a summary of the key conclusions.
2.1 Storm event and study site
Tropical Storm Ida formed in the western Caribbean Sea southwest of Jamaica on 23 August 2021 at approximately 12:00 UTC. It first hit western Cuba as a Category 1 hurricane and later transformed into an extratropical low. The tropical cyclone traveled northwestward and strengthened as it entered the Gulf of Mexico. Sea surface temperatures near 30 °C led to continued intensification, and the storm became a Category 4 hurricane before making landfall on the Louisiana coast near Port Fourchon on 29 August 2021 at 16:55 UTC. After landfall, the storm continued to travel across the United States and resulted in severe rainfall and deadly flooding in Pennsylvania, New Jersey, New York, Connecticut, and Maryland (Beven et al., 2022). Ida caused the fifth-wettest day in NYC history, with over 17.8 cm (7 in.) of rain in total (in Central Park) and set the single-hour rain record at 8 cm (3.15 in.) (City of New York, Department of Small Business Services (SBS) New York, 2015; FEMA, 2023; National Severe Storms Laboratory, 2021). Smith et al. (2023) documented the extreme short-duration rainfall and the flooding caused by Ida in eastern Pennsylvania and New Jersey, emphasizing the role of supercell thunderstorms. In NYC, the storm's sustained rainfall overwhelmed stormwater conveyance systems (sewers) and turned streets into rivers in many places, including severe flooding in all five boroughs (Finkelstein et al., 2023).
The coastal embayment and surrounding watershed of Jamaica Bay is a part of New York City (NYC) that experienced extensive pluvial flooding during Ida (Fig. 1). Over 2.8 million people live in the Jamaica Bay watershed (NYC-DEP, 2018), and many are situated within range of a realistic 5 m coastal flood (Orton et al., 2015). Jamaica Bay has an area of 72 km2, encompassing over 15 km2 of marshes and 4.6 km2 of intertidal unvegetated areas, hosting a wide range of habitats and wildlife and offering a variety of recreational opportunities (Orton et al., 2020a, 2020b; Swanson et al., 2016). Ida's rain averaged across the Jamaica Bay watershed was 71 mm (2.8 in.) over 3 h, which corresponds to a 10-year return period (between 5 and 25 years) based on the National Oceanic and Atmospheric Administration (NOAA) Precipitation Frequency Data Server (station ID 30-5803). However, the maximum intensity (Fig. 3) reached 70 mm h−1, which is a 1 h rain event with a 50-year return period (2.76 in. h−1) based on the same NOAA data (National Weather Service). In contrast, the previous major disaster in the region, Hurricane Sandy (2012), was predominantly a coastal flooding event that severely impacted the neighborhoods surrounding Jamaica Bay and spurred major efforts focused on strengthening coastal defenses (USACE, 2022).
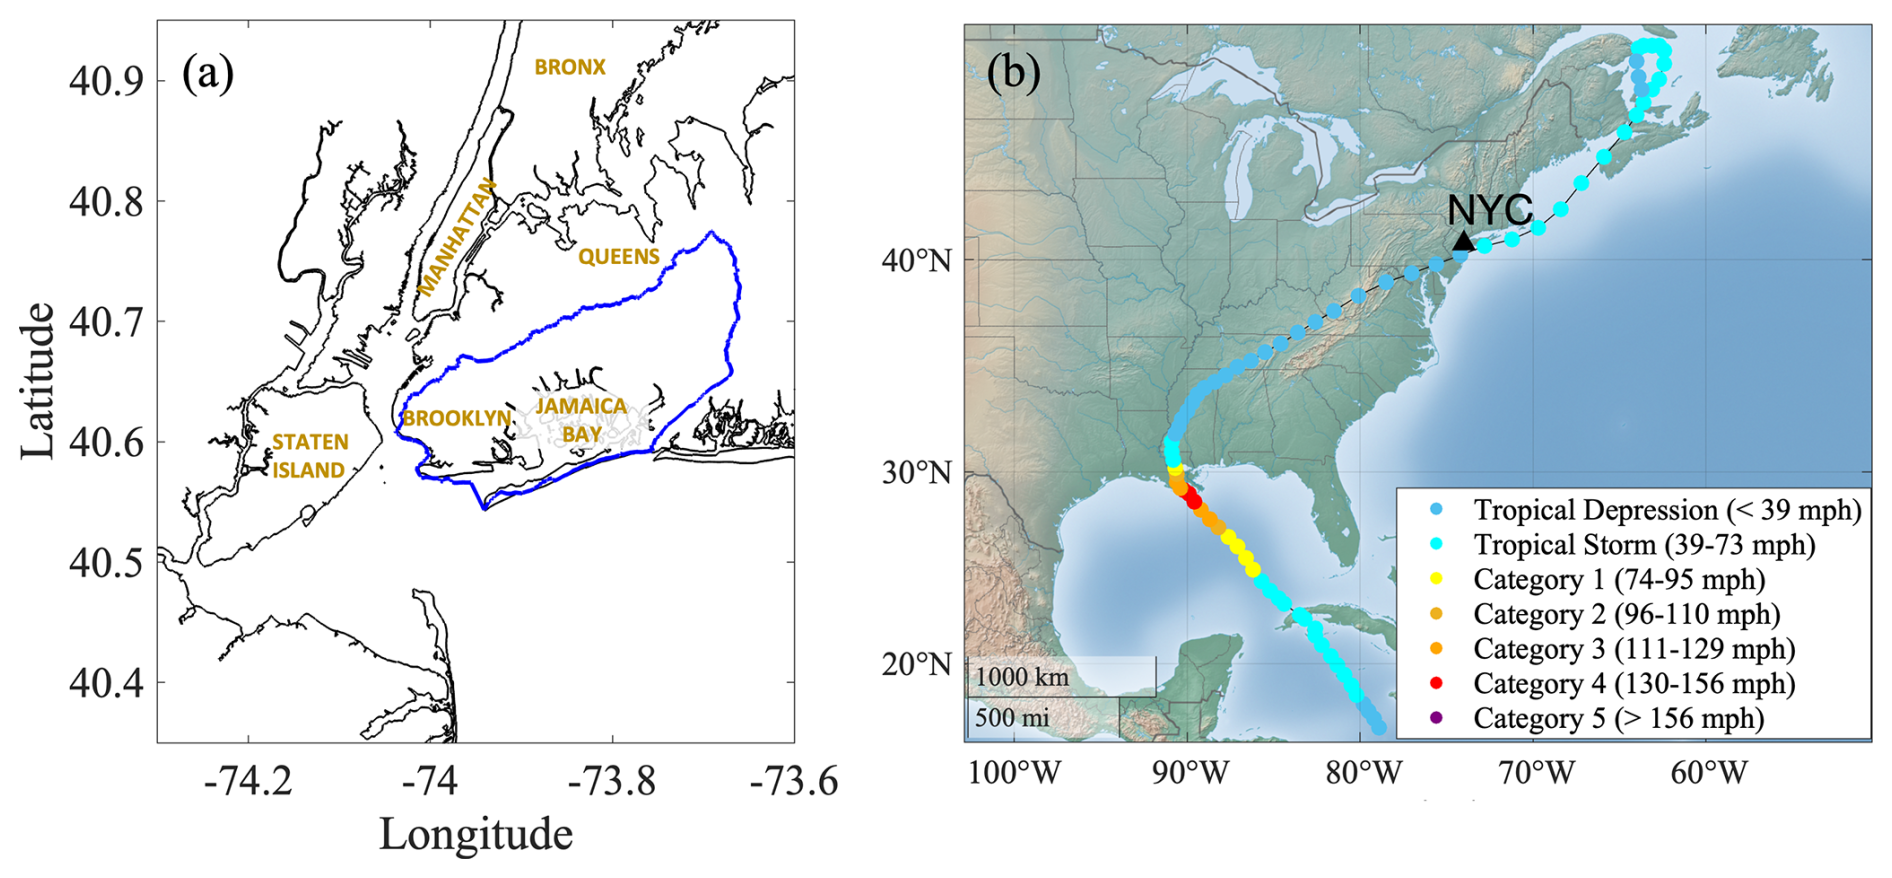
Figure 1(a) The location of Jamaica Bay in New York City and its watershed area (shown by the blue line). (b) The storm track of Cyclone Ida (the color terrain base map from MATLAB is applied, hosted by Esri).
2.2 Modeling
The COAWST modeling system integrates multiple components to comprehensively simulate coastal system interactions (Warner et al., 2010). These components include models for the ocean, atmosphere, surface waves, and sediment transport; a coupler to exchange data fields; and a re-gridding method. This gives COAWST capabilities that are not typically available with urban hydraulic–hydrologic models (see Sect. 4 for examples), which are used to design improvements to water infrastructural systems and to predict urban water cycle processes. COAWST is well suited to represent interactions between the ocean and atmosphere, such as sea surface temperature, or wave dynamics, such as wave generation and propagation.
2.2.1 Hydrodynamic model
The ocean model in COAWST is the Regional Ocean Modeling System (ROMS), which is a three-dimensional, free-surface, terrain-following hydrodynamic model (Shchepetkin and McWilliams, 2005; Haidvogel et al., 2008). It employs finite-difference approximations of the Reynolds-averaged Navier–Stokes (RANS) equations under the hydrostatic and Boussinesq assumptions (Haidvogel et al., 2000; Chassignet et al., 2000). In ROMS, the hydrostatic primitive equations are approximated through the utilization of boundary-fitted, orthogonal curvilinear coordinates on a staggered Arakawa C grid. The vertical dimension uses stretched terrain-following coordinates.
We adapt the ROMS component for this study to account for rain as a volumetric addition to the grid cell, enabling the rain-on-grid option over water or dry land (COAWSTv3.8). Rainfall is directly integrated into the governing equations in the model. The vertical momentum equation is modified to include the vertical displacement of the water level due to the volume of rain, affecting the free-surface and water column dynamics. Additionally, the continuity equation includes a source term to account for the rainfall's volumetric contribution. This approach aligns with other studies (Dresback et al., 2023; Santiago-Collazo et al., 2024) where rainfall is incorporated by modifying the governing equations. The rain rate is included as a spatially and temporally varying meteorological forcing variable. The model can also implicitly account for spatially varying floodwater infiltration and flow into stormwater sewers with drain rates that are subtracted from the rain rate. The drain rate is always negative (a volume sink representing the storm water system and infiltration), while the rain rate is always positive (a volume source), and the net rate of volume change (precipitation − drain rate) can be negative when it is locally greater than the rain rate. For the Jamaica Bay watershed simulations, we assume a uniform, constant drain rate for the land area and use it as a calibration parameter, as described in Sect. 2.4. The volume of the rain that is removed from the domain with this drain term could be routed into the ocean with additional modifications to the model, but this is left for future work, as it is not an essential component of this study.
2.2.2 Model domains, nesting, and setup
A nested modeling application is used for Ida, with an existing larger-scale coastal and estuarine domain providing boundary conditions for a higher-resolution Jamaica Bay domain. The model grid of the Jamaica Bay watershed has 818×734 cells, averaging 46×51 m in size with slight variation across the domain, and has eight uniformly spaced vertical sigma layers. The bare-Earth digital elevation model (DEM) for model bathymetry is created by merging three datasets (in descending order of preference): the National Park Service data (Flood, 2011) and the NOAA-NCEI 0.11 arcsec resolution DEM (CIRES, 2014b) and 0.33 arcsec resolution bathymetric data (CIRES, 2014a). Figure 2b). We use spatially varied bottom roughness, in which the quadratic bottom roughness coefficient was calculated based on the land cover (Fig. 2d). The Coastal Change Analysis Program (C-CAP) is a nationally standardized effort by the NOAA Office for Coastal Management that provides raster-based inventories of land cover for coastal regions in the USA, derived from the analysis of remotely sensed imagery to ensure consistency over time and geography (National Oceanic and Atmospheric Administration, 2016). We use the corresponding Manning number for each value of C-CAP (ranging from 0.02 to 0.13) (Mattocks and Forbes, 2008); subsequently, we calculate the Zo (bottom roughness) and the quadratic bottom roughness coefficient (which is used in the model) consecutively. The internal (baroclinic) time step for the simulation is 2.5 s, and there are 20 external (barotropic) time steps. For wetting and drying, the minimum depth to allow flow out of the cells, Dcrit, is set to 5 cm (Warner et al., 2013). The Ida simulation commences from a state of rest, and temperature and salinity are initialized as spatially constant values, although the full three-dimensional salt and temperature fields could be utilized to capture baroclinicity and stratification effects on storm tides. The open boundaries of the nested model (shown in Fig. 2a by a black rectangle) are set using Chapman conditions for the free surface, Flather conditions for two-dimensional momentum, and radiation conditions for three-dimensional momentum, and the gradient condition is applied for salinity and temperature, effectively holding them constant within the domain (Marchesiello et al., 2001). Since the spinup is only for the velocity and water level, it only requires hours to stabilize.
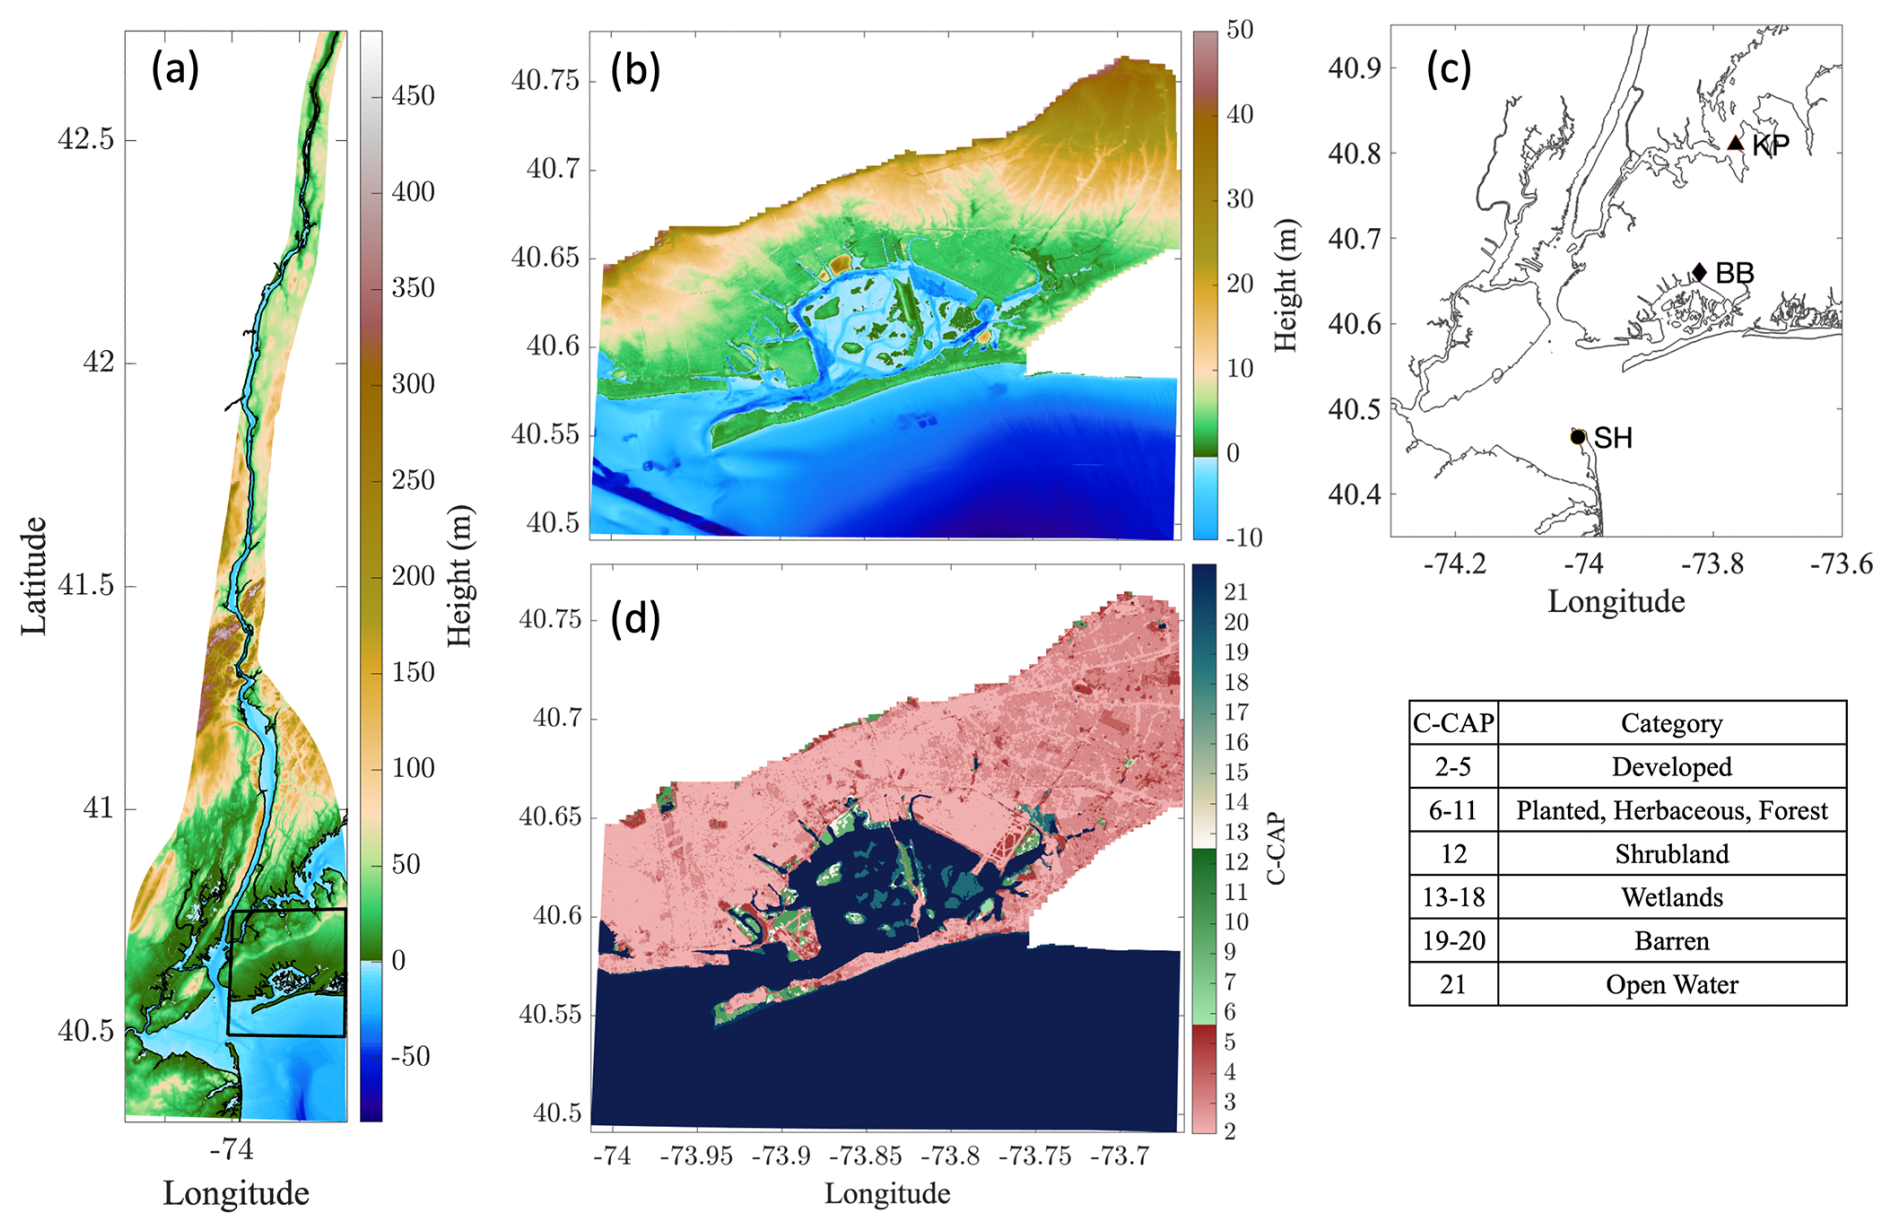
Figure 2(a) Regional DEM (m) and the location of the Jamaica Bay model (black rectangle). (b) Jamaica Bay DEM (m) covering the Jamaica Bay watershed (nested model). (c) Tide gauges at Kings Point (KP), Bergen Basin (BB), and Sandy Hook (SH). (d) Coastal Change Analysis Program (C-CAP) values and the land cover categories.
The regional parent simulation uses a larger-scale grid that includes the Hudson River estuary and surrounding coastal region (Fig. 2a), as described by Ralston (2022). The open boundaries of the regional parent model are forced with tidal water levels, and currents were extracted from the ADCIRC database (Mukai et al., 2002). Additionally, subtidal water levels calculated from observations at the NOAA tide gauges at Sandy Hook (NJ; NOAA station 8531680) and Kings Point (NY; NOAA station 8516945) (Fig. 2c) were added to the boundaries in the New York Bight and western Long Island Sound, respectively. In addition, we simulate the influences of local wind stress and barometric pressure changes on the regional storm. This combination of boundary conditions and in-domain forcing allows for a more accurate representation of both local and regional storm surge effects. Atmospheric forcing is from the North American Mesoscale Forecast System (NAM) 12 km analysis product. Simulations in the regional model are run for the period of 10 August 2021 to 10 September 2021 to allow for model spinup prior to Ida hitting NYC. Evaluation of this larger-scale model against previous observations of water level, currents, and salinity is reported with skill metrics in Ralston (2022).
2.3 Application to post-tropical Cyclone Ida
The model is applied to investigate the impacts of Ida on the Jamaica Bay watershed. All simulations for the nested model are initiated with a model time of 29 August 2021 at 00:00 UTC, when the storm had just passed Cuba, and simulations last for 5 days, until 3 September 2021 at 00:00 UTC. Ida generated only pluvial flooding since the hour of the most extreme rainfall occurred between low and high tide, and the non-tidal anomaly peaked at 0.6 m. At this instance, the observed water level at the Stevens Institute's tide gauge at Bergen Basin in Jamaica Bay (Fig. 2) was 0.21 m NAVD88, which is not enough to cause coastal flooding. This water level is far below the street level, which is 3.17 m NAVD88 (North American vertical datum of 1988), and therefore should not block outflow through the stormwater drainage system. The coastal water level range during the 5 d simulation period was −0.4 to 1.1 m NAVD88 in Jamaica Bay (see Sect. 2.5, Fig. 8).
The simulation incorporates meteorological forcing from the North American Mesoscale (NAM) WRF model product (Center Environmental Modeling, 2017) and rain forcing from the Multi-Radar/Multi-Sensor system (MRMS). The WRF-NAM model provides east and north winds, atmospheric pressure, relative humidity, air temperature, and short- and longwave radiation data on a 12 km spatial grid and at a 3 h temporal resolution. The MRMS quantitative precipitation estimation (QPE) data provide a 1.11 km spatial and 1 h temporal resolution, combining radar, satellite, and rain gauge observations with bias correction to offer more accurate precipitation estimates than radar-only products (Zhang et al., 2016). Hourly data provide a robust value to simulate the event, but sub-hourly data could have higher intensities that would create more impact. However, the time resolution of the forcing data precludes sub-hourly analysis. Figure 3 shows the maximum hourly intensity and accumulated rain during Ida for the simulation duration. The maximum hourly rainfall intensity was 70 mm h−1 during Ida, which is a 50-year-return-period rain event (2.76 in. h−1) based on the NOAA Precipitation Frequency Data Server (station ID 30-5803) (National Weather Service, 2023). The observed rainfall intensity was greatest on the western side of Jamaica Bay. Additionally, the maximum rainfall accumulation over 5 d of simulation reached 160 mm. Figure 4 shows the time series of rainfall to highlight the sharp peak of rainfall during the 5 d simulation and the absence of significant rainfall before and after.
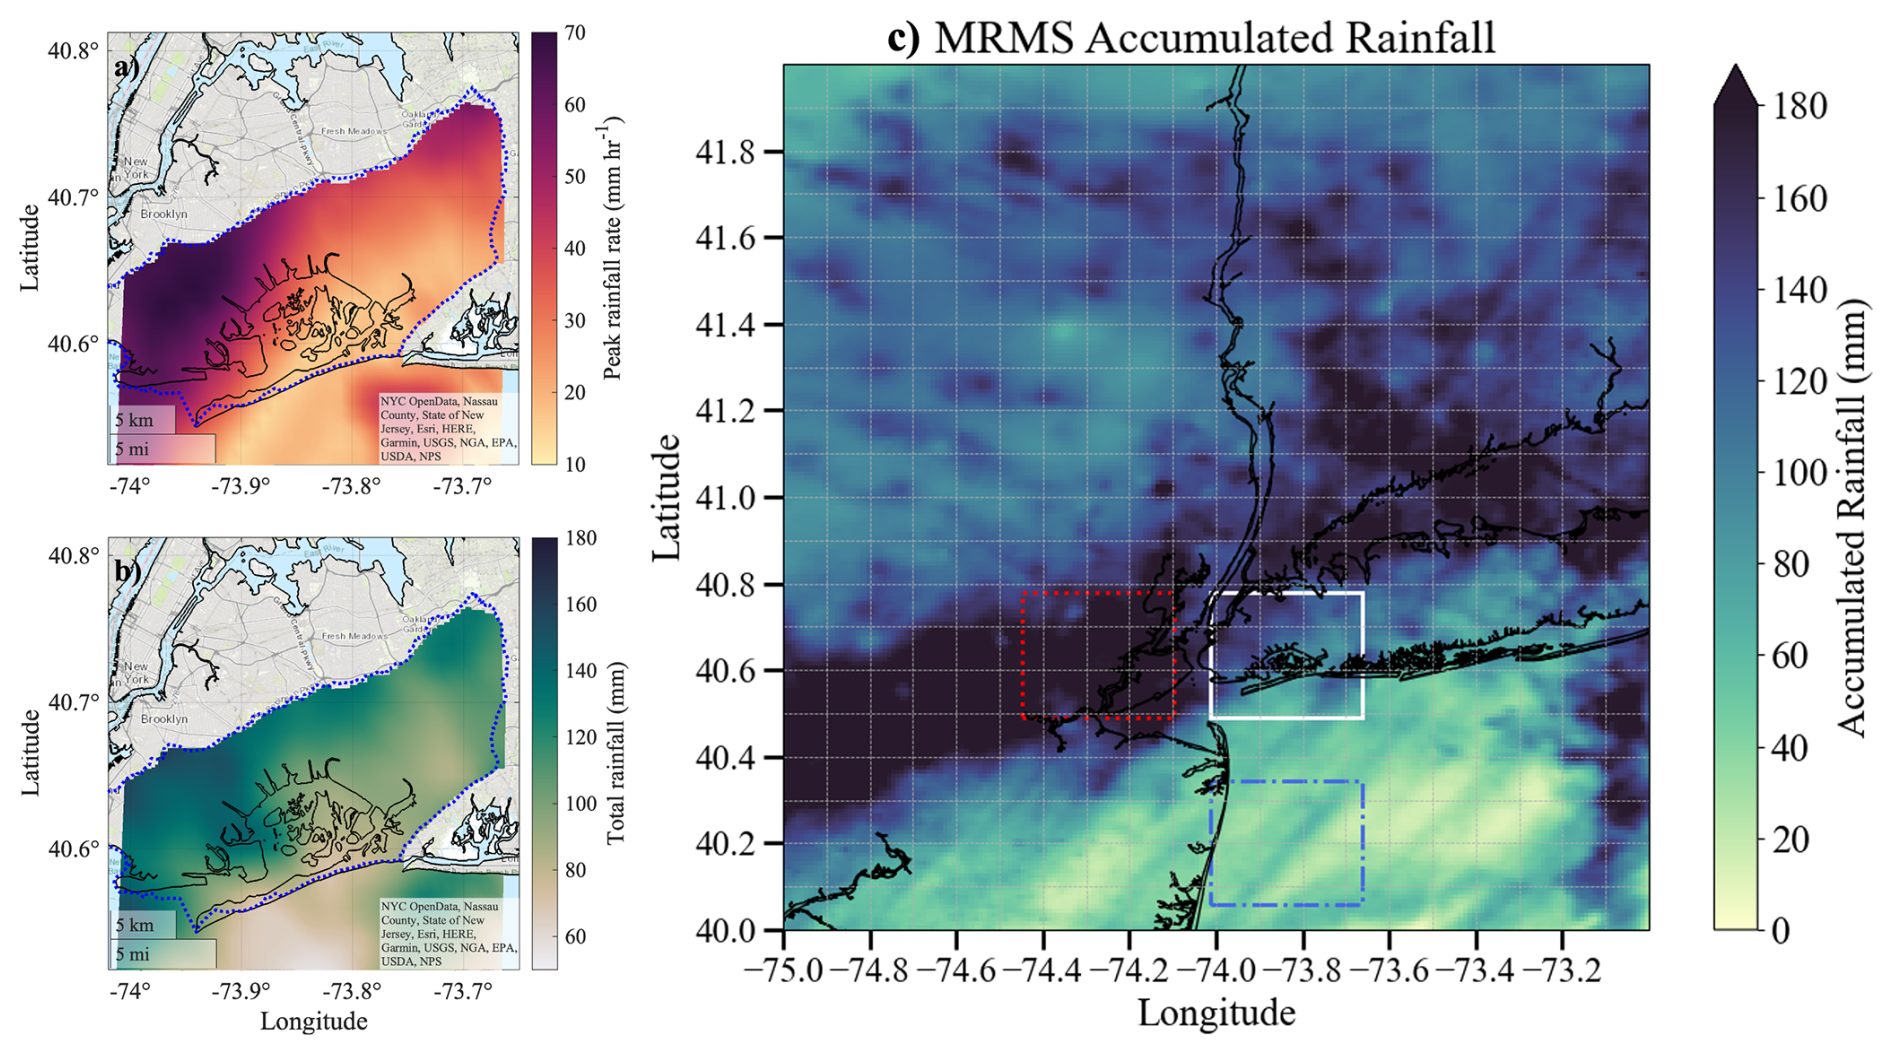
Figure 3(a) Maximum hourly rain intensity for Ida, (b) Total rain accumulation from 29 Aug 2021 to 2 September 2021, for Ida (the watershed boundary is shown with blue dots, and topographic base maps are from MATLAB, hosted by Esri). (c) Ida total rain is shown as color shading (temporal accumulation of rainfall over the 5 d simulation time). The white box shows the Jamaica Bay domain, whereas the red box (dotted line) shows the rain that would fall over the domain if the rain were displaced eastward (worst-case scenario), and the blue box (dash-dotted line) shows the rain that would fall over the domain for a displacement northward (best-case scenario).
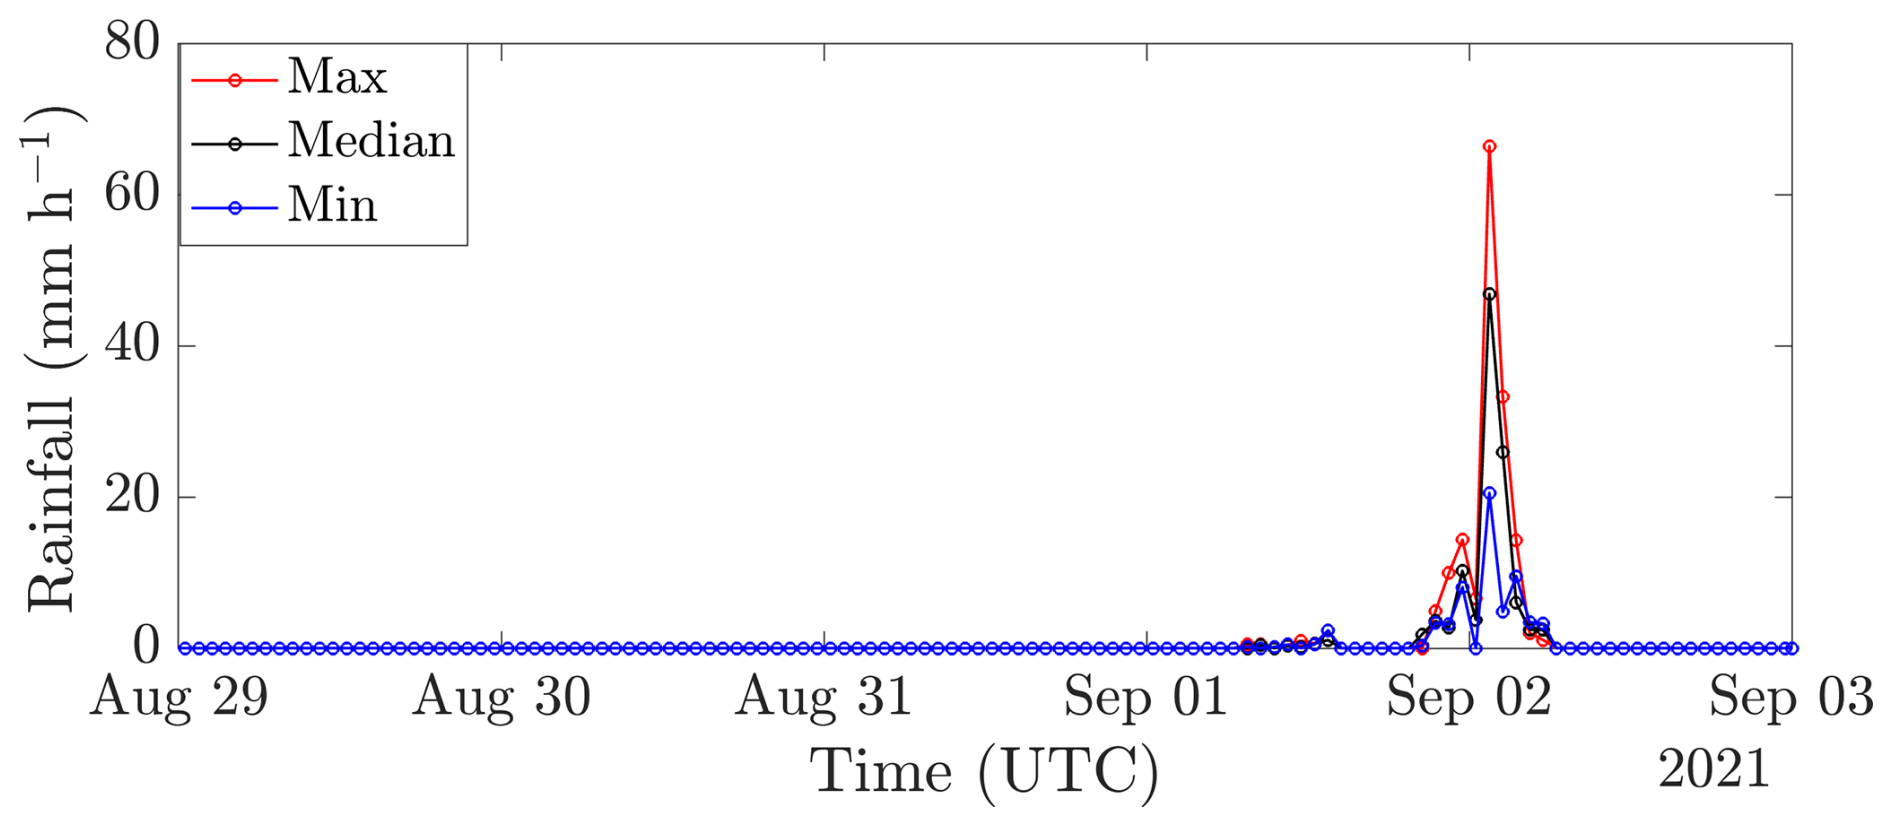
Figure 4Rainfall time series at the “Max” location with the maximum rain accumulation, at the “Median” location with the median rain accumulation, and at the “Min” location with the minimum rain accumulation over the 5 d simulation.
2.4 Drain rate calibration and context
Rainfall in the study region can have several fates, including infiltration, ponding, surface flow, or interception and export through the drainage system. Because the model does not explicitly include infiltration or a stormwater system, we account for the drainage with a collective “drain rate”. The drain rate can be influenced by different factors such as the characteristics of the sewer network, land use, soil infiltration rates, and potential blockage in the stormwater system. Given its impact on the results and its relatively unconstrained nature, we start by applying a spatially uniform drain rate and treat it as a calibration parameter. The sensitivity of results to the assumed drain rate is explored using several different values. First, we perform a base simulation with no drain rate and with realistic rainfall and atmospheric forcings. This base Ida simulation is initially compared to observations of high-water-mark data points, and then different drain rates are investigated to improve the model calibration. Potential drain rate values extend up to 44 mm h−1, which correspond to the design capacity of the stormwater system (NYC-MOCEJ, 2023).
It is informative to compare our calibrated drain rate with an estimate of the required drainage during Ida: the volume of water that stormwater infrastructure must effectively manage to prevent flooding. The curve number (CN) method (Cronshey, 1986), a cornerstone of hydrological modeling, is employed to estimate runoff (the required drainage) from this event. This method is defined by Eq. (1):
where Q represents the runoff, P denotes total precipitation, and S signifies the potential maximum retention after runoff initiation, which is calculated based on Eq. (2):
To reflect the spatial variability in urban and non-urban areas, a weighted CN of 93.95 is derived based on the land cover categories (C-CAP data, Fig. 2d) and soil data from the USDA-NRCS Web Soil Survey (U.S. Department of Agriculture, Natural Resources Conservation Service, 2024; Cronshey, 1986). We consider the rainfall associated with Ida as a concentrated 3 h period of precipitation (as the vast majority of the rain is over only 3 h according to MRMS) starting on 2 September 2021 at 00:30 UTC. A comparison of the gauge data from the Community Collaborative Rain Hail and Snow Network (CoCoRaHS) at the Howard Beach station (126 mm) with MRMS data at the same location (102 mm) confirms the reasonable accuracy of MRMS. During this period, the rainfall generates an average of 74 mm (2.9 in.) of total accumulation across the domain. Using this formula, we determine that Ida would result in an average of 58 mm (2.3 in.) of runoff across the domain. This finding, which is based on the rainfall forcing of the event, provides useful context, as it denotes the volume of water that the urban stormwater infrastructure must efficiently channel to avert flooding.
2.5 Sensitivity analysis
The sensitivity of flooding in the Jamaica Bay watershed was evaluated using multiple scenarios based on the realistic forcing by shifting the track and timing of the storm. These hypothetical storm cases are designed to represent the worst-case and best-case precipitation conditions from Ida for the Jamaica Bay watershed.
At the time that Ida passed the New York City metropolitan area, the region with the most intense and widespread rainfall was over New Jersey, 48 km to the west of Jamaica Bay (Fig. 3c). Thus, to examine the sensitivity, we shift the Ida rainfall and wind fields spatially to the east to create an approximate worst-case scenario. This shift is well within the potential track uncertainty for Ida, given that the National Hurricane Center (NHC) forecast cone of uncertainty at 12 h prior to storm passage is 48 km. For comparison, we create a best-case scenario by shifting Ida northward the same distance, which results in much less precipitation over the Jamaica Bay watershed.
While Ida's rain set records at in Central Park and at other locations, much of the Jamaica Bay area had far lower rainfall rates. Shifting the storm track east by 48 km increases Ida's rain average across the Jamaica Bay watershed over 3 h to 145 mm (5.7 in.), which represents a 3 h rain event with a 500-year return period based on the NOAA Precipitation Frequency Data Server (station ID 30-5803) (National Weather Service, 2023) and close to a 100-year storm under climate projections (129.54 mm) based on the Northeast Regional Climate Center extreme precipitation projections (Cornell University, Northeast Regional Climate Center (NRCC), 2024). During this worst-case scenario, all of the Jamaica Bay watershed area experiences maximum hourly rain intensity greater than 30 mm h−1, and the watershed area experiencing rainfall intensity greater than 60 mm h−1 more than doubles. In addition, the total rainfall in this scenario over the 5 days increases by 48 % to 237 mm. In the best-case scenario, the watershed experiences 60 % less total rainfall, equal to 64 mm. Figure 3c shows Ida rainfall over the simulation domain (white rectangle) and the regions that the rainfall came from for the eastward shift (red rectangle with the dotted line) and for the northward shift (blue rectangle with the dash-dotted line).
We also analyze the timing of Ida together with tidal conditions to ascertain whether the synchronization of the peak rainfall rates with storm surge and high tide could exacerbate flooding. Figure 5 illustrates tidal observations from Bergen Basin (location shown in Fig. 2) throughout the simulation period. The most intense rainfall during Ida happened on 2 September 2021 at 01:30 UTC. We consider two alternative temporal scenarios: (1) positioning the maximum intensity of the Ida rain 6 h prior to its actual occurrence, corresponding with the earlier high tide, and (2) a delay of 19 h to examine the effects of the storm's peak overlapping with the highest tide during the simulation period. The timing of the storm's peak rain is shifted from the observed timing (when the water level is 0.3 m NAVD88) to occur when the observed water levels are at 1.01 and 1.15 m NAVD88, respectively.
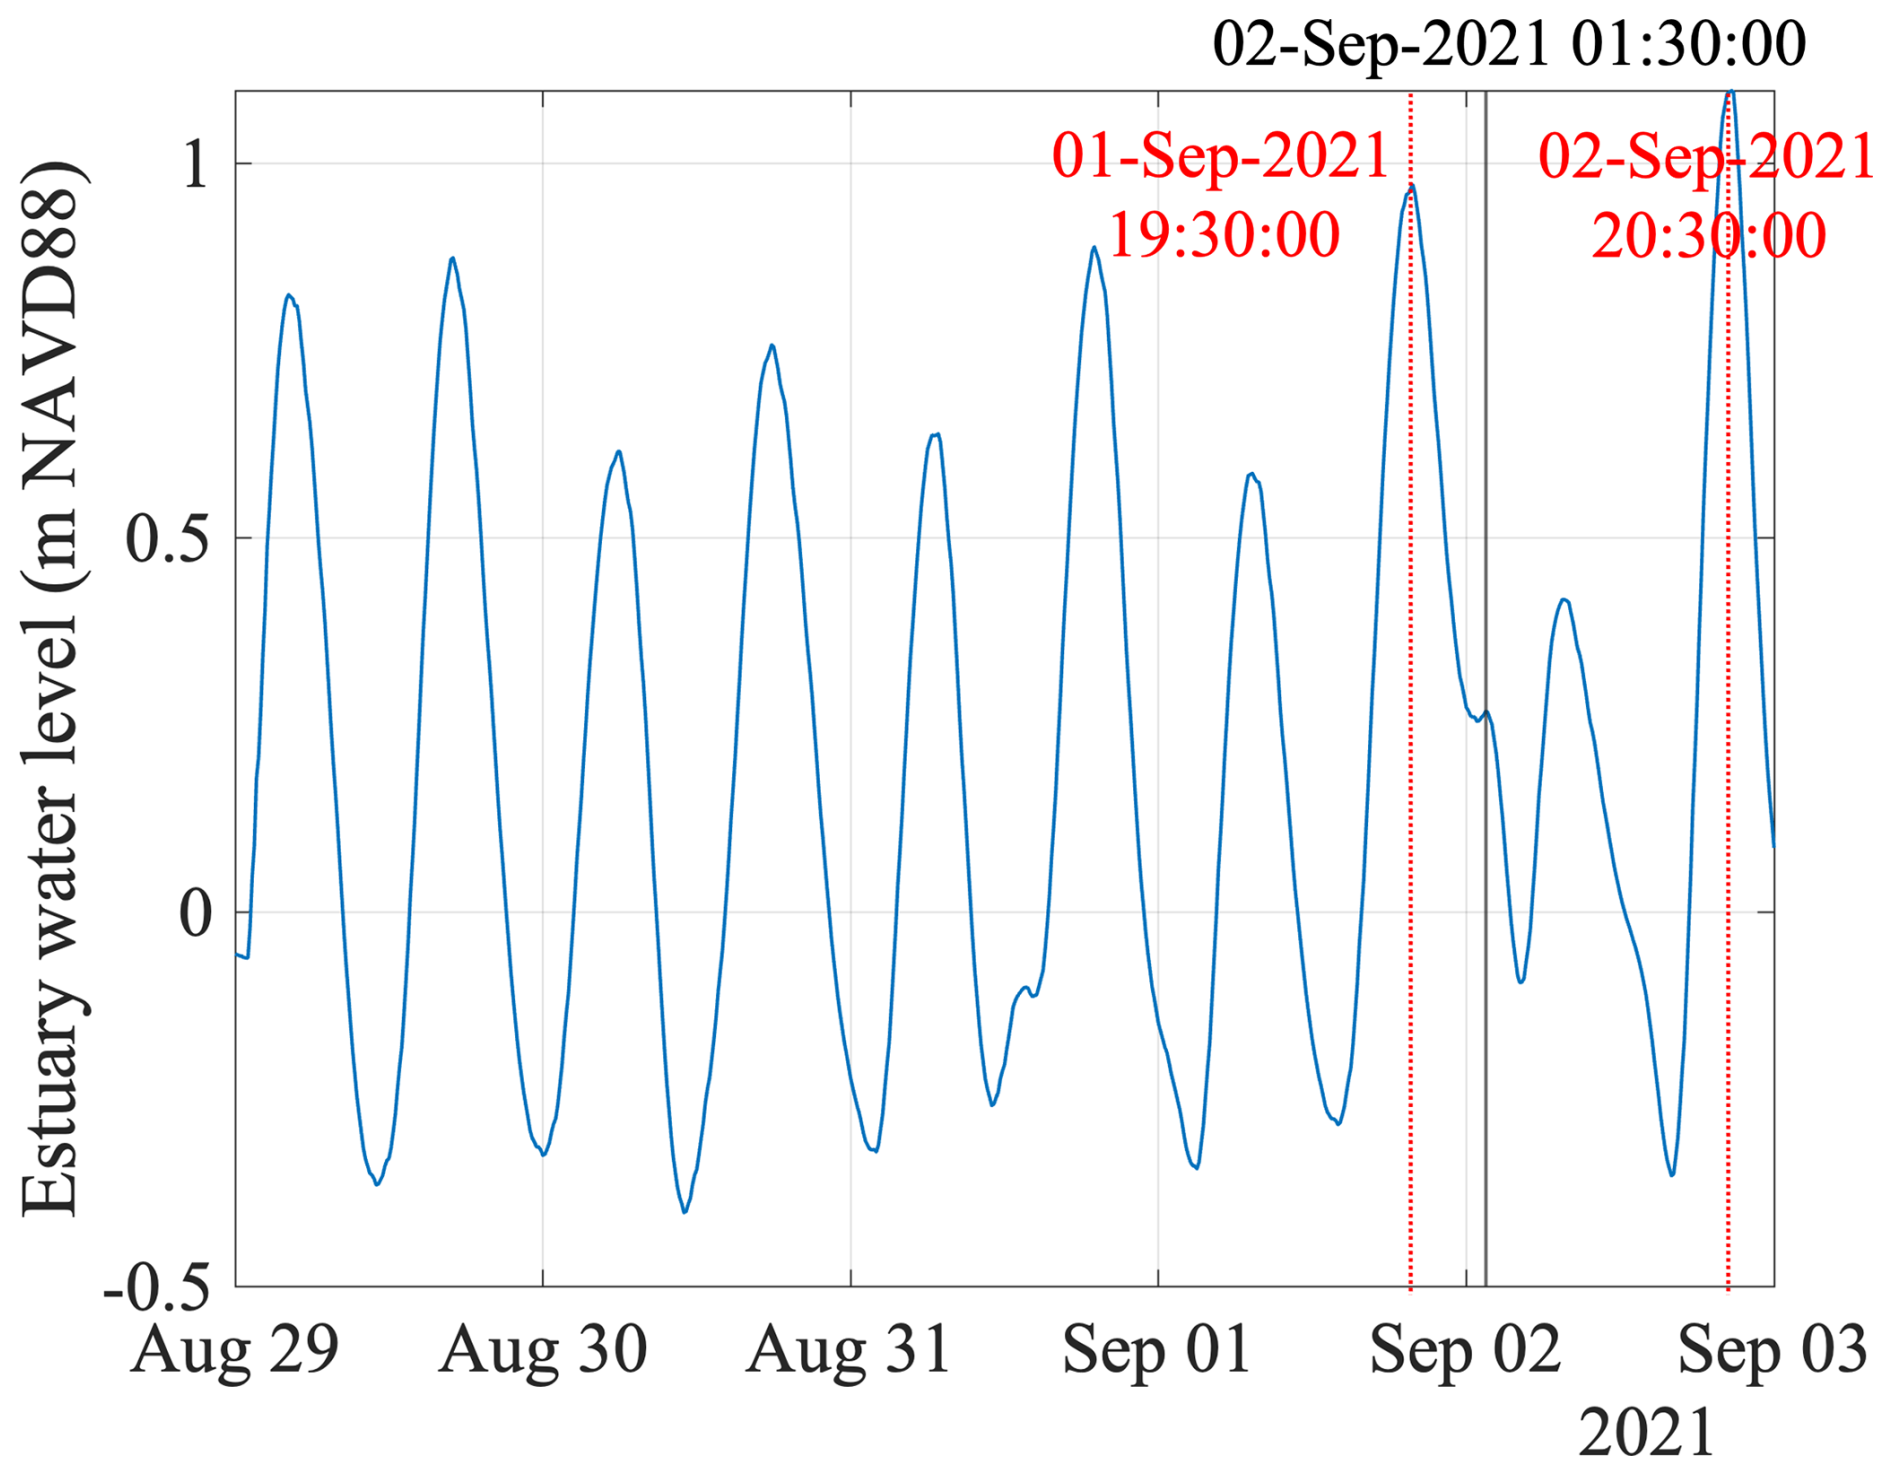
Figure 5Tide gauge water elevation at Bergen Basin, with the timing of Ida's peak intensity (black) and two adjacent diurnal high tides (red).
These experiments are simplistic, and true variations and uncertainties in storms can affect a wide range of storm characteristics, including the intensity and spatial distribution of rainfall. However, a comprehensive study of Ida forecasting uncertainties is beyond the scope of this paper.
2.6 Flood map and building association
This research effort produces the estimated flood depth map of Ida, which is publicly accessible and is utilized by New York City Emergency Management (NYCEM). This interpolated flood map based on differencing of the modeled peak water elevation and a 30 cm resolution DEM has been generated and published in a separate resource (Kasaei et al., 2024). Also, to quantify the number of buildings affected by Ida and the spatial shift in the worst-case scenario, a GIS spatial intersect analysis is performed between the model outputs and NYC building footprints in the Jamaica Bay watershed. These are obtained from the NYC Department of Finance Map PLUTO tax lot dataset (DCP, 2024).
2.7 Limitations
The methods above expand the capabilities of the widely used COAWST model system and enable the first simulation and flood map for Ida. However, several simplifications are worth considering while interpreting our results. The model's simplifications, such as assuming spatially constant drain rates and a bare-Earth land surface, help simplify the model setup but do not fully capture the complexity of urban flooding, particularly in areas with variable drainage systems and land use. However, during extreme events like Ida, where stormwater systems were overwhelmed or blocked, these assumptions likely have a reduced impact. Additionally, the moderate ∼50 m spatial resolution may overlook finer-scale variations in flooding. Potential future improvements to mitigate these limitations are discussed in Sect. 4.
3.1 Model calibration and validation
For the baseline simulation (no drainage rate, no spatial or temporal shifting of rain) of Ida's flood impact on Jamaica Bay, the flood depths vary spatially throughout the domain (Fig. 6, discussed below). Flood depths below Dcrit (5 cm) are not tallied in the flood depth mapping and calculations. For model validation, we reference surveyed high-water marks (HWMs) from the USGS website for the event, finding seven locations within our modeled area; one more HWM is from the Community Flood Watch Project (for these datasets, see the “Data availability” section). Furthermore, to enhance the robustness and generality of the model calibration, we investigate another less intense rain event that occurred on 29 September 2023. In this event, we identify 10 additional flood gauges from the FloodNet project (Mydlarz et al., 2024). We use the maxima of the flood time series during this event as HWM data points (more information on this rain event in the Supplement) in addition to the HWMs for Ida. Figure 7 presents the model results vs. observed HWMs for different drainage rates in both rain events. We investigate the root-mean-square error (RMSE), mean absolute error (MAE), and Nash–Sutcliffe efficiency (NSE) metrics to assess the model accuracy. NSE equals 1.0 for a perfect fit and 0.0 when the mean of the time series is as predictive as the model (Nash and Sutcliffe, 1970). The analysis shows a tendency for the model to predict higher flood levels, with a root-mean-square error (RMSE) of 40 cm and a mean error of 13 cm (Fig. 7a). This discrepancy is likely attributed to the model's omission of infiltration and stormwater drainage; however, it is important to acknowledge that other factors, such as uncertainties in atmospheric forcing, could also contribute to this discrepancy. To rectify this, we test different drainage rates in the model, and the values that lead to the best results are summarized below. In addition to the HWMs, we investigate the tide gauge data at three stations: Inwood (USGS station 01311850; US Geological Survey), Rockaway (USGS 01311875; US Geological Survey), and Bergen Basin (a station managed by Stevens Institute of Technology). The locations of the gauges are shown in Fig. 6. For the comparison of the calibrated model, we evaluate the peak water level during the simulation (the first high tide after Ida), where the model has an error of +8, +7, and +6 cm for the Inwood, Rockaway, and Bergen Basin gauges, respectively (validation time series at these three gauges are shown in the Supplement). These tide gauge results are not utilized in the calibration process, as the peak tidal water levels in Jamaica Bay during Ida do not occur during the period of rainfall and were controlled by ocean forcing.
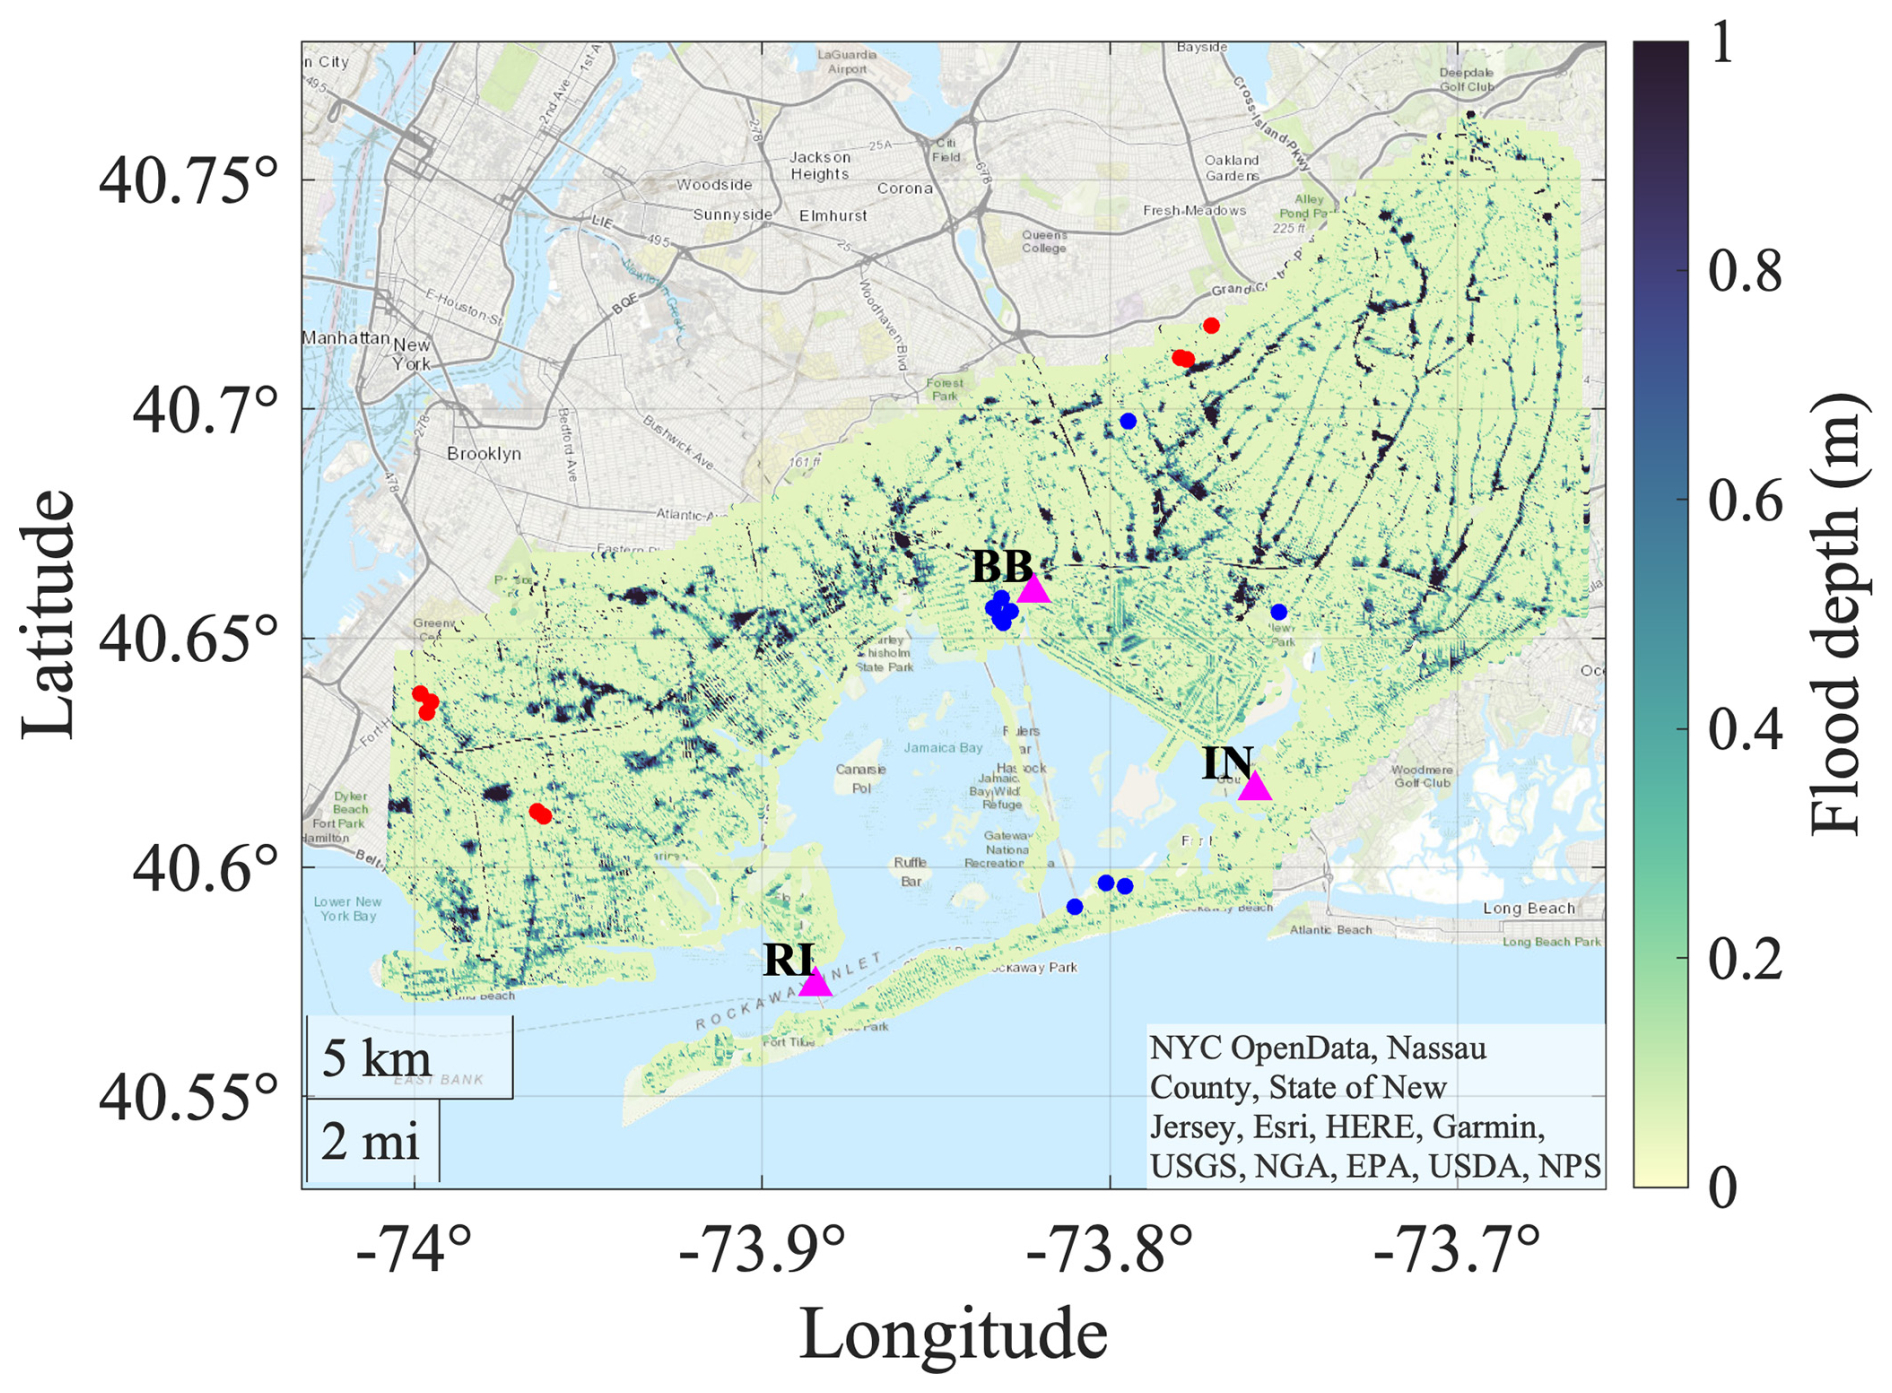
Figure 6Flood depth above ground level (model with no drainage): red circles, blue circles, and purple triangles show HWMs from Ida, HWMs from the 29 September storm, and tide gauge locations, respectively. Tide gauge locations at Bergen Basin (BB), Rockaway (RI), and Inwood (IN) are shown (topographic base map from MATLAB, hosted by Esri).
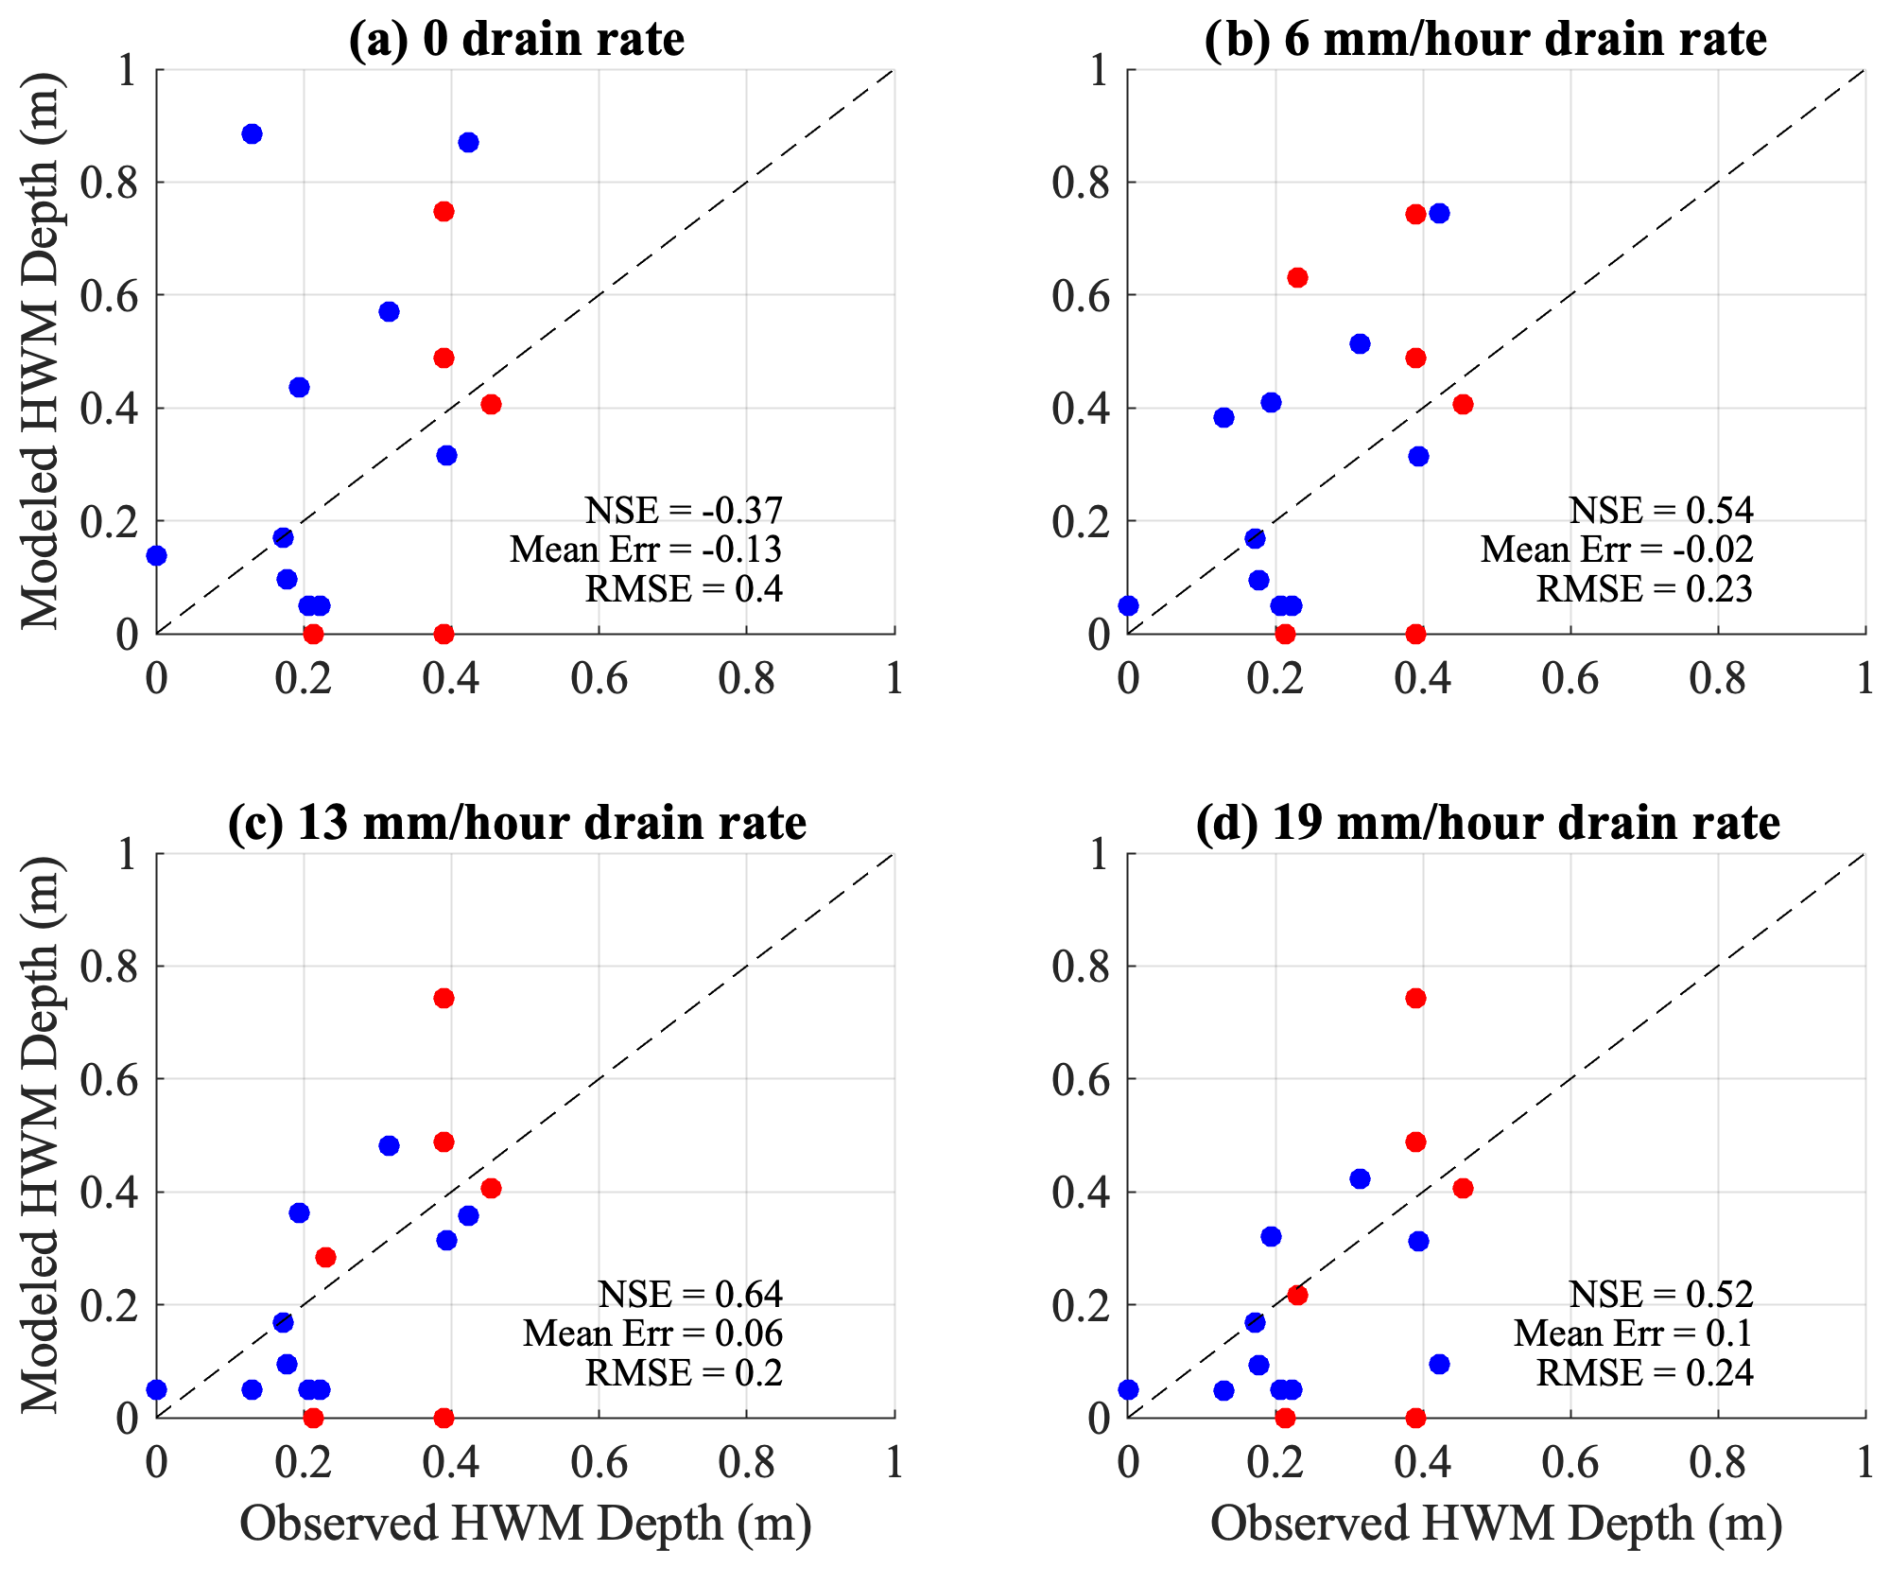
Figure 7Model results vs. observed HWMs for different drainage rates, which was used to calibrate the model and finalize the choice of a 13 mm h−1 drain rate. Data include HWMs from Ida (in red) and the 29 September storm (in blue).
To simulate the sewer system's capacity within our models, we introduce drain rates of 6 mm h−1 (0.25 in. h−1), 13 mm h−1 (0.5 in. h−1), and 19 mm h−1 (0.75 in. h−1). The 13 mm h−1 rate, which provides the best fit to high-water marks from both the main event (Ida) and a less intense event (29 September 2023), reflects a reasonable drainage rate for the model based on the best fit to the observed HWMs. Assessing the performance across the three metrics with high-water-mark (HWM) data, we conclude that the 13 mm h−1 drain rate is the best overall option. It provides the highest Nash–Sutcliffe efficiency (NSE), 0.64; the lowest root-mean-square error (RMSE), 0.20; and a reasonably low mean absolute error (MAE), 0.06. While the 6 mm h−1 drain rate has an NSE of 0.54 and the lowest MAE (−0.02), its RMSE of 0.23 is slightly higher, and it does not outperform the 13 mm h−1 rate in terms of overall predictive ability. Since the 13 mm h−1 drain rate has the highest NSE, indicating the model's ability to explain the variance in observed HWMs, it remains the optimal choice, striking the best balance across all key performance metrics. Figure 7 depicts the improvement in the metrics when applying a 13 mm h−1 (0.5 in. h−1) drainage rate.
According to the CN calculations in Sect. 2.4, Hurricane Ida is estimated to have generated an average of 58 mm of runoff over a 3 h period, which corresponds to a runoff rate of approximately 19 mm h−1 (or 0.75 in. h−1). This establishes the necessary rate at which stormwater must be managed to ensure proper drainage. The model's empirical validation is achieved by comparing simulated flooding depths against observed data, yielding root-mean-square errors (RMSEs) of 23, 20, and 24 cm for drain rates of 6, 13, and 19 mm h−1, respectively. Notably, the 13 mm h−1 drain rate (0.5 in. h−1) most accurately reflects the observed flooding, with the least under- and/or overestimation according to the metrics. Further Ida result maps in this study, such as the Ida flood map, flood speed, and the control model to evaluate sensitivity analyses, utilize this drainage rate (13 mm h−1). We address the realism of this best-fit drainage rate in the discussion section below. Incorporating drainage into the model improves the results compared to the baseline case when comparing to the high-water marks (HWMs), particularly for the elevated HWMs that are ponding. The HWMs (in Fig. 7) that remain unchanged with increasing drainage rates are elevated, steeply sloping locations where water flows rapidly and does not accumulate.
3.2 Model results
The simulations provide estimates of peak water depths across the watershed, showing that water depths greater than 1 m are generally aligned along major streets or in isolated confluence areas (Fig. 8). For this study, we created general categories of flooding in addition to the maps of depth and of extent of the flooding. Flooding up to 0.3 m (shallow) typically causes minor inconveniences, such as water accumulation and disruptions to pedestrian and vehicular traffic. Floodwaters ranging from 0.3 to 0.9 m (deep) can interfere with vehicle operation and damage structures, causing moderate damage and inconvenience. In instances where water depths surpass 0.9 m (extreme), there is a substantial risk to both individuals and property, with potential outcomes including the movement of vehicles, mandatory evacuation, and extensive property damage. In the model results, 23 % of the urban area in the watershed experiences water depths greater than 0.05 m (Fig. 8). Within this urban flooded area (water depth > 0.05 m), 18 % is categorized as shallow flood (88 km2), 4 % is deep flood (20 km2), and 0.7 % is extreme flood (3.6 km2). About 3 % of the urban area (14.5 km2) experiences more than 10 h of severe flooding (flood depth > 0.3 m), and 9.4 km2 is flooded for more than 20 h. The severely flooded areas include major streets and low-lying areas. Of the 4621 buildings affected by flooding exceeding 0.3 m, 21 % (970 buildings) experienced flooding greater than 0.9 m.
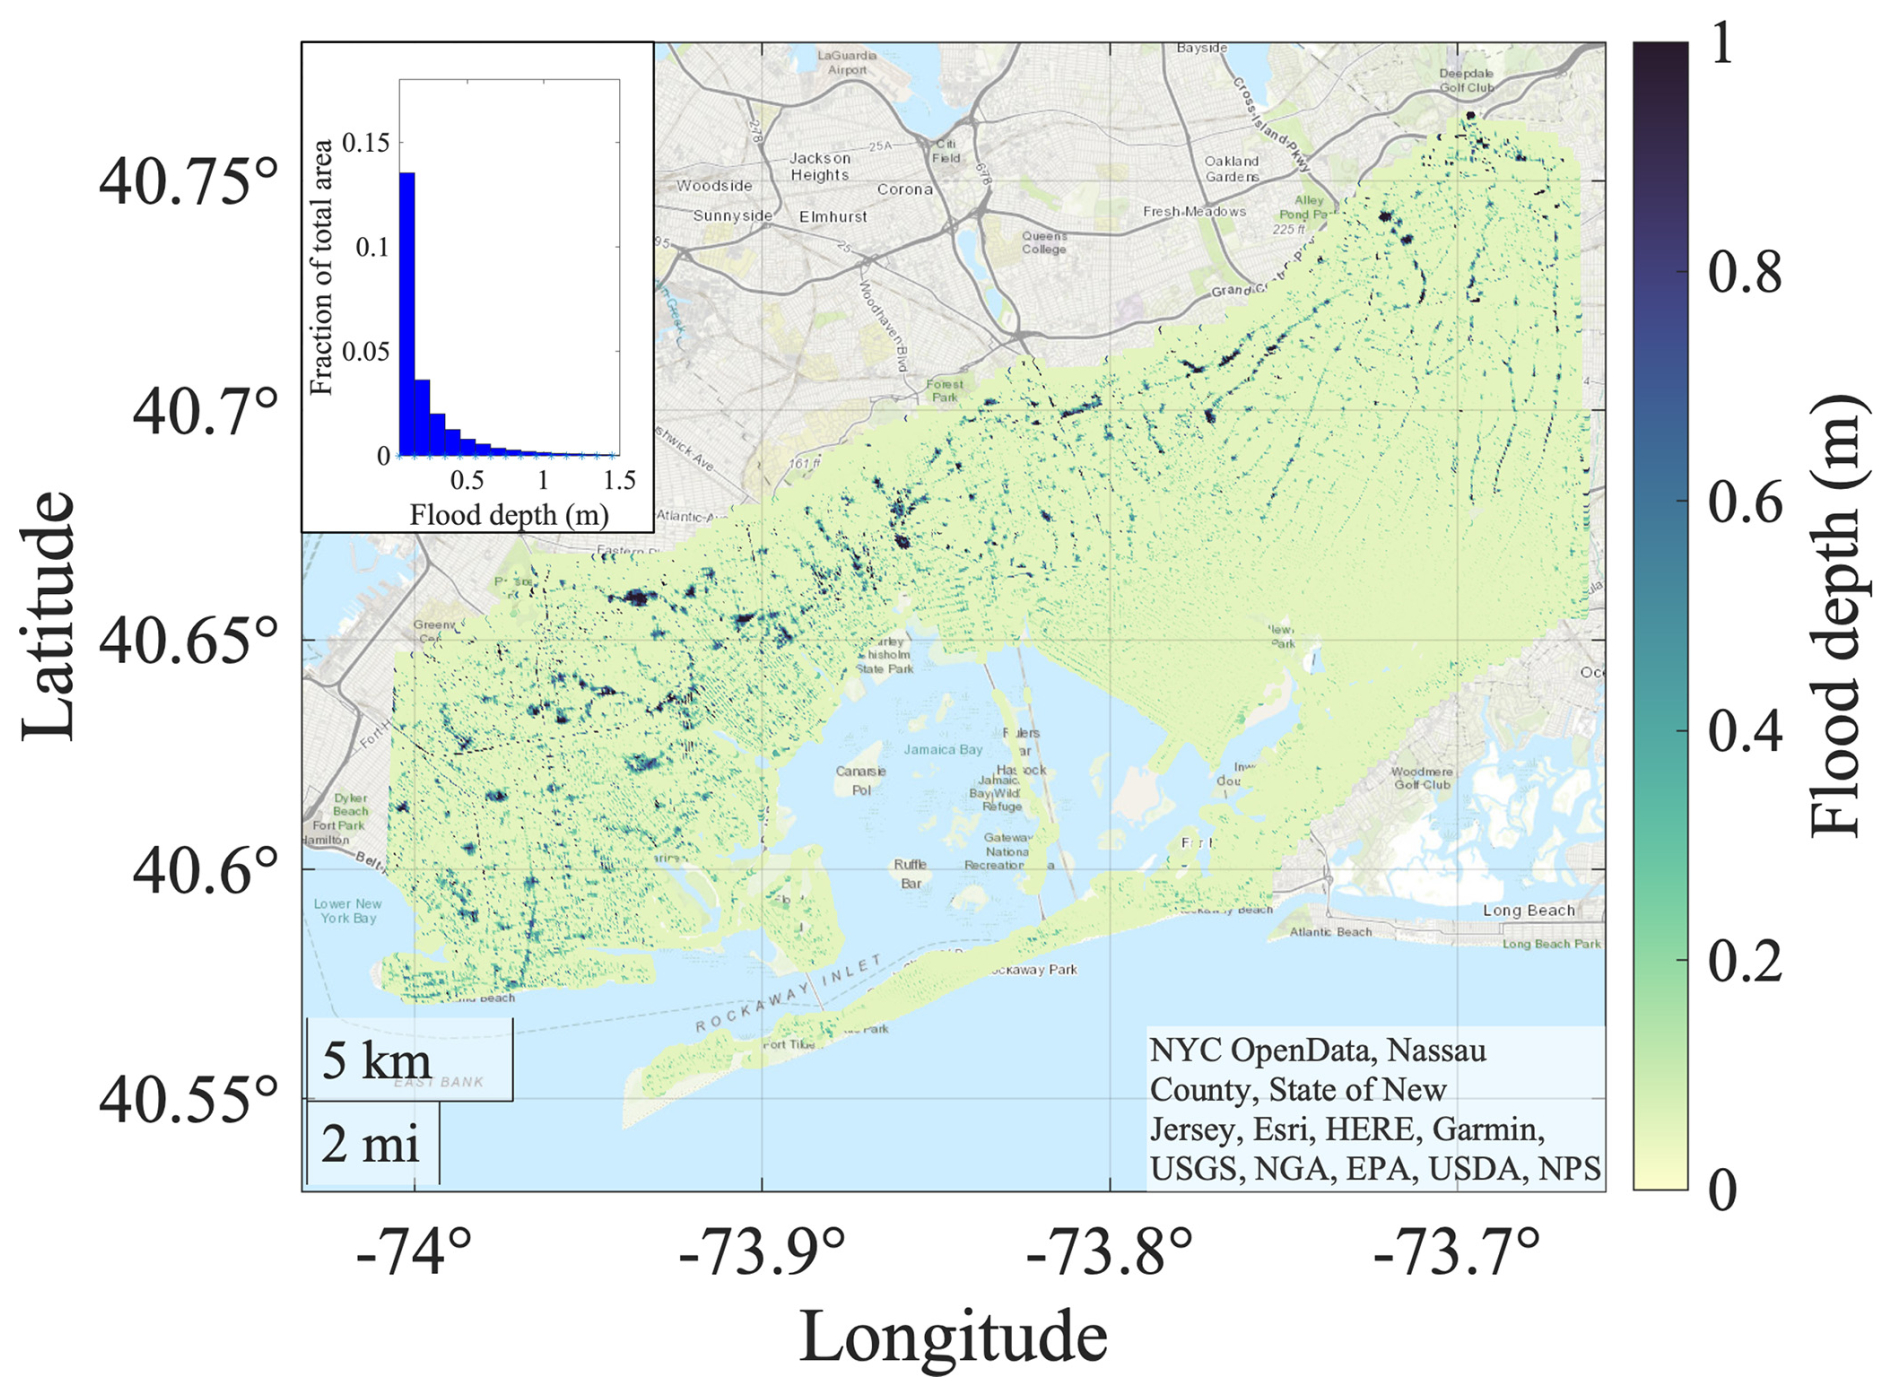
Figure 8Map of modeled flood depths from Ida and the flood histogram (topographic base map from MATLAB, hosted by Esri).
The model results allow for diagnosis of maximum water velocities in flooded areas. The highest speeds, often greater than 1 m s−1, occurred primarily in steep areas and along streets (Fig. 9). High-speed zones (> 1 m s−1) affect 0.56 % of the urbanized domain, equivalent to approximately 2.7 km2, while moderate water velocities (0.5–1 m s−1) account for 1.75 %, or roughly 8.5 km2, and lower-speed regions (< 0.5 m s−1) constitute the remaining 97.7 %, which translates to approximately 472 km2. The maximum flood speed across the domain during Ida reached 3.6 m s−1. These estimates of water speed can help identify the potential zones to delineate flood risk and inform mitigation strategies. High-speed areas pose substantial structural and safety challenges, moderate velocities require caution for potential impacts on transport and infrastructure, and low velocities primarily pose concerns related to static inundation of structures and streets. However, it is important to acknowledge that our velocity data have limitations, as they do not account for buildings, cars, or other roughness elements.
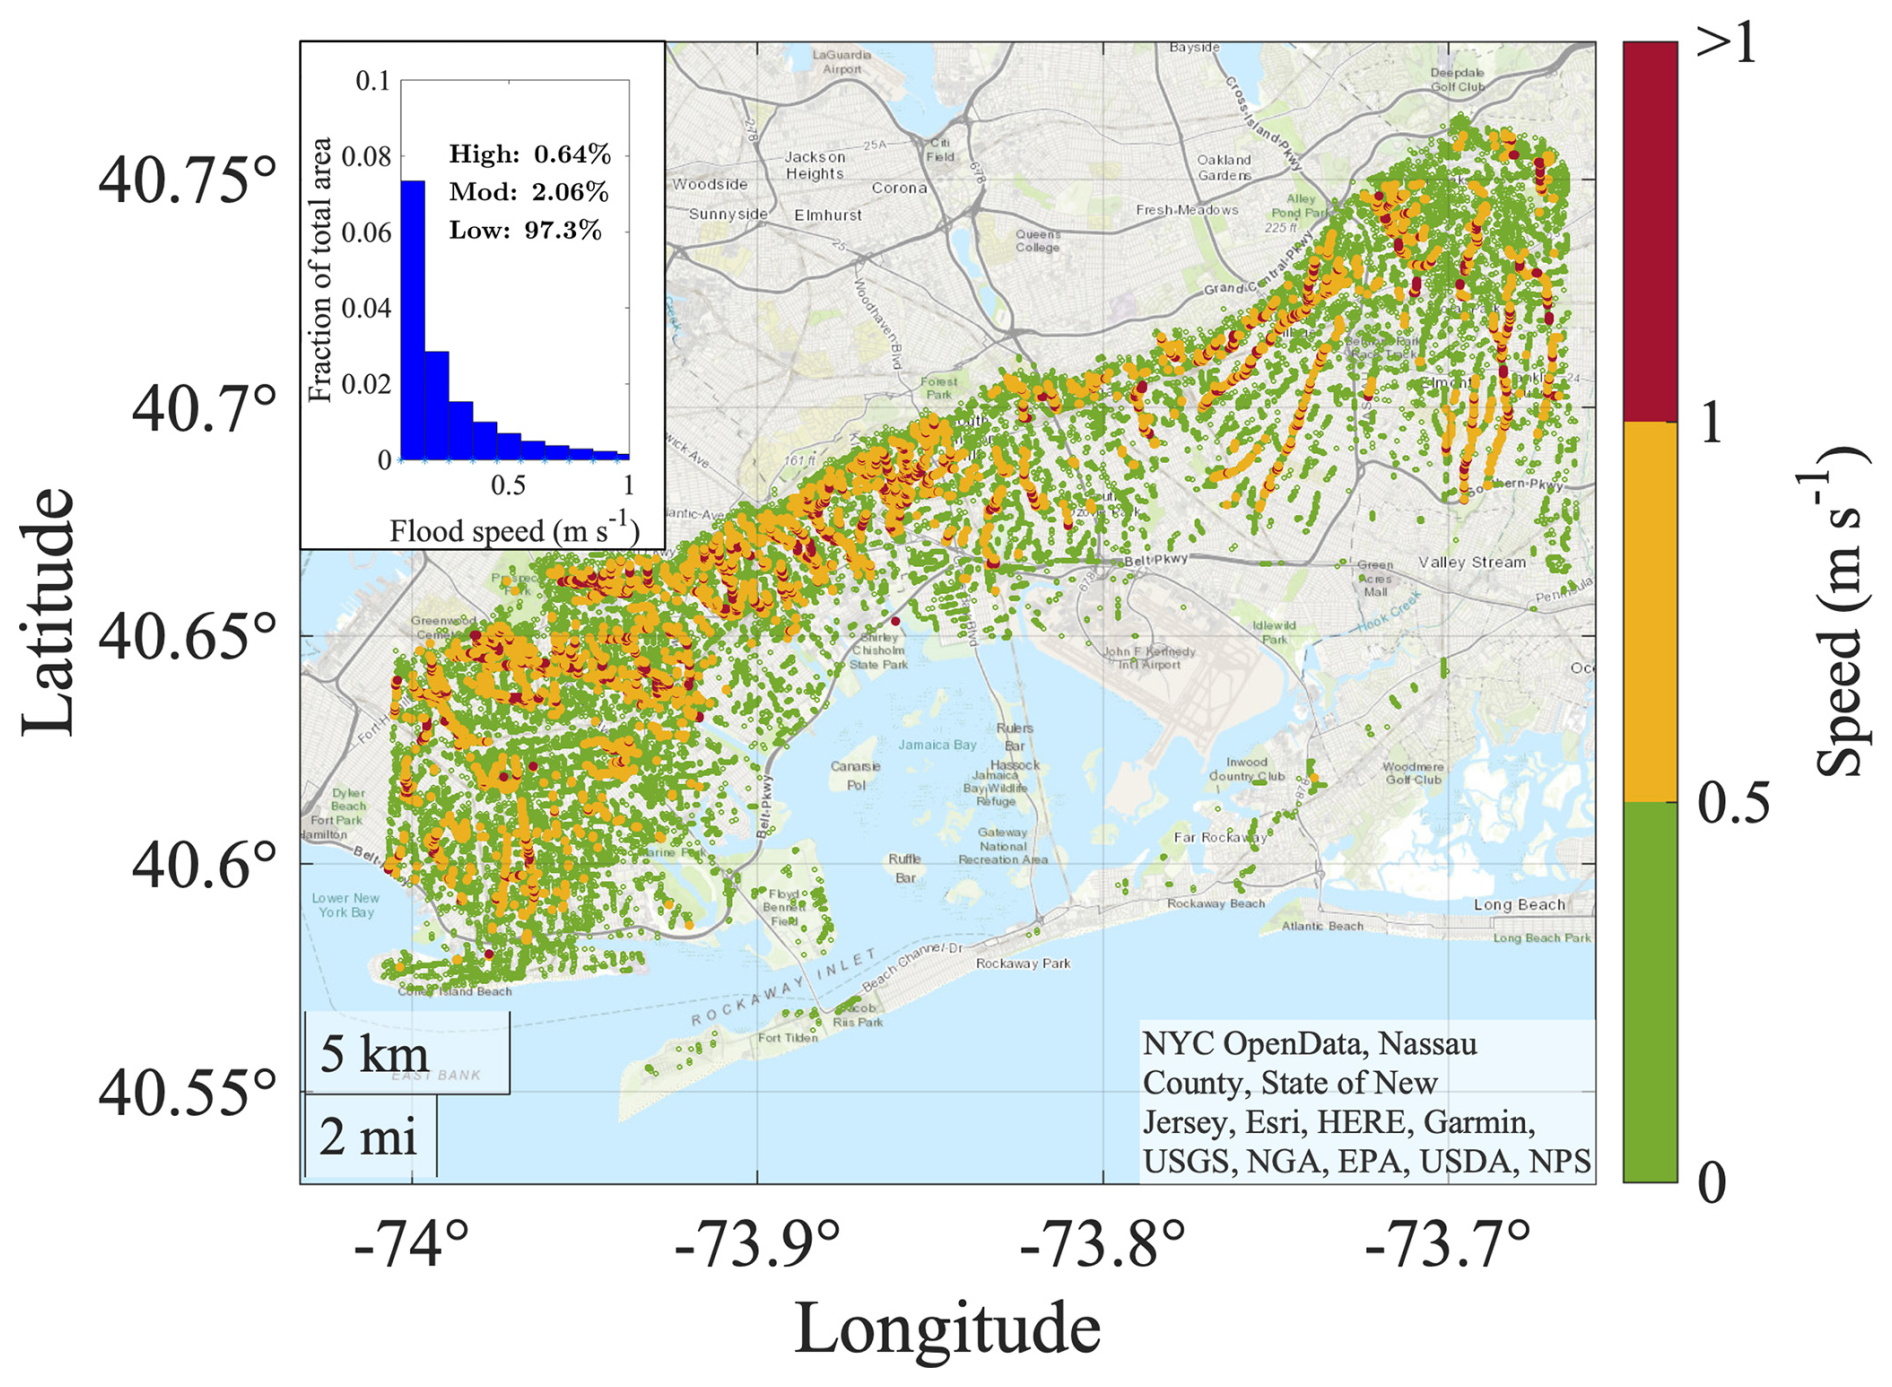
Figure 9Flood speeds greater than 0.05 m s−1 and the flood speed histogram (high, mod, and low stand for high speed, moderate speed, and low speed, respectively). Topographic base map from MATLAB, hosted by Esri.
3.3 Sensitivity analysis results
3.3.1 Spatial shifting of the storm
The sensitivity testing demonstrates that large differences in flooding result from relatively small changes in the storm track. Shifting the rainband eastward shows that the flooded area could increase by 62 %, from 112 to 181 km2 in total. Moreover, the areas classified as extreme flood (> 0.9 m) and deep flood (0.3–0.9 m) increase by 257 % (1.9 km2) and 141 % (5.9 km2), respectively. Maximum flood depth rises by 70 %, from 5.6 to 9.5 m, and the area with high water velocities (> 1 m s−1) increases by 257 % (6.95 km2) (Fig. 10a). In this scenario, the total number of buildings experiencing flooding over 0.3 and 0.9 m increases by 28 % and 46 %, reaching 5907 and 1412 buildings, respectively. Adjusting the rainband northward by 48 km and simulating the best-case scenario, there is a 73 % reduction in predicted urban flooded area, but importantly, this does not eliminate the flooding in the watershed. Although the flood map result shows a reduction in maximum flood depth in this scenario (from 5.6 to 3.8 m), we still see 30 km2 of the urban watershed classified as shallow flood (Fig. 10b). In addition, further investigation of the whole region (not just the urban area) shows that there are some areas that are always flooded, such as marshes and the edges of the bay. A comparison between the worst-case scenario, Ida rainfall, and the best-case scenario shows that as the storm gets milder, the flooded area becomes shallower, with significantly less deep and extreme flooding.
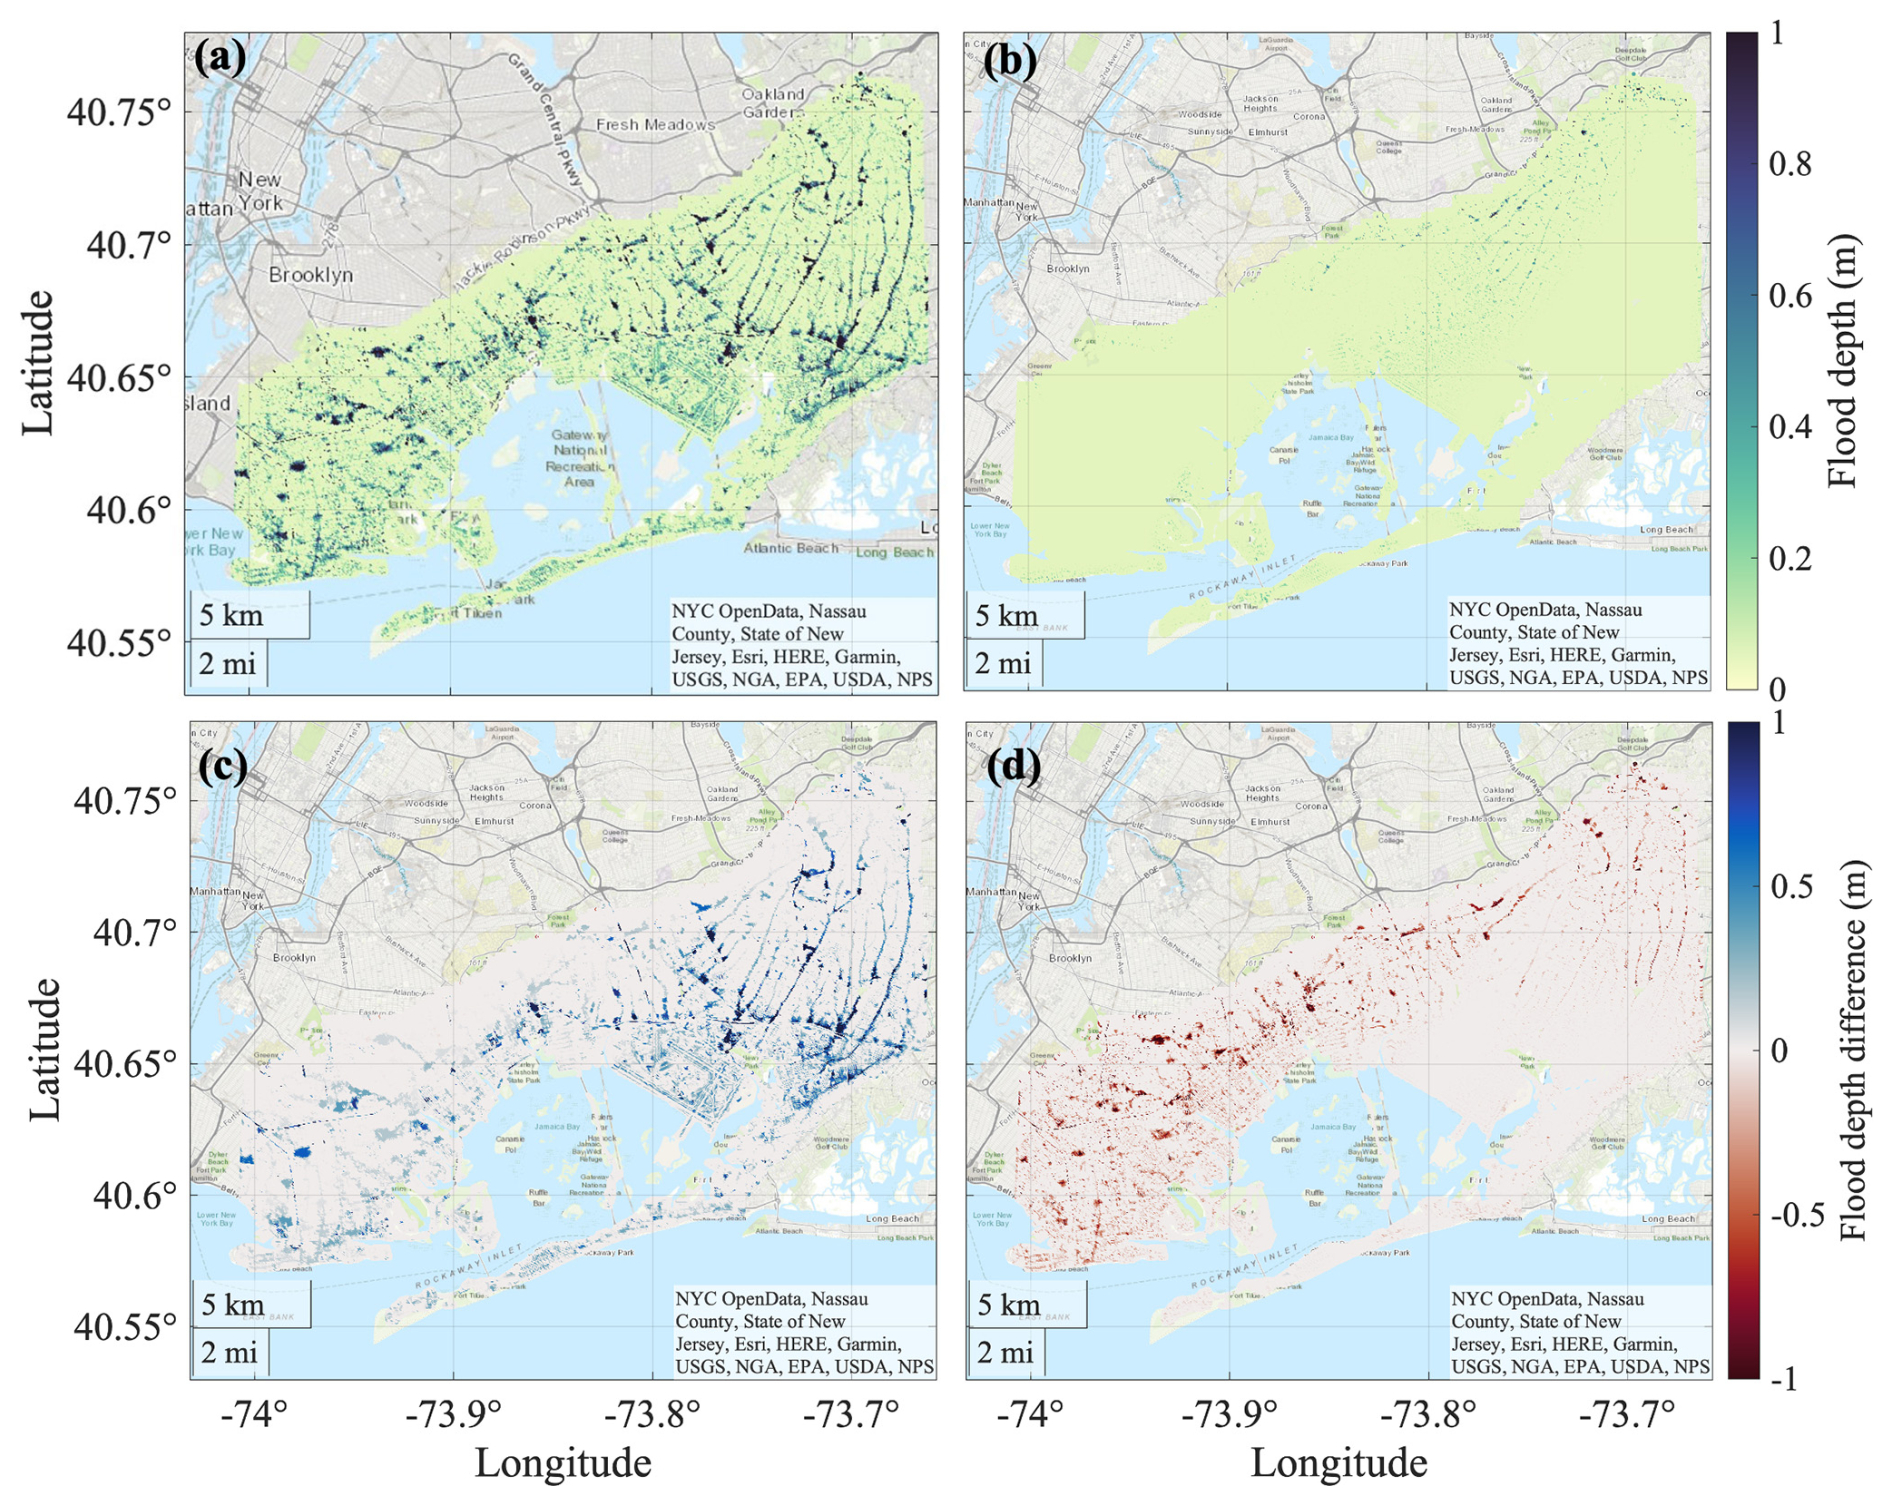
Figure 10Flood map for the sensitivity analysis for rain shifted eastward (a) and northward (b), as well as the flood depth difference in comparison with Ida (flood depth minus control, shown in Fig. 11) for the rainband shifted eastward (c) and northward (d) (topographic base map from MATLAB, hosted by Esri).
3.3.2 Temporal shift in the storm
Model scenarios with temporal shifts in the storm are examined to investigate the potential amplification of flood severity due to the compounding of rainfall, storm surge, and tides. The results indicate that the spatial extent of the inundation mostly remains the same as in the baseline simulation (Ida). However, looking more closely at the coastal flood plain and comparing the water level change from Ida and the two temporal shift scenarios (as explained in Sect. 2.5.) reveal evidence of compounding in the second scenario but not the first. When the peak of Ida's rainfall coincides with the storm surge and the highest tide of the 24 h period, the flooded urban area increases by 1.3 % (approximately 1.4 km2). Of this increase, 20 % has deeply flooded areas. This additional flooding predominantly affects coastal areas such as the east and west sides of Jamaica Bay and Hamilton Beach (Fig. 11). In Hamilton Beach, the second temporal shift scenario (Fig. 11b) results in flood depths reaching 30–40 cm within the neighborhood. Figure 11b displays model grid cells where the additional flood depth with the temporal shift surpasses 5 cm. These findings underscore the model's utility in representing compound flooding events, such as for hurricanes that bring both extreme rainfall and storm surge (Chen et al., 2024).
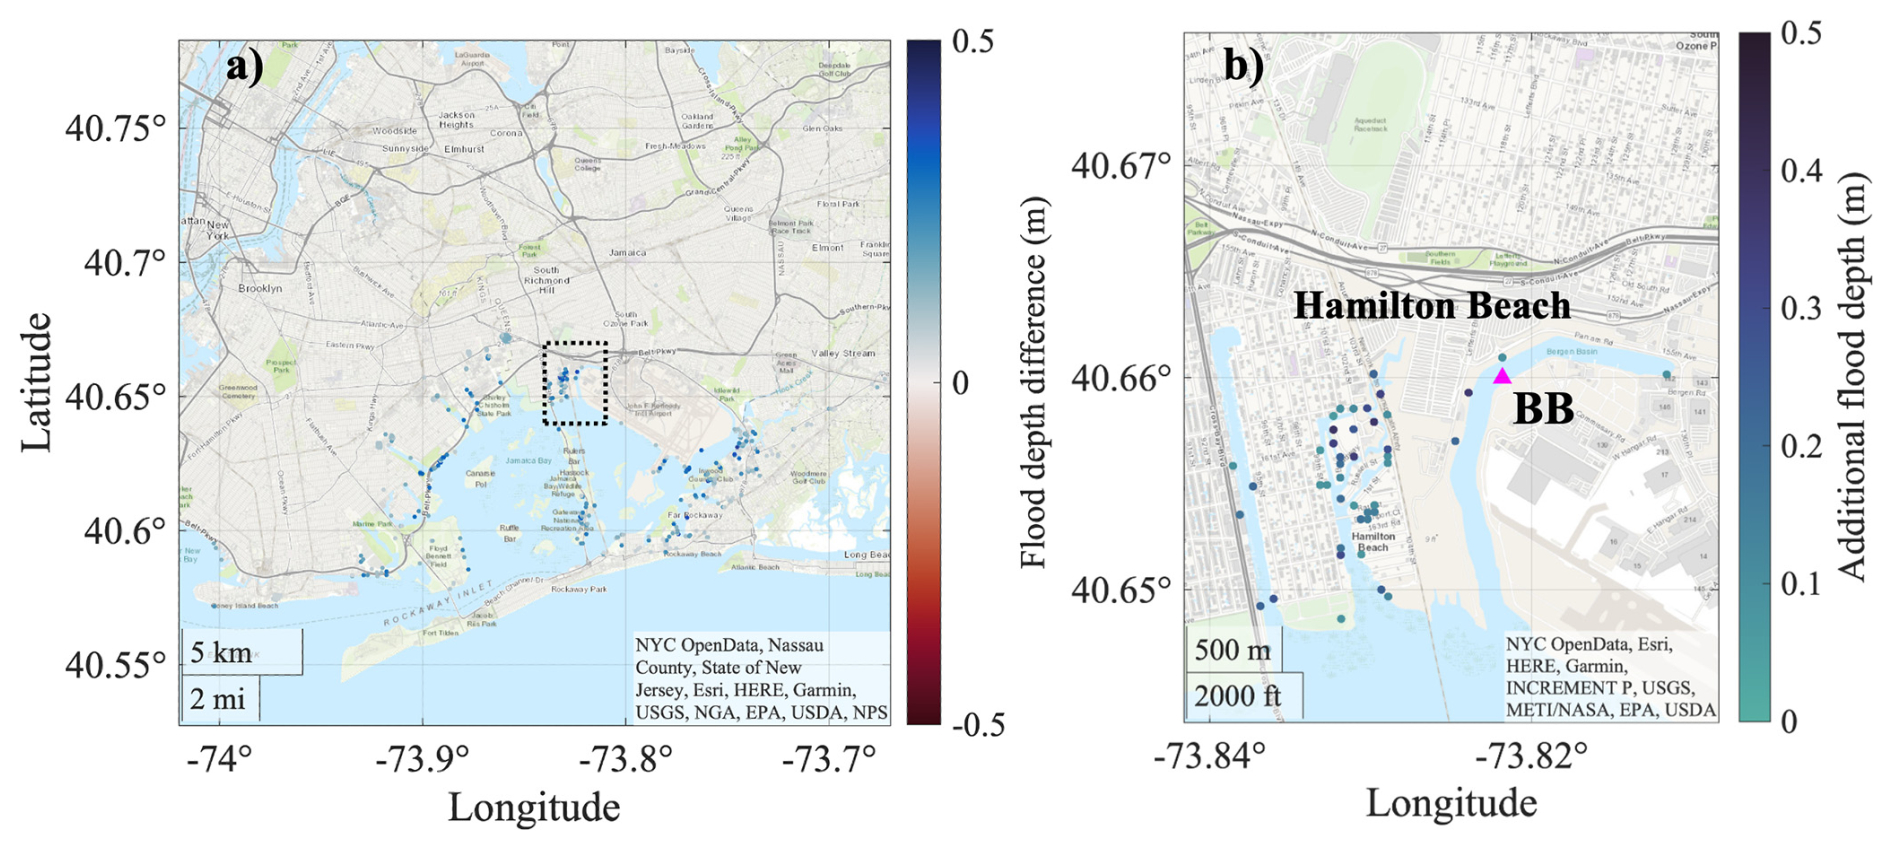
Figure 11(a) Flood depth difference map for when the timing of Ida's rainfall is aligned with the highest tide of the 24 h period (temporal shift scenario2) in comparison with Ida (differences exceeding 5 cm are highlighted). (b) Model grid cells that exhibit additional flood depth (more than 5 cm) around the Hamilton Beach neighborhood (dashed black rectangle in panel a) due to compounding. The magenta triangle labeled BB marks the Bergen Basin tide gauge location (topographic base map from MATLAB, hosted by Esri).
This study creates the first spatially continuous flood map of Ida, which can help us identify and understand Ida's effects far beyond the scattered high-water-mark data. While static or bathtub mapping can in some cases be effective for coastal floods (City of New York, Department of Small Business Services (SBS) New York, 2015), the bathtub mapping effort for the pluvial flooding of Ida was limited to areas within only 250 m of high-water marks rather than a spatially continuous map (Capurso et al., 2023). The absence of flood maps for events like Ida highlights the fact that accurate pluvial flood modeling and mapping technologies are not yet broadly available. As a result, our modeling, despite its simplifications, holds significant potential to inform emergency management and mitigation efforts.
To fully comprehend urban pluvial flood risk, it is important to understand how every part of a city responds to extreme rainfall, yet only certain areas of NYC experienced rainfall rates above 50 mm h−1 during Ida. The spatial shifts (Fig. 3) exploring both the worst-case scenario and the best-case scenario depict the range of flood hazards in the Jamaica Bay watershed. Our findings indicate that even a small perturbation in Ida's storm track would have caused even more severe flooding, affecting both the extent and depth of inundation. Furthermore, even during the best-case storm scenario, the area still experiences widespread shallow flooding.
Additionally, understanding whether, where, and how pluvial and coastal flood drivers interact is vital to assessing a coastal city's flood risk. Compound (pluvial–coastal) flooding remains poorly understood, including aspects such as whether compounding causes an increase in flood area, an increase in flood depth, or in both. The temporal shifting of the storm to synchronize the most intense rainfall and storm surge with the high tide shows greater depths of flooding of coastal neighborhoods and a greater extent of inundation (an increase of 1.3 km2). This indicates that compound flooding can cause greater danger in coastal flood zones during an extreme pluvial event. The greater footprint of compound flooding could negatively influence emergency management activities (e.g., by blocking roadways in pluvially affected flood areas). These results illustrate the ability of COAWST to capture compound flood effects and show its utility for future modeling of a wider range of coastal-pluvial forcings to improve our understanding of coastal urban flood hazard.
Our model's ability to represent spatial variations in flood depth with improved accuracy (Fig. 8) when using a 13 mm h−1 drain rate, relative to the simulation with no drainage (Fig. 6), underscores the importance of integrating drainage considerations into urban hydrodynamic simulations. Detailed hydrologic and hydraulic models that aim to fully represent urban stormwater systems and coastal water level boundary conditions are under development. However, the data required to build and validate these models are often unavailable, and such models are rarely applied (Rosenzweig et al., 2021). In their place, new, simplified models that represent the Earth system are being utilized for city-scale (Sebastian et al., 2021) and national-scale compound flood modeling (Bates et al., 2021). The approach of calibrating the model to a constant drain rate used in the present study can be of use in these simplified modeling efforts.
According to the curve number method (Eq. 1), the runoff rate of Ida that needs to be managed is 19 mm h−1. The calibrated drain rate of 13 mm h−1 from our model is less than the calculated runoff rate. Since our model and the curve number method are based on hourly rainfall data, we can compare them with each other, and this comparison highlights the limitations in the stormwater system, as the calculated runoff rate exceeds the model's calibrated drain rate. However, we should consider that it is likely that brief, intense rain bursts rather than the hourly MRMS rain rates that were used in this study caused most of the flooding by overwhelming the stormwater system. This could be a reason that the calibrated drainage rate in our model (13 mm h−1) is less than the stormwater system capacity of the current design, 44 mm h−1, although certain areas do not have modernized storm sewer infrastructure (NYC-MOCEJ, 2023). Also, stormwater systems often become blocked in heavy rain events due to garbage or vegetation. As a result, our modeling approach may be more applicable to extreme rain events, although it likely also has declining accuracy or needs new tuning for weaker rain events. Our model results suggest that the deepest flooding occurs in major streets, turning them into river-like pathways. However, the assumption of spatially uniform drain rates may lead to misestimation of the spatial distribution of flood depths. Although major streets may possess better stormwater infrastructure than minor streets, our final high-water-mark (HWM) results indicate that the model maintains good accuracy.
The improved COAWST model has the potential to more comprehensively simulate the coastal system and factors contributing to flooding, relative to typical urban hydraulic–hydrologic models. The result is a coastal system model capable of simulating tides and storm surge, rainfall, wind wave overtopping, erosion, and air–sea–wave interactions. Research made possible by this new model includes infrastructure adaptation planning for urban coastal pluvial flood studies and analyses of rain influence on estuary hydrodynamics, and it has the potential for future studies on coupled pluvial–coastal flood-induced sediment transport and erosion. This capability is not readily available in many existing models, which often require separate or one-way coupled models to achieve similar results.
The model also has the potential to improve flood hazard and adaptation assessment. Many recent studies have assessed the joint probability of rain and surge for an urban environment (e.g., Kim et al., 2022; Zellou and Rahali, 2019) yet very few have modeled flooding for a range of these scenarios. Our sensitivity analyses, incorporating the potential variability in storm tracks and storm timing, demonstrate the promise of the model in capturing a wide range of flood forcing scenarios and show the importance of storm track variability and timing for flooding.
Despite these advancements, this study is not without limitations, which are mentioned in Sect. 2.7. The model simplifications could be modified in future work to capture a more complex and thorough evaluation of urban flooding. For example, future work could experiment with applying spatially varied drain rates based on the stormwater system data and land use type data. The empirical validation could also benefit from more extensive HWMs or spatial maps of observed flooding to more fully evaluate the model's reliability. These future improvements are possible but are large undertakings, as the detailed information on stormwater pipe systems are not easy to gather and include, and the data for validation from this storm are limited. However, a concurrent rapid increase in urban flood observations (Gold et al., 2023; Mydlarz et al., 2024) could be a remedy for this data shortage, which could help for future flood events and for more detailed model development. Our research retrospectively analyzes and models Ida using the best estimate of rain from MRMS. However, uncertainties in precipitation products can affect the accuracy of our resulting flood simulation, especially at fine temporal and spatial resolutions. Previous studies (e.g., Xu et al., 2025) have shown that precipitation data uncertainties, stemming from differences in spatial resolution and input sources, can lead to substantial variations in the simulated flood extent. Additionally, Feng et al. (2024) demonstrated that using multiple atmospheric forcing datasets helps to better capture the uncertainty in hydrological simulations. Future research could explore the sensitivity of our findings to different precipitation datasets, following similar ensemble-based approaches.
In this research, a coastal system model (COAWST) is enhanced to capture the volumetric effect of rainfall on the ocean and floodplains. A simplified drain rate capability is added to account for the stormwater system and effects of infiltration on flooding. These improvements are applied in a simulation of flooding by post-tropical Cyclone Ida in the Jamaica Bay watershed of New York City. The calibration and resulting accuracy of the model compared with empirical high-water marks (RMS error of 20 cm) and maximum water levels in the estuary illustrate the model's predictive capabilities yet suggest a need for improvements in modeling detail or sophistication to capture a wider range of rain intensity events.
Outcomes of the research include a spatially continuous flood map of Ida and improvements to our understanding of the flood hazards posed by extreme rain events, as well as the development of model capable of investigating compound (pluvial–coastal) events for the Jamaica Bay area. The sensitivity analysis depicts the flood hazard associated with changes in the storm track and timing for Jamaica Bay. It reveals that flooding from Ida could have been worse due to shifts in the location of the most intense rain or co-occurrence with storm surge and high tides. Capturing the compounding effect is particularly important, given that compound floods are expected to become more common and important as sea levels continue to rise (e.g., Mita et al., 2023). Effective translation of this scientific knowledge into coastal and urban planning is paramount, requiring interdisciplinary efforts and long-term studies of the risks of future climate challenges.
The improvements to COAWST are embedded in v3.8, which is available for download at https://code.usgs.gov/coawstmodel/COAWST (USGS, 2025). The model setup files, flood depth dataset, and Bergen Basin tide gauge dataset are published on Mendeley (https://doi.org/10.17632/3tz69prrwv.1, Kasaei and Orton, 2025). The final flood map for Ida is published on Mendeley (https://doi.org/10.17632/hs2zt6ngwd.1, Kasaei et al., 2024) as a collaboration with NYC Emergency Management. Meteorological forcing for the Jamaica Bay model was provided by the WRF model, North American Mesoscale (NAM) product; the data can be accessed at https://www.ncei.noaa.gov/thredds/catalog/model-nam218/202108/20210828/catalog.html (NOAA National Centers for Environmental Information, 2023). USGS high-water-mark data points can be accessed at https://stn.wim.usgs.gov/FEV/#2021Ida (U.S. Geological Survey, 2021). Community Flood Watch HWM data points can be accessed at https://mycoast.org/search-reports?state=ny&fwp_categories=highwater (MyCoast New York, 2023). Tide gauge data from the USGS can be accessed at https://maps.waterdata.usgs.gov/mapper/index.html (U.S. Geological Survey, 2019).
The supplement related to this article is available online at https://doi.org/10.5194/hess-29-2043-2025-supplement.
The paper and the experiments were conceptualized by SK, PMO, and JCW; the parent (regional model) simulation was performed by DKR and Jamaica Bay simulations by SK. The COAWST model improvements were done by JCW. Statistical analyses were done by SK with help from PMO. The original draft was written by SK with help from PMO; further review was done by PMO, DKR, and JCW; and the edits were done by SK with help from PMO. Project administration was performed by JCW and PMO, and funding acquisition was done by JCW and PMO.
The contact author has declared that none of the authors has any competing interests.
Any use of trade, firm, or product names is for descriptive purposes only and does not imply endorsement by the US government. Publisher’s note: Copernicus Publications remains neutral with regard to jurisdictional claims made in the text, published maps, institutional affiliations, or any other geographical representation in this paper. While Copernicus Publications makes every effort to include appropriate place names, the final responsibility lies with the authors.
We would like to acknowledge the NYC Emergency Management GIS team, who helped generate the high-resolution Ida flood map and building exposure numbers.
This research has been supported by the US Geological Survey through the Extending Government Funding and Delivering Emergency Assistance Act (public law 117-43, award no. G22AC00399-00) under the North Atlantic Coast Co-operative Ecosystems Study Unit (NAC-CESU).
This paper was edited by Elena Toth and reviewed by three anonymous referees.
Bao, D., Xue, Z. G., Warner, J. C., Moulton, M., Yin, D., Hegermiller, C. A., Zambon, J. B., and He, R.: A numerical investigation of Hurricane Florence-induced compound flooding in the Cape Fear Estuary using a dynamically coupled hydrological-ocean model, J. Adv. Model. Earth Sy., 14, e2022MS003131, https://doi.org/10.1029/2022MS003131, 2022.
Bates, P. D., Quinn, N., Sampson, C., Smith, A., Wing, O., Sosa, J., Savage, J., Olcese, G., Neal, J., and Schumann, G.: Combined modeling of US fluvial, pluvial, and coastal flood hazard under current and future climates, Water Resour. Res., 57, e2020WR028673, https://doi.org/10.1029/2020WR028673, 2021.
Beven, J., Hagen, A., and Berg, R.: Tropical Cyclone Report Hurricane Ida, National Hurricane Center, https://www.nhc.noaa.gov/data/tcr/AL092021_Ida.pdf (last access: 1 August 2023), 2022.
Bulti, D. T. and Abebe, B. G.: A review of flood modeling methods for urban pluvial flood application, Modeling Earth Systems and Environment, 6, 1293–1302, https://doi.org/10.1007/s40808-020-00803-z, 2020.
Capurso, W. D., Simonson, A., Noll, M. L., Busciolano, R., and Finkelstein, J.: High-Water Marks in the Five Boroughs of New York City from Flash Flooding Caused by the Remnants of Hurricane Ida, September 1, 2021,U.S. Geological Survey, [data set], https://doi.org/10.5066/P9OMBJPQ, 2023.
Center Environmental Modeling: North American Mesoscale (NAM) analysis and forecast system characteristics, Environmental Modeling Center, https://www.ncei.noaa.gov/products/weather-climate-models/north-american-mesoscale (last access: 15 August 2023), 2017.
Chassignet, E. P., Arango, H., Dietrich, D., Ezer, T., Ghil, M., Haidvogel, D. B., Ma, C.-C., Mehra, A., Paiva, A. M., and Sirkes, Z.: DAMEE-NAB: the base experiments, Dynam. Atmos. Oceans, 32, 155–183, 2000.
Chen, Z., Orton, P., Booth, J., Wahl, T., DeGaetano, A., Kaatz, J., and Horton, R.: Influence of Storm Type on Compound Flood Hazard of a Mid-Latitude Coastal-Urban Environment, Hydrol. Earth Syst. Sci. Discuss. [preprint], https://doi.org/10.5194/hess-2024-135, in review, 2024.
City of New York, Department of Small Business Services (SBS) New York: Sandy Inundation Zone (11/12/2015), City of New York, Department of Small Business Services (SBS) New York [data set], https://data.cityofnewyork.us/Environment/Sandy-Inundation-Zone/uyj8-7rv5 (last access: 1 August 2023), 2015.
Cooperative Institute for Research in Environmental Sciences (CIRES) at the University of Colorado, Boulder: Continuously Updated Digital Elevation Model (CUDEM) – Arc-Second Resolution Bathymetric-Topographic Tiles, NOAA National Centers for Environmental Information [data set], https://doi.org/10.25921/0mpp-h192, 2014a.
Cooperative Institute for Research in Environmental Sciences (CIRES) at the University of Colorado, Boulder: Continuously Updated Digital Elevation Model (CUDEM) – Arc-Second Resolution Bathymetric-Topographic Tiles. NOAA National Centers for Environmental Information [data set], https://doi.org/10.25921/ds9v-ky35, 2014b.
Cornell University, Northeast Regional Climate Center (NRCC): New York State IDF Projections, https://ny-idf-projections.nrcc.cornell.edu/, last access: 15 August 2024.
Cronshey, R.: Urban hydrology for small watersheds, 55, US Department of Agriculture, Soil Conservation Service, Engineering Division, https://www.nrc.gov/docs/ML1421/ML14219A437.pdf (last access: 1 January 2024), 1986.
Department of City Planning (DCP): Dwn-Pluto and MapPluto, https://www.nyc.gov/site/planning/data-maps/open-data/dwn-pluto-mappluto.page, last access: 15 August 2024.
Dresback, K. M., Szpilka, C. M., Kolar, R. L., Moghimi, S., and Myers, E. P.: Development and validation of accumulation term (Distributed and/or Point Source) in a Finite Element Hydrodynamic model, J. Mar. Sci. Eng., 11, 248, https://doi.org/10.3390/jmse11020248, 2023.
FEMA: Reducing the Effects of Urban Flooding in New York City: Hurricane Ida NYC MAT Technical Report 3, Federal Emergency Management Agency, 2–3, 2023.
Feng, D., Tan, Z., Engwirda, D., Wolfe, J. D., Xu, D., Liao, C., Bisht, G., Benedict, J. J., Zhou, T., and Li, H. Y.: Simulation of compound flooding using river-ocean two-way coupled E3SM ensemble on variable-resolution meshes, J. Adv. Model. Earth Sy., 16, e2023MS004054, https://doi.org/10.1029/2023MS004054, 2024.
Finkelstein, J., Gazoorian, C. L., and Capurso, W. D.: Geospatial Datasets of Water Surface Elevation and Water Depth in New York City, NY Associated with the Remnants of Hurricane Ida – September 1, 2021, U.S. Geological Survey (USGS) [data set], https://doi.org/10.5066/P9JF4OWB, 2023.
Flood, R.: High-Resolution bathymetric and backscatter mapping in Jamaica Bay, Final Report to the National Park Service, State University of New York at Stony Brook, Stony Brook, NY, 2011.
Genest, C. and Favre, A.-C.: Everything you always wanted to know about copula modeling but were afraid to ask, J. Hydrol. Eng., 12, 347–368, 2007.
Gold, A., Anarde, K., Grimley, L., Neve, R., Srebnik, E. R., Thelen, T., Whipple, A., and Hino, M.: Data from the drain: a sensor framework that captures multiple drivers of chronic coastal floods, Water Resour. Res., 59, e2022WR032392, https://doi.org/10.1029/2022WR032392, 2023.
Green, J., Haigh, I. D., Quinn, N., Neal, J., Wahl, T., Wood, M., Eilander, D., de Ruiter, M., Ward, P., and Camus, P.: A comprehensive review of coastal compound flooding literature, arXiv [preprint], https://doi.org/10.48550/arXiv.2404.01321, 2024.
Haidvogel, D. B., Arango, H. G., Hedstrom, K., Beckmann, A., Malanotte-Rizzoli, P., and Shchepetkin, A. F.: Model evaluation experiments in the North Atlantic Basin: simulations in nonlinear terrain-following coordinates, Dynam. Atmos. Oceans, 32, 239–281, 2000.
Haidvogel, D. B., Arango, H., Budgell, W. P., Cornuelle, B. D., Curchitser, E., Di Lorenzo, E., Fennel, K., Geyer, W. R., Hermann, A. J., and Lanerolle, L.: Ocean forecasting in terrain-following coordinates: Formulation and skill assessment of the Regional Ocean Modeling System, J. Comput. Phys., 227, 3595–3624, 2008.
Jane, R., Wahl, T., Santos, V. M., Misra, S. K., and White, K. D.: Assessing the potential for compound storm surge and extreme river discharge events at the catchment scale with statistical models: sensitivity analysis and recommendations for best practice, J. Hydrol. Eng., 27, 04022001, https://doi.org/10.1061/(ASCE)HE.1943-5584.0002154, 2022.
Kasaei, S. and Orton, P.: Model data, Mendeley [data set], https://doi.org/10.17632/3tz69prrwv.1, 2025.
Kasaei, S., Orton, P., Ralston, D., and Warner, J.: Post-tropical cyclone Ida (2021) flood map for New York City's Jamaica Bay watershed, Mendeley [data set], https://doi.org/10.17632/hs2zt6ngwd.1, 2024.
Kim, H., Villarini, G., Jane, R., Wahl, T., Misra, S., and Michalek, A.: On the generation of high-resolution design events capturing the joint occurrence of rainfall and storm surge in coastal basins, Front. Hydrol., 2022, 224-002, https://ui.adsabs.harvard.edu/abs/2022frhy.conf22402K (last access: 15 April 2025), 2022.
Marchesiello, P., McWilliams, J. C., and Shchepetkin, A.: Open boundary conditions for long-term integration of regional oceanic models, Ocean Model., 3, 1–20, 2001.
Mattocks, C. and Forbes, C.: A real-time, event-triggered storm surge forecasting system for the state of North Carolina, Ocean Model., 25, 95–119, https://doi.org/10.1016/j.ocemod.2008.06.008, 2008.
Mita, K. S., Orton, P., Montalto, F., Saleh, F., and Rockwell, J.: Sea Level Rise-Induced Transition from Rare Fluvial Extremes to Chronic and Compound Floods, Water, 15, 2671, https://doi.org/10.3390/w15142671, 2023.
Mukai, A. Y., Westerink, J. J., Luettich, R. A., and Mark, D. J.: Eastcoast 2001, a tidal constituent database for the western North Atlantic, Gulf of Mexico, and Caribbean Sea, https://apps.dtic.mil/sti/tr/pdf/ADA408733.pdf (last access: 10 September 2023), 2002.
MyCoast New York: High Water Reports, MyCoast [data set], https://mycoast.org/search-reports?state=ny&fwp_categories=highwater, last access: 1 August 2023.
Mydlarz, C., Sai Venkat Challagonda, P., Steers, B., Rucker, J., Brain, T., Branco, B., Burnett, H. E., Kaur, A., Fischman, R., and Graziano, K.: FloodNet: Low-Cost Ultrasonic Sensors for Real-Time Measurement of Hyperlocal, Street-Level Floods in New York City, Water Resour. Res., 60, e2023WR036806, https://doi.org/10.1029/2023WR036806, 2024.
Nash, J. E. and Sutcliffe, J. V.: River flow forecasting through conceptual models part I – A discussion of principles, J. Hydrol., 10, 282–290, https://doi.org/10.1016/0022-1694(70)90255-6, 1970.
National Severe Storms Laboratory: Warn-on-Forecast: Tornado Outbreak & Historic Flash Flood with Post-Tropical Cyclone Ida, 1–2 September, 2021, https://www.nssl.noaa.gov/projects/wof/casestudies/hurricane-ida-sep2021/ (last access: 15 August 2024), 2021.
New York City Government: Hurricane Ida – Community Development Block Grant Disaster Recovery: https://www.nyc.gov/site/cdbgdr/hurricane-ida/hurricane-ida.page, last access: 10 August 2024.
NOAA National Centers for Environmental Information: North American Mesoscale (NAM) Analysis Data, NOAA NCEI [data set], https://www.ncei.noaa.gov/thredds/catalog/model-nam218/202108/20210828/catalog.html (last access: 1 August 2023), 2023.
National Oceanic and Atmospheric Administration: Coastal Change Analysis Program (C-CAP) Regional Land Cover, National Oceanic and Atmospheric Administration [data set], https://coast.noaa.gov/digitalcoast/data/ccapregional.html (last access: 15 August 2023), 2016.
National Oceanic and Atmospheric Administration: What percentage of the American population lives near the coast?: https://oceanservice.noaa.gov/facts/population.html (last access: 2 June 2024), 2018.
National Weather Service: Precipitation Frequency Data Server (PFDS), https://hdsc.nws.noaa.gov/pfds/pfds_gis.html, last access: 10 August 2024.
NYC-DEP: Jamaica Bay Watershed Protection Plan Update, NYC Department of Environmental Protection, https://a860-gpp.nyc.gov/concern/parent/tb09j798b/file_sets/pz50gz44d (last access: 30 August 2023), 2018.
NYC-MOCEJ: New York City Stormwater Resiliency Plan, Report, NYC Department of Environmental Protection, https://www.nyc.gov/assets/orr/pdf/publications/stormwater-resiliency-plan.pdf (last access: 1 December 2023), 2023.
Orton, P., Georgas, N., Blumberg, A., and Pullen, J.: Detailed modeling of recent severe storm tides in estuaries of the New York City region, J. Geophys. Res.-Oceans, 117, C09030, https://doi.org/10.1029/2012JC008220, 2012.
Orton, P., Vinogradov, S., Georgas, N., Blumberg, A., Lin, N., Gornitz, V., Little, C., Jacob, K., and Horton, R.: New York City panel on climate change 2015 report chapter 4: dynamic coastal flood modeling, Ann. NY Acad. Sci., 1336, 56–66, 2015.
Orton, P. M., Sanderson, E. W., Talke, S. A., Giampieri, M., and MacManus, K.: Storm tide amplification and habitat changes due to urbanization of a lagoonal estuary, Nat. Hazards Earth Syst. Sci., 20, 2415–2432, https://doi.org/10.5194/nhess-20-2415-2020, 2020a.
Orton, P. M., Conticello, F. R., Cioffi, F., Hall, T. M., Georgas, N., Lall, U., Blumberg, A. F., and MacManus, K.: Flood hazard assessment from storm tides, rain and sea level rise for a tidal river estuary, Nat. Hazards, 102, 729–757, https://doi.org/10.1007/s11069-018-3251-x, 2020b.
Peters, J. C.: HEC-HMS Hydrologic Modeling System: User's Manual, US Army Corps of Engineers, Hydrologic Engineering Center, 1998.
Ralston, D. K.: Impacts of storm surge barriers on drag, mixing, and exchange flow in a partially mixed estuary, J. Geophys. Res.-Oceans, 127, e2021JC018246, https://doi.org/10.1029/2021JC018246, 2022.
Rosenzweig, B., Herreros Cantis, P., Kim, Y., Cohn, A., Grove, K., Brock, J., Yesuf, J., Mistry, P., Welty, C., and McPhearson, T.: The value of urban flood modeling, Earth's Future, 9, e2020EF001739, https://doi.org/10.1029/2020EF001739, 2021.
Rossman, L. A. and Huber, W. C.: Storm water management model reference manual Volume I – Hydrology (Revised), US Environmental Protection Agency: Cincinnati, OH, USA, http://nepis.epa.gov/Exe/ZyPDF.cgi?Dockey=P100NYRA.txt (last access: 1 February 2024), 2016.
Santiago-Collazo, F. L., Bilskie, M. V., and Hagen, S. C.: A comprehensive review of compound inundation models in low-gradient coastal watersheds, Environ. Modell. Softw., 119, 166–181, https://doi.org/10.1016/j.envsoft.2019.06.002, 2019.
Santiago-Collazo, F. L., Bilskie, M. V., Bacopoulos, P., and Hagen, S. C.: Compound inundation modeling of a 1-D idealized coastal watershed using a reduced-physics approach, Water Resour. Res., 60, e2023WR035718, https://doi.org/10.1029/2023WR035718, 2024.
Schroeder, D. W., Tsegaye, S., Singleton, T. L., and Albrecht, K. K.: GIS-and ICPR-Based Approach to Sustainable Urban Drainage Practices: Case Study of a Development Site in Florida, Water, 14, 1557, https://doi.org/10.3390/w14101557, 2022.
Sebastian, A., Bader, D., Nederhoff, C., Leijnse, T., Bricker, J., and Aarninkhof, S.: Hindcast of pluvial, fluvial, and coastal flood damage in Houston, Texas during Hurricane Harvey (2017) using SFINCS, Nat. Hazards, 109, 2343–2362, 2021.
Shchepetkin, A. F. and McWilliams, J. C.: The regional oceanic modeling system (ROMS): a split-explicit, free-surface, topography-following-coordinate oceanic model, Ocean Model., 9, 347–404, 2005.
Slater, L. J. and Villarini, G.: Recent trends in US flood risk, Geophys. Res. Lett., 43, 12428–412436, 2016.
Smith, J. A., Baeck, M. L., Su, Y., Liu, M., and Vecchi, G. A.: Strange storms: Rainfall extremes from the remnants of Hurricane Ida (2021) in the northeastern US, Water Resour. Res., 59, e2022WR033934, https://doi.org/10.1029/2022WR033934, 2023.
Swanson, L., Dorsch, M., Giampieri, M., Orton, P., Parris, A. S., and Sanderson, E. W.: Dynamics of the biophysical systems of Jamaica Bay, Prospects for Resilience: Insights from New York City's Jamaica Bay, 65–89, https://link.springer.com/chapter/10.5822/978-1-61091-734-6_4 (last access: 15 February 2024), 2016.
Trenberth, K. E.: Changes in precipitation with climate change, Clim. Res., 47, 123–138, 2011.
USACE: New York-New Jersey Harbor and Tributaries Coastal Storm Risk Management Feasibility Study: Draft Integrated Feasibility Report and Tier 1 Environmental Impact Statement, New York, NY, https://www.nan.usace.army.mil/Portals/37/NYNJHATS Draft Integrated Feasibility Report Tier 1 EIS.pdf (last access: 15 June 2024), 2022.
U.S. Department of Agriculture, Natural Resources Conservation Service: Web Soil Survey, https://websoilsurvey.nrcs.usda.gov, last access: 15 September 2024.
U.S. Geological Survey: National Water Information System (NWIS) Mapper, U.S. Geological Survey [data set], https://maps.waterdata.usgs.gov/mapper/index.html (last access: 1 August 2023), 2019.
U.S. Geological Survey: Short-Term Network: Flood Event Viewer for Hurricane Ida, U.S. Geological Survey [data set], https://stn.wim.usgs.gov/FEV/#2021Ida (last access: 1 August 2023), 2021.
USGS: COAWST, USGS [code], https://code.usgs.gov/coawstmodel/COAWST, last access: 1 April 2025.
Wahl, T., Jain, S., Bender, J., Meyers, S. D., and Luther, M. E.: Increasing risk of compound flooding from storm surge and rainfall for major US cities, Nat. Clim. Change, 5, 1093–1097, 2015.
Warner, J. C., Armstrong, B., He, R., and Zambon, J. B.: Development of a coupled ocean–atmosphere–wave–sediment transport (COAWST) modeling system, Ocean Model., 35, 230–244, 2010.
Warner, J. C., Defne, Z., Haas, K., and Arango, H. G.: A wetting and drying scheme for ROMS, Comput. Geosci., 58, 54–61, 2013.
Xu, D., Bisht, G., Engwirda, D., Feng, D., Tan, Z., and Ivanov, V. Y.: Uncertainties in simulating flooding during Hurricane Harvey using 2D shallow water equations, Water Resour. Res., 61, e2024WR038032, https://doi.org/10.1029/2024WR038032, 2025.
Ye, F., Zhang, Y. J., Yu, H., Sun, W., Moghimi, S., Myers, E., Nunez, K., Zhang, R., Wang, H. V., and Roland, A.: Simulating storm surge and compound flooding events with a creek-to-ocean model: Importance of baroclinic effects, Ocean Model., 145, 101526, https://doi.org/10.1016/j.ocemod.2019.101526, 2020.
Zellou, B. and Rahali, H.: Assessment of the joint impact of extreme rainfall and storm surge on the risk of flooding in a coastal area, J. Hydrol., 569, 647–665, 2019.
Zhang, J., Howard, K., Langston, C., Kaney, B., Qi, Y., Tang, L., Grams, H., Wang, Y., Cocks, S., and Martinaitis, S.: Multi-Radar Multi-Sensor (MRMS) quantitative precipitation estimation: Initial operating capabilities, B. Am. Meteorol. Soc., 97, 621–638, 2016.
Zhu, J.: Impact of Climate Change on Extreme Rainfall across the United States, J. Hydrol. Eng., 18, 1301–1309, https://doi.org/10.1061/(ASCE)HE.1943-5584.0000725, 2013.
Zinda, J. A., Williams, L. B., Kay, D. L., and Alexander, S. M.: Flood risk perception and responses among urban residents in the northeastern United States, Int. J. Disast. Risk Re., 64, 102528, https://doi.org/10.1016/j.ijdrr.2021.102528, 2021.