the Creative Commons Attribution 4.0 License.
the Creative Commons Attribution 4.0 License.
 | 18 Mar 2025
Novel statistical analysis illustrates the importance of flow source for extreme variation in dissolved organic carbon in a eutrophic reservoir in the Great Plains
Anthony A. P. Baron
Helen M. Baulch
Ali Nazemi
Colin J. Whitfield
Dissolved organic carbon (DOC) trends, predominantly showing long-term increases in concentration, have been observed across many regions of the Northern Hemisphere. Elevated DOC concentrations are a major concern for drinking water treatment plants, owing to the effects of disinfection byproduct formation, the risk of bacterial regrowth in water distribution systems, and treatment cost increases. Using a unique 30-year data set encompassing both extreme wet and dry conditions in a eutrophic drinking water reservoir in the Great Plains of North America, we investigate the effects of changing source-water and in-lake water chemistry on DOC. We employ novel wavelet coherence analyses to explore the coherence of changes in DOC with other environmental variables and apply a generalized additive model to understand predictor–DOC responses. We found that the DOC concentration was significantly coherent with (and lagging behind) flow from a large upstream mesotrophic reservoir at long (> 18-month) timescales. DOC was also coherent with (lagging behind) sulfate and in phase with total phosphorus, ammonium, and chlorophyll a concentrations at short (≤ 18-month) timescales across the 30-year record. These variables accounted for 56 % of the deviance in DOC from 1990 to 2019, suggesting that water-source and in-lake nutrient and solute chemistry are effective predictors of the DOC concentration. Clearly, climate and changes in water and catchment management will influence source-water quality in this already water-scarce region. Our results highlight the importance of flow management to shallow eutrophic reservoirs; wet periods can exacerbate water quality issues, and these effects can be compounded by reducing inflows from systems with lower DOC. These flow management decisions address water level and flood risk concerns but also have important impacts on drinking water treatability.
- Article
(1664 KB) - Full-text XML
-
Supplement
(1407 KB) - BibTeX
- EndNote


Organic matter (OM) within lakes is derived from both internal processes (autochthonous) and the transport of land-derived organic matter (allochthonous) (Wetzel, 2001). The dissolved component of organic matter (DOM), often measured as dissolved organic carbon (DOC), is an important water quality characteristic that regulates the structure and function of lake and reservoir ecosystems (Prairie, 2008). In lakes and reservoirs used as drinking water sources, elevated DOM concentrations (i.e., DOM quantity) and changes in DOM colour and composition (i.e., DOM quality) can be problematic and are a major concern for drinking water treatment plants. At high DOM levels, water treatment is more challenging, necessitating costly DOM removal during pre-treatment (Cooke and Kennedy, 2001) and other actions to limit harmful disinfection byproduct (DBP) formation (Williams et al., 2019) and bacterial regrowth in water distribution systems (LeChevallier et al., 1996). The importance of DOC in regulating the structure and function of aquatic systems and the attention that it receives in drinking water treatment processes (e.g., Morling et al., 2017; Parr et al., 2019) have prompted many studies into the drivers of change in DOC.
Increasing DOC concentrations have been reported for freshwater lakes and reservoirs, primarily in forested regions of the Northern Hemisphere; this includes regions of eastern Canada (Couture et al., 2011; Hudson et al., 2003), the northeastern United States (Rodríguez-Cardona et al., 2015), northern Europe (Futter et al., 2014; Pärn and Mander, 2012), central Europe (Hruška et al., 2009), and the United Kingdom (Evans et al., 2005). Others have reported no significant trends in the DOC concentration (Dillon and Molot, 2005; Jane et al., 2017), that trends in flux do not accompany trends in concentration (Eimers et al., 2008), or decreasing trends over time (Rodríguez-Murillo et al., 2015). The search for common drivers has pointed to changes in acidic deposition, including both anthropogenic sulfur (Monteith et al., 2007) and nitrogen (N) deposition (Evans et al., 2008; Musolff et al., 2017), and natural cycles in sea salt (i.e., chloride) deposition (Evans et al., 2006) as being important. Climatic and hydrological factors, such as changes in temperature, precipitation, or runoff, can also play a role (Hongve et al., 2004; Weyhenmeyer and Karlsson, 2009; Björnerås et al., 2017). Moreover, trends in DOC have been linked to land management and land use (Yallop and Clutterbuck, 2009). Importantly, these drivers can operate at varying temporal and spatial scales (Clark et al., 2010), leading to individual or multiple drivers emerging as dominant in different studies.
DOC influx from catchments to lakes is regulated by local hydrology and climate as well as by landscape features, which influence DOC production and transport (Pace and Cole, 2002; Porcal et al., 2009). At the landscape scale, allochthonous DOC leached from terrestrial soils is transported to streams and lakes, and DOC flux from soils is regulated by soil moisture and flow paths from the soil to streams or lakes (Clark et al., 2010; Sobek et al., 2007). Landscape features that influence the DOC concentration in lakes include the wetland area (Dillon and Molot, 1997), the drainage ratio (catchment area : lake area) and proportion of the catchment that is open water (Kortelainen, 1993), the hydrological connectivity of water sources (Laudon et al., 2011; Schiff et al., 1997), the land use (Williams et al., 2010; Wilson and Xenopoulos, 2009), and the catchment slope and topography (Sobek et al., 2007; Xenopoulos et al., 2003).
Ultimately, it is evident that landscape attributes influence DOC exports and that landscape diversity complicates our understanding of the drivers of changing DOC. Importantly, there has been relatively little work assessing the change in aquatic DOC in regions with limited effects of acidic deposition. The Canadian Prairies Ecozone, a vast area of 1.8×10⁶ km2, features flat topography, poorly developed stream networks, abundant depressional storage in pothole wetlands, and climatic variability. Periods of deluge and drought are common (Pham et al., 2009; Pomeroy et al., 2007; Vogt et al., 2018), and soils of the region often have high concentrations of DOC and SO, which is reflected in pothole pond chemistry (Arts et al., 2000; Miranda and Whitfield, 2024; Labaugh et al., 1987; Waiser, 2006). Importantly, approximately half of the region is hydrologically noneffective (does not contribute runoff to streams in a typical year) (Godwin and Martin, 1975; PFRA, 1983; Martin, 2001), although this varies strongly at small spatial scales, even for catchments of the same class (Wolfe et al., 2019). Low noneffective areas mean that surface flows from the local catchment are irregular and typically limited to a few weeks in spring. As such, they may play an important, albeit irregular, role in delivering nutrients and DOC to larger water bodies. Although endorheic saline prairie lakes are known for their often extremely high DOC concentrations, owing to prolonged evapoconcentration (Arts et al., 2000; Osburn et al., 2011; Waiser and Robarts, 2000), DOC concentrations in freshwater lakes of the region have received less attention, and few long time series of DOC concentration exist. Long-term change in DOC is of particular interest to drinking water treatment providers relying on surface water in the region (Imtiazy et al., 2023). Understanding these DOC patterns can support safe drinking water treatment and limit the production of disinfection byproducts like trihalomethanes and haloacetic acids. Given that the region is relatively dry and that large reservoirs are used to store water for irrigation and municipal supplies, support hydropower generation, and facilitate recreation, flow management to meet multiple objectives is important (e.g., Suen and Eheart, 2006; Yang et al., 2012).
This study investigates long-term variation in DOC concentration in Buffalo Pound Lake (Saskatchewan, Canada); this lake has a high DOC concentration for a drinking water source and is also prone to cyanobacterial blooms (Painter et al., 2022). Our objectives were to understand relationships between DOC, flows from the local catchment, managed flows diverted from upstream Lake Diefenbaker, and a suite of in-lake water chemistry parameters over a 30-year period (1990–2019) encompassing both wet conditions and severe drought, with varied water flows and management. Our analysis centres on the novel use of wavelet coherence and phase analyses to identify temporally dependent patterns between time series that are typically masked by traditional correlation methods. These relationships were further investigated with generalized additive modelling (GAM) to understand the predictor–response relationship between DOC concentration, flows, and water chemistry. We hypothesized that flows into Buffalo Pound Lake would be important determinants of patterns in the DOC concentration at longer timescales. We also assessed chemical changes at shorter timescales, focusing on total phosphorus and DOC relationships, which can be related due to allochthonous transport or the stimulation of autochthonous production via increased primary production in a lake that can be phosphorus-limited.
2.1 Study site
Buffalo Pound Lake is a shallow, eutrophic reservoir located near the headwaters of the Qu'Appelle River drainage system in southern Saskatchewan, Canada (50.65127° N, 105.508225° W; Fig. 1). Buffalo Pound Lake is the drinking water source for ∼25 % of the province's residents, servicing the cities of Regina (population of 249 000) and Moose Jaw (population of 34 000). The lake is the site of a provincial park and a popular recreation spot for activities that include fishing, swimming, and camping; however, agriculture is the dominant land use in the region. The climate in this region is semi-arid with long, cold winters and short, warm summers. The mean annual precipitation is 320 mm (McGowan et al., 2005), although it varies between dry and wet climate phases, and the average annual temperature is ∼3 °C (Haig et al., 2021). Buffalo Pound Lake was created by damming a natural lake's outflow to the Moose Jaw River to raise water levels (beginning in 1939). The lake is long and narrow (∼29 km × 1 km) with an average depth of 3 m (max depth of 5.6 m) and storage capacity of 9×10⁷ m3 (BPWTP, 2020), with a short residence time (8 months to 2.5 years; BPWTP, 2016; Vogt et al., 2018). Its shallow depth and exposure to regular wind-induced mixing result in a polymictic system that only periodically establishes thermal stratification (Finlay et al., 2019).
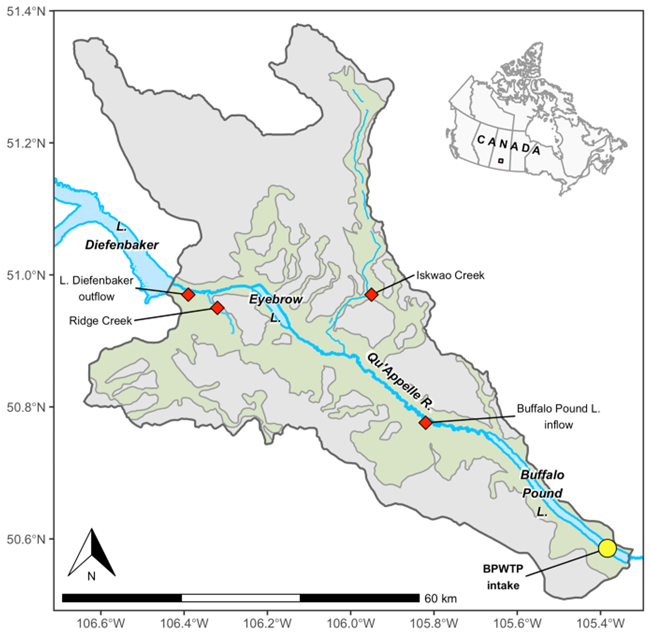
Figure 1Map of Buffalo Pound Lake, Saskatchewan, Canada, highlighting its gross (grey) and effective (green) drainage areas, including upstream Lake Diefenbaker and the Qu'Appelle River. Red diamonds denote Water Survey of Canada (WSC) streamflow gauging stations in the Buffalo Pound Lake catchment with complete or reconstructed records over the study period (see Sect. 2.3 and Table S1). The yellow circle shows the location of two submerged intake pipes that deliver raw lake water 3 km to the Buffalo Pound Water Treatment Plant (BPWTP). The short (Ridge Creek) and segmented (Iskwao Creek) blue lines are an artefact of their transience. Eyebrow Lake, which is not a true lake, is ephemeral and periodically contributes ungauged flow to Buffalo Pound Lake.
Buffalo Pound Lake has two major water sources: the local catchment and upstream diversions from Lake Diefenbaker (Fig. 1), a reservoir with a volume of 9×10⁹ m3, approximately ∼100 times greater than that of Buffalo Pound Lake. Importantly, the local catchment water quality and inflows from Lake Diefenbaker differ with respect to multiple attributes, including the DOC and sulfate (SO) concentrations. For example, measured local catchment DOC and SO concentrations are on the order of 20 mg L−1 and > 1000 mg L−1, respectively, whereas the respective concentrations in Lake Diefenbaker are typically < 5 mg L−1 (Saskatchewan Water Security Agency, unpublished data) and < 100 mg L−1 (John-Mark Davies, unpublished data).
Lake Diefenbaker lies outside of the natural catchment boundary for Buffalo Pound (BPWTP, 2020) and receives a continuous flow sourced from the South Saskatchewan River, originating in the Rocky Mountains. Water releases from Lake Diefenbaker maintain Buffalo Pound lake levels within an established operating range (30 cm) which has some seasonal variability. During the summer months, due to the importance of the water supply and recreational interests, levels are typically managed within the upper 10 cm of the operating range, but they are reduced by about 15–20 cm in winter. The second major water source to Buffalo Pound is the local catchment (3310 km2, of which only 38% is effective), which is dominated by agriculture with nutrient-rich runoff that contributes to eutrophic conditions (Finlay et al., 2019; Hammer, 1971). These inflows are generally intermittent, occurring primarily during spring snowmelt and (infrequent) extreme summer precipitation. During wet years, which lead to higher catchment flows to Buffalo Pound, managed releases from Lake Diefenbaker are much lower than in dry years. In contrast, dry years, with little or no catchment flow, require larger releases from this upstream reservoir to maintain lake levels within the operating range. Groundwater flows are not thought to be important in terms of volume or DOC contributions to the lake.
2.2 Data
2.2.1 Water chemistry
Water samples were collected and analyzed on weekly, semi-monthly, or monthly intervals at the Buffalo Pound Water Treatment Plant (BPWTP) between 1990 and 2019. Samples were collected from raw lake water that was pumped 3 km from near the Buffalo Pound Lake outlet to the BPWTP via two submerged intake pipes (Fig. 1). The BPWTP laboratory is accredited to the ISO/IEC 17025 standard and adapts its analysis methods using the Standard Methods for the Examination of Water and Wastewater (APHA, 2012). The accredited BPWTP laboratory did change instruments over the long history of this data set; however, new instruments were cross-validated and subjected to the testing requirements associated with accreditation (Blair Kardash, personal communication, 2020). Here, we briefly describe the current analytical methods (Table S2 in the Supplement). Prior to 2015, DOC samples were analyzed via a nondispersive infrared detector on a Tekmar Dohrmann Phoenix 8000 TOC (total organic carbon) Analyzer. Since 2015, DOC concentrations have been analyzed on a General Electric (GE) Sievers M5310 C TOC Analyzer with a GE-patented Selective Membrane Conductometric design. Filtration (e.g., for DOC) was to a pore size of 0.7 µm. Sulfate and nitrate (NO) concentrations were determined via ion chromatography using a Dionex ICS-1100 ion chromatograph. Ammonium (NH) concentrations were determined colourimetrically by Nessler's reagent addition after samples were buffered in boric acid solution and distilled. Chlorophyll a (Chl a) pigment concentrations were extracted with acetone and measured via spectrophotometry, but they were not corrected for the presence of pheophytin. Total phosphorus (TP) analysis was carried out via the molybdenum blue method at 690 nm on a spectrophotometer after digestion. Soluble reactive phosphorus (SRP) concentrations were analyzed using the ammonium molybdate method and then measured at 690 nm on a spectrophotometer.
The frequency of water chemistry analyses permitted the use of monthly averages (n= 360) across the 30-year time series with few missing data points (0.28 %–3.6 %) for the seven parameters described above. Statistical analyses (described below) required a complete record (i.e., 360 monthly averages of weekly to monthly samples collected over 30 years), necessitating (very limited) imputation. Because many water chemistry parameters were highly variable over decadal scales, replacing missing values with the (seasonal) mean or median consistently produced values outside of the reasonable range for a given month and year based on visual inspection. To overcome this, the k-nearest neighbour regression approach (Altman, 1992; Fix and Hodges, 1951) was used, replacing missing values with the mean of k= 1 nearest neighbours.
2.2.2 Streamflow measurements
The streamflow monitoring network in the Buffalo Pound Lake catchment is operated by the Saskatchewan Water Security Agency (WSA) and comprises four streamflow gauges with sometimes incomplete records for 1972–2019 (Fig. 1, Table S1). Lake Diefenbaker outflow (QLD) and Buffalo Pound Lake inflow (QBP) are gauges at the upstream and downstream reaches of the Qu'Appelle River that represent inflow from Lake Diefenbaker and upstream inflow to Buffalo Pound Lake, respectively. Flows from Ridge Creek (QRC) and Iskwao Creek (QIC) are tributaries sourced from the local catchment that flow into the Qu'Appelle River between Lake Diefenbaker and Buffalo Pound Lake (see Sect. 2.3). Ephemeral flows from the effective areas running the length of either side of the catchment (Fig. 1) represent another (ungauged) source of water to the lake.
2.3 Streamflow reconstruction scheme
Conventional hydrological modelling is not an easy task in the Buffalo Pound Lake catchment due to the poorly defined drainage system distributed over a relatively flat terrain (e.g., Mekonnen et al., 2015; Pomeroy et al., 2005). This forms complicated hydrological conditions, under which the hydrologic responses heavily depend on landscape feature detail (Fang et al., 2007; Van der Kamp et al., 2003; Spence, 2010) and are subject to nonlinear hysteresis (Shook and Pomeroy, 2011). With few exceptions (Clark and Shook, 2022), current hydrological models do not represent dominant hydrological processes in prairie landscapes and fail to reproduce the observed runoff. Here, we attempted to maximize the use of observed gauge information (Table S1) by implementing a data-driven reconstruction scheme. This approach allows us to consider three water sources in our analysis: diversions from Lake Diefenbaker (QLD); upstream inflows to Buffalo Pound Lake, representing a mix of local catchment flows and QLD (QBP); and flows originating from the local catchment (QLC).
Considering the mass conservation and ignoring other potential losses, the upstream inflow to Buffalo Pound Lake (QBP) can be described as follows:
We used available flow information at Ridge Creek (QRC) to estimate missing flows at Iskwao Creek (. Likewise, we used Ridge Creek to estimate flows for the ungauged portion of the catchment upstream of the Buffalo Pound Lake inflow (), an area that includes Eyebrow Lake (Fig. 1), which periodically attenuates flow. While records for QLD and QRC are complete, we used a set of linear and nonlinear transfer functions, including polynomial, exponential, and inverse exponential functions, along with power and tangential functions and their linear combinations (resulting in a total of 420 functional mappings) to link and to QRC. We note that the nature of landscape hydrologic response in the lake catchment is significantly different between frozen (December–March) and ice-free (April–November) months; therefore, we considered separate transfer functions for warm and cold seasons. The 1972–1992 data were used for model development, and the models were compared and falsified based on the Bayesian information criterion, which penalizes the number of model parameters. For Iskwao Creek, the following transfer functions performed well during the training period:
Here, and QRC are in cubic metres per second. Similarly, the total upstream ungauged flux, in cubic metres per second, was estimated based on QRC as follows:
Here, the storage term accounts for changes in landscape storage, including at Eyebrow Lake. The efficiency of estimated and was investigated by calculating the coefficient of determination (R2) for observed flows at Iskwao Creek and upstream of Buffalo Pound Lake during separate training (1972–1992) and testing periods. The R2 measures the percentage of described variance and was 0.71 during the training period and 0.68 during the testing period of 2008–2011 for . For the total inflow to the lake (QBP), R2 was similarly high: 0.87 during training and 0.78 during testing (1993–1995).
Finally, because QBP is dominated by QLD, we used a third metric as a means of assessing the role of flows from the local catchment (QLC). In this instance, we approximate QLC, including runoff from the catchment area downstream of the gauge at the Buffalo Pound Lake inflow, according to the following:
Here, we scale combined flows from the Ridge and Iskwao creeks to estimate flows from the effective catchment area that lies downstream of the upstream inflow to Buffalo Pound Lake (QDC), including areas along either side of the lake (Fig. 1). While this approach can only serve as an estimate, as any attenuation of flows in the ungauged portion of the Qu'Appelle River can be a mix of source waters from Lake Diefenbaker and the local catchment, it nonetheless provides a proxy for the flow contribution from the local catchment.
2.4 Statistical analyses
There were two major goals of our statistical analysis. First, we aimed to understand frequency-dependent relationships between the DOC concentration and a suite of environmental predictors that include upstream flows (QLD, QBP, and QLC) and in-lake water chemistry (SO, TP, SRP, Chl a, NO, and NH) using wavelet coherence analysis (Grinsted et al., 2004; Sheppard et al., 2016, 2017; Walter et al., 2021). Wavelet-based methods can be used to measure synchrony and coherence between environmental and biological variables and to investigate relationships that are not readily detected by conventional correlation methods (Reuman et al., 2021). Specifically, wavelet coherence analysis can reveal the degree of association between two variables, while the phase relationships provide information on the patterns of behaviour between these two variables. Variables that are in phase or antiphase are analogous to a positive or negative correlation, respectively, while the phase relationships also provide information on where there is a time lag between the variables (e.g., Walter et al., 2021). Importantly, this approach allows for investigation across different timescales, as it is possible that these relationships manifest in different ways at different timescales. We also note that these phase relationships do not identify dependence among variables. Variables identified as significantly coherent with DOC (α= 0.05) by wavelet coherence analysis were subsequently used to achieve our second objective, wherein generalized additive modelling (GAM) was used to investigate predictor–response relationships between the DOC concentration, flows, and in-lake water chemistry. Predictor–response relationships were assessed using GAM because we anticipated complex nonlinear trends between DOC and predictor variables that would be masked by traditional (e.g., Mann–Kendall) methods or would require some degree of a priori trend selection or functional form (e.g., linear and generalized additive models). This approach allows for investigation of the relationships between each predictor and the response variable, but we note that we use this technique as a tool to analyze complex relationships, not as a forecasting tool or to infer that these predictors are drivers of DOC. All statistical analyses were completed using monthly averages (n= 360; see Sect. 2.2.1).
All statistical analyses were carried out in R (version 4.1.3; R Core Team, 2022), including “Wavelet approaches to synchrony” (wsyn) for wavelet analysis (version 1.0.4; Reuman et al., 2021), base (R Core Team, 2022), and spatstat.core (version 2.4.2; Baddeley et al., 2015) for wavelet plotting. Generalized additive models were fit using the R package mgcv (version 1.8.40; Wood, 2017), and graphics were plotted with ggplot2 (version 3.3.6, Wickham, 2016), gratia (version 0.7.3; Simpson, 2021), and patchwork (version 1.1.1; Pedersen, 2020). The graphics in Fig. 1 were plotted using the R package mapcan (McCormack and Erlich, 2019). The gross and effective drainage area shapefiles used in Fig. 1 were obtained from the Prairie Farm Rehabilitation Administration, and lake and river geospatial data were retrieved through the Government of Canada's Open Government License (Statistics Canada, 2006, 2011). Further details on wavelet analyses and GAMs are provided below.
2.4.1 Wavelet coherence analyses
We applied the continuous Morlet wavelet transform Wσ(t) (Addison, 2017) to each time series following the approaches outlined by Sheppard et al. (2016, 2017, 2019). The wavelet transform Wσ(t) uses small localized wavelike functions to transform time series signals into a more useful form (Addison, 2017). For this study, scaling was applied such that one wavelet oscillation was equal to 2 months (σ= 2), as a 2-month period is the highest-frequency fluctuation that can be identified in monthly time series. Wavelets were generated across a range of timescales, from 2 to 120 months (10 years). Wavelet transforms require scalloping to remove poorly estimated values at the tails of time series (Addison, 2017). For a 30-year time series of monthly observations, scalloping limits wavelet periods to a maximum of ∼120 months, or approximately one-third of the length of the full time series (e.g., Fig. S1 in the Supplement).
Coherence between two variables is a measure of the strength of association between those variables in a timescale-specific way that is not confounded by lagged or phase-shifted associations (Reuman et al., 2021). Accordingly, wavelet coherence quantifies the degree to which two time series have correlated magnitudes of oscillation and consistent phase differences through time, as a function of timescale (Walter et al., 2021), with a magnitude ranging from 0 (no relationship) to 1 (perfect coherence). The “wavelet mean field” normalization method (Sheppard et al., 2016) was used to measure wavelet coherence because its coherence magnitude increases both with increasing synchrony between time series and when oscillations in time series at time t and timescale σ have a similar phase (direction and time lag). This method also permits one to test for significant coherence across multiple timescales. Two timescale bands were tested for significance: short timescales (≤ 18 months) were selected based on Buffalo Pound Lake intra-annual/seasonal dynamics and potential lagged relationships between DOC and environmental predictors; long timescales (> 18 months – i.e., up to 120 months) were selected based on multiyear to decadal patterns observed in DOC concentration.
Phase (direction and time lag) was also investigated for environmental predictors that were significantly coherent with the DOC concentration. Coherent variables may be in phase (positively correlated) or antiphase (negatively correlated) and are typically time-lagged (positively or negatively). To understand phase difference relationships between significantly coherent DOC–predictor pairs, we computed the average phase φ across the corresponding timescale band (Walter et al., 2021). Because phase φ is an angular measurement, cosine- or sine-transforming this value provides information about how close the relationship is to being in phase [cos(φ)] and whether the time-lagged relationship between time series tends to be positive or negative [sin(φ)] (Walter et al., 2021). Cosine transformation assigns in-phase relationships (φ=0) to 1, antiphase relationships () to −1, and quarter-phase (i.e., time-lagged) relationships () to 0. Sine transformation assigns both in-phase (φ=0) and antiphase () relationships to a value of 0 because they exhibit no time lag. When a change in DOC occurs in advance of a predictor variable (), the relationship is lagged negative, whereas when a change in DOC lags behind a change in a predictor (), the relationship is lagged positive.
To test for significant coherence, all time series were transformed using standard optimal Box–Cox normalization prior to wavelet transformation (Sakia, 1992). Box–Cox transformation improves normality and ensures that variability in individual time series is not dominated by extreme values (Sheppard et al., 2019). Significance testing for wavelet methods relies on Fourier surrogate techniques where time series are normally distributed (Schreiber and Schmitz, 2000), so fair comparisons and statements of significance can only be made if underlying data are normally distributed (Sheppard et al., 2019). Box–Cox transformation removes the linear trend for each time series and rescales the variance to 1, producing transformed times series with a mean of 0 and approximately normal distributions. Fourier-transform-based methods for generating surrogate coherence data sets can be used to test for statistically significant coherence relationships between wavelet-transformed variables (Sheppard et al., 2017). These Fourier-transformed data retain the original characteristics (e.g., temporal autocorrelation) of the time series and test whether coherence values are likely to occur under the null hypothesis that no actual coherence or phase relationships exist between variables. For each DOC–predictor time series pair, 10 000 surrogate randomizations were run to facilitate more accurate significance testing results and reduce variability in repeat runs (Reuman et al., 2021; Sheppard et al., 2017).
2.4.2 Generalized additive models
Predictors identified as significant by coherence analysis were used to model the DOC time series using a GAM. This approach was chosen because it can account for nonlinearity in trends, whereas other methods are limited to identifying increasing or decreasing linear (monotonic) trends (e.g., (seasonal) Mann–Kendall test) or require a priori selection of the functional form of trends in time series or selection from less flexible polynomial models (e.g., parametric linear or generalized linear models) (Finlay et al., 2019; Simpson, 2018). The use of splines by GAMs is also advantageous in that it can reduce bias issues and over-fitting at the tails of data sets, which is a common problem with polynomial models (Finlay et al., 2019). In practice, a GAM takes the following general form:
where yi is the response variable; β0 is the model intercept; xi1, xi2, and xin are covariates; f1, f2, and fn are nonparametric smoothing functions; and ϵi represents independent N(0,σ2) random errors (Wood, 2017). All predictors (i.e., f(xi)) were estimated using thin plate regression splines and penalized using restricted maximum-likelihood–based smoothness selection procedures (Wood, 2011). The initial basis dimension (k) of each smooth function was checked following the procedure described in Pya and Wood (2016): if initial k was deemed too low (i.e., if the k index < 1 and estimated degrees of freedom was close to k′), a larger basis size was used and the model was refitted. The Tweedie distribution (Tweedie, 1981) was used as the model conditional distribution, as histograms of most of the environmental predictors showed deviation from normality and resembled some form of the gamma distribution, which is also included in the Tweedie family of distributions and identified when the Tweedie power parameter, p, is 2. In our model, p was 1.99, indicating that the gamma distribution was a good fit; however, selecting the Tweedie distribution a priori avoided the potential of erroneously choosing gamma as the conditional distribution. Model fit was assessed through qualitative inspection of quantile–quantile residuals, residuals vs. linear predictor, histogram of residuals, and observed vs. fitted values plots. Uncertainty in the estimated DOC trend was simulated using 10 000 iterations from the posterior distribution of the fitted values. The simulated trends are consistent with the estimated trend but include the uncertainty in the estimates of the spline coefficients (Finlay et al., 2019). The posterior simulation involves drawing 10 000 samples from the multivariate normal distribution and then deriving the difference between the peak and minimum DOC for each sample (trend). The upper and lower 2.5 % probability quantiles of the distribution of 10 000 differences in trend for each year form a 95 % confidence interval on the difference estimated from the fitted trend (Finlay et al., 2019).
3.1 Flow and water chemistry parameters
Flow sources varied over the 30-year period with no distinct long-term or multiyear patterns (Fig. 2a–c). Buffalo Pound Lake inflows (QBP) and QLD each showed seasonal patterns, peaking around late spring to early summer and decreasing during winter months when water demands were lower and the lake was covered with ice (Fig. S2). Control structures from Lake Diefenbaker to Buffalo Pound Lake permit flows to continue during winter months when the lakes are ice-covered. Local catchment flows (QLC) typically peaked in late spring to early summer and did not contribute water to Buffalo Pound Lake in winter months or dry years. Peaks in QLD, QBP, and QLC are typically associated with spring freshet, but large rainfall events can also contribute considerable flow within the region. Streamflow averaged 3.2±2.6 (range: 0–12.4) m3 s−1 at QLD and 3.6±2.8 (range: 0.1–18.9) m3 s−1 at QBP (Table S3), highlighting much lower catchment flows which averaged 0.7±2.3 (range: 0–25.4) m3 s−1. In years where QLC was low or absent, particularly in the late 1990s and early 2000s, QBP generally followed patterns of water release from Lake Diefenbaker, and fluctuations in QBP were comparable to those of QLD. Several years showed evidence of wetter-than-normal conditions (e.g., 1997 and 2014) with short-term episodes of considerable discharge from the local catchment. These episodes correspond to peaks in QBP and were generally associated with low QLD flows (Fig. 2).
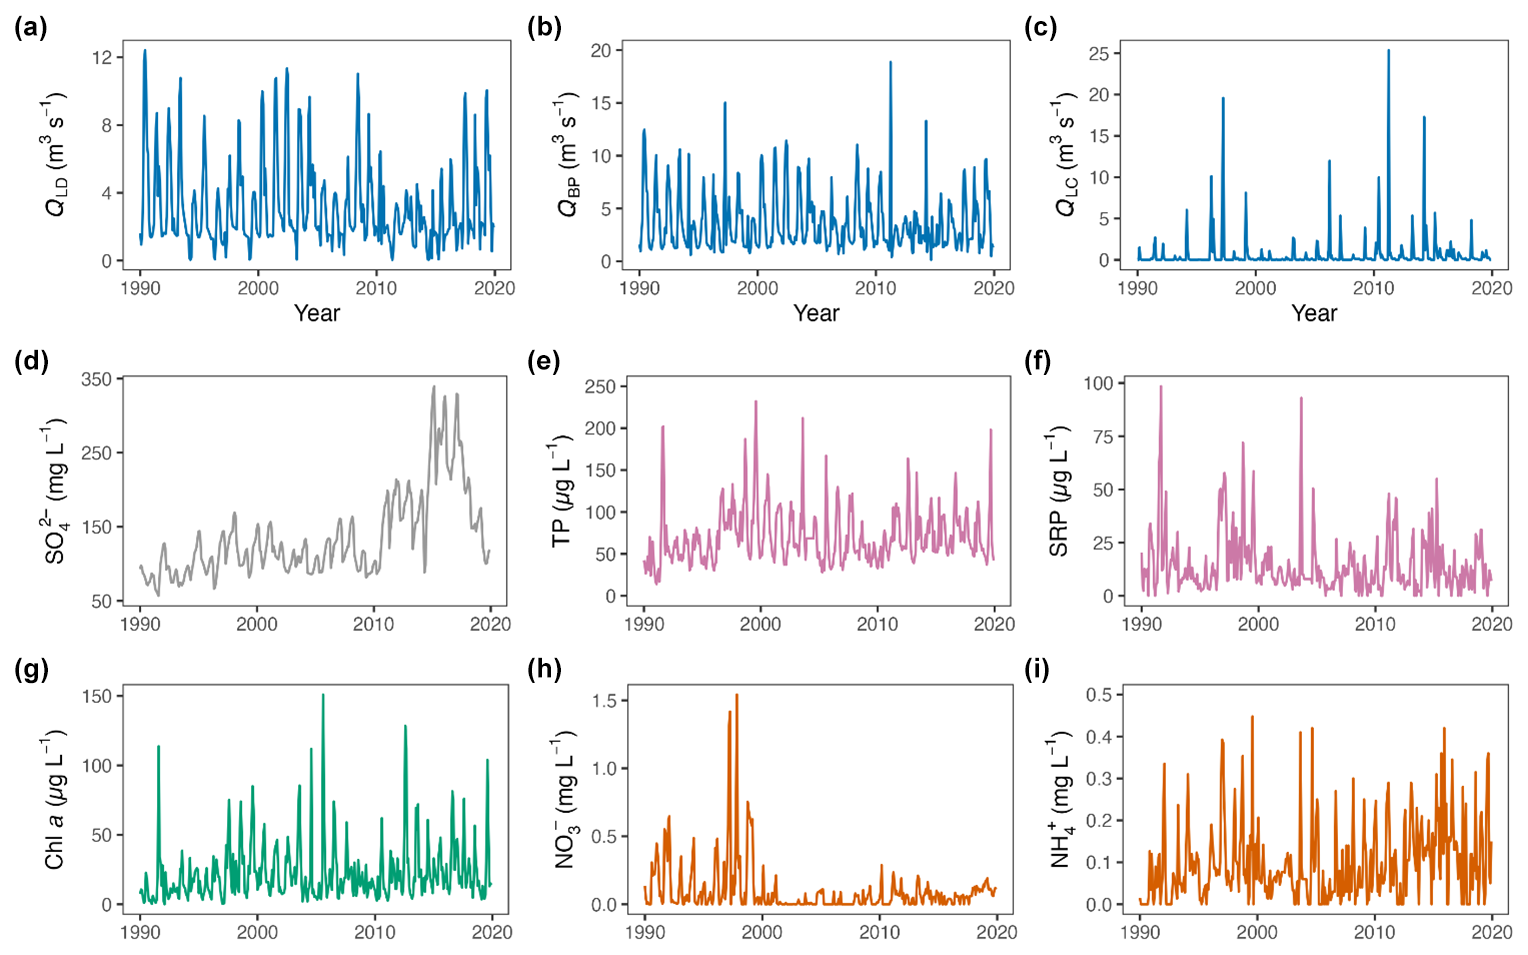
Figure 2Monthly time series of flows of (a) QLD, (b) QBP, (c) QLC, (d) SO, (e) TP, (f) SRP, (g) Chl a, (h) NO, and (i) NH concentrations from 1990 to 2019. Note that the y-axis scales for the QLD, QBP, and QLC plots are different and that all nitrogen concentrations are given as milligrams of N per litre (mg N L−1).
The DOC concentrations fluctuated considerably over the 30-year observation period, ranging from 3.3 to 12.4 mg L−1 (Fig. 3, Table S3). The mean (± standard deviation) DOC concentration was 6.8±1.8 mg L−1. Several notable fluctuations occurred over multiyear periods. For example, after sustained high concentrations from 1997 to 2000 (mean 9.5 mg L−1), DOC fell to 4.4 mg L−1 by 2004 and remained near or below average until the mid-2010s. Between 1990 and 2000, there was a gradual increase in the DOC concentration where, alongside intra-annual increases and decreases, DOC concentrations increased from 3.9 mg L−1 in 1990 to 9.3 mg L−1 in 2000. Other notable changes occurred at shorter timescales: in 1991, DOC concentrations were ≤5.0 mg L−1 from January to July, spiked to 10.5 mg L−1 in August, and fell to 5.5 mg L−1 by December. The mid-2010s also saw a sharp increase in DOC concentration followed by below-average levels within a 4-year span.
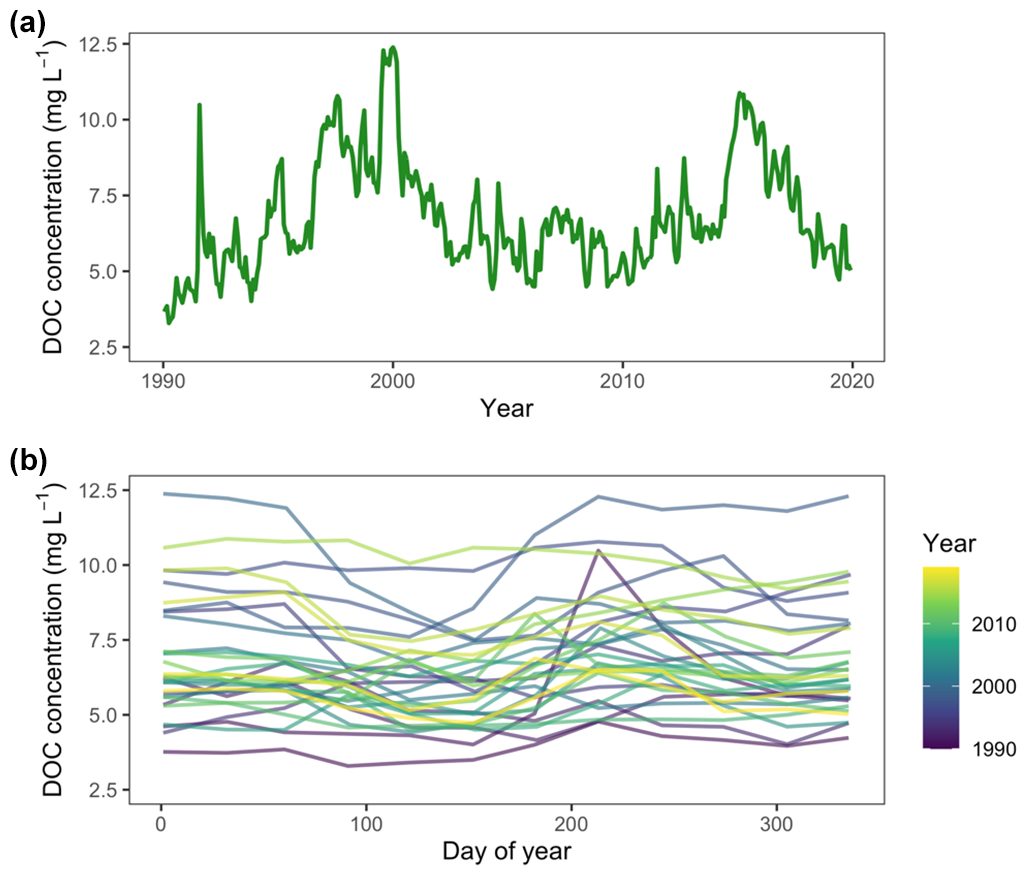
Figure 3Monthly Buffalo Pound Lake DOC concentrations (1990–2019) by (a) year, showing the pattern in the DOC concentration over the full time series, and (b) day of year, showing the intra-annual variation in the DOC concentration.
Water chemistry was also highly variable over the 30-year period (Fig. 2d–i, Table S3), with evidence of dramatic changes in the chemistry of Buffalo Pound Lake over time. For example, SO concentrations ranged from 56.8 to 340 mg L−1 and were relatively stable from 1990 to 2009 before rapidly rising up to 250 mg L−1 between 2011 and 2017 (Fig. 2d). By the end of 2019, SO returned to levels observed during 1990–2010. Nitrate also showed two distinct patterns. After averaging 0.20±0.28 mg L−1 from 1990 to 1999 and peaking at 1.5 mg L−1 in 1997, NO concentrations were nearly an order of magnitude lower from 2000 to 2019, averaging 0.05±0.08 mg L−1 (Fig. 2h). Total phosphorus, SRP, Chl a, and NH concentrations rose rapidly in 1991 (Fig. 2e–g, i), concomitant with the rise in DOC in that year, but this was transient. In the few years after 1991, chemical concentrations were average or below average, followed by increases in concentrations into the early 2000s. The mid-2010s also showed elevated levels of SO, TP, Chl a, and NH, concurrent with elevated DOC concentrations and QLC during this time.
3.2 Wavelet coherence and phase relationships
Coherences between DOC and nine environmental predictors at short (≤ 18-month) and long (> 18-month) timescales were highly variable (Table 1, Fig. S3). At short timescales, coherence magnitudes ranged from 0.08 to 0.50 (median of 0.15), whereas at long timescales, they ranged from 0.05 to 0.74 (median of 0.54); this is consistent with potential bias in wavelet coherence, where greater coherence magnitudes tend to be returned at long timescales (Walter et al., 2021). Four DOC–predictor pairs were significant at short timescales (α=0.05 significance level): SO, TP, Chl a, and NH. At long timescales, SO, TP, and QLD were significantly coherent with DOC (α= 0.05 significance level). Significant coherence relationships at these timescales indicate that the magnitude of changes that occur in DOC concentrations and the environmental predictors are closely related. Phase relationships, expounded upon next, describe the time lags in these changes. Pairs of variables that are in phase will increase (and decrease) together, and a time lag can tell us if changes in one variable precede the other. Antiphase behaviour indicates that one variable is increasing while another decreases.
Table 1Coherence and phase relationships between DOC and environmental predictors at short (≤18-month) and long (> 18-month) timescales. Mean coherence p values are calculated over the reported timescale band for each significant relationship. Significant relationships shown using bold text and are denoted by (p < 0.001), (p < 0.01), and * (p < 0.05). Relationships that are marginally nonsignificant (p < 0.1) are shown using italic font and are denoted by Cos(φ) and sin(φ) are transformations of the average phase φ over the reported timescale band; cos(φ) describes how close the relationship between DOC and each parameter is to being in phase, whereas sin(φ) focuses on whether the time-lagged relationship between DOC and each predictor tends to be positive or negative. Because phases are angular measurements, φ ranges between −π and π, and cos(φ) and sin(φ) range between −1 and 1. Relationships are identified as in phase when cos(φ) ≈1, antiphase when cos(φ) , and quarter-phase when cos(φ) ≈ 0. When sin(φ) , the relationship is time-lagged positive (i.e., a change in DOC precedes a change in the predictor), whereas when sin(φ) ≈1, the relationship is time-lagged negative (DOC lags behind the predictor). When relationships are perfectly in phase or antiphase (i.e., not time-lagged), sin(φ) = 0.
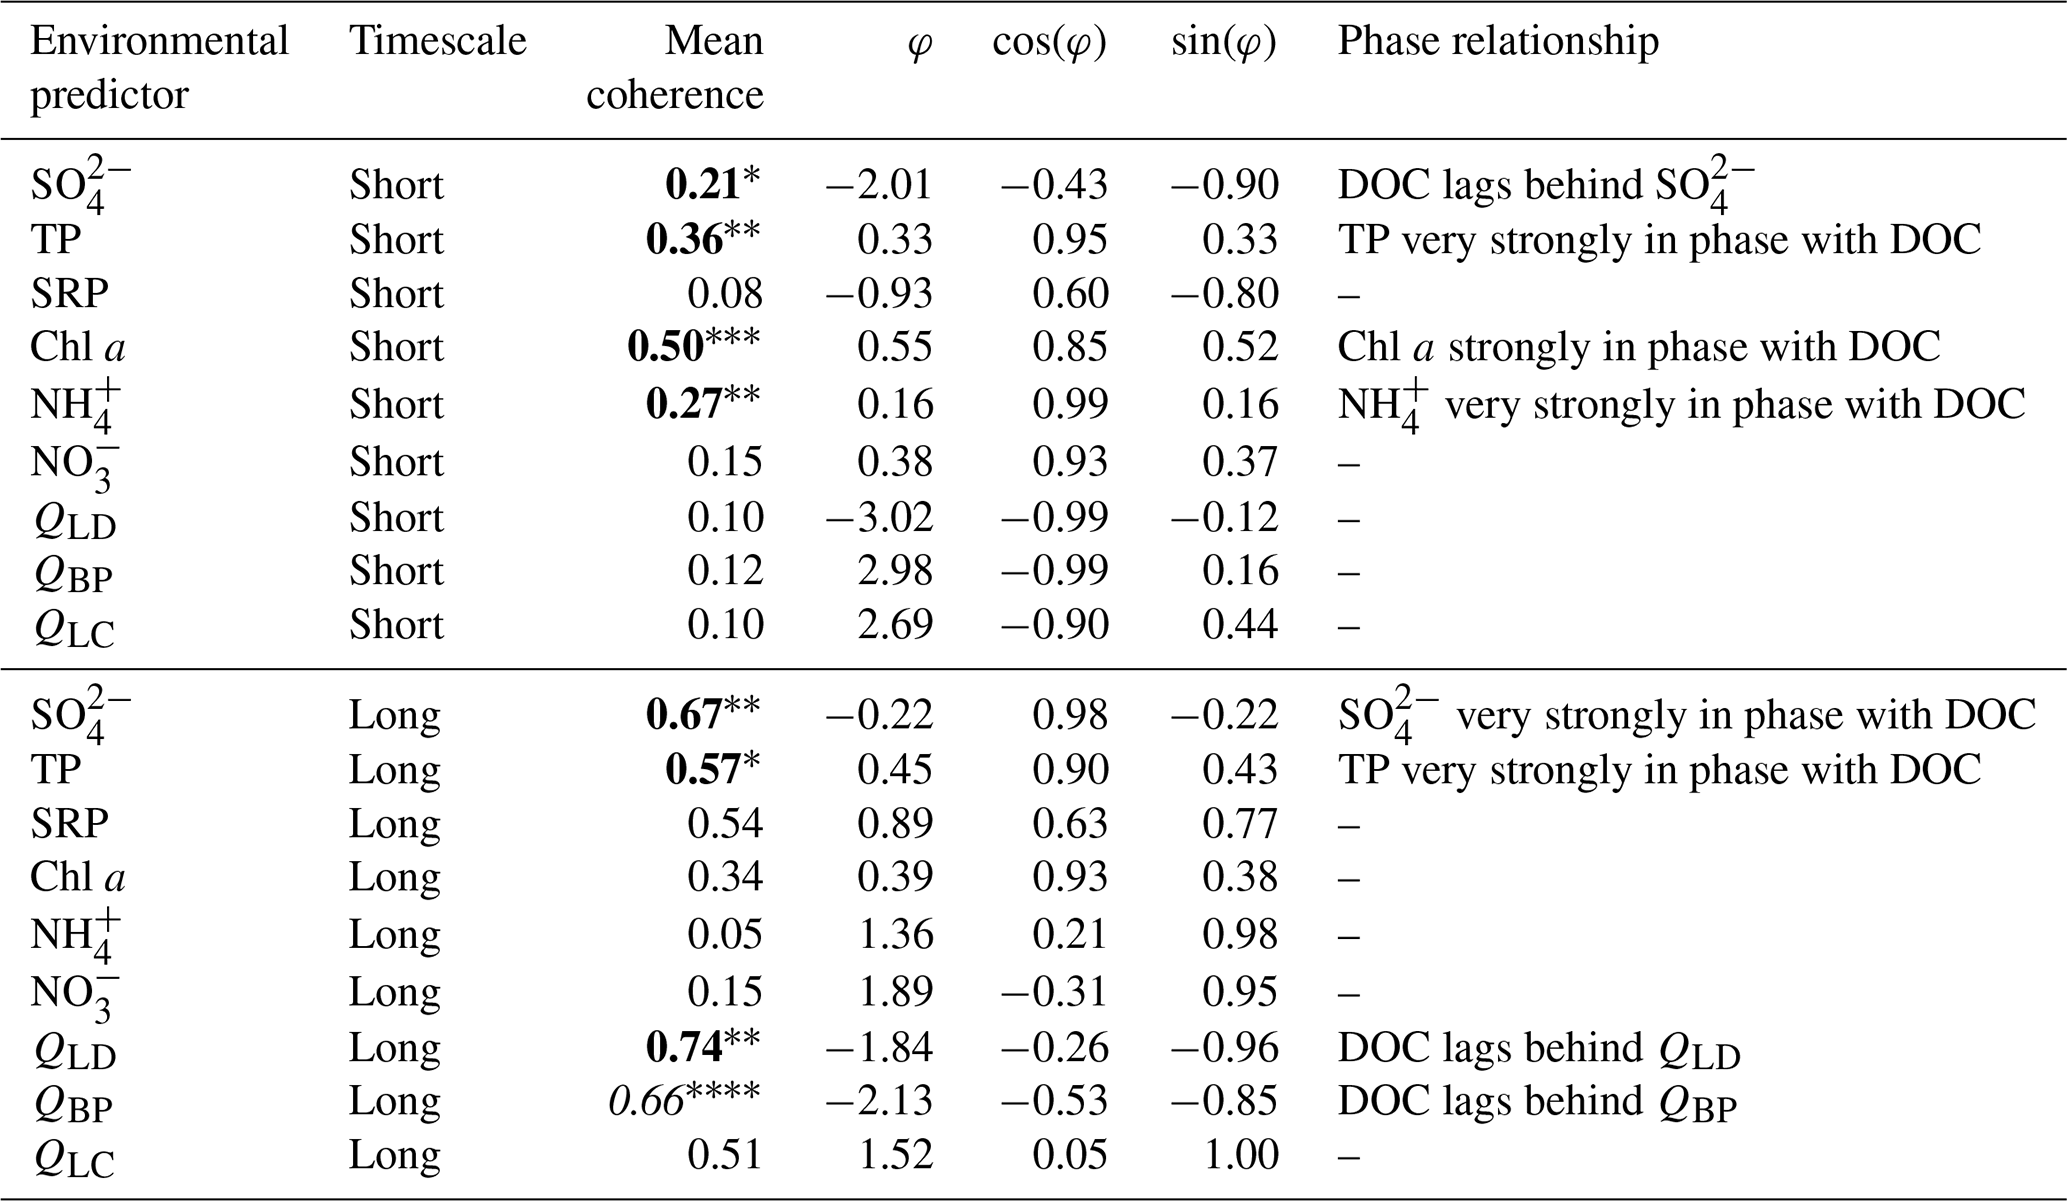
Phase relationships spanned the range of possible values (0 to ±π) (Fig. S4). For DOC–predictor pairs with significant coherence, most relationships were approximately () at both short and long timescales (Table 1). At short timescales, DOC was strongly in phase with TP, Chl a, and NH (), whereas it tended to lag behind fluctuations in SO (), indicating that DOC increases (or decreases) when these predictors increase (or decrease). Interestingly, the phase relationship between DOC and SO shifted to strongly in phase () at long timescales, while TP remained strongly in phase with DOC (). Unlike SO and TP, fluctuations in DOC were antiphase with and tended to lag behind fluctuations in QLD (), indicating that DOC decreases follow increases in QLD. Significant coherence and phase relationships described here provide insight into the timescale and time-lag relationships between DOC and the environmental predictors. Next, analogies to traditional positive and negative correlation are discussed, using GAM.
3.3 Generalized additive modelling
Five environmental predictors (SO, TP, Chl a, NH, and QLD) found to be significantly coherent with the DOC concentration, as identified by wavelet coherence analyses at either short (≤18-month) or long (> 18-month) timescales, were included in a simple GAM. A thin plate regression spline for each covariate explained 56 % of the deviance in the DOC concentration over the 30-year period, with an adjusted R2 of 0.50 (effective degrees of freedom = 16.9). Sulfate, TP, NH, and QLD all explained the significant variation in the DOC concentration (p < 0.001 for NH and QLD; p < 0.0001 for SO and TP). The Chl a smooth term was the only nonsignificant predictor (p= 0.15; Fig. 4a). Total phosphorus and QLD showed linear positive and negative relationships with the DOC concentration, respectively (Fig. 4b, e). At NH concentrations <∼0.1 mg L−1 (61 % of the observed NH data), NH had an approximately linear positive effect on the DOC concentration but did not have much predictive power at concentrations > 0.1 mg L−1, as shown by the increasingly large confidence interval (CI; shaded region) at higher NH levels (Fig. 4c). The relationship between DOC and SO (Fig. 4d) was generally positive but was more variable than the other environmental predictors. For example, at an SO concentration of ∼150–200 mg L−1, increases in SO were concurrent with decreases in DOC; however, at SO concentrations < 150 mg L−1 (71 % of the observed SO data), DOC tended to increase with increases in SO. At higher concentrations of SO, TP, and NH and high QLD, the GAM lost predictive power (large CI for the right tails of each smooth), but it performed well in the lower to moderate ranges (Fig. 4). Visually, the GAM provided a good fit between observed and fitted DOC at a concentration <∼ 7 mg L−1, but considerable variation was apparent in the model fit at concentrations above a threshold of 8 mg L−1 (Fig. S5). Fitting the GAM to the DOC time series (Fig. 5) revealed that using these predictors to estimate the DOC concentration was useful for identifying multiyear trends (e.g., in the 1990s and mid-2010s), but the model suffered from over-fitting intra-annual fluctuations, such that DOC minima and maxima are not always captured (Fig. 5).
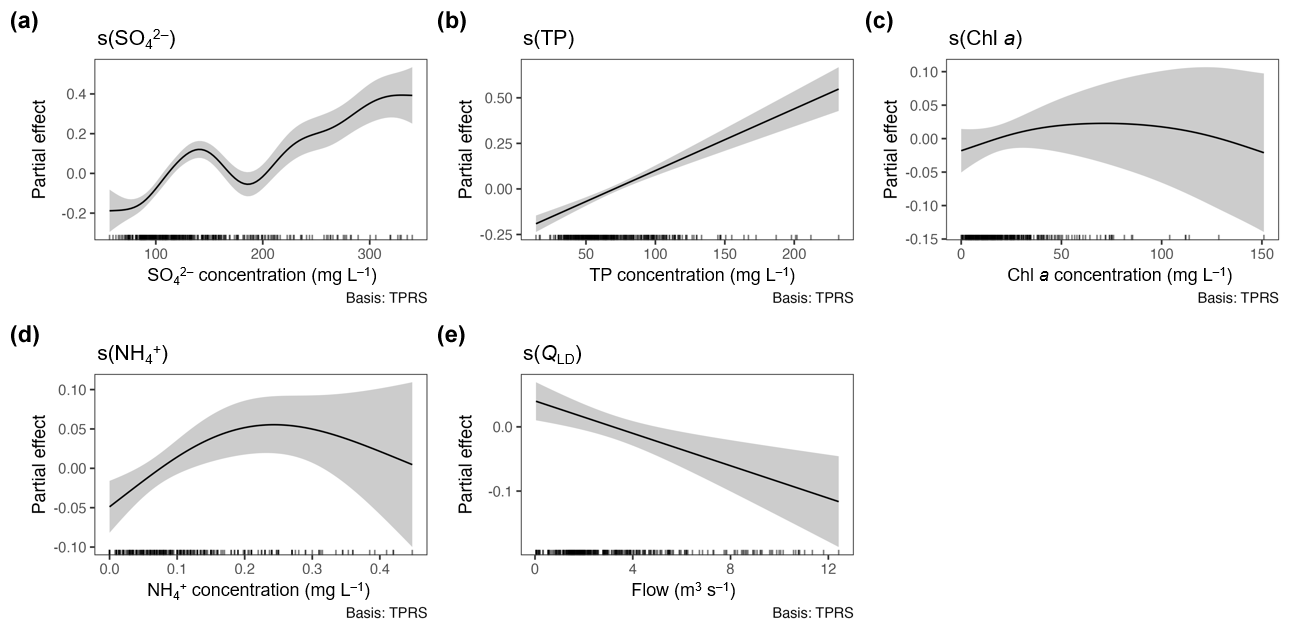
Figure 4Partial effects of (a) SO, (b) TP, (c) Chl a, (d) NH, and (e) QLD for the GAM fitted to the DOC time series with significantly coherent environmental predictor covariates. The x axes show observed values for each environmental predictor. The y axes show the partial effects of thin plate regression spline smooths (black lines) for each environmental predictor. Grey shaded regions are the 95 % confidence interval. The rug (the inset on the x axes) displays the distribution of observed values. Chlorophyll a was the only nonsignificant covariate (p=0.15); all other environmental predictors were significant at p < 0.001.
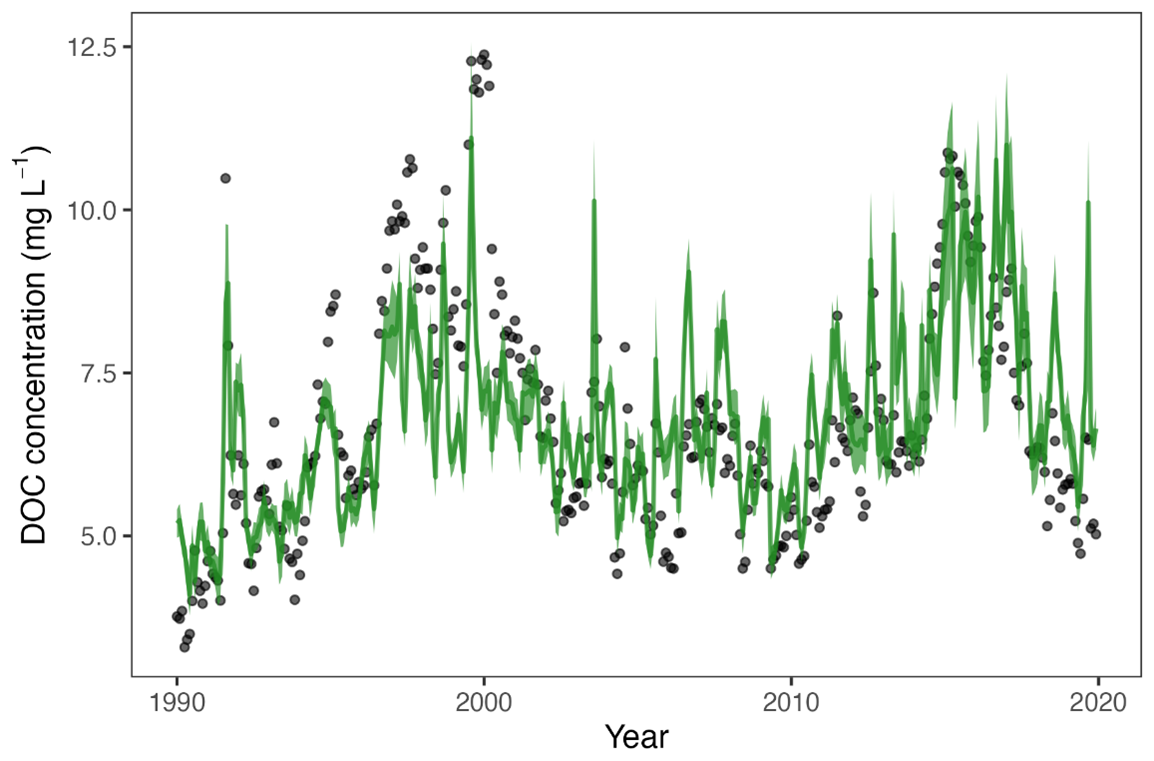
Figure 5The DOC concentration time series (black points) overlain by the GAM fit (GAM model using SO, TP, Chl a, NH, and QLD; blue line). The shaded blue area is the 95% confidence interval of the GAM model fit using 10 000 samples drawn from the posterior multivariate normal distribution. This model explained 56 % of the deviance in the DOC concentration with an of 0.50.
4.1 DOC concentration and flow conditions
Semi-arid regions are subject to high inter-annual variation in moisture conditions. Buffalo Pound Lake is a shallow reservoir in a DOC-rich landscape (Labaugh et al., 1987; Waiser, 2006) with high climatic variability (Pham et al., 2009; Pomeroy et al., 2007; Vogt et al., 2018) where prolonged periods of drought are often followed by multiple high-precipitation years. This leads to very high variability in DOC, with a range of ∼10 mg L−1 over the 30-year observation period (Fig. 3). Rapid changes in DOC were sometimes observed, likely related to the lake's short residence time (8 months to 2.5 years; BPWTP, 2016; Vogt et al., 2018) that makes the system highly responsive to changing inputs. In regard to our first hypothesis, the flow source appears to have an important influence on DOC. Wavelet analyses demonstrated that flow from the upstream reservoir (QLD) was coherent with DOC concentrations in Buffalo Pound Lake at long timescales, with changes in the DOC concentration lagging behind changes in flows. This suggests that “managed” flows from Lake Diefenbaker have a flushing (diluting) effect, which is consistent with the generally lower DOC concentrations of this lake compared with local catchment runoff (Saskatchewan Water Security Agency, unpublished data). Thus, we fail to reject the null hypothesis (that QLD is not related to DOC).
We expected that QLC would be strongly related to lake DOC for the following reasons: prairie catchment runoff tends to be high in solutes, including DOC, salinity, and nutrients (e.g., Casson et al., 2019; Fasching et al., 2019), and prairie wetlands become important flow sources during periods of high hydrologic connectivity (Ali and English, 2019; Nachshon et al., 2014) and can have extremely high DOC concentrations (sometimes in excess of 100 mg L−1) (Arts et al., 2000; Waiser, 2006). Instead, coherence of QLC with DOC was low (0.10) at short timescales and moderate (0.51) at long timescales, with neither being significant (Table 1). Statistically, the smaller and intermittent contribution of the local catchment to flow makes signals challenging to ascertain without much longer time series. Specifically, QLC, although sometimes large, is infrequent (Fig. 2) due to the ephemeral nature of these sources and their tendency to have no or minimal flow in drier years. There is also some potential for the attenuation of upstream catchment flows and for unknown lags in these flows reaching the lake, which may impair statistical detection. In contrast, QLD is large, even in years with high QLC. In addition, QLC is also estimated from smaller areas of gauged flow and, therefore, has greater uncertainty than QLD. In addition, total flows into Buffalo Pound Lake are not coherent with DOC (at short or long timescales; Table 1). Because QBP combines flows from Lake Diefenbaker and parts of the local catchment, this indicator may obscure relationships by integrating different mechanisms by which the two flow sources impact chemistry (e.g., greater allochthonous inputs from the local catchment and more dilute waters from Lake Diefenbaker).
Ultimately, the lack of statistical significance between QLC and lake DOC does not negate the likely importance of catchment DOC inputs to Buffalo Pound Lake. Due to the fact that there are only two flow sources to the lake and our analysis revealed a flushing effect of QLD, we would not expect this flushing to occur without the input of water of a different chemical character from the catchment. The wettest multiyear period in the long-term record (2010–2015) coincided with a prolonged period of DOC increase in Buffalo Pound Lake (Fig. 3), suggesting that a pulse of inflows from the local catchment influenced DOC and that the local catchment is likely an important source of allochthonous DOC when the QLC magnitude is large. Existing streamflow data from the local catchment indicate much higher DOC concentrations than in Buffalo Pound Lake. The Ridge Creek and Iskwao Creek DOC concentrations are each on the order of 20 mg L−1 (Saskatchewan Water Security Agency, unpublished data), while water diverted from Lake Diefenbaker is similar to the minimum observed concentrations in Buffalo Pound Lake (< 5 mg L−1; Saskatchewan Water Security Agency, unpublished data). Further, observed increases in lake DOC due to autochthony and other in-lake processes are modest (Baron, 2023): DOC concentrations measured at eight locations along the length of Buffalo Pound Lake from 2016 to 2019 showed a 1.2 mg L−1 increase from near the lake's inflow to near its outflow. In contrast, DOC concentrations from all lake locations over this period ranged from 3.7 to 8.1 mg L−1 (Baron, 2023), As such, increases in DOC from autochthonous sources are unlikely to be the driving factor in the observed across-year increases in DOC. It is important to emphasize that QLD is reduced when QLC is high. This is a management-driven relationship that stems from the need to maintain stable water levels and limit downstream water transfers during wet periods (due to flooding effects). However, reducing the inputs from Lake Diefenbaker (QLD) when the inputs from the local catchment are high reduces the likelihood that higher-DOC waters will be flushed.
4.2 DOC and chemical predictor relationships
Dissolved organic carbon was not the only chemical variable that underwent dramatic change within Buffalo Pound over the study period. Indeed, 6-fold variation in the concentration of SO was observed (Fig. 2d). At short timescales (≤18 months), DOC lagged behind SO on average, but this relationship was strongly in phase at long timescales (> 18 months), suggesting that within-year or seasonal DOC and SO dynamics may differ; however, the patterns in these chemical variables become more synchronous at longer timescales. The rapid rise and fall in DOC and SO concentrations in the 2010s may be linked to both internal and external processes. The majority of SO fluxes to lakes come from soils and wetlands in the catchment, often in mineral form or bound in allochthonous organic matter containing oxygen-bound S (e.g., as ester-SO4 or other organo-SO4 species) (Couture et al., 2016), helping to explain coherence between SO and DOC. Much like prairie catchments have high DOC, they can also have high SO, again, due to soil and wetland pools. Pothole ponds have a wide range of SO concentrations (median levels of 163 (mean: 519) mg L−1), with some ponds reaching concentrations of 5500 mg L−1 (Miranda and Whitfield, 2024), typically much higher than in many other regions, owing to sulfur-rich geologic sources and the potential for evapoconcentration in surface waters. Prairie soils can be similarly high in SO (Fennell and Bentley, 1998). In contrast, annually measured SO samples at Lake Diefenbaker from 1990 to 2019 showed median concentrations of only 58 mg L−1 and maxima of < 90 mg L−1 (John-Mark Davies, unpublished data), which are values near the low range of SO seen in Buffalo Pound Lake. The much higher median Ridge Creek SO concentrations (estimated at ∼1094 mg L−1; unpublished data) combined with below-average QLD (and higher QLC) in the early 2010s under more “natural” flow conditions mean that catchment SO sources must have contributed to the higher Buffalo Pound Lake SO concentrations during the latter part of the observation record. Extreme flooding across the prairies in 2011 could have created an exceptional fill-and-spill (Shaw et al., 2012) scenario (see Nachshon et al., 2014; Shook and Pomeroy, 2012), during which water containing elevated levels of SO and DOC was transported via runoff from spilling pothole ponds to Buffalo Pound Lake. Similar mechanisms were likely important in 2014 and 2015, 2 years with periods of high precipitation in the region (WSA, 2018) and above-average catchment inflows, when SO and DOC concentrations further increased. There is also the potential that groundwater may be infusing minerals, such as SO, into the lake (BPWTP, 2022), and analogous patterns have been observed during multiyear wet periods that have led to the activation of subsurface flow pathways that transport solutes from the soil to surface water (Draude, 2025). Prairie soils and lake sediments rich in gypsum (CaSO4) and pyrite (FeS2) deposited during glaciation 10 000 years ago may also play a role. The reoxidation of lake sediments rich in H2S, CaSO4, FeS2, and other sulfides can also increase surface water SO concentrations (Holmer and Storkholm, 2001); moveover, in freshwater sediments, high rates of oxidation of reduced S compounds can shift the sediments from net sinks to sources of SO (Holmer and Storkholm, 2001), particularly if groundwater SO sources to the lake are not high.
Lake DOC concentrations in cold regions tend to vary both seasonally and inter-annually. Our results highlight in-phase relationships of DOC and TP, Chl a, and NH (Table 1). Seasonal cycles alter the rates of biological DOC production and hydrological export (Clark et al., 2010), and DOC influxes often peak during spring snowmelt, whereas biological DOC production peaks in summer (Buffam et al., 2007; Clark et al., 2010; Laudon et al., 2004). In cold regions where lakes are ice-covered for a portion of the year, DOC exclusion from ice can be important for driving winter metabolism and DOC concentrations (Guo et al., 2012; Kurek et al., 2022), whereas photo- and biodegradation processes (Hansen et al., 2016) and autochthonous DOC production (Baron, 2023) may dominate during the open-water season. In many lakes, the seasonal variation in the DOC concentration can be 1–2 orders of magnitude greater than the long-term rate of change over decadal timescales (Clark et al., 2010). Within Buffalo Pound Lake, we observed both high inter- and intra-annual variability in the DOC concentration, with fluctuation as high as 7 mg L−1 within a single year.
Total phosphorus, Chl a, and NH concentrations were strongly in phase with DOC at short timescales, indicating that increases in these three variables are accompanied by increases in DOC. Total phosphorus remained strongly in phase at long timescales (Table 1). Possible mechanisms for these relationships include (1) internal production and transformations and (2) synchronous inputs of nutrients and allochthonous DOC from the local catchment, as expected from SO behaviour. We anticipate that the latter plays a more prominent role, given the modest DOC increases as water moves through the lake (above). Using SO, TP, NH, Chl a, and QLD as predictors in a GAM describing DOC explained 56 % of the deviance in the DOC concentrations observed over this 30-year data set, where all predictors were significant except for Chl a. This result presents evidence that the DOC concentration in Buffalo Pound Lake is strongly linked to in-lake nutrient and solute chemistry in addition to its major flow source, Lake Diefenbaker. We attempted to incorporate time-lagged relationships of DOC with SO and QLD into the GAM approach; however, a feature of wavelet coherence analysis is that phase relationships can only be determined on average over the timescale of interest (J. Walter personal communication, 2022), and thus specific time lags (e.g., 6 months or 24 months) cannot be accurately measured with this approach. The true time-lag relationship between QLD and DOC also likely varies depending on flow magnitude. To assess concerns over potential collinearity between DOC and TP, we ran a GAM with SRP in place of TP but found no discernable differences in model results.
Strong in-phase coherence between DOC and TP at both short and long timescales and the strong linear effect of TP on DOC (Fig. 4e) suggest that there is synchrony in the processes influencing DOC and TP in Buffalo Pound Lake. As with SO, prairie ponds can also be important phosphorus (P) sources to downstream lakes during periods of elevated catchment flow, particularly because ponds high in SO tend to have greater sediment P release rates (Jensen et al., 2009). Spring TP concentrations measured at ∼150 ponds across the prairie region in 2019 revealed mean TP concentrations in excess of 500 µg P L−1 (McFarlan, 2021); when water is mobilized from the catchment through wetland fill-and-spill behaviour (Shaw et al., 2012), QLC is elevated and increased nutrient export from the catchment to the lake is expected. Periods of water flow from the catchment also prompt lower QLD, as less water is diverted from Lake Diefenbaker, during the natural flow events. This would reduce the dilution effects of Lake Diefenbaker inputs for both DOC and TP. Sediment processes may also support this coherence. Larger pulses of internal P released from sediments during transient stratification events could be linked to mid-summer algal blooms (D'Silva, 2017; Painter et al., 2023), potentially supporting pulses of greater autochthonous DOC production. In addition, anoxia and organic P are important to internal P loading in lakes further downstream (Wauchope-Thompson et al., 2024) which could similarly support in-phase DOC and TP relationships at shorter timescales.
The Chl a concentration, a measure of algal abundance, was not significant in the GAM but showed in-phase coherence with DOC concentrations at short timescales, suggesting a seasonal effect associated with cyanobacterial/algal biomass in the lake. Inefficient conversion of light energy to organic molecules during photosynthesis means that a portion of the organic materials produced by algal cells are released as DOM/DOC to ambient water over the lifetime of the algae (Fogg, 1966; Myklestad, 1995). Extracellular DOC release, via the overflow model (Fogg, 1966, 1983; Williams, 1990) or the passive diffusion model (Bjørnsen, 1988; Fogg, 1966), has been shown to be an important source of autochthonous DOC, where up to 5 %–35 % of fixed organic carbon may be release immediately as DOM, often with high proportions of DOC (Carlson and Hansell, 2015). Other mechanisms for the release of autochthonous carbon, such as release by grazers and following sedimentation, are also likely important (Keller and Hood, 2011). Additionally, DOC concentrations can increase by 1–2 mg L−1 between the Buffalo Pound Lake inflow and outflow in years dominated by flow from Lake Diefenbaker (Baron, 2023), consistent with autochthonous production and the potential for extracellular release.
Observed in-phase coherence between DOC and NH at short timescales and the significance of NH as a predictor of DOC in the GAM may be related to several mechanisms. The lake is sometimes N-limited (Swarbrick et al., 2019), suggesting that increased NH could support increased productivity as well as autochthonous production. This temperate lake is also highly seasonal, with major summer blooms (Painter et al., 2022, 2023), followed by long, cold winter periods when the lake is ice-covered and NH dynamics undergo rapid change (Cavaliere and Baulch, 2020). The early-winter phase is marked by increasing NH concentrations associated with decreased autotrophy, oxygen depletion, and organic matter mineralization. We observed several years during which DOC concentrations decreased in the early-winter period. The late-winter phase shows a decline in NH likely associated with biotic uptake. Seasonal variation in the DOC : DON ratios are also apparent (Fig. S6). Higher C : N ratios occur under ice cover and then decrease beginning around spring ice-off (∼100th day of year), reaching a minima in late summer, concurrent with seasonal maximum Chl a concentrations.
4.3 Flow management and effective water treatment
Flood risk and drought underpin water management concerns in the Prairie region; cyclic wet–dry phases mean that these systems frequently alternate between years of having too much or too little water associated with elevated flood and drought risk, respectively. Examples include extensive flooding in 2011 and 2014, a major drought from 1999 to 2004, and extreme drought conditions in recent years (2021–2023). Natural and managed flow scenarios associated with wet–dry cycles each present challenges for Buffalo Pound Lake water quality and for the Buffalo Pound Water Treatment Plant (BPWTP). Our analysis highlights the importance of flows from Lake Diefenbaker as a means of “flushing” the lake and contributing to lower DOC concentrations. While our analysis did not yield significant relationships between QLC and DOC at long timescales, this may be partly attributed to the intermittent nature of this flow source. Given that there are only two flow sources in this system, we argue that the flushing mechanism identified for QLD would not likely exist if years with high local catchment flows (natural flow scenario) were not contributing to high DOC and poor water quality. These conditions can take years to dissipate. For example, during a prolonged drought from 1999 to 2005, specific ultraviolet absorbance at 254 nm normalized to DOC concentration (SUVA254) values were very low (∼0.9–1.6 L mg C−1 m−1 over this period), but SUVA254 exceeded 2.5 L mg C−1 m−1 after a very wet 2011 that resulted in extensive flooding and then remained above 1.5 L mg C−1 m−1 into 2019 (Baron, 2023; Fig. S7).
There are important trade-offs here that include balancing the provision of water from Buffalo Pound Lake to meet the needs of ∼300 000 people. While QLD has a flushing effect, diverting additional water during wetter periods when more source water originates from the local catchment, to manage DOC concentrations (and support drinking water treatment), can be expected to exacerbate downstream flooding and is currently avoided. It should be noted that dry conditions that prompt elevated flows from Lake Diefenbaker to Buffalo Pound Lake also represent a trade-off, as this diversion of water means that less flow is available for hydroelectric power generation via water exiting Lake Diefenbaker to the South Saskatchewan River at the Gardiner Dam. Diversions to maintain Buffalo Pound Lake levels during dry phases have also been associated with worsening algal blooms in Buffalo Pound Lake, in terms of magnitude (Painter et al., 2022), and coincide with autochthonous DOC production in the lake (e.g., Baron, 2023). Periods of elevated DOC under either flow scenario can create added challenges and costs for the BPWTP to maintain safe drinking water standards. Disinfection byproduct formation is a major concern for the BPWTP (Williams et al., 2019), particularly when the DOC concentration is high. Under these circumstances, the BPWTP has used a pre-chlorination step to reduce algal growth and prevent rising floc (organic materials that coalesce and resist coagulation) that can impact treatment capacity by accumulating on filtration media (Painter et al., 2022). Pre-chlorination has typically been used in summer months when algae are abundant in Buffalo Pound Lake (Painter et al., 2022); however, this can make it difficult for the BPWTP to meet regulatory limits for trihalomethanes in years in which DOC is also elevated (BPWTP, 2016). Untreated DOC can also contribute to poor taste and odour problems (Matilainen et al., 2011).
Environmental flows represent a framework that could be used to better manage the competing needs for drinking water and the hydrological functions of the reservoir, as well as its critical fish and wildlife habitat. The variable magnitude, timing, and water quality of flows from two water sources and the impacts on DOC underscore some of the complexity that would accompany the development of environmental flow rules for Buffalo Pound Lake. Maintaining stable water levels within the lake to limit valley slumping and erosion is important (SERM, 2001), and competing regional priorities for freshwater, including hydropower production, flood control, and irrigation, are also key factors in water management (WSA, 2013; Wheater and Gober, 2013). Water quality concerns are broad and include increasing nutrient inputs to agricultural lands; agricultural drainage of wetlands, which can have major impacts on catchment streamflow (Spence et al., 2022); effluent disposal practices on agricultural land; leaking septic fields; and pollution from tourism and recreational activities. Ultimately, concurrent efforts to consider environmental flow rules and advance source-water protection could help ensure that the maximum benefit is attained from current investments in upgraded water treatment.
Our novel analysis of a rare long-term observational record for a prairie reservoir demonstrates the relationship of DOC with the flow source and several water chemistry variables. Both the water quality indicators, including DOC, and flow source show high variability at both long and short timescales. Total phosphorus and NH concentrations are synchronous with DOC and in phase, an observation which could reflect synchronous inputs (driven by high solute inputs from the local catchment), autochthony, and seasonal nutrient and organic matter dynamics (across ice-covered and open-water seasons). Sulfate, which was also highly variable over the 30-year period, was synchronous and in phase with DOC, revealing the close link between solutes and DOC sourced from the local catchment. Most critically for management, the flow source (strongly influenced by climatic and hydrologic variability) is an important control on the DOC concentration via the diluting effects of an upstream reservoir. This reservoir, with its waters primarily originating in mountain headwaters, plays an important role in flushing Buffalo Pound Lake, contributing to lower DOC concentrations at longer timescales (>18 months). In this system, where wet periods stimulating more flow from the local catchment lead to less water being diverted from Lake Diefenbaker to the Qu'Appelle River, this also suggests that catchment source waters can contribute to poorer-quality lake water. If the prairies experience higher precipitation that yields more catchment runoff under a changing climate, higher allochthonous inputs of DOC, as well as inputs of nutrients and other solutes, can be expected to further degrade water quality in the lake, making drinking water treatment increasingly difficult. Importantly, management to control the water level and flood risk can be in tension with managing flows for water quality, due to the need to reduce flushing inflows to manage the water level and downstream flooding. Advancing environmental flow rules may help balance competing goals in this water-insecure region that is already subject to major climatic and water stressors.
The streamflow data used for flow reconstruction, wavelet analyses, and GAM in the study are not openly available online, but they may be requested via https://www.wsask.ca/contact-us/ (WSA, 2025). Chemical data used for wavelet analyses and GAM from the water treatment plant are not publicly available. Access to the data for researchers can be provided through the Buffalo Pound Water Treatment Plant (Blair Kardash, blairk@buffalopoundwtp.ca), subject to agreements, which may include non-disclosure. Additional supporting information on the Water Treatment Plant and its operations are available via annual reports at https://www.buffalopoundwtp.ca/publications/annual-report (BPWTP, 2025).
The supplement related to this article is available online at https://doi.org/10.5194/hess-29-1449-2025-supplement.
AAPB: conceptualization, methodology, software, formal analysis, data curation, writing – original draft, writing – review and editing, and visualization; HMB: conceptualization, methodology, investigation, data curation, writing – review and editing, supervision, project administration, and funding acquisition; CJW: conceptualization, methodology, investigation, data curation, writing – review and editing, supervision, project administration, and funding acquisition; AN: conceptualization, methodology, formal analysis, and writing – review and editing.
Helen M. Baulch has been funded by the Buffalo Pound Water Treatment Corporation, which uses water from this system for drinking water supply. She has also been funded by the Saskatchewan Water Security Agency, which is responsible for flow management and decisions, including agricultural drainage. Colin J. Whitfield also engages with both partners regarding science needs and water security issues in the prairies.
Publisher’s note: Copernicus Publications remains neutral with regard to jurisdictional claims made in the text, published maps, institutional affiliations, or any other geographical representation in this paper. While Copernicus Publications makes every effort to include appropriate place names, the final responsibility lies with the authors.
Many thanks are owed to Blair Kardash, Laboratory Manager at the Buffalo Pound Water Treatment Plant, for stewardship of treatment plant data, insights into the Buffalo Pound Lake ecosystem, and cooperation throughout the project, as well as to the Buffalo Pound Water Treatment Plant for chemical analyses. We also thank John-Mark Davies from the Saskatchewan Water Security Agency (WSA), for sharing perspective and knowledge from many years of working in this catchment, and the WSA, for provision of streamflow data. Moreover, we wish to thank Jonathon Walter and Lawrence Sheppard for guidance on wavelet analyses. We acknowledge members of the SaskWatChe and Bigfoot labs for their support and feedback from the inception of this work. Feedback from two anonymous reviewers on an earlier draft are greatly appreciated, as they helped us to improve this work.
Research funding for this work was provided by the NSERC Discovery Grants program (to Helen M. Baulch and Colin J. Whitfield) and an NSERC Graduate Scholarship – master's program (to Anthony A. P. Baron). Funding was also provided through an academic–industry partnership with the Buffalo Pound Water Treatment Plant supported by the Mitacs Accelerate program, along with ongoing funding of the Buffalo Pound Water Treatment Plant for operations. Additional funding was provided through the Career Launcher Internship program, offered by Colleges and Institutes Canada as part of the Government of Canada's Youth Employment and Skills Strategy.
This paper was edited by Rohini Kumar and reviewed by two anonymous referees.
Addison, P. S.: The Illustrated Wavelet Transform Handbook: Introductory Theory and Applications in Science, Engineering, Medicine and Finance, 2nd Edition, CRC Press, Boca Raton, 464 pp., https://doi.org/10.1201/9781315372556, 2017.
Ali, G. and English, C.: Phytoplankton blooms in Lake Winnipeg linked to selective water-gatekeeper connectivity, Sci. Rep. 9, 8395, https://doi.org/10.1038/s41598-019-44717-y, 2019.
Altman, N. S.: An introduction to kernel and nearest-neighbor nonparametric regression, Am. Stat. 46, 175–185, https://doi.org/10.1080/00031305.1992.10475879, 1992.
American Public Health Association (APHA): Standard Methods for the Examination of Water and Wastewater, 22nd Edition, edited by: Rice, E. W., Baird, R. B., Eaton, A. D., and Clesceri, L. S., APHA, American Water Works Association (AWWA), and Water Environment Federation (WEF), Washington, D.C., 724 pp., ISBN 9780875530130, 2012.
Arts, M. T., Robarts, R. D., Kasai, F., Waiser, M. J., Tumber, V. P., Plante, A. J., Rai, H., and De Lange, H. J.: The attenuation of ultraviolet radiation in high dissolved organic carbon waters of wetlands and lakes on the northern Great Plains, Limnol. Oceanogr. 45, 292–299, https://doi.org/10.4319/lo.2000.45.2.0292, 2000.
Baddeley, A., Rubak, E., and Turner, R.: Spatial Point Patterns: Methodology and Applications with R, Chapman and Hall/CRC, London, ISBN 9781482210200, 2015.
Baron, A. A. P.: Water source, climate, and water chemistry combine to influence DOC concentration and DOM quality in Buffalo Pound Lake, Saskatchewan, Master's thesis, School of Environment and Sustainability, University of Saskatchewan, Canada, 151 pp., https://hdl.handle.net/10388/14623 (last access: 18 February 2025), 2023.
Björnerås, C., Weyhenmeyer, G. A., Evans, C. D., Gessner M. O., Grossart, H.-P., Kangur, K., Kokorite, I., Kortelainen, P., Laudon, H., Lehtoranta, J., Lottig, N., Monteith, D. T., Nõges, P., Nõges, T., Oulehle, F., Riise, G., Rusak, J. A., Räike, A., Sire, J., Sterling, S., and Kritzberg, E. S.: Widespread Increases in Iron Concentration in European and North American Freshwaters, Global Biogeochem. Cy. 31, 1488–1500, https://doi.org/10.1002/2017GB005749, 2017.
Bjørnsen, P. K.: Phytoplankton exudation of organic matter: why do healthy cells do it?, Limnol. Oceanogr. 33, 151–154, https://doi.org/10.4319/lo.1988.33.1.0151, 1988.
Buffalo Pound Water Treatment Plant (BPWTP): Buffalo Pound Water Treatment Plant Annual Report 2015, Regina and Moose Jaw, Sask., Canada, 60 pp., https://www.buffalopoundwtp.ca/images/docs/2016_buffalo_pound_annual_report.pdf (last access: 8 March 2025), 2016.
Buffalo Pound Water Treatment Plant (BPWTP): Buffalo Pound Water Treatment Plant Annual Report 2019, Regina and Moose Jaw, Sask., Canada, 72 pp., https://www.buffalopoundwtp.ca/images/content/annual-report-2020.pdf (last access: 8 March 2025), 2020.
Buffalo Pound Water Treatment Plant (BPWTP): Buffalo Pound Water Treatment Plant Annual Report 2021, Regina and Moose Jaw, Sask., Canada, 77 pp., https://www.buffalopoundwtp.ca/images/docs/2022_buffalo_pound_annual_report.pdf (last access: 8 March 2025), 2022.
Buffalo Pound Water Treatment Plant (BPWTP): Buffalo Pound Annual Report Water Quality Data, https://www.buffalopoundwtp.ca/publications/annual-report, last access: 8 March 2025.
Buffam, I., Laudon, H., Temnerud, J., Mörth, C., and Bishop, K.: Landscape-scale variability of acidity and dissolved organic carbon during spring flood in a boreal stream network, J. Geophys. Res.-Biogeo., 112, G01022, https://doi.org/10.1029/2006JG000218, 2007.
Carlson, C. A. and Hansell, D. A.: Chapter 3 – DOM Sources, Sinks, Reactivity, and Budgets, in: Biogeochemistry of Marine Dissolved Organic Matter, edited by: Hansell, D. A. and Carlson, C. A., Academic Press, 65–126, https://doi.org/10.1016/B978-0-12-405940-5.00003-0, 2015.
Casson, N. J., Wilson, H. F., and Higgins, S. M.: Hydrological and Seasonal Controls of Phosphorus in Northern Great Plains Agricultural Streams, J. Environ. Qual., 48, 978–987, https://doi.org/10.2134/jeq2018.07.0281, 2019.
Cavaliere, E. and Baulch, H. M.: Winter in two phases: Long-term study of a shallow reservoir in winter, Limnol. Oceanogr., 66, 1335–1352, https://doi.org/10.1002/lno.11687, 2020.
Clark, J. M., Bottrell, S. H., Evans, C. D., Monteith, D. T., Bartlett, R., Rose, R., Newton, R. J., and Chapman, P. J.: The importance of the relationship between scale and process in understanding long-term DOC dynamics, Sci. Total Environ. 408, 2768–2775., https://doi.org/10.1016/j.scitotenv.2010.02.046, 2010.
Clark, M. P. and Shook, K. R.: The Numerical Formulation of Simple Hysteretic Models to Simulate the Large-Scale Hydrological Impacts of Prairie Depressions, Water. Resour. Res., 58, e2022WR032694, https://doi.org/10.1029/2022WR032694, 2022.
Cooke, G. D. and Kennedy, R. H.: Managing Drinking Water Supplies, Lake Reserv. Manage., 17, 157–174, https://doi.org/10.1080/07438140109354128, 2001.
Couture, R.-M., Fischer, R., Van Cappellen, P., and Gobeil, C.: Non-steady state diagenesis of organic and inorganic sulfur in lake sediments, Geochim. Cosmochim. Ac., 194, 15–33, https://doi.org/10.1016/j.gca.2016.08.029, 2016.
Couture, S., Houle, D., and Gagnon, C.: Increases of dissolved organic carbon in temperate and boreal lakes in Quebec, Canada, Environ. Sci. Pollut. R., 19, 361–371, https://doi.org/10.1007/s11356-011-0565-6, 2011.
D'Silva, L. P.: Biological and physicochemical mechanisms affecting phosphorus and arsenic efflux from prairie reservoir sediment, Buffalo Pound Lake, SK, Canada, Master's thesis, College of Toxicology, University of Saskatchewan, Canada, 134 pp., http://hdl.handle.net/10388/7741 (last access: 18 February 2025), 2017.
Dillon, P. J. and Molot, L. A.: Effect of landscape form on export of dissolved organic carbon, iron, and phosphorus from forested stream catchments, Water Resour. Res., 33, 2591–2600, https://doi.org/10.1029/97WR01921, 1997.
Dillon, P. J. and Molot, L. A.: Long-term trends in catchment export and lake retention of dissolved organic carbon, dissolved organic nitrogen, total iron, and total phosphorus: The Dorset, Ontario, study, 1978–1998, J. Geophys. Res., 110, G01002, https://doi.org/10.1029/2004JG000003, 2005.
Draude, A.: The fate of sulphate: transport and distribution of salt in the Prairie Pothole Region over multiple climate phases, Master's thesis, School of Environment and Sustainability, University of Saskatchewan, Canada, 71 pp., 2025.
Eimers, M. C., Watmough, S. A., and Buttle, J. M.: Long-term trends in dissolved organic carbon concentration: a cautionary note, Biogeochemistry, 87, 71–81, https://doi.org/10.1007/s10533-007-9168-1, 2008.
Evans, C. D., Monteith, D. T., and Cooper, D. M.: Long-term increases in surface water dissolved organic carbon: Observations, possible causes and environmental impacts, Environ. Pollut., 137, 55–71, https://doi.org/10.1016/j.envpol.2004.12.031, 2005.
Evans, C. D., Chapman, P. J., Clark, J. M., Monteith, D. T., and Cresser, M. S.: Alternative explanations for rising dissolved organic carbon export from organic soils, Glob. Change Biol., 12, 2044–2053, https://doi.org/10.1111/j.1365-2486.2006.01241.x, 2006.
Evans, C. D., Goodale, C. L., Caporn, S. J. M., Dise, N. B., Emmett, B. A., Fernandez, I. J., Field, C. D., Findlay, S. E. G., Lovett, G. M., Meesenburg, H., Moldan, F., and Sheppard, L. J.: Does elevated nitrogen deposition or ecosystem recovery from acidification drive increased dissolved organic carbon loss from upland soil? A review of evidence from field nitrogen addition experiments, Biogeochemistry, 91, 13–35, https://doi.org/10.1007/s10533-008-9256-x, 2008.
Fang, X., Minke, A., Pomeroy, J., Brown, T., Westbrook, C., Guo, X., and Guangul, S.: A review of Canadian Prairie hydrology: Principles, modelling and response to land use and drainage change, Center for Hydrology Report #2, Saskatoon, Sask., 35 pp., https://hdl.handle.net/10388/15163 (last access: 18 February 2025), 2007.
Fasching, C., Wilson, H. F., D'Amario, S. C., and Xenopoulos, M. A.: Natural Land Cover in Agricultural Catchments Alters Flood Effects on DOM Composition and Decreases Nutrient Levels in Streams, Ecosystems, 22, 1530–1545, https://doi.org/10.1007/s10021-019-00354-0, 2019.
Fennell, J. and Bentley, L. R.: Distribution of sulfate and organic carbon in a prairie till setting: Natural versus industrial sources, Water Resour. Res., 34, 1781–1794, https://doi.org/10.1029/98WR00827, 1998.
Finlay, K., Vogt, R., Simpson, G., and Leavitt, P.: Seasonality of pCO2 in a hard-water lake of the northern Great Plains: The legacy effects of climate and limnological conditions over 36 years, Limnol. Oceanogr., 64, S118–S129, https://doi.org/10.1002/lno.11113, 2019.
Fix, E. and Hodges, J. L.: Discriminatory Analysis. Nonparametric Discrimination: Consistency Properties, United States Air Force School of Aviation Medicine, Randolph Field, Texas, 28 pp., https://doi.org/10.2307/1403797, 1951.
Fogg, G. E.: The extracellular products of algae, Oceanogr. Mar. Biol., 4, 195–212, 1966.
Fogg, G. E.: The ecological significance of extracellular products of phytoplankton, Bot. Mar., 26, 3–14, https://doi.org/10.1515/botm.1983.26.1.3, 1983.
Futter, M. N., Valinia, S., Löfgren, S., Köhler, S. J., and Fölster, J.: Long-term trends in water chemistry of acid-sensitive Swedish lakes show slow recovery from historic acidification, AMBIO, 43, 77–90, https://doi.org/10.1007/s13280-014-0563-2, 2014.
Godwin, R. B. and Martin, F. R. J.: Calculation of gross and effective drainage areas for the Prairie Provinces, in: Canadian Hydrology Symposium – 1975 Proceedings, 11–14 August 1975, Winnipeg, Manitoba, Associate Committee on Hydrology, National Research Council of Canada, 219–223, 1975.
Grinsted, A., Moore, J. C., and Jevrejeva, S.: Application of the cross wavelet transform and wavelet coherence to geophysical time series, Nonlin. Processes Geophys., 11, 561–566, https://doi.org/10.5194/npg-11-561-2004, 2004.
Guo, L., Cai, Y., Belzile, C., and Macdonald, R. W.: Sources and export fluxes of inorganic and organic carbon and nutrient species from the seasonally ice-covered Yukon River, Biogeochemistry, 107, 187–206, https://doi.org/10.1007/s10533-010-9545-z, 2012.
Haig, H. A., Hayes, N. M., Simpson, G. L., Yi, Y., Wissel, B., Hodder, K. R., and Leavitt, P. R.: Effects of seasonal and interannual variability in water isotopes (δ2H, δ18O) on estimates of water balance in a chain of seven prairie lakes, J. Hydrol. X, 10, 100069, https://doi.org/10.1016/j.hydroa.2020.100069, 2021.
Hammer, U. T.: Limnological Studies of the Lakes and Streams of the Upper Qu'Appelle River System, Saskatchewan, Canada: I. Chemical and Physical Aspects of the Lakes and Drainage System, Hydrobiologia, 37, 473–507, https://doi.org/10.1007/BF00015040, 1971.
Hansen, A. M., Kraus, T. E. C., Pellerin, B. A., Fleck, J. A., Downing, B. D., and Bergamaschi, B. A.: Optical properties of dissolved organic matter (DOM): Effects of biological and photolytic degradation, Limnol. Oceanogr., 61, 1015–1032, https://doi.org/10.1002/lno.10270, 2016.
Holmer, M. and Storkholm, P.: Sulphate reduction and sulphur cycling in lake sediments: a review: Sulphate cycling in lake sediments, Freshwater Biol., 46, 431–451, https://doi.org/10.1046/j.1365-2427.2001.00687.x, 2001.
Hongve, D., Riise, G., and Kristiansen, J. F.: Increased colour and organic acid concentrations in Norwegian forest lakes and drinking water - a result of increased precipitation, Aquat. Sci., 66, 231–238, https://doi.org/10.1007/s00027-004-0708-7, 2004.
Hruška, J., Krám, P., McDowell, W. H., and Oulehle, F. Increased Dissolved Organic Carbon (DOC) in Central European Streams is Driven by Reductions in Ionic Strength Rather than Climate Change or Decreasing Acidity, Environ. Sci. Technol., 43, 4320–4326, https://doi.org/10.1021/es803645w, 2009.
Hudson, J. J., Dillon, P. J., and Somers, K. M.: Long-term patterns in dissolved organic carbon in boreal lakes: the role of incident radiation, precipitation, air temperature, southern oscillation and acid deposition, Hydrol. Earth Syst. Sci., 7, 390–398, https://doi.org/10.5194/hess-7-390-2003, 2003.
Imtiazy, M. N., Hunter, K., Sereda, J., Dirk, L., and Hudson, J. J.: Effects of regional climate, hydrology and river impoundment on long-term patterns and characteristics of dissolved organic matter in semi-arid northern plains rivers, Sci. Total Environ., 870, 161961, https://doi.org/10.1016/j.scitotenv.2023.161961, 2023.
Jane, S. F., Winslow, L. A., Remucal, C. K., and Rose, K. C.: Long-term trends and synchrony in dissolved organic matter characteristics in Wisconsin, USA, lakes: Quality, not quantity, is highly sensitive to climate, J. Geophys. Res.-Biogeo., 122, 546–561, https://doi.org/10.1002/2016JG003630, 2017.
Jensen, H. S., Nielsen, O. I., Koch, M. S., and De Vicentea, I.: Phosphorus release with carbonate dissolution coupled to sulfide oxidation in Florida Bay seagrass sediments, Limnol. Oceanogr., 54, 1753–1764, https://doi.org/10.4319/lo.2009.54.5.1753, 2009.
Keller, D. P. and Hood, R. R.: Modeling the seasonal autochthonous sources of dissolved organic carbon and nitrogen in the upper Chesapeake Bay, Ecol. Model., 5, 1139–1162, https://doi.org/10.1016/j.ecolmodel.2010.12.014, 2011.
Kortelainen, P.: Content of Total Organic Carbon in Finnish Lakes and Its Relationship to Catchment Characteristics, Can. J. Fish. Aquat. Sci., 50, 1477–1483, https://doi.org/10.1139/f93-168, 1993.
Kurek, M. R., Frey, K. E., Guillemette, F., Podgorski, D. C., Townsend-Small, A., Arp, C. D., Kellerman, A. M., and Spencer, R. G. M.: Trapped Under Ice: Spatial and Seasonal Dynamics of Dissolved Organic Matter Composition in Tundra Lakes, J. Geophys. Res.-Biogeo., 127, e2021JG006578, https://doi.org/10.1029/2021JG006578, 2022.
Labaugh, J. W., Winter, T. C., Adomaitis, V. A., and Swanson, G. A.: Hydrology and chemistry of selected prairie wetlands in the Cottonwood Lake area, Stutsman County, North Dakota, 1979–82, Professional Paper 1431, U.S. Geol. Surv., 26 pp., https://doi.org/10.3133/pp1431, 1987.
Laudon, H., Kohler, S., and Buffam, I.: Seasonal TOC export from seven boreal catchments in northern Sweden, Aquat. Sci., 66, 223–230, https://doi.org/10.1007/s00027-004-0700-2, 2004.
Laudon, H., Berggren, M., Ågren, A., Buffam, I., Bishop, K., Grabs, T., Jansson, M., and Köhler, S.: Patterns and Dynamics of Dissolved Organic Carbon (DOC) in Boreal Streams: The Role of Processes, Connectivity, and Scaling, Ecosystems, 14, 880–893, https://doi.org/10.1007/s10021-011-9452-8, 2011.
LeChevallier, M. W., Welch, N. J., and Smith, D. B.: Full-scale studies of factors related to coliform regrowth in drinking water, Appl. Environ. Microb., 62, 2201–2211, https://doi.org/10.1128/aem.62.7.2201-2211.1996, 1996.
Martin, F. R. J.: Addendum No. 8 to Hydrology Report #104, Agriculture and Agri-Food Canada PFRA Technical Service, Regina, Sask., 109 pp., https://publications.gc.ca/collections/collection_2024/eccc/A58-6-104-8-eng.pdf (last access: 18 February 2025), 2001.
Matilainen, A., Gjessing, E. T., Lahtinen, T., Hed, L., Bhatnagar, A., and Sillanpää, M.: An overview of the methods used in the characterisation of natural organic matter (NOM) in relation to drinking water treatment, Chemosphere, 83, 1431–1442, https://doi.org/10.1016/j.chemosphere.2011.01.018, 2011.
McCormack, A. and Erlich, A.: mapcan: Tools for Plotting Canadian Choropleth Maps and Choropleth Alternatives, version 0.0.1, https://doi.org/10.32614/CRAN.package.mapcan, 2019.
McFarlan, L. S.: Where's the P in prairie potholes? Identifying patterns of phosphorus accumulation in Canadian prairie wetlands, Master's thesis, School of Environment and Sustainability, University of Saskatchewan, Canada, 98 pp., https://hdl.handle.net/10388/13524 (last access: 18 February 2025), 2021.
McGowan, S., Leavitt, P. R., and Hall, R. I.: A Whole-Lake Experiment to Determine the Effects of Winter Droughts on Shallow Lakes, Ecosystems 8, 694–708, https://doi.org/10.1007/s10021-003-0152-x, 2005.
Mekonnen, B. A., Nazemi, A., Mazurek, K. A., Elshorbagy, A., and Putz, G.: Hybrid modelling approach to prairie hydrology: fusing data-driven and process-based hydrological models, Hydrolog. Sci. J., 60, 1473–1489, https://doi.org/10.1080/02626667.2014.935778, 2015.
Miranda, L. T. and Whitfield, C. J.: Seasonal patterns and key chemical predictors of dissolved greenhouse gases in small prairie pothole ponds, FACETS, 9, 1–18, https://doi.org/10.1139/facets-2023-0134, 2024.
Monteith, D. T., Stoddard, J. L., Evans, C. D., De Wit, H. A., Forsius, M., Høgåsen, T., Wilander, A., Skjelkvåle, B. L., Jeffries, D. S., Vuorenmaa, J., Keller, B., Kopácek, J., and Vesely, J.: Dissolved organic carbon trends resulting from changes in atmospheric deposition chemistry, Nature, 450, 537–540, https://doi.org/10.1038/nature06316, 2007.
Morling, K., Herzsprung, P., and Kamjunke, N.: Discharge determines production of, decomposition of and quality changes in dissolved organic carbon in pre-dams of drinking water reservoirs, Sci. Total Environ., 577, 329–339, https://doi.org/10.1016/j.scitotenv.2016.10.192, 2017.
Musolff, A., Selle, B., Büttner, O., Opitz, M., Knorr, K.-H., Fleckenstein, J. H., Reemtsma, T., and Tittl, J.: Does iron reduction control the release of dissolved organic carbon and phosphate at catchment scales? Need for a joint research effort, Glob. Change Biol., 23, e5–e6, https://doi.org/10.1111/gcb.13758, 2017.
Myklestad, S. M.: Release of extracellular products by phytoplankton with special emphasis on polysaccharides, Sci. Total Environ., 165, 155–164, https://doi.org/10.1016/0048-9697(95)04549-G, 1995.
Nachshon, U., Ireson, A., van der Kamp, G., Davies, S. R., and Wheater, H. S.: Impacts of climate variability on wetland salinization in the North American prairies, Hydrol. Earth Syst. Sci., 18, 1251–1263, https://doi.org/10.5194/hess-18-1251-2014, 2014.
Osburn, C. L., Wigdahl, C. R., Fritz, S. C., and Saros, J. E.: Dissolved organic matter composition and photoreactivity in prairie lakes of the U.S. Great Plains, Limnol. Oceanogr., 56, 2371–2390, https://doi.org/10.4319/lo.2011.56.6.2371, 2011.
Pace, M. L. and Cole, J. J.: Synchronous variation of dissolved organic carbon and color in lakes, Limnol. Oceanogr., 47, 333–342, https://doi.org/10.4319/lo.2002.47.2.0333, 2002.
Painter, K. J., Venkiteswaran, J. J., Simon, D. F., Vo Duy, S., Sauvé, S., and Baulch, H. M.: Early and late cyanobacterial bloomers in a shallow, eutrophic lake, Environ. Sci. Process. Impacts, 24, 1212–1227, https://doi.org/10.1039/D2EM00078D, 2022.
Painter, K. J., Venkiteswaran, J. J., and Baulch, H. M.: Blooms and flows: Effects of variable hydrology and management on reservoir water quality, Ecosphere 14, e4472, https://doi.org/10.1002/ecs2.4472, 2023.
Pärn, J. and Mander, Ü.: Increased organic carbon concentrations in Estonian rivers in the period 1992-2007 as affected by deepening droughts, Biogeochemistry, 108, 351–358, https://doi.org/10.1007/s10533-011-9604-0, 2012.
Parr, T. B., Inamdar, S. P., and Miller, M. J.: Overlapping anthropogenic effects on hydrologic and seasonal trends in DOC in a surface water dependent water utility, Water Res., 148, 407–415, https://doi.org/10.1016/j.watres.2018.10.065, 2019.
Pedersen, T. L.: patchwork: The Composer of Plots, version 1.1.1, https://doi.org/10.32614/CRAN.package.patchwork, 2020.
Pham, S. V., Leavitt, P. R., McGowan, S., Wissel, B., and Wassenaar, L. I.: Spatial and temporal variability of prairie lake hydrology as revealed using stable isotopes of hydrogen and oxygen, Limnol. Oceanogr., 54, 101–118, https://doi.org/10.4319/lo.2009.54.1.0101, 2009.
Pomeroy, J. W., De Boer, and D., Martz, L. W.: Hydrology and water resources of Saskatchewan, Centre for Hydrology, 25 pp., Saskatoon, Sask., https://research-groups.usask.ca/hydrology/documents/reports/chrpt01_hydrology-water-resources-sask_feb05.pdf (last access: 18 February 2025), 2005.
Pomeroy, J. W., Gray, D. M., Brown, T., Hedstrom, N. R., Quinton, W. L., Granger, R. J., and Carey, S. K.: The cold regions hydrological model: a platform for basing process representation and model structure on physical evidence, Hydrol. Process., 21, 2650–2667, https://doi.org/10.1002/hyp.6787, 2007.
Porcal, P., Koprivnjak, J.-F., Molot, L. A., and Dillon, P. J.: Humic substances – part 7: the biogeochemistry of dissolved organic carbon and its interactions with climate change, Environ. Sci. Pollut. R., 16, 714–726, https://doi.org/10.1007/s11356-009-0176-7, 2009.
Prairie, Y. T.: Carbocentric limnology: looking back, looking forward, Can. J. Fish. Aquat. Sci., 65, 543–548, https://doi.org/10.1139/f08-011, 2008.
Prairie Farm Rehabilitation Administration (PFRA) Hydrology Division: The Determination of Gross and Effective Drainage Areas in the Prairie Provinces, Hydrology Report #104, Agriculture Canada, PFRA Engineering Branch, Regina, Sask., 22 pp., https://publications.gc.ca/collections/collection_2024/eccc/A58-6-104-eng.pdf (last access: 18 February 2025), 1983.
Pya, N. and Wood, S. N.: A note on basis dimension selection in generalized additive modelling, arXiv [preprint], https://doi.org/10.48550/arXiv.1602.06696, 2016.
R Core Team: R: A Language and Environment for Statistical Computing, version 4.1.3, R Foundation for Statistical Computing, Vienna, https://www.R-project.org (last access: 18 February 2025), 2022.
Reuman, D. C., Anderson, T. L., Walter, J. A., Zhao, L., and Sheppard, L. W.: wsyn: Wavelet Approaches to Studies of Synchrony in Ecology and Other Fields, version 1.0.4, https://doi.org/10.32614/CRAN.package.wsyn, 2021.
Rodríguez-Cardona, B. M., Wymore, A. S., Argerich, A., Barnes, R. T., Bernal, S., Brookshire, E. N. J., Coble, A. A., Dodds, W. K., Fazekas, H. M., Helton, A. M., Johnes, P. J., Johnson, S. L., Jones, J. B., Kaushal, S. S., Kortelainen, P., López-Lloreda, C., Spencer, R. G. M., Rodríguez-Murillo, J. C., Zobrist, J., and Filella, M.: Temporal trends in organic carbon content in the main Swiss rivers, 1974–2010, Sci. Total Environ., 502, 206–217, https://doi.org/10.1016/j.scitotenv.2014.08.096, 2015.
Sakia, R. M. : The Box-Cox Transformation Technique: A Review, J. R. Stat. Soc. Ser. D.-Sta., 41, 169–178, https://doi.org/10.2307/2348250, 1992.
Saskatchewan Environment and Resources Management (SERM): Buffalo Pound Lake Land Use and Resource Management Plan, Regina, Sask., 28 pp., https://pubsaskdev.blob.core.windows.net/pubsask-prod/86729/86729-English.pdf (last access: 18 February 2025), 2001.
Schiff, S. L., Aravena, R., Trumbore, S. E., Hinton, M. J., Elgood, R., and Dillon, P. J.: Export of DOC from forested catchments on the Precambrian Shield of Central Ontario: Clues from 13C and 14C, Biogeochemistry, 36, 43–65, https://doi.org/10.1023/A:1005744131385, 1997.
Schreiber, T. and Schmitz, A.: Surrogate time series, Phys. D: Nonlinear Phenom., 142, 346–382, https://doi.org/10.1016/S0167-2789(00)00043-9, 2000.
Shaw, D. A., Vanderkamp, G., Conly, F. M., Pietroniro, A., and Martz, L.: The Fill–Spill Hydrology of Prairie Wetland Complexes during Drought and Deluge, Hydrol. Process., 26, 3147–3156, https://doi.org/10.1002/hyp.8390, 2012.
Sheppard, L. W., Bell, J. R., Harrington, R., and Reuman, D. C.: Changes in large-scale climate alter spatial synchrony of aphid pests, Nat. Clim. Change, 6, 610–613, https://doi.org/10.1038/nclimate2881, 2016.
Sheppard, L. W., Reid, P., and Reuman, D. C.: Rapid surrogate testing of wavelet coherences, Nonlinear Biomed. Phys., 5, 1, https://doi.org/10.1051/epjnbp/2017000, 2017.
Sheppard, L. W., Defriez, E. J., Reid, P. C., and Reuman, D. C.: Synchrony is more than its top-down and climatic parts: interacting Moran effects on phytoplankton in British seas, PLoS Comput. Biol., 15, e1006744, https://doi.org/10.1371/journal.pcbi.1006744, 2019.
Shook, K. R. and Pomeroy, J. W. L.: Memory effects of depressional storage in Northern Prairie hydrology, Hydrol. Process., 25, 3890–3898, https://doi.org/10.1002/hyp.8381, 2011.
Shook, K. R. and Pomeroy, J. W.: Changes in the hydrological character of rainfall on the Canadian prairies, Hydrol. Process, 26, 1752–1766, https://doi.org/10.1002/hyp.9383, 2012.
Simpson, G. L.: Modelling Palaeoecological Time Series Using Generalised Additive Models, Front. Ecol. Evol., 6, 21, https://doi.org/10.3389/fevo.2018.00149, 2018.
Simpson, G. L.: gratia: Graceful “ggplot”-Based Graphics and Other Function for GAMs Fitted Using “mgcv”, version 0.6.0, https://doi.org/10.32614/CRAN.package.gratia, 2021.
Sobek, S., Tranvik, L. J., Prairie, Y. T., Kortelainen, P., and Cole, J. J.: Patterns and regulation of dissolved organic carbon: An analysis of 7,500 widely distributed lakes, Limnol. Oceanogr., 52, 1208–1219, https://doi.org/10.4319/lo.2007.52.3.1208, 2007.
Spence, C.: A paradigm shift in hydrology: Storage thresholds across scales influence catchment runoff generation, Geogr. Compass, 4, 819–833, https://doi.org/10.1111/j.1749-8198.2010.00341.x, 2010.
Spence, C., He, Z., Shook, K. R., Mekonnen, B. A., Pomeroy, J. W., Whitfield, C. J., and Wolfe, J. D.: Assessing hydrological sensitivity of grassland basins in the Canadian Prairies to climate using a basin classification-based virtual modelling approach, Hydrol. Earth Syst. Sci., 26, 1801–1819, https://doi.org/10.5194/hess-26-1801-2022, 2022.
Statistics Canada: Water File – Rivers (lines) – 2006 Census, https://open.canada.ca/data/en/dataset/1a6c9395-0b8f-40b5-b0d9-ffc74619fd74 (last access: 18 February 2025), 2006.
Statistics Canada: Water File – Lakes and Rivers (polygons) – 2011 Census, https://open.canada.ca/data/en/dataset/448ec403-6635-456b-8ced-d3ac24143add (last access: 18 February 2025), 2011.
Suen, J.-P. and Eheart, J. W.: Reservoir management to balance ecosystem and human needs: Incorporating the paradigm of the ecological flow regime, Water Resour. Res., 42, 2591–2600, https://doi.org/10.1029/2005WR004314, 2006.
Swarbrick, V. J., Simpson, G. L., Glibert, P. M., and Leavitt, P. R.: Differential stimulation and suppression of phytoplankton growth by ammonium enrichment in eutrophic hardwater lakes over 16 years, Limnol. Oceanogr., 64, S130–S149, https://doi.org/10.1002/lno.11093, 2019.
Tweedie, M. C. K.: An index which distinguishes between some important exponential families, in: Statistics: Applications and New Directions, Proceedings of the Indian Statistical Institute Golden Jubilee International Conference, 16–19 December 1981, Calcutta, India, edited by: Ghosh, J. K. and Roy, J., Indian Statistical Institute, Calcutta, India, 579–604, 1981.
Van der Kamp, G., Hayashi, M., and Gallen, D.: Comparing the hydrology of grassed and cultivated catchments in the semi-arid Canadian prairies, Hydrol. Process., 17, 559–575, https://doi.org/10.1002/hyp.1157, 2003.
Vogt, R. J., Sharma, S., and Leavitt, P. R.: Direct and interactive effects of climate, meteorology, river hydrology, and lake characteristics on water quality in productive lakes of the Canadian Prairies, Can. J. Fish. Aquat. Sci., 75, 47–59, https://doi.org/10.1139/cjfas-2016-0520, 2018.
Waiser, M. J.: Relationship between hydrological characteristics and dissolved organic carbon concentration and mass in northern prairie wetlands using a conservative tracer approach, J. Geophys. Res.-Biogeo., 111, G02024, https://doi.org/10.1029/2005JG000088, 2006.
Waiser, M. J. and Robarts, R. D.: Changes in composition and reactivity of allochthonous DOM in a prairie saline lake, Limnol. Oceanogr., 45, 763–774, https://doi.org/10.4319/lo.2000.45.4.0763, 2000.
Walter, J. A., Fleck, R., Kastens, J. H., Pace, M. L., and Wilkinson, G. M.: Temporal Coherence Between Lake and Landscape Primary Productivity, Ecosystems, 24, 502–515, https://doi.org/10.1007/s10021-020-00531-6, 2021.
Water Security Agency (WSA): Lower Qu'Appelle River Watershed Plan, Lower Qu'Appelle Watershed Stewards, 42 pp., https://www.wsask.ca/wp-content/uploads/2021/02/Lower-QuAppelle-River-Watershed-Plan-Final.pdf (last access: 18 February 2025), 2013.
Water Security Agency (WSA): Qu'Appelle Nutrient Mass Balance: 2013–2016, Water Quality and Habitat Assessment Services, 215 pp., https://www.wsask.ca/wp-content/uploads/2024/05/4-The-QuAppelle-Nutrient-Mass-Balance-Report-2013-2016.pdf (last access: 18 February 2025), 2018.
Water Security Agency (WSA): Contact Us, https://www.wsask.ca/contact-us/, last access: 8 March 2025.
Wauchope-Thompson, M. S., Baulch, H. M., and Cade-Menun, B. J.: Internal phosphorus loading in a chain of eutrophic hardwater lakes in Saskatchewan, Canada, Sci. Total Environ., 924, 171493, https://doi.org/10.1016/j.scitotenv.2024.171493, 2024.
Wetzel, R. G.: Light in Inland Waters, in: Limnology: Lake and River Ecosystems, Elsevier, Academic Press, 49–69, ISBN 9780127447605, 2001.
Weyhenmeyer, G. A. and Karlsson, J.: Nonlinear response of dissolved organic carbon concentrations in boreal lakes to increasing temperatures, Limnol. Oceanogr. 54, 2513–2519, https://doi.org/10.4319/lo.2009.54.6_part_2.2513, 2009.
Wickham, H.: ggplot2: Elegant Graphics for Data Analysis, Springer-Verlag, New York, 213 pp., ISBN 9783319242774, 2016.
Williams, C. J., Yamashita, Y., Wilson, H. F., Jaffé, R., and Xenopoulos, M. A.: Unraveling the role of land use and microbial activity in shaping dissolved organic matter characteristics in stream ecosystems, Limnol. Oceanogr., 55, 1159–1171, https://doi.org/10.4319/lo.2010.55.3.1159, 2010.
Williams, C. J., Conrad, D., Kothawala, D. N., and Baulch, H. M.: Selective removal of dissolved organic matter affects the production and speciation of disinfection byproducts, Sci. Total Environ., 652, 75–84, https://doi.org/10.1016/j.scitotenv.2018.10.184, 2019.
Williams, P. J. L. B.: The importance of losses during microbial growth: commentary on the physiology, measurement and ecology of the release of dissolved organic material, Mar. Microb. Food Webs, 4, 175–206, https://doi.org/10.1007/978-3-642-84602-1_10, 1990.
Wilson, H. F. and Xenopoulos, M. A.: Effects of agricultural land use on the composition of fluvial dissolved organic matter, Nat. Geosci., 2, 37–41, https://doi.org/10.1038/ngeo391, 2009.
Wheater, H. and Gober, P.: Water security in the Canadian Prairies: science and management challenges, Philos. T. R. Soc. A, 371, 20120409, https://doi.org/10.1098/rsta.2012.0409, 2013.
Wolfe, J. D., Shook, K. R., Spence, C., and Whitfield, C. J.: A watershed classification approach that looks beyond hydrology: application to a semi-arid, agricultural region in Canada, Hydrol. Earth Syst. Sci., 23, 3945–3967, https://doi.org/10.5194/hess-23-3945-2019, 2019.
Wood, S. N.: Fast stable restricted maximum likelihood and marginal likelihood estimation of semiparametric generalized linear models: Estimation of Semiparametric Generalized Linear Models, J. R. Stat. Soc. B, 73, 3–36, https://doi.org/10.1111/j.1467-9868.2010.00749.x, 2011.
Wood, S. N.: Generalized Additive Models: An Introduction with R, 2nd Edition, Chapman and Hall/CRC, New York, 496 pp., https://doi.org/10.1201/9781315370279, 2017.
Xenopoulos, M. A., Lodge, D. M., Frentress, J., Kreps, T. A., Bridgham, S. D., Grossman, E., and Jackson, C. J.: Regional comparisons of watershed determinants of dissolved organic carbon in temperate lakes from the Upper Great Lakes region and selected regions globally, Limnol. Oceanogr., 48, 2321–2334, https://doi.org/10.4319/lo.2003.48.6.2321, 2003.
Yallop, A. R. and Clutterbuck, B.: Land management as a factor controlling dissolved organic carbon release from upland peat soils 1: Spatial variation in DOC productivity, Sci. Total Environ., 407, 3808–3813, https://doi.org/10.1016/j.scitotenv.2009.03.012, 2009.
Yang, N., Mei, Y., and Zhou, C.: An Optimal Reservoir Operation Model Based on Ecological Requirement and Its Effect on Electricity Generation, Water Resour. Manag., 26 4019–4028, https://doi.org/10.1007/s11269-012-0126-x, 2012.