the Creative Commons Attribution 4.0 License.
the Creative Commons Attribution 4.0 License.
 | 28 Feb 2025
Accelerated soil moisture drought onset link to high temperatures and asymmetric responses associated with hit timing
Yi Liu
Zhimin Wang
Xinyu Zhang
Ye Zhu
Liliang Ren
Shanshui Yuan
Junliang Jin
Frequent record-high temperatures in recent years have led to a rise in both the frequency and the intensity of drought events while also altering the formation process of droughts. The worldwide occurrences of flash droughts during the past decade are evidence that droughts may evolve in an unusually rapid manner. Such a change in droughts challenges existing drought monitoring and early-warning systems typically designed for monthly scale purposes. This leads to a query regarding to what extent the formation process of droughts would be accelerated at high temperatures. Based on the reanalysis product, we identified historical drought events across China during 1950–2021 and defined a new drought characteristic, the duration of the drought onset (DDO; defined as the time period it takes for moisture to transition from a normal state to below-average condition) to measure how rapidly the drought develops. A two-stage experimental framework was then designed to establish the relationship between DDO and antecedent soil moisture, precipitation, and air temperature and to estimate the impacts of high temperatures with different warming scenarios and varied hitting time (pre- and post-drought onset) on DDO. Results showed that DDO would shorten by 10–50 d at 35 °C (high temperatures in meteorology) in relative to that of annual mean temperature scenarios. Overall, the impacts of high temperatures were greatest during the first 4 weeks (or 1 month) of the drought onset stage. High temperatures in the pre-drought and post-drought onset exhibited asymmetrical effects on DDO. In areas with a high normalized difference vegetation index (high-NDVI areas), pre-drought high temperatures presented a leading role in accelerating the formation of drought, while in low-NDVI areas, high temperatures after the drought onset were favourable for the ongoing development of drought. The findings in this study may supplement the process of understanding of drought in the future warming environment.
- Article
(11105 KB) - Full-text XML
- BibTeX
- EndNote


Climate change has led to high temperatures being more likely. The unusual warmth in 2022 and 2023 is the recent fingerprint of the warming climate under conditions of which many countries in the Northern Hemisphere experienced the hottest summer (e.g. parts of western and northern Europe and the Yangtze River basin in China) and the warmest September (e.g. North America) on record (Van Der Woude et al., 2023; Liu et al., 2023a). Such consecutive high temperatures have caused devastating impacts on human health and the welfare of the society; meanwhile, they were conducive to other climate extremes such as the wildfires and droughts (Miralles et al., 2019; Hao et al., 2022).
A lot of effort has been devoted to the analysis of how droughts will change in a warming climate. For example, based on the long-term historical observational data, reanalyses, and general circulation model (GCM) projections, a variety of studies suggested an increase in terms of the frequency, intensity, and affected area of individual drought events at both global and regional scales (Dai, 2012; Vicente-Serrano et al., 2020). Focused on the causative linkages between high temperatures and droughts, numerous studies analysed the characteristics of concurrent droughts and heat waves, including the frequency, trends, magnitude, hotspot locations, and associated socioeconomic and environmental impacts of such compound events (Hao et al., 2018; Alizadeh et al., 2020; Zscheischler and Fischer, 2020; Mukherjee and Mishra, 2021; Zhou et al., 2023), as well as the cascading interactions between dry and hot extremes (Mukherjee et al., 2023). The patterns of compound climate extremes can be strongly different due to the varied land–atmosphere coupling strength in different climate regions, underlying surfaces, and temporal scales considered (Teuling, 2018; Zhou et al., 2019; Schumacher et al., 2022). Moreover, from the perspective of drought monitoring, the change in the formation process of drought in a warming climate is also challenging. The widespread flash droughts around the world during the past decade are the evidence that drought may develop at a quicker pace and stronger intensity (Trenberth et al., 2014; Mo and Lettenmaier, 2015; Ford and Labosier, 2017; Christian et al., 2019; Qing et al., 2022; Yuan et al., 2023). Such a change in drought challenges the existing drought monitoring systems typically designed for slowly evolved drought (Otkin et al., 2022; Liu et al., 2023b). Taking the 2022 Yangtze River summer drought as an example, it only took 10 d for the moisture status to transfer from a normal state to a severe drought (Liu et al., 2023a). Previous studies also showed the increased probability of flash droughts aggravated by the internal climate variability and anthropogenic forcings (Yuan et al., 2019; Nguyen et al., 2020; Parker et al., 2021; Qing et al., 2022). Recent progresses of flash droughts include comparisons among different flash drought definitions, evaluations on the characteristics of flash drought in different regions of the world, unravelling the mechanism of flash drought based on causality analysis, incorporating various information on improving flash drought identification and monitoring strategies, and flash-drought-associated crop response (e.g. Osman et al., 2021; Shah et al., 2022; Ahmad et al., 2022; Ho et al., 2023; Zhou et al., 2023; Mahto and Mishra, 2024). These contribute a deep understanding on the accelerated drying process and its associated impacts. However, efforts to unravel the formation process of droughts at high temperatures, particularly for the changes during the onset stage of droughts (e.g. the time consumed for moisture transition from a drought-free state to drought conditions), are generally rare.
For the sake of improving drought early-warning capabilities and facilitating drought management and adaption strategies, it is crucial to figure out to what extent the drying process would be changed at high temperatures. This calls for depicting the drought development process at fine temporal resolutions (e.g. a daily time step). In addition, the influences of record-high temperatures can be significantly different given the timing of their occurrence; e.g. the boosted temperature may be favourable for drought during pre-drought periods when the moisture is in a surplus state, while the roles may be changed when transforming into a water stress condition. Moreover, vegetation may modulate these interactions given the coupling nature of water, energy, and vegetation. With these in mind, in this study, we apply a modelling framework to establish the relationship between the main driving factors and the onset of drought. On this basis, comprehensive quantification on the change ratio of the drought onset under varied temperature scenarios was conducted. This includes record-high temperatures with a varied timing of occurrence (pre- and post-drought onset within 2 months) and sensitivity tests of the relationship of DDO with temperature. Finally, the modulating effects of vegetation on the patterns of drought onset under varied high-temperature conditions were investigated. The results are promising with regard to improving our understanding of the driving mechanism of high temperatures on drought during the onset stage. Meanwhile, the modelling framework could also be an alternative for quantitative measurement on the changes in drought formation under future extreme high-temperature scenarios.
2.1 Data
The soil moisture data are from an enhanced global dataset for the land component of the fifth-generation European reanalysis (ERA5-Land) produced by the European Center for Medium-Range Weather Forecasts (ECMWF) (Muñoz-Sabater et al., 2021). This dataset has shown improved accuracy for both the surface layer and the root zone compared with other reanalysis products (Beck et al., 2021). The ERA5-Land provides hourly soil moisture estimates of four layers, i.e. 0–7, 7–28, 28–100, and 100–289 cm, at a spatial resolution of 9 km. Meanwhile, other integrated products of varied spatial and temporal resolutions are also available. In this study, daily estimates of the top three layers (depth of 1 m) during 1950 to 2021, at a spatial resolution of 0.25°, were employed to represent the root-zone soil moisture. In addition, the actual evapotranspiration (AET) and vapour pressure deficit (VPD) derived from the ERA global reanalysis product were also collected to detect the land–atmosphere coupling strength during a drought period.
The meteorological data, including daily mean precipitation (P) and the maximum air temperature (Tmax) of 2479 national meteorological stations, were collected from the China Meteorological Administration (http://data.cma.cn/, last access: 20 October 2021). The data span from 1961 to 2021, and they were interpolated into a spatial resolution of 0.25° using the kriging method by taking into account the influence of elevation. These data were employed to analyse the mean precipitation and maximum temperature conditions during the drought process.
The third-generation normalized difference vegetation index (NDVI3g) dataset is derived from the Advanced Very High Resolution Radiometer (AVHRR) sensor operated by the National Oceanic and Atmospheric Administration (NOAA) and is made available by the Global Inventory Modeling and Mapping Studies (GIMMS) group (https://daac.ornl.gov/VEGETATION/guides/Global_Veg_Greenness_GIMMS_3G.html, last access: 15 February 2024). This dataset is available from 1982 to 2022 at a time interval of 16 d and a spatial resolution of 0.083°. The NDVI data were employed to distinguish densely vegetation-covered regions, sparsely vegetation-covered regions, and bare soils.
2.2 Methods
2.2.1 Drought index based on soil moisture percentile
In this study, the soil moisture percentile (SMP) was employed to identify drought events. Given the notable geographic differences and seasonality of soil moisture over China, the volumetric soil moisture content was converted to a percentile value. For each grid cell, the daily soil moisture series from 1950 to 2021 were assigned to 12 subsets based on the calendar months (SMi, ). For each subset, 13 candidate theoretical probability distribution functions (available in MATLAB version 2019a, including beta, gamma, log-logistic, generalized extreme value, log–log, Weibull, exponential, generalized Pareto, Nakagami, Birnbaum–Saunders, normal, Ray, and Rician distributions) were employed to fit the soil moisture series. The optimal theoretical probability distribution was chosen when the lowest value of root-mean-square error (RMSE) is achieved and also passes the Kolmogorov–Smirnov test at a 95 % significance level. The selection of the optimal distribution among the 13 candidate distributions is based on Liu et al. (2023b). Drought classification is based on the United States Drought Monitor drought classification criteria (Svoboda et al., 2002; Ford and Labosier, 2017), where drought is classified into five categories: abnormally dry, moderate drought, severe drought, extreme drought, and exceptional drought, corresponding to the threshold of 40th, 20th, 10th, 5th, and 2nd soil moisture percentile, respectively.
2.2.2 Identification of drought events and duration of the drought onset
In this study, a drought event is recognized when all the following conditions are met: (i) the SMP during a drought episode is lower than the 40th percentile, and the first day that the SMP falls below the 40th percentile represents the initiation time (denoted as t0) of the drought event, whereas the termination time (denoted as te) of the event is recognized when the SMP returns to or exceeds the 40th percentile. (ii) To ensure the identified event really is a drought, the drying process must contain an interval when the SMP falls below the 20th percentile. (iii) Short-term drought events with a duration (from the initiation time to the termination time) of less than 1 month were excluded given their limited effects on agricultural production and the ecological system.
Based on the aforementioned criteria, a complete process of drought typically comprises the following stages: prior to the drought onset, the onset time when the SMP reaches a threshold for the first time, the development process (or refers to the onset stage), and the recovery period. For each stage, the SMP may present different variation patterns in response to meteorological conditions. As shown in Fig. 1, the drought event initiated from t0 (i.e. the first blue square in the figure when the SMP falls below 40 % for the first time) and terminated at te (the second blue square in the figure). During the onset stage, the SMP overall exhibits a continuous reduction until it reaches the lowest value (e.g. from 25 May to 4 June). Tiny variations in the rate of water depletion may also be found in response to the current water supply and energy conditions. For instance, a rapid intensification process of soil moisture can be expected under persistent high temperatures and precipitation deficits, while the SMP may also show a transient rise as a result of tiny precipitation. Previous research mostly examined drought duration, intensity, or severity, while it overlooked the evolution of drought during the onset stage. Such information is more valuable for drought monitoring, early-warning, and adaption strategies. In this study, we focus on the behaviour of the SMP during the onset stage to explore to what extent the drying process would be accelerated under varied meteorological forcings. Given the category of drought severity, the duration of the drought onset (DDO) is defined as the time interval between the initiation time of a drought (referred to as t0) and the time when the moisture condition falls into moderate, severe, or extreme drought (referred to as td), denoted as DDOm, DDOs, and DDOe for short, respectively. For example, Fig. 1 shows DDOm, DDOs, and DDOe were 5, 11, and 15 d, respectively.
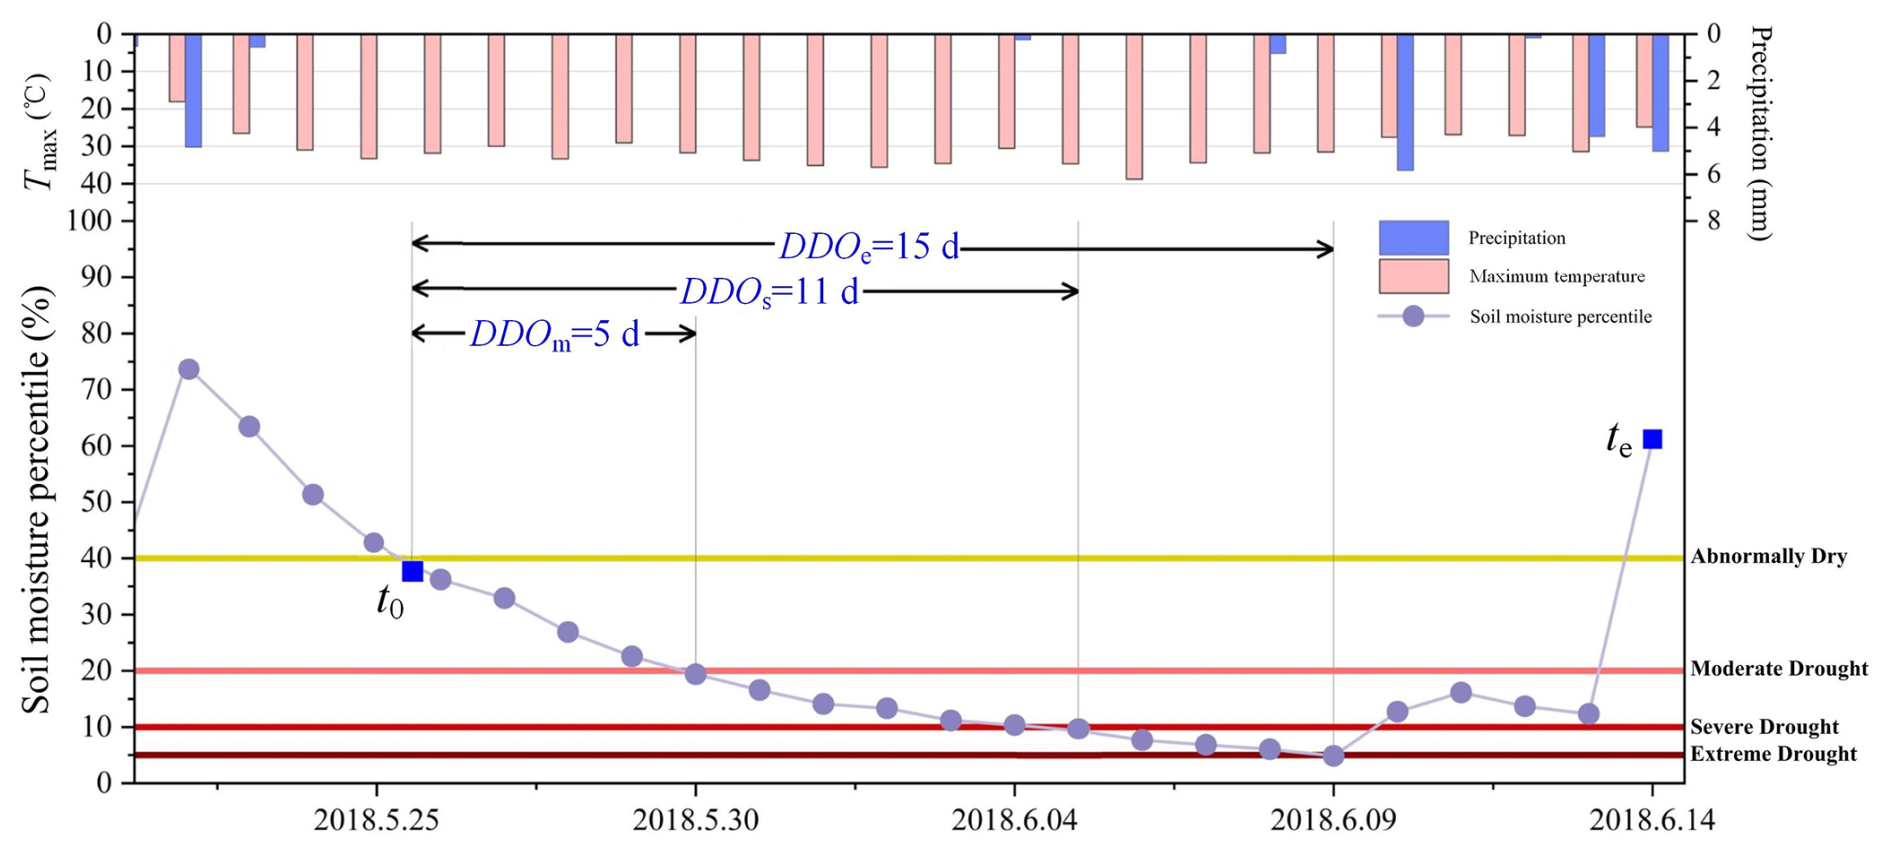
Figure 1A schematic graph of the development process of drought. Data are from the grid cell Beijing (39.8° N, 116.4° E). DDOm, DDOs, and DDOe represent the time consumed by the soil moisture percentile to reach categories of moderate, severe, and extreme drought, respectively.
2.2.3 Random forest
Random forest (RF) is a machine learning technology based on a bootstrap aggregation of classification and regression trees (Cutler et al., 2012; Belgiu and Drăguţ, 2016). It can be applied in classification, regression, and other tasks, with preferable ability of handling big and high-dimensional datasets. The model generates a bootstrap sample from the original data and trains a decision tree. All the decision trees make up a forest, and each tree in the forest has a predicted value. The final outputs of the RF method are produced by the aggregation of prediction values of all the individual trees. Compared with other machine learning techniques, RF is fast, resistant to noise in the predictor variables, and capable of capturing the complex nonlinear interactions between predictors and dependent variables, especially for soil moisture (Liu et al., 2022). In this study, the RF model is employed to construct the relationship between the characteristics of drought events and meteorological conditions (i.e. the explanatory variable) during the onset stage as follows:
where Yk can be the duration for moisture transition from abnormally dry to moderate, severe, or extreme drought or the intensification rate of soil moisture corresponding to DDOm, DDOs, or DDOe. are explanatory variables relevant to Yk. In this study, the preceding soil moisture percentile at the time t0 (refers to the SMP(t0−1)), average precipitation (P; in mm), and the maximum air temperature (Tmax; in °C) were employed as model inputs. The time period for P and Tmax are flexible, and their average/accumulated values over a certain time period can be used as model inputs to explore the individual role or accumulated effects of such variables on the formation of a soil moisture drought.
2.2.4 Experimental design
Air temperatures of different value ranges, occurrence time (e.g. pre- or after-drought onset time), and their persistence may have different effects on the formation of a soil moisture drought. We designed two numerical simulation experiments to investigate the change in drought onset under varied temperature scenarios (Fig. 2). The first sets were to establish the functional relationship between DDO (i.e. the predictand, Y) and predictor matrix, X (consisting of preceding soil moisture, average precipitation, and Tmax of varied values), during the onset stage of a drought. For the second experimental sets, we focused on the impact of high temperatures with varied timing of occurrences, i.e. pre-, during-, and post-drought onset time.
-
Experimental scenario I. We first evaluated the performance of the RF model for simulating DDO. The data were separated into two parts, i.e. two-thirds of the data were used for model training and the remaining one-third for model performance evaluation using the correlation coefficient and root-mean-square error (RMSE). In this study, the tree size and the number of features were set to 1000 and 3, respectively, according to the sensitivity tests of model parameters in Zhang et al. (2022). On this basis, we established a functional relationship between DDO (including DDOm, DDOs, and DDOe) and preceding soil moisture, precipitation, and Tmax as follows:
where SMP(t0−1) represents the soil moisture percentile 1 week prior to the drought onset. P refers to the average precipitation during t0–td. Although precipitation during a drought event could be negligible, there are still exceptional cases; for instance, in humid regions, a drizzle may occur during a drought. Tmax is the mean value of daily maximum air temperature during t0–td.
For experimental modelling, 400 samples of Tmax were generated within the range of 0–40 °C at 0.1° intervals to represent different temperature scenarios. Considering the antecedent moisture condition corresponding to a soil moisture drought can also be different; 1000 sets of SMP(t0−1) were randomly sampled within the range of the 40th–60th percentile (representing the mildly wet condition) and the 70th–90th percentile (representing the severely wet condition), respectively. Based on the probabilistic distribution of the average precipitation corresponding to historical drought events, 1000 precipitation samples during the onset stage were generated using the probability sampling method. The combination of Tmax, SMP(t0−1), and P samples constitutes a data matrix, and then they were inputted into the RF model to explore the impacts of temperatures with different value ranges on DDO.
-
Experimental scenario II. The second experimental sets aimed to explore the specific roles of high temperatures occurring in 14 (i.e. prior to the drought onset from t−7 to t0, and after the drought onset from t1 to t7) adjacent weeks of the drought onset in DDO. The sampling of SMP(t0−1) and P was the same as in experimental scenario I, while for Tmax, its emergence time can be any interval from t−7 to t7. For example, the first group aimed to explore the role of high temperatures from t−1 to t0. Accordingly, 100 samples within the range of 30–40 °C (the sample mean was 35 °C, which is the threshold of high temperature employed by the China Meteorological Administration) at 0.1° intervals were generated by the random sampling method for Tmax from t−1 to t0, while the remaining weeks (i.e. from t−7 to t−1 and from t1 to t7) of Tmax were set as the non-high-temperature conditions. On this basis, we define the change ratio of DDO to quantify the effect of high temperatures as follows:
where DDOi is the simulated result of the ith group; in other words, Tmax (t0–ti) is set to be the scenario of high temperature. DDOmean refers to the condition that air temperatures are of a normal value from the period of t−7 to t7 without high temperatures involved.
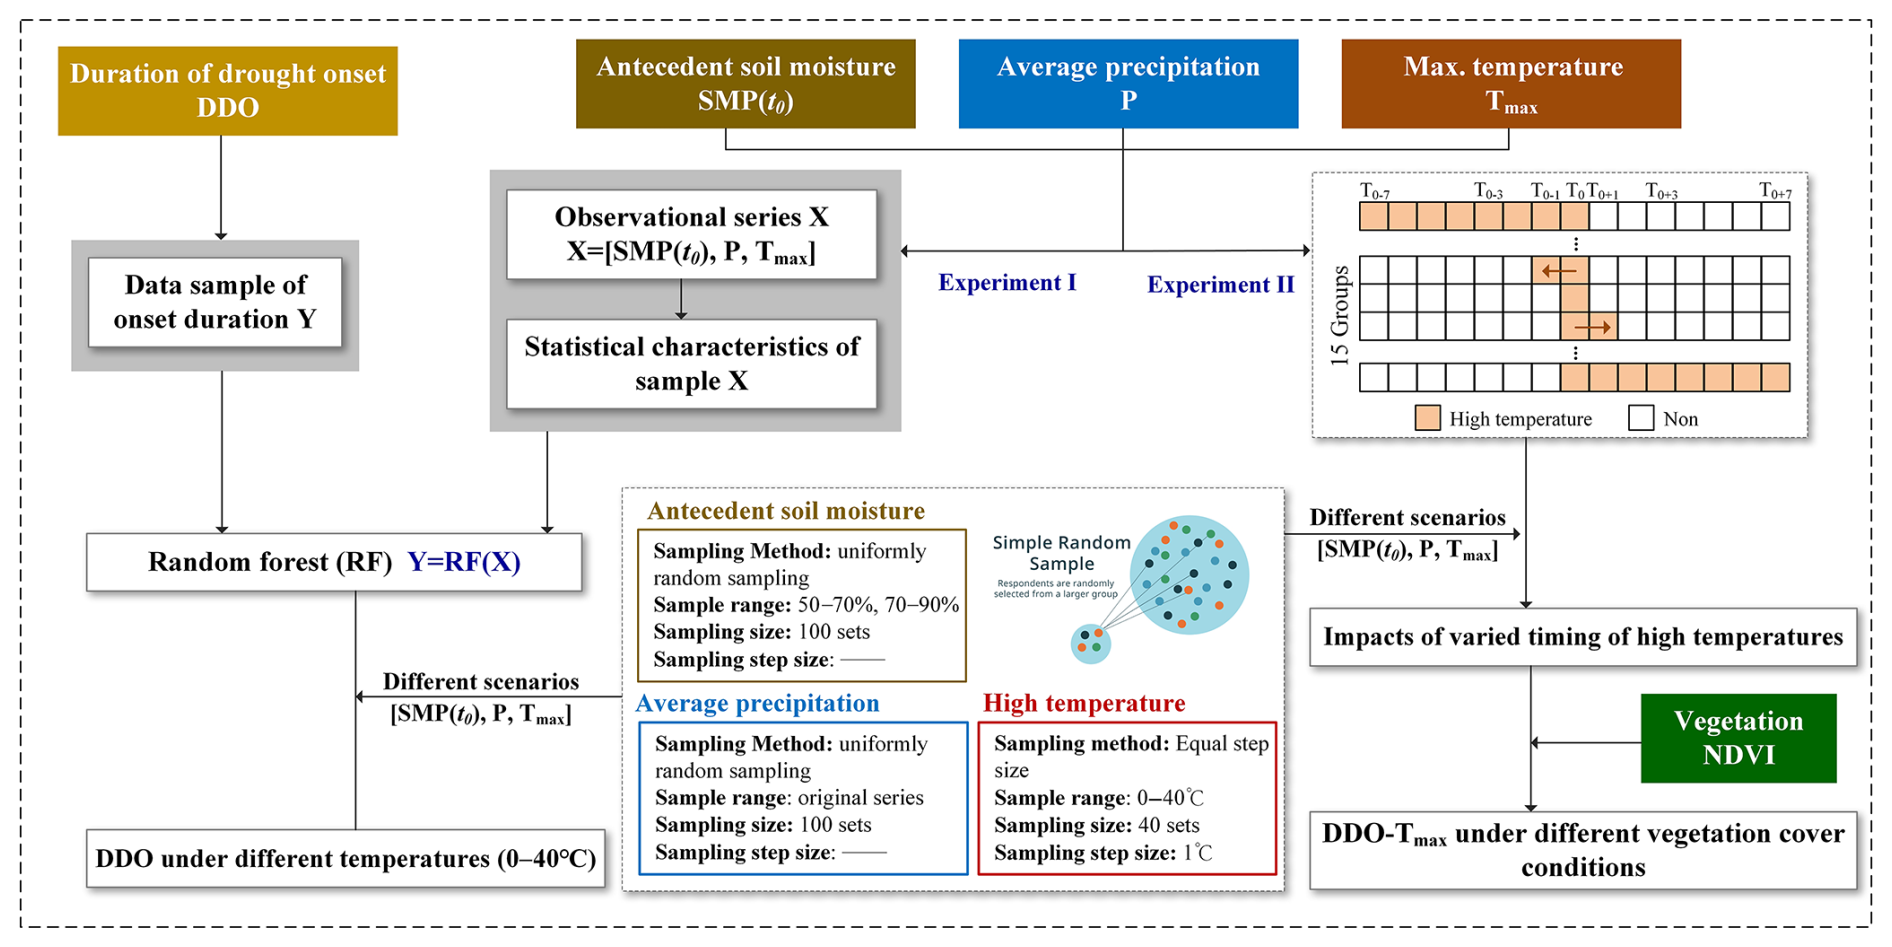
Figure 2The flow chart of the experimental design for estimating the duration of the drought onset under different temperature scenarios. DDO is the duration of the drought onset, P is the average precipitation during the onset stage of drought, SMP(t0−1) represents the antecedent soil moisture, Tmax represents the maximum air temperature, and RF is the random forest model.
2.3 Performance evaluation
Figure 3 shows the correlation between drought duration (i.e. DDOm, DDOs, and DDOe) during the onset stage and P, SMP(t0−1), and Tmax. For all three variables, higher absolute values of the correlation coefficient (CC) indicate larger influences of corresponding variables on the drought onset. As shown in Fig. 3a, the spatial map suggests that in most areas, precipitation was positively correlated with DDOs, especially for the northwestern region, and the absolute values of CC were as high as 0.5. According to the box plots, the absolute values of CC for DDOm, DDOs, and DDOe were generally low, indicating that the impacts of precipitation on DDO would be finite. For preceding soil moisture conditions, high correlation was found in northwest China and the headwaters of the Yangtze and Yellow rivers, and in the majority of regions, a weak correlation with DDO was found (Fig. 3b). Among the three variables, Tmax is closely correlated with DDO (Fig. 3c). The CC values were negative, with the strongest correlation in northeastern China, northern China, Qinghai–Tibet Plateau, and southern coastal areas of China. The negative correlation suggests that the duration of the drought onset is likely to shorten at high temperatures.
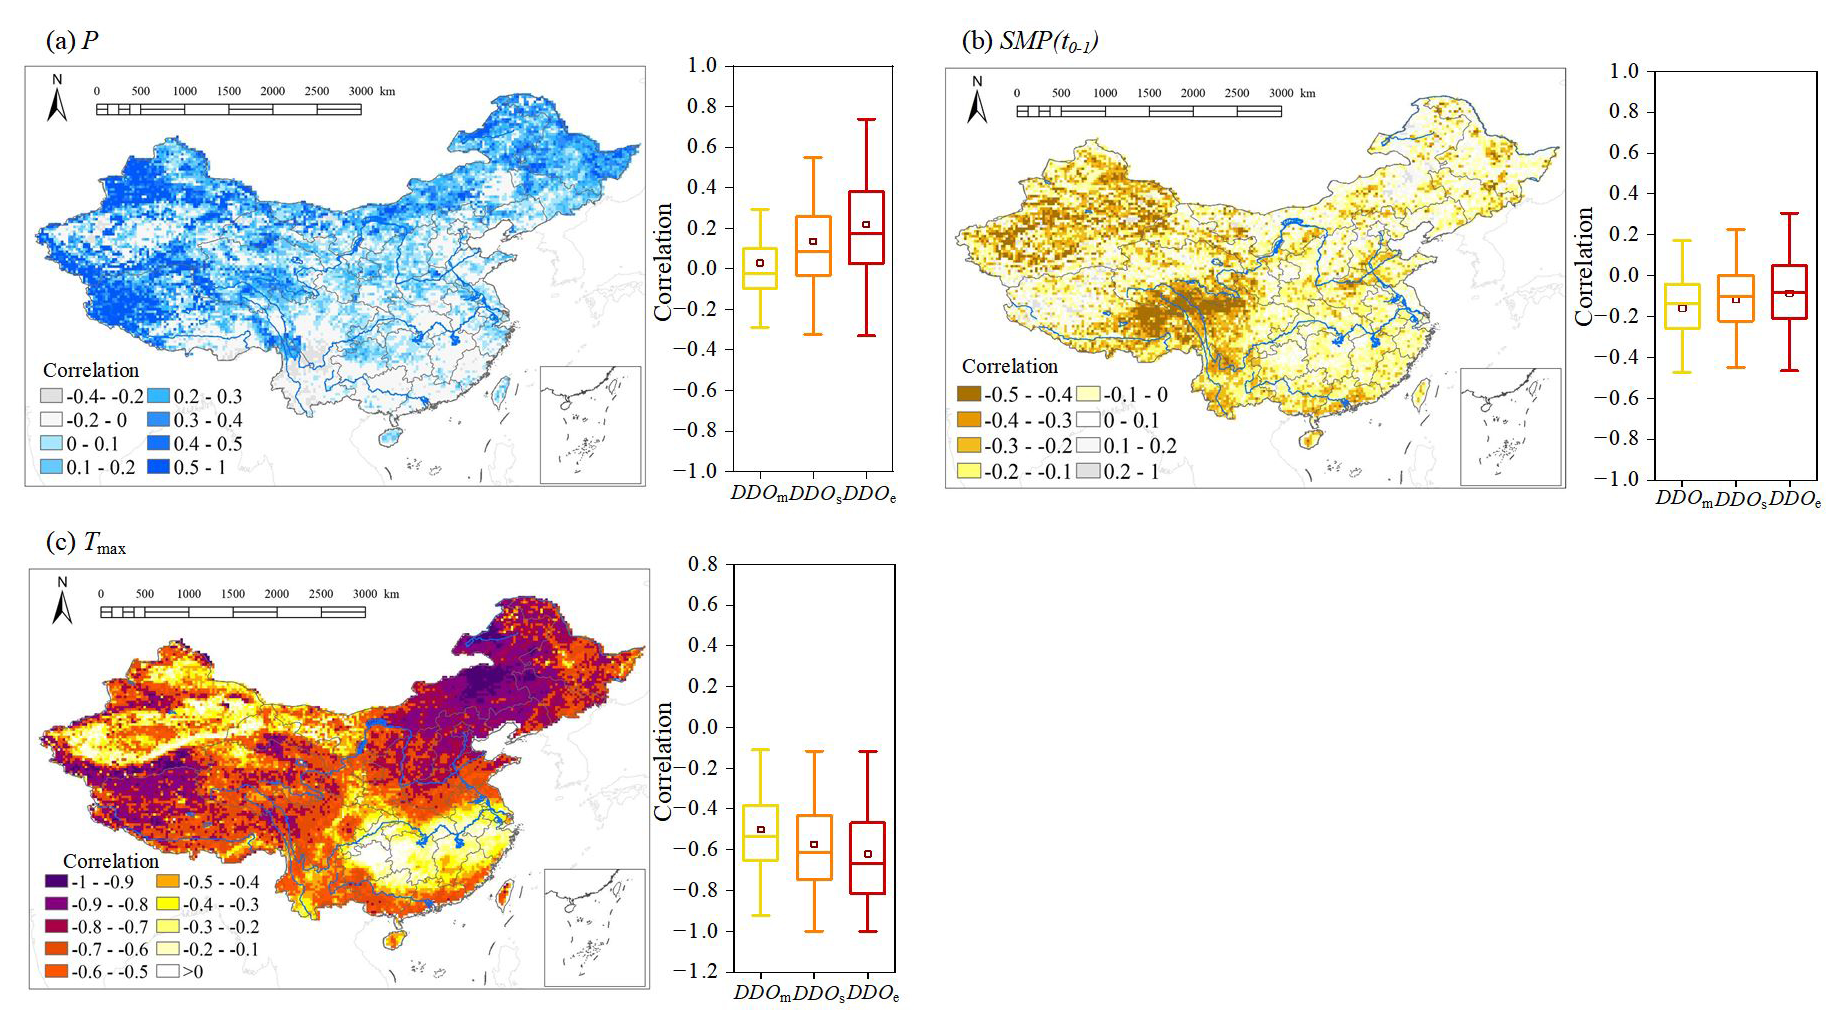
Figure 3The spatial distribution of the CC between DDOs and (a) P, (b) SMP(t0−1), and (c) Tmax, and the box plots show the CC between DDOm, DDOs, and DDOe and P, SMP(t0−1), and Tmax, respectively.
We further evaluated the performance of the framework for modelling the duration of the drought onset. P, SMP(t0−1), and Tmax were employed as input variables, and we simulated DDOm, DDOs, and DDOe, respectively, using the RF model (the derived results were referred to as simulated duration). The performance of the RF model was evaluated by comparing simulated results with the duration derived from ERA5-Land data (thereafter referred to as the calculated duration). Figure 4a shows there was good agreement between the calculated duration and the RF-based simulations, where the CC values were above 0.8 and the average RMSE values for DDOm, DDOs, and DDOe were 1, 3, and 6 d, respectively. Figure 4b shows the spatial distribution of the mean errors in DDOs. The lowest simulation errors (1–3 d) were found in the southern region, followed by the northern region and northeastern region (3–5 d). Larger estimation errors (of 10 d) were found in the northwestern alpine regions, where droughts generally persist for a long time period, resulting in small data samples for model training.
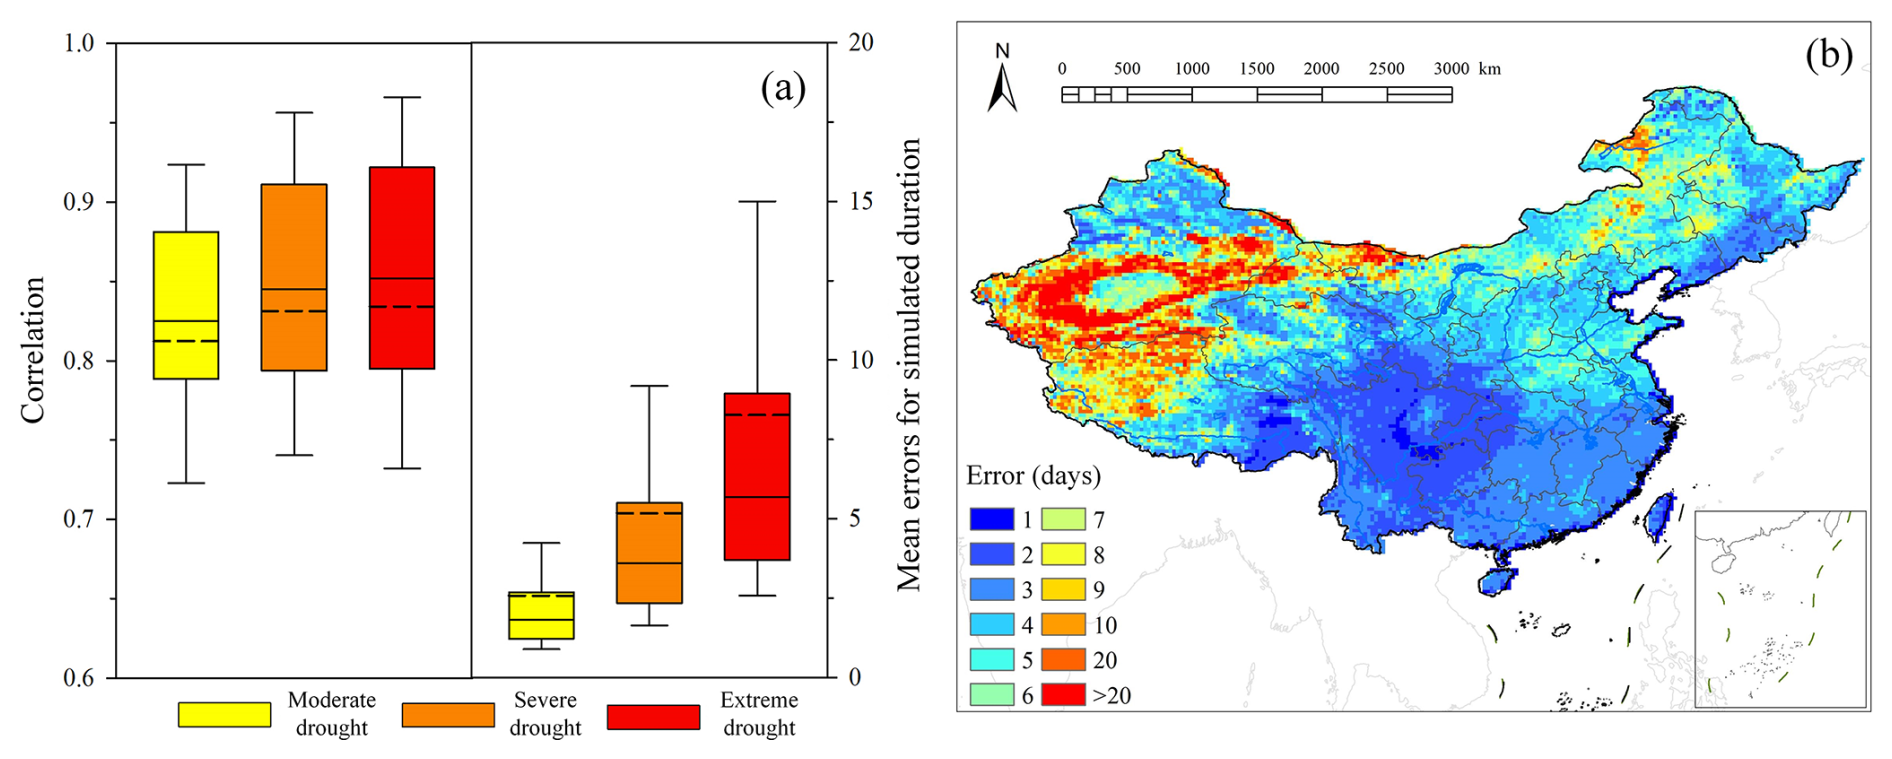
Figure 4(a) The box plots of CC and RMSE between calculated (from original ERA5-Land data) and simulated (by RF) DDOm, DDOs, and DDOe and (b) the spatial distribution of mean errors for a simulated duration of the drought onset.
3.1 Spatiotemporal characteristics of historical drought events
Figure 5 shows the spatial distribution of the number of drought events, mean duration, DDOm, DDOs, and DDOe during 1950–2021 using ERA5-Land reanalysis data. As shown in Fig. 5a, the south region suffered more than 150 drought events during the past 72 years, which is 2–3-fold the number of droughts in the north region. Regarding drought duration, droughts persisted longer in the north than the south. In the northeast and western regions in particular, drought duration was 60 d or longer, while drought duration in central and southern China (Yangtze River Basin) was less than 50 d (Fig. 5b). The duration of the drought onset (Fig. 5c), i.e. the time period of moisture transition from normal to moderately dry (DDOm), severely dry (DDOs), and extremely dry (DDOe), presents a similar spatial pattern as in Fig. 5b. Overall, DDOs was approximately 5–20 d longer than DDOm, and DDOe was 10–40 d longer than DDOm. For example, in northeastern China, it took 18 d to make the transition from a drought-free state to a moderate drought (i.e. DDOm), the value of DDOs almost doubled (to more than 30 d), and DDOe exceeded 42 d. To explore how the duration of the drought onset varies over time, taking the case of DDOs as an example, Fig. 6 presents the time series of DDOs for all grid cells over China during 1950–2021. The box plots show that there exists spatial heterogeneity of DDOs over China, ranging between 5 and 35 d, and such gaps were overall narrowed after 2002. Moreover, an evident downward pattern was found for the annual average values of DDOs over China (blue dots in Fig. 6). This suggests that the process for the transition from a drought-free status to a drought on average has been shortened.
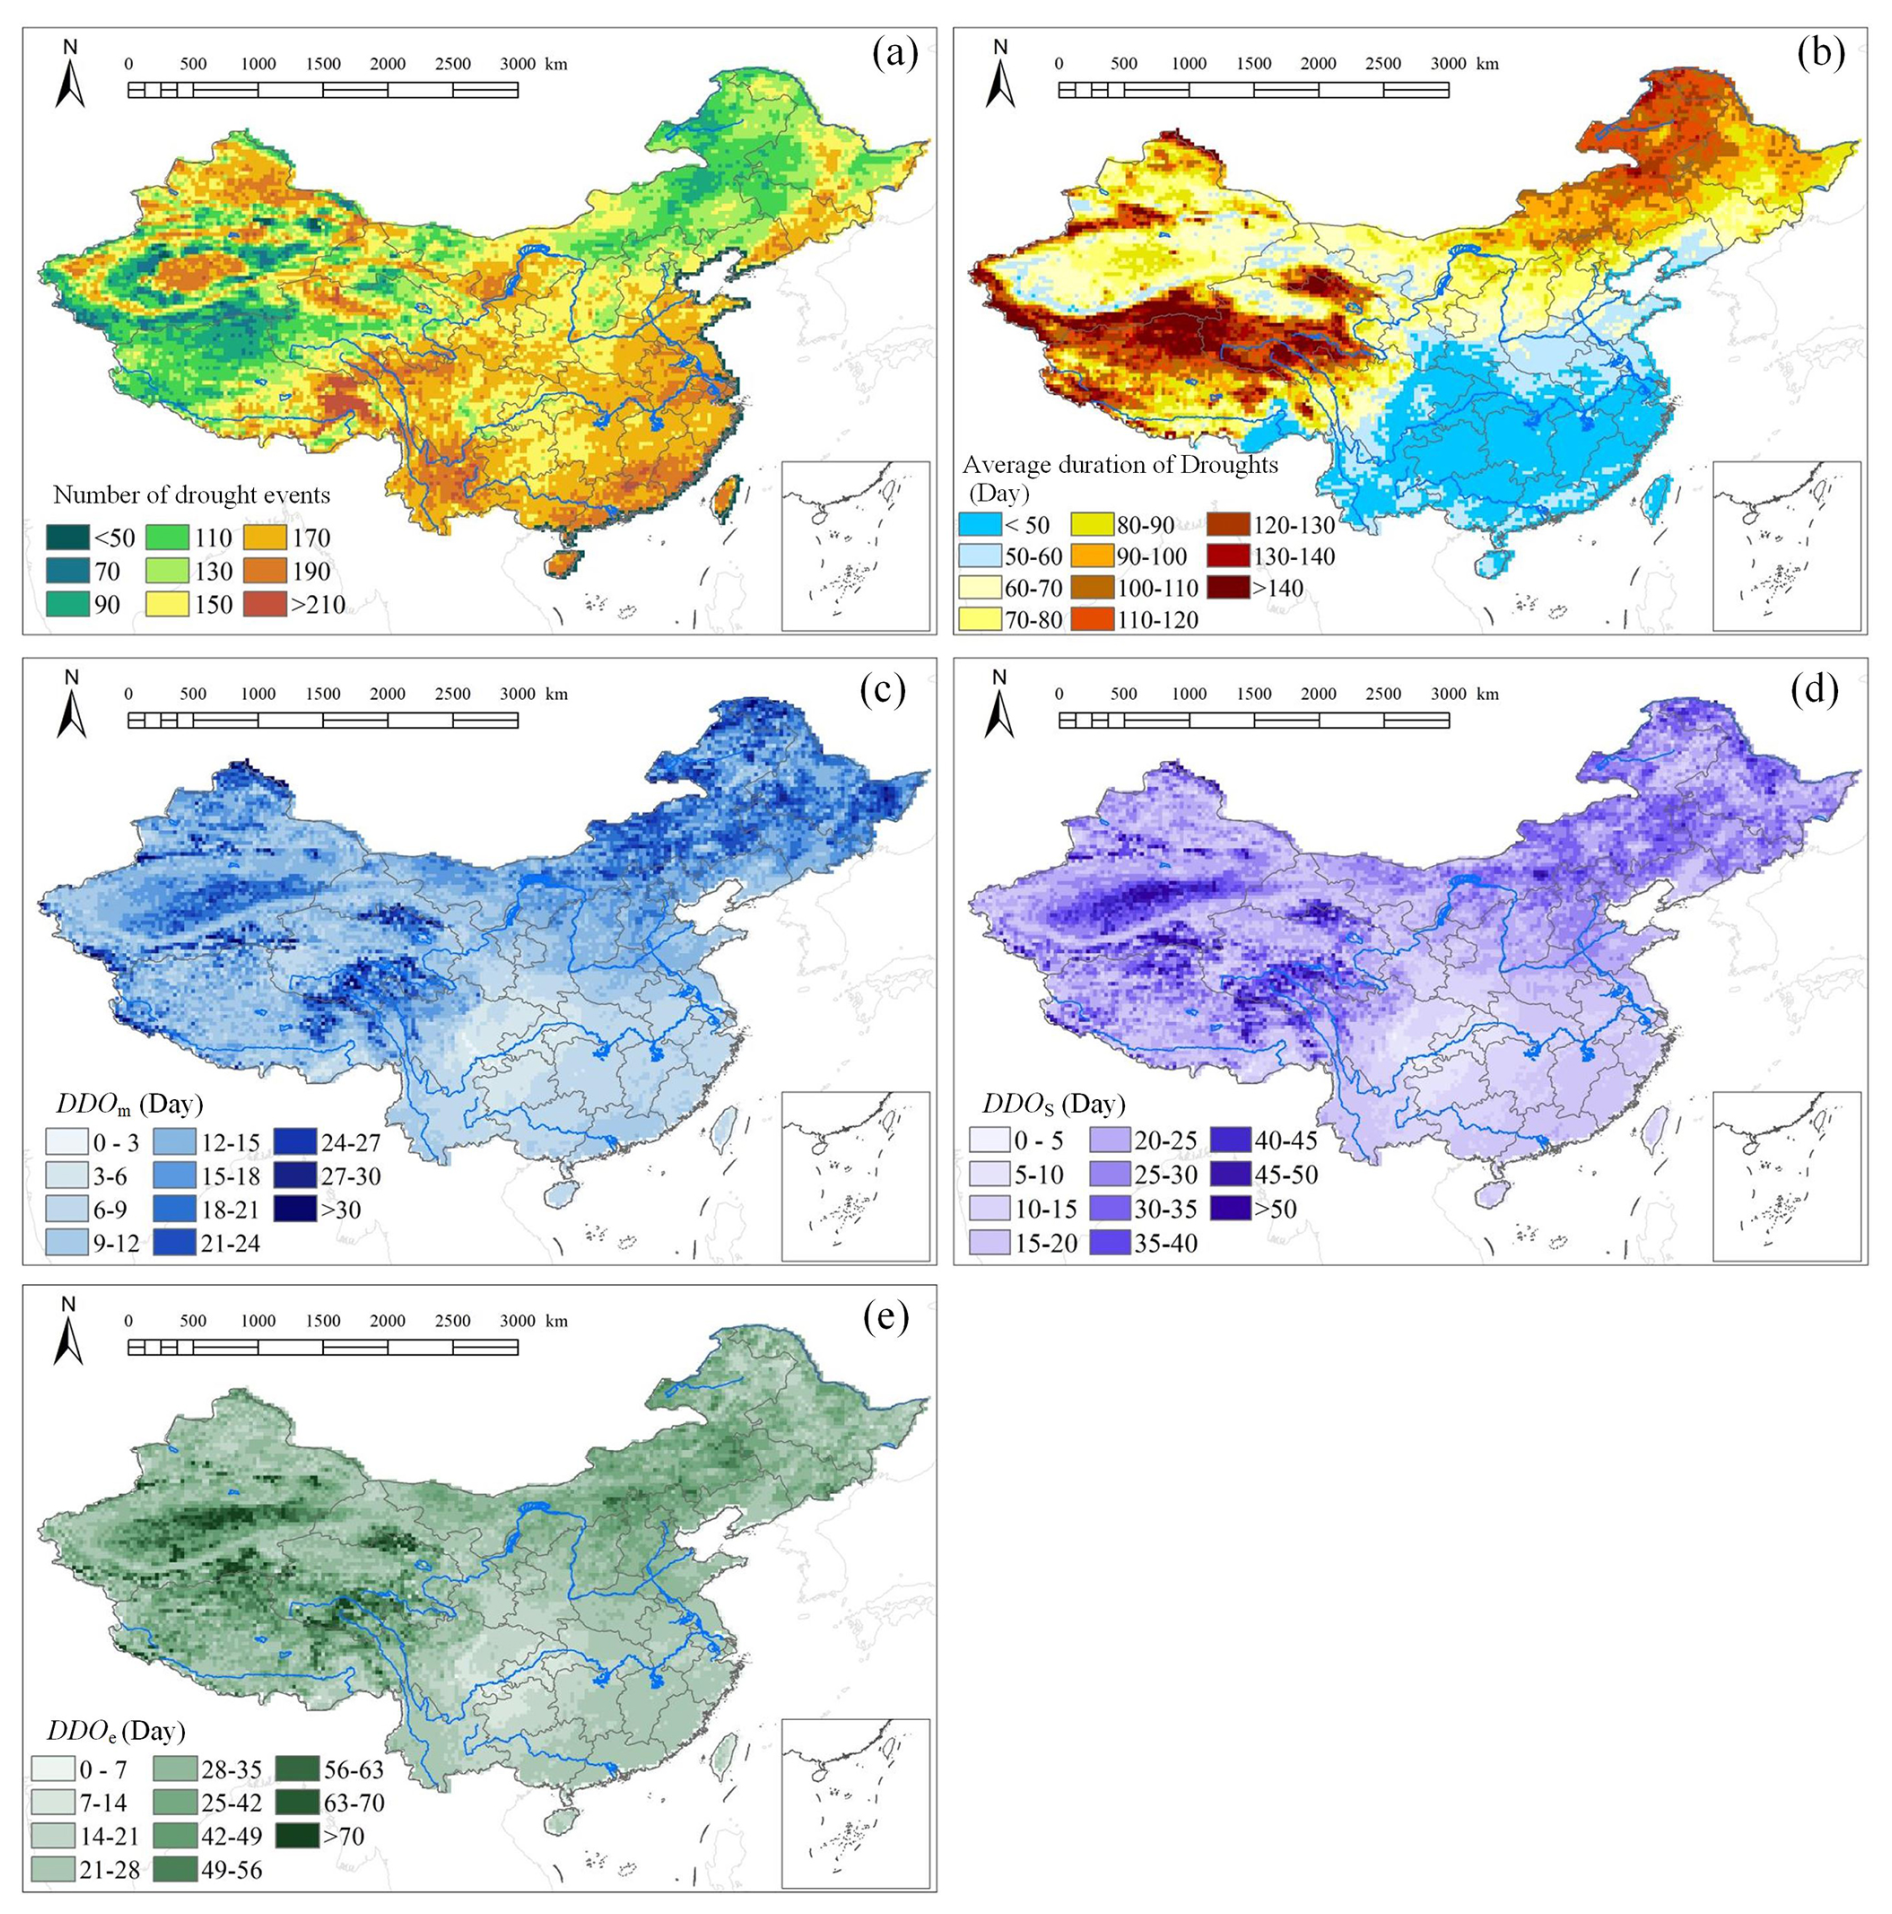
Figure 5The spatial distribution of (a) the number of drought events; (b) the average duration of drought events; and the average days taken for reaching (c) moderately dry (DDOm), (d) severely dry (DDOs), and (e) extremely dry (DDOe) of all drought events during 1950–2021.

Figure 6Box plots of the time taken to reach severely dry (DDOs) drought events for all grid cells over China during 1950–2021. The blue dots are the average values for each year.
3.2 Duration of the drought onset under varied temperature scenarios
Given the evidence of the accelerated formation process of drought as in Fig. 6, in this section, we make a comprehensive analysis of the changes in the duration of the drought onset under extreme heat conditions. The scenarios include the temperature of varied values during the drought onset and the high temperatures in 14 adjacent weeks of drought initiation. The duration of the drought onset conditioned on different temperature scenarios were estimated combined with an analysis of the intervals where soil moisture is sensitive to the changes in temperature. Moreover, the timing of high temperatures, e.g. prior to or after the initiation time of the drought, may have different effects on the drying of soil. We also analysed the contribution of high temperatures in 14 adjacent weeks of drought initiation.
3.2.1 Impacts of high temperatures and sensitive intervals
We used the RF model to explore the possible changes in the duration of the drought onset by altering forcings of temperature. Figure 7 shows the spatial distributions of DDO under scenarios of annual mean temperature and a temperature of 35 °C (this value is employed as a threshold of high-temperature days by the China Meteorological Administration and research focused on heat waves, and in this study, it was chosen as an example of high-temperature scenarios to show how DDO will change comparing to the mean temperature state), respectively. DDOm, DDOs, and DDOe were 10–20, 30–50, and 60 d in the northern region under scenarios of annual mean temperature, while the values ranged between 10 and 30 d for south China. As expected, the drought duration of different drought categories in general significantly decreased under extreme heat conditions. For instance, DDOm was less than 10 d in the majority of China, especially for the southwestern region, and DDOm was less than 5 d. Likewise, the time period starting from abnormally dry to severe or extreme drought also decreased. DDOs were no more than 15 d, and DDOe were less than 20 d except for the northwestern region. This suggests the process of soil drying could be shortened by half or one-third under extreme heat conditions relative to those of annual mean temperature scenarios.
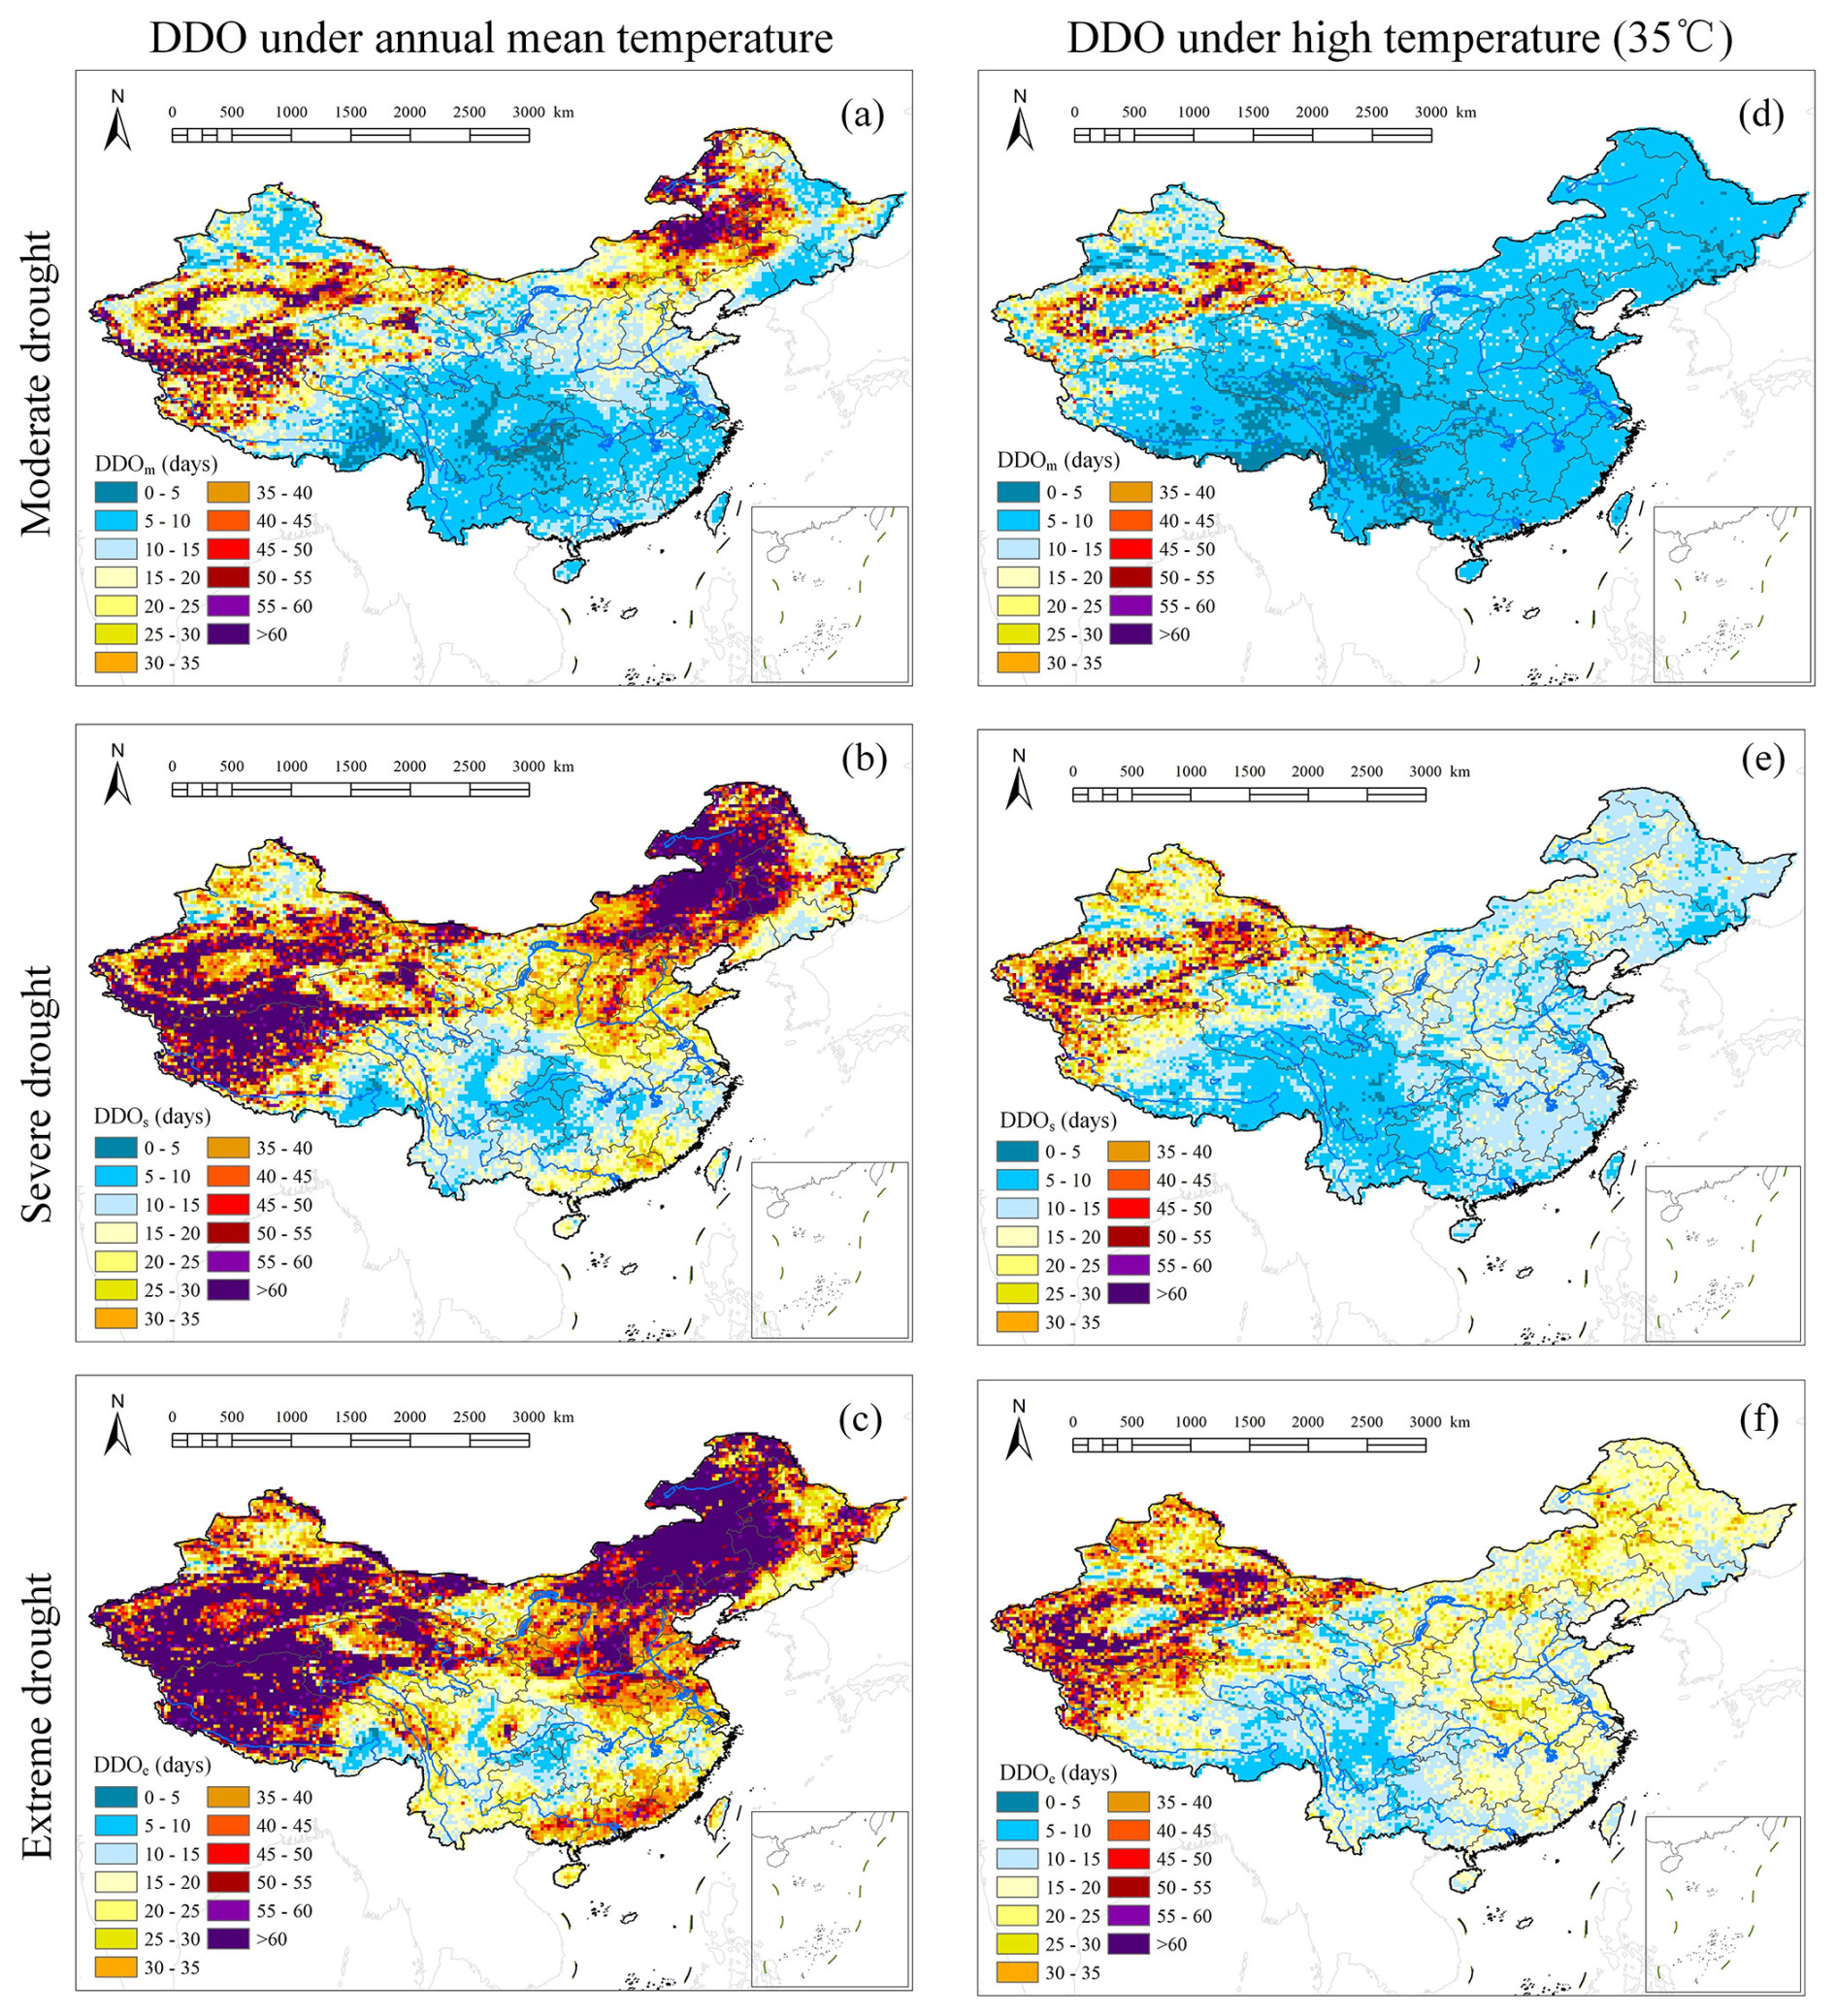
Figure 7The spatial distribution of DDOm, DDOs, and DDOe at (a–c) annual mean temperature and (d–f) a temperature of 35 °C.
We further explored the sensitive intervals (where DDO significantly changes along with increased Tmax) where temperature variation may lead to marked changes for the duration of the drought onset. Experimental simulations were conducted for each grid cell, and the temperature scenarios were randomly sampled from the range of 0–40 °C at a 0.1° step. As shown in Fig. 8, the shading shows the 25th, 75th, 95th, and 99th percentiles of drought duration under different temperature scenarios, and the white dashed lines show the average values. A general downward pattern was found for the curve of the onset duration along with the temperature rise. For temperature intervals of 10–15 °C in particular, the onset duration over China was shortened by 15 d on average. When the temperature increased to 25 °C, DDO in most regions was less than 20 d; meanwhile, the change in onset duration also slowed down (Fig. 8a). Regional patterns were similar to that of the nation, but their sensitivity ranges regarding temperature were different. For instance, the sensitive intervals for the northeastern region were between 5 and 25 °C, where DDO decreased from 50–100 d to 10–30 d (Fig. 8b). In north China, the curve presented no obvious changes until the temperature reached 8 °C, and the onset duration approximately decreased by two-thirds (from 30–50 d to 10–20 d) under temperature scenarios of 8–15 °C (Fig. 8c). Such sharp drops in onset duration were also found in southwest China and the southern parts of the Tibet Plateau, ranging between intervals of 15–25 °C (Fig. 8e) and 6–17 °C (Fig. 8f), respectively. The onset duration in south China on the whole was shorter than other regions, and evident decreases in onset duration were found at intervals between 20 and 35 °C (Fig. 8d). These suggest that high temperatures may accelerate the formation process of soil moisture drought; meanwhile, their role may also be finite and would not influence the drying process a lot when exceeding the sensitive intervals in different regions, and the white dashed lines in Fig. 8 show the average values of the duration of the drought onset.
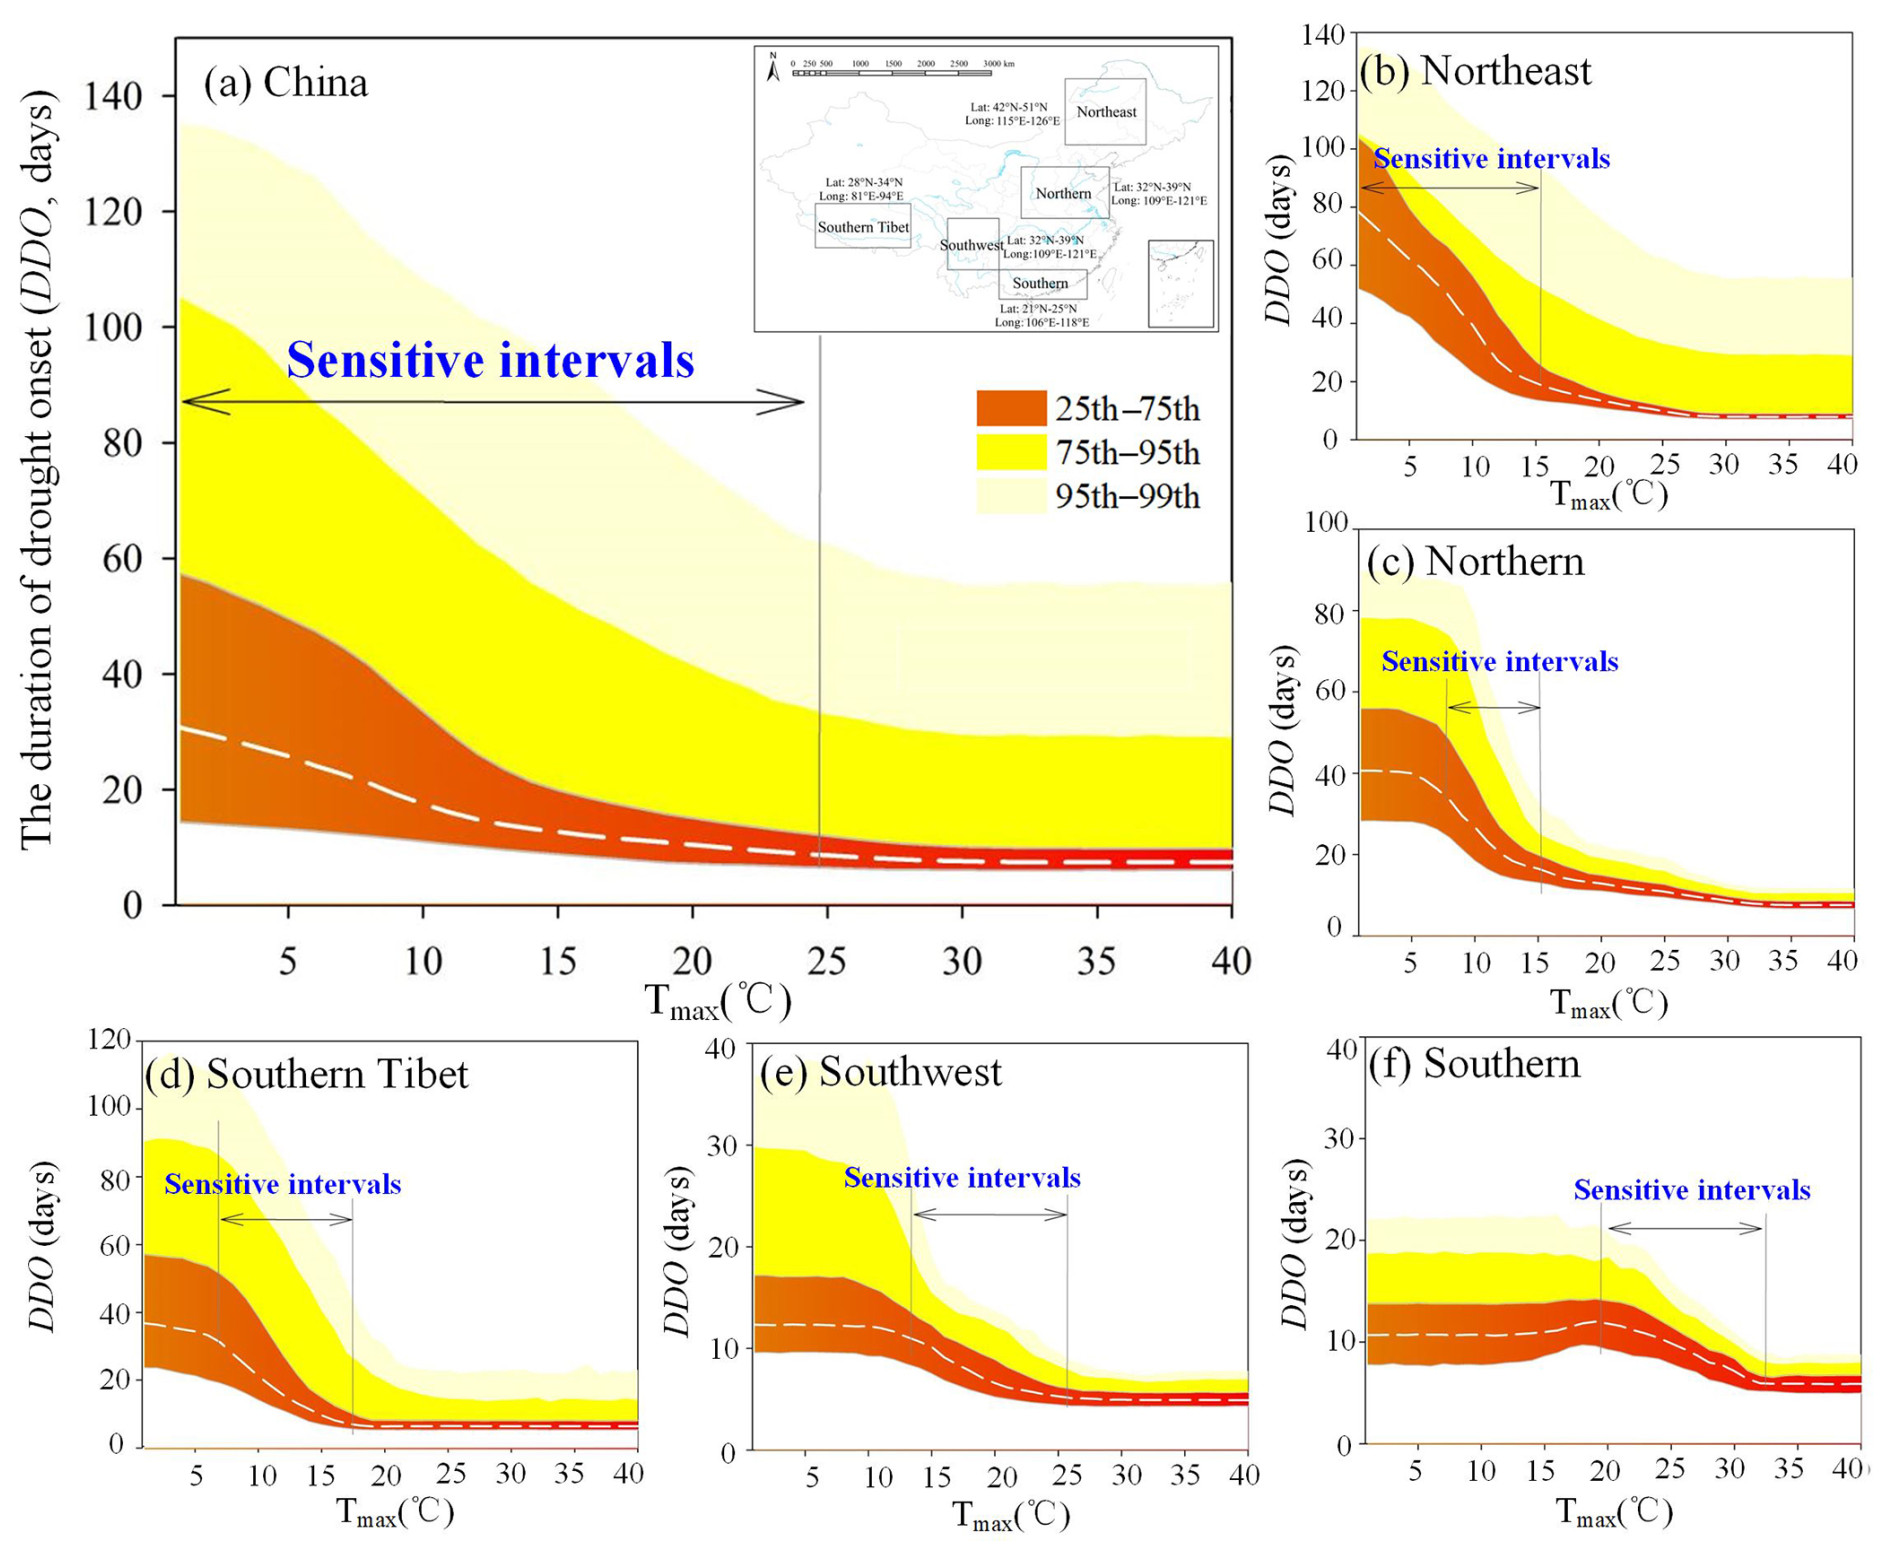
Figure 8The days of the drought onset under different temperature scenarios (a) over China; in (b) northeast (42–51° N, 115–126° E), (c) northern (32–39° N, 109–121° E), and (d) southern Tibet (28–34° N, 81–91° E); and in (e) southwest (25–32° N, 99–106° E) and (f) southern (21–25° N, 106–118° E) China. The coloured shades show the 25th, 75th, 95th, and 99th percentiles of the duration of the drought onset under temperature scenarios for grid cells in each region, and the white dashed lines show the average values of the duration of the drought onset.
3.2.2 Impacts of varied timing of high temperatures
The timing of high temperatures is also crucial for drought development. Before drought initiation, the soil is typically in a normal or wet state, which allows for a higher rate of evapotranspiration to meet the atmospheric demands. In this circumstance, pre-drought high temperatures are expected to play a positive role in accelerating the formation process of drought. As the drought proceeds, the role of high temperatures may also change along with a transition from water surplus to water deficit (Budyko, 1974; Roderick et al., 2009). On these grounds, we analysed the change ratio of DDO at high temperatures occurring in 14 adjacent weeks of drought initiation. As shown in Fig. 9, the probability distribution curve refers to the change ratio of DDO caused by high temperatures randomly sampling within the range of 30–40 °C during the period of T0–Ti for all grid cells over China. A positive change ratio of DDO indicates that high temperatures promote the drying process of soil profile; namely, DDO becomes lower compared to those under normal temperature conditions and vice versa for negative values. Overall, high temperatures in 14 adjacent weeks of drought initiation (namely T0) all show a positive role of drying the soil, with the mean change ratio of DDO above 15 %. Specifically, for periods before drought initiation, DDO, on average would be shortened by 25 %, with high temperatures occurring in 4 consecutive weeks (namely from T−4 to T0) prior to drought initiation. The change ratio of DDO then generally decreases as the period of high temperatures shortens and drops to 15 % when high temperatures exactly occur in T0. In contrast, more prominent effects of high temperatures were found for periods after drought initiation. For example, DDO, on average, would be shortened by 30 %, with high temperatures during T0–T1, and such effects of promoting soil drying would be further enhanced with continuously lengthened time intervals of high temperatures from T0 to T4 (the mean change ratio was approximately 55 %). For periods of 1 month after drought initiation, DDO would no longer change as the time intervals of high temperatures lengthened.
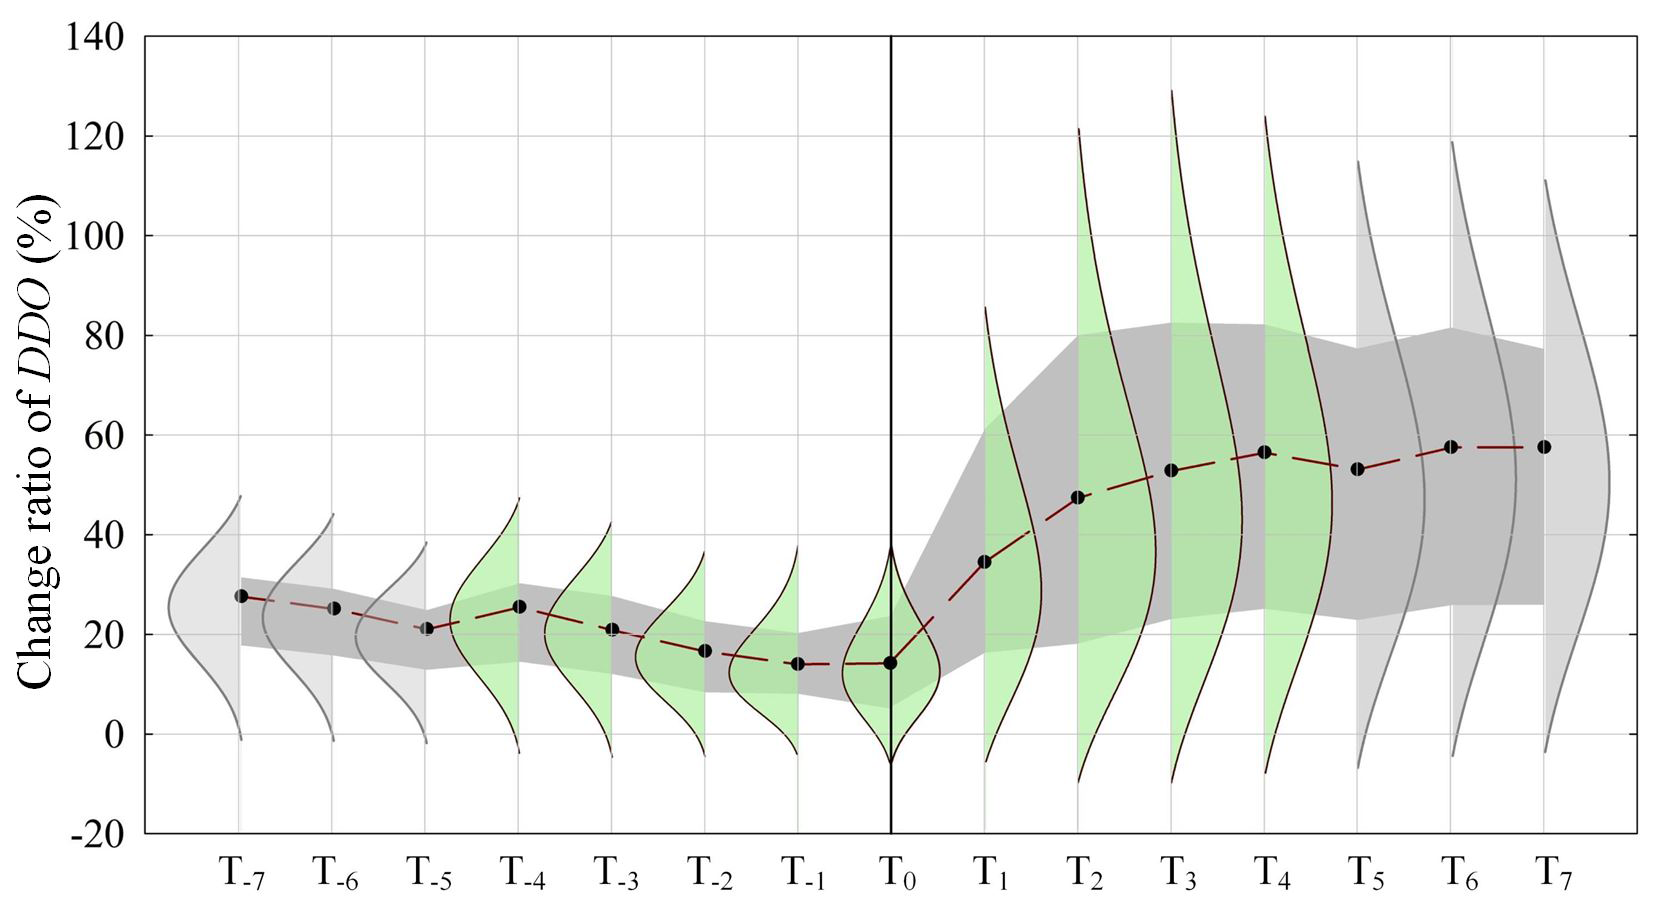
Figure 9The change ratio of DDO caused by high temperatures occurring at different time intervals (from T0 to Ti, and i≠0 and is an integer ranging from −7 to 7), which was averaged over all grid cells in China. The probability distribution curve for the ith time refers to the change ratio of DDO caused by high temperatures randomly sampling within the range of 30–40 °C during the period of T0–Ti. The dark grey stripe represents the 25th to 75th percentiles of each probability distribution, and the black solid dots show the means of the probability distribution. The coloured probability distributions show the effective time intervals of high temperatures on the formation process of drought.
3.3 Drought onset under varied vegetation conditions
The formation processes of drought under different high-temperature scenarios are subjected to the water and energy exchanges between the atmosphere and land surface (Durre et al., 2000), and vegetation plays a fundamental role in modifying this physical process. For example, vegetation is supposed to contribute to the depletion of soil moisture by water uptake from the deep soil for transpiration under sufficient water supply states, while it may also impede further soil moisture consumption by means of stomatal closure when entering into a water stress period (Yang et al., 2018). In addition, the role of vegetation becomes more complicated on account of vegetation type or density.
We use the NDVI (a comprehensive indicator of vegetation density, class, and health condition) to classify DDO driven by high temperatures, and three typical regions with different vegetation greenness were extracted for comparison. As shown in Fig. 10, northwest China is characterized by low NDVI values (around 0.1, generally corresponding to barren areas of rock, sand, or snow), and high temperatures after drought initiation show positive effects (Fig. 10b). With an overall higher NDVI (around 0.4, corresponding to shrub, grassland, and mixed forest classes of medium vegetation density) in northeast China, the positive effects of high temperatures on DDO were extended to pre-drought periods (Fig. 10c). Southwest China (the NDVI is around 0.6, corresponding to the forest class with high vegetation density) exhibited stronger positive effects during pre-drought periods, where DDO could be halved at high temperatures from T−7 to T0; meanwhile, the effects of high temperatures greatly decreased after a drought is initiated (Fig. 10d).
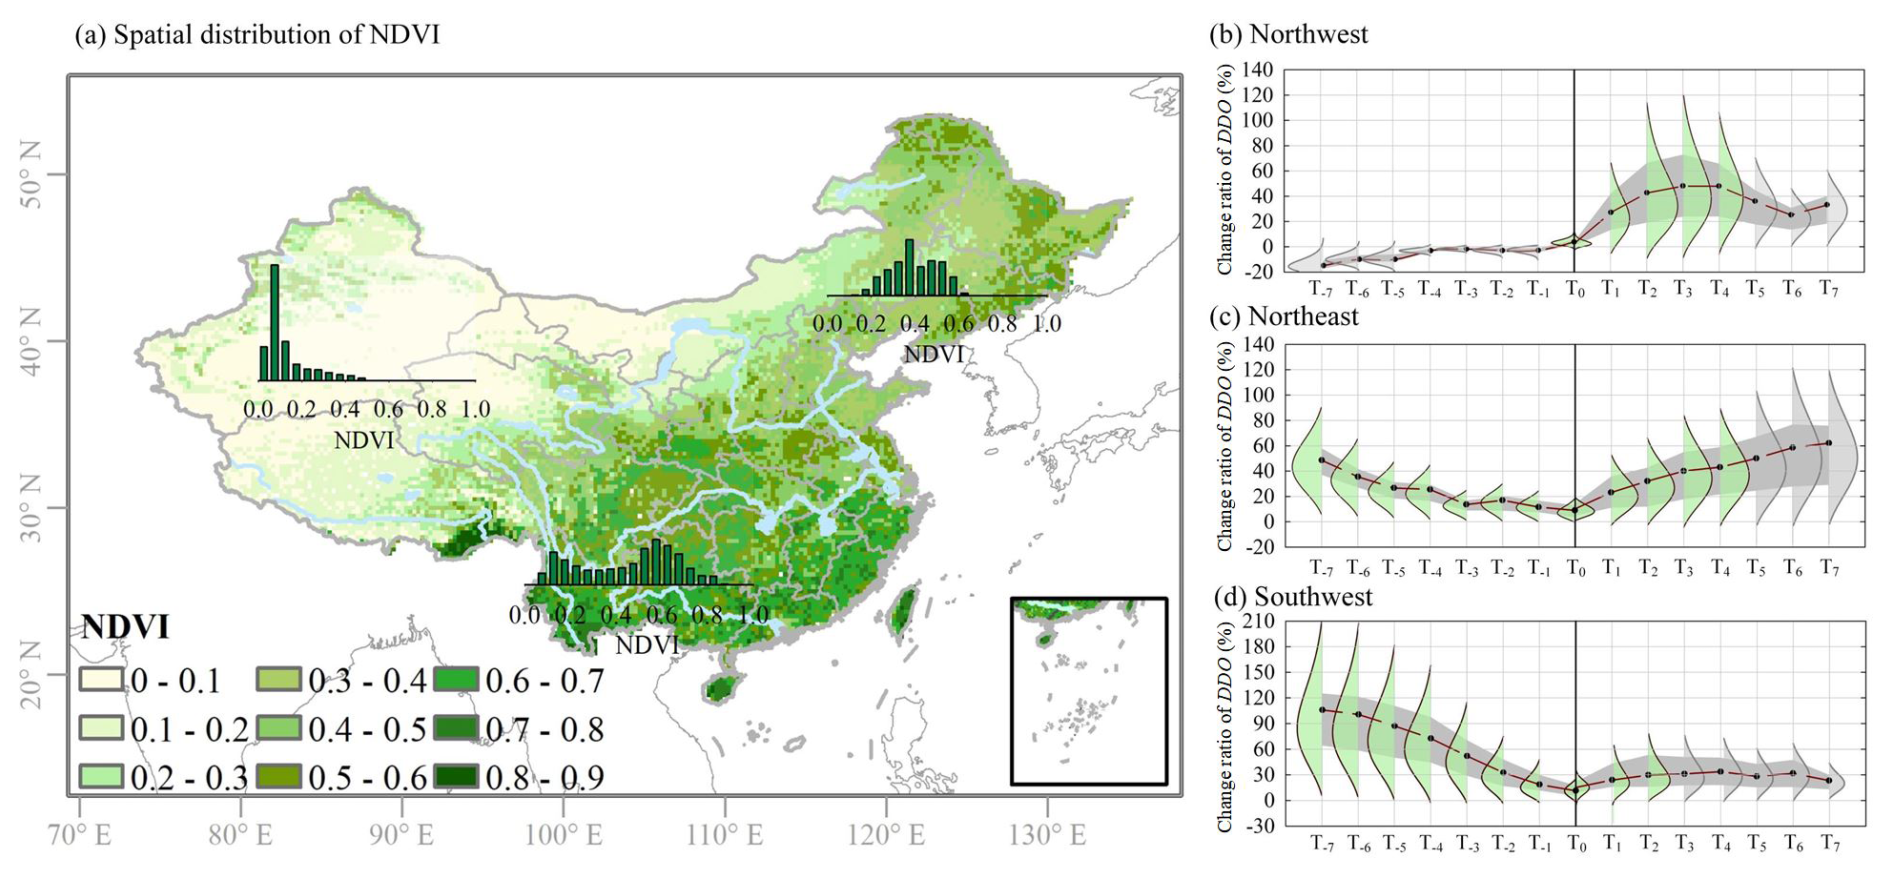
Figure 10Spatial distribution of (a) NDVI over China and the change ratio of DDO as in Fig. 9 but for (b) northwest, (c) northeast, and (d) southwest regions. The histograms show the distribution of NDVI of all grid cells in northwest, northeast, and southwest China.
Similar patterns were also found for the change ratio of DDO classified by NDVI values from 0 to 1 at an interval of 0.1 over China, where the positive effects of high temperatures during pre-drought periods tend to be weaker as the NDVI decreases (Fig. 11). For instance, in high-NDVI areas (0.5 ≤ NDVI < 1), pre-drought high temperatures exhibited an overwhelming role of DDO (Figs. 10d, 11a–d). In medium-NDVI areas (0.4 ≤ NDVI < 0.5), high temperatures exhibited parallel effects during pre-drought and after-drought periods (Fig. 11e), while for low-NDVI areas (0 < NDVI < 0.4), positive effects of high temperatures emerged after drought initiation (Figs. 11f–i).
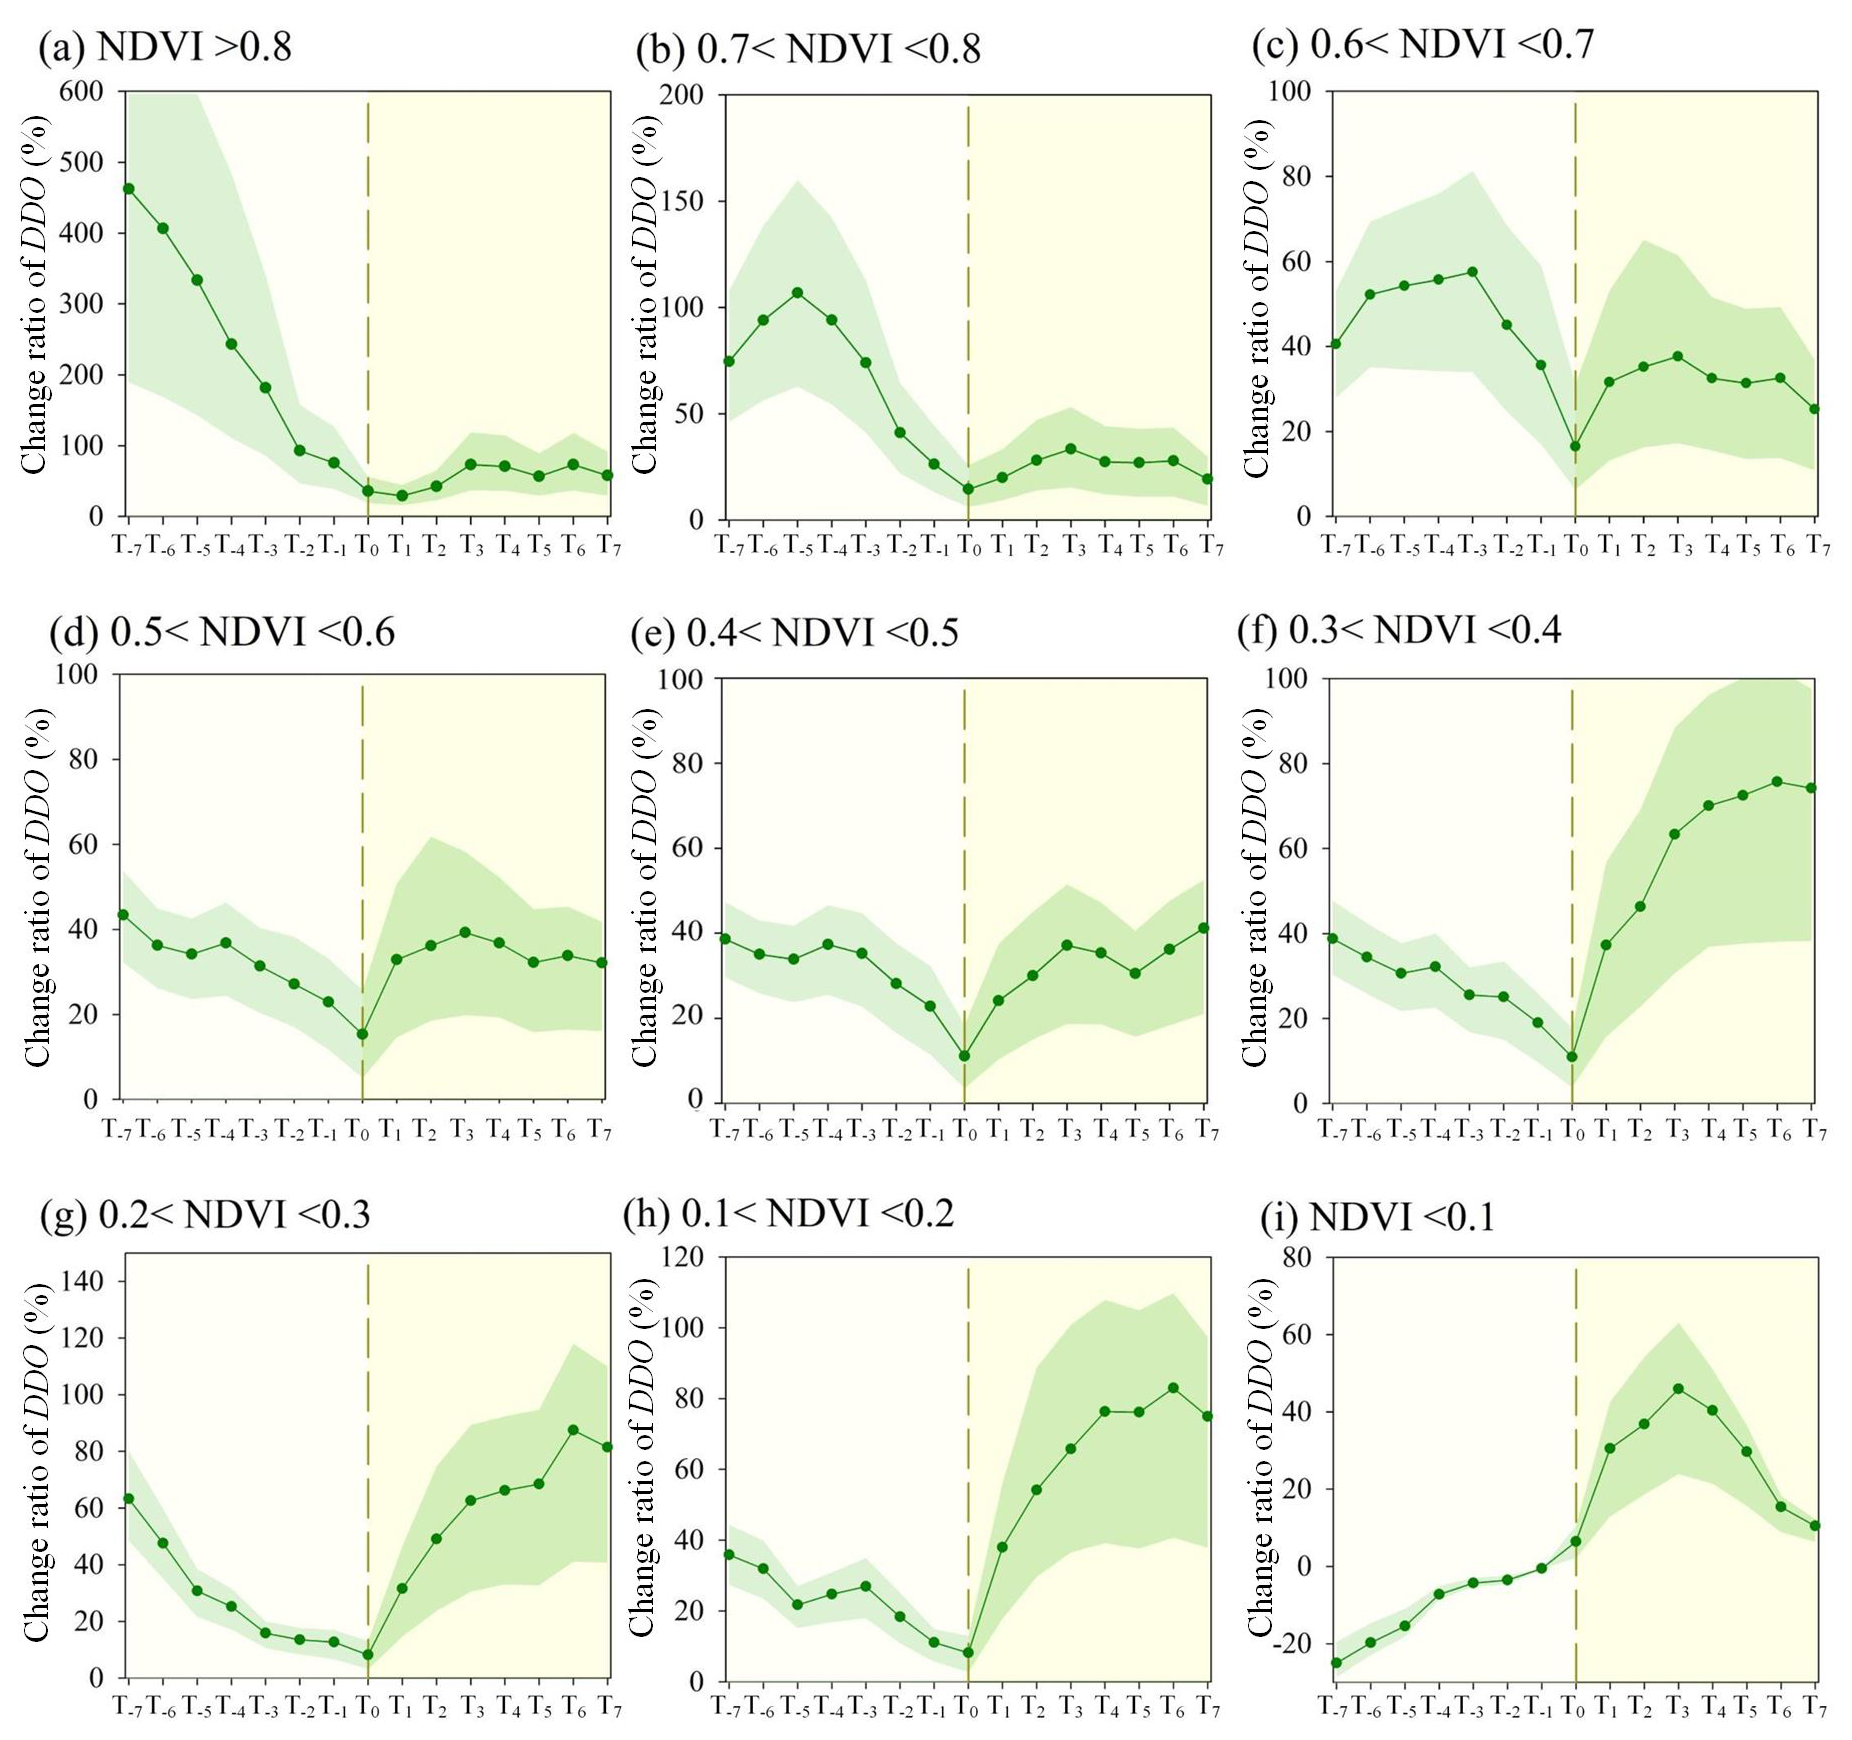
Figure 11As in Fig. 9 but for the change ratio of DDO under different NDVI values. The dotted vertical line in each panel shows the initiation time of a drought, the green dots are the mean change ratio of DDO at high temperatures from T0 to Ti, and the green shades show the range of 25th–75th percentiles of the change ratio of DDO.
To explore the reasons for the different patterns between vegetation conditions, we further compare the anomalies of AET (to make AET in different regions are comparable) in high- and low-NDVI areas. As shown in Fig. 12a, the high-NDVI regions exhibited stronger positive AET anomalies than in low-NDVI areas at 2-week leads, suggesting that vegetation of high density and fraction (roughly corresponds to high-NDVI values) may respond more drastically to the elevated temperature and evaporative demand, resulting in increased evapotranspiration and the accelerating depletion of root-zone soil moisture. A similar phenomenon was also found in Osman et al. (2022). It is worth noting that such positive effects of vegetation in response to high temperatures may largely weaken as the moisture status transfers into a water stress condition. This is evident due to the sharply decreased AET anomalies after drought initiation in high-NDVI areas. Moreover, the coupling strength between the vapour pressure deficit (VPD) and soil moisture also indicates the changing role of vegetation within a drying period (Seneviratne et al., 2010). As shown in Fig. 12b, high-NDVI areas exhibited stronger coupling strength than the low-NDVI areas, which implies the important roles of vegetation in regulating these processes. Meanwhile, in high-NDVI areas, the coupling between VPD and soil moisture was stronger during pre-drought (i.e. energy-limited) periods than after-drought (i.e. water-limited) periods. In contrast, there were virtually no changes within a drying period for low-NDVI areas. This to some extent explains why pre-drought high temperatures presented more prominent effects in high-NDVI areas, while the role of vegetation in low-NDVI areas was very limited.
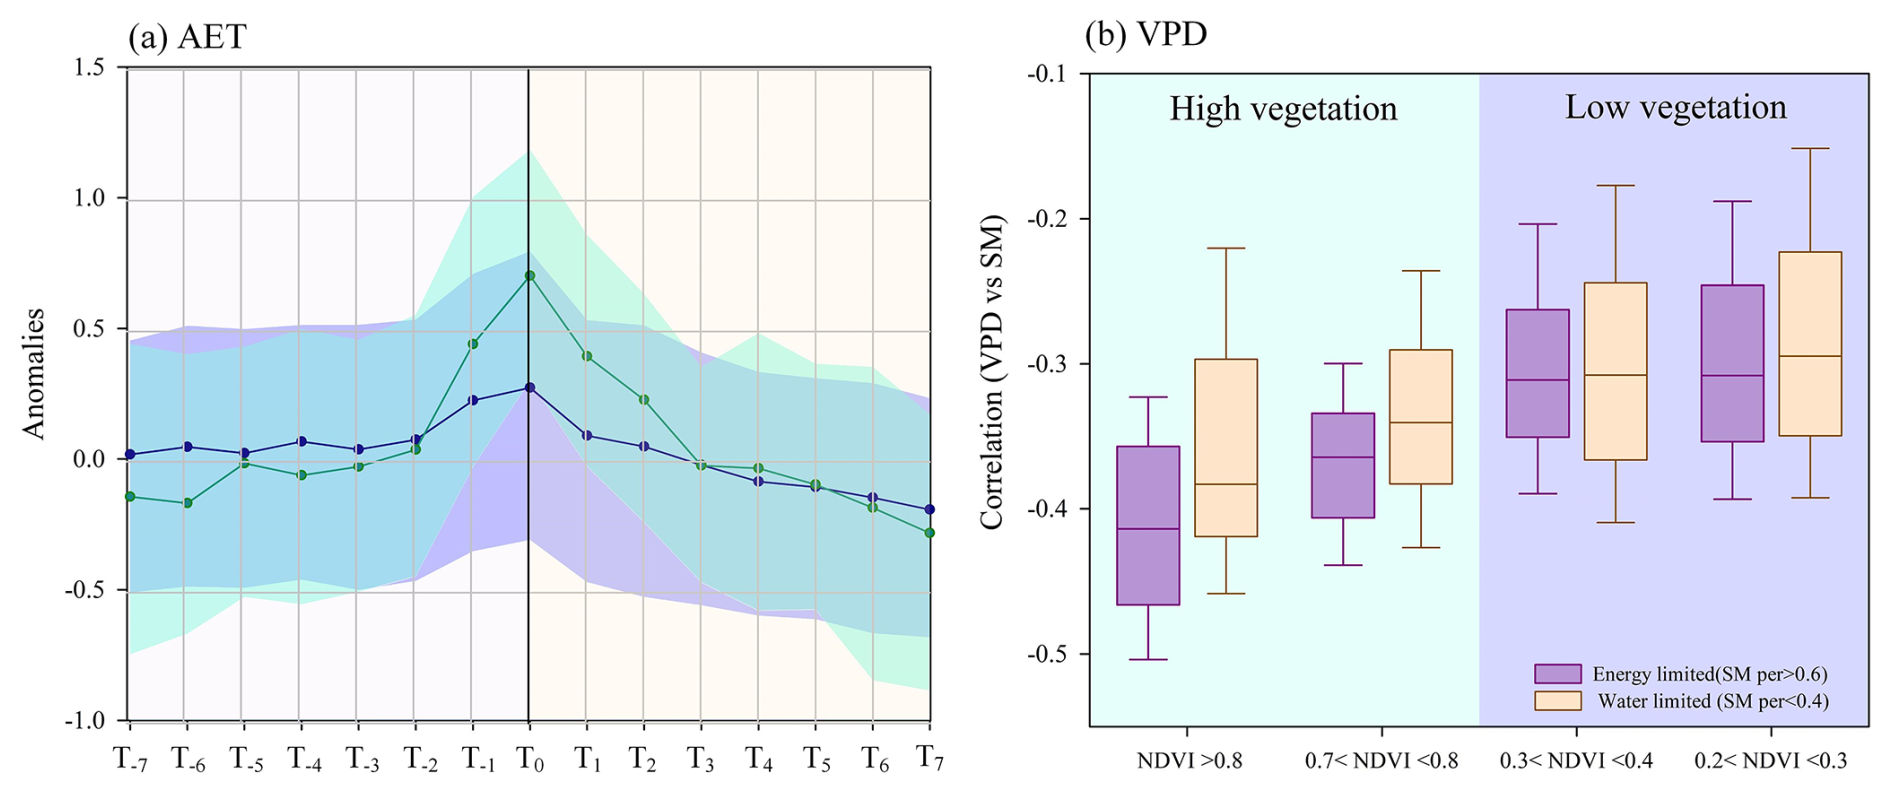
Figure 12(a) Variation in AET anomalies in high-NDVI (NDVI > 0.7) and low-NDVI (0.2 < NDVI < 0.3) areas in 14 adjacent weeks of drought initiation (T0). The cyan and purple shadows in (a) are the 25th percentile and 75th percentile of AET anomalies in high- and low-NDVI areas, respectively, and the two circle chains are the corresponding means of AET anomalies. (b) Box plots of the correlation between VPD and soil moisture during pre-drought (purple box) and after-drought (orange box) periods in high- and low-NDVI areas.
Frequent occurrences of record-high temperatures around the world have motivated efforts to the spatiotemporal patterns, causal analysis, and associated social and ecological impacts of the dry and hot extremes (Mazdiyasni and AghaKouchak, 2015; Williams et al., 2015; Naumann et al., 2021; Yin et al., 2023). For the case of drought, the resulting changes in a warming climate are not confined to typical drought characteristics such as drought frequency and intensity (Otkin et al., 2018; Chiang et al., 2021; Lian et al., 2021; Wang et al., 2021), while the change in the drought evolution process is also challenging.
In this study, we focus on the development of drought during the onset stage, which is defined as the time period of moisture transferring from a normal state to moderate, severe, or extreme drought (referred to as DDO in this study). Compared with previous research that characterize flash drought from a perspective of intensification rate (e.g. Otkin et al., 2022; Liu et al., 2020), DDO is operation-friendly due to it providing more intuitive information on the specific days consumed for the onset of a flash drought, which may facilitate policy-makers to incorporate such information into the early-warning and drought monitoring system without additional data processing. Certainly, DDO can also be transformed into the intensification rate as it was in previous research.
The results suggest DDO, on average, would be shortened by 10–50 d at 35 °C (a threshold of high temperature in meteorology) relative to that of annual mean temperature scenarios, with most evident changes in the middle and eastern parts of northeast China and north China (Fig. 7). This implies that with more frequent high temperatures in the future, such as the global record-high temperatures during the summers of 2022 and 2023, droughts over China may have a faster onset than at present (Yuan et al., 2019). As a result, northeast and north China, which were recognized as regions with a low frequency of flash droughts in previous studies (e.g. Wang et al., 2016; Liu et al., 2020), also have potential increments of flash droughts in the warming climate. In addition, it should be noted that DDO does not continuously change with the rising temperatures, even in south China, which presents with the highest sensitivity to high temperatures (Fig. 8). This could relate to the limited data samples of temperatures above 35 or 40 °C (generally rare in historical events for most regions in China) for model training, which may reduce the simulation accuracy and lead to the boundary effect. In addition, the role of temperature could also be very limited when reaching a rather high value, while other aerodynamic fluxes may be more crucial for the ongoing development of soil moisture drought (Christian et al., 2024).
Meanwhile, the role of high temperatures was shown to be strongly different given the timing of their occurrence (Fig. 9). For all of China, high temperatures of 1-month leads were most relevant to soil drying and could be employed as a precursor of a rapid drought onset. As drought evolves, water and thermal forces also change, high temperatures after drought onset are also conductive to the ongoing process of soil moisture drought, and such promoting effects may persist for 1 month. In other words, high temperatures at 1-month intervals of the drought onset are effective for accelerating soil drying over China.
During the shift of driving forces from water control to thermal control, vegetation also modulates the water and energy balances between the atmosphere and the land surface (Van Loon, 2015; Warter et al., 2021), leading to different roles of high temperatures under varied vegetation conditions. In high-NDVI areas such as southwest China, pre-drought high temperatures contributed to a higher evapotranspiration rate by means of water uptake from soil (Fig. 12) and were conducive to the formation of soil moisture drought. However, when soil moisture enters a water deficiency state (after drought initiation), evapotranspiration would not continuously increase at high temperatures, but rather high temperatures may arise with the stomatal closure of vegetation to impede further water losses from the soil (Seneviratne et al., 2010). This is evident by the sharply decreased AET anomalies after drought initiation (Fig. 12a) and also the weakened coupling between VPD and soil moisture (Fig. 12b). However, in low-NDVI areas such as northwest China, high temperatures after drought initiation played a leading role in accelerating the development of soil moisture drought. This shows the asymmetrical effects between pre-drought and post-drought high temperatures on DDO. Therefore, it is necessary to take account of regional differences associated with high-temperature roles when making strategies related to local drought early warning, drought monitoring, and prediction.
The findings in this study supplement the understanding of the change ratio of drought formation in a warming process. Given the evidence of accelerated drought onset under warming scenarios, it is recommended to incorporate the formation of drought during the onset stage in future drought assessments, as it was for drought intensity and duration.
The daily meteorological data were collected from the China Meteorological Administration (https://data.cma.cn/en, CMA, 2021). ERA5-Land data used in this study are available through European Centre for Medium-Range Weather Forecasts (https://cds.climate.copernicus.eu/cdsapp#!/dataset/reanalysis-era5-land, Muñoz Sabater, 2019). The third-generation normalized difference vegetation index (NDVI3g) dataset was obtained from the National Aeronautics and Space Administration (NASA) Ames Ecological Forecasting Lab (https://daac.ornl.gov/VEGETATION/guides/Global_Veg_Greenness_GIMMS_3G.html, Pinzon et al., 2023). The software used is MATLAB (version 2019a), and the function packages can be downloaded from its website (https://www.mathworks.com, Mathworks, 2023).
ZW carried out the analyses and wrote the manuscript. XZ prepared the figures and data. YL and LR designed the paper and supervised the formulation of this paper. YZ provided critical feedback and edits. JJ and SY provided important suggestions. All authors discussed the results and contributed to the final paper.
The contact author has declared that none of the authors has any competing interests.
Publisher's note: Copernicus Publications remains neutral with regard to jurisdictional claims made in the text, published maps, institutional affiliations, or any other geographical representation in this paper. While Copernicus Publications makes every effort to include appropriate place names, the final responsibility lies with the authors. Regarding the maps used in this paper, please note that Figs. 3, 4, 5, 7, and 10 contain disputed territories.
This study was supported by the National Key Research and Development Program (grant no. 2023YFC3209800), the National Natural Science Foundation of China (grant nos. 42171021, U2243203), and the National Natural Science Foundation of Jiangsu Province Youth Fund (grant no. BK 20220145).
This paper was edited by Xing Yuan and reviewed by two anonymous referees.
Ahmad, S. K., Kumar, S. V., and Lahmers, T. M.: Flash drought onset and development mechanisms captured with soil moisture and vegetation data assimilation, Water Resour. Res., 58, e2022WR032894, https://doi.org/10.1029/2022WR032894, 2022.
Alizadeh, M. R., Adamowski, J., and Nikoo, M. R.: A century of observations reveals increasing likelihood of continental-scale compound dry-hot extremes, Sci. Adv., 6, eaaz4571, https://doi.org/10.1126/sciadv.aaz4571, 2020.
Beck, H. E., Pan, M., Miralles, D. G., Reichle, R. H., Dorigo, W. A., Hahn, S., Sheffield, J., Karthikeyan, L., Balsamo, G., Parinussa, R. M., van Dijk, A. I. J. M., Du, J., Kimball, J. S., Vergopolan, N., and Wood, E. F.: Evaluation of 18 satellite- and model-based soil moisture products using in situ measurements from 826 sensors, Hydrol. Earth Syst. Sci., 25, 17–40, https://doi.org/10.5194/hess-25-17-2021, 2021.
Belgiu, M. and Drăguţ, L.: Random forest in Remote Sens.-Basel: A review of applications and future directions, ISPRS J. Photogramm. Remote Sens., 144, 24–31, https://doi.org/10.1016/j.isprsjprs.2016.01.011, 2016.
Budyko, M. I.: New York, NY: Academic Press, Climate and life, p. 508, https://doi.org/10.1016/0033-5894(67)90014-2, 1974.
Chiang, F., Mazdiyasni, O., and AghaKouchak, A.: Evidence of anthropogenic impacts on global drought frequency, duration, and intensity, Nat. Commun., 12, 2754, https://doi.org/10.1038/s41467-021-22314-w, 2021.
Christian, J. I., Basara, J. B., and Otkin, J. A.: A methodology for flash drought identification: Application of flash drought frequency across the United States, J. Hydrol., 20, 833–846, https://doi.org/10.1175/JHM-D-18-0198.1, 2019.
Christian, J. I., Hobbins, M., and Hoell, A.: Flash drought: A state of the science review, WIRES Water., 11, e1714, https://doi.org/10.1002/wat2.1714, 2024.
China Meteorological Administration (CMA): China land-surface meteorological daily dataset, CMA [data set], https://data.cma.cn/en (last access: 20 October 2021), 2021.
Cutler, A., Cutler, D. R., and Stevens, J. R.: Random Forests, in: Ensemble Machine Learning, edited by: Zhang, C. and Ma, Y., 157–175 pp., New York, NY: Springer, https://doi.org/10.1007/978-1-4419-9326-7_5, 2012.
Dai, A.: Increasing drought under global warming in observations and models, Nat. Clim. Change, 3, 52–58, https://doi.org/10.1038/nclimate1633, 2012.
Durre, I., Wallace, J. M., and Lettenmaier, D. P.: Dependence of extreme daily maximum temperatures on antecedent soil moisture in the contiguous United States during summer, J. Climate, 13, 2641–2651, https://doi.org/10.1175/1520-0442(2000)013<2641:DOEDMT>2.0. CO;2, 2000.
Ford, T. W. and Labosier, C. F.: Meteorological conditions associated with the onset of flash drought in the eastern United States, Agr. Forest Meteorol., 247, 414–423, https://doi.org/10.1016/j.agrformet.2017.08.031, 2017.
Hao, Z., Hao, F., and Singh, V. P.: Changes in the severity of compound drought and hot extremes over global land areas, Environ. Res. Lett., 13, 124022, https://doi.org/10.1088/1748-9326/aaee96, 2018.
Hao, Z., Hao, F., and Xia, Y.: Compound droughts and hot extremes: Characteristics, drivers, changes, and impacts, Earth-Sci. Rev., 235, 104241, https://doi.org/10.1016/j.earscirev.2022.104241, 2022.
Ho, S., Buras, A., and Tuo, Y.: Comparing agriculture-related characteristics of flash and normal drought reveals heterogeneous crop response. Water Resour. Res., 59, e2023WR034994, https://doi.org/10.1029/2023WR034994, 2023.
Lian, X., Piao, S., and Chen, A.: Multifaceted characteristics of dryland aridity changes in a warming world, Nat. Rev. Earth Env., 2, 232–250, https://doi.org/10.1038/s43017-021-00144-0, 2021.
Liu, Y., Chen, R., and Yuan, S.: Satellite Soil Moisture Data Reconstruction in the Temporal and Spatial Domains: Latent Error Assessments and Performances for Tracing Rainstorms and Droughts, Remote Sens.-Basel, 14, 4841, https://doi.org/10.3390/rs14194841, 2022.
Liu, Y., Yuan, S., and Zhu, Y.: The patterns, magnitude, and drivers of unprecedented 2022 mega-drought in the Yangtze River Basin, China, Environ. Res. Lett., 18, 114006, https://doi.org/10.1088/1748-9326/acfe21, 2023a.
Liu, Y., Zhu, Y., and Ren, L.: Flash drought fades away under the effect of accumulated water deficits: the persistence and transition to conventional drought, Environ. Res. Lett., 18, 114035, https://doi.org/10.1088/1748-9326/acfccb, 2023b.
Liu, Y., Zhu, Y., and Zhang, L.: Flash droughts characterization over China: From a perspective of the rapid intensification rate, Sci. Total Environ., 704, 135373, https://doi.org/10.1016/j.scitotenv.2019.135373, 2020.
Mahto, S. S. and Mishra V.: Global evidence of rapid flash drought recovery by extreme precipitation, Environ. Res. Lett., 19, 044031, https://doi.org/10.1088/1748-9326/ad300c, 2024.
Mathworks: MATLAB für Künstliche Intelligenz, https://www.mathworks.com (last access: December 2023), 2023.
Mazdiyasni, O. and AghaKouchak, A.: Substantial increase in concurrent droughts and heatwaves in the United States, P. Natl. A. Sci. India B., 112, 11484–11489, https://doi.org/10.1073/pnas.1422945112, 2015.
Miralles, D. G., Gentine, P., and Seneviratne, S. I.: Land–atmospheric feedbacks during droughts and heatwaves: state of the science and current challenges, Ann. Ny. Acad. Sci., 1436, 19–35, https://doi.org/10.1111/nyas.13912, 2019.
Mo, K. C. and Lettenmaier, D. P.: Heat wave flash droughts in decline, Geophys. Res. Lett., 42, 2823–2829, https://doi.org/10.1002/2015GL064018, 2015.
Mukherjee, S. and Mishra, A. K.: Increase in compound drought and heatwaves in a warming world, Geophys. Res. Lett., 48, e2020GL090617, https://doi.org/10.1029/2020GL090617, 2021.
Mukherjee, S., Mishra, A. K., and Zscheischler, J.: Interaction between dry and hot extremes at a global scale using a cascade modeling framework, Nat. Commun., 14, 277, https://doi.org/10.1038/s41467-022-35748-7, 2023.
Muñoz Sabater, J.: ERA5-Land hourly data from 1950 to present, Copernicus Climate Change Service (C3S) Climate Data Store (CDS), ECMWF [data set], https://doi.org/10.24381/cds.e2161bac, 2019.
Muñoz-Sabater, J., Dutra, E., Agustí-Panareda, A., Albergel, C., Arduini, G., Balsamo, G., Boussetta, S., Choulga, M., Harrigan, S., Hersbach, H., Martens, B., Miralles, D. G., Piles, M., Rodríguez-Fernández, N. J., Zsoter, E., Buontempo, C., and Thépaut, J.-N.: ERA5-Land: a state-of-the-art global reanalysis dataset for land applications, Earth Syst. Sci. Data, 13, 4349–4383, https://doi.org/10.5194/essd-13-4349-2021, 2021.
Naumann, G., Cammalleri, C., and Mentaschi, L.: Increased economic drought impacts in Europe with anthropogenic warming, Nat. Clim. Change, 11, 485–491, https://doi.org/10.1038/s41558-021-01044-3, 2021.
Nguyen, H., Otkin, J. A., and Wheeler, M. C.: Climatology and variability of the evaporative stress index and its suitability as a tool to monitor Australian drought, J. Hydrometeology, 21, 2309–2324, https://doi.org/10.1175/JHM-D-20-0042.1, 2020.
Osman, M., Zaitchik, B. F., Badr, H. S., Christian, J. I., Tadesse, T., Otkin, J. A., and Anderson, M. C.: Flash drought onset over the contiguous United States: sensitivity of inventories and trends to quantitative definitions, Hydrol. Earth Syst. Sci., 25, 565–581, https://doi.org/10.5194/hess-25-565-2021, 2021.
Osman, M., Zaitchik, B. F., and Winstead, N. S.: Cascading Drought-Heat Dynamics During the 2021 Southwest United States Heatwave, Geophys. Res. Lett., 49, e2022GL099265, https://doi.org/10.1029/2022GL099265, 2022.
Otkin, J. A., Svoboda, M., and Hunt, E. D.: Flash droughts: A review and assessment of the challenges imposed by rapid-onset droughts in the United States, B. Am. Meteorol. Soc., 99, 911–919, https://doi.org/10.1175/BAMS-D-17-0149.1, 2018.
Otkin, J. A., Woloszyn, M., and Wang, H.: Getting ahead of flash drought: from early warning to early action, B. Am. Meteorol. Soc., 103, E2188–E2202, https://doi.org/10.1175/BAMS-D-21-0288.1, 2022.
Parker, T., Gallant, A., and Hobbins, M.: Flash drought in Australia and its relationship to evaporative demand, Environ. Res. Lett., 16, 064033, https://doi.org/10.1088/1748-9326/abfe2c, 2021.
Pinzon, J. E., Pak, E. W., and Tucker, C. J.: Global Vegetation Greenness (NDVI) from AVHRR GIMMS-3G+, 1981–2022, ORNL DAAC, Oak Ridge, Tennessee, USA [data set], https://doi.org/10.3334/ORNLDAAC/2187, 2023.
Qing, Y., Wang, S., and Ancell, B. C.: Accelerating flash droughts induced by the joint influence of soil moisture depletion and atmospheric aridity, Nat. Commun., 13, 1139, https://doi.org/10.1038/s41467-022-28752-4, 2022.
Roderick, M. L., Hobbins, M. T., and Farquhar, G. D.: Pan evaporation trends and the terrestrial water balance II, Energy balance and interpretation, Geography Compass, 3, 761–780, https://doi.org/10.1111/j.1749-8198.2008.00214.x, 2009.
Schumacher, D. L., Keune, J., and Dirmeyer, P.: Drought self-propagation in drylands due to land–atmosphere feedbacks, Nat. Geosci., 15, 262–268, https://doi.org/10.1038/s41561-022-00912-7, 2022.
Seneviratne, S. I., Corti, T., and Davin, E. L.: Investigating soil moisture–climate interactions in a changing climate: A review, Earth-Sci. Rev., 99, 125–161, https://doi.org/10.1016/j.earscirev.2010.02.004, 2010.
Shah, J., Hari V., and Rakovec O.: Increasing footprint of climate warming on flash droughts occurrence in Europe, Environ. Res. Lett, 17, 064017, https://doi.org/10.1088/1748-9326/ac6888, 2022.
Svoboda, M., LeComte, D., and Hayes, M.: The drought monitor, B. Am. Meteorol. Soc., 83, 1181–1190, https://doi.org/10.1175/1520-0477-83.8.1181, 2002.
Teuling, A. J.: A hot future for European droughts, Nat. Clim. Change, 8, 364–365, https://doi.org/10.1038/s41558-018-0154-5, 2018.
Trenberth, K. E., Dai, A., and Van Der Schrier, G.: Global warming and changes in drought, Nat. Clim. Change, 2014, 4, 17–22, https://doi.org/10.1038/nclimate2067, 2014.
Van Der Woude, A. M., Peters, W., and Joetzjer, E.: Temperature extremes of 2022 reduced carbon uptake by forests in Europe, Nat. Commun., 14, 6218, https://doi.org/10.1038/s41467-023-41851-0, 2023.
Van Loon, A. F.: Hydrological drought explained, WIRES Water., 2, 359–392, https://doi.org/10.1002/wat2.1085, 2015.
Vicente-Serrano, S. M., Quiring, S. M., and Peña-Gallardo, M.: A review of environmental droughts: Increased risk under global warming?, Earth-Sci. Rev., 201, 102953, https://doi.org/10.1016/j.earscirev.2019.102953, 2020.
Wang, L., Yuan, X., and Xie, Z.: Increasing flash droughts over China during the recent global warming hiatus, Sci. Rep.-UK, 6, 30571, https://doi.org/10.1038/srep30571, 2016.
Wang, T., Tu, X., and Singh, V.P.: Global data assessment and analysis of drought characteristics based on CMIP6, J. Hydrol., 596, 126091, https://doi.org/10.1016/j.jhydrol.2021.126091, 2021.
Warter, M. M., Singer, M. B., Cuthbert, M. O., Roberts, D., Caylor, K. K., Sabathier, R., and Stella, J.: Drought onset and propagation into soil moisture and grassland vegetation responses during the 2012–2019 major drought in Southern California, Hydrol. Earth Syst. Sci., 25, 3713–3729, https://doi.org/10.5194/hess-25-3713-2021, 2021.
Williams, A. P., Seager, R., and Abatzoglou, J. T.: Contribution of anthropogenic warming to California drought during 2012–2014, Geophys. Res. Lett., 42, 6819–6828, https://doi.org/10.1002/2015GL064924, 2015.
Yang, L., Wen, K. S., and Ruan, X.: Response of plant secondary metabolites to environmental factors, Molecules, 23, 762, https://doi.org/10.3390/molecules23040762, 2018.
Yin, J., Gentine, P., and Slater, L.: Future socio-ecosystem productivity threatened by compound drought-heatwave events, Nat. Sustain., 6, 259–272, https://doi.org/10.1038/s41893-022-01024-1, 2023.
Yuan, X., Wang, L., and Wu, P.: Anthropogenic shift towards higher risk of flash drought over China, Nat. Commun., 10, 4661, https://doi.org/10.1038/s41467-019-12692-7, 2019.
Yuan, X., Wang, Y., and Ji, P.: A global transition to flash droughts under climate change, Science, 380, 187–191, https://doi.org/10.1126/science.abn6301, 2023.
Zhang, L., Liu, Y., Ren, L., Teuling, A. J., Zhu, Y., Wei, L., Zhang, L., Jiang, S., Yang, X., Fang, X., and Yin, H.: Analysis of flash droughts in China using machine learning, Hydrol. Earth Syst. Sci., 26, 3241–3261, https://doi.org/10.5194/hess-26-3241-2022, 2022.
Zhou, S., Williams, A. P., and Berg, A. M.: Land–atmosphere feedbacks exacerbate concurrent soil drought and atmospheric aridity, P. Natl. A. Sci. India B., 116, 18848–18853, https://doi.org/10.1073/pnas.1904955116, 2019.
Zhou, S., Yu, B., and Zhang, Y.: Global concurrent climate extremes exacerbated by anthropogenic climate change, Sci. Adv., 9, eabo1638, https://doi.org/10.1126/sciadv.abo1638, 2023.
Zhou, Z. Q., Ding, Y. B., and Zhao, Y. Y.: A new perspective for assessing hydro-meteorological drought relationships at large scale based on causality analysis. Environ. Res. Lett., 18, 104046,2023, https://doi.org/10.1088/1748-9326/acfe1e, 2023.
Zscheischler, J. and Fischer, E. M.: The record-breaking compound hot and dry 2018 growing season in Germany, Weather Clim. Extreme, 29, 100270, https://doi.org/10.1016/j.wace.2020.100270, 2020.