the Creative Commons Attribution 4.0 License.
the Creative Commons Attribution 4.0 License.
Inferring sediment-discharge event types in an Alpine catchment from sub-daily time series
Amalie Skålevåg
Oliver Korup
Axel Bronstert
Fluvial sediment dynamics in mountain rivers are changing rapidly in a degrading cryosphere, raising the potential for erosive rainfall and runoff and detrimental effects on downstream areas. Hence, we need to understand better what characterises and drives episodic pulses of water and suspended solids in rivers. Here, we infer different types of such sediment-discharge events from 959 automatically detected events based on 16 metrics derived from 15 min time series of streamflow and suspended sediment concentrations from Vent–Rofental in the high Ötztal Alps, Austria. We use principal component analysis to extract uncorrelated event characteristics and cluster event types with a Gaussian mixture model. We interpret the thus inferred event types with catchment metrics describing antecedent conditions, hydrometeorological forcing, and fraction of catchment area with freezing temperatures and snow cover. We find event magnitude, hysteresis, and event shape complexity to be the main factors characterising the overall event regime. The most important characteristics distinguishing the event types are suspended sediment and streamflow magnitude and complexity of the hydro- and sedigraphs. Sediment-discharge hysteresis is less relevant for discerning event types. We derive four event types that we attribute to (1) compound rainfall–melt extremes, (2) glacier and seasonal snowmelt, (3) freeze–thaw-modulated snowmelt and precipitation events, and (4) late-season glacier melt. Glacier and snowmelt events driven by warm conditions and high insolation were the most frequent and contributed some 40 % to annual suspended sediment yield on average; compound rainfall–melt extremes were the rarest but contributed the second-highest proportion (26 %). Our approach represents a reproducible method for objectively estimating the variety of event-scale suspended sediment transport conditions in mountain rivers, which can provide insights into the contribution of different drivers to annual sediment yields in current and future regimes. Our findings highlight the importance of both meltwater and rainfall–runoff as drivers of high-magnitude suspended sediment fluxes in mountain rivers.
- Article
(10145 KB) - Full-text XML
- BibTeX
- EndNote
High-mountain areas have been warming at a faster rate than the global average (Hock et al., 2019), drastically changing the mountain cryosphere in terms of accelerated glacier mass loss (Hugonnet et al., 2021; Huss and Hock, 2018), permafrost degradation (Smith et al., 2022; Biskaborn et al., 2019), and snowpack reduction (Hanzer et al., 2018; Beniston et al., 2018; Carrer et al., 2023). This ongoing cryospheric decay is combined with altered precipitation and weather patterns and change sediment dynamics and loads in mountain regions (Zhang et al., 2022). Elevated sediment loads can have detrimental effects on water quality, hydro-power production, and aquatic habitats and ecosystems in downstream reaches in particular (Adler et al., 2022; Huss et al., 2017; Scheurer et al., 2009).
Current changes in fluvial suspended sediment transport in mountain rivers are mainly affected by sub- and proglacial sources in the wake of deglaciation and reworking of freshly exposed deposits (Schmidt et al., 2022; Zhang et al., 2022; Ballantyne, 2002; Delaney and Adhikari, 2020; Delaney et al., 2018a; Hinderer et al., 2013). Episodic sediment pulses, often caused by rainstorms, can contribute substantial fractions to annual sediment yields (Vercruysse et al., 2017; Gonzalez-Hidalgo et al., 2013; Schmidt et al., 2022). Observed and projected increases in extreme precipitation (Madsen et al., 2014; Vergara-Temprado et al., 2021; Fowler et al., 2021) make it seem likely that such sediment fluxes may become more dominant, leading to more flashy sediment-transport regimes (Zhang et al., 2022). Paraglacial environments in particular host large amounts of unconsolidated sediment that can remain available for mobilisation during extreme rainfall events long after glaciers have melted (Zhang et al., 2022; Huss et al., 2017). Thus, any gradually decaying sub- and proglacial sediment discharge may be supplemented by rainfall-driven reworking of sediment (Zhang et al., 2022). Consequently, we need to better understand the current drivers of episodic sediment fluxes in high-mountain areas and to which extent hydrometeorological forcing, sediment availability, and reworking will affect our projections of future rates and regimes of sediment transport.
Detailed event-based analysis of suspended sediment dynamics in mountain rivers can identify important antecedent conditions and drivers (Vercruysse et al., 2017). However, the complex and nonlinear nature of suspended sediment transport in mountain rivers poses a challenge for such analyses (Vercruysse et al., 2017; Bracken et al., 2015): the complexity arises from (1) multiple hydrological drivers of sediment transport, e.g. rainfall, snowmelt, and glacier melt (Costa et al., 2018; Orwin et al., 2010); (2) catchment conditions and processes regulating sediment production and availability, e.g. snow and vegetation cover, freeze–thaw cycles and erosion, lithology, and glacial history (Schmidt et al., 2022; Rengers et al., 2020); and (3) hillslope and channel geomorphology that influences erosion potential and sediment connectivity (Bracken et al., 2015). Hence, suspended sediment concentrations in mountain rivers are highly variable (Schmidt et al., 2022; Lalk et al., 2014; Hinderer et al., 2013; Delaney et al., 2018b). By systematically detecting and grouping episodic suspended sediment fluxes, which we term sediment-discharge events, we might derive a catchment-specific event typology in which each type shares similar and dominant hydrometeorological drivers and geomorphic catchment conditions.
While studies of event-scale suspended sediment dynamics are common, only a handful of studies have tried to identify specific event types and their conditions and drivers. Most of these studies focused on classifying patterns of sediment-discharge hysteresis (e.g. Hamshaw et al., 2018; Tsyplenkov et al., 2020; Haddadchi and Hicks, 2021) and attributed these classes to drivers such as hydrometeorological forcing (e.g. rainfall intensity and amount); antecedent catchment conditions (e.g. soil moisture, precipitation); land cover; sediment exhaustion; or contributions from multiple sediment sources. Sediment-discharge hysteresis is a well-established concept in fluvial sediment transport research, dating back to 1953 (Malutta et al., 2020). Despite its popularity in classifying event-scale sediment discharge dynamics, the interpretation of hysteresis remains contextual (Vercruysse et al., 2017) and often without direct indication of its cause (Tsyplenkov et al., 2020), especially where the same cause is attributed to different types of hysteresis (Table 1 in Malutta et al., 2020).
A more general approach can be taken by clustering sediment-discharge events based on characteristics derived from their hydro- and sedigraphs. Leggat et al. (2015) and Orwin and Smart (2004) used a combined classification, separately clustering sedigraph temporal patterns and magnitudes to identify event types and the associated dominant meteorological conditions and drivers. Javed et al. (2021) grouped events based solely on hydro- and sedigraph shapes by normalising magnitude and standardising event lengths and subsequently clustering with k-medoids and dynamic time warping. Mather and Johnson (2015) clustered event shapes based on sediment rating curve parameters. The advantage of using clustering for inferring event typologies is that it does not require any previous knowledge about event types (Tarasova et al., 2019). Thus, clustering is a suitable first approach for inferring sediment-discharge event types in high-mountain catchments on the basis of similar water and sediment discharge characteristics.
Here, we use a clustering approach to derive a sediment-discharge event typology for the high-Alpine, glaciated basin Vent–Rofental, Ötztal Alps, Austria. With its long monitoring history, the catchment has a wealth of hydrological, meteorological, and glaciological data (Strasser et al., 2018). The key to our data-driven approach is continuous high-resolution records of suspended sediment concentration since 2006. Recent reconstructions and projections of annual suspended sediment yield for the Vent–Rofental basin suggest that the basin has entered a phase of declining glacial influence on sediment transport (Schmidt et al., 2023, 2024), making it an ideal study area to examine. For our clustering approach, we assume that each event belongs to a certain type that shares a set of similar sediment-discharge characteristics. We identify and condense these characteristics with a principal component analysis on 16 event metrics describing event magnitude, hysteresis, shape, and effects of preceding events. We cluster events based on these characteristics with a Gaussian mixture model and use hydrometeorological data to interpret each cluster as an event type. Our aim is to understand the catchment state, antecedent conditions, and hydrometeorological drivers that determine event-scale suspended sediment dynamics in the upper Ötztal with the following research questions:
-
What are the key sediment-discharge characteristics that differentiate between the event types?
-
Do events of the same type share hydrometeorological drivers?
-
Are the event types associated with diagnostic antecedent conditions (e.g. dry vs. wet and cool vs. warm)?
-
What is the contribution of each event type to the annual suspended sediment yield?
Rofental is a valley located upstream of the village of Vent in the Ötztal Alps, Austria (Fig. 1). The valley has been the site of several hydrometeorological and glaciological studies in the past 150 years and has a unique time series of long-term observations (see Strasser et al., 2018, for detailed description). The Vent–Rofental hydrological basin spans 98 km2 and an elevation range of 1891–3772 m a.s.l. The main river is the Rofenache, a tributary of the Venter Ache, Ötztaler Ache, and Inn. The current hydrological regime is dominated by snowmelt and ice melt, which peak in July and August and are the lowest during winter (Strasser et al., 2018; Schmidt et al., 2022). The seasonality of suspended sediment has a pattern similar to that of streamflow but with a longer low-flux winter period (Schmidt et al., 2022). Glaciers cover about a quarter of the catchment (28 % in 2015, Schmidt et al., 2022; Buckel and Otto, 2018). However, their size is rapidly decreasing, and they will likely disappear by the end of the 21st century (Hanzer et al., 2018).
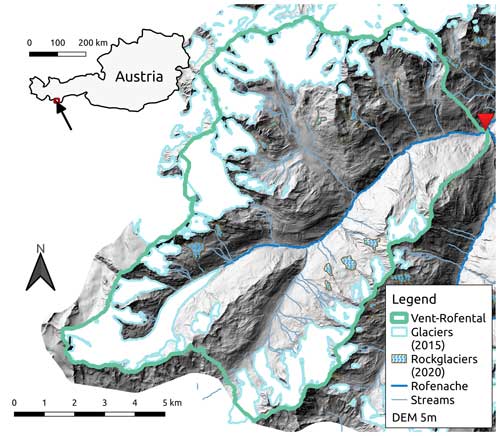
Figure 1Map of the study area showing the topography (Land Tirol, 2021), river network (OpenStreetMap, 2022), glaciers (Buckel and Otto, 2018), and active rock glaciers (Wagner et al., 2020). The location of the Vent–Rofental river gauge is denoted by a red triangle and the accompanying catchment boundary in green. © OpenStreetMap contributors 2022. Distributed under the Open Data Commons Open Database License (ODbL) v1.0.
The bedrock consists of various types of gneiss-mica schists and schistose gneisses (Moser, 2016; Kreuss, 2018). The Quaternary geology is dominated by Holocene and some Pleistocene moraines (Moser, 2016; Kreuss, 2018). The catchment also has many talus slopes sitting between the moraines and steep bedrock slopes (Moser, 2016; Kreuss, 2018). Apart from a few small lakes and proglacial outwash plains, the river network lacks significant sediment storage.
The Vent–Rofental river gauge (1891 m a.s.l., 46.85691° N, 10.91093° E) has been operated continuously by the Hydrographic Service of Tyrol (HD-Tirol) since 1967, and suspended sediment concentration (SSC) has been monitored since 2006 with two optical infrared turbidity sensor (Solitax sensors by Hach) and manual SSC sampling (see Lalk et al., 2014, for details). The continuous SSC monitoring at Vent–Rofental was established as part of a nation-wide strategy by the Austrian Hydrographic Service in order to monitor and analyse changes in riverine suspended sediment resulting from deglaciation, permafrost thawing, land use changes, and river regulation (Habersack et al., 2008; Lalk et al., 2014). SSC samples to calibrate turbidity measurements were frequently manually collected close to the turbidity sensors and, when possible, during high-flow events (Lalk et al., 2014). Turbidity measurements at the Vent–Rofental gauge are paused in winter (October–April) to prevent damage to the equipment. However, the sensors are installed before the spring rise in SSC, and the sediment transport during the unmonitored period can be considered negligible.
A number of gridded products of hydrometeorological variables are available for Rofental (Table 1) and are mostly from the Austrian Weather Service GeoSphere Austria. We used these data to calculate various metrics of catchment conditions and processes during and leading up to events (see Sect. 3.4).
Matiu et al. (2019a)Table 1Description of datasets and variables used in this study. Temporal extents refer to available data in the study period (2006–2021).
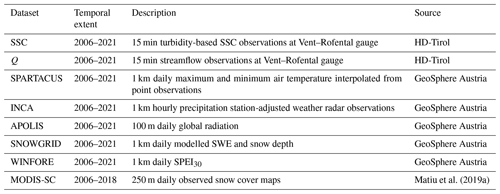
SPARTACUS provides daily maximum and minimum temperature fields at 1 km resolution based on interpolated station data. Time series from 150 stations in Austria are interpolated with a method that combines a macroclimatic background field with a mesoclimatic residual field (see Hiebl and Frei, 2016, for details).
WINFORE provides daily reference (potential) evapotranspiration fields at 1 km resolution using a recalibrated Hargreaves method forced with SPARTACUS minimum and maximum temperature fields (see Haslinger and Bartsch, 2016, for details). The daily reference potential evapotranspiration and SPARTACUS interpolated daily precipitation fields (Hiebl and Frei, 2018) are then used to calculate the 30 d standardised precipitation and evapotranspiration index (SPEI30) fields at daily resolution.
The INCA system produces analysis and nowcasting fields for various meteorological variables. The precipitation analysis incorporates rain gauge measurements, radar data, and elevation effects. The uncorrected radar field is partially corrected to produce a climatologically adjusted radar field, which is subsequently re-scaled based on the comparison between station observations and the radar field at the station location (see Haiden et al., 2011, for details).
Daily global radiation fields are obtained from APOLIS, a 100 m gridded dataset produced by calculating direct and diffuse solar radiation with the parametric solar radiation model STRAHLGRID (Olefs and Schöner, 2012).
SNOWGRID-CL, a daily and longer-term version of the physically based and spatially distributed snow model SNOWGRID, uses an extended degree-day scheme to calculate snow ablation and a two-layer scheme to account for snow sublimation, settling, and refreezing of the snow cover (Olefs et al., 2020). The model is forced with daily WINFORE potential evapotranspiration (Haslinger and Bartsch, 2016) and SPARTACUS temperature (Hiebl and Frei, 2016) and precipitation (Hiebl and Frei, 2018) fields, producing daily snow water equivalent (SWE) and snow depth estimations at 1 km resolution. To complement the SNOWGRID data, we also included daily 250 m snow cover maps derived from MODIS imagery using snow cover and cloud removal algorithms tailored to the European Alps (see Matiu et al., 2019a, for details).
Our approach for identifying sediment-discharge event types is divided into three steps: (1) detection and characterisation of events (Sect. 3.1 and 3.2), (2) grouping similar events via clustering (Sect. 3.3), and (3) evaluation and interpretation of these clusters as event types (Sect. 3.4).
3.1 Event detection
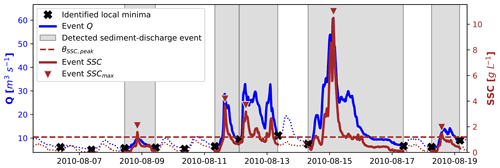
There is no commonly used definition of what constitutes a sediment-discharge event, i.e. an episodic suspended sediment flux measured at the catchment outlet. Studies use various terms, e.g. flood events (Pagano et al., 2019; Francke et al., 2008), hydrologic(al) events (Tsyplenkov et al., 2020; Williams, 1989), or storm events (Javed et al., 2021; Hamshaw et al., 2018), as events are generally separated based on streamflow by either hydrological day (e.g. Antoniazza et al., 2022; Leggat et al., 2015), with hydrograph separation (e.g. Haddadchi and Hicks, 2020; Tsyplenkov et al., 2020), or a semi-automated procedure (e.g. Hamshaw et al., 2018). In this study, we use the term sediment-discharge event, which we define as a marked increase in streamflow accompanied by a large pulse of suspended sediment measured at the catchment outlet (i.e. gauge).
Continuous 15 min time series of streamflow, Qt, and suspended sediment concentration, SSCt, were used for the event detection. The start, t0, and end, t1, of an event i were derived from Qt and then subsequently filtered based on event SSCt using the following procedure (Fig. 2a):
-
The demarcation of hydrological events followed the method after Tsyplenkov et al. (2020) based on the local minimum hydrograph separation method (Sloto and Crouse, 1996) using the loadflux R package (Tsyplenkov, 2022). This method essentially splits the entire streamflow record into events at local minima identified in a centred 21 h search window, w.
-
We removed hydrological events with no or only partial SSC measurements.
-
Only events where peak SSC values that exceeded a fixed threshold, θSSC,peak, were kept. To focus on large events, we set the threshold at the 90th percentile, P90, of SSCt, which for our 16-year study period (2006–2021) was 1196.5 mg L−1.
The choice of P90 as the peak SSC threshold was a trade-off between ensuring a sufficient number of events for the clustering while keeping only larger events.
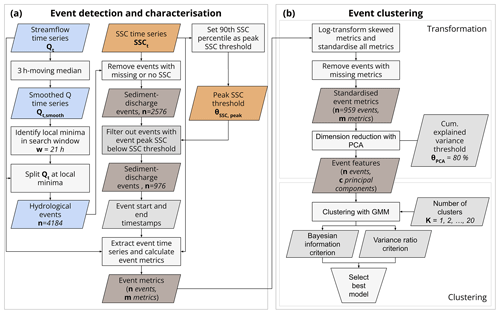
Figure 2Overview of event detection and characterisation (a) and event clustering (b). Events are demarcated at local streamflow minima and then filtered by suspended sediment concentration (SSC) magnitude. Each event is then characterised with sediment-discharge event metrics (see Table 2). After transforming and standardising the metrics, the dimensions are reduced with principal component analysis (PCA) and clusters identified with a Gaussian mixture model (GMM). The optimal number of clusters are chosen using two objective criteria. The values specific to this study are denoted in italic. Input variables and thresholds are denoted in bold.
This event detection procedure ensures that events of varying duration can be detected (Fig. 3) and that the detected events are extreme enough (in terms of SSC) to be of interest. By filtering events based on the peak SSC threshold, our approach is similar to a peak-over-threshold (POT) approach, except in that the boundaries of the events are determined by the event hydrograph.
3.2 Characterisation of events
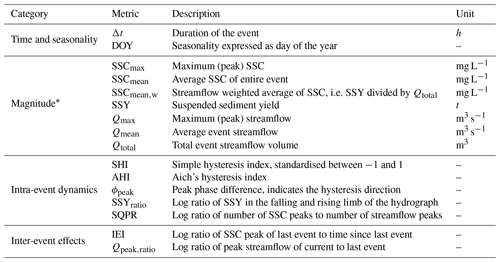
In order to identify groups of similar sediment-discharge events, we need metrics to characterise them first. A number of metrics and indices have been developed to characterise event-scale (suspended) sediment dynamics. We select 14 metrics from the literature and introduce two new metrics (Table 2), which are broadly divided into four categories relating to time and seasonality, event magnitude, intra-event dynamics, and inter-event effects on sediment dynamics.
Table 2Sediment-discharge event metrics used to characterise events.
* Log-transformed during cluster analysis preprocessing.
Metrics of event duration and magnitude are commonly used in studies of event-scale sediment dynamics (e.g. Haddadchi and Hicks, 2021; Leggat et al., 2015; Pagano et al., 2019; Hamshaw et al., 2018), such as the average and peak SSC and streamflow during an event (Table 2). The suspended sediment yield, SSY, (also suspended sediment load) is the total mass of suspended sediment passing the gauge calculated by integrating the product of SSCt and Qt for each time step dt between the start, t0, and end, t1, of the event:
For comparability with other study areas, we sometimes report specific SSY (sSSY) in t km−2, which is SSY divided by the catchment area. Similarly, when we report on annual (s)SSY, t0 is the start and t1 the end of the year.
Hysteresis results from differences in SSC in the rising and falling limbs of the hydrograph and is commonly used to describe event-scale suspended sediment dynamics (Malutta et al., 2020; Vercruysse et al., 2017). A number of hysteresis indices (HIs) have been developed to quantify and classify hysteresis patterns objectively (e.g. Aich et al., 2014; Langlois et al., 2005; Tsyplenkov et al., 2020; Lawler et al., 2006). Here, we use Aich's HI (AHI) (Aich et al., 2014) and the simple HI (SHI) (Tsyplenkov et al., 2020) as both have standardised ranges that allow for direct comparison. More positive values of AHI and SHI indicate stronger clockwise hysteresis, while more negative values indicate more pronounced anticlockwise hysteresis. Both metrics were computed with the loadflux R package (Tsyplenkov, 2022).
Three further metrics were used to characterise intra-event dynamics, i.e. the peak phase difference, the SSC-to-streamflow peak ratio, and the falling and rising limb SSY ratio. The peak phase difference, ϕpeak (Haddadchi and Hicks, 2021), is a dimensionless measure of the time difference between the peaks of streamflow, , and SSC, :
It indicates to what degree the SSC peak leads (positive ϕpeak) or lags (negative ϕpeak) the Q peak. Thus, it also indicates the direction of the hysteresis pattern.
To indicate whether the exported sediment tends to be delivered before or after the streamflow peak, we include a modified version of the SSYratio (Haddadchi and Hicks, 2020), which is the log ratio of SSY in the rising and falling limb of the hydrograph:
indicating whether the bulk of the sediment is delivered in the rising (SSYratio<0) or falling limb of the hydrograph (SSYratio>0).
The SSC-to-streamflow peak ratio (SQPR) is defined as
and indicates whether more SSC peaks (nSSCpeaks) or streamflow peaks (nQpeaks) occur during an event. Negative values indicate more streamflow peaks, while positive values indicate more SSC peaks. If the SQPR is zero, the event has the same number of streamflow and SSC peaks. The peaks were identified automatically (Virtanen et al., 2020, scipy.signal.find_peaks;) based on two criteria: the distance between peaks and the prominence of the peak. The peak prominence “measures how much a peak stands out from the surrounding baseline of the signal and is defined as the vertical distance between the peak and its lowest contour line” (Virtanen et al., 2020, scipy.signal.peak_prominences;). To calculate the SQPR, we set a minimal peak prominence of 500 mg L−1 for SSC peaks, which corresponds to about a third of the median SSC range of events, and 2 m3 s−1 for streamflow peaks, which corresponds to about an eighth of the median streamflow range of events. The minimum distance between peaks was set to 1 h. The selection of these parameters for peak detection was based on visual inspection of the hydro- and sedigraphs of the detected events.
Inter-event effects such as sediment accumulation or exhaustion are important for suspended sediment transport but difficult to quantify. The flow peak ratio, Qpeak,ratio, introduced by Haddadchi and Hicks (2020) is one metric that attempts to quantify inter-event effects:
We modified this metric using the log ratio rather than the ratio of streamflow peak of the last event, , to the current event, .
We also attempt to account for inter-event effects with a new metric, the inter-event index (IEI), defined as the ratio of the SSC peak of the previous event, , in milligrams per litre to the time between the end of the last event, , and the start of the current event, , in hours:
3.3 Event clustering
Our approach for inferring the event types is based on the assumption that each event type shares a set of defining antecedent conditions, hydrometeorological drivers, and catchment states, which we capture sufficiently by our choice of event metrics. Clustering, a type of unsupervised machine learning analysis where data points are grouped into clusters based on their similarity (Murphy, 2012), is suited for our purposes as it does not require predefined class criteria. By clustering based on event metrics, we hope to find groups of events, i.e. event types, that are the expression of a certain set of catchment conditions and hydrometeorological drivers. We employed a two-step approach (Fig. 2b), consisting of a transformation step and a clustering step.
In the transformation step, we applied a principal component analysis (PCA) to the sediment-discharge event metrics. PCA transforms correlated metric variables into the same number of uncorrelated variables called principal components (PCs) (Kim and Kim, 2012). By selecting the top PCs ranked by their explained variance, we end up with a re-projected dataset where the variables, i.e. PCs, contain most of the variance from the original variables.
After the event detection and characterisation, we ended up with an n×m data matrix of n sediment-discharge events and m event metrics. Some of these metrics describe similar aspects of the same event property, e.g. event magnitude or hysteresis. By transforming the dataset with PCA, we achieve two objectives. Firstly, we obtain c principal components (PCs) that can be interpreted as uncorrelated event characteristics. Secondly, we reduce the dimensions of our dataset by selecting fewer PCs than metrics. Preprocessing the event metrics was necessary before applying the PCA. Event metrics describing magnitude were natural-log-transformed (Table 2) as the distributions of these metrics were highly skewed. Next, all metrics were standardised by subtracting the mean and dividing by the standard deviation. This step is needed before performing a PCA since the principal components can be “misled” by directions in which the variance is high merely because of the measurement scale (Murphy, 2012). Finally, the metrics were re-projected in a lower dimension space with PCA by keeping only those ranked principal components that together accounted for more than 80 % of the total explained variance. This left an n×c data matrix, , where c<m.
In the clustering step, the event types were inferred with a Gaussian mixture model (GMM). A GMM is a mixture of K multivariate Gaussians, 𝒩, with mean vector μk denoting the centre of the cluster in all c dimensions, covariance matrix Σk denoting the shape of the cluster, and mixing weight, πk, such that
The mixture weights satisfy the constraint that . The parameterisation, λ, of the GMM is given by
The GMM is a type of soft clustering that estimates the probability of each event belonging to each cluster k. Each event is assigned to the cluster to which it has the highest likelihood of belonging.
The GMM can be fitted with different covariance types for Σk. We tested three different options: a full covariance matrix with dimensions , a diagonal covariance matrix with dimensions k×c, and a spherical covariance matrix with dimensions k. The full covariance type is the most flexible model by admitting independent Gaussians for each cluster, while the spherical is the most restrictive, allowing for only one variance value for each cluster.
In order to determine the optimal number of clusters, K, and covariance type, we used two objective criteria, the Bayesian information criterion (BIC) (Schwarz, 1978), which penalises higher number of parameters needed to describe more clusters, and the variance ratio criterion (VRC) (Caliñski and Harabasz, 1974) and silhouette score (Rousseeuw, 1987), where a higher value relates to a model with better defined clusters and separated clusters respectively. The selection of the optimal cluster model was based on the objective criteria of the lowest BIC and the highest VRC. However, depending on the agreement between the BIC and VRC scores, the final choice may require expert judgement, e.g. by use of the elbow method. The elbow method is a heuristic approach for determining the optimal number of clusters, where K is selected based on the most distinct break in the curve of cluster scores.
3.4 Interpretation of event clusters with catchment metrics
For the interpretation of the inferred event clusters, we selected a number of catchment metrics describing antecedent conditions and hydrometeorological forcing; all these may be relevant for suspended sediment dynamics in mountain rivers (Tables 1 and 3).
(Heggen, 2001)(Frauenfeld et al., 2007)(Frauenfeld et al., 2007)(ACDA Li et al., 2021b)Table 3Catchment metrics describing catchment conditions and hydrometeorological drivers leading up to and during sediment-discharge events.
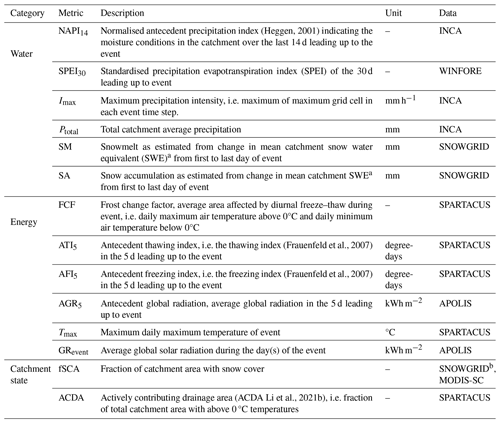
a Excluding glaciated catchment area (Buckel and Otto, 2018). b Snow cover in SNOWGRID, defined as grid cells with snow depth >0.01 m.
In order to measure differences between event types consistently, in terms of both sediment-discharge characteristics and hydrometeorological catchment conditions, we standardised all event and catchment metrics such that
where x is the metric, its mean, and s its standard deviation across all events. Such standardised z scores are useful to compare groups of events (Javed et al., 2021).
4.1 General characteristics of detected sediment-discharge events
Our detection routine identified 976 sediment-discharge events between 2006 and 2021. On average, the annual event frequency is 60 events per year. While events occurred throughout the monitored suspended sediment season from May to October, most happened from mid-June to early September (Fig. 4a), when daily suspended sediment export was the highest following the snowmelt and glacier melt season. During this period, the peak suspended sediment concentration threshold, θSSC,peak, of 1196.5 mg L−1 was frequently exceeded. The largest events occurred towards the end of the glacier melt season, i.e. between mid-July and August.
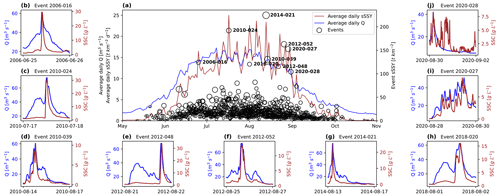
Figure 4Seasonality and magnitude of detected sediment-discharge events (a), including the average annual cycle of daily streamflow (Q) and specific suspended sediment yield (sSSY) for the study period (2006–2021), together with the timing and sSSY magnitude of events, the size of which is proportional to event total streamflow volume. The nine events with (s)SSY greater than 10 000 t (102 t km−2) are annotated (a). These events have exceptionally high peak suspended sediment concentration (SSC) values (b–j).
The median event specific suspended sediment yield (sSSY) is 14.3 t km−2 (duration-normalised sSSY: 13.9 ), and the median event suspended sediment concentration (SSC) (streamflow-weighted) is 1059 mg L−1. The largest event (2014-021, Fig. 4g) exported an estimated 22 019 t of suspended sediment (sSSY: 224.5 t km−2; duration-normalised sSSY: 54.1 ) over nearly 100 h, with 90 % of the sediment reaching the outlet during the first 24 h. Two events in August 2020 (2020-027, Fig. 4i; 2020-028, Fig. 4j) occurred consecutively. When combined, these two events exported 25 179 t of suspended sediment (sSSY: 256.7 t km−2; duration-normalised sSSY: 200.2 ). However, most events had a sSSY of less than 50 t km−2 (Fig. 4a).
The average event duration is about 24 h, with 90 % of events lasting under 30 h. The remaining events have a duration of 2 to 3 d, with six events lasting longer than 4 d.
4.2 Principal component analysis of event metrics
The PCA reduced our set of 16 event metrics to seven principal components (PCs) that explain 84 % of the variance (Fig. 5h). As PCA can only be applied on complete data, 16 events with minor data gaps had to be discarded, leading us to consider a total of 959 events for the PCA and event clustering.
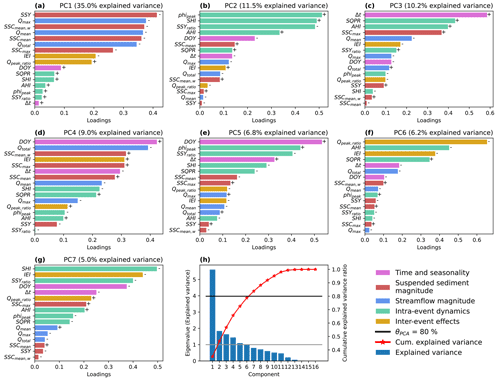
Figure 5Importance of event metrics for each principal component (PC) (a–g) indicated by the sorted absolute loadings of each component. The sign of the loading, which indicates positive or negative correlation of a metric with the PC, is denoted with a plus or a minus for positive and negative sign respectively. The first seven PCs were chosen as these explained just over 80 % of the total variance in the data (h).
We find that PC1 (Fig. 5a) is strongly tied to streamflow and suspended sediment magnitude (i.e. mean and peak event SSC, total suspended sediment mass exported, mean and peak event streamflow, and total streamflow volume). PC1 explains 35 % of the total variance in the data.
Both PC2 and PC3 relate to metrics of intra-event dynamics; PC2 (Fig. 5b) expresses the hysteresis effect and direction. Higher absolute values indicate stronger hysteresis (confirmed by visual inspection of hysteresis pattern). The sign of PC2 indicates hysteresis direction, where positive (negative) values indicate clockwise (anticlockwise) hysteresis. PC2 is essentially a combined hysteresis index of SHI, AHI, ϕpeak, and SSYratio. PC3 relates to the complexity of the event shape, and the similarity between hydro- and sedigraphs, expressed by mixed loadings of event duration, the ratio of SSC to streamflow peaks, SQPR, and SSC peak magnitude (Fig. 5c). Visual inspections of event hydro- and sedigraphs confirm that events with high PC3 values have multiple peaks or complex hysteresis patterns, whereas low PC3 values indicate more uniform event shapes with synchronous hydro- and sedigraphs.
PCs 4 and 5 mainly represent seasonal-dependent effects. PC4 (Fig. 5d) captures the seasonal-dependent relationship between event SSC and streamflow volume, with the tendency of higher SSC for a given total streamflow volume later in the year. Events with high PC4 values tend to occur later in the season; therefore, the positive correlation with seasonal timing (DOY; Table 2) (Fig. 5d). PC5 (Fig. 5e) relates to seasonal- and duration-dependent hysteresis, with mixed loadings of DOY, ϕpeak, SSYratio, and event duration.
PC6 represents mostly inter-event conditions, and two metrics on intra-event dynamics, AHI, and SQPR (Fig. 5f). Visual checks confirm that PC6 expresses the tendency for more pronounced clockwise hysteresis (positive AHI) with higher IEI and Qpeak,ratio. Overall, AHI, IEI, and Qpeak,ratio are negatively correlated with PC6. Finally, PC7 (Fig. 5g) relates to hysteresis, inter-event effects, and seasonality. PC7 is negatively correlated with seasonal timing (DOY) and has higher values for events occurring earlier in the year. However, PC7 explains only 5 % of the total variance in the data.
4.3 Selection of cluster model
For the event clustering, we ran 60 different GMMs in total, with varying combinations of cluster numbers () and covariance types (spherical, diagonal, and full; Fig. 6). For K<4, the BIC decays distinctly for all models (Fig. 6a). Models with diagonal and full covariance matrices have elbow points where the curve flattens abruptly at K=2, whereas the BIC for spherical models decays smoothly with increasing K. For fewer clusters, the more flexible covariance types (diagonal and full) have better BIC scores. Strictly judging by the BIC, the best model would be that with full covariance and .
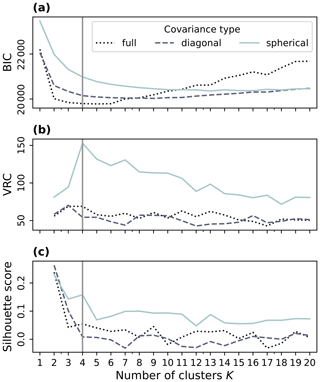
Figure 6Selection of the optimal number of clusters, K, and GMM covariance type based on the Bayesian information criterion (BIC), the variance ratio criterion (VRC), and the silhouette score (SC). Low (high) BIC (VRC, SC) indicates better-defined clusters. The selected number of clusters (K=4) is indicated by a vertical grey line.
However, for both the VRC and the silhouette score, the spherical-type models consistently outperform all others (Fig. 6b–c), with a clear peak for VRC at K=4 and a minor peak for the silhouette score. The BIC also indicates that four clusters with the spherical covariance type model is reasonable, which is why we selected this variant for our interpretation.
4.4 Cluster characteristics
The model assigned 486, or about half of all detected sediment-discharge events, to cluster 1 (Table 4). Clusters 2 and 3 each contain about a fifth of the events (Table 4). Cluster 0 is the smallest, with 110 events or 11 % of the total (Table 4). In general, clusters 1 and 3 have narrower event feature ranges (Fig. 7b and d), due to the low variance of these clusters (Table 4). In contrast, clusters 0 and 2 have higher variances. In particular, cluster 2 has a high spread across all PCs (Fig. 7c).
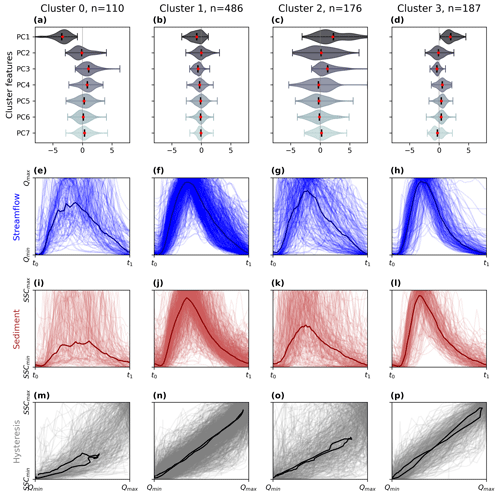
Figure 7Distribution of event characteristics, i.e. PCs, for each cluster (a–d). Red dots show cluster GMM mean. Hydrographs (e–h), sedigraphs (i–j), and hysteresis patterns (m–p) are given. Event streamflow (Q) and SSC have been normalised in magnitude and event length to enable the comparison of the event shape. All the events in the cluster have been plotted on top of each other, and the mean event cluster shape is shown by a darker line. Where the timings of peak streamflow and SSC are inconsistent within the cluster, the mean event cluster shape is flattened (e, g, i, k).
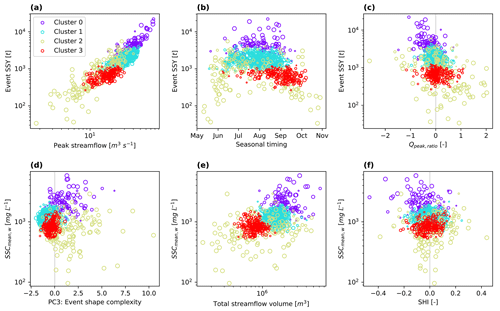
Figure 8Selected sediment-discharge event metrics coloured by the event cluster, showing event SSY plotted against peak streamflow Qmax (a), seasonality (b), and peak streamflow ratio (Qpeak,ratio) (c), and mean streamflow-weighted SSC against PC3 (d), total streamflow volume (e), and the SHI (f). The dot size is proportional to the logit-transformed probability that an event belongs to its assigned cluster. Each cluster occupies a specific magnitude range (a–c, e). Clusters 0 and 2 have higher event shape complexity compared to clusters 1 and 3 (d). There is little difference in the hysteresis between the clusters (f).
The clusters have different seasonal timing (Fig. 8b). Events of cluster 0 mainly occurred from July and August, when sediment flux was high (see average daily sSSY; Fig. 4a). Similarly, cluster 1 events almost exclusively happened during the high-flow period from mid-June to August (see average daily streamflow Fig. 4a). Cluster 3 is confined to August and September, with a few events having occurred in July. Cluster 2 has the lowest seasonal signal, with some more events in May–June and September–October.
Event magnitude (PC1) is the most prominent feature separating the clusters (Figs. 7a–d, 8a). Cluster 0 has the highest-magnitude events in terms of event SSY, peak and average SSC, and streamflow followed by clusters 1 and 3; cluster 2 has the largest magnitude range (Table 4), containing the smallest events and those up to medium in size (Fig. 7a–c).
Hysteresis effect and direction (PC2) are negligible for separating the clusters (Fig. 7a–d), with their centres being close to the zero mean of PC2 (Table 4); clear differences in hysteresis are elusive (Fig. 7m–p). According to the SHI (Fig. 8c), cluster 0 has a slight tendency towards anticlockwise hysteresis and cluster 2 towards clockwise hysteresis.
Event shape complexity (PC3) separates clusters 0 and 2 from 1 and 3 (Figs. 7a–d, 8d; Table 4). The former have more dissimilar event shape within the clusters, while the latter are mostly single-peak events with steeply rising and slowly falling hydro- and sedigraphs (Fig. 7e–l). Clusters 1 and 3 display little to no hysteresis compared to the other two clusters (Fig. 7m–p, 8c).
The seasonal dependence of the SSC–streamflow volume relationship (PC4) and hysteresis (PC5) separates clusters 0 and 3 from 1 and 2. The effect of PC4 on clusters 1 and 3 can also be seen in that (1) events of both clusters have similar average SSC, but cluster 1 events have higher streamflow volumes (Fig. 8e), and (2) cluster 3 events occurred later in the year than cluster 1 events (Fig. 8b).
Inter-event effects (PC6) also separate clusters 0 and 3 from 1 and 2. Clusters 0 and 3 with more positive PC6 values occur later in the year (Fig. 8b) and have lower Qpeak,ratio (Fig. 8c), which means that events of these clusters tend to have higher streamflow peaks than their preceding events.
5.1 Interpretation of event types
The purpose of our clustering was to objectively detect groups of events with shared characteristics but without known labels. The detected clusters form stepping stones for our objective to identify event types that relate to specific hydrometeorological forcings, catchment states, antecedent conditions, and hydro-geomorphic processes. In the following, we discuss the relevant drivers of each cluster (Fig. 9) and infer the characteristic event type each cluster represents (summarised in Table 5).
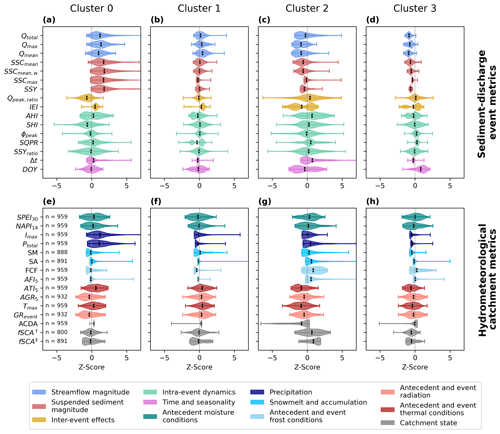
Figure 9Comparison of sediment-discharge event metrics (Table 2) and hydrometeorological catchment metrics (Tables 1 and 3) across clusters. Coloured violins show the distributions of the standardised metrics; vertical black bars are cluster means. The zero line shows the mean of each metric; units are standard deviations. Event metrics (a–d) were used to cluster events into groups. Different sample numbers for each catchment metric (e) arise from small data gaps. † MODIS-derived snow cover. ‡ SNOWGRID-derived snow cover.
Table 4Parameters of the GMM used to assign sediment-discharge events to clusters. The mean vector μk of each cluster denotes the centre of each cluster's Gaussian in each dimension, i.e. for each PC. The variance describes the spread of the cluster's Gaussian. Due to the spherical covariance type, the variance is the same in all dimensions (i.e. for each PC). The mixture weights πk describe the relative frequency of each event cluster, which is reflected in the number of events, n, in each cluster.

Table 5Summary of event types based on their sediment-discharge characteristics, antecedent conditions, driving processes, and sediment sources. Listed values of events per year and magnitude are the medians of each cluster, with the minimum and maximum values listed in brackets. Refer to Sect. 5.1.1–5.1.4 for detailed explanations.
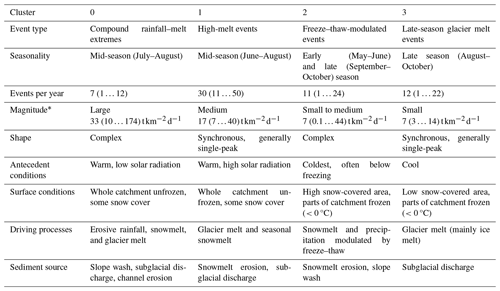
* within the range of detected sediment-discharge events.
5.1.1 Type 0: compound rainfall–melt extremes
Precipitation intensity and amount for this event type are the highest among all the event types (Fig. 9e), with a median (maximum) event precipitation intensity of 7 (36) mm h−1 and median (maximum) total event precipitation of 15 (69) mm. Given the high event temperatures, we interpret rainfall to be a key hydrological driver for these events. High suspended sediment loads in mountain rivers are often associated with rainfall (Beylich et al., 2017; Lenzi and Marchi, 2000; Pagano et al., 2019; Rainato et al., 2021; Li et al., 2021b; Wulf et al., 2012; Leggat et al., 2015; Francke et al., 2008) that triggers slope wash, mass wasting, and channel erosion (Beylich et al., 2017). The amount of sediment exported during events of this type exceeded those of other event types (Fig. 9a), involving between 17 and 224 t km−2 of suspended sediment (duration-normalised sSSY: 10 to 174 ). This finding is consistent with observations from other mountain rivers, where rainfall is a key hydrological driver of the highest sediment loads, except for extreme erosion events such as natural dam failures (Korup, 2012; Cook et al., 2018) or glacier detachments (e.g. Kääb and Girod, 2023).
Conversely, only 12 out of the 110 events in this type occurred during minimal or no recorded precipitation (<1 mm). Instead, the streamflow for these events stemmed from a combination of snowmelt (ranging from 1.2 to 12 mm) and glacier melt. We deduce the latter based on the higher-than-average event global radiation during these events. These 12 events are similar in size to others of this type, suggesting that the magnitude of this event type is not solely determined by precipitation amount or intensity. Therefore, it is likely there were other drivers involved in determining the magnitude of type 0 events.
Meltwater is another likely hydrological driver of type 0 events, given that they mainly took place during the high-melt season from July to August (Fig. 8b). During these months, glacier melt is at its highest, contributing sediment-rich meltwater to the streams. For a sub-catchment of Vent–Rofental, the glacier melt contribution to streamflow is estimated to be 40 % to 70 % (Schmieder et al., 2018). For earlier events in May and June, snowpack melting contributes an estimated 35 % to 80 % of the streamflow (Schmieder et al., 2018). Our assumption of significant meltwater contribution to type 0 events is corroborated by high maximum temperatures and an above-average antecedent thawing index (Fig. 9e), both indicating snowmelt and glacier melt (Hock, 2005; Woo, 2005). Thus, we attribute the high streamflow peaks and volumes of this event type to the combined effect of meltwater and rainfall–runoff. Such an effect has been observed to increase summer SSCs in a glacier-dominated basin in Tien Shan (Zhang et al., 2023).
The combination of rainfall and snowmelt or glacier melt as driving processes may also explain the high SSY of type 0 events. During high glacier melt, subglacial sediment discharge likely boosted suspended sediment load (Costa et al., 2018; Delaney et al., 2018b; Zhang et al., 2022). Similarly, snowmelt runoff and erosion can contribute sediment-rich meltwater to the streams (Wu et al., 2018; Lundekvam and Skøien, 1998; Costa et al., 2018). A high antecedent thawing index (Fig. 9e) indicates subglacial sediment discharge in the days prior to the events and thus an already high ambient SSC. Large portions of the catchment are prone to rainfall erosion during type 0 events, as indicated by a large actively contributing drainage area (ACDA) and low snow cover (Fig. 9e). In addition to these processes, the high streamflow rates during type 0 events are likely to induce channel bank erosion, thus further elevating SSC. Signs of bank erosion have been observed particularly in proglacial areas of the upper catchment reaches, where streams cut through deposits of unconsolidated sediments.
Multiple hydrological drivers and multiple sediment sources explain the complex event shapes of this cluster (Figs. 8d, 7e). Similar complex event shapes were reported after rainstorms in proglacial areas (Leggat et al., 2015; Orwin and Smart, 2004). A visual inspection of event hydro-, sedi-, and hyetographs shows that several events had multiple peaks attributable to different melt or rainwater pulses, i.e. a glacier-melt-driven sediment pulse, with a superimposed rainfall-driven pulse, e.g. during events 2006-016 (Fig. 3b), 2010-024 (Fig. 3c), 2012-48 (Fig. 3e), 2018-020 (Fig. 3h), and 2018-027 (Fig. 10). Mass wasting that abruptly delivers large amounts of sediment to the channels may explain the complex event shapes and exceptionally high SSC peaks of some type 0 events. The consecutive events 2020-027 and 2020-028 (Fig. 4i–j) are examples of such an occurrence. A debris flow impacted the tip of the glacier Hintereisferner, and the subsequent fluvial reworking of the deposits elevated SSC for several days.

Figure 10Example of a compound rainfall–melt extreme event (type 0). Left-hand panels show event hydrographs of 15 min streamflow (Q), sedigraphs of 15 min suspended sediment concentrations (SSC), hyetographs of hourly precipitation (P), and hourly catchment average air temperature (T). Right-hand panels show changes in SNOWGRID SWE from the first to the last day of event. Event 2018-027 was not influenced by snowmelt (b). An initial pulse of glacier melt during the day was followed by a rainfall-driven pulse at night (a).
5.1.2 Type 1: high-melt events
The main hydrometeorological drivers of this event type are glacier and seasonal snowpack melt. Event global radiation and maximum temperature are above average for most events of this type (Fig. 9f). Both metrics indicate glacier melt and snowmelt (Hock, 2005; Woo, 2005) and also melt extremes (Cremona et al., 2023; Thibert et al., 2018). Most events (90 %) of this type lasted between 20 and 27 h and had single-peak hydrographs (Figs. 7f, 11) consistent with the characteristic diurnal cycle of glacier melt (Hock, 2005) and seasonal snowpack melt (Schmieder et al., 2018). The events occurred mainly during the high-flow period from mid-June to August dominated by snow and ice melt in Vent–Rofental (Strasser et al., 2018). Thus, from June to early July, type 1 events were likely driven by snowpack melting, whereas from July to early September they were likely fed mainly by glacier melt. With warm antecedent conditions and large ACDA (Fig. 9f), we hypothesise that most of the glacier and snow surfaces during type 1 events were likely near the melting point at the event onset. Under such conditions, less energy is required to initiate snow and ice melt (Hock, 2005; Woo, 2005), and thus, during these events, melt rates were higher, resulting in the high streamflow volumes observed.
Subglacial sediment is often the prime source of suspended loads in glacierised basins (Delaney et al., 2018a; Zhang et al., 2022; Guillon et al., 2022). The positive correlation between annual glacier mass loss and sSSY supports this notion for Vent–Rofental (Schmidt et al., 2022). Event SSY is the result of high mean SSC and high streamflow volumes (Fig. 9b), which are elevated during glacier melt (Costa et al., 2018). Snowmelt often results in surface runoff and erosion (Lundekvam and Skøien, 1998) as freshly thawed soils have low infiltration rates and increased surface runoff (Wu et al., 2018). In spring, sediment mobilised by snowmelt-driven runoff from hillslopes can raise SSC in mountain rivers (Costa et al., 2018; Wu et al., 2018). Thus, we infer that the suspended sediment of this event type is mainly sourced from snowmelt erosion in June to early July and subglacially in July to early September.
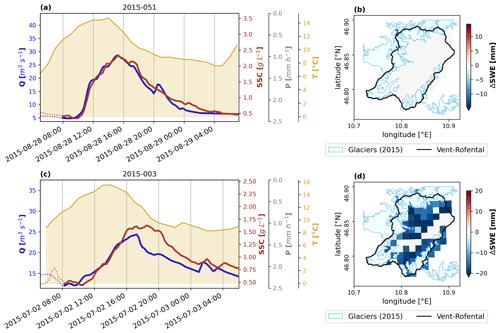
Figure 11Examples of high-melt events (type 1). See explanation in Fig. 10. Event 2015-051 represents a glacier-melt-induced event (a), with no apparent influence of snowmelt (b). Event 2015-003 (c) is mainly snowmelt-driven (d). Note the high catchment temperatures for both events. No precipitation fell during the events (a, c).
5.1.3 Type 2: freeze–thaw-modulated events
The primary hydrometeorological forcing for this event type we attribute to alternating or co-occurring freeze and thaw as shown by a significantly higher FCF and lower ACDA (Fig. 9g). Precipitation and snowmelt have secondary roles, indicated by generally high snowmelt rates and the second-highest precipitation rates (Fig. 9g). Type 2 events happened during the coldest conditions and with the most extensive snow cover. They occurred throughout the season but mostly in May–June and September–October.
As with the rainfall–melt extremes (type 0), the complex event shape and high variability in sediment-discharge characteristics within this event type (Fig. 9c) primarily reflect multiple drivers of streamflow and SSC. Unlike rainfall–melt extremes, the complex event shape of type 2 events may also partly be the result of a modulating effect of freeze–thaw on the driving hydrological processes (mechanisms discussed below). The effect of freeze–thaw is thus twofold, first by affecting the hydrological processes themselves and second by constraining the erodible landscape that contributes sediment to the channels. A similar effect of catchment freeze–thaw state regulating suspended sediment dynamics has been proposed for the Tibetan Plateau (Li et al., 2021b).
From examining event hydro-, sedi-, and hyetographs, we infer that three different mechanisms may have generated type 2 events: (a) snowmelt (Fig. 12a and b), (b) rain on snow (Fig. 12c and d), and (c) precipitation (Fig. 12e and f). Many events arose from a combination of some or all of these mechanisms, with temperature and freeze–thaw modulating both magnitude and dynamics. This modulating effect mainly lowers snowmelt rates due to either freezing that prevents snowmelt or cold preconditions that steer the energy balance to warming initially rather than melting the snowpack (Woo, 2005). For precipitation, the colder conditions regulate the frozen to liquid precipitation ratio either spatially (i.e. higher elevations accumulate snow while lower elevations generate runoff) or temporally (precipitation falls as rain initially, turning to snow later as the catchment cools to freezing during passage of a cold front).
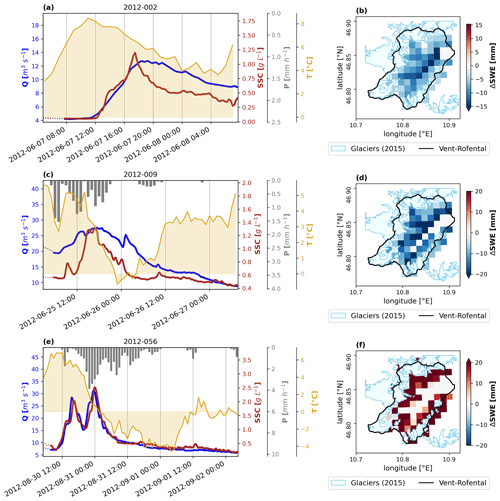
Figure 12Examples of freeze–thaw modulated events (type 2). See explanation in Fig. 10. Event 2012-002 (a) is an example of an early-season smaller-magnitude snowmelt event where the lower elevations contributed the most (b) and without precipitation. Event 2012-009 is a rain-on-snow event where both snowmelt (d) and rainfall (c) contributed to streamflow. Event 2012-056 is a precipitation-driven event (e) with two initial rainfall-driven pulses and subsequent snowfall as the catchment froze (f).
5.1.4 Type 3: late-season glacier melt events
Events of this type have several sediment-discharge characteristics resembling those of the high-melt events (type 1), including a single peak, synchronous hydro- and sedigraphs, durations of about 1 d, and mean SSC. What distinguishes type 3 from high-melt events (type 1) are lower streamflow and SSY magnitudes and their timing in the late melt season, with 80 % occurring after mid-August.
The main drivers of type 3 events appear to be unrelated to snowmelt or rainfall given that they happened during little to no precipitation or snowmelt and during the lowest overall snow cover. The similarities in event characteristics with high-melt events (type 1), coupled with the second highest insolation rates among the event types (Fig. 9h) and lack of snowmelt and rainfall, lead us to propose that type 3 events are linked to late-season glacier melt. Thus, we posit that subglacial sediment discharge is the primary source of suspended sediment for type 3 events.
The low streamflow magnitudes in type 3 events can be attributed to colder antecedent conditions and lower temperatures. Low ACDA values further indicate that parts of the catchment were below freezing, likely higher up near the glaciers. Hence, initially the energy from global radiation was primarily directed towards heating the ice to the point of initiating melt (Hock, 2005), resulting in lower melt rates. Alternatively, it is possible that only the lower parts of the glaciers were warmed sufficiently to contribute meltwater to the streams. Considering the time of year, ice melt (as opposed to snow or firn melt) is likely the largest component of the glacial meltwater (Kormann et al., 2016).
While the mean SSC of high-melt events (type 1) and type 3 events are comparable (Figs. 8d–f, 9b and d), the significantly lower streamflow magnitudes limit the overall SSY of type 3 events (Figs. 8a–c, 9b and d). Hence, the low SSYs of type 3 events might reflect transport-limited conditions rather than the decreasing availability of subglacial sediment throughout the melt season as observed elsewhere (Delaney et al., 2018b).

Figure 13Example of late-season glacier melt events (type 3). See explanation in Fig. 10. Event 2016-043 is a small-magnitude glacier melt event due to low and below-freezing temperatures (a) and no snowmelt (b).
5.2 Event type contributions to annual suspended sediment yield
We find that a large portion of annual sSSY in Vent–Rofental is exported in a few high-flow events, consistent with previous studies of fluvial sediment dynamics (Gonzalez-Hidalgo et al., 2013; Vercruysse et al., 2017). On average, 40 % of the annual SSY is exported in 2 % of the time in Vent–Rofental (Schmidt et al., 2022). Recalling that our event definition only included SSC above the 90th percentile, a substantial part, 37 % on average, of a given year (i.e. annual observation period from May to October) was occupied by events (Fig. 14d).
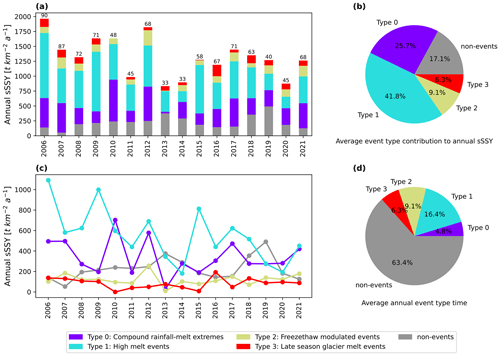
Figure 14Annual specific suspended sediment yield (sSSY) contributed by each event type (a), with considerable inter-annual variability. The total number of events each year is annotated above the bars. The average contribution of each event type (b) shows the dominance of rainfall–melt extremes (type 0) and high-melt events (type 1). The sSSY attributed to high-melt events declines during the study period (c), with the contributions for the other types remaining more constant. The average proportion of time during the observation season from May–October for each event type (d) is rather small compared to the time where no events occurred.
On average, the four identified event types involved 83 % of annual sSSY (Fig. 14b). Despite their large magnitude, as compound rainfall–melt extremes (type 0) were rarest (Table 5; Fig. 14d), they only had the second-largest share (25.6 %) of annual sSSY (Fig. 14b). Instead, the most frequent high-melt events (type 1) contributed the largest portion (41.6 %) of annual sSSY (Table 5; Fig. 14d). Rainfall–melt extremes and high-melt events thus dominated the annual sSSY, showing the relevance of both glacier melt and erosive rainfall for suspended sediment fluxes in our study area. A similar influence of these hydrometeorological drivers on suspended sediment transport has been reported for the heavily regulated upper Rhône Basin in the Swiss Alps (Costa et al., 2018) and the maritime mountains of western Norway (Beylich et al., 2017).
High-melt event (type 1) annual sSSY contribution declined during our study period (Fig. 14c). A reconstruction of suspended sediment export from Vent–Rofental suggests a negative trend in mean annual sSSY of −7.6 after a change point in 1981 (Schmidt et al., 2023). Thus, we may be seeing the declining influence of subglacial sediment discharge on event-scale suspended sediment transport as the glaciers in Vent–Rofental shrink and disappear. Similar sensitivities of daily suspended sediment fluxes to glacier melt have been reported in other high-mountain regions, such as the western subtropical Andes (Vergara et al., 2022) and High-mountain Asia (Li et al., 2021a).
Annual SSY is projected to continue to decrease until the year 2100 in Vent–Rofental even when inflating yields from days with heavy precipitation (Schmidt et al., 2024). This fits with our findings that high-yield events have erosive rainfall as an important driver on top of a high base SSC from subglacial sediment discharge. Thus, future potential increases in SSC driven by erosive rainfall may be offset by decreasing glacier melt contributions to SSC.
5.2.1 Annual suspended sediment yield during non-event periods
The periods of the time series without events are concentrated towards the shoulders of the monitored SSC period, specifically in May–June and September–October. These periods are characterised by markedly lower streamflow rates (90 % below 12.3 m3 s−1) and SSC (90 % below 588 mg L−1). Therefore, sediment fluxes too are markedly lower during the non-event periods (roughly between 0.01 and 10 t 15 min−1) compared to event periods (roughly between 1 and 100 t 15 min−1). However, as non-events occupy the largest part of the time series (Fig. 14d), a notable portion of the annual SSY is exported during these non-event periods, especially in years with fewer events, such as 2013 and 2019 (Fig. 14a).
5.3 Benefits and limitations of methodology
Our approach enables event-based analysis of river sediment fluxes by detecting, characterising, and grouping similar sediment-discharge events. These groups can then be interpreted to understand under which conditions episodic sediment fluxes occurred.
The main advantage of using clustering to derive event types is that it does not require any prior knowledge or labels (Tarasova et al., 2019). As such, our methodology can be applied in any catchment with sub-daily time series of streamflow and SSC. Furthermore, the approach is customisable as the parameters for event detection (search window and SSC threshold) are easily adapted to fit other catchments and is, moreover, advisable (see Sect. 5.3.2). The use of PCA condenses the input data to the most informative event characteristics in the clustering process, while information criteria help to identify the optimal cluster model and number of event types. The latter is an important aspect of the method as the number of event types may vary between catchments and environments. Another strength of our approach is the GMM itself as we can examine the probabilities of belonging to the assigned cluster. Thus, we can check how reliably the GMM assigns events to each of the clusters, which commonly used cluster algorithms such as k-medoids or hierarchical clustering (e.g. Leggat et al., 2015; Javed et al., 2021; Mather and Johnson, 2015) are unable to do.
The drawback of using a data-driven approach such as clustering is that the derived event typology is sensitive to the choice of sediment-discharge metrics. Both PCA and GMM can only learn from the data they are trained on. Moreover, data-driven approaches can be sensitive to sample size. Although we have not explicitly tested how sensitive our results are to the metric selection and amount of data, the inclusion of an additional year of data did not substantially alter the number or characteristics of event clusters or types.
How consistent event typologies derived with our approach are across various catchment types and regions requires further research and testing because both the number and the characteristics of event types similarly vary across different environments. Hence, we refrain from proposing a universal suspended sediment flux typology from this study of a single catchment. Rather, we hope that our approach can serve as a knowledge discovery tool to identify catchment-specific event types in all types of hydrological basins.
In general, our approach has high data requirements as both high temporal resolution and long temporal extents are necessary to gather enough events for clustering, especially when dealing with the high variability typical of sediment transport. In order to interpret the detected event clusters a substantial amount of data representing hydrometeorological forcings, catchment state, and antecedent conditions is needed.
5.3.1 Influence of long-term trends
Sediment dynamics in glaciated catchments are subject to long-term changes in driving processes and sediment availability (Zhang et al., 2022; Antoniazza and Lane, 2021). Annual sSSY and discharge in the Vent–Rofental catchment have remained largely stable during the study period (2006–2021) compared to long-term trends (Schmidt, 2023; Schmidt et al., 2024, 2023), especially if considering the inter-annual variability. We infer that ongoing long-term changes in the catchment have had only minor effects on our results.
To confirm that the sediment-discharge event characteristics stayed constant over the study period, we checked whether annual averages of event metrics and PCs changed over time and found no significant trends (Mann–Kendall test with a 5 % significance level). Likewise, the total annual sSSY and sSSY contributed by rainfall–melt extremes (type 0), freeze–thaw-modulated events (type 2), and late-season glacier melt events (type 3) do not show significant trends. However, the annual sSSY contribution of high-melt events (type 1) changed significantly over the study period by −31 (Fig. 14c). This decrease in the annual contribution of high-melt events (type 1) is less due to fewer events occurring but rather a consequence of the average SSY magnitude of type 1 events decreasing. Does this trend influence the detection event types? If the magnitude of high-melt events (type 1) had continued to decrease over time, then melt-driven events later in the study period would have differed enough from earlier ones to be separated by the cluster analysis. The advantage lies in considering events individually, which allows our methodology, at least to some extent, to deal with long-term trends.
5.3.2 Limitations and transferability of event detection
Given that fluvial sediment transport is primarily driven by hydrology, it is reasonable to delineate events by streamflow. Single SSC spikes without a corresponding increase in streamflow are expected to be rare, at least in the Vent–Rofental catchment. However, when applying our method to other catchments, other conditions may apply. Consider a mass wasting event without hydro-meteorological drivers, such as an earthquake-triggered landslide. Our event detection would lump the resulting sediment pulse together with an unconnected streamflow pulse. Thus, in catchments where such processes are thought to be relevant, our methodology may be less appropriate. Similarly, in catchments where sediment exhaustion effects are important or where this is the focus of research, the event filtering by SSC could overlook supply-limited events. In such cases, it may be appropriate to lower θSSC,peak to include more events. However, removing the filtering completely would cease to be an event detection, instead splitting the entire time series into event-sized portions, which we advise against. Moreover, the length of the local-minima search window is a parameter to be adapted to the hydrological and sediment response time of the study catchment. In short, the appropriate choice of parameters for event detection is crucial. The event definition should be adjusted to align with the focus of the study and the hydrological and sediment transport dynamics of a given catchment.
5.4 Implications of findings for future studies
Event magnitude is rarely considered in sediment-discharge event typologies. Most other studies focus primarily on discharge-SSC hysteresis and other intra- and inter-event dynamics (e.g. Tsyplenkov et al., 2020; Haddadchi and Hicks, 2021, 2020; Hamshaw et al., 2018). Classifications based on hysteresis degree and direction are most commonly used. Yet, our study shows that magnitude is the most important characteristic, accounting for a third of the event regime variability and being the main factor distinguishing the event types. Our findings emphasise that hysteresis only explains about a 10th of the variability in the events and that it is not an important feature for distinguishing between the event types. This highlights the methodological challenges of hysteresis pattern analysis – namely, its difficult and highly context-driven interpretation due to feedback mechanisms and interactions between multiple drivers (Vercruysse et al., 2017). While hysteresis analysis can be a useful tool for exploring the temporal dynamics of SSC and streamflow during events (Malutta et al., 2020), it may be insufficient for event type classification in Alpine catchments if multiple drivers of suspended sediment transport are concerned.
We find event shape complexity, i.e. degree of hydro- and sedigraph synchronicity, to be a key feature for distinguishing between event types. In our study area, higher complexity generally indicates multiple processes generating streamflow and suspended sediment. We were able to capture this effect despite only implicitly including the event shape in the clustering though metrics like SQPR. The hydro- and sedigraph synchronicity is somewhat included in hysteresis indices as values close to zero indicate this. Multivariate event time series (METS) clustering is an approach that uses event shape explicitly to cluster events (Javed et al., 2021). However, METS does not include magnitude, which we find to be the most important characteristic for both describing the event regime and clustering. An important implication of our results is that multiple processes can generate the same signal in sedi- and hydrographs. Care should be taken when interpreting from these alone, e.g. hysteresis classifications connected with processes.
We link the sediment-discharge characteristics of each event type with hydrological and geomorphic processes although the strength of this linkage varies with each event type. For instance, the Gaussians of high-melt events (type 1) and late-season glacier melt events (type 3) cover a narrower variable space, and their distinct diurnal hydro- and sedigraphs were attributed to snowmelt and glacier melt. For rainfall–melt extremes (type 0) and freeze–thaw modulated events (type 2), the attribution to specific processes is less clear, as multiple hydrological drivers are involved, and the variability within the clusters are higher. Therefore, care should be taken when interpreting the results of clustering-based approaches as the events are grouped based on the observed effect of hydrological and geomorphic processes rather than the processes themselves, as is the case with a process-based approach.
Identifying drivers of suspended sediment dynamics in mountain rivers remains challenging. Nonetheless, event-based analysis of fluvial suspended sediment transport can shed light on the main catchment processes and conditions that drive suspended sediment fluxes. We present an approach for identifying event types based on automatic event detection and clustering in the high-Alpine Vent–Rofental catchment in the Ötztal Alps, Austria.
Magnitude and event shape complexity (hydro- and sedigraph synchronicity) are the main characteristics that define the event types in our study area. Rainfall is important for triggering extreme events, but their magnitude is due to a compound effect from subglacial sediment discharge, slope wash, and fluvial channel erosion. Sediment-discharge hysteresis is important for characterising the overall event regime but not for distinguishing between event types. Rather, event shape complexity (hydro- and sedigraph synchronicity) is the second-most-important factor after magnitude for separating event types.
We connect the four identified event types to different drivers. Extreme compound rainfall–melt events (type 0) are driven by a compound effect of high subglacial sediment export and ice melt, erosive rainfall, channel erosion, and possibly rainfall-triggered mass wasting. High-melt events (type 1) are driven by snowmelt and erosion from June to early July and subglacial sediment discharge and glacier melt from July to early September. Freeze–thaw-modulated events (type 2) are driven by snowmelt, rain on snow, and colder precipitation events involving snowfall. Late-season glacier melt events (type 3) are driven by subglacial sediment discharge and glacier melt, with cooler event and antecedent conditions.
Differences in antecedent moisture are vague for the different event types. The two higher-magnitude event types, rainfall–melt extremes (type 0) and high-melt events (type 1), have distinctly warmer antecedent conditions compared to the smaller-magnitude event types, freeze–thaw-modulated events (type 2) and late-season glacier melt events (type 3).
In total, events contribute the bulk of annual suspended sediment yields (SSY) (on average 83 %), whereby the extreme compound rainfall–melt events and high-melt events contribute the most, amounting to more than half of annual SSY. Vent–Rofental represents a high-Alpine catchment, where glacier melt and subglacial discharge in conjunction with erosive rainfall constitute the primary drivers of event-scale suspended sediment dynamics.
We offer a first approach for deriving sediment-discharge event typologies, designed to be transferable and adaptive. Our findings highlight the importance of multiple geomorphic and hydrological processes driving event-scale suspended sediment dynamics in mountain rivers and that events are relevant for annual yields. Future studies could use our findings to inform process-based modelling and classification approaches.
Streamflow and suspended sediment concentration time series are available at 15 min resolution upon request from the Hydrographic Service of Tyrol via wasserwirtschaft@tirol.gv.at. All datasets by GeoSphere Austria are freely available for download from their online data portal at https://data.hub.geosphere.at (GeoSphere Austria, 2024). The MODIS snow cover maps version v1.0.2 by Matiu et al. (2019a) can be downloaded here: https://doi.org/10.5281/zenodo.3601891 (Matiu et al., 2019b). The code and scripts used to detect, characterise, and cluster events are available as a Python module at https://github.com/skalevag/hysevt/releases/tag/v0.1 (Skålevåg, 2024b). The main results of this study – namely, the detected events, calculated event and catchment metrics, event characteristics from the principal component analysis, identified event clusters, event type annual suspended sediment yields, and event plots of all events in each cluster – can be found in this data repository: https://doi.org/10.23728/b2share.4806f852f25541b4a3206b0d8110 907c (Skålevåg, 2024a).
AS developed the general idea and conceptualised the study with input from AB and OK. AS developed the methodology and performed the formal analysis under supervision of AB and OK. AS prepared the original manuscript draft, including all the figures, and AB and OK critically reviewed, commented on, and revised the manuscript.
The contact author has declared that none of the authors has any competing interests.
Publisher’s note: Copernicus Publications remains neutral with regard to jurisdictional claims made in the text, published maps, institutional affiliations, or any other geographical representation in this paper. While Copernicus Publications makes every effort to include appropriate place names, the final responsibility lies with the authors.
Lena Katharina Schmidt helpfully provided her extensive insights and experience of the sediment dynamics in the study area, Vent–Rofental, and was instrumental in developing the inter event index (IEI).
ChatGPT 3.5 was used in the editing process of the results and discussion sections. It was only used to suggest rephrasing of existing text, mainly single sentences or paragraphs. This applies to roughly 5 % of the aforementioned sections. Not at any point in the manuscript writing and editing process was ChatGPT used to generate new text or ideas or to summarise existing concepts and literature.
This research has been supported by the Deutsche Forschungsgemeinschaft (grant no. GRK 2043/2).
This paper was edited by Matjaz Mikos and reviewed by two anonymous referees.
Adler, C., Wester, P., Bhatt, I., Huggel, C., Insarov, G., Morecroft, M., Muccione, V., and Prakash, A.: Cross-Chapter Paper 5: Mountains, in: Climate Change 2022: Impacts, Adaptation and Vulnerability, edited by Pörtner, H.-O., Roberts, D., Tignor, M., Poloczanska, E., Mintenbeck, K., Alegría, A., Craig, M., Langsdorf, S., Löschke, S., Möller, V., Okem, A., and Rama, B., 2273–2318, Cambridge University Press, Cambridge, UK and New York, NY, USA, https://doi.org/10.1017/9781009325844.022, 2022. a
Aich, V., Zimmermann, A., and Elsenbeer, H.: Quantification and interpretation of suspended-sediment discharge hysteresis patterns: How much data do we need?, CATENA, 122, 120–129, https://doi.org/10.1016/j.catena.2014.06.020, 2014. a, b
Antoniazza, G. and Lane, S. N.: Sediment yield over glacial cycles: A conceptual model, Prog. Phys. Geog., 45, 842–865, https://doi.org/10.1177/0309133321997292, 2021. a
Antoniazza, G., Nicollier, T., Boss, S., Mettra, F., Badoux, A., Schaefli, B., Rickenmann, D., and Lane, S. N.: Hydrological Drivers of Bedload Transport in an Alpine Watershed, Water Resour. Res., 58, e2021WR030663, https://doi.org/10.1029/2021WR030663, 2022. a
Ballantyne, C. K.: Paraglacial geomorphology, Quaternary Sci. Rev., 21, 1935–2017, https://doi.org/10.1016/S0277-3791(02)00005-7, 2002. a
Beniston, M., Farinotti, D., Stoffel, M., Andreassen, L. M., Coppola, E., Eckert, N., Fantini, A., Giacona, F., Hauck, C., Huss, M., Huwald, H., Lehning, M., López-Moreno, J.-I., Magnusson, J., Marty, C., Morán-Tejéda, E., Morin, S., Naaim, M., Provenzale, A., Rabatel, A., Six, D., Stötter, J., Strasser, U., Terzago, S., and Vincent, C.: The European mountain cryosphere: a review of its current state, trends, and future challenges, The Cryosphere, 12, 759–794, https://doi.org/10.5194/tc-12-759-2018, 2018. a
Beylich, A. A., Laute, K., and Storms, J. E.: Contemporary suspended sediment dynamics within two partly glacierized mountain drainage basins in western Norway (Erdalen and Bødalen, inner Nordfjord), Geomorphology, 287, 126–143, https://doi.org/10.1016/J.GEOMORPH.2015.12.013, 2017. a, b, c
Biskaborn, B. K., Smith, S. L., Noetzli, J., Matthes, H., Vieira, G., Streletskiy, D. A., Schoeneich, P., Romanovsky, V. E., Lewkowicz, A. G., Abramov, A., Allard, M., Boike, J., Cable, W. L., Christiansen, H. H., Delaloye, R., Diekmann, B., Drozdov, D., Etzelmüller, B., Grosse, G., Guglielmin, M., Ingeman-Nielsen, T., Isaksen, K., Ishikawa, M., Johansson, M., Johannsson, H., Joo, A., Kaverin, D., Kholodov, A., Konstantinov, P., Kröger, T., Lambiel, C., Lanckman, J. P., Luo, D., Malkova, G., Meiklejohn, I., Moskalenko, N., Oliva, M., Phillips, M., Ramos, M., Sannel, A. B. K., Sergeev, D., Seybold, C., Skryabin, P., Vasiliev, A., Wu, Q., Yoshikawa, K., Zheleznyak, M., and Lantuit, H.: Permafrost is warming at a global scale, Nat. Commun., 10, 1–11, https://doi.org/10.1038/s41467-018-08240-4, 2019. a
Bracken, L. J., Turnbull, L., Wainwright, J., and Bogaart, P.: Sediment connectivity: a framework for understanding sediment transfer at multiple scales, Earth Surf. Proc. Land., 40, 177–188, https://doi.org/10.1002/ESP.3635, 2015. a, b
Buckel, J. and Otto, J.-C.: The Austrian Glacier Inventory GI 4 (2015) in ArcGis (shapefile) format, PANGAEA [data set], https://doi.org/10.1594/PANGAEA.887415, 2018. a, b, c
Caliñski, T. and Harabasz, J.: A Dendrite Method For Cluster Analysis, Commun. Stat., 3, 1–27, https://doi.org/10.1080/03610927408827101, 1974. a
Carrer, M., Dibona, R., Prendin, A. L., and Brunetti, M.: Recent waning snowpack in the Alps is unprecedented in the last six centuries, Nat. Clim. Change, 13, 155–160, https://doi.org/10.1038/s41558-022-01575-3, 2023. a
Cook, K. L., Andermann, C., Gimbert, F., Adhikari, B. R., and Hovius, N.: Glacial lake outburst floods as drivers of fluvial erosion in the Himalaya, Science, 362, 53–57, https://doi.org/10.1126/science.aat4981, 2018. a
Costa, A., Anghileri, D., and Molnar, P.: Hydroclimatic control on suspended sediment dynamics of a regulated Alpine catchment: a conceptual approach, Hydrol. Earth Syst. Sci., 22, 3421–3434, https://doi.org/10.5194/hess-22-3421-2018, 2018. a, b, c, d, e, f
Cremona, A., Huss, M., Landmann, J. M., Borner, J., and Farinotti, D.: European heat waves 2022: contribution to extreme glacier melt in Switzerland inferred from automated ablation readings, The Cryosphere, 17, 1895–1912, https://doi.org/10.5194/tc-17-1895-2023, 2023. a
Delaney, I. and Adhikari, S.: Increased Subglacial Sediment Discharge in a Warming Climate: Consideration of Ice Dynamics, Glacial Erosion, and Fluvial Sediment Transport, Geophys. Res. Lett., 47, e2019GL085672, https://doi.org/10.1029/2019GL085672, 2020. a
Delaney, I., Bauder, A., Huss, M., and Weidmann, Y.: Proglacial erosion rates and processes in a glacierized catchment in the Swiss Alps, Earth Surf. Proc. Land., 43, 765–778, https://doi.org/10.1002/ESP.4239, 2018a. a, b
Delaney, I., Bauder, A., Werder, M. A., and Farinotti, D.: Regional and annual variability in subglacial sediment transport by water for two glaciers in the Swiss Alps, Front. Earth Sci., 6, 175, https://doi.org/10.3389/FEART.2018.00175, 2018b. a, b, c
Fowler, H. J., Lenderink, G., Prein, A. F., Westra, S., Allan, R. P., Ban, N., Barbero, R., Berg, P., Blenkinsop, S., Do, H. X., Guerreiro, S., Haerter, J. O., Kendon, E. J., Lewis, E., Schaer, C., Sharma, A., Villarini, G., Wasko, C., and Zhang, X.: Anthropogenic intensification of short-duration rainfall extremes, Nature Reviews Earth & Environment, 2, 107–122, https://doi.org/10.1038/s43017-020-00128-6, 2021. a
Francke, T., López-Tarazón, J. A., Vericat, D., Bronstert, A., and Batalla, R. J.: Flood-based analysis of high-magnitude sediment transport using a non-parametric method, Earth Surf. Proc. Land., 33, 2064–2077, https://doi.org/10.1002/ESP.1654, 2008. a, b
Frauenfeld, O. W., Zhang, T., and Mccreight, J. L.: Northern Hemisphere freezing/thawing index variations over the twentieth century, Int. J. Climatol., 27, 47–63, https://doi.org/10.1002/joc.1372, 2007. a, b
GeoSphere Austria: GeoSphere Austria Data Hub, https://data.hub.geosphere.at (last access: 24 October 2024), 2024. a
Gonzalez-Hidalgo, J. C., Batalla, R. J., and Cerda, A.: Catchment size and contribution of the largest daily events to suspended sediment load on a continental scale, CATENA, 102, 40–45, https://doi.org/10.1016/J.CATENA.2010.10.011, 2013. a, b
Guillon, H., Mugnier, J.-L., Schwing, A., Buoncristiani, J.-F., and Buoncristiani, J.-F.: Glacial drainage development controls temporal and spatial fluctuations of sediment flux in Mont Blanc’s North face, C. R. Geosci., 354, 281–301, https://doi.org/10.5802/CRGEOS.139, 2022. a
Habersack, H., Haimann, M., Kerschbaumsteiner, W., and Lalk, P.: Schwebstoffe im Fließgewässer: Leitfaden zur Erfassung des Schwebstofftransportes, Tech. rep., Bundesministerium für Land- und Forstwirtschaft, Umwelt und Wasserwirtschaft, Wien, https://info.bml.gv.at/dam/jcr:f579125e-4459-45cc-8569-a4d3520ed22a/Schwebstoffe_Leitfaden.pdf (last access: 24 October 2024), 2008. a
Haddadchi, A. and Hicks, M.: Understanding the effect of catchment characteristics on suspended sediment dynamics during flood events, Hydrol. Process., 34, 1558–1574, https://doi.org/10.1002/hyp.13682, 2020. a, b, c, d
Haddadchi, A. and Hicks, M.: Interpreting event-based suspended sediment concentration and flow hysteresis patterns, J. Soil Sediment., 21, 592–612, https://doi.org/10.1007/s11368-020-02777-y, 2021. a, b, c, d
Haiden, T., Kann, A., Wittmann, C., Pistotnik, G., Bica, B., and Gruber, C.: The Integrated Nowcasting through Comprehensive Analysis (INCA) System and Its Validation over the Eastern Alpine Region, Weather Forecast., 26, 166–183, https://doi.org/10.1175/2010WAF2222451.1, 2011. a
Hamshaw, S. D., Dewoolkar, M. M., Schroth, A. W., Wemple, B. C., and Rizzo, D. M.: A New Machine-Learning Approach for Classifying Hysteresis in Suspended-Sediment Discharge Relationships Using High-Frequency Monitoring Data, Water Resour. Res., 54, 4040–4058, https://doi.org/10.1029/2017WR022238, 2018. a, b, c, d, e
Hanzer, F., Förster, K., Nemec, J., and Strasser, U.: Projected cryospheric and hydrological impacts of 21st century climate change in the Ötztal Alps (Austria) simulated using a physically based approach, Hydrol. Earth Syst. Sci., 22, 1593–1614, https://doi.org/10.5194/hess-22-1593-2018, 2018. a, b
Haslinger, K. and Bartsch, A.: Creating long-term gridded fields of reference evapotranspiration in Alpine terrain based on a recalibrated Hargreaves method, Hydrol. Earth Syst. Sci., 20, 1211–1223, https://doi.org/10.5194/hess-20-1211-2016, 2016. a, b
Heggen, R. J.: Normalized Antecedent Precipitation Index, J. Hydrol. Eng., 6, 377–381, https://doi.org/10.1061/(ASCE)1084-0699(2001)6:5(377), 2001. a
Hiebl, J. and Frei, C.: Daily temperature grids for Austria since 1961 – concept, creation and applicability, Theor. Appl. Climatol., 124, 161–178, https://doi.org/10.1007/s00704-015-1411-4, 2016. a, b
Hiebl, J. and Frei, C.: Daily precipitation grids for Austria since 1961 – development and evaluation of a spatial dataset for hydroclimatic monitoring and modelling, Theor. Appl. Climatol., 132, 327–345, https://doi.org/10.1007/s00704-017-2093-x, 2018. a, b
Hinderer, M., Kastowski, M., Kamelger, A., Bartolini, C., and Schlunegger, F.: River loads and modern denudation of the Alps – A review, Earth-Sci. Rev., 118, 11–44, https://doi.org/10.1016/j.earscirev.2013.01.001, 2013. a, b
Hock, R.: Glacier melt: a review of processes and their modelling, Prog. Phys. Geog., 29, 362–391, https://doi.org/10.1191/0309133305PP453RA, 2005. a, b, c, d, e
Hock, R., Rasul, G., Adler, C., Cáceres, B., Gruber, S., Hirabayashi, Y., Jackson, M., Kääb, A., Kang, S., Kutuzov, S., Milner, A., Molau, U., Morin, S., Orlove, B., and Steltzer, H.: High Mountain Areas, in: IPCC Special Report on the Ocean and Cryosphere in a Changing Climate, edited by: Pörtner, H.-O., Roberts, D., Masson-Delmotte, V., Zhai, P., Tignor, M., Poloczanska, E., Mintenbeck, K., Alegría, A., Nicolai, M., Okem, A., Petzold, J., Rama, B., and Weyer, N., chap. 2, IPCC, Cambridge University Press, Cambridge, UK and New York, NY, USA, 131–202, https://doi.org/10.1017/9781009157964.004, 2019. a
Hugonnet, R., McNabb, R., Berthier, E., Menounos, B., Nuth, C., Girod, L., Farinotti, D., Huss, M., Dussaillant, I., Brun, F., and Kääb, A.: Accelerated global glacier mass loss in the early twenty-first century, Nature, 592, 726–731, https://doi.org/10.1038/s41586-021-03436-z, 2021. a
Huss, M. and Hock, R.: Global-scale hydrological response to future glacier mass loss, Nat. Clim. Change, 8, 135–140, https://doi.org/10.1038/s41558-017-0049-x, 2018. a
Huss, M., Bookhagen, B., Huggel, C., Jacobsen, D., Bradley, R. S., Clague, J. J., Vuille, M., Buytaert, W., Cayan, D. R., Greenwood, G., Mark, B. G., Milner, A. M., Weingartner, R., and Winder, M.: Toward mountains without permanent snow and ice, Earth's Future, 5, 418–435, https://doi.org/10.1002/2016EF000514, 2017. a, b
Javed, A., Hamshaw, S. D., Lee, B. S., and Rizzo, D. M.: Multivariate event time series analysis using hydrological and suspended sediment data, J. Hydrol., 593, 125 802, https://doi.org/10.1016/J.JHYDROL.2020.125802, 2021. a, b, c, d, e
Kääb, A. and Girod, L.: Brief communication: Rapid m3 bed erosion after detachment of the Sedongpu Glacier (Tibet), The Cryosphere, 17, 2533–2541, https://doi.org/10.5194/tc-17-2533-2023, 2023. a
Kim, D. and Kim, S. K.: Comparing patterns of component loadings: Principal Component Analysis (PCA) versus Independent Component Analysis (ICA) in analyzing multivariate non-normal data, Behav. Res. Methods, 44, 1239–1243, https://doi.org/10.3758/s13428-012-0193-1, 2012. a
Kormann, C., Bronstert, A., Francke, T., Recknagel, T., and Graeff, T.: Model-Based Attribution of High-Resolution Streamflow Trends in Two Alpine Basins of Western Austria, Hydrology, 3, 7, https://doi.org/10.3390/hydrology3010007, 2016. a
Korup, O.: Earth's portfolio of extreme sediment transport events, Earth-Sci. Rev., 112, 115–125, https://doi.org/10.1016/j.earscirev.2012.02.006, 2012. a
Kreuss, O.: GEOFAST – Zusammenstellung ausgewählter Archivunterlagen der Geologischen Bundesanstalt 1:50.000 – 173 Sölden: Stand 2012, https://doi.org/10.24341/tethys.164, 2018. a, b, c
Lalk, P., Haimann, M., and Habersack, H.: Monitoring, Analyse und Interpretation des Schwebstofftransportes an österreichischen Flüssen, Österreichische Wasser- und Abfallwirtschaft, 66, 306–315, https://doi.org/10.1007/s00506-014-0175-x, 2014. a, b, c, d
Land Tirol: Digitales Geländemodell Tirol 5 m, https://www.data.gv.at/katalog/dataset/land-tirol_tirolgelnde/resource/3eb16718-a4fe-45e3-a92c-3d057237ae00 (last access: 9 May 2022), 2021. a
Langlois, J. L., Johnson, D. W., and Mehuys, G. R.: Suspended sediment dynamics associated with snowmelt runoff in a small mountain stream of Lake Tahoe (Nevada), Hydrol. Process., 19, 3569–3580, https://doi.org/10.1002/HYP.5844, 2005. a
Lawler, D. M., Petts, G. E., Foster, I. D., and Harper, S.: Turbidity dynamics during spring storm events in an urban headwater river system: The Upper Tame, West Midlands, UK, Sci. Total Environ., 360, 109–126, https://doi.org/10.1016/j.scitotenv.2005.08.032, 2006. a
Leggat, M. S., Owens, P. N., Stott, T. A., Forrester, B. J., Déry, S. J., and Menounos, B.: Hydro-meteorological drivers and sources of suspended sediment flux in the pro-glacial zone of the retreating Castle Creek Glacier, Cariboo Mountains, British Columbia, Canada, Earth Surf. Proc. Land., 40, 1542–1559, https://doi.org/10.1002/esp.3755, 2015. a, b, c, d, e, f
Lenzi, M. A. and Marchi, L.: Suspended sediment load during floods in a small stream of the Dolomites (northeastern Italy), CATENA, 39, 267–282, https://doi.org/10.1016/S0341-8162(00)00079-5, 2000. a
Li, D., Lu, X., Overeem, I., Walling, D. E., Syvitski, J., Kettner, A. J., Bookhagen, B., Zhou, Y., and Zhang, T.: Exceptional increases in fluvial sediment fluxes in a warmer and wetter High Mountain Asia, Science, 374, 599–603, https://doi.org/10.1126/science.abi9649, 2021a. a
Li, D., Overeem, I., Kettner, A. J., Zhou, Y., and Lu, X.: Air Temperature Regulates Erodible Landscape, Water, and Sediment Fluxes in the Permafrost-Dominated Catchment on the Tibetan Plateau, Water Resour. Res., 57, 1–14, https://doi.org/10.1029/2020WR028193, 2021b. a, b, c
Lundekvam, H. and Skøien, S.: Soil erosion in Norway. An overview of measurements from soil loss plots, Soil Use Manage., 14, 84–89, https://doi.org/10.1111/J.1475-2743.1998.TB00620.X, 1998. a, b
Madsen, H., Lawrence, D., Lang, M., Martinkova, M., and Kjeldsen, T.: Review of trend analysis and climate change projections of extreme precipitation and floods in Europe, J. Hydrol., 519, 3634–3650, https://doi.org/10.1016/j.jhydrol.2014.11.003, 2014. a
Malutta, S., Kobiyama, M., Chaffe, P. L. B., and Bonumá, N. B.: Hysteresis analysis to quantify and qualify the sediment dynamics: state of the art, Water Sci. Technol., 81, 2471–2487, https://doi.org/10.2166/WST.2020.279, 2020. a, b, c, d
Mather, A. L. and Johnson, R. L.: Event-based prediction of stream turbidity using a combined cluster analysis and classification tree approach, J. Hydrol., 530, 751–761, https://doi.org/10.1016/J.JHYDROL.2015.10.032, 2015. a, b
Matiu, M., Jacob, A., and Notarnicola, C.: Daily MODIS Snow Cover Maps for the European Alps from 2002 onwards at 250 m Horizontal Resolution Along with a Nearly Cloud-Free Version, Data 2020, Vol. 5, Page 1, https://doi.org/10.3390/DATA5010001, 2019a. a, b, c
Matiu, M., Jacob, A., and Notarnicola, C.: Daily MODIS snow cover maps for the European Alps from 2002 onwards at 250 m horizontal resolution along with a nearly cloud-free version (v1.0.2), Zenodo [data set], https://doi.org/10.5281/zenodo.3601891, 2019b. a
Moser, M.: GEOFAST – Zusammenstellung ausgewählter Archivunterlagen der Geologischen Bundesanstalt 1:50.000 – 172 Weißkugel: Stand 2012, https://doi.org/10.24341/tethys.163, 2016. a, b, c
Murphy, K. P.: Machine Learning: A Probabilistic Perspective, MIT Press, ISBN 978-0-262-01802-9, 2012. a, b
Olefs, M. and Schöner, W.: A new solar radiation model for research and applications in Austria, Geophysical Research Abstracts, 14, https://meetingorganizer.copernicus.org/EGU2012/EGU2012-9705.pdf (last access: 29 September 2023), 2012. a
Olefs, M., Koch, R., Schöner, W., and Marke, T.: Changes in Snow Depth, Snow Cover Duration, and Potential Snowmaking Conditions in Austria, 1961–2020 – A Model Based Approach, Atmosphere, 11, 1330, https://doi.org/10.3390/ATMOS11121330, 2020. a
OpenStreetMap: OpenStreetMap data for Austria, https://download.geofabrik.de/europe/austria.html (last access: 10 November 2022), 2022. a
Orwin, J. F. and Smart, C. C.: Short-term spatial and temporal patterns of suspended sediment transfer in proglacial channels, small River Glacier, Canada, Hydrol. Process., 18, 1521–1542, https://doi.org/10.1002/HYP.1402, 2004. a, b
Orwin, J. F., Lamoureux, S. F., Warburton, J., and Beylich, A.: A framework for characterizing fluvial sediment fluxes from source to sink in cold environments, Geogr. Ann. A, 92, 155–176, https://doi.org/10.1111/j.1468-0459.2010.00387.x, 2010. a
Pagano, S. G., Rainato, R., García-Rama, A., Gentile, F., and Lenzi, M. A.: Analysis of suspended sediment dynamics at event scale: comparison between a Mediterranean and an Alpine basin, Hydrolog. Sci. J., 64, 948–961, https://doi.org/10.1080/02626667.2019.1606428, 2019. a, b, c
Rainato, R., Martini, L., Pellegrini, G., and Picco, L.: Hydrological, geomorphic and sedimentological responses of an alpine basin to a severe weather event (Vaia storm), Catena, 207, 105600, https://doi.org/10.1016/j.catena.2021.105600, 2021. a
Rengers, F. K., Kean, J. W., Reitman, N. G., Smith, J. B., Coe, J. A., and McGuire, L. A.: The Influence of Frost Weathering on Debris Flow Sediment Supply in an Alpine Basin, J. Geophys. Res.-Earth, 125, 2, https://doi.org/10.1029/2019JF005369, 2020. a
Rousseeuw, P. J.: Silhouettes: A graphical aid to the interpretation and validation of cluster analysis, J. Comput. Appl. Math., 20, 53–65, https://doi.org/10.1016/0377-0427(87)90125-7, 1987. a
Scheurer, K., Alewell, C., Bänninger, D., and Burkhardt-Holm, P.: Climate and land-use changes affecting river sediment and brown trout in alpine countries-a review, Environ. Sci. Pollut. R., 16, 232–242, https://doi.org/10.1007/s11356-008-0075-3, 2009. a
Schmidt, L. K.: Altered hydrological and sediment dynamics in high-alpine areas – Exploring the potential of machine-learning for estimating past and future changes, Ph.D. thesis, University of Potsdam, Potsdam, https://doi.org/10.25932/publishup-62330, 2023. a
Schmidt, L. K., Francke, T., Rottler, E., Blume, T., Schöber, J., and Bronstert, A.: Suspended sediment and discharge dynamics in a glaciated alpine environment: identifying crucial areas and time periods on several spatial and temporal scales in the Ötztal, Austria, Earth Surf. Dynam., 10, 653–669, https://doi.org/10.5194/esurf-10-653-2022, 2022. a, b, c, d, e, f, g, h, i
Schmidt, L. K., Francke, T., Grosse, P. M., Mayer, C., and Bronstert, A.: Reconstructing five decades of sediment export from two glacierized high-alpine catchments in Tyrol, Austria, using nonparametric regression, Hydrol. Earth Syst. Sci., 27, 1841–1863, https://doi.org/10.5194/hess-27-1841-2023, 2023. a, b, c
Schmidt, L. K., Francke, T., Grosse, P. M., and Bronstert, A.: Projecting sediment export from two highly glacierized alpine catchments under climate change: exploring non-parametric regression as an analysis tool, Hydrol. Earth Syst. Sci., 28, 139–161, https://doi.org/10.5194/hess-28-139-2024, 2024. a, b, c
Schmieder, J., Marke, T., and Strasser, U.: Wo kommt das Wasser her? Tracerbasierte Analysen im Rofental (Ötztaler Alpen, Österreich), Österreichische Wasser- und Abfallwirtschaft, 70, 507–514, https://doi.org/10.1007/s00506-018-0502-8, 2018. a, b, c
Schwarz, G.: Estimating the Dimension of a Model, Ann. Stat., 6, 461–464, https://doi.org/10.1214/aos/1176344136, 1978. a
Skålevåg, A.: Sediment-discharge event types in Vent-Rofental, Austria [data set], https://doi.org/10.23728/b2share.4806f852f25541b4a3206b0d 8110907c, 2024a. a
Skålevåg, A.: Hydro-sediment event types (v0.1), GitHub [code], https://github.com/skalevag/hysevt/releases/tag/v0.1 (last access: 24 October 2024), 2024b. a
Sloto, R. A. and Crouse, M. Y.: HYSEP: A Computer Program for Streamflow Hydrograph Separation and Analysis, Tech. rep., U.S. Geological Survey, https://doi.org/10.3133/wri964040, 1996. a
Smith, S. L., O’Neill, H. B., Isaksen, K., Noetzli, J., and Romanovsky, V. E.: The changing thermal state of permafrost, Nature Reviews Earth & Environment, 3, 10–23, https://doi.org/10.1038/s43017-021-00240-1, 2022. a
Strasser, U., Marke, T., Braun, L., Escher-Vetter, H., Juen, I., Kuhn, M., Maussion, F., Mayer, C., Nicholson, L., Niedertscheider, K., Sailer, R., Stötter, J., Weber, M., and Kaser, G.: The Rofental: a high Alpine research basin (1890–3770 m a.s.l.) in the Ötztal Alps (Austria) with over 150 years of hydrometeorological and glaciological observations, Earth Syst. Sci. Data, 10, 151–171, https://doi.org/10.5194/essd-10-151-2018, 2018. a, b, c, d
Tarasova, L., Merz, R., Kiss, A., Basso, S., Blöschl, G., Merz, B., Viglione, A., Plötner, S., Guse, B., Schumann, A., Fischer, S., Ahrens, B., Anwar, F., Bárdossy, A., Bühler, P., Haberlandt, U., Kreibich, H., Krug, A., Lun, D., Müller-Thomy, H., Pidoto, R., Primo, C., Seidel, J., Vorogushyn, S., and Wietzke, L.: Causative classification of river flood events, WIRES Water, 6, e1353, https://doi.org/10.1002/WAT2.1353, 2019. a, b
Thibert, E., Dkengne Sielenou, P., Vionnet, V., Eckert, N., and Vincent, C.: Causes of Glacier Melt Extremes in the Alps Since 1949, Geophys. Res. Lett., 45, 817–825, https://doi.org/10.1002/2017GL076333, 2018. a
Tsyplenkov, A.: atsyplenkov/loadflux: Zenodo release, Zenodo [code], https://doi.org/10.5281/ZENODO.6992087, 2022. a, b
Tsyplenkov, A., Vanmaercke, M., Golosov, V., and Chalov, S.: Suspended sediment budget and intra-event sediment dynamics of a small glaciated mountainous catchment in the Northern Caucasus, J. Soil. Sediment., 20, 3266–3281, https://doi.org/10.1007/s11368-020-02633-z, 2020. a, b, c, d, e, f, g, h
Vercruysse, K., Grabowski, R. C., and Rickson, R.: Suspended sediment transport dynamics in rivers: Multi-scale drivers of temporal variation, Earth-Sci. Rev., 166, 38–52, https://doi.org/10.1016/j.earscirev.2016.12.016, 2017. a, b, c, d, e, f, g
Vergara, I., Garreaud, R., and Ayala, Á.: Sharp Increase of Extreme Turbidity Events Due To Deglaciation in the Subtropical Andes, J. Geophys. Res.-Earth, 127, e2021JF006584, https://doi.org/10.1029/2021JF006584, 2022. a
Vergara-Temprado, J., Ban, N., and Schär, C.: Extreme Sub-Hourly Precipitation Intensities Scale Close to the Clausius-Clapeyron Rate Over Europe, Geophys. Res. Lett., 48, e2020GL089506, https://doi.org/10.1029/2020GL089506, 2021. a
Virtanen, P., Gommers, R., Oliphant, T. E., Haberland, M., Reddy, T., Cournapeau, D., Burovski, E., Peterson, P., Weckesser, W., Bright, J., van der Walt, S. J., Brett, M., Wilson, J., Millman, K. J., Mayorov, N., Nelson, A. R., Jones, E., Kern, R., Larson, E., Carey, C. J., Polat, İ., Feng, Y., Moore, E. W., VanderPlas, J., Laxalde, D., Perktold, J., Cimrman, R., Henriksen, I., Quintero, E. A., Harris, C. R., Archibald, A. M., Ribeiro, A. H., Pedregosa, F., van Mulbregt, P., Vijaykumar, A., Bardelli, A. P., Rothberg, A., Hilboll, A., Kloeckner, A., Scopatz, A., Lee, A., Rokem, A., Woods, C. N., Fulton, C., Masson, C., Häggström, C., Fitzgerald, C., Nicholson, D. A., Hagen, D. R., Pasechnik, D. V., Olivetti, E., Martin, E., Wieser, E., Silva, F., Lenders, F., Wilhelm, F., Young, G., Price, G. A., Ingold, G. L., Allen, G. E., Lee, G. R., Audren, H., Probst, I., Dietrich, J. P., Silterra, J., Webber, J. T., Slavič, J., Nothman, J., Buchner, J., Kulick, J., Schönberger, J. L., de Miranda Cardoso, J. V., Reimer, J., Harrington, J., Rodríguez, J. L. C., Nunez-Iglesias, J., Kuczynski, J., Tritz, K., Thoma, M., Newville, M., Kümmerer, M., Bolingbroke, M., Tartre, M., Pak, M., Smith, N. J., Nowaczyk, N., Shebanov, N., Pavlyk, O., Brodtkorb, P. A., Lee, P., McGibbon, R. T., Feldbauer, R., Lewis, S., Tygier, S., Sievert, S., Vigna, S., Peterson, S., More, S., Pudlik, T., Oshima, T., Pingel, T. J., Robitaille, T. P., Spura, T., Jones, T. R., Cera, T., Leslie, T., Zito, T., Krauss, T., Upadhyay, U., Halchenko, Y. O., and Vázquez-Baeza, Y.: SciPy 1.0: fundamental algorithms for scientific computing in Python, Nat. Methods, 17, 261–272, https://doi.org/10.1038/s41592-019-0686-2, 2020. a, b
Wagner, T., Pleschberger, R., Kainz, S., Ribis, M., Kellerer-Pirklbauer, A., Krainer, K., Philippitsch, R., and Winkler, G.: The first consistent inventory of rock glaciers and their hydrological catchments of the Austrian Alps, Aust. J. Earth Sci., 113, 1–23, https://doi.org/10.17738/ajes.2020.0001, 2020. a
Williams, G. P.: Sediment concentration versus water discharge during single hydrologic events in rivers, J. Hydrol., 111, 89–106, https://doi.org/10.1016/0022-1694(89)90254-0, 1989. a
Woo, M.: Snowmelt Runoff Generation, in: Encyclopedia of Hydrological Sciences, Wiley, https://doi.org/10.1002/0470848944.hsa127, 2005. a, b, c, d
Wu, Y., Ouyang, W., Hao, Z., Yang, B., and Wang, L.: Snowmelt water drives higher soil erosion than rainfall water in a mid-high latitude upland watershed, J. Hydrol., 556, 438–448, https://doi.org/10.1016/J.JHYDROL.2017.11.037, 2018. a, b, c
Wulf, H., Bookhagen, B., and Scherler, D.: Climatic and geologic controls on suspended sediment flux in the Sutlej River Valley, western Himalaya, Hydrol. Earth Syst. Sci., 16, 2193–2217, https://doi.org/10.5194/hess-16-2193-2012, 2012. a
Zhang, T., Li, D., East, A. E., Walling, D. E., Lane, S., Overeem, I., Beylich, A. A., Koppes, M., and Lu, X.: Warming-driven erosion and sediment transport in cold regions, Nature Reviews Earth & Environment 2022, 1–20, https://doi.org/10.1038/s43017-022-00362-0, 2022. a, b, c, d, e, f, g, h
Zhang, T., Li, D., East, A. E., Kettner, A. J., Best, J., Ni, J., and Lu, X.: Shifted sediment-transport regimes by climate change and amplified hydrological variability in cryosphere-fed rivers, Sci. Adv., 9, 45, https://doi.org/10.1126/SCIADV.ADI5019, 2023. a


