the Creative Commons Attribution 4.0 License.
the Creative Commons Attribution 4.0 License.
 | 31 Jul 2024
A hydrogeological conceptual model of aquifers in catchments headed by temperate glaciers
Clémence Daigre
Ophélie Fischer
Guðfinna Aðalgeirsdóttir
Sophie Violette
Jane Hart
Snævarr Guðmundsson
Finnur Pálsson
For reliable forecasting of the evolution of critical water resources, as well as of potential flood and landslide hazards and their response to climate change, it is necessary to improve the understanding and quantification of unknown aquifer systems in glacierized catchments. We focus on four southeastern outlet glaciers of the main Icelandic ice cap, Vatnajökull. A multidisciplinary approach is carried out, including the acquisition of new in situ data to characterize aquifers and their groundwater dynamics. Moreover, the recharge to aquifers from glacial melt and effective rainfall is estimated. From a detailed analysis of all available data and the determination of the dynamic characteristics of the aquifers, a hydrogeological conceptual model of glacierized catchments is constructed: (i) two distinct aquifers, their hydraulic conductivities and their hydrodynamic responses to climate forcing are identified; (ii) a comprehensive water balance for the whole catchment is obtained; (iii) the subglacial recharge to the aquifers is shown to be 4 times higher than in the proglacial area; and (v) the importance of the impact of the glacial melt recharge on the groundwater system is demonstrated. Thus, we highlight the major role that the groundwater component has in the hydrodynamic functioning of glacierized catchments.
- Article
(10070 KB) - Full-text XML
- BibTeX
- EndNote


The research addressing the response of glaciers to climate change is well-developed, looking not only at changes in glacier mass balance (e.g., Aðalgeirsdóttir et al., 2020; Björnsson et al., 2013; Gardner et al., 2013; Zemp et al., 2019) but also at the associated effects on basal and downstream hydrology (e.g., Li et al., 2015; Immerzeel et al., 2012). Subglacial aquifer systems, which are inaccessible to direct measurements due to the covering glacier thickness, remain the great unknowns in the general hydrological dynamics of glaciers, their catchment areas, and their outlets. However, aftermath changes to the groundwater component are rarely considered (Vincent et al., 2019), though evolving groundwater recharge, discharge and storage in glacierized catchments are required to forecast the future changes in water resources and water-related hazards (landslides, floods and water shortages) as they respond to climate change. The scope of the studies considering the groundwater component is limited as they only concern the aquifers of the till and/or sand formations, thus neglecting the deeper underlying aquifers. Those studies in similar glacierized catchments show high recharge to aquifers by glacial meltwater (Somers et al., 2016; Mackay et al., 2020; Sigurðsson, 1990) and a strong connection between surface water (rivers or lakes) and groundwater (e.g., Hood et al., 2006; Dzikowski and Jobard, 2012; Somers et al., 2016; Dochartaigh et al., 2019; see Vincent et al., 2019, for other references). Nevertheless, such studies are few, and data relate only to shallow and unconfined aquifers (Favier et al., 2008; Dochartaigh et al., 2019; Mackay et al., 2020; Müller et al., 2024). What happens if the hydrogeological system is multi-layered? Does the surface meltwater recharge the subglacial aquifer(s) or not? How much of the surface meltwater contributes to recharging the aquifer(s)?
To answer these questions, this study focuses on four outlet glaciers (Fláajökull, Heinabergsjökull, Skálafellsjökull and Breiðamerkurjökull) at the southeast margin of Vatnajökull, Iceland's largest ice cap. The catchment areas of these outlets cover 1300 km2 (Fig. 1). They are located in a maritime subpolar climate and therefore experience and record the impact of climate change before those in the polar regions and thus play the role of climate change sentinels. A better understanding of how these glaciers respond to climate change contributes to a better understanding of how other glaciers around the world will respond. These glaciers are temperate and alpine, i.e., valley glaciers with their base at melting temperature (Cuffey and Paterson, 2010). They have been retreating since the mid-1990s due to climate change (e.g., Aðalgeirsdóttir et al., 2020; Björnsson et al., 2013). The geology in this area is mainly composed of basalt, topped in some locations by till and glacio-fluvial deposits (Jóhannesson and Sæmundsson, 1998). These formations extend into the Atlantic Ocean to form the marine abrasion platform (Van Vliet-Lanöe et al., 2021).
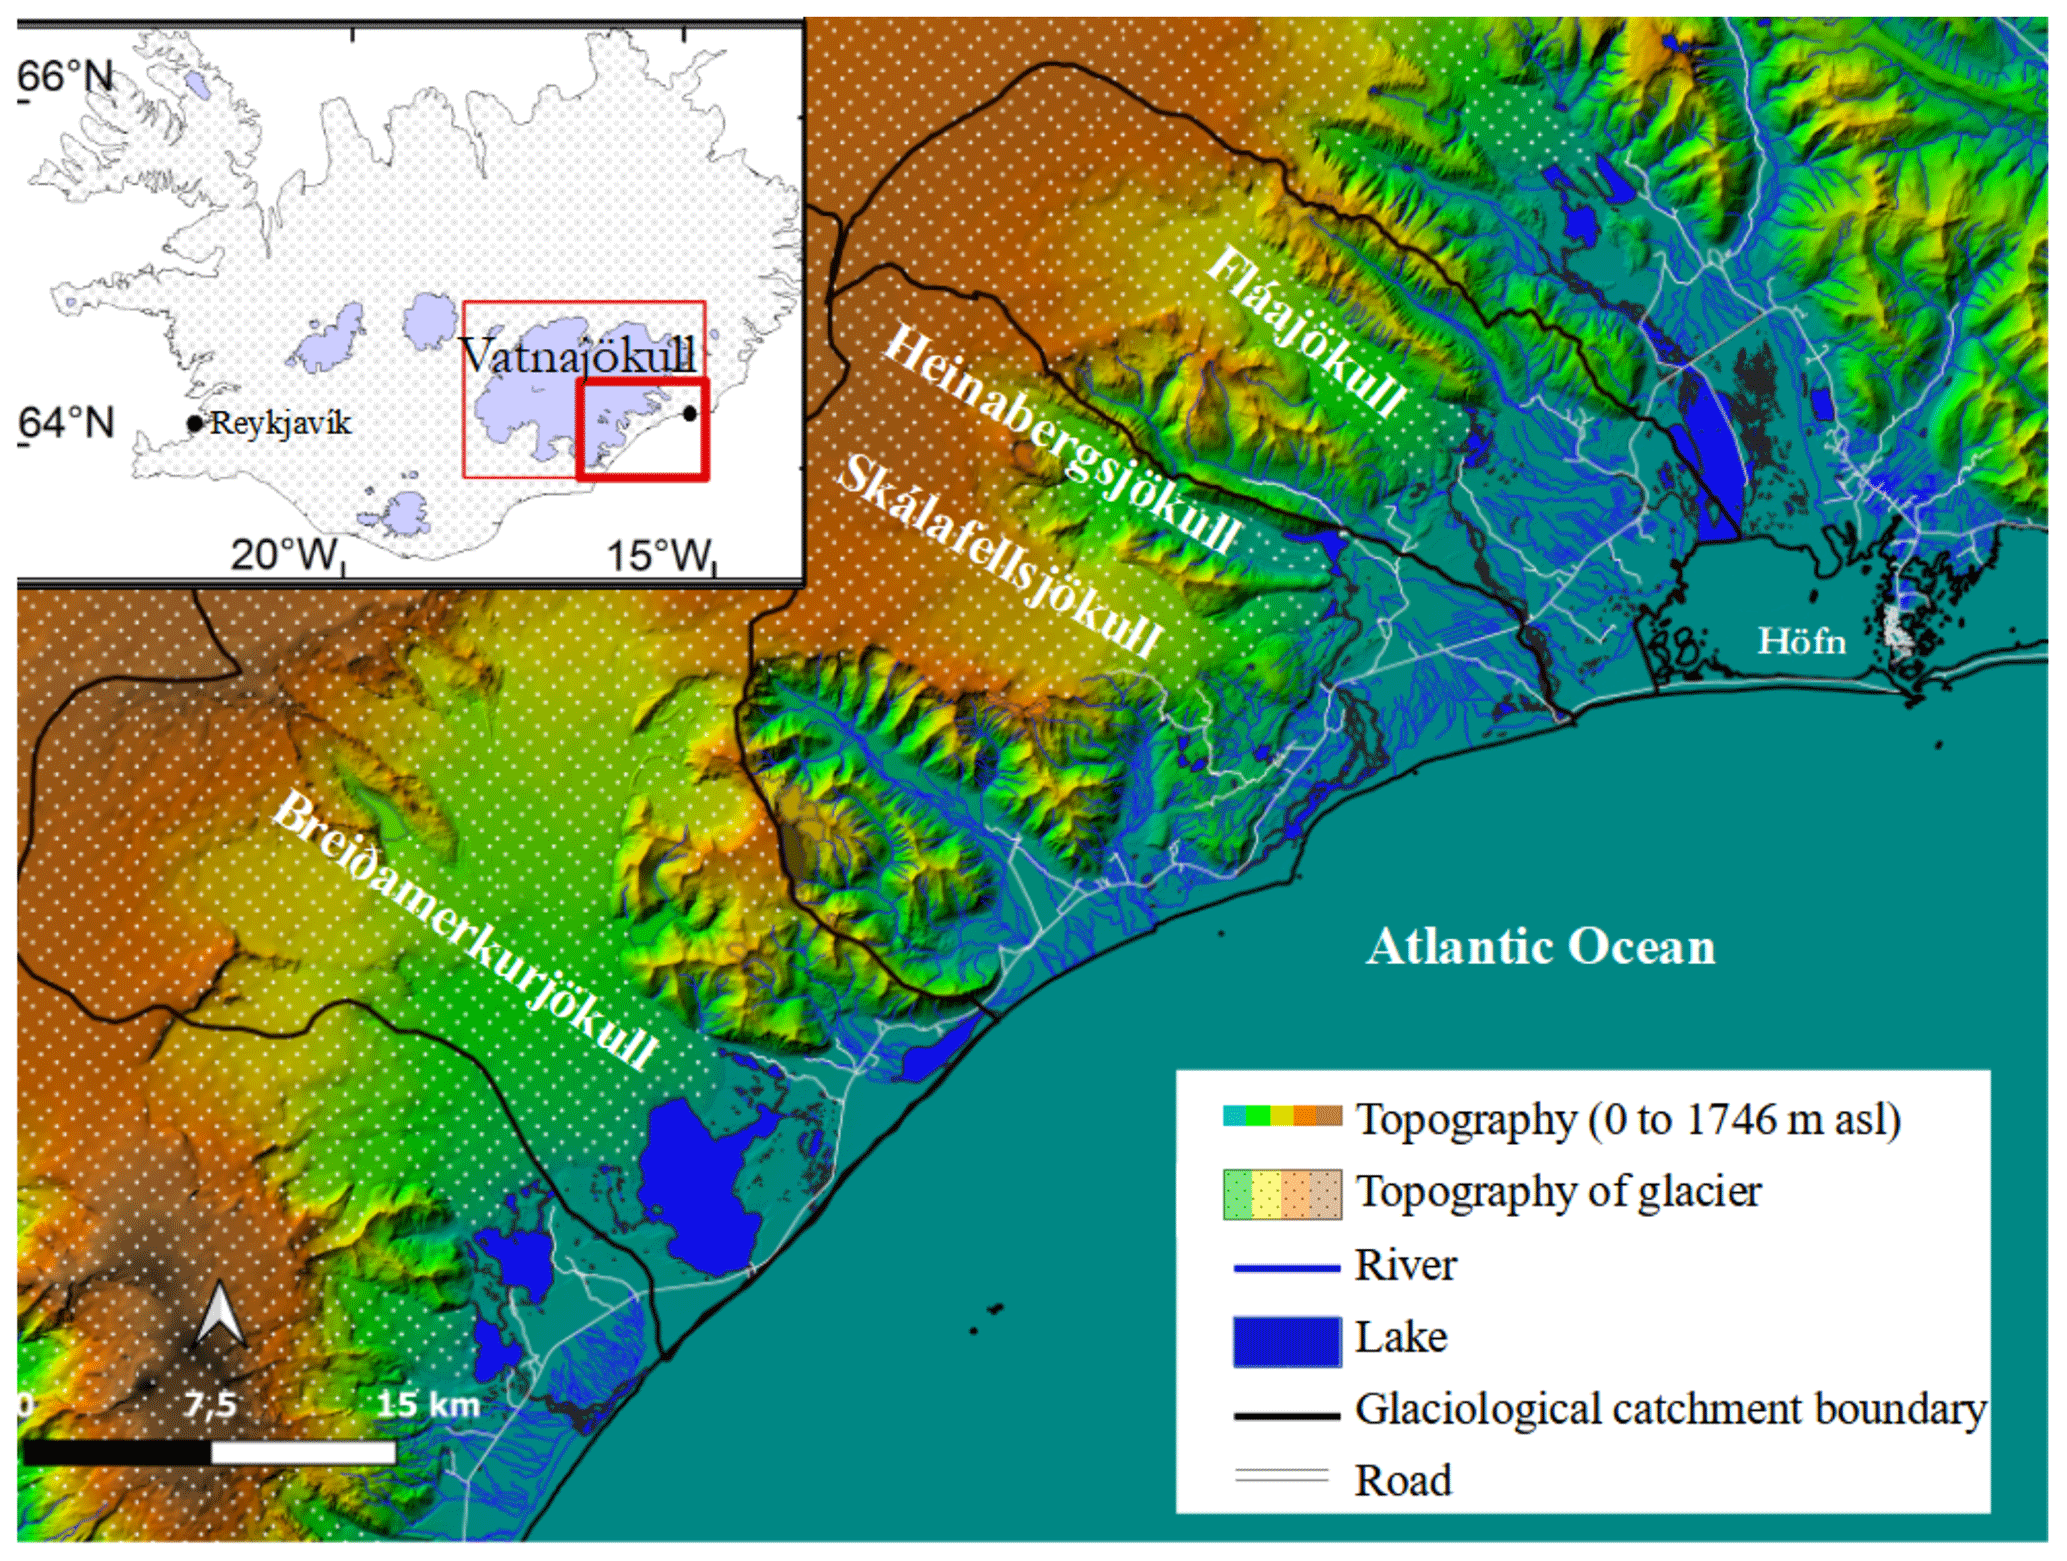
Figure 1The study area showing the topography of the proglacial areas and the glaciers (IslandsDEMv1, Landmælingar Íslands), glaciological catchment boundaries of the four studied outlet glaciers, and river networks and lakes (contours Landmælingar Íslands ISN2016). Insert map in the top-left corner shows the location of the study area in Iceland compared to Reykjavík and Höfn.
Our goal is to understand and characterize the whole hydrogeological system, the geometry and the hydraulic parameters of the aquifers and to quantify the recharge in both the subglacial and proglacial areas. To this end, (i) new data have been collected since May 2021 on groundwater level, temperature and electro-conductivity (EC) in an observation network of 18 boreholes, including 4 new boreholes drilled for this project; (ii) all existing and newly acquired data are analyzed to obtain the geometry (extent and thickness) of the geological formations (from geological and drilling data), the hydraulic parameters (from existing grain size data, new slug tests and new groundwater level data), the groundwater dynamics and the recharge rates (from existing data: glacier mass balance and weather data); (iii) all these data, of varied and complementary origins, are brought together and allow us to build a conceptual model for the hydrogeological functioning of catchments in glacial environments and to demonstrate the importance of the groundwater component in these glacial catchments.
2.1 Climate context
The climate in Iceland is a maritime subpolar climate, strongly moderated by the Gulf Stream influence (Irminger Current) to the south (Björnsson, 2017; Van Vliet-Lanoë et al., 2021). Snow is abundant during winter, especially over 400 m a.s.l. (above sea level) (Van Vliet-Lanoë et al., 2021), and precipitation increases with elevation (Crochet et al., 2007).
Meteorological data used in this study are provided by the Icelandic Meteorological Office (IMO) (Icelandic Meteorological Office, 2022). In particular, air temperature (T) and precipitation (P) have been recorded at four weather stations close to Höfn í Hornafirði since June 1965 (Fig. 2). The four stations are close to each other (Fig. 3), but the same period is never recorded by any of them, except for T between 2007 and 2018 (stations 705 and 5544, Fig. 2), with very similar data (correlation coefficient of 0.998). Therefore, we decided to merge the time series of the four stations into one record. The combined daily temperature and precipitation records are from June 1965 to September 2022, with only 4 months missing (September to December 2006).
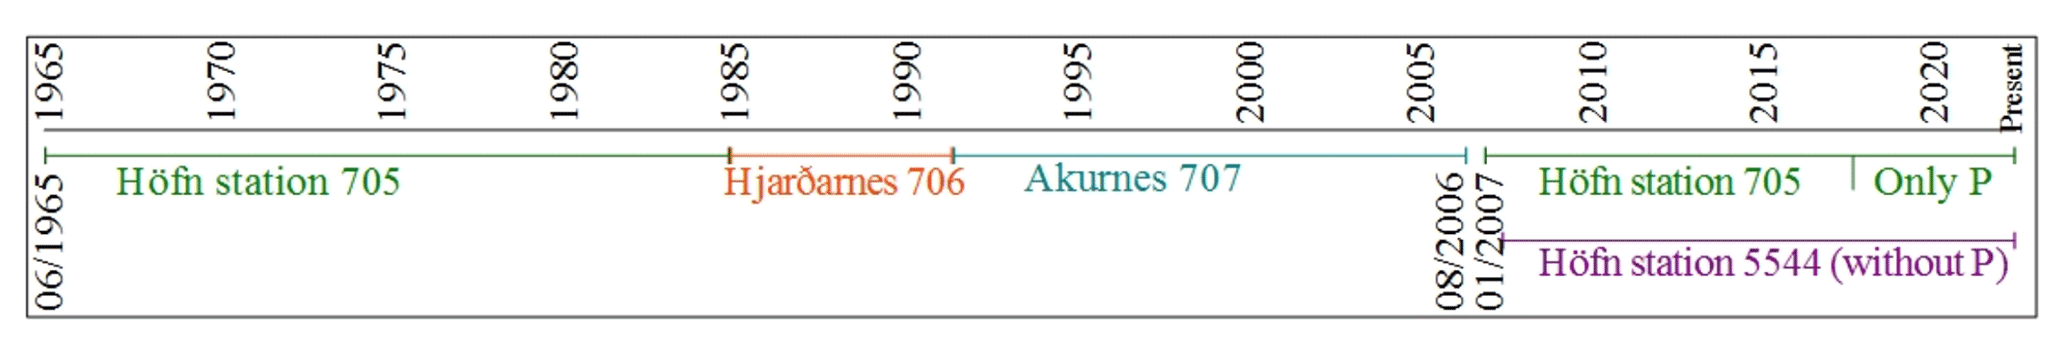
Figure 2Periods of the T and P records of the four Höfn weather stations: Höfn 705 (+4 m a.s.l.), Höfn 5544 (+5 m a.s.l.), Hjarðarnes 706 (+9 m a.s.l.) and Akurnes 707 (+17 m a.s.l.). The locations of the four stations are shown with red plus symbols in Fig. 3.
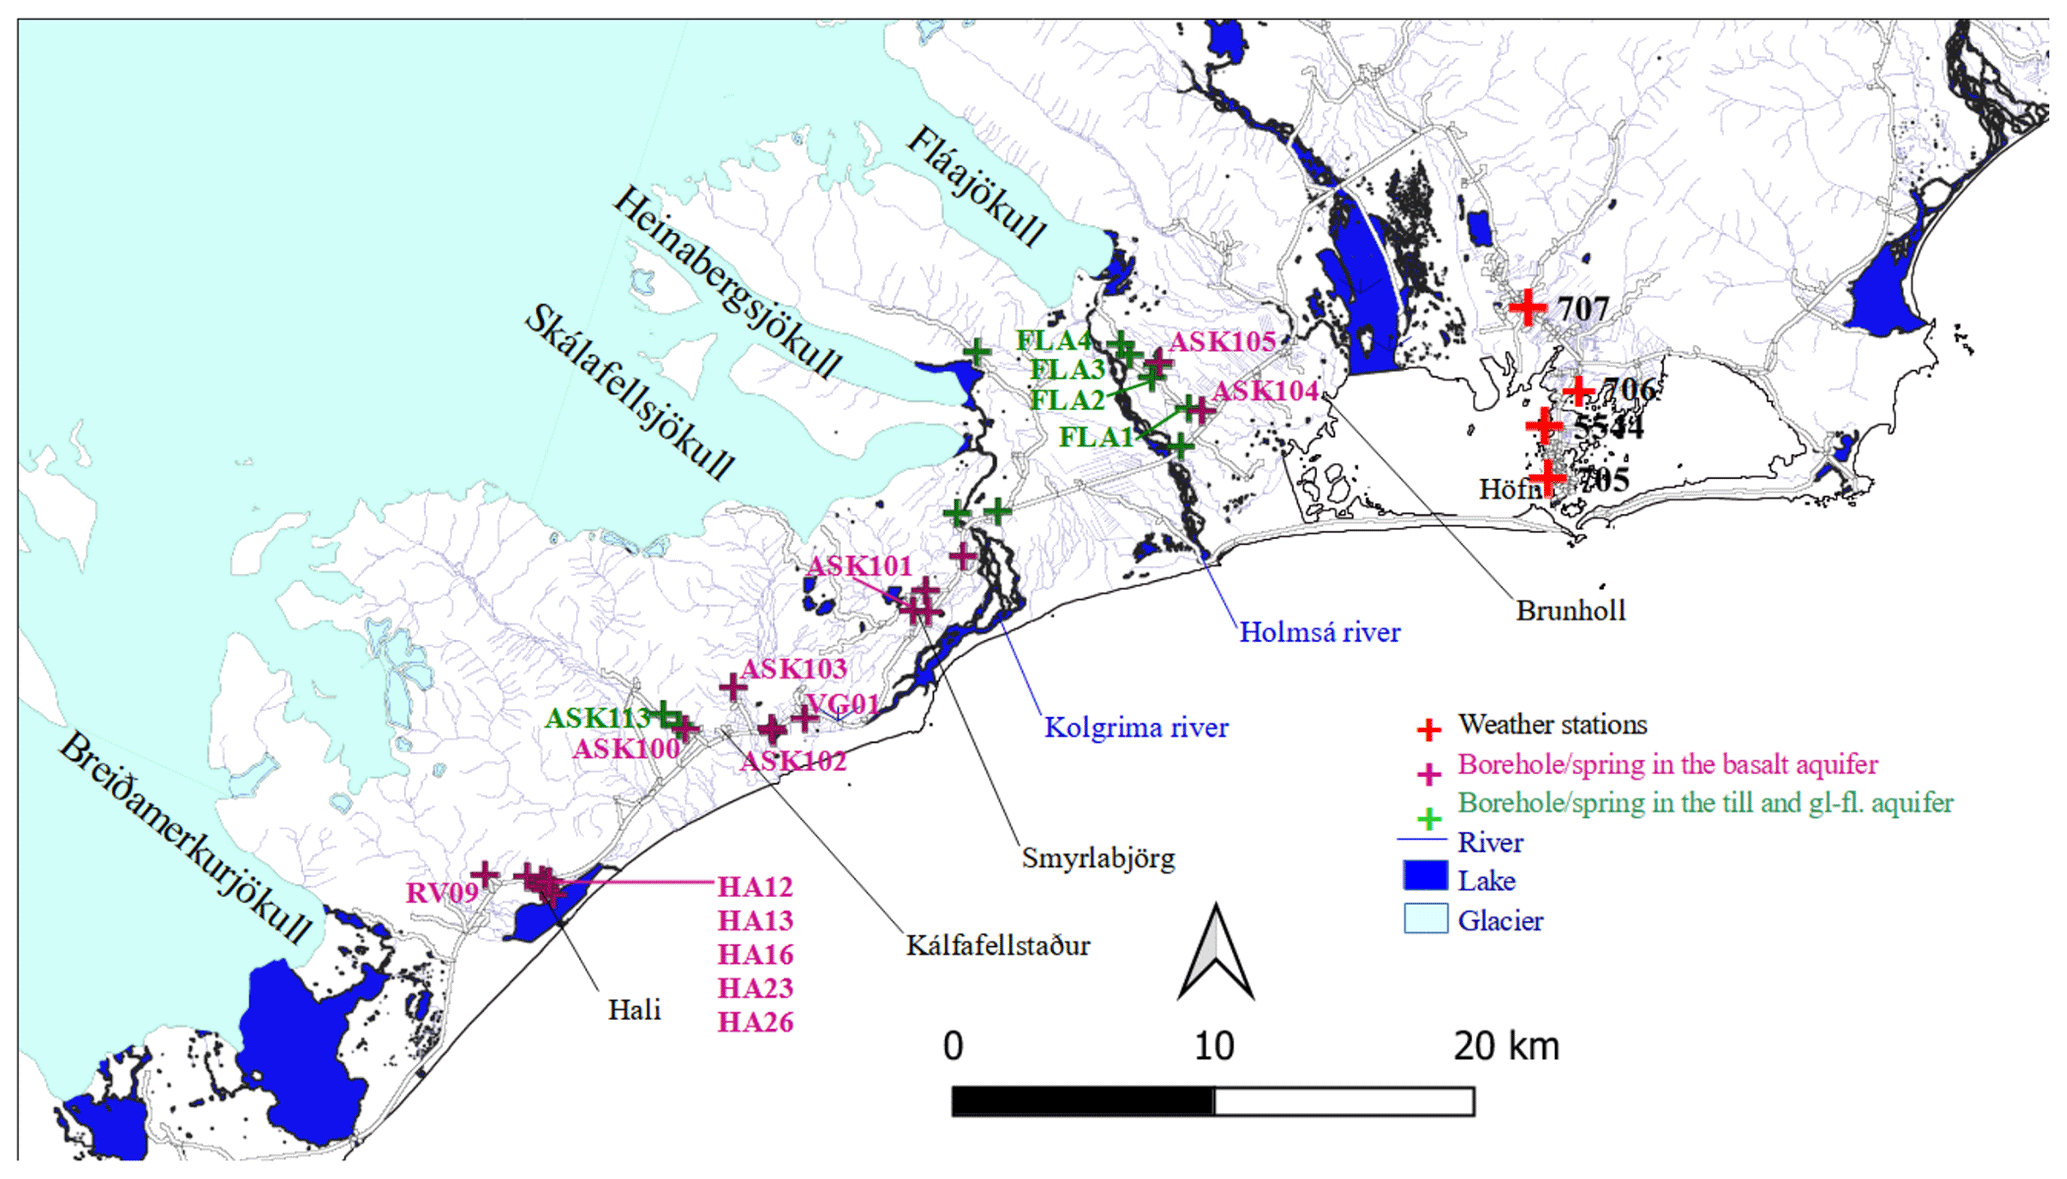
Figure 3Map of the groundwater observation network. Purple plus symbols: boreholes and springs in the basalt aquifer. Green plus symbols: boreholes and springs in the till and glacio-fluvial-deposit aquifer (gl. Fl.), with location of Höfn weather stations (red plus symbols), namely Höfn 705, Höfn 5544, Hjarðarnes 706 and Akurnes 707. Contours from Landmælingar Íslands ISN2016.
The meteorological data between 1966 to 2021 have the following characteristics: the annual average temperature increased from 3.9 to 5.4 °C (+1.5 °C, Fig. 4), and the annual total precipitation increased from 1200 to 1630 mm (+430 mm, Fig. 4). For comparison, the global mean temperature increased by °C between 1850–1900 and 2021 (WMO, 2022). For the studied area, the annual average temperature and total precipitation in 2021 (5 °C and 1327 mm) lie in the 40 % warmest and the 40 % driest years (Fig. 4). The mean monthly temperatures are distributed over quite a narrow range (Fig. 5a) and nearly always stay positive, which is typical for a subpolar maritime climate. All months receive significant precipitation, but the variation between years is high (Fig. 5b).
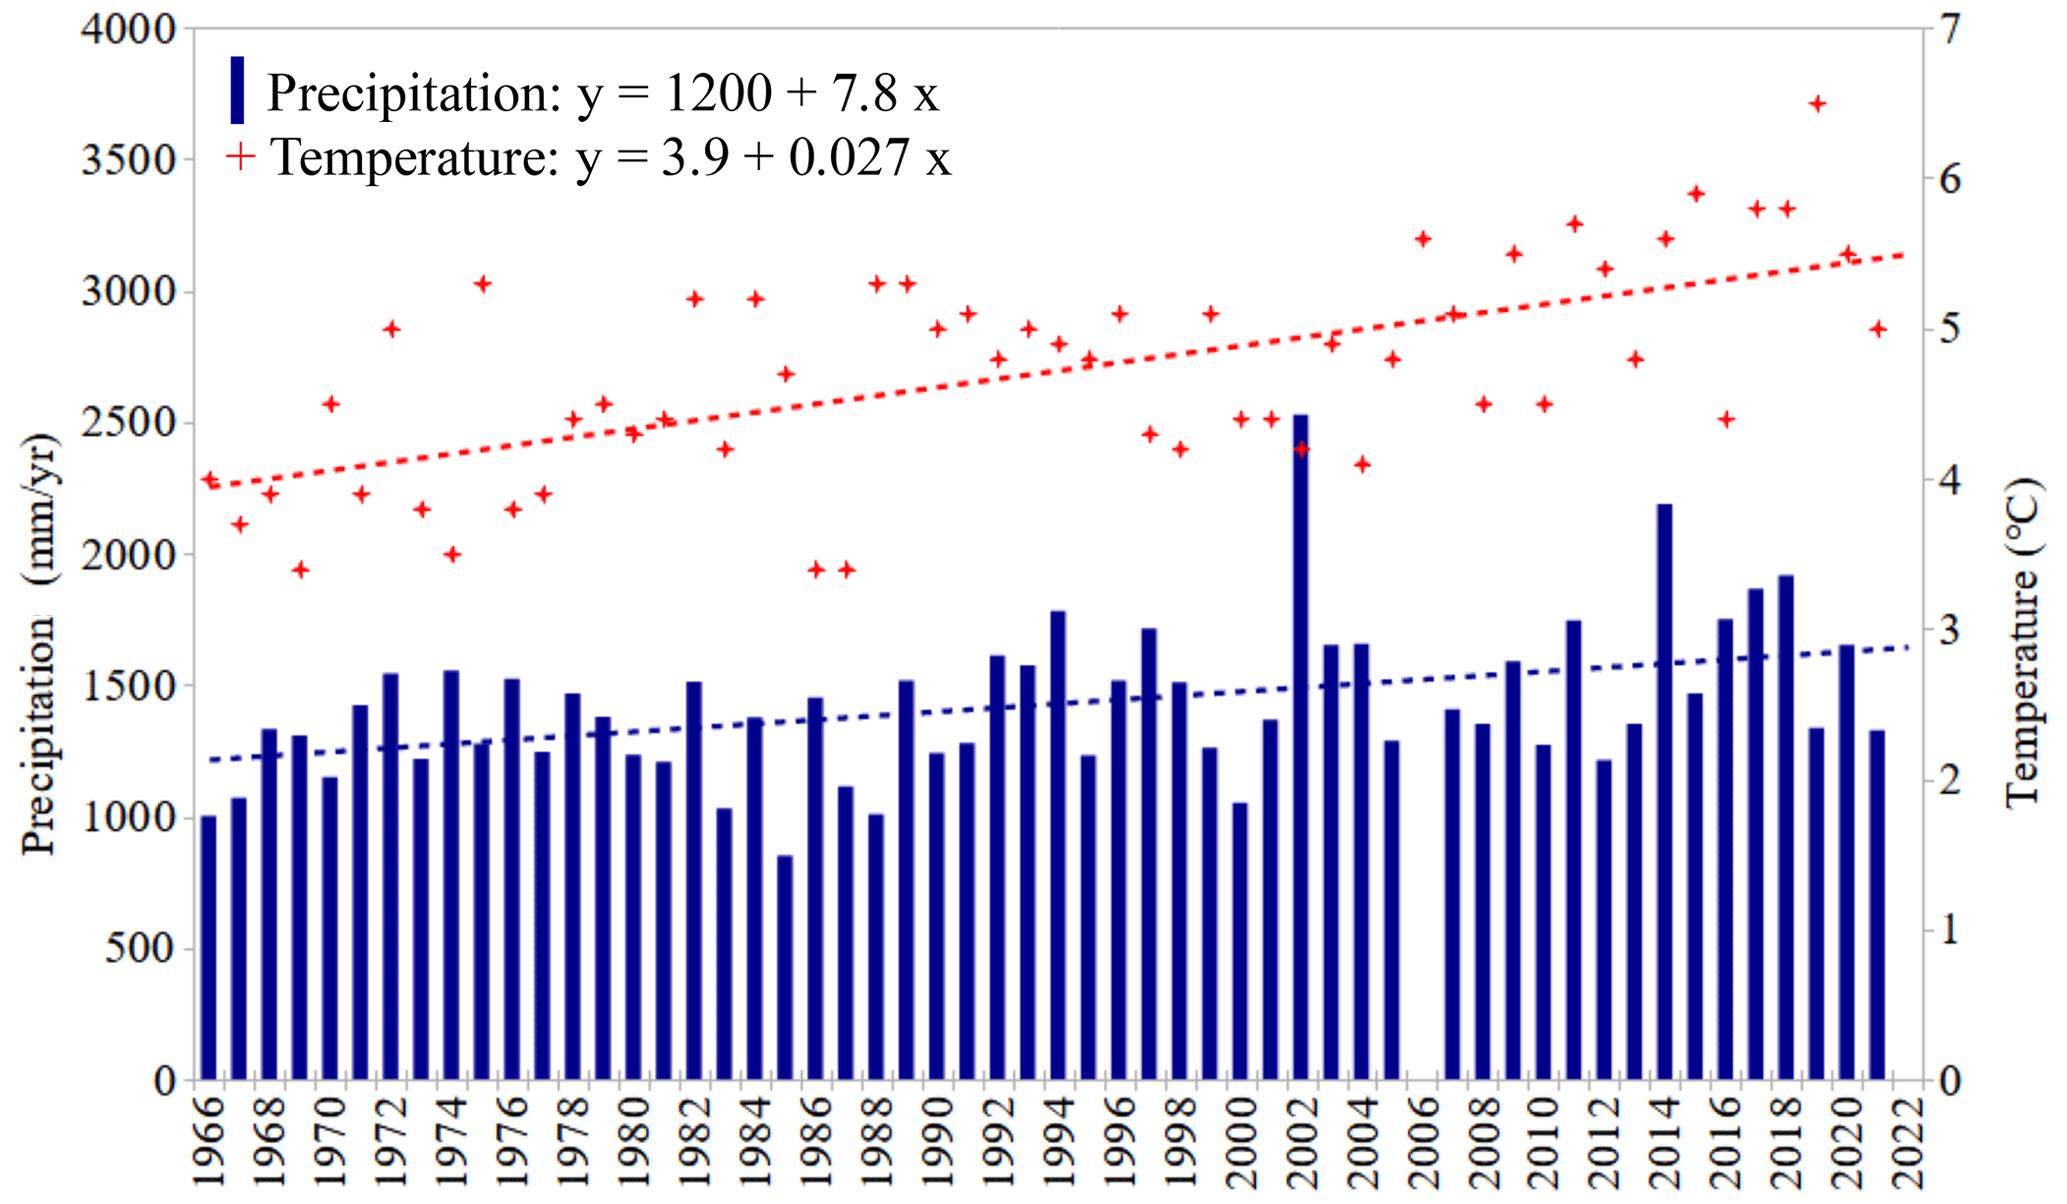
Figure 4Temperature and precipitation records in Höfn from 1966 to 2021 (combined record of four stations): annual average temperature (red plus symbols, mean: 4.7 °C) and annual total precipitation (blue histograms, mean: 1420 mm), with linear trends (dotted lines: red for temperatures and blue for precipitation).
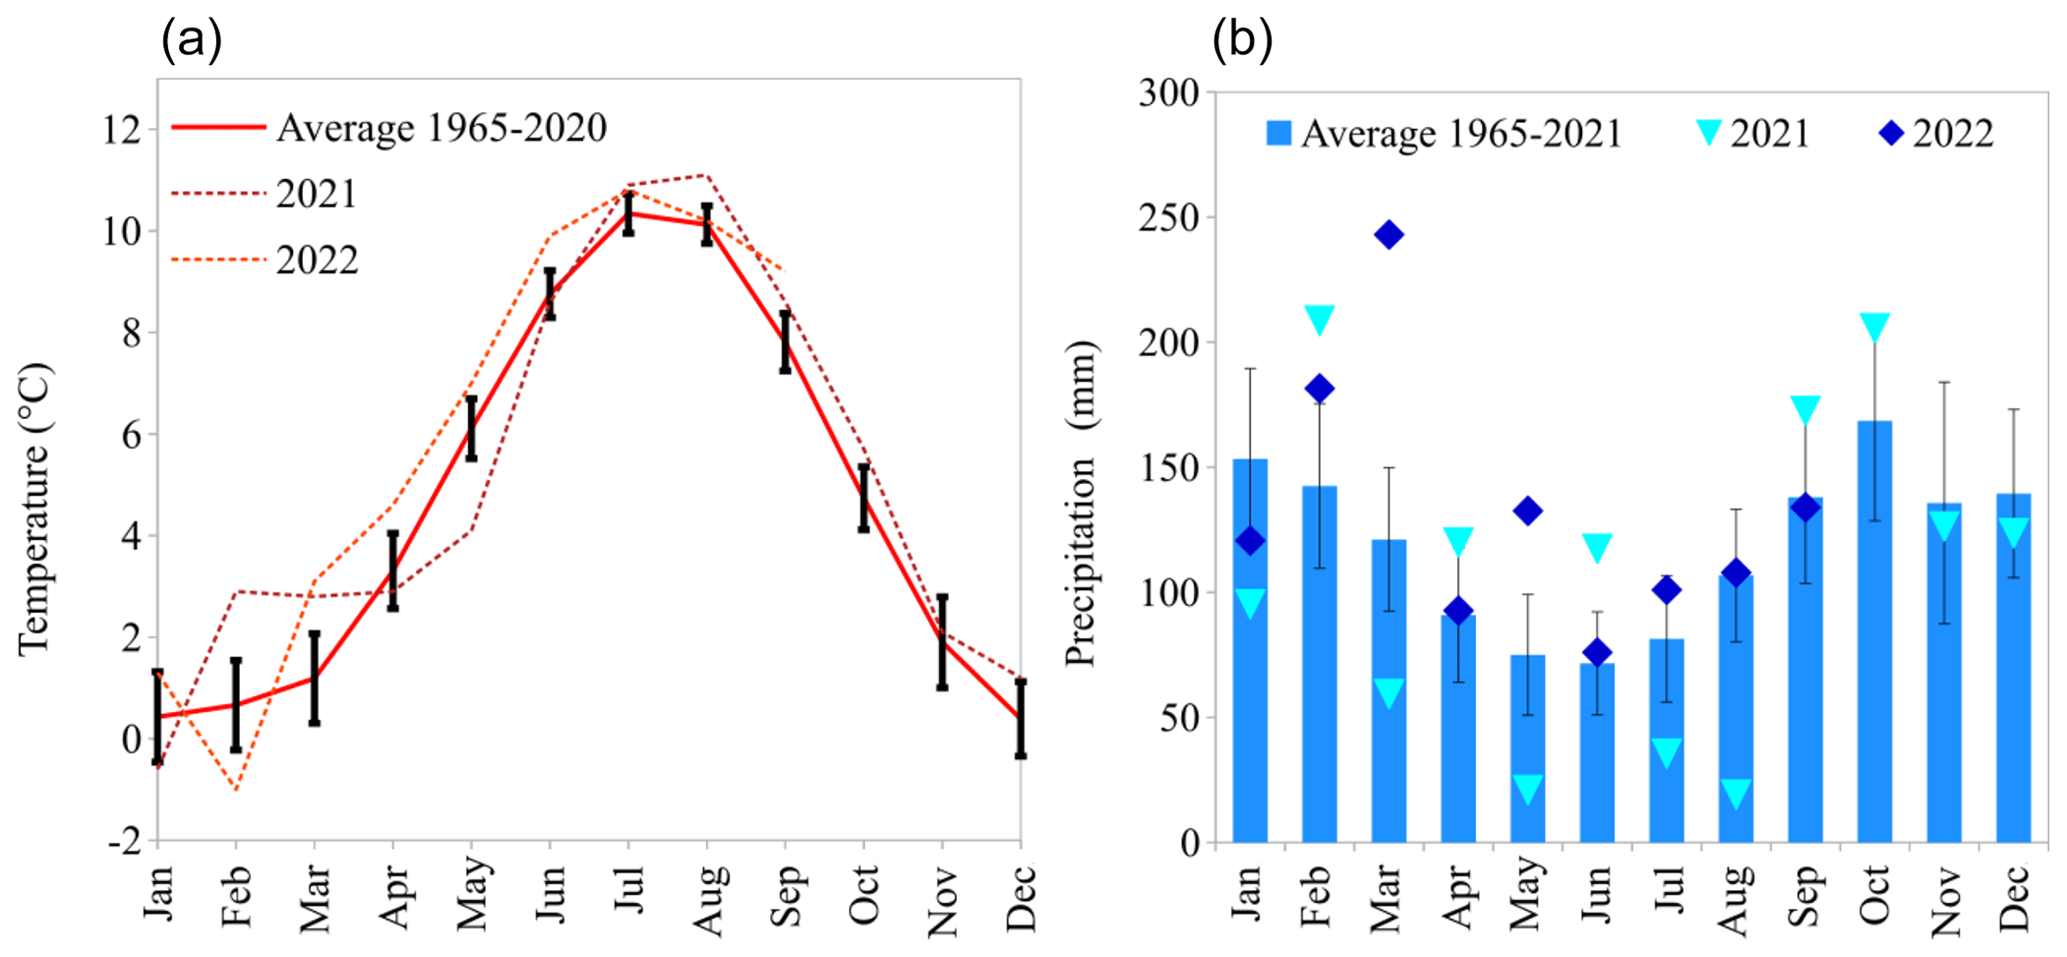
Figure 5The mean monthly temperature and precipitation measured in Höfn from 1966 to 2020 (combined record of four stations), with monthly standard deviation and 2021 and 2022 values: (a) temperatures (monthly standard deviation from 0.7 to 1.8 °C), (b) precipitation (monthly standard deviation from 41 to 98 mm).
2.2 Glacier context
The four outlet glaciers (Fláajökull, Heinabergsjökull, Skálafellsjökull and Breiðamerkurjökull) are temperate and warm based. They have undergone a complex evolution since their last maximum extent at the end of the 19th century (Hannesdóttir et al., 2015). Their recession since the mid-1990s (Björnsson et al., 2013) is linked to anthropogenic climate change (e.g., Aðalgeirsdóttir et al., 2020). The rate of mass loss has slowed down since 2010 (Noël et al., 2022), demonstrating the high sensitivity of glaciers to climate and ocean temperature. The retreat rate is predicted to increase again in the coming decades (Noël et al., 2022). Breiðamerkurjökull has a particularly fast retreat rate because of its unique situation, with its proglacial lake in direct connection with the ocean, whose salinity and variable temperature are enhancing the melting rate (Guðmundsson et al., 2020). Mass balance records for the glaciers (here, only summer mass balance) are extrapolated from stake measurements (glaciological method, Cogley et al., 2011) on Vatnajökull ice cap (Björnsson et al., 1998, 2013; Gunnarsson et al., 2022) in the period 1992–1993 to 2021.
The topographic map used for the proglacial area and the surface topography of the glaciers is IslandsDEMv1 (Fig. 1), a seamless and bias-corrected mosaic from ArcticDEM (Porter et al., 2018) and lidar (Jóhannesson et al., 2013) from the National Land Survey of Iceland (IslandsDEMv1, Landmælingar Íslands/National Land Survey of Iceland, 2022), with a 2×2 m resolution and a vertical accuracy better than 0.5 m. The subglacial topography of the four outlet glaciers is interpolated from radio-echo sounding measurements at a resolution of 200×200 m (Björnsson and Pálsson, 2020).
2.3 Geological context
These glaciers lie on volcanic rocks (Einarsson, 1994) and volcano-detritic deposits that result from the interaction of the plate boundary, the Mid-Atlantic Ridge and the Iceland mantle plume, which have formed the Iceland Plateau (Martin et al., 2011; Sæmundsson, 1979). Four main groups of geological formations exist (Einarsson, 1994), of which two are represented in the study area: tertiary basalt formations and sediments. The basalt encountered in the study area was formed during the Miocene and Pliocene (−13 Ma in the east of Iceland to −3.3 Ma along the western margin of Vatnajökull (Torfason, 1979)). This pile, of a total thickness of up to 12 km (Torfason, 1979) and being gently inclined towards the northwest (Torfason, 1979), is mainly composed of basaltic lava flows, with numerous acidic intrusions and intercalated sediments which have been largely eroded (Jóhannesson and Sæmundsson, 1998). The Vatnajökull outlet glaciers have carved out steep-sided valleys in the basaltic plateau (Hannesdóttir et al., 2010). In the study area, the basaltic plateau reaches a maximum elevation of 1746 m a.s.l. (glacier thickness included). Till is the sediment formed, transported and deposited by glacier movements (Goldthwait, 1971), with little or no sorting by water (Dreimanis, 1983). In the study area, the proglacial areas between the glaciers and the coast are sandur (Hannesdóttir et al., 2010), with geomorphological features encompassing till and glacio-fluvial deposits. The types of soil developed are Vitric Andosols, Leptosols and Andosols (Arnalds, 1999, 2015). They are partly cultivated (Hannesdóttir et al., 2010). The periglacial landforms are numerous and could induce variations in hydraulic parameters. South of Breiðamerkurjökull, in particular, there is a large sandur with many drumlins and eskers.
For sustainable water management and a precise assessment of the impact of climate change on glacierized catchments, a good understanding of the water cycle and, thus, better quantification of the water fluxes between the glacier surface and subglacial components are crucial. To accomplish those critical needs, a multidisciplinary approach based on available and new data collection is developed. The already available data provide information on meteorological conditions, glacier evolution and geology but do not allow characterization of the aquifers, their hydrodynamics or their dependence on glacier melt. To better characterize the groundwater component, new data acquisitions such as groundwater level monitoring and slug tests were done before analyzing the complete data set. The data analysis concerns the determination of the geometry, dynamics and hydrodynamic properties of aquifers; the estimation of the subglacial melt discharge; and the effective rainfall rate on the proglacial area.
3.1 New data
3.1.1 Aquifer geometry
The geological map of Iceland at a scale of 1:500 000 was published by the Icelandic Institute of Natural History (Jóhannesson and Sæmundsson, 1998) and is, to date, the only published geological map covering the study area. The drilling logs of 66 boreholes, drilled for different purposes in the past, were collected through the ISOR database (https://arcgisserver.isor.is/?lon=15.94309&lat=64.16777&zoom=9&_ga=2.201842968.826007890.16557159811663863155.1650447536&layers[]=satellite&layers[]highTemperatureBoreholes, last access: 25 July 2024 and https://arcgisserver.isor.is/, last access: 25 July 2024) or directly from the archives of the drilling company, Ræktunarsamband Flóa og Skeiða (RFS). A total of 24 of these logs provide validation of the geological map and of data on the thickness of the geological formations. Field data were gathered from May 2021 to September 2022. Using these data, we have updated and simplified the geological map (Jóhannesson and Sæmundsson, 1998) to present the two main geological formations of potential aquifers: (i) the detrital formation results of combined subglacial and proglacial tills, the moraines, and glacio-fluvial deposits and (ii) the basalt bedrock (including the acidic intrusions). The extents of the outcrops of the till and glacio-fluvial-deposit formations and of the basalt formations as indicated on the geological map have been validated in the field wherever possible (13 outcrops) and slightly corrected. The resulting map is presented in Fig. 6. The thicknesses of the geological formations were estimated by combining the thicknesses extracted from the existing geological logs and the literature (Bogadóttir et al., 1986; Boulton et al., 1982; Evans, 2000).
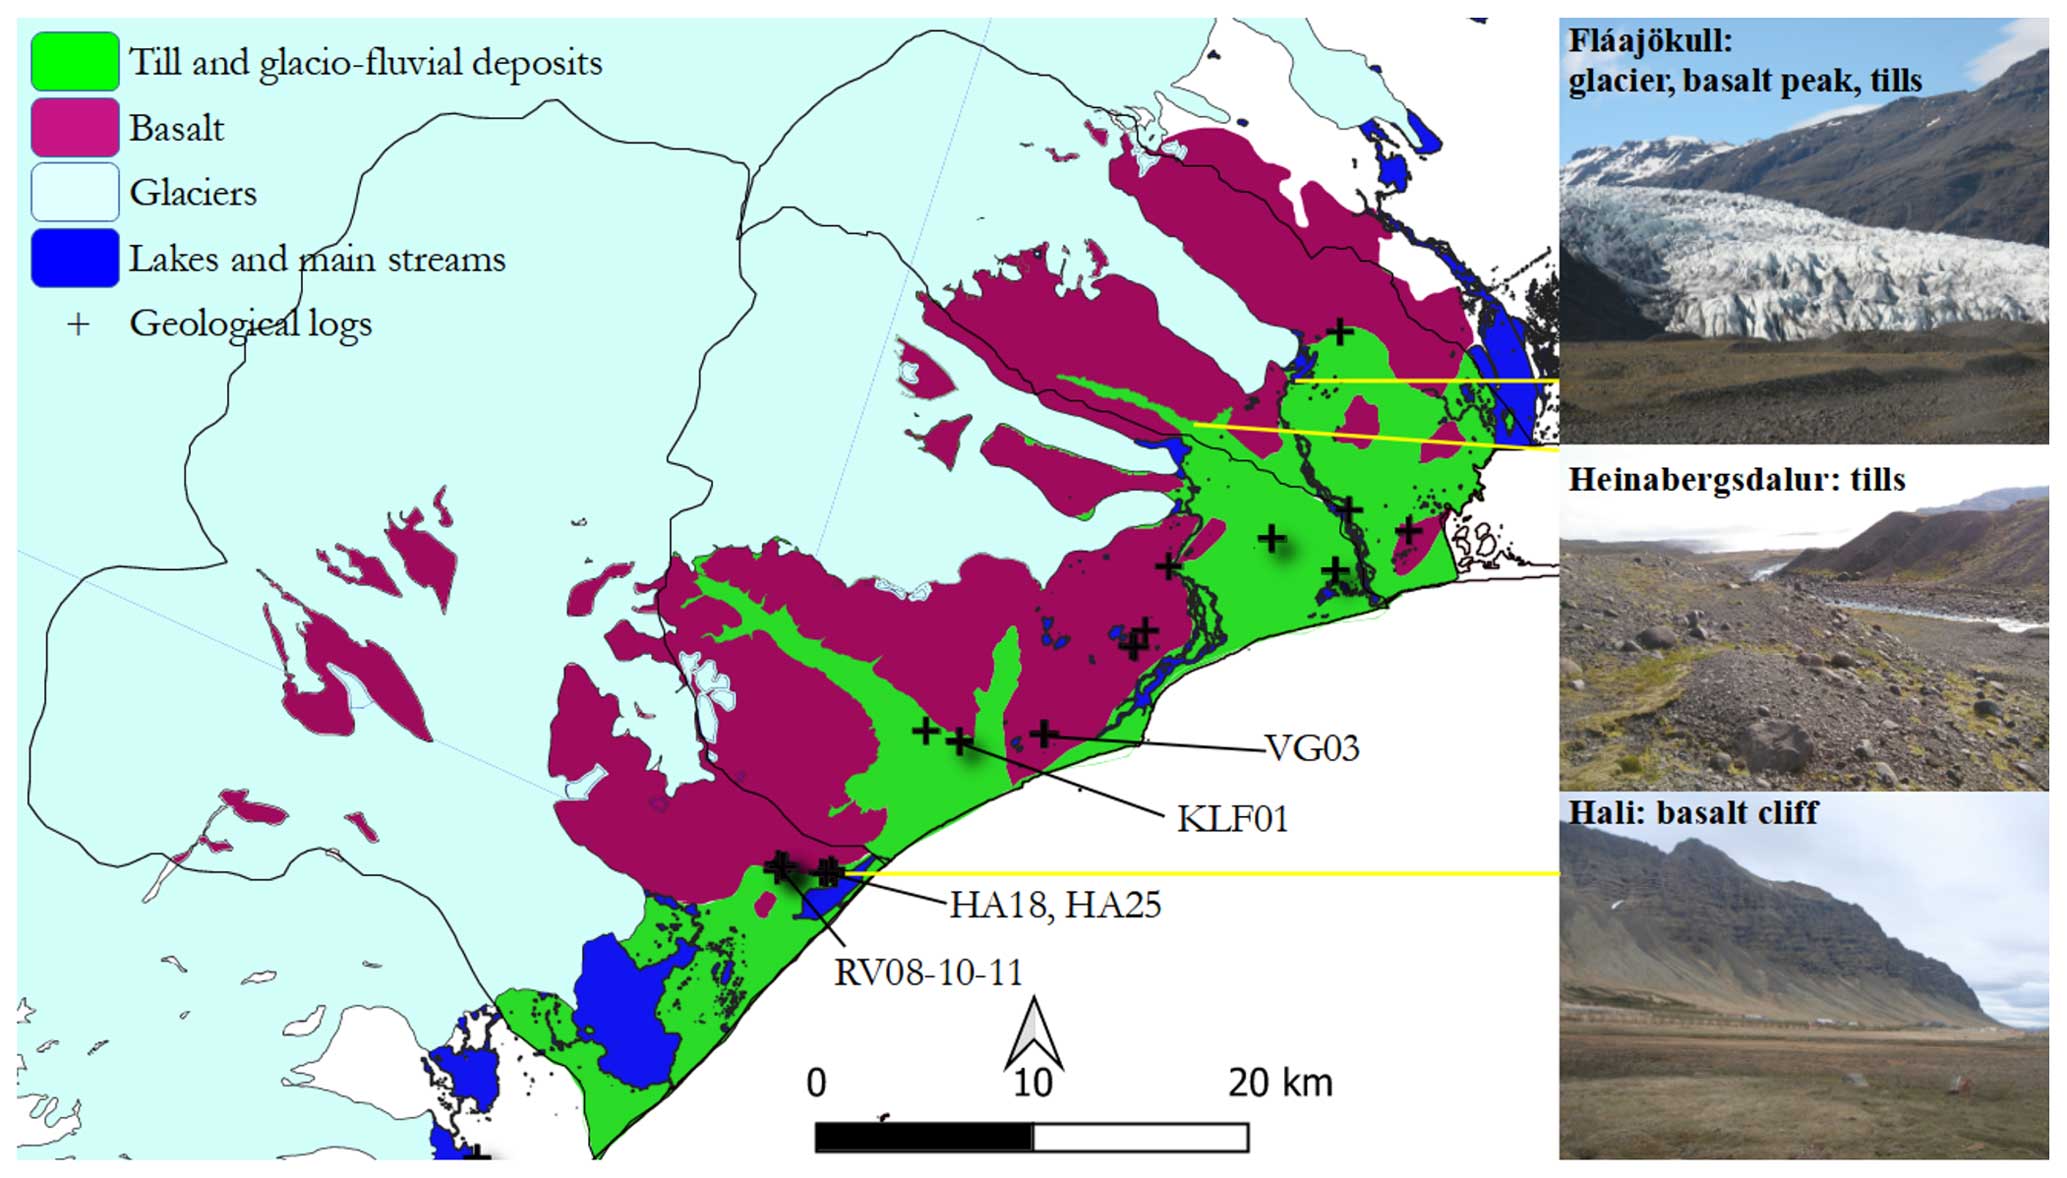
Figure 6The resulting geological map of the study area, with locations of the geological logs giving information on the thickness of geological formations. The basalt formation is represented in purple, and the till and glacio-fluvial deposits are represented in green. In light blue, there is the glacier, and in dark blue, there are the lakes and main rivers. Pictures on the right side offer some typical views of the geological system: outlet glacier (Fláajökull), tills in Heinabergsdalur and a basalt cliff at Hali. Geological contours are based on Jóhannesson and Sæmundsson (1998), and other contours are from Landmælingar Íslands ISN2016.
3.1.2 Aquifer dynamics and properties
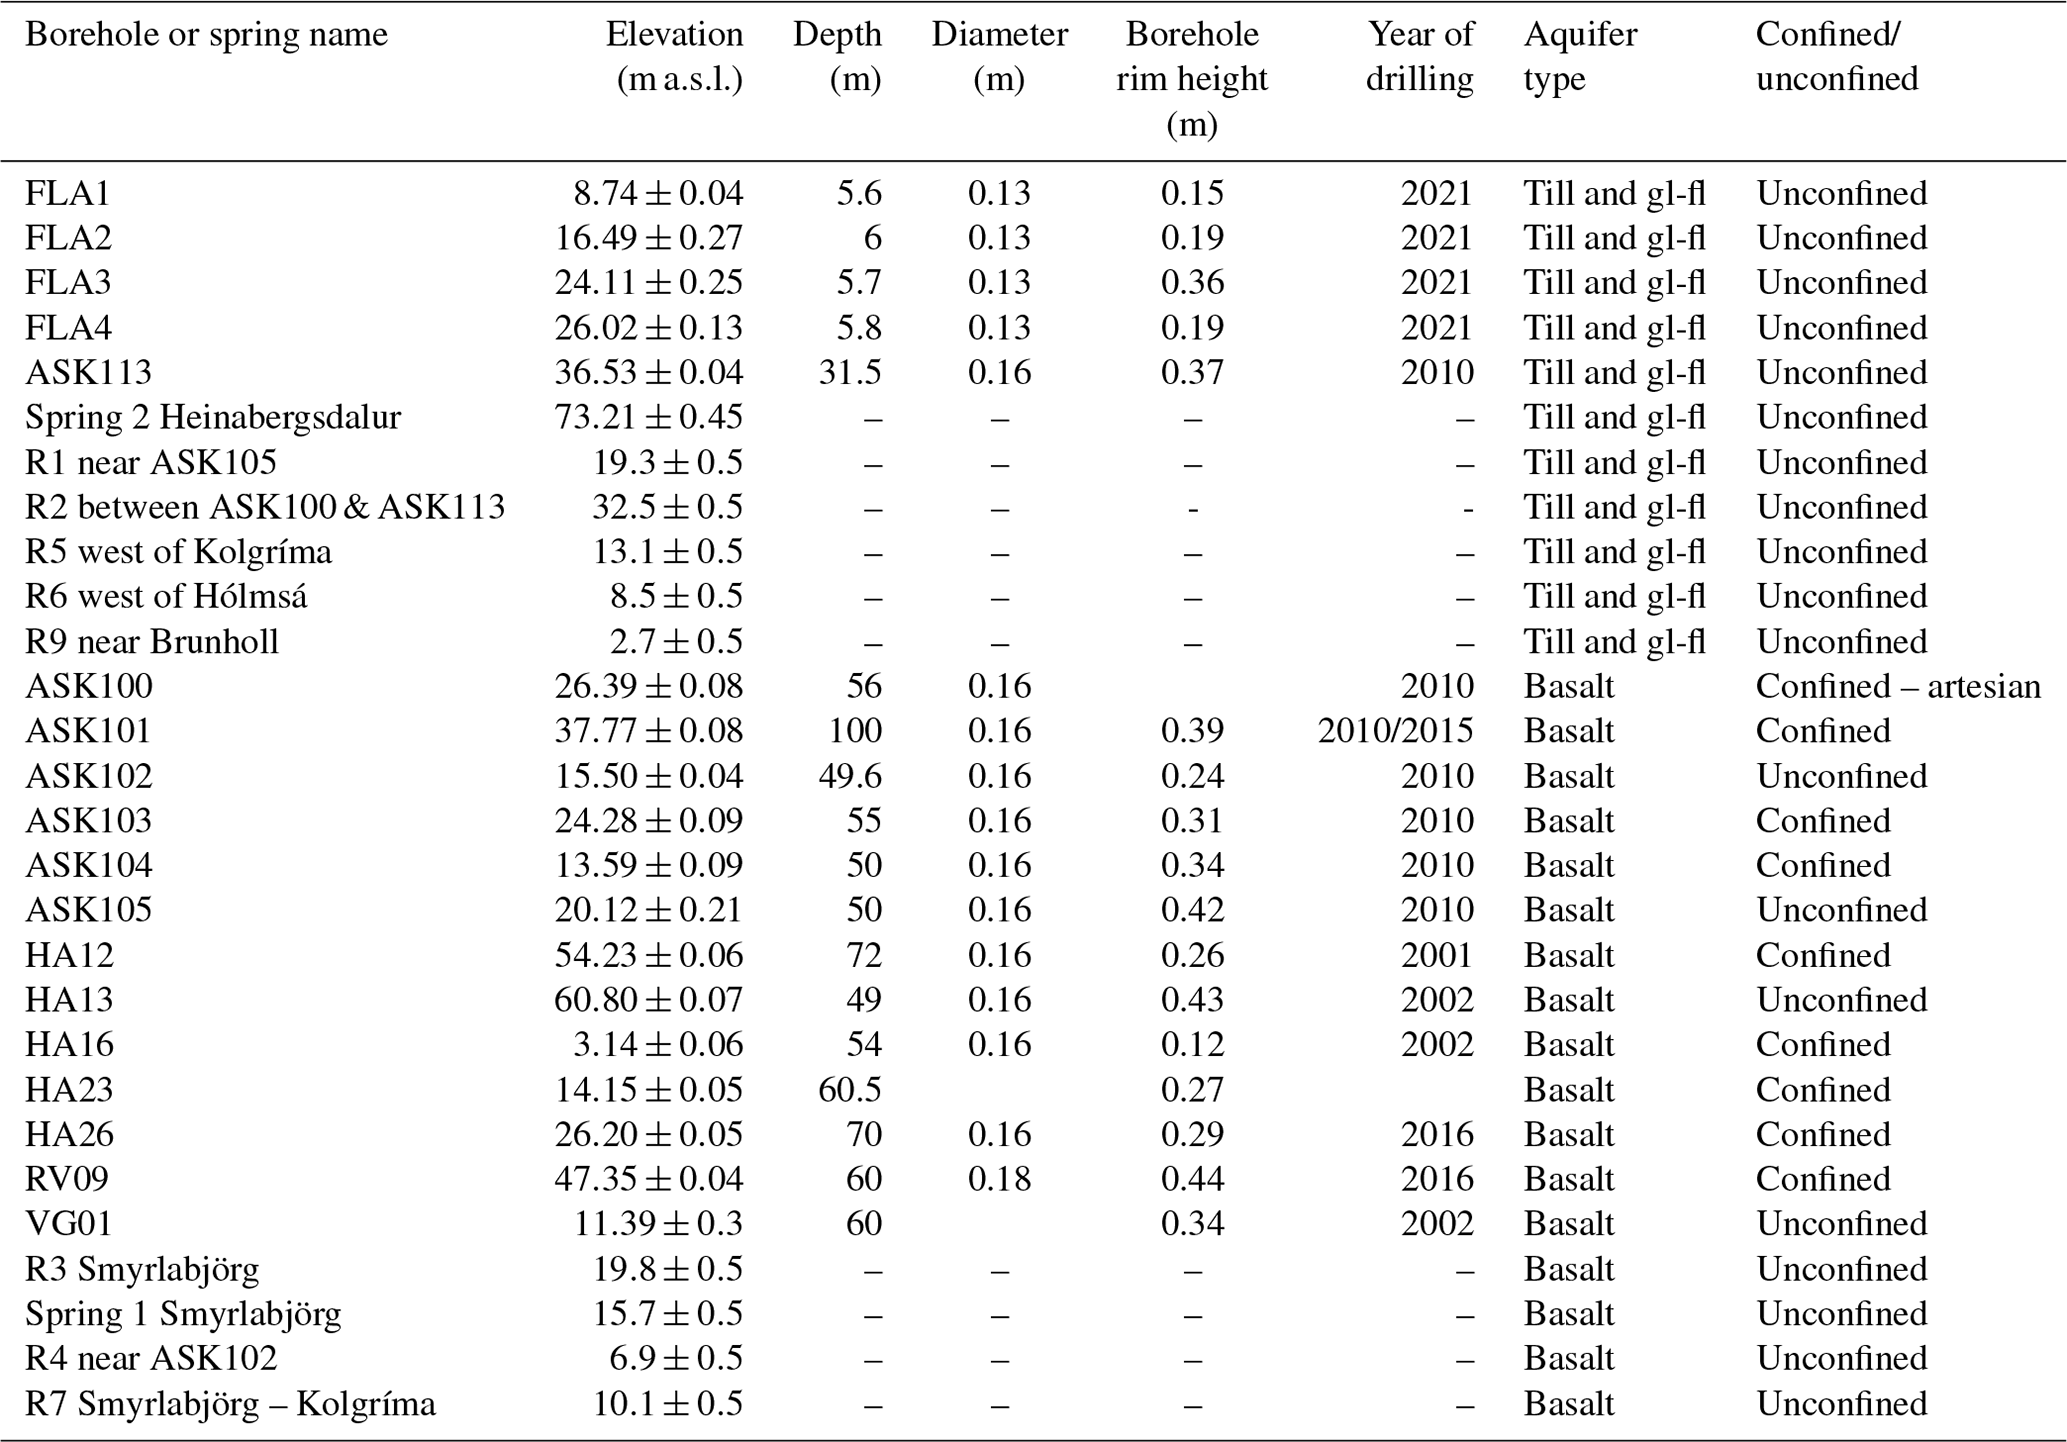
The observation network (Table 1 and Fig. 3) consists of 14 abandoned boreholes and 4 new ones that were drilled for this project in front of Fláajökull on a line from the glacier terminus toward the coast (see Fig. 3 – FLA4, FLA3, FLA2 and FLA1). The network thus consists of 13 boreholes in the basalt formation and 5 in the till and glacio-fluvial-deposit formations. In addition, we monitored 11 depression springs, 4 from the basalt aquifer and 7 from the till and glacio-fluvial-deposit aquifers. Monthly manual measurements were made from March or May 2020 to September 2022 of the groundwater level, water temperature and water EC with a manual piezometric probe (Solinst TLC Meter 107). The springs were controlled visually, and their temperature and EC were monitored with the TLC Meter. From September 2021 to September 2022, we monitored four boreholes in the till and glacio-fluvial deposits and seven boreholes in the basalt using automatic pressure and temperature probes at an hourly time step (six TD-Divers, type DI802; three TD Micro-Divers, type DI501) and two probes measuring, in addition, electro-conductivity (two CTD-Divers, type DI217). To correct for the atmospheric pressure, we used three Baro-Divers (type DI800) and one Baro Micro-Diver (type DI500). A participatory approach involving Glacier Adventure, a tourism and educational company based in Hali, allows the monthly monitoring of three of the boreholes in the basalt aquifer all year round with a Hydrotechnik Water Level Meter. The locations of all boreholes and springs were measured using a differential GPS instrument in September 2021 (elevations shown in Table 1).
Table 1Specifications of the groundwater observation network. For each borehole, their elevation, depth, diameter, borehole rim height, year of drilling, aquifer type, and the confined or unconfined status of the aquifer are listed. Note that gl-fl refers to glacio-fluvial deposits. For the locations of the listed rivers and places, see Fig. 3.
Finally, slug tests were carried out in July and September 2022 in the five boreholes in the till and glacio-fluvial deposits and in the six boreholes in the basalt formation using slugs (diameters 10 and 5 cm) and an automatic pressure probe. One to three repetitions of the test were conducted in each borehole, with data being recorded every half second.
3.2 Data analysis
3.2.1 Hydrodynamic properties of aquifers
We calculated the hydraulic conductivities with two different methods: slug tests for both types of aquifers and grain size data for the till and glacio-fluvial deposits.
We interpreted the slug tests with the Bouwer and Rice solution (Bouwer and Rice, 1976) for the unconfined boreholes (only on the rising parts of the tests) and with the Hvorslev method (Hvorslev, 1951) for the confined boreholes. The results are representative of a few meters' distance in radius from the borehole and of the whole depth of the screen in the borehole (Table 1).
For the grain size data method, we used d10 from samples collected in the Skálafellsjökull area. Their representativeness is local and up to 2 m depth. We carried out the calculation using the modified Hazen formula, developed empirically (in various soil types in northern Scotland; MacDonald et al., 2012) and applied to Virkisjökull, a glacierized valley very similar to the study area (Dochartaigh et al., 2019):
with K being the hydraulic conductivity (in m d−1); d10 being the threshold grain size under which 10 % of the grains are represented (in mm); and SSD being the soil state description value, ranked between 0 and 1, from a very loose to very dense state – here, SSD = 1 (Dochartaigh et al., 2019).
We estimated specific yield (Sy) for both aquifers using grain size data (graph in Robson, 1993) and the water table fluctuation (WTF) method based on the distinct rainfall–recharge events after manual correction of the Lisse effect (Crosbie et al., 2005; Healy and Cook, 2002):
with R being the recharge (in m) and Δh being the increase in groundwater table (in m). Only recharge events exclusively due to rainfall should be considered; thus, we excluded days with snow precipitation and/or snow cover, as well as periods of potential significant glacial melt recharge.
3.2.2 Glacier melt and effective rainfall
Estimates of glacier melt and effective rainfall were used to deduce the amount of available water for subglacial flow and groundwater recharge in the subglacial area. To estimate the glacier melt, we used two data sets: (i) the estimated summer mass balance based on direct glaciological methods from 2010 to 2021 (Björnsson et al., 1998, 2013; Gunnarsson et al., 2022) and (ii) melt calculated with the offline HIRHAM model forced with output from the Regional Climate Model HARMONIE-AROME reanalysis-forced simulations from 1980 to 2016 as conducted by Schmidt et al. (2020), which was used to force the Parallel Ice Sheet Model (PISM) (Bueler and Brown, 2009). HARMONIE-AROME is a non-hydrostatic, convection-permitting model (Bengtsson et al., 2017) that used the reanalysis of the Icelandic Meteorological Office for Iceland (ICRA) (Nawri et al., 2017) as boundary conditions for the period from 1 September 1979 until 31 December 2017 at a horizontal resolution of 0.025°×0.025°, corresponding to ∼2.5 km. In the rest of the paper, these simulations by Schmidt et al. (2020) are called HH-ICRA. The non-surface mass balance is added to the HH-ICRA outputs: 0.23 mm d−1 of dissipation for all the areas and an additional 0.15 mm d−1 from lake calving for Breiðamerkurjökull and Heinabergsjökull (Aðalgeirsdóttir et al., 2020; Jóhannesson et al., 2020).
The quantification of the effective rainfall must first estimate the potential evapotranspiration from available climatic variable and then use the water balance method. The potential evapotranspiration (PET) was calculated using the Thornthwaite method (Thornthwaite, 1948) for evolution since 1966 and using the Penman method (Monteith, 1965; Penman, 1948, with CropWat 8.0) for monthly values between 1990 and 2022 using available weather station data from the Höfn weather stations and parameters adapted to the latitude. We chose classic methods as, from the literature, there is no specific method that proved to be more representative for Iceland.
Effective rainfall was then calculated with the following equations:
with i being the month, RETi being the real evapotranspiration, PETi being the potential evapotranspiration, Pi being Precipitation, Si being soil water storage capacity and EFi being the effective rainfall. S is initially estimated at 50 mm as an average for the Vitric Andosols, Leptosols and Andosols that compose the area (Arnalds, 1999, 2015). As rainfall and snow events are not completely distinguished in the precipitation record provided by the IMO, the effective rainfall we calculate does not represent the delayed recharge to the aquifers due to the snowmelt.
To perform these data analyses, we used several free and open software packages: the Geographic Information System QGIS (QGIS Association, 2022) to update and create maps, as well as to perform mathematical operations on maps; LibreOffice for statistical treatments and graphical drawings (Libre Office, 2020); and Python (Anon, 2022) for data analysis and the drawing of graphics.
We present here all the existing (geological map and climatic records) and newly acquired data sets on the monitoring of groundwater level, temperature and electrical conductivities, as well as the results of the slug tests. These data allow the characterization of the geometry, the hydrodynamic properties and the dynamic nature of each aquifer, as well as the recharge rates.
4.1 Aquifer characteristics
4.1.1 Geometry
The thickness of the subglacial till formation is estimated with ground-penetrating radar measurements, ranging from 1 to 20 m thick (average 5 m) under Skálafellsjökull (Hart et al., 2015; Hart, 2017). The proglacial tills closest to the glacier terminus, which can be a good representation of subglacial ones, have a thickness of up to 3 m in front of Skálafellsjökull (Hart, 2017) and 3.5–5 m in front of Fláajökull (Evans and Hiemstra, 2005). The thickness probably has some spatial variability, and the subglacial till might not be continuous everywhere.
According to the drill logs of the 16 boreholes consulted (locations in Fig. 6), the till and glacio-fluvial-deposit formation total thicknesses range from 2 to 54 m (maximum thickness in RV08), with an average of 15 m. This range is confirmed by 5 m of till and glacio-fluvial deposits in a borehole in Hali (HA25, Sigurðarson et al., 2016) and a 16 m high stratigraphic log full of sediments in a cross-section along the Kolgríma River, close to the Skálafellsjökull terminus (Evans et al., 2000). According to seismic reflection and refraction measurements south of Breiðamerkurjökull, the thickness of the till and glacio-fluvial deposits ranges between 30 and 150 m, from the glacier to the coastline (Bogadóttir et al., 1986; Boulton et al., 1982).
A basalt formation generally has a high contrast in hydraulic conductivity (K) from top to bottom as, with time and a temperature over 50 °C, the fractures are filled with secondary minerals, products of the chemical alteration (smectite, illite, zeolite at low temperatures, and chlorite and epidote for higher-grade metamorphism; e.g., Arnórsson, 1995). Thus, we assume that, below the 50 °C isotherm, the hydraulic conductivity of the basalt formation becomes negligible. The depth of the 50 °C isotherm can be estimated using the drilling logs retrieved from RFS and from data presented by Sigurðarson et al. (2016), who provide a detailed analysis of geophysical measurements in the borehole HA25 in Hali. The temperature log of borehole HA25 indicates 51 °C at −303 m, but both the stratigraphic description and the deviations in geophysical measurements show a shallower depth of −194 m (Sigurðarson et al., 2016). From the drilling logs retrieved from RFS, we have identified temperatures higher than 50 °C only in HA14, specifically 53 °C at −384 m (43 °C, at −186 m), suggesting a boundary at approximately −400 m. No temperature higher than 50 °C is observed in HA18 (at 180 m), RV08 (at 340 m) or RV11 (at 143 m), suggesting that the 50 °C isotherm is not above at least −140 m. Furthermore, weathered materials are described in VG03 (precipitate from −173 to −200 m), suggesting a transition at −200 m, and in RV10 (dark shale at −709 m). Thus, we conclude that the current 50 °C isotherm is between −300 and −400 m, and the boundary with older altered areas brought nearer to the surface by glacial erosion is around −200 m. The bottom of the basalt aquifer can thus be considered to be between −200 and −400 m below the surface or at the bottom of the till and glacio-fluvial deposits.
4.1.2 Aquifer hydraulic conductivity
Table 2 summarizes the results of the slug tests conducted in 11 boreholes. Hydraulic conductivities (K) of till and glacio-fluvial aquifers range from to m s−1, while those of the basalt aquifer range from to m s−1. Thus, there is a wider heterogeneity in terms of K in the basalt aquifer, depending on their fractured degree.
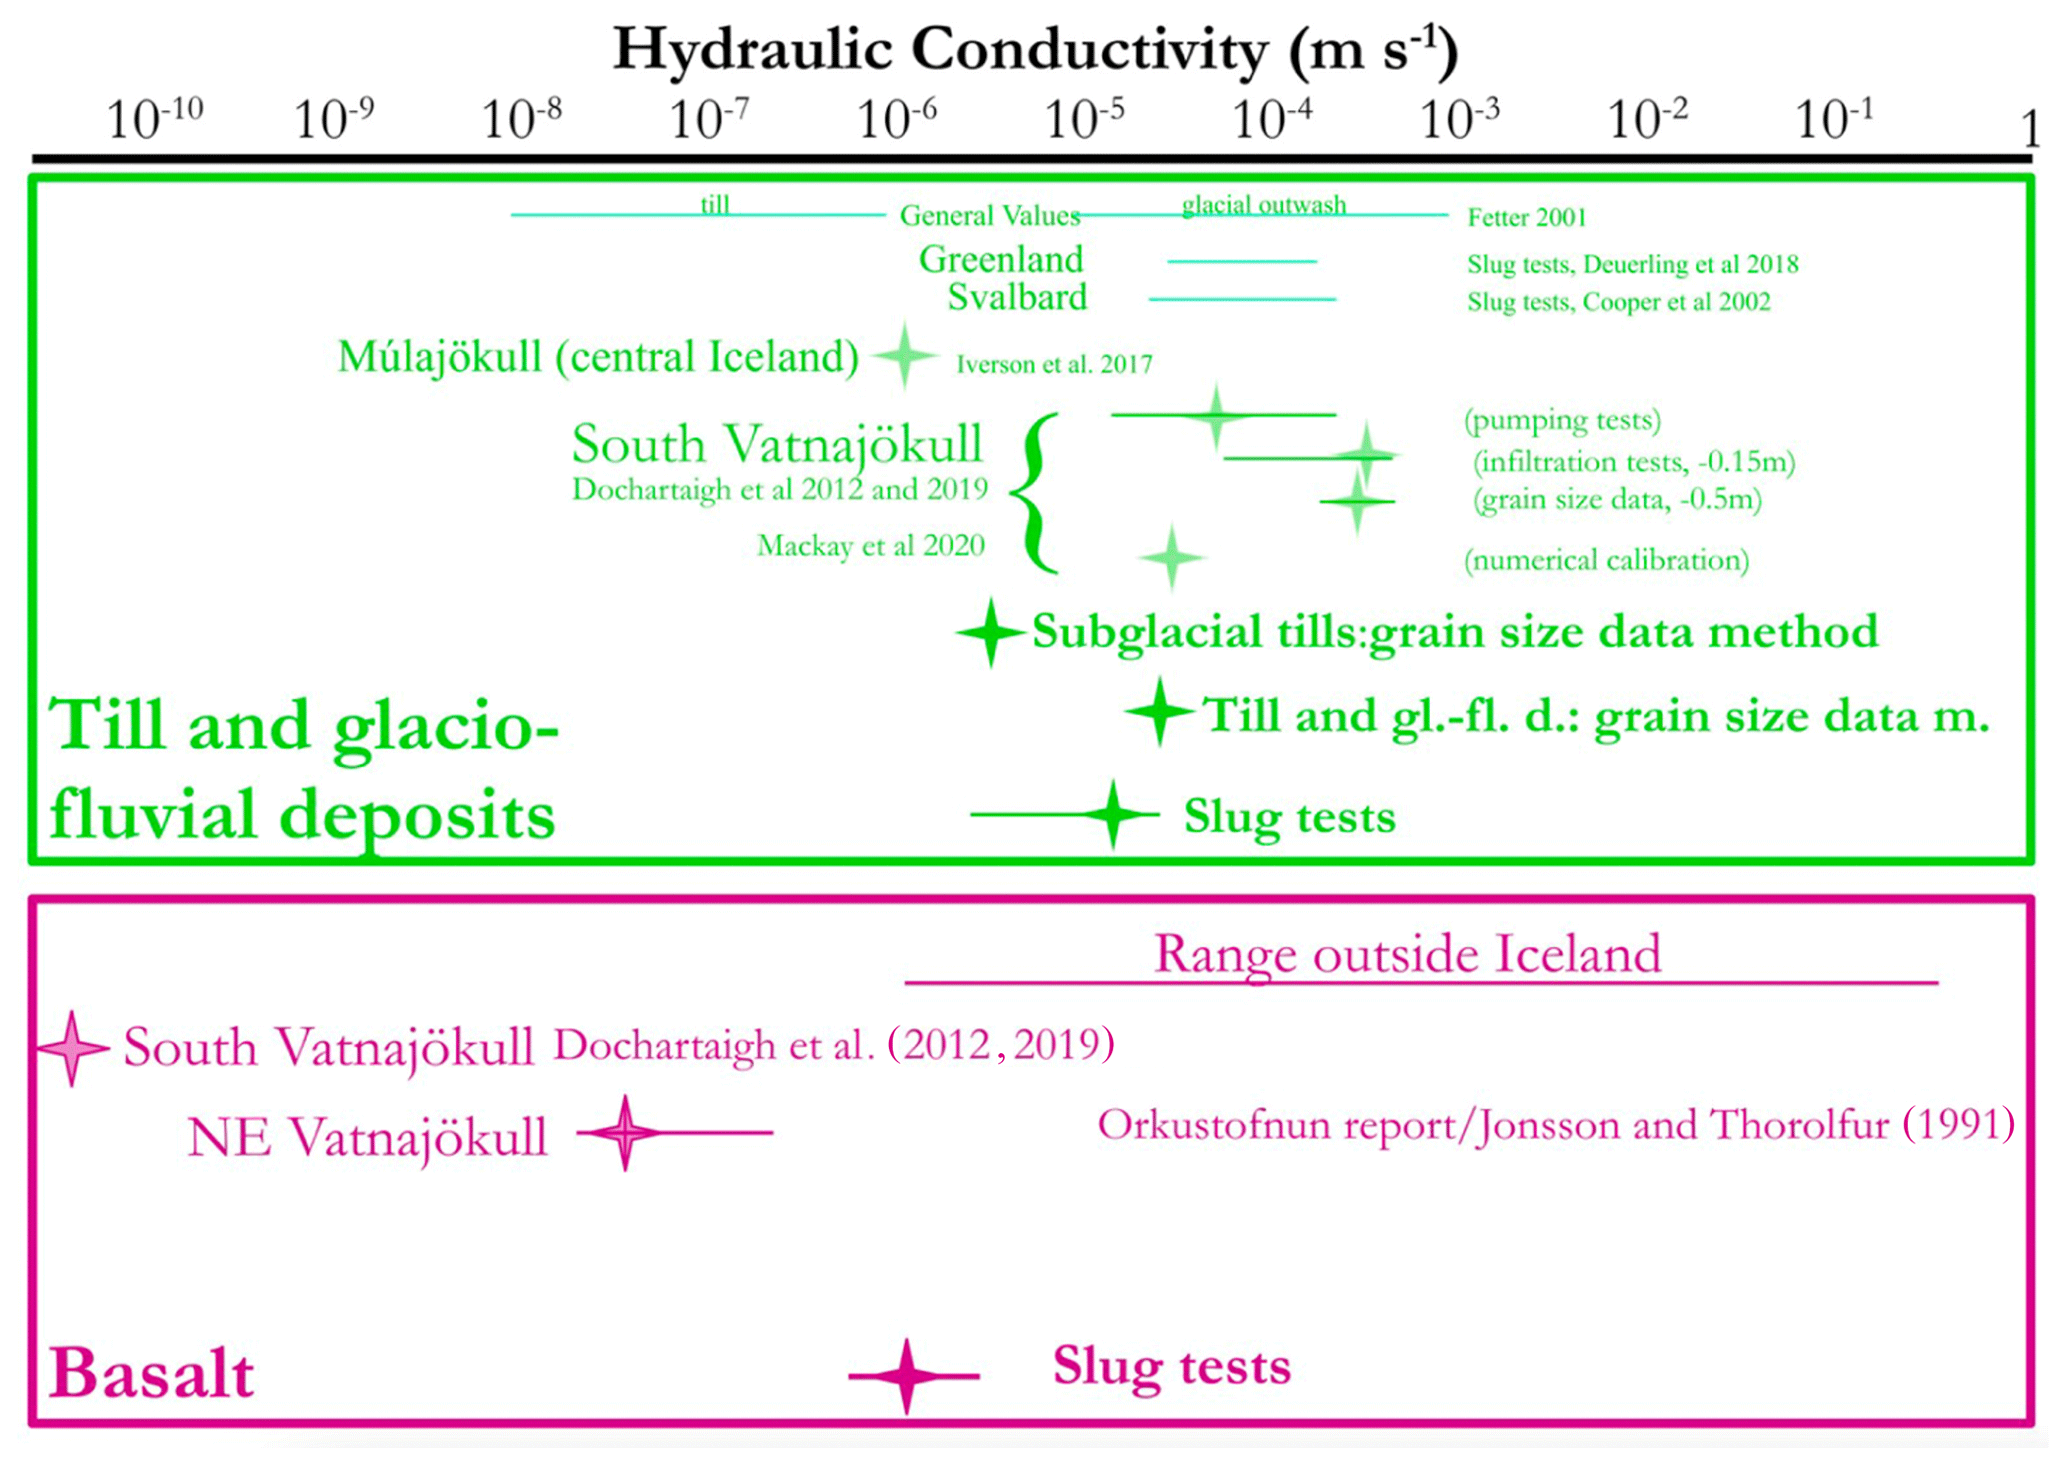
Figure 7Hydraulic conductivity values for the till and glacio-fluvial deposits and the basalt from data analysis and the literature; stars indicate single or average values, and horizontal lines indicate the range of values. The range for hydraulic conductivities of basalt outside Iceland is based on several bibliographical references; see details and references in the text.
Table 2Results of the slug tests conducted in July and September 2022. For each borehole, the aquifer type, the confined or unconfined status of the aquifer, the number of tests, the method of analysis used to interpret the slug tests data, the average value of hydraulic conductivity calculated from the data, the uncertainty of the measurements and the distance to the glacier front for the till and g-f aquifers are listed. Note that g-f refers to glacio-fluvial deposits.
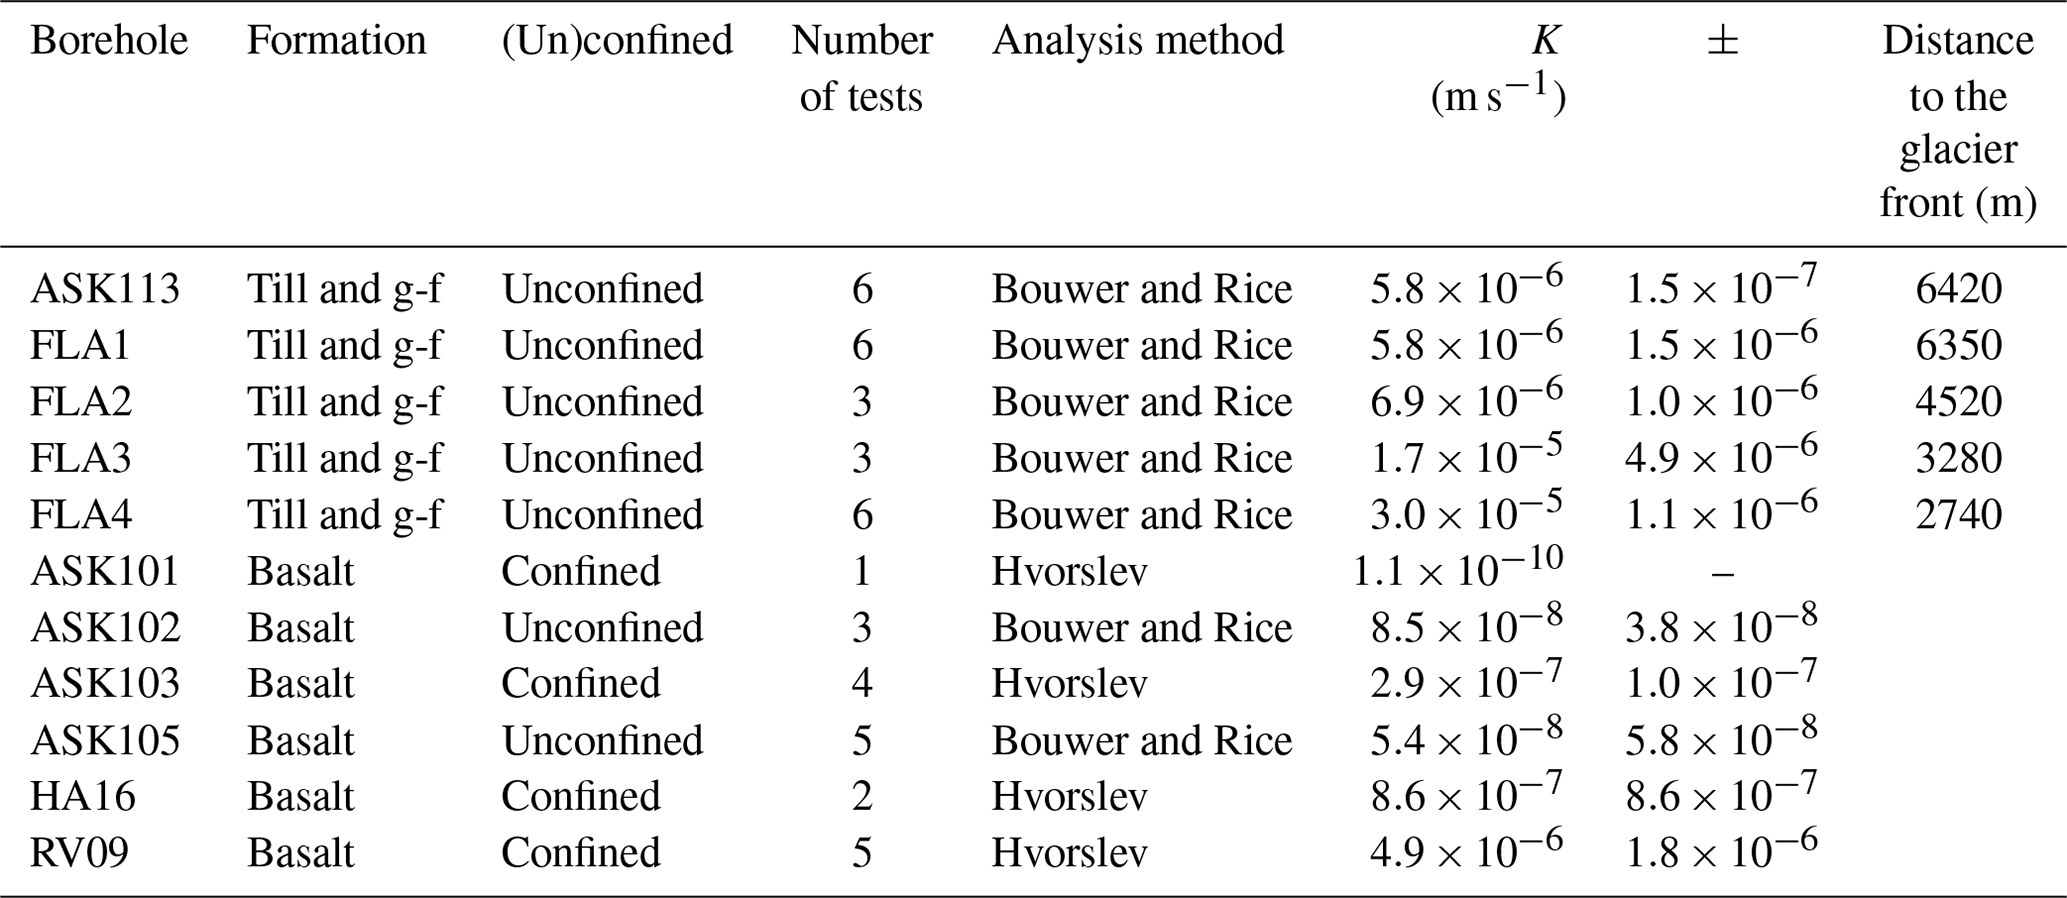
The hydraulic conductivity (K) values of the till and glacio-fluvial deposits calculated from grain size data (Fig. 7) vary from to m s−1 (for average d10 of 2 and 22 µm, respectively). This is in the range of values found in the literature for Iceland: from m s−1 (Iverson et al., 2017; Múlajökull till) to m s−1 (Ó Dochartaigh et al., 2012; Virkisjökull – glacial till, max. measured). The value of m s−1 is very close to the value of m s−1 calibrated for the Virkisjökull sandur (Mackay et al., 2020). Measurements done via slug tests yield similar results as the ones calculated from grain size data: [–] m s−1. They, moreover, show a decreasing trend from the glacier toward the coastline (Table 2), which can result from the decrease in grain size from the glacier terminus to the coast due to fluvial transport.
Hydraulic conductivity (K) values for the basalt formation calculated with the data from the slug tests are presented in Table 2 and are also shown in Fig. 7. Outside Iceland, K values for basalt have been recorded from to m s−1 (Fig. 7) and show the heterogeneous character of this type of formation. Higher values are found in fissured and young basalts, while lower ones are found in the core of lava flows or weathered and old lava. This range is based on the following references: Columbia River Plateau (USA) for a 1 to 5 km thick Miocene plateau, with 800 bulk K measurements in 577 wells over the first 500 m, showing a range of to m s−1, with vertical K being 5 times smaller (Jayne and Pollyea, 2018); La Réunion, which showed a range of to m s−1 (Join, 1991) and to m s−1 (numerical model calibration) (Violette et al., 1997); and Mayotte, with in situ measurements of lava flow, showing massive flow of < m s−1, scoriated flow of to m s−1 and fissured of to m s−1 (Lachassagne et al., 2014). In Iceland, K values for basalt vary by at least 3 orders of magnitude (Fig. 7): they are less than m s−1 (Ó Dochartaigh et al., 2012; Dochartaigh et al., 2019) at Virkisjökull glacier in southeastern Iceland, through constant rate pumping tests of 3 to 6 h, and to m s−1 (Jonsson and Hafstað, 1991) at the boundary between the mountainous East Fjords and the high plateau of central Iceland.
4.1.3 Aquifer storage coefficients
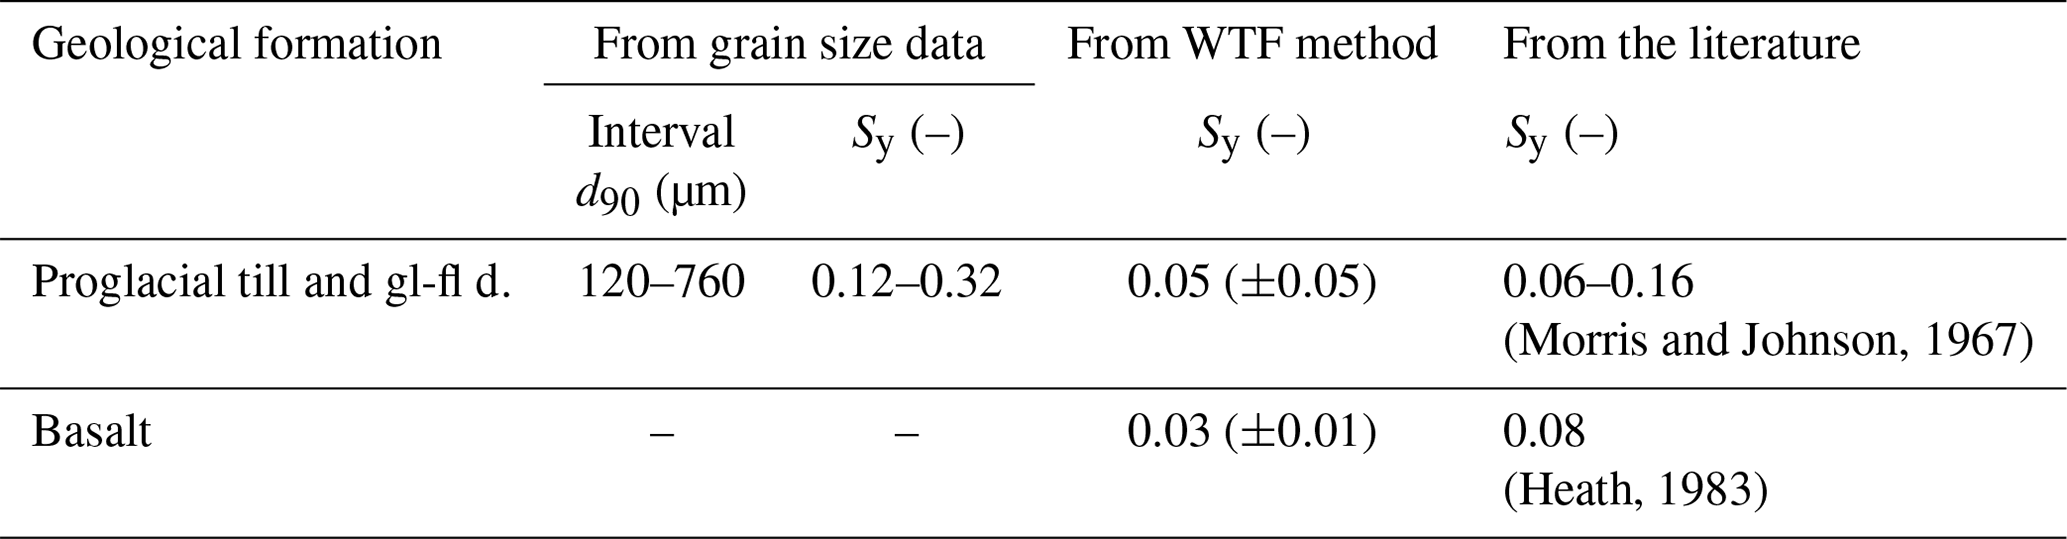
The aquifer storage coefficient S is composed of two parts, specific yield Sy and specific storage Ss: (e being the thickness of the aquifer); Sy dominates in unconfined aquifers, and Ss⋅e dominates in confined aquifers. We calculated Sy using the WTF method for three to seven distinct rainfall–recharge events depending on the borehole and the length of the available groundwater record (Table 3). Adequate data were available from four boreholes in the till and glacio-fluvial deposits (FLA1, FLA2, FLA3 and FLA4) and from two in the basalt aquifer (HA13 and ASK102). Direct use of the WTF method with different values of Sy shows that values greater than or equal to 0.12 for the till and glacio-fluvial deposits and 0.11 for the basalt imply a recharge larger than the measured precipitation, thus setting an upper limit regarding the possible interval for Sy. The conclusion is that till and glacio-fluvial deposits Sy ∈ [0.01–0.12] and that basalt Sy ∈ [0.02–0.11].
Table 3Specific yield (Sy) values calculated using (i) an estimate from grain size data (for the till and glacio-fluvial deposits only) and (ii) the water table fluctuation (WTF) method on up to seven rainfall–recharge events in October 2021 and April and May 2022. Average (]pm standard deviation). Note that gl-fl d. refers to glacio-fluvial deposits.
4.2 Monitoring and aquifer dynamics
To perform a comprehensive overview of the dynamics of aquifers and their water flux exchanges, we analyzed the new data set collected with the hourly monitoring of the groundwater level, temperature and electro-conductivity.
4.2.1 Groundwater level
The till and glacio-fluvial-deposit aquifer is unconfined with groundwater level that is often near to or at the surface. South of Fláajökull, in the newly drilled boreholes, the groundwater levels are very close to the surface (Fig. 8). The amplitude of the groundwater level seasonal variations decreases with the distance to the glacier (from 1.70 m in FLA4 to 0.30 m in FLA1). Uncertainties between manual and automatic probes are smaller than 6 cm, except for FLA3, where they are of the order of 13 cm. This area is in a county that is called “mýrar”, which means swamps, and many temporary swamps can be found in this area.
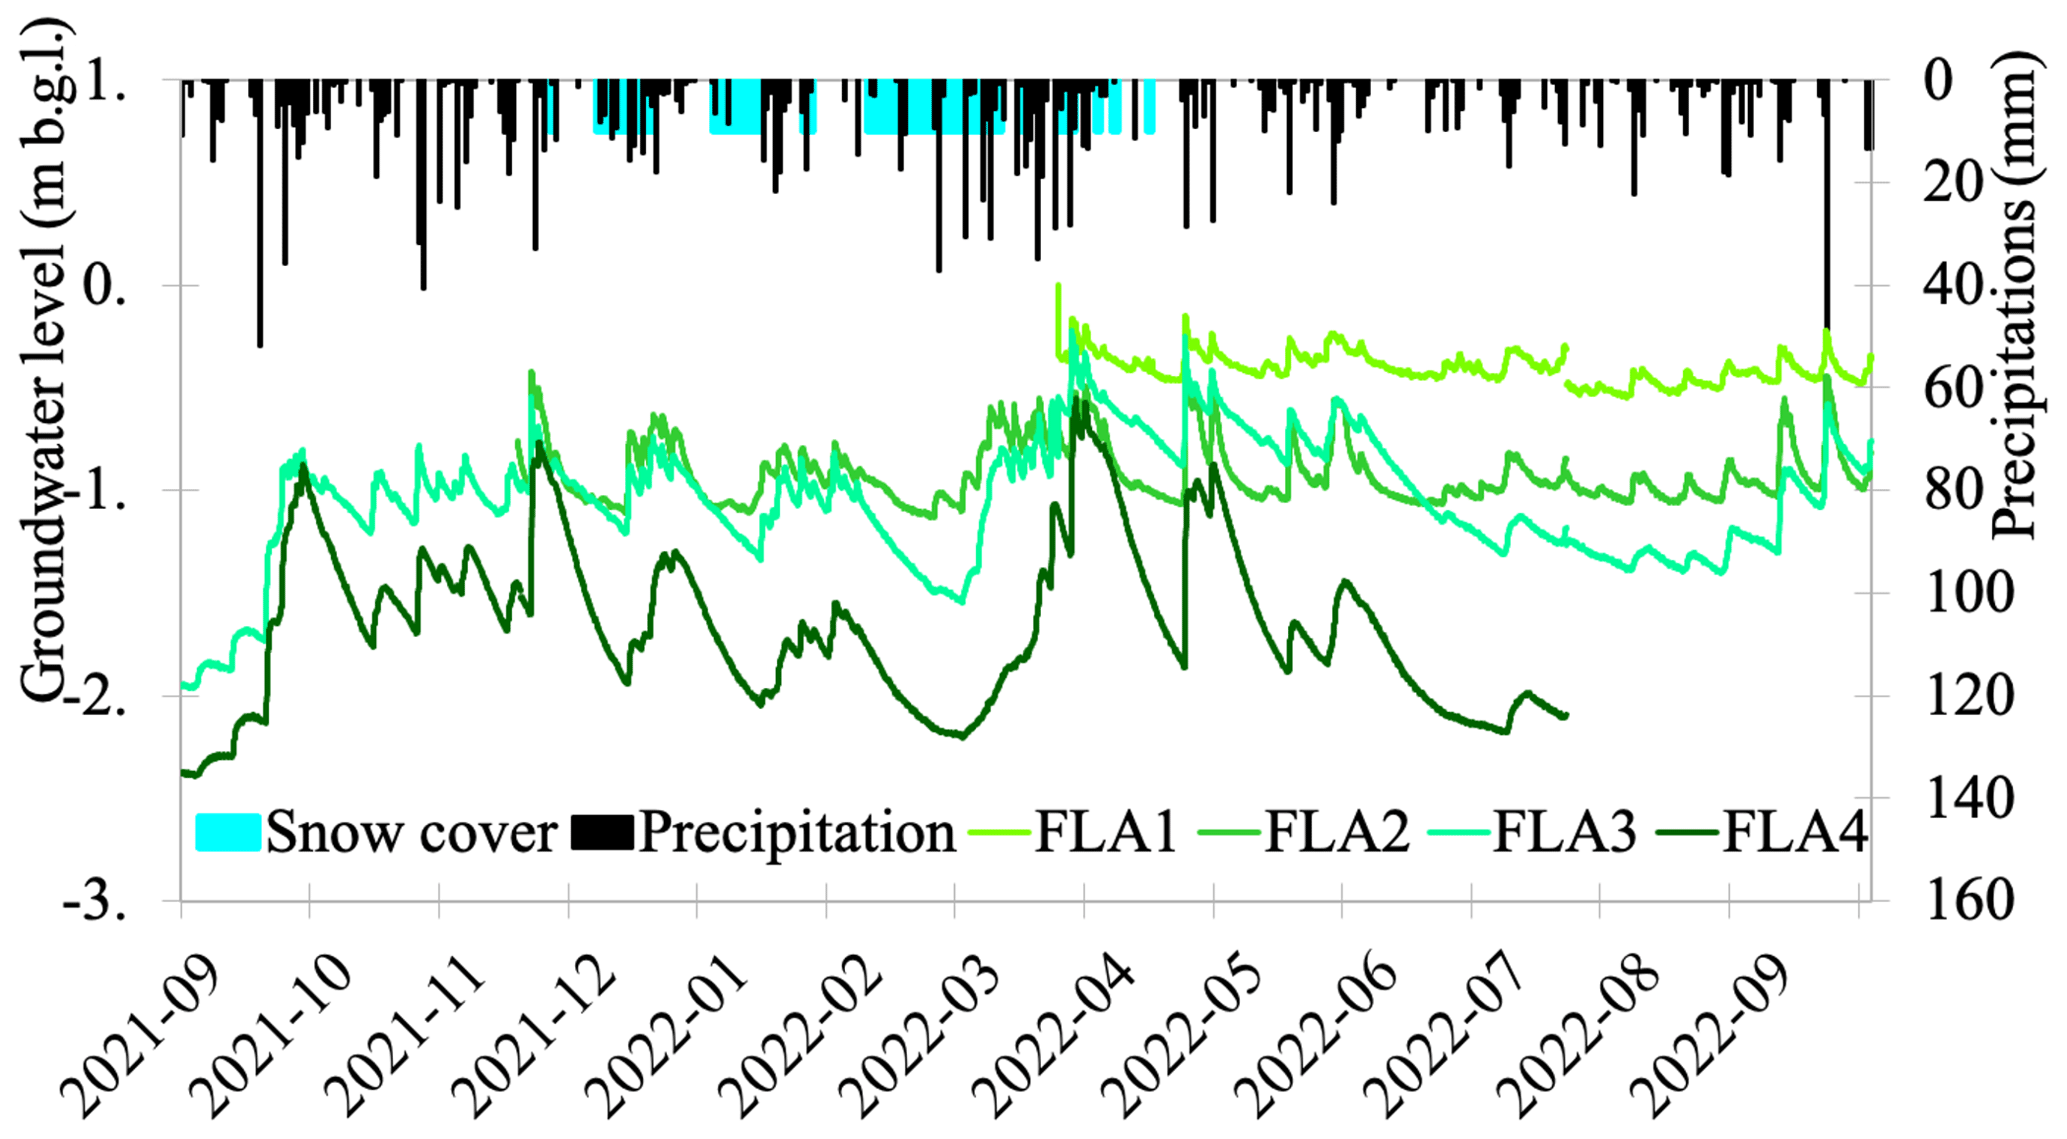
Figure 8Hourly evolution of the groundwater level (in m b.g.l.) in the till and glacio-fluvial-deposit aquifer south of Fláajökull from August 2021 to September 2022 (in the four new boreholes: FLA1, FLA2, FLA3, FLA4), daily precipitation (in mm) from Höfn weather station 705, and days with snow cover.
Depending on the location, the basalt aquifer can be unconfined (while it is outcropping) or confined (while it is covered by till and glacio-fluvial deposits); it can be of an artesian character at some locations. The groundwater level in the basalt aquifer varies from −42 m b.g.l. (below ground level) in HA13 (Fig. 9 – in a topography slope at the bottom of a basalt cliff) to the surface topography in some proglacial areas (ASK100 in Kálfafellsdalur valley, recurring artesian well, Fig. 3) and a recurring spring in the proglacial area between Skálafellsjökull and the coastline. In the proglacial areas, the confined parts of the basalt aquifer (HA16, ASK103 and ASK104, Fig. 9) show groundwater level variations with much smaller amplitudes (0.4 to 0.6 m) than in the unconfined parts (over 1 m in boreholes ASK102 and ASK105, Fig. 9). In the topography slopes at the bottom of the basalt cliffs, the amplitude of the variations is much larger (nearly 2 to 4 m, boreholes HA13 and HA12, Fig. 9). Uncertainties between manual and automatic probes are smaller than 6 cm for ASK013, ASK104 and HA16 and are of the order of 15 cm for ASK102, ASK105, HA12 and HA13.
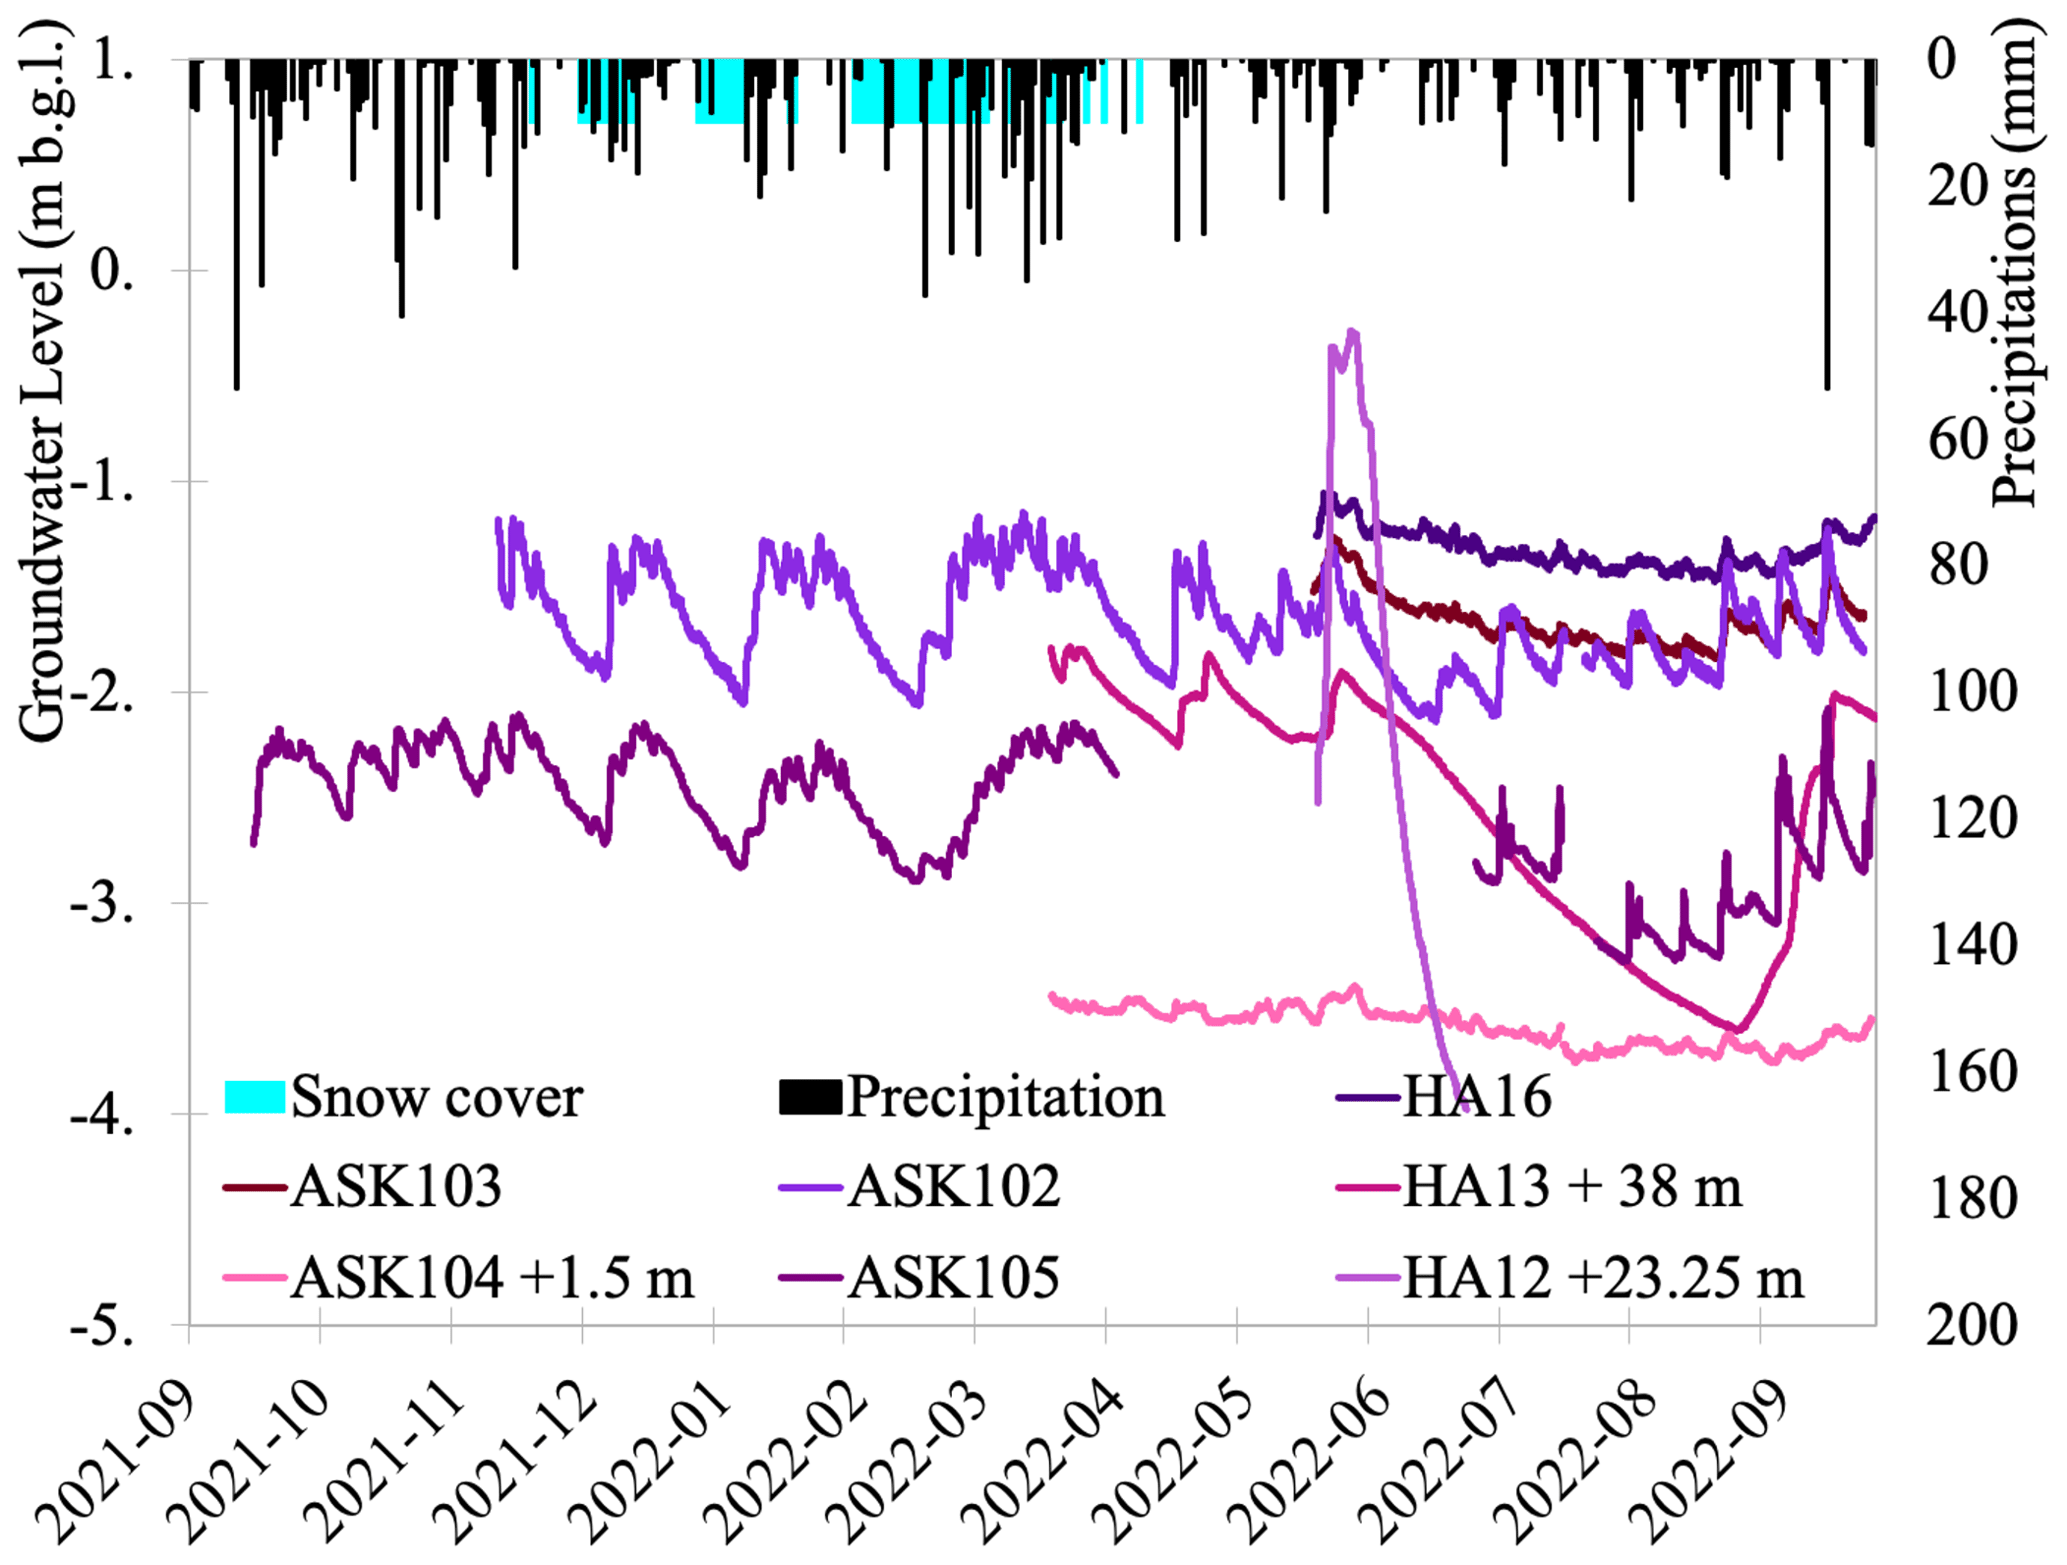
Figure 9Hourly evolution of the groundwater level (in m b.g.l.) in the basalt aquifer from September 2021 to September 2022 (five boreholes: ASK102, ASK103, ASK104, ASK105, HA16), daily precipitation (in mm) from Höfn weather station 705 and days with snow cover.
4.2.2 Temperature
Hourly temperatures were recorded in 10 boreholes – FLA2, FLA3 and FLA4 in the till and glacio-fluvial-deposit aquifer and ASK102, ASK103, ASK104, ASK105, HA12, HA13 and HA16 in the basalt aquifer (location in Fig. 3) – with an uncertainty smaller than 0.2 °C. In the till and glacio-fluvial-deposit aquifer, the temperature follows the trends of the atmospheric temperature, with a lag of about 6 weeks: the groundwater temperature decreases from September to March and increases from April to September, covering a range of 1–9 °C (Fig. 10). Several plateaus of temperature around 5 °C are visible in the FLA4 record (see Sect. 4.2.4 for interpretation). All the probes in the boreholes in the basalt aquifer at less than 10 m b.g.l. (all boreholes except HA13) display a narrow range of values, specifically 5–9 °C.
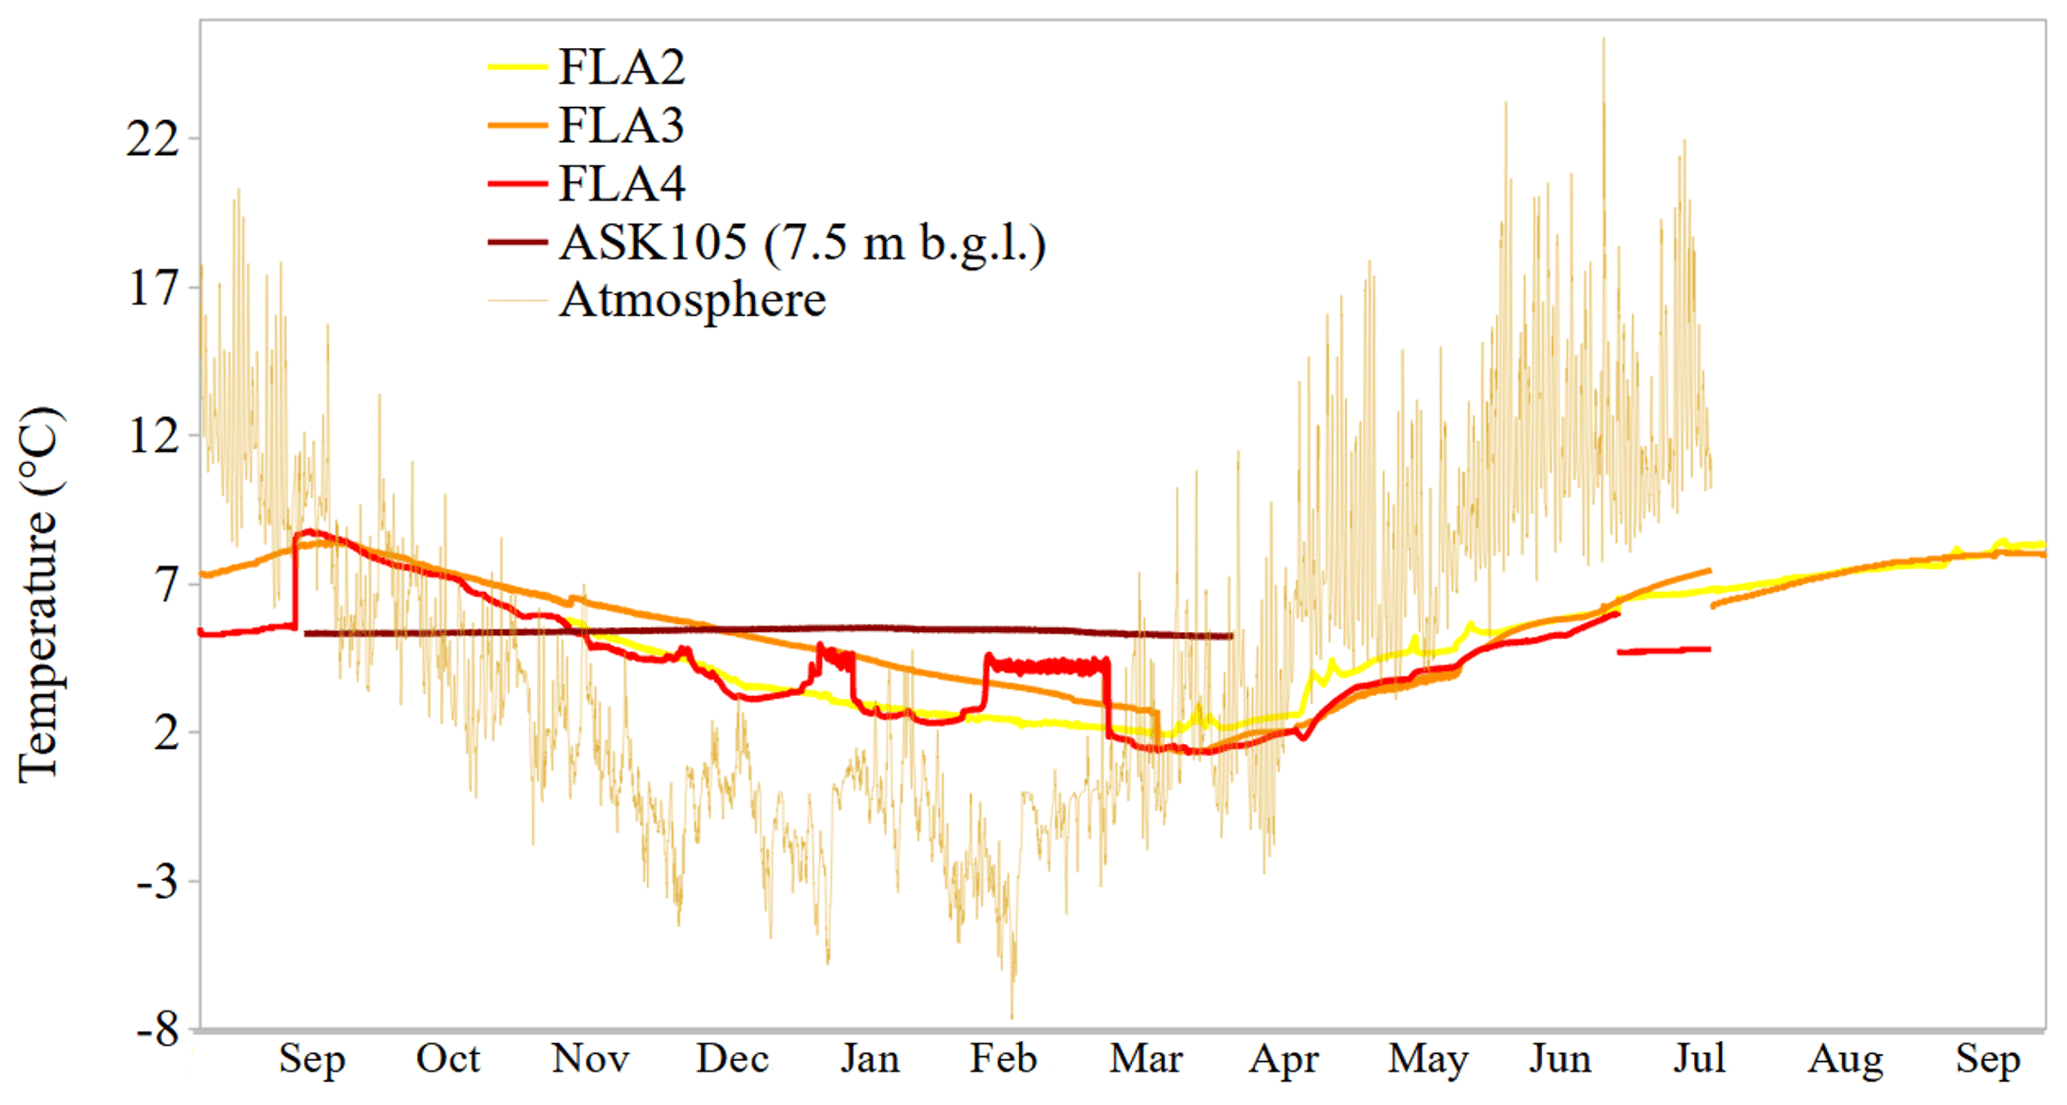
Figure 10Hourly temperature records from August 2021 to September 2022: in the till and glacio-fluvial-deposit aquifer in three boreholes (FLA2, FLA3, FLA4), in the basalt aquifer in one borehole (ASK105 at −7.5 m b.g.l.) and in the atmosphere (recorded by a Baro-Diver at the top of FLA4).
4.2.3 Electro-conductivity
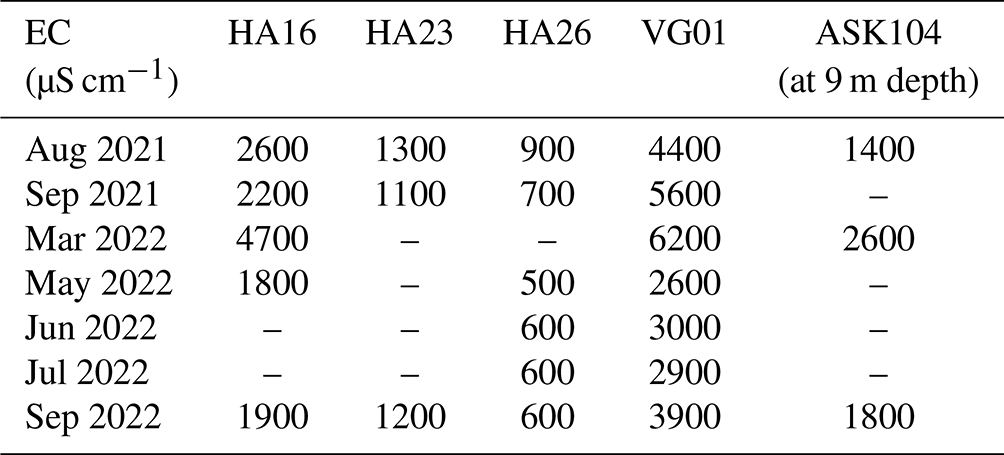
Water with an EC < 700 µS cm−1 is considered to be non-saline, an EC between 700 and 2000 µS cm−1 is considered to be slightly saline, and an EC between 2000 and 10 000 µS cm−1 is considered to be moderately saline (Rhoades et al., 1992). In Table 4, the recorded EC values are shown. Values above 700 µS cm−1 have been measured in three boreholes, listed by order of decreasing value: VG1, HA16 and HA23. Values measured in HA26 are just below or just over 700 µS cm−1. In ASK104, groundwater is completely fresh until −8 m b.g.l., but below that level, EC values are significantly above 700 µS cm−1. These boreholes are close to the coastline or a brackish lake connected to the sea (Fig. 3). The closer they are to one or the other, the higher their EC values are. EC has also been measured hourly in HA16 from May to September 2022: EC varies from 700 to 1850 µS cm−1 with regular cycles (a period of 24 h due to the tide and a period of 3 to 4 d).
Table 4Electro-conductivity (EC) values (µS cm−1) measured in boreholes in the study area from August 2021 to September 2022; – indicates that no measurement is available. For locations, see Fig. 3. Uncertainties ±100 µS cm−1.
4.2.4 Aquifer dynamics
In the studied area, groundwater flows towards the sea. Hydraulic gradients are deduced from the difference in groundwater levels between two boreholes on the same potential groundwater flow line. The estimated hydraulic gradient in the till and glacio-fluvial-deposit aquifer is approximately south of Fláajökull. The hydraulic gradient in the basalt aquifer is approximately 3.5/1000 south of Fláajökull, south of Skálafellsjökull and in Hali. The first two locations are representative of the hydraulic gradient in the downward part of the proglacial area, while the last location is representative of the hydraulic gradient in the upward part of the proglacial area (closest to the basalt cliffs).
The time evolution of the groundwater level in the till and glacio-fluvial-deposit aquifer (Figs. 8 and 9) shows clear recharge events by rainfall, snowmelt and glacial meltwater. Recharge by rainfall events occurs within 24 h of the precipitation event, at least when the rain is >10 mm. Snowmelt events are identified in February–March 2022 and also on a shorter timescale in January 2022. When the precipitation is snowfall and the snow cover lasts for more than 1 d, the lag between a snowfall precipitation event and the recharge of the groundwater is visible (Figs. 8 and 9), corresponding to the time that it takes for the snow to melt. In September the larger increase in the water level in borehole FLA3 (+0.54 m from 30 August to 21 September 2022) compared to in FLA2 and FLA1 (+0.21 and +0.11 m, respectively; Fig. 8) during the same period demonstrates additional recharge by glacial meltwater. Similarly, in the basalt aquifer (Fig. 9), the trend line of the water level in borehole ASK105 shows an increase of +0.40 m from 17 August to 19 September 2022 that cannot be accounted for only by the precipitation events during the same period. ASK105 is 4.2 km from the nearest glacier terminus; boreholes further away show a similar but smaller increase during the same period: ASK103 at 6.2 km from the terminus – +0.20 m, ASK102 at 7.4 km from terminus – +0.22 m and HA16 at 7.4 km from the terminus – +0.19 m.
Temperature data from the FLA4 borehole exhibit four plateaus (constant value over several days to a few weeks) of temperatures between 4.2 to 5.4 °C (Fig. 11). These plateaus correspond to every time the water level is lower than 24.1 m a.s.l. (Fig. 11). We interpret this plateau as an upward leakage from the basalt aquifer, triggered when the water level in the till and glacio-fluvial-deposit aquifer is lower than the piezometric level in the confined basalt aquifer. The fact that these plateaus occur during different periods of the year (September, December, January and February) demonstrates that groundwater level in the basalt aquifer must therefore be relatively constant over the period. The temperature measured in the basalt aquifer in ASK105 (1.6 km from FLA4), from 5 to 9 °C, corroborates that hypothesis.
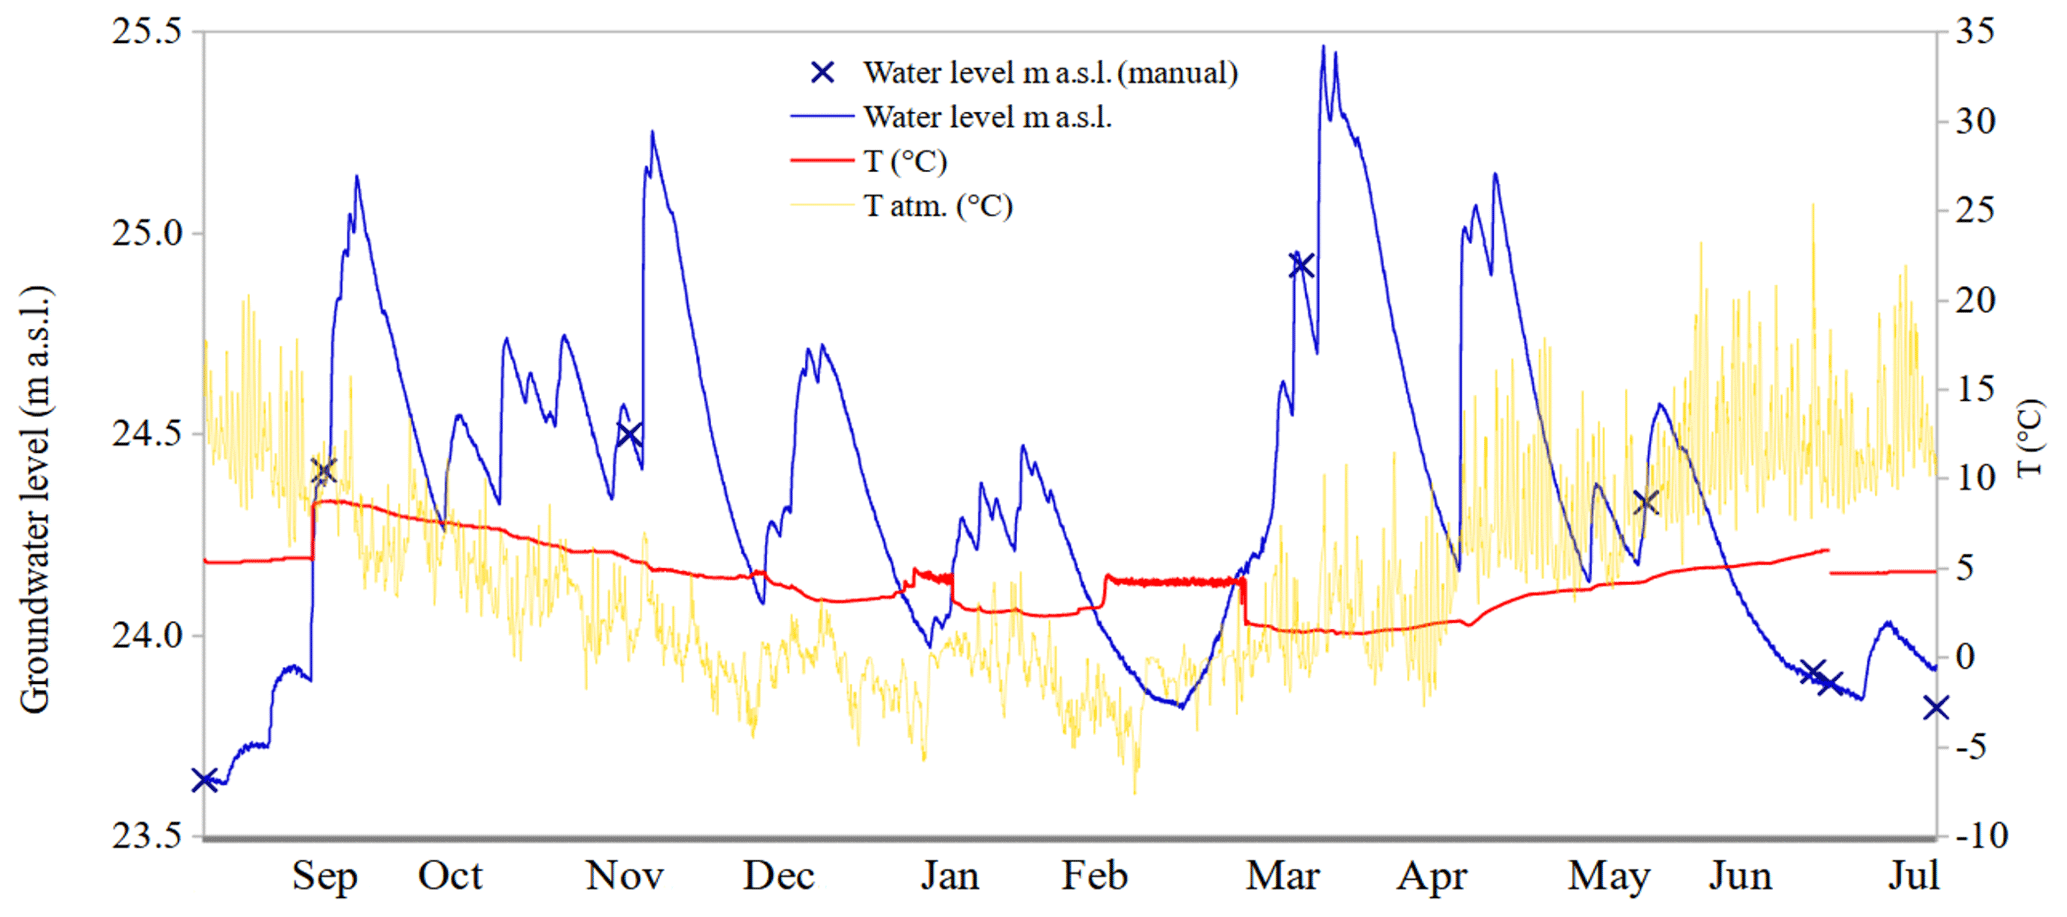
Figure 11Hourly groundwater level (in blue, m a.s.l.) and temperature (in red) in the borehole FLA4 and atmospheric temperature (in yellow, from the Baro-Diver probe) in borehole FLA4. The temperature chronicle exhibits plateaus around 5 °C at the end of August 2021 and in January, February and July 2022; each time, the groundwater level is lower than 24.1 m a.s.l.
The clear separation of both aquifers and the confined characteristics of the basalt aquifer observed in some locations lead us to hypothesize the presence of a much less permeable layer between the till and glacio-fluvial deposits and the basalt formation. It could be a clay layer or a more compacted till.
At the coastline, three hypotheses can be made for the fresh–marine groundwater interface for each aquifer: equilibrium around the coastline, fresh groundwater pushing the interface offshore or marine intrusion inland. The few data acquired on the EC of the groundwater (high EC values near the coastline, Table 4) suggest a potential seawater intrusion in the basalt aquifer. For the till and glacio-fluvial aquifer, we expect that some fresh groundwater is flowing into the sea as this aquifer is unconfined and in direct connection with the sea.
4.3 Recharge rate estimation
We will first detail the amounts of available water for surface flow and groundwater recharge in the subglacial and the proglacial areas, providing an upper limit for the recharge rates towards the aquifers.
4.3.1 Estimation of subglacial water flows and spatial distribution
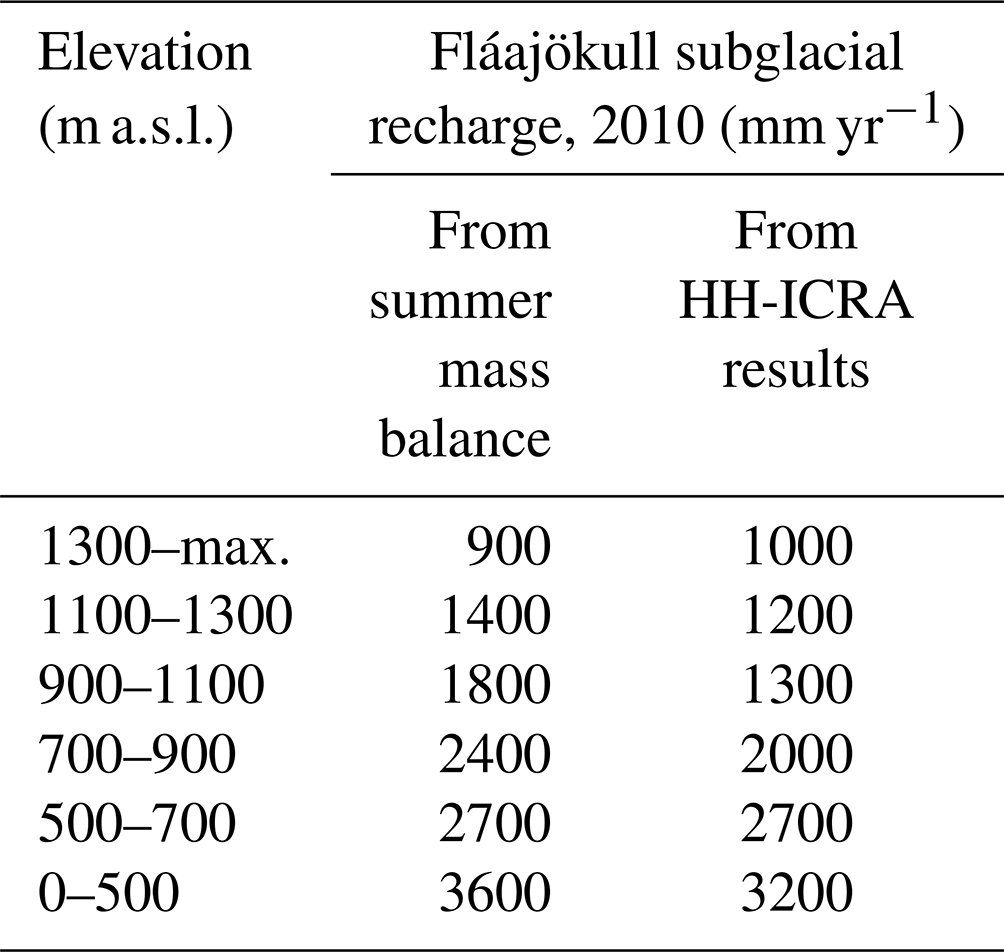
Combining all the data, we concluded that the available water for surface flow and subglacial recharge in the subglacial area (Table 5) is, on average, 4000 mm yr−1. During the period 2010–2016, the average available water quantities on each glacier, obtained from the combination of the HH-ICRA results or the summer mass balance with the effective rainfall, are very similar for Fláajökull, and for Skálafellsjökull and Heinabergsjöklar, the HH-ICRA results give 10 % higher values, but these are significantly higher for Breiðamerkurjökull by 22 % (Table 5). The subglacial recharge is highly seasonally variable and peaks in July and August (Fig. 12). An example of the elevation dependence of the available subglacial water is shown in Table 6. As can be expected, there is much more available subglacial water at the lowest elevation of the glaciers for both data sets. The subglacial recharge thus varies both temporally and spatially, and the available data and results allow us to account for that.
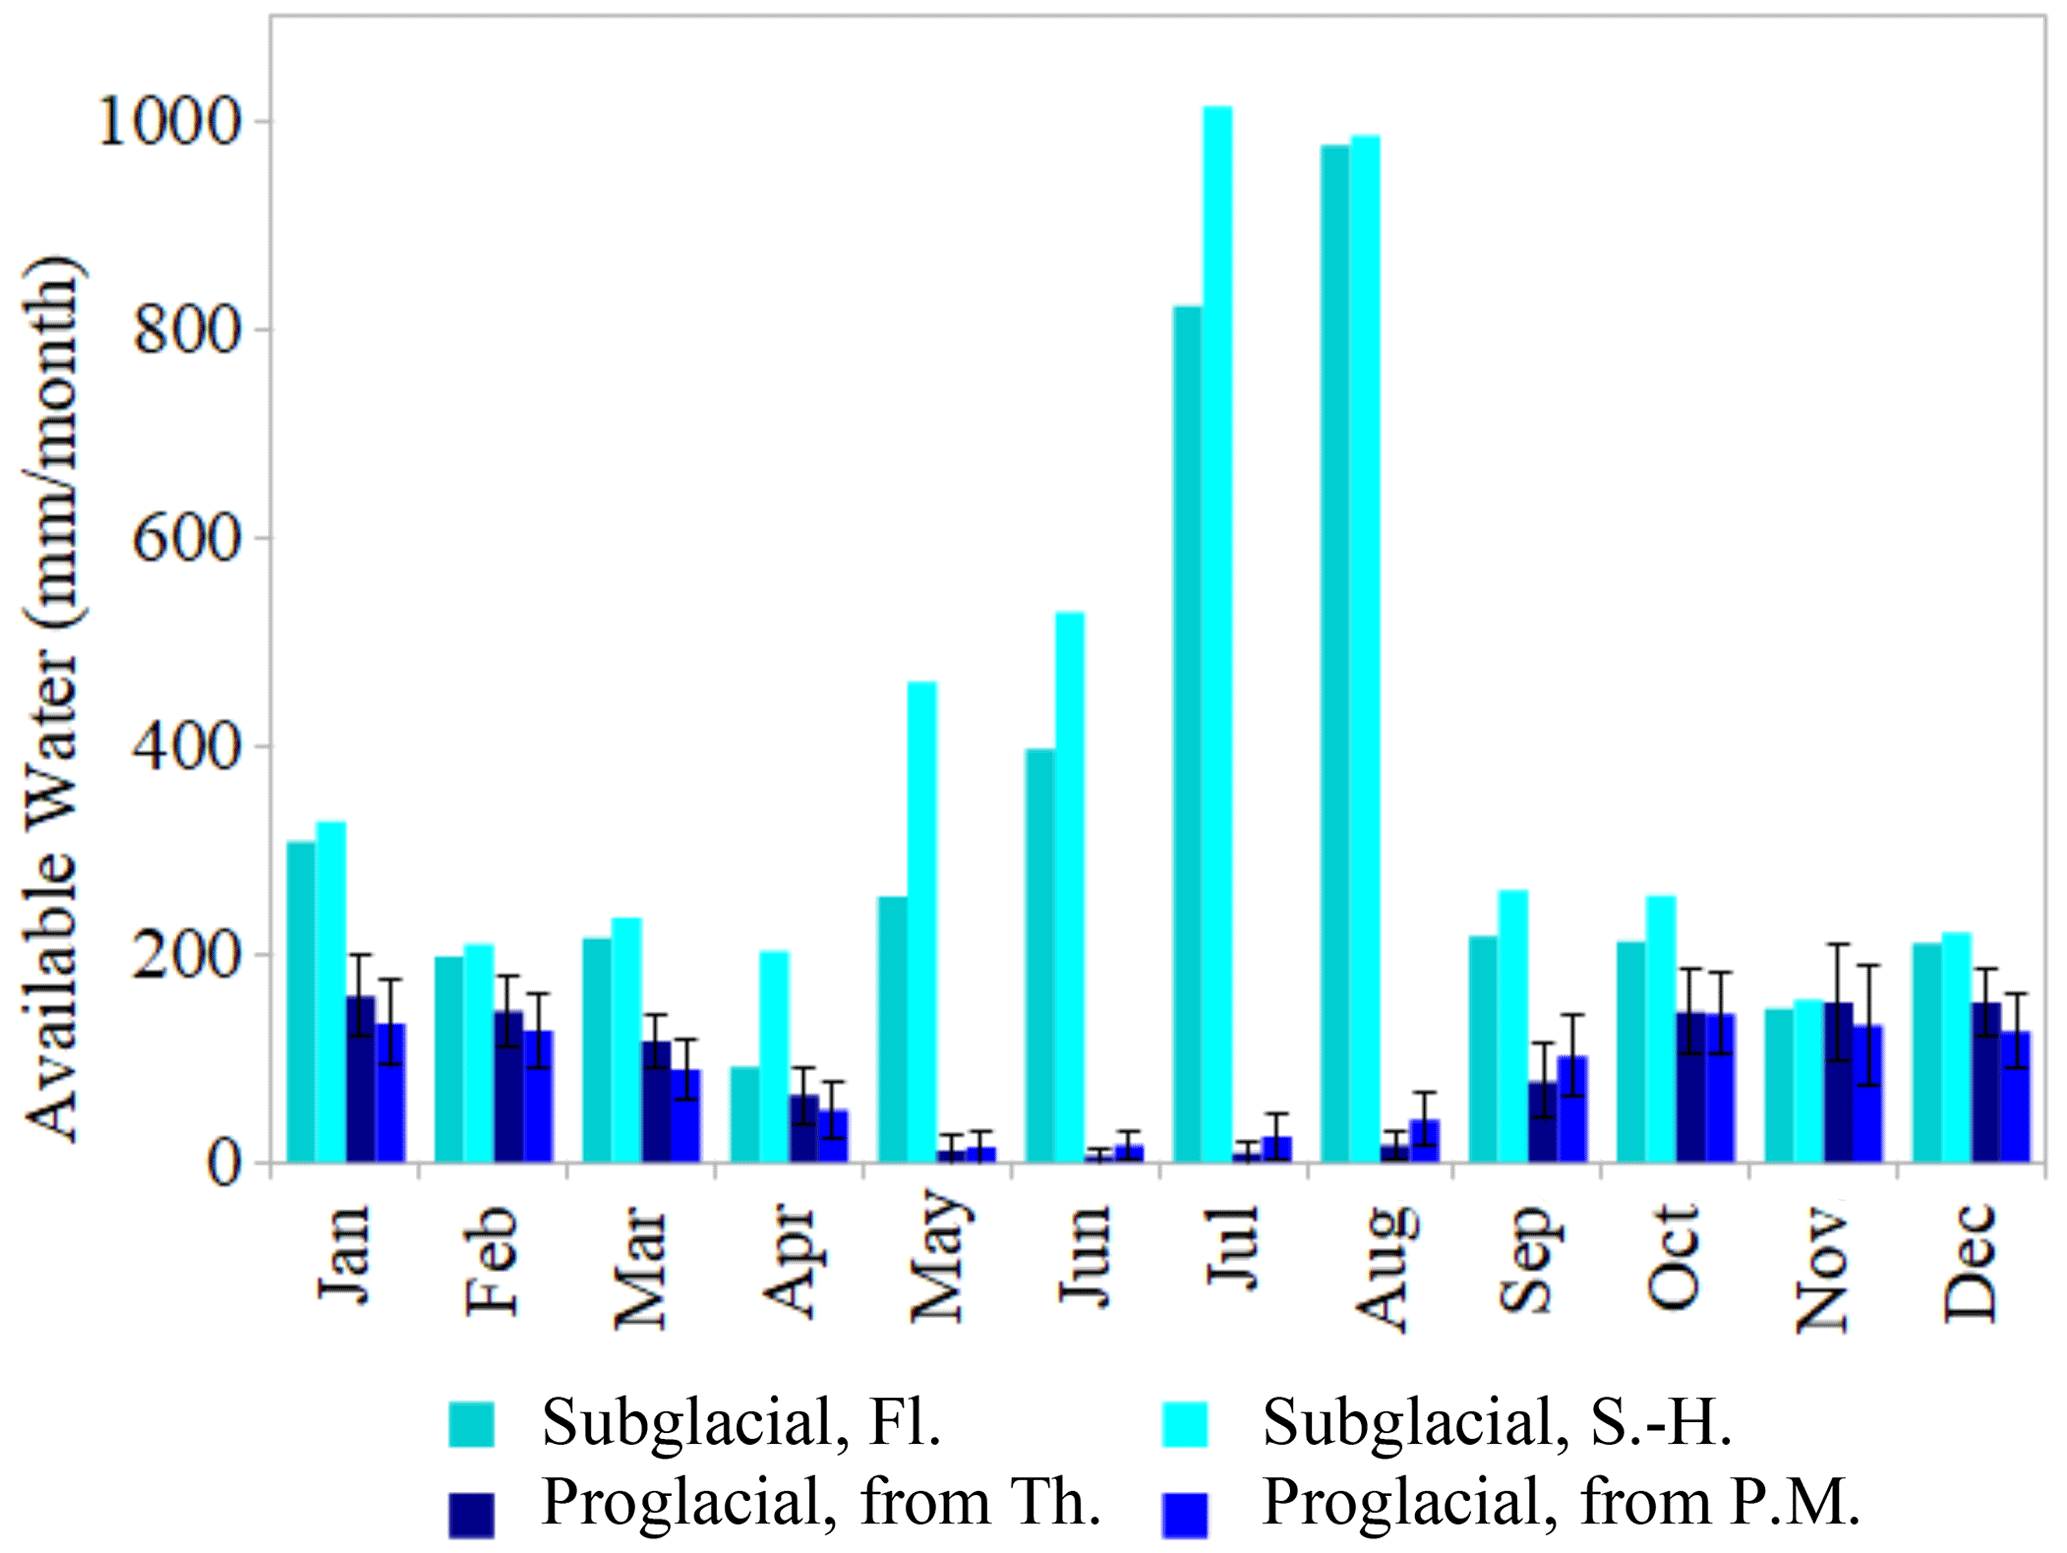
Figure 12Monthly mean available water in the subglacial area and the proglacial area: (i) in the subglacial area, the values result from the estimated melt (from HH-ICRA 2012 projected with the 2021 total summer mass balance) and the effective rainfall for Fláajökull (Fl.) and Skálafellsjökull–Heinabergsjöklar (S.-H.); (ii) in the proglacial area, the values are averaged over 1990–2021, calculated from monthly precipitation data (from combined Höfn weather stations) and monthly potential evapotranspiration calculated with the Thornthwaite method (Th., monthly standard deviation between 30 and 192 mm) and with the Penman–Monteith method (P.M., monthly standard deviation between 54 and 228 mm); see Table 5 for the elevation-dependent subglacial available water (mm yr−1) estimated from summer mass balances and HH-ICRA results. We provide an example of 1 year (2010) for one glacier (Fláajökull) to provide insight into the variability of the subglacial available water rates with the elevation.
Table 5Available water for surface flow and subglacial water available (mm yr−1), estimated from (i) summer mass balance measurements (field data, IES Glaciology group) and effective rainfall and (ii) HH-ICRA results (Schmidt et al., 2020) and effective rainfall for each outlet glacier considered.
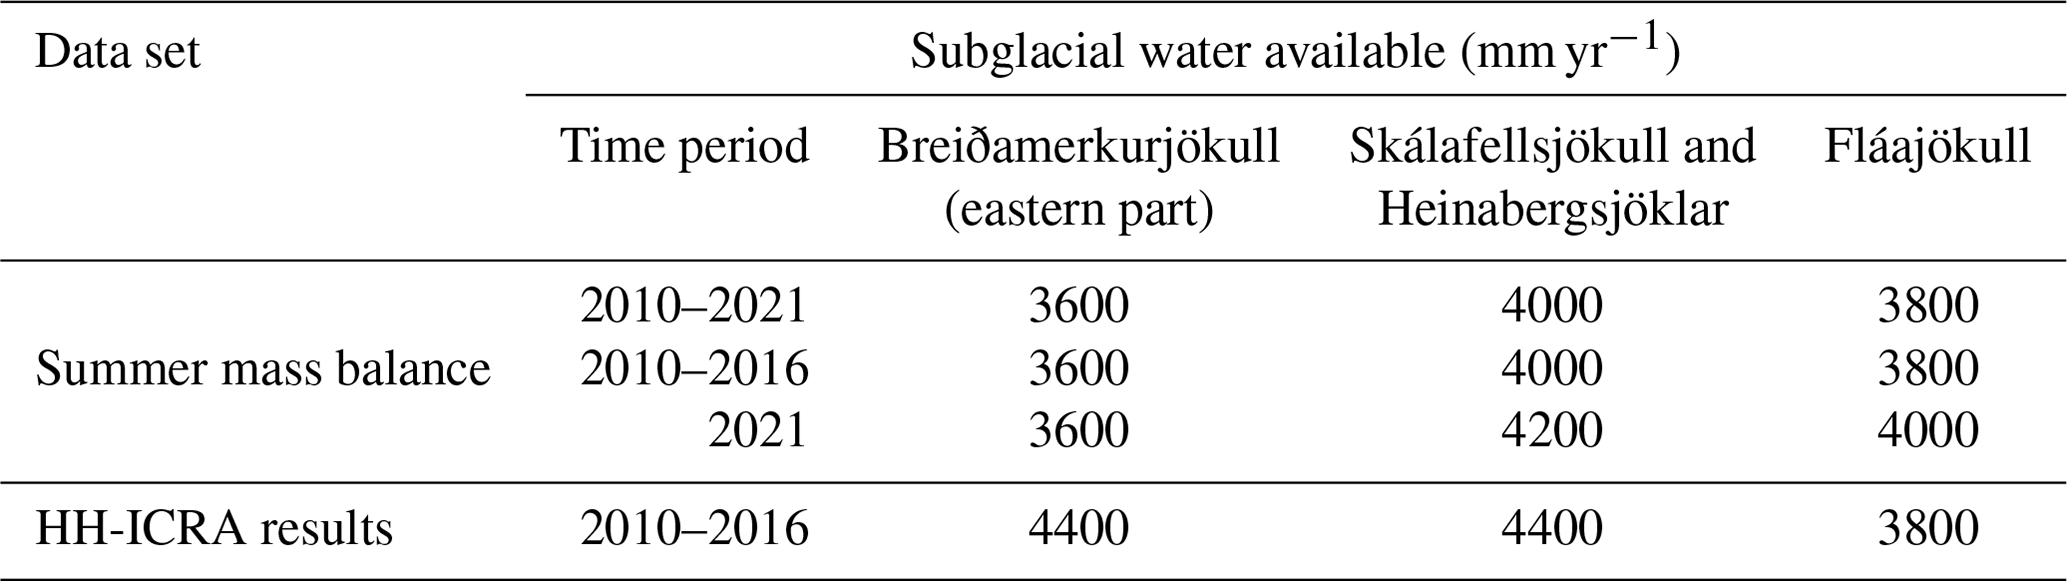
Table 6Subglacial recharge rates to the aquifers (mm yr−1) according to the elevation, estimated from summer mass balances and HH-ICRA results. We give an example of 1 year (2010) for one glacier (Fláajökull) to provide insight into the variations of the recharge rates with the elevation.
4.3.2 Estimated effective rainfall in the proglacial area
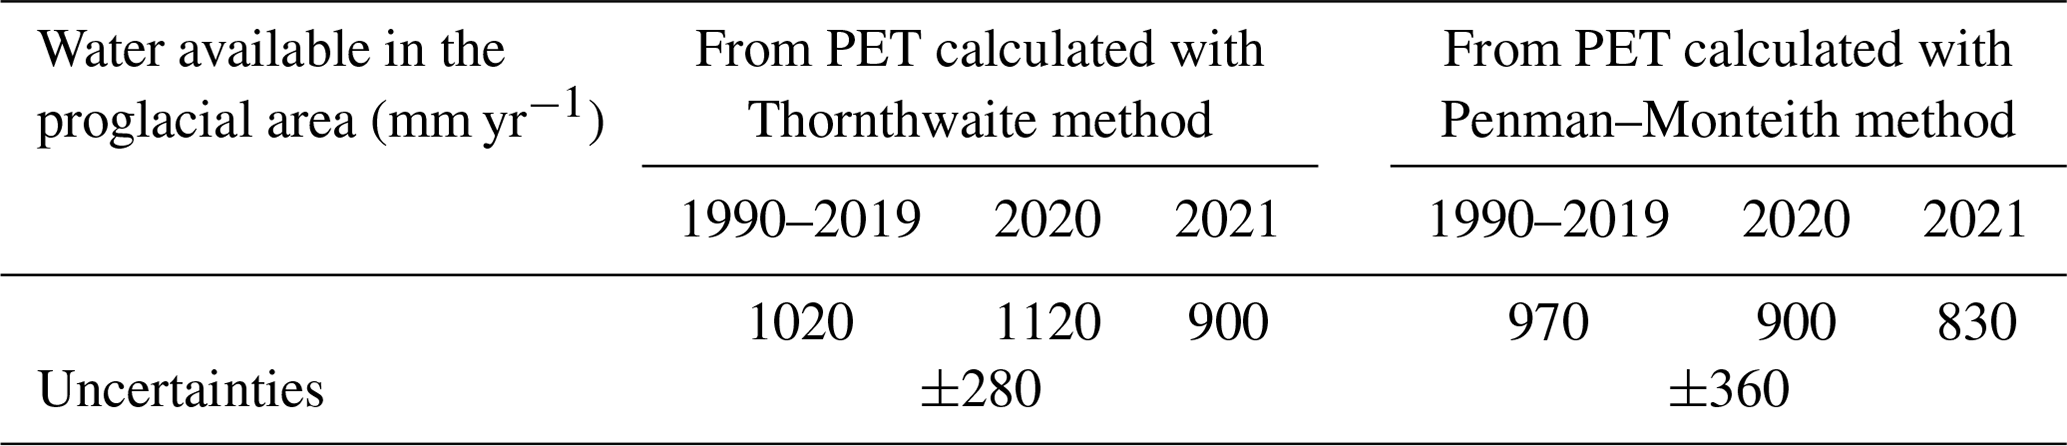
The total effective rainfall, based on the PET calculated with the Thornthwaite method (Table 7), has increased by 165 mm (from 975 to 1140) since 1990, following the precipitation trend (Fig. 4).
Table 7Effective rainfall or available water (mm yr−1) in the proglacial area (between the glacier's terminus and the coastline) for both surface runoff and recharge to the aquifers.
The monthly variation in the effective rainfall, based on the PET calculated from 1990 to 2021, shows that several months in each year have no effective rainfall at all (PET with Thornthwaite method: 2–5 months, very rarely none; PET with Penman–Monteith method: 1–4 months, very rarely 0 or 5 or 7 months). Months with no effective rainfall are, most of the time, between April and August. These months have an interannual average of effective rainfall < 30 mm. The winter months, October to March, all have an average effective rainfall > 100 mm, with a maximum in January and February.
In the proglacial area, the interannual average hydrological balance in the period 1990–2021 is the following: 1540 mm (±310 mm) of precipitation, 520 mm (±80 mm) of evapotranspiration (both methods used), and 1000 mm (±300 mm) of water available for both surface runoff and for recharge to the aquifers.
Step by step, the compilation of available data and the collection of new data are leading to a better understanding of the role of groundwater in the water cycle of glacierized catchments. It is now possible to quantify the complete water balance and the amount of subglacial and proglacial recharge to the aquifers.
In the subglacial area, the subglacial recharge to the aquifers can represent 50 % of the glacial melt, with a range of 50 % (i.e., 25 %–75 % of the glacial meltwater). This ratio is in the order of magnitude of the one deduced from a 2012–2013 surface runoff data set (Young et al., 2015). In this study, a 67.3 km2 catchment of the glacier is studied, with daily surface runoff measurements in a 500 m downstream river south of Skálafellsjökull. The surface runoff measured and extrapolated (for days without data) accounts for 50 % (±10 %) of the volume of ice melt during the same period.
Table 8Recharge to the aquifers (mm yr−1) in the proglacial area (between the glacier terminus and the coastline), estimated from the effective rainfall, and in the subglacial area, estimated (i) from summer mass balances (field data, IES Glaciology group) and effective rainfall and (ii) from HH-ICRA results (Schmidt et al., 2020) and effective rainfall. Note that calc. means calculated.
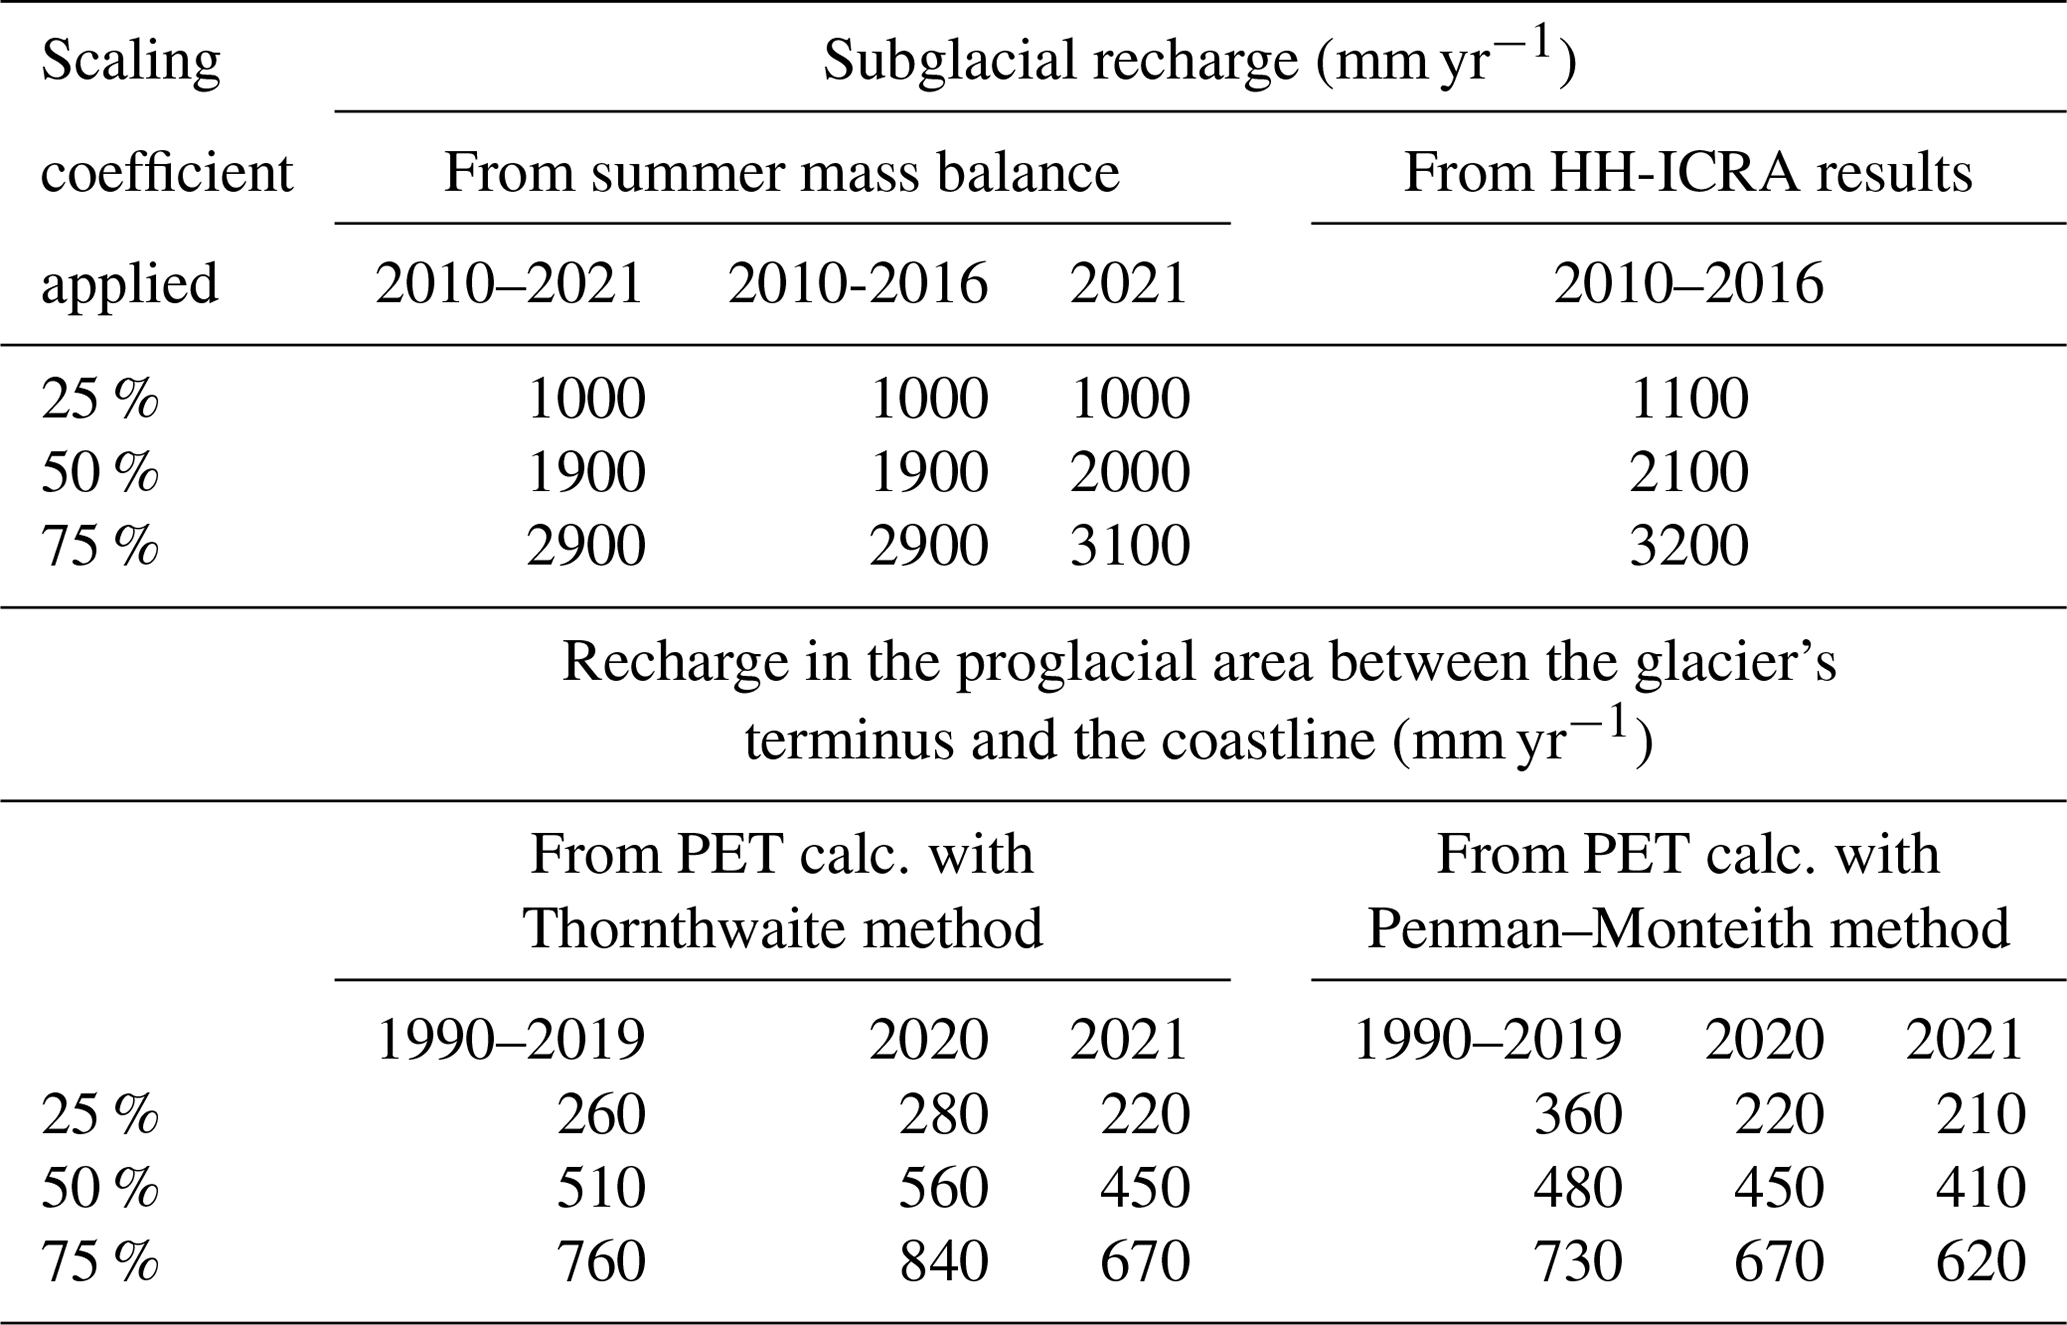
Between the glacier terminus and the coastline (i.e., in the proglacial area), to quantify the recharge to the aquifers, we now have the maximum possible amount (i.e., the effective rainfall). As the first approximation, the scaling coefficient of 0.5 (with a range of 0.25 to 0.75) is applied to the effective rainfall. This is based on field observations (important surface runoff) and is used in the absence of surface flow records, allowing a more accurate estimation (Table 8). The interannual average hydrologic balance in 1990–2021 for the proglacial area can thus be detailed as follows: 1540 mm (±310 mm) of precipitation, 520 mm (±80 mm) of evapotranspiration (both methods used), 500 mm (±150 mm) of runoff and 500 mm (±150 mm) of recharge to the aquifers.
The subglacial recharge rate is estimated based on available data to be, on average, 2000 mm yr−1, and in the proglacial area, it is estimated to be 500 mm yr−1 (Table 8). Thus, our estimates indicate that the subglacial recharge is about 4 times higher than the one in the proglacial area, which is consistent with studies claiming a high recharge of the till and glacio-fluvial-deposit aquifer by the melting of the glaciers (Sigurðsson, 1990; Xiang et al., 2016) while offering additional quantitative comparison. Following the patterns of the available water for both subglacial runoff and groundwater recharge (see Fig. 12 and Table 6), the subglacial recharge is highly seasonally variable (Fig. 12). It is much higher under the lowest elevation of the glaciers (Table 6).
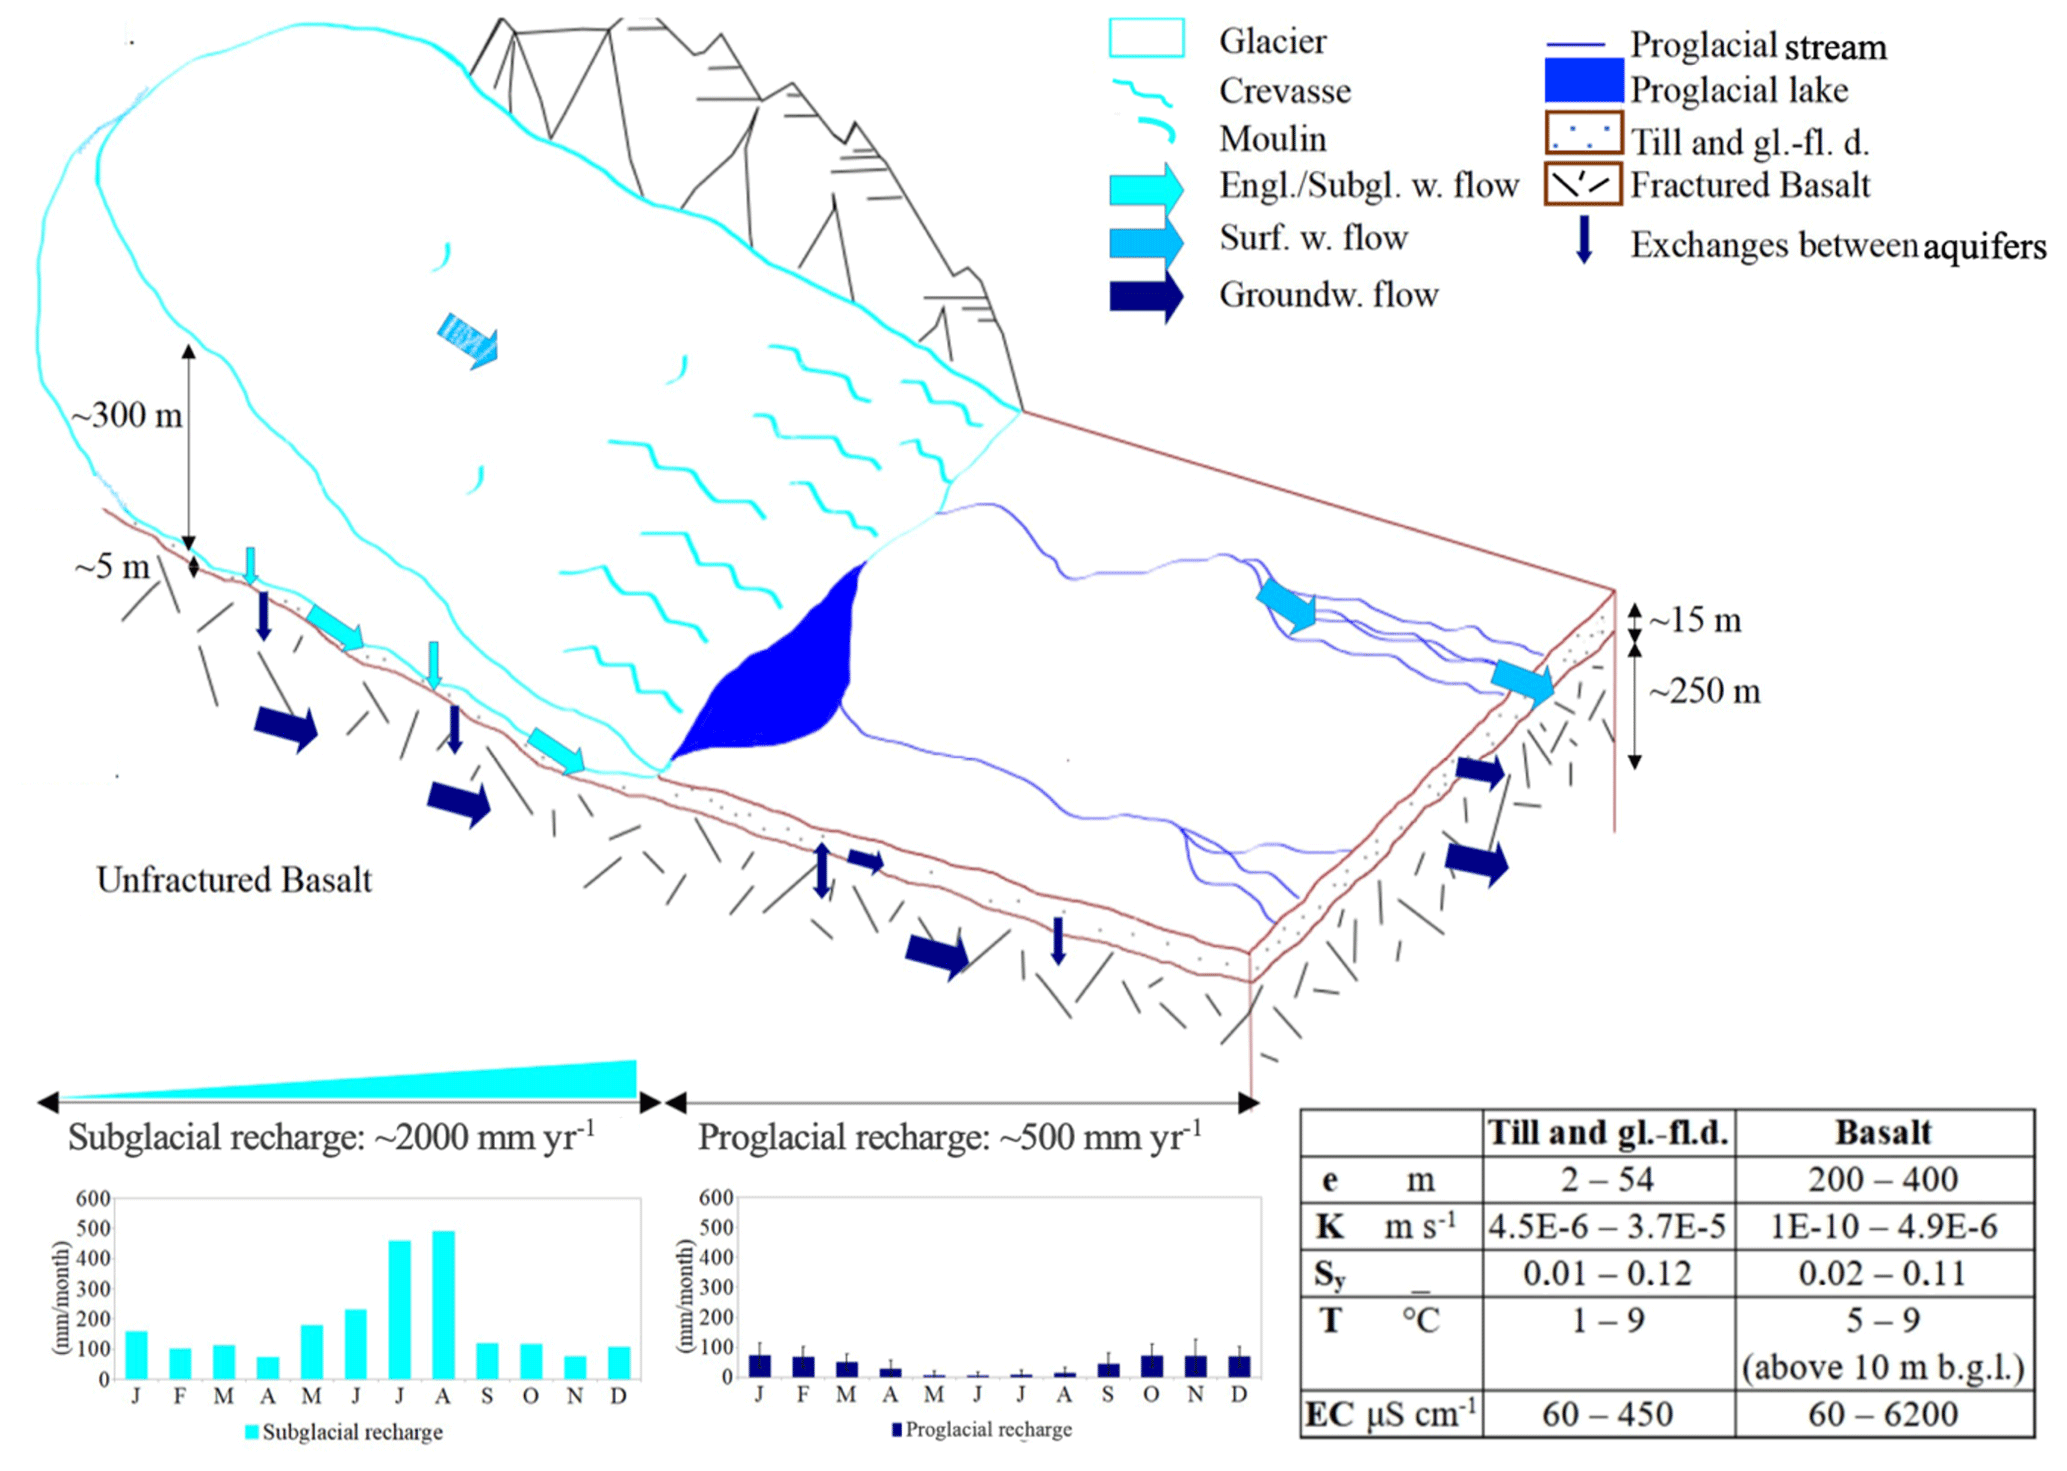
Figure 13Conceptual model of the groundwater dynamic in glacierized catchments such as those observed at Fláajökull, Heinabergsjökull and Skálafellsjökull. The model is based on all the data presented in this paper. A glacier is at the head of the catchment, along with the two geological formations underlying it and at its front: the till and glacio-fluvial deposits and the basalt formation. Average characteristics of the hydrogeological formations are described, along with their spatial (e, K, Sy) and seasonal (T, EC) variability, as well as their recharge rates (subglacial and on the proglacial area) and their monthly variability. Arrows express the groundwater dynamic. Note that subgl. means subglacial, w. means water, surf. means surface, groundw. means groundwater, and gl-fl d. means glacio-fluvial deposits.
The conceptual model of the groundwater dynamic characteristics in glacierized catchments derived from all the analyzed data is presented in Fig. 13. A glacier with crevasses and moulins that provide pathways for the surface meltwater to the subglacial water system is presented, along with the two geological formations underlying it and at its front: the till and glacio-fluvial deposits and the basalt formation. The average characteristics of the hydrogeological formations are described along with their spatial variability (thickness, hydraulic conductivity, specific yield) and/or seasonal variability (temperature, electrical conductivity). The subglacial recharge and recharge in the proglacial area are quantified, and their monthly variability is shown in the bottom graphs of Fig. 13. The groundwater flow is indicated with arrows. The water enters the basin as precipitation, immediately joining the hydrologic and hydrogeological system if there is rainfall or joining it with a delay through melted snow and melted ice. Both the surface and groundwater flows are towards the coast. Exchanges between the subglacial hydrology network and the till and glacio-fluvial aquifer occur; exchanges also occur between the surface hydrology network and the till and glacio-fluvial aquifer. Both downward (recharge) and upward (leakage) exchanges occur between the tills and glacio-fluvial aquifer and the basalt aquifer.
Thanks to the new data sets presented in this paper, acquired notably for the groundwater compartment, along with their analysis, it was possible to design a new conceptual model of glacio-hydrogeological behavior in glacierized catchments.
We have identified two different aquifers, one in the till and glacio-fluvial deposits and one in the basalts, with different hydrodynamic behaviors, using the geological map and the measurements in the boreholes of the new observation network established. For the till and glacio-fluvial-deposit aquifer, we estimated a hydraulic gradient of 4 to and one of 3 to for the basalt aquifer. By the borehole FLA4, which is closest to the glacier's terminus, when the water level in the till and glacio-fluvial-deposit aquifer is lower than the piezometric level in the basalt aquifer, a vertical upward leakage from the basalt aquifer takes place.
We have calculated the hydraulic conductivities and specific yields of both aquifers from field measurements: (i) till and glacio-fluvial deposits – K ∈ [–] m s−1, Sy ∈ [0.01–0.12], and (ii) basalt aquifer – K ∈ [–] m s−1, Sy ∈ [0.02–0.11]. These compare well with the values extracted from the scientific literature (Fig. 11 and Table 7). For the K of the basalt aquifer, there is a much narrower range than in the literature; however, the values we have gathered are not sufficient to determine the spatial variability.
We have obtained a comprehensive water balance for the whole glacierized catchment from the estimation of the water available for surface runoff and recharge of the aquifer system both under the glacier and in the proglacial area. Recharge under the glacier is estimated to be about 4 times higher than the one on the proglacial area, which is consistent with studies claiming a high recharge of the till and glacio-fluvial-deposit aquifer by the melting of the glaciers. The subglacial recharge shows large variability with the season (for 2021 – maximum in July and August, about 480 mm per month, and minimum in April and November, about 80 mm per month) and with the elevation (highest at the lowest glacier elevation at 3400 mm yr−1 in 2010 and lowest at the highest elevation at less than 1000 mm yr−1 in 2010).
Several unknowns remain: (1) the saturation of the till and glacio-fluvial deposits and basalt formations under the glacier is to be determined. (2) The presence of a clay layer or compacted till between the subglacial till and the basalt on the subglacial area and between the till and glacio-fluvial deposits and the basalt formation on the proglacial area is to be confirmed. It would explain the separation of the two aquifers and the confined character (even the artesian one) of the basalt aquifer observed in some locations. (3) Regarding the connection of the discharge in the aquifers with the ocean, we expect that some fresh groundwater from the till and glacio-fluvial deposits is flowing into the ocean, for which a hydrogeological numerical model is required to calculate an estimate of the groundwater flux to the sea. A numerical model would also help to test the hypothesis of a slight seawater intrusion into the basalt aquifer.
We are thus developing numerical hydrogeological models that will allow further assessments of the unknowns. Manual and automatic groundwater level measurements are to be continued for several years. Eventually, to further explore the potential feedback of the groundwater system on the glacier dynamics, a coupling of a glaciological model and the hydrogeological model would be necessary.
As demonstrated, subglacial recharge to aquifers is significant for warm-based glaciers lying on sediments and/or fractured bedrock. It is thus important to include the groundwater component to evaluate accurately the water balance of glacierized catchments and to evaluate the impact of glacier melting under climatic change on natural hazards such as landslides, floods or severe droughts.
All new data acquired for this paper and described in Sect. 4 are openly available, without any restrictions and along with the associated metadata, on the Zenodo repository. The slug test data can be found at https://doi.org/10.5281/zenodo.7716507 (Vincent et al., 2023a). The IceAq Groundwater Hourly Data are available at https://doi.org/10.5281/zenodo.7716453 (Vincent et al., 2023b). The IceAq Groundwater Monthly Manual Data are available at https://doi.org/10.5281/zenodo.7716362 (Vincent et al., 2021).
AV devised the project. AV planned the field work and carried it out, along with CD, OF, SV, GA and SG. JH provided data from the fieldwork carried out in 2012–2013. FP provided summer mass balance data. AV, CD and OF treated the data. AV, SV, GA, CD and OF contributed to interpreting the results. AV wrote the paper, with support from SV and critical feedback from all the authors.
Publisher's note: Copernicus Publications remains neutral with regard to jurisdictional claims made in the text, published maps, institutional affiliations, or any other geographical representation in this paper. While Copernicus Publications makes every effort to include appropriate place names, the final responsibility lies with the authors.
Michael Pettersson is thanked for the field work assistance from May 2021 to September 2022. Haukur Ingi Einarsson from Glacier Adventure in Hali is thanked for his help with the groundwater level data acquisition. Maud Bernat is thanked for the field assistance in June 2022. Finally, several farmers are thanked for the access to their land. The authors acknowledge Christophe Cudennec, Xuegao Chen and two anonymous reviewers for their constructive comments on previous versions of the paper.
The IceAq project has received funding from the European Union's Horizon 2020 research and innovation program under the Marie Skłodowska-Curie grant agreement no. 951732. Extra support was received from Campus France PHC Jules Verne funding (French–Icelandic partnership, grant agreement no. 48330SL), two Erasmus+ grants and a PSL-Global Seed grant.
This paper was edited by Zhongbo Yu and reviewed by Xuegao Chen, Christophe Cudennec, and two anonymous referees.
Aðalgeirsdóttir, G., Magnússon, E., Pálsson, F., Thorsteinsson, T., Belart, J. M. C., Jóhannesson, T., Hannesdóttir, H., Sigurðsson, O., Gunnarsson, A., Einarsson, B., Berthier, E., Schmidt, L. S., Haraldsson, H. H., and Björnsson, H.: Glacier Changes in Iceland From ∼1890 to 2019, Front. Earth Sci., 8, 523646, https://doi.org/10.3389/feart.2020.523646, 2020.
Anon: Anonx 0.0.0.dev1, A python library with tools, created by: Batu, M. T., Python Brochure vol. 1, Python Software Foundation, https://pypi.org/project/anonx/ (last access: 23 July 2024), 2022.
Arnalds, Ó.: Soil Survey and Databases in Iceland, Eur. Soil Bur. Res. Rep., 91–96, https://esdac.jrc.ec.europa.eu/ESDB_Archive/eusoils_docs/esb_rr/n06_soilresources_of_europe/PDF/ICE04.pdf (last access: 25 July 2024), 1999.
Arnalds, O.: The Soils of Iceland, Springer Netherlands, Dordrecht, 193 pp., https://doi.org/10.1007/978-94-017-9621-7, 2015.
Arnórsson, S.: Geothermal systems in Iceland: Structure and conceptual models – I. High-temperature areas, Geothermics, 24, 561–602, https://doi.org/10.1016/0375-6505(95)00025-9, 1995.
Bengtsson, L., Andrae, U., Aspelien, T., Batrak, Y., Calvo, J., de Rooy, W., Gleeson, E., Hansen-Sass, B., Homleid, M., Hortal, M., Ivarsson, K.-I., Lenderink, G., Niemelä, S., Nielsen, K. P., Onvlee, J., Rontu, L., Samuelsson, P., Muñoz, D. S., Subias, A., Tijm, S., Toll, V., Yang, X., and Køltzow, M. Ø.: The HARMONIE–AROME Model Configuration in the ALADIN–HIRLAM NWP System, Mon. Weather Rev., 145, 1919–1935, https://doi.org/10.1175/MWR-D-16-0417.1, 2017.
Björnsson, H.: The glaciers of Iceland, Atlantis Press, Amsterdam, the Netherlands, 613 pp., ISBN 978-94-6239-206-9, 2017.
Björnsson, H. and Pálsson, F.: Radio-echo soundings on Icelandic temperate glaciers: history of techniques and findings, Ann. Glaciol., 61, 25–34, https://doi.org/10.1017/aog.2020.10, 2020.
Björnsson, H., Palsson, F., Gudmundsson, M. T., and Haraldsson, H. H.: Mass balance of western and northern Vatnajökull, Iceland, 1991–1995, Jökull, 45, 35–38, 1998.
Björnsson, H., Pálsson, F., Gudmundsson, S., Magnússon, E., Adalgeirsdóttir, G., Jóhannesson, T., Berthier, E., Sigurdsson, O., and Thorsteinsson, T.: Contribution of Icelandic ice caps to sea level rise: Trends and variability since the Little Ice Age: Mass Loss From Icelandic Ice Caps, Geophys. Res. Lett., 40, 1546–1550, https://doi.org/10.1002/grl.50278, 2013.
Bogadóttir, H., Boulton, G. S., Tómasson, H., and Thors, K.: The structure of the sediments beneath Breiðamerkursandur and the form of the underlying bedrock, in: Iceland Coastal and River Symposium, Proceedings, edited by: Sigbojarnarson, G., National Energy Authority, Reykjavik, p. 387, 295–303, 1986.
Boulton, G. S., Harris, P., and Jarvis, J.: Stratigraphy and structure of a coastal sediment wedge of glacial origin inferred from sparker measurements in glacial Lake Jökulsárlón in southeastern Iceland, Jökull, 32, 37–47, 1982.
Bouwer, H. and Rice, R. C.: A slug test for determining hydraulic conductivity of unconfined aquifers with completely or partially penetrating wells, Water Resour. Res., 12, 423–428, https://doi.org/10.1029/WR012i003p00423, 1976.
Bueler, E. and Brown, J.: Shallow shelf approximation as a “sliding law” in a thermomechanically coupled ice sheet model, J. Geophys. Res., 114, F03008, https://doi.org/10.1029/2008JF001179, 2009.
Cogley, J. G., Hock, R., Rasmussen, L. A., Arendt, A. A., Bauder, A., Kaser, G., Möller, M., Nicholson, L., and Zemp, M.: Glossary of Glacier Mass Balance and Related Terms, Polar Record, 48, 114, https://doi.org/10.1017/S0032247411000805, 2011.
Crochet, P., Jóhannesson, T., Jónsson, T., Sigurðsson, O., Björnsson, H., Pálsson, F., and Barstad, I.: Estimating the Spatial Distribution of Precipitation in Iceland Using a Linear Model of Orographic Precipitation, J. Hydrometeorol., 8, 1285–1306, https://doi.org/10.1175/2007JHM795.1, 2007.
Crosbie, R. S., Binning, P., and Kalma, J. D.: A time series approach to inferring groundwater recharge using the water table fluctuation method: Inferring Groundwater Recharge, Water Resour. Res., 41, W01008, https://doi.org/10.1029/2004WR003077, 2005.
Cuffey, K. and Paterson, W. S. B.: The physics of glaciers, in: 4th Edn., Butterworth/Elsevier, Burlington, ISBN 9780080919126, 2010.
Dochartaigh, B. É. Ó., MacDonald, A. M., Black, A. R., Everest, J., Wilson, P., Darling, W. G., Jones, L., and Raines, M.: Groundwater–glacier meltwater interaction in proglacial aquifers, Hydrol. Earth Syst. Sci., 23, 4527–4539, https://doi.org/10.5194/hess-23-4527-2019, 2019.
Dreimanis, A.: Penecontemporaneous partial disaggregation and/or resedimentation during the formation and deposition of subglacial ti11, Acta Geol. Hispan., 18, 153–160, 1983.
Dzikowski, M. and Jobard, S.: Mixing law versus discharge and electrical conductivity relationships: application to an alpine proglacial stream: Mixing law versus Q–EC relationships from an Alpine proglacial stream, Hydrol. Process., 26, 2724–2732, https://doi.org/10.1002/hyp.8366, 2012.
Einarsson, Þ.: Geology of Iceland: rocks and landscape, Mál og Menning, Reykjavik, 309 pp., ISBN 1904945449, 1994.
Evans, D. J.: A gravel outwash/deformation till continuum, Skalafellsjokull, Iceland, Geograf. Ann. A, 82, 499–512, 2000.
Evans, D. J. A. and Hiemstra, J. F.: Till deposition by glacier submarginal, incremental thickening, Earth Surf. Proc. Land., 30, 1633–1662, https://doi.org/10.1002/esp.1224, 2005.
Favier, V., Coudrain, A., Cadier, E., Francou, B., Ayabaca, E., Maisincho, L., Praderio, E., Villacis, M., and Wagnon, P.: Evidence of groundwater flow on Antizana ice-covered volcano, Ecuador, Hydrolog. Sci. J., 53, 278–291, https://doi.org/10.1623/hysj.53.1.278, 2008.
Gardner, A. S., Moholdt, G., Cogley, J. G., Wouters, B., Arendt, A. A., Wahr, J., Berthier, E., Hock, R., Pfeffer, W. T., Kaser, G., Ligtenberg, S. R. M., Bolch, T., Sharp, M. J., Hagen, J. O., van den Broeke, M. R., and Paul, F.: A Reconciled Estimate of Glacier Contributions to Sea Level Rise: 2003 to 2009, Science, 340, 852–857, https://doi.org/10.1126/science.1234532, 2013.
Goldthwait, R. P. (Ed.): Till: a symposium, Ohio State University Press, 414 pp., ISBN 13:978-0814201480, 1971.
Guðmundsson, S., Björnsson, H., Pálsson, F., Magnússon, E., Sæmundsson, Þ., and Jóhannesson, T.: Terminus lakes on the south side of Vatnajökull ice cap, SE-Iceland, Jökull, 69, 1–34, https://doi.org/10.33799/jokull2019.69.001, 2020.
Gunnarsson, A., Gardarsson, S. M., Pálsson, F., Jóhannesson, T., and Sveinsson, Ó. G. B.: Annual and inter-annual variability and trends of albedo of Icelandic glaciers, The Cryosphere, 15, 547–570, https://doi.org/10.5194/tc-15-547-2021, 2021.
Hannesdóttir, H., Zöhrer, A., Davids, H., Sigurgeirsdóttir, S. I., Skírnisdóttir, H., and Árnason, Þ.: Vatnajökull National Park: Geology and Geodynamics, https://archive.org/details/vatnajokull-national-park-geology-and-geodynamics/mode/2up (last access: 25 July 2024), 2010.
Hannesdóttir, H., Björnsson, H., Pálsson, F., Aðalgeirsdóttir, G., and Guðmundsson, S.: Variations of southeast Vatnajökull ice cap (Iceland) 1650–1900 and reconstruction of the glacier surface geometry at the Little Ice Age maximum: Timing and reconstruction of the LIA maximum of SE-Vatnajökull, Geograf. Ann. A, 97, 237–264, https://doi.org/10.1111/geoa.12064, 2015.
Hart, J. K.: Subglacial till formation: Microscale processes within the subglacial shear zone, Quaternary Sci. Rev., 170, 26–44, https://doi.org/10.1016/j.quascirev.2017.06.021, 2017.
Hart, J. K., Rose, K. C., Clayton, A., and Martinez, K.: Englacial and subglacial water flow at Skálafellsjökull, Iceland derived from ground penetrating radar, in situ Glacsweb probe and borehole water level measurements, Earth Surf. Proc. Land., 40, 2071–2083, https://doi.org/10.1002/esp.3783, 2015.
Healy, R. W. and Cook, P. G.: Using groundwater levels to estimate recharge, Hydrogeol. J., 10, 91–109, https://doi.org/10.1007/s10040-001-0178-0, 2002.
Heath, R. C.: Basic ground-water hydrology, US Geological Survey, https://pubs.usgs.gov/wsp/2220/report.pdf (last access: 25 July 2024), 1983.
Hood, J. L., Roy, J. W., and Hayashi, M.: Importance of groundwater in the water balance of an alpine headwater lake, Geophys. Res. Lett., 33, L13405, https://doi.org/10.1029/2006GL026611, 2006.
Hvorslev, M. J.: Time lag and soil permeability in ground-water observations, Corps of Engineers, US Army, Waterways Experiment Station, https://health.hawaii.gov/heer/files/2021/07/Hvorslev1951.pdf (last access: 25 July 2024), 1951.
Icelandic Meteorological Office: Icelandic Meteorological Office Database, deliveries nos. 2022-07-07/GEJ06, 2022-03-30/GEJ02, 2022-03-28/GEJ03, Icelandic Meteorological Office, 2022.
Immerzeel, W. W., van Beek, L. P. H., Konz, M., Shrestha, A. B., and Bierkens, M. F. P.: Hydrological response to climate change in a glacierized catchment in the Himalayas, Climatic Change, 110, 721–736, https://doi.org/10.1007/s10584-011-0143-4, 2012.
Iverson, N. R., McCracken, R. G., Zoet, L. K., Benediktsson, Í. Ö., Schomacker, A., Johnson, M. D., and Woodard, J.: A Theoretical Model of Drumlin Formation Based on Observations at Múlajökull, Iceland, J. Geophys. Res.-Earth, 122, 2302–2323, https://doi.org/10.1002/2017JF004354, 2017.
Jayne, R. S. and Pollyea, R. M.: Permeability correlation structure of the Columbia River Plateau and implications for fluid system architecture in continental large igneous provinces, Geology, 46, 715–718, https://doi.org/10.1130/G45001.1, 2018.
Jóhannesson, H. and Sæmundsson, K.: Geological Map of Iceland, 1:500000: Bedrock Geology, Icelandic Institute of Natural History (Náttúrufræðistofnun Íslands), https://www.ni.is/en/resources/publications/maps/geological-maps (last access: 25 July 2024), 1998.
Jóhannesson, T., Björnsson, H., Magnússon, E., Guðmundsson, S., Pálsson, F., Sigurðsson, O., Thorsteinsson, T., and Berthier, E.: Ice-volume changes, bias estimation of mass-balance measurements and changes in subglacial lakes derived by lidar mapping of the surface of Icelandic glaciers, Ann. Glaciol., 54, 63–74, https://doi.org/10.3189/2013AoG63A422, 2013.
Jóhannesson, T., Pálmason, B., Hjartarson, Á., Jarosch, A. H., Magnússon, E., Belart, J. M. C., and Gudmundsson, M. T.: Non-surface mass balance of glaciers in Iceland, J. Glaciol., 66, 685–697, https://doi.org/10.1017/jog.2020.37, 2020.
Join, J.-L.: Caractérisation hydrogéologique du milieu volcanique insulaire: Piton des Neiges, Île de la Réunion, PhD thesis, Université de Montpellier II, 61 pp., 1991.
Jonsson, B. and Hafstað Þ.: Fljotsdalur Hydroelectric Project, Orkustofnun, 90 pp., 1991.
Lachassagne, P., Aunay, B., Frissant, N., Guilbert, M., and Malard, A.: High-resolution conceptual hydrogeological model of complex basaltic volcanic islands: a Mayotte, Comoros, case study, Terra Nova, 26, 307–321, https://doi.org/10.1111/ter.12102, 2014.
Landmælinga Íslands/National Land Survey of Iceland: IslandsDEMv1, https://www.lmi.is (last access: October 2022), 2022.
Li, H., Beldring, S., Xu, C.-Y., Huss, M., Melvold, K., and Jain, S. K.: Integrating a glacier retreat model into a hydrological model – Case studies of three glacierised catchments in Norway and Himalayan region, J. Hydrol., 527, 656–667, https://doi.org/10.1016/j.jhydrol.2015.05.017, 2015.
Libre Office: The Document Foundation, 2020 Annual report, p. 54, https://fr.libreoffice.org (last access: July 2022), 2020.
MacDonald, A. M., Maurice, L., Dobbs, M. R., Reeves, H. J., and Auton, C. A.: Relating in situ hydraulic conductivity, particle size and relative density of superficial deposits in a heterogeneous catchment, J. Hydrol., 434–435, 130–141, https://doi.org/10.1016/j.jhydrol.2012.01.018, 2012.
Mackay, J. D., Barrand, N. E., Hannah, D. M., Krause, S., Jackson, C. R., Everest, J., MacDonald, A. M., and Ó Dochartaigh, B. É.: Proglacial groundwater storage dynamics under climate change and glacier retreat, Hydrol. Process., 34, 5456–5473, https://doi.org/10.1002/hyp.13961, 2020.
Martin, E., Paquette, J. L., Bosse, V., Ruffet, G., Tiepolo, M., and Sigmarsson, O.: Geodynamics of rift–plume interaction in Iceland as constrained by new 40Ar/39Ar and in situ U–Pb zircon ages, Earth Planet. Sc. Lett., 311, 28–38, https://doi.org/10.1016/j.epsl.2011.08.036, 2011.
Monteith, J. L.: Evaporation and environment, Symposia of the Society for Experimental Biology, 19, 205–234, 1965.
Morris, D. A. and Johnson, A. I.: Summary of hydrologic and physical properties of rock and soil materials as analyzed by the Hydrologic Laboratory of the U.S. Geological Survey, US Geological Survey, 42 pp., https://doi.org/10.3133/wsp1839D, 1967.
Müller, T., Roncoroni, M., Mancini, D., Lane, S. N., and Schaefli, B.: Current and future roles of meltwater–groundwater dynamics in a proglacial Alpine outwash plain, Hydrol. Earth Syst. Sci., 28, 735–759, https://doi.org/10.5194/hess-28-735-2024, 2024.
Nawri, N., Pálmason, B., Petersen, N., Björnsson, H., and Þorsteinsson, S.: The ICRA Atmospheric Reanalysis Project for Iceland, Icelandic Meteorological Office, 39 pp., https://www.vedur.is/media/vedurstofan-utgafa-2017/VI_2017_005_rs.pdf (last access: 25 July 2024), 2017.
Noël, B., Aðalgeirsdóttir, G., Pálsson, F., Wouters, B., Lhermitte, S., Haacker, J. M., and Broeke, M. R.: North Atlantic Cooling is Slowing Down Mass Loss of Icelandic Glaciers, Geophys. Res. Lett., 49, e2021GL095697, https://doi.org/10.1029/2021GL095697, 2022.
Ó Dochartaigh, B. É., MacDonald, A. M., Wilson, P. and Bonsor, H.: Groundwater investigations at Virkisjökull, Iceland: Data Report 2012, British Geological Survey Open Report, OR/12/088, 52 pp., https://nora.nerc.ac.uk/id/eprint/500570/1/OR12088.pdf (last access: 25 July 2024), 2012.
Penman, H. L.: Natural evaporation from open water, bare soil and grass, P. Roy. Soc. Lond. A, 193, 120–145, 1948.
Porter, C., Morin, P., Howat, I., Noh, M.-J., Bates, B., Peterman, K., Keesey, S., Schlenk, M., Gardiner, J., Tomko, K., Willis, M., Kelleher, C., Cloutier, M., Husby, E., Foga, S., Nakamura, H., Platson, M., Wethington, M., Williamson, C., Bauer, G., Enos, J., Arnold, G., Kramer, W., Becker, P., Doshi, A., D'Souza, C., Cummens, P., Laurier, F., and Bojesen, M.: ArcticDEM, HARVARD Dataverse [data set], https://doi.org/10.7910/DVN/OHHUKH, 2018.
QGIS Association: QGIS Geographic Information System, https://www.qgis.org (last access: 25 July 2024), 2022.
Rhoades, J. D., Kandiah, A., and Mashali, A. M.: The use of saline waters for crop production, Food and Agriculture Organization of the United Nations, Rome, 133 pp., ISBN 92-5-103237-8, https://www.sleigh-munoz.co.uk/wash/Mara/FAOsaline/Saline0a.pdf (last access: 25 July 2024), 1992.
Robson, S. G.: Techniques for estimating specific yield and specific retention from grain-size data and geophysical logs from clastic bedrock aquifers, US Department of the Interior, US Geological Survey, https://pubs.usgs.gov/wri/1993/4198/report.pdf (last access: 25 July 2024), 1993.
Sæmundsson, K.: Outline of the geology of Iceland, Jökull, 29, 7–28, 1979.
Schmidt, L. S., Ađalgeirsdóttir, G., Pálsson, F., Langen, P. L., Guđmundsson, S., and Björnsson, H.: Dynamic simulations of Vatnajökull ice cap from 1980 to 2300, J. Glaciol., 66, 97–112, https://doi.org/10.1017/jog.2019.90, 2020.
Sigurðarson, D., Smárason, Ó. B., and Þórðarson, Þ.: Hali í Suðursveit Greining jarðlaga í holu HA-25, Baccalaureus Scientiarum, Háskóli Íslands, 61 pp., 2016.
Sigurðsson, F.: Groundwater from glacial areas in Iceland, Jökull, 40, 119–146, 1990.
Somers, L. D., Gordon, R. P., McKenzie, J. M., Lautz, L. K., Wigmore, O., Glose, A. M., Glas, R., Aubry-Wake, C., Mark, B., Baraer, M., and Condom, T.: Quantifying groundwater-surface water interactions in a proglacial valley, Cordillera Blanca, Peru: Groundwater Tracing in a Proglacial Catchment, Hydrol. Process., 30, 2915–2929, https://doi.org/10.1002/hyp.10912, 2016.
Thornthwaite, C. W.: An Approach toward a Rational Classification of Climate, Geogr. Rev., 38, 55–94, 1948.
Torfason, H.: Investigations into the structure of South-Eastern Iceland, PhD thesis, University of Liverpool, 1979.
Van Vliet-Lanoë, B., Bergerat, F., Geoffroy, L., Guillou, H., and Maury, R. C.: L'Islande au coeur de l'Atlantique Nord, ISTE edition, 258 pp., ISBN 978-1-78949-014-5, 2021.
Vincent, A., Violette, S., and Aðalgeirsdóttir, G.: Groundwater in catchments headed by temperate glaciers: A review, Earth-Sci. Rev., 188, 59–76, https://doi.org/10.1016/j.earscirev.2018.10.017, 2019.
Vincent, A., Daigre, C., Fischer, O., Adalgeirsdottir, G., and Pettersson, M.: IceAq – groundwater data, monthly manual data (version 3 (march 2023)) [Data set], Zenodo [data set], https://doi.org/10.5281/zenodo.7716362, 2021.
Vincent, A., Violette, S., Daigre, C., and Fischer, O.: IceAq – Slug Tests Data [Data set], Zenodo [data set], https://doi.org/10.5281/zenodo.7716507, 2023a.
Vincent, A., Daigre, C., Fischer, O., Gudmundsson, S., and Pettersson, M.: IceAq Groundwater Hourly Data [Data set], Zenodo [data set], https://doi.org/10.5281/zenodo.7716453, 2023b.
Violette, S., Ledoux, E., Goblet, P., and Carbonnel, J.-P.: Hydrologic and thermal modeling of an active volcano: the Piton de la Fournaise, Reunion, J. Hydrol., 191, 37–63, https://doi.org/10.1016/S0022-1694(96)03071-5, 1997.
WMO – World Meteorological Association: State of Global Climate 2021 – WMO, World Meteorological Association, 47 pp., https://library.wmo.int/index.php?lvl=notice_display&id=21982 (last access: 25 July 2024), 2022.
Xiang, L., Wang, H., Steffen, H., Wu, P., Jia, L., Jiang, L., and Shen, Q.: Groundwater storage changes in the Tibetan Plateau and adjacent areas revealed from GRACE satellite gravity data, Earth Planet. Sc. Lett., 449, 228–239, https://doi.org/10.1016/j.epsl.2016.06.002, 2016.
Young, D. S., Hart, J. K., and Martinez, K.: Image analysis techniques to estimate river discharge using time-lapse cameras in remote locations, Comput. Geosci., 76, 1–10, https://doi.org/10.1016/j.cageo.2014.11.008, 2015.
Zemp, M., Huss, M., Thibert, E., Eckert, N., McNabb, R., Huber, J., Barandun, M., Machguth, H., Nussbaumer, S. U., Gärtner-Roer, I., Thomson, L., Paul, F., Maussion, F., Kutuzov, S., and Cogley, J. G.: Global glacier mass changes and their contributions to sea-level rise from 1961 to 2016, Nature, 568, 382–386, https://doi.org/10.1038/s41586-019-1071-0, 2019.