the Creative Commons Attribution 4.0 License.
the Creative Commons Attribution 4.0 License.
Wetting and drying trends in the land–atmosphere reservoir of large basins around the world
Ruben D. Molina
Jorge I. Zuluaga
Jesus D. Gomez-Velez
Global change is altering hydrologic regimes worldwide, including large basins that play a central role in the sustainability of human societies and ecosystems. The basin water budget is a fundamental framework for understanding these basins' sensitivity and future dynamics under changing forcings. In this budget, studies often treat atmospheric processes as external to the basin and assume that atmosphere-related water storage changes are negligible in the long term. These assumptions are potentially misleading in large basins with strong land–atmosphere feedbacks, including terrestrial moisture recycling, which is critical for global water distribution. Here, we introduce the land–atmosphere reservoir (LAR) concept, which includes atmospheric processes as a critical component of the basin water budget and use it to study long-term changes in the water storage of some of the world's largest basins. Our results show significant LAR water storage trends over the last 4 decades, with a marked latitudinal contrast: while low-latitude basins have accumulated water, high-latitude basins have been drying. If they continue, these trends will disrupt the discharge regime and compromise the sustainability of these basins, resulting in widespread impacts.
- Article
(7707 KB) - Full-text XML
- BibTeX
- EndNote
This paper has been co-authored by staff from UT-Battelle, LLC, under Contract No. DE-AC05-00OR22725 with the U.S. Department of Energy (DOE). The United States Government retains and the publisher, by accepting the article for publication, acknowledges that the United States Government retains a nonexclusive, paid-up, irrevocable, worldwide license to publish or reproduce the published form of this paper, or allow others to do so, for United States Government purposes. The Department of Energy will provide public access to these results of federally sponsored research in accordance with the DOE Public Access Plan (http://energy.gov/downloads/doe-public-access-plan, last access: 19 June 2024).
River basins are complex systems, comprising physical, biological, and social components, and a basic unit for studying the water cycle on land and implementing management and governance strategies (Cohen and Davidson, 2011). The sustainability of terrestrial ecosystems and human societies will depend on how river basins respond under the influence of global change (Vörösmarty et al., 2010; Kuil et al., 2016; Mekonnen and Hoekstra, 2016; Best, 2019), including alterations due to climate change (Palmer et al., 2008), land use/land cover (LULC) change (Posada-Marín and Salazar, 2022), and other anthropogenic stresses (Best, 2019). River discharge at the basin outlet is an integrated response resulting from the basin's water budget and, therefore, depends on the basin's properties and internal processes affecting terrestrial water fluxes and storage. Previous studies have identified changes in these fluxes and storage worldwide, including trends in precipitation (Lausier and Jain, 2018); river discharge (Barichivich et al., 2018; Li et al., 2020); terrestrial water storage (TWS) (Scanlon et al., 2018); and, generally, different components of the basin's water budget (Pan et al., 2012; Wang-Erlandsson et al., 2018; Zhang et al., 2019; Pabón-Caicedo et al., 2020). Although critical for future sustainability, how and why the water budget of large basins is changing has yet to be fully understood (Pan et al., 2012; Jing et al., 2019; Posada-Marín and Salazar, 2022; Xiong et al., 2022). Here, we first introduce the land–atmosphere reservoir (LAR) concept for explicitly including the atmosphere in the basin water budget and then use this concept to show ongoing changes in some of the world's largest basins.
The most common approach to studying a basin's water budget, including theoretical, observational, and modeling studies, defines a control volume that includes the land and excludes the atmosphere (e.g., Pan et al., 2012; Kuil et al., 2016; Zhang et al., 2017, 2019; Posada-Marín and Salazar, 2022), i.e., a land reservoir (Fig. 1a, b). This control volume definition is a prevailing concept in catchment hydrology to study how basins respond to an external climatic input (Sivapalan, 2005; McDonnell et al., 2007) and to understand human impacts on the water cycle (Abbott et al., 2019). From this perspective, precipitation is a flux that enters the basin from the exterior (it is regarded as an external forcing), whereas evapotranspiration represents a flux exiting the basin.
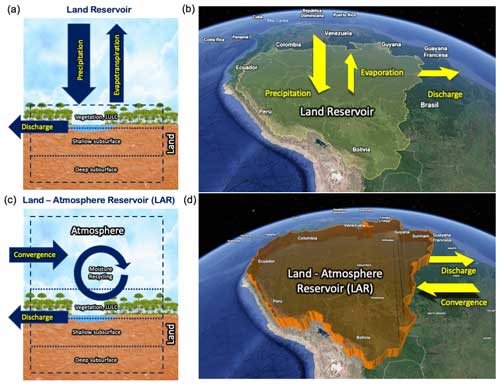
Figure 1Land versus land–atmosphere reservoirs. Panel (a) presents the control volume and exchanges (precipitation, evapotranspiration, and discharge) for the land reservoir (see Eq. 1). Panel (b) is a schematic representation of the land reservoir and exchanges in the Amazon Basin, including the surface and land beneath it but excluding the atmospheric column. Panel (c) presents the control volume and exchanges (moisture convergence and discharge) for the LAR (see Eq. 2). Panel (d) is a schematic representation of the LAR and exchanges in the Amazon Basin, including the land reservoir and the atmospheric column above it. Moisture recycling occurs within the LAR. (Imagery/map: ©2021 Google; data: SIO, NOAA, U.S. Navy, NGA, GEBCO, Landsat/Copernicus, IBCAO, INEGI; basin polygon: GRDC.)
If defined as a land reservoir, the water budget equation for a basin,
establishes that river discharge (R) depends on the difference between precipitation (P) and evapotranspiration (E) as well as on temporal changes in water storage within the land reservoir (). The land reservoir (sometimes limited to a shallow soil layer) is widely used to define the control volume for computing a basin water budget in hydrological and land-surface models (e.g., Devia et al., 2015; Sood and Smakhtin, 2015; Blyth et al., 2021; Posada-Marín and Salazar, 2022). As a result, these models inherently assume that atmospheric processes exert external effects but do not comprise part of a basin's internal dynamics and water budget. This approach is the most widely used to simulate, for instance, the river discharge response to deforestation (Zhang et al., 2017; Posada-Marín and Salazar, 2022).
However, defining a basin system as a land reservoir may be misleading, especially for large basins with strong land–atmosphere feedbacks. For instance, let us consider the largest basin on Earth: the Amazon ( km2; Fig. 1). Approximately 30 % of rainfall that falls over the Amazon Basin originates internally as evapotranspiration (Tuinenburg et al., 2020), mainly forest transpiration (Staal et al., 2018), resulting in the mechanism known as moisture (precipitation and evapotranspiration) recycling within the basin (Eltahir and Bras, 1994), i.e., local moisture recycling (LMR). Globally, 40 % of the total rainfall falling over land comes from terrestrial evapotranspiration (van der Ent et al., 2010), and 57 % of the rainfall over land returns to the atmosphere via evapotranspiration (Tuinenburg et al., 2020), meaning that moisture recycling from terrestrial sources plays a major role in distributing water over the land worldwide (te Wierik et al., 2021; Posada-Marín et al., 2023).
Given its dependence on transpiration and, therefore, on the surface water budget and vegetation dynamics, LMR should not be generally considered an external mechanism with respect to the basin. In contrast, for large basins with strong land–atmosphere feedbacks, this mechanism should be considered a crucial part of the system's internal dynamics, which plays a role in regulating river discharge (Salazar et al., 2018) and is sensitive to anthropogenic effects such as LULC change (Ruiz-Vásquez et al., 2020; te Wierik et al., 2021). To consider LMR and any other land–atmosphere interaction as part of a basin's internal dynamics as well as their role in producing the river discharge regime, the control volume needs to be redefined by including the atmospheric column. The resulting land–atmosphere control volume is the land–atmosphere reservoir (or LAR; Fig. 1c, d), i.e., the natural reservoir that receives water from the basin system's exterior, mainly through the atmosphere, and then stores or releases it leading to the discharge regime.
The water budget equation for the LAR is as follows:
where river discharge (R) results from the difference between the net atmospheric convergence towards the basin system (Q) and temporal changes in water storage within the LAR, including land (SL) and atmospheric (SA) components. In contrast to the land reservoir, the water influx to the LAR is not precipitation; rather, LAR water influx stems from the atmospheric flux:
where Θ is the vertically integrated atmospheric water flux and the integral is performed across the LAR's lateral contour (see Sect. 2 for more details).
Equations (1) and (2) exclude a term representing the net convergence of groundwater. Unlike the atmospheric fields, the global estimates of the groundwater flow field needed to estimate this underground convergence are limited. However, we do not expect this term to significantly affect our results. Estimates of the continent-to-ocean groundwater flow show that this flow is small relative to river discharge: 1 km3 yr−1 compared with 103 km3 yr−1 in the Amazon Basin, for example (see Sects. 2 and 3 for more details). Furthermore, groundwater fluxes in a large river basin contribute significantly to runoff and, therefore, are largely accounted for in the outlet's river discharge.
A critical difference between the land reservoir and the LAR concepts is that, P and E are internal fluxes in the basin system in the LAR, allowing LMR to be a mechanism of the basin's internal dynamics that takes part in the basin water budget and, therefore, in sustaining and regulating the discharge regime. A possible reason why the more traditional (land reservoir) approach excludes the atmosphere is that it has a much smaller water storage capacity than the land due to thermodynamic constraints, suggesting the assumption that the atmosphere's role in the basin's internal dynamics, including changes in water storage and regulation, is negligible. Although valid as a simplification in many cases (e.g., small watersheds in which external factors primarily impose precipitation), this assumption misses a fundamental feature of the hydrological cycle when applied to large basins: despite its small storage capacity, the atmosphere has a vast capacity to transport water. Indeed, in the global water budget, the inland transport of atmospheric moisture compensates for the offshore flow, including both surface water and groundwater (Trenberth et al., 2007). This transport capacity implies that a significant amount of water can be retained within the LAR by LMR (Fig. 1c), especially in large basins with high LMR rates.
Water stored within a basin's LAR through LMR involves not only atmospheric moisture but also the surface water that takes part in LMR, including every source of direct evaporation and transpiration in a basin. Whereas evapotranspiration leaves the basin based on the land reservoir perspective (Fig. 1a), the LAR perspective considers that significant amounts of transpired and evaporated water do not leave the basin but remain inside it through LMR (Fig. 1c). Hence, evapotranspiration is not necessarily a “loss” of water from the basin; rather, it can be a significant source of precipitation (e.g., see the “demand-side” and “supply-side” contrasting views discussed by Ellison et al., 2012).
Another difference between water storage dynamics in the LAR and the land reservoir is that the atmospheric processes and land–atmosphere interactions (occurring within the LAR but excluded from the land reservoir) are much more sensitive to climate change than, for instance, underground processes. These atmospheric processes include LMR as an essential component of the LAR's water storage and basins' internal dynamics and relate to the “green water” that is fundamental to the Earth system dynamics and is now extensively perturbed by human pressures at continental to planetary scales (Wang-Erlandsson et al., 2022).
Choosing between the land reservoir and LAR has important practical implications for modeling studies. Coe et al. (2009) compared results from models with land or land–atmosphere domains and showed that they produce contradictory results when investigating deforestation impacts on river discharge in some basins of South America. This contrast between results from models with land reservoir-type domains and those with LAR-type domains is a general pattern across multiple studies (Posada-Marín and Salazar, 2022). A key reason is that models with land reservoir-type domains forced with measured precipitation do not “see” future changes in precipitation due to LULC change, including LULC impacts on LMR (or terrestrial moisture recycling in general).
Lastly, the LAR should not be confused with other established and related concepts such as moisture recycling (Eltahir and Bras, 1994) or the precipitationshed (Keys et al., 2012). While the LAR is a control volume, moisture recycling is a mechanism that can occur within it. The precipitationshed is not an Eulerian control volume (such as the LAR), has different and more dynamic boundaries, excludes the land, and points to answer different questions (e.g., “Where does precipitable water come from?”).
In the following sections, after describing the data and methods, we use the LAR concept to study changes in the water budget of six of the largest basins on Earth, including low-latitude (the Amazon, Paraná, and Congo) and high-latitude (the Mississippi, Ob, and Yenisei) river basins.
2.1 River discharge and its uncertainty
We obtained time series of monthly discharge, R (m3 s−1), from the HYdro-geochemistry of the AMazonian Basin (HYBAM) observatory (Cochonneau et al., 2006) and the Global Runoff Data Centre (GRDC). We selected the following gauging stations to maximize the drainage area and record length in each basin: Óbidos for the Amazon River, Timbúes for the Paraná River, Kinshasa for the Congo River, Vicksburg for the Mississippi River, Salekhard for the Ob River, and Igarka for the Yenisei River. Figures A1–A6 show the discharge time series used in our analysis.
HYBAM and GRDC do not report uncertainties in their discharge records. As a first-order approximation, we explored relative errors in the discharge of 5 % and 25 %. The latter represents a conservative value for our uncertainty analysis. These relative errors are consistent with the error estimates proposed by Syed et al. (2005), who assumed a relative error in the observed Amazon and Mississippi discharge of 15 %. Using these relative errors, we bound our estimates of changes in storage and storage trends.
2.2 Moisture convergence and its uncertainty
We used 1979–2020 data from the ERA5 reanalysis (Hersbach et al., 2019) to estimate moisture convergence, Q (kg s−1), for each basin. Across a boundary C, Q is defined by the contour integral shown in Eq. (3), where the vertically integrated water flux, Θ (kg m−1 s−1), is defined as follows:
Here, q (g kg−1) is the specific humidity, vh (m s−1) is the horizontal wind field at each pressure level, p (kg m−1 s−2) is the total air pressure, ps (kg m−1 s−2) is the pressure at the Earth's surface, and g (m s−2) is the acceleration due to the Earth's gravity. Q accounts for the vertically integrated atmospheric water fluxes in the solid, liquid, and vapor phases.
ERA5 provides monthly estimates of the eastward and northward components of the vertically integrated water fluxes within a rectangular grid of 0.25°×0.25° resolution. We used this rectangular grid to rasterize each basin (Fig. A7a) and identify the grid edges defining its boundary (Fig. A7b). From an implementation perspective, once the boundary edges were defined, we differentiated them based on their orientation and whether the water flux was entering (inflow edge) or leaving (outflow edge) the basin. For example, the edges oriented in a south–north direction were separated into inflow (Fig. A7c) and outflow (Fig. A7d) edges for eastward fluxes, the only flow component contributing to the integral. Similarly, the edges oriented in an east–west direction were separated into inflow (Fig. A7e) and outflow (Fig. A7f) edges for northward fluxes. As a convention, we assumed that inflow fluxes are positive and outflow fluxes are negative. The discretized version of the contour integral defining Q is estimated as the summation of the water fluxes (kg m−1 s−1) crossing each edge multiplied by the edge's length (m) (Fig. A8). Figures A1–A6 show the resulting time series of Q.
ERA5 does not provide uncertainty estimates for Θ or for all of the variables used for its calculation. Therefore, we cannot simply propagate these variables' uncertainty through our approach to estimate Q. However, as part of their data assimilation framework, ERA5 provides the ensemble spread at a coarser resolution (0.5°×0.5°) for a set of state variables (Hersbach et al., 2020), including the vertically integrated water vapor divergence D (kg m−2 s−1), which is a proxy for Q. This spread is not a strict measure of uncertainty for the state variable estimates, as it ignores some important sources of error (e.g., systematic and correlated errors) (Asch et al., 2016), but provides a first-order approximation to bound our estimates of Q. More specifically, moisture convergence can be estimated as a function of water divergence with the divergence theorem by integrating D over the basin area, i.e.,
with
Even though the spatial and temporal resolutions are different and the divergence only accounts for the vapor phase, the moisture convergence (Q) values computed with Eqs. (3) and (5) show good agreement (Fig. A9 shows the scatterplots). In other words, estimating the uncertainty of Q by propagating the uncertainties of D is reasonable. To do this, we used linear propagation of uncertainties (Taylor, 1997) and the assumption of independent random errors to quantify the uncertainty in Q as follows. First, a discretization of Eq. (5) allowed us to estimate moisture convergence, , at a time t:
where Nc is the number of grid cells within the basin, Ai is the area of the ith grid cell, and Di,t is the divergence value in grid cell i at time t. Under the previous assumptions, the error in is given by the following (Taylor, 1997):
where δDi,t is the error in the divergence Di,t, assumed to equal the ensemble spread from ERA5. Finally, for a conservative estimate of the errors of Q, we assumed that the relative errors of Q from Eq. (3) equal the relative errors of Q from Eq. (5). That is,
2.3 Basin storage changes and its uncertainty
We used conservation of mass to estimate changes in the total LAR storage (SL+SA). From the continuity equation (Eq. 2), the LAR accumulates water, i.e., , when Q>R and releases it, i.e., , when Q<R. Figure 2 uses the Amazon data to exemplify the schematic steps that we followed to estimate these dynamics. First, we identified transitions between accumulation and release periods, corresponding to times when the R and Q time series intersect (vertical gray lines in Fig. 2). Figures A1–A6 show these transitions for all basins.
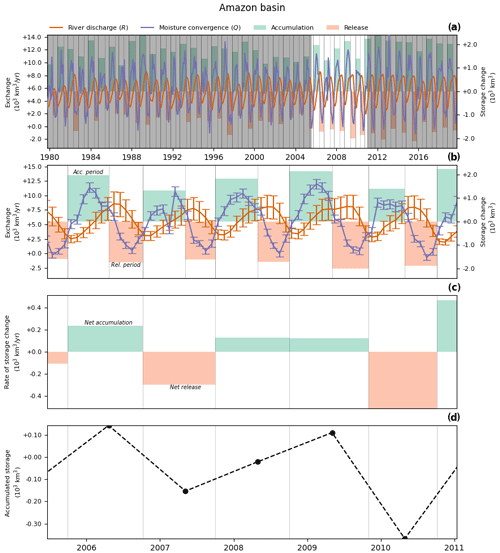
Figure 2Schematic steps to obtain accumulation and release periods and their metrics in the Amazon Basin. Panel (a) presents time series of R and Q with accumulation and release periods, highlighting the period shown in the next panels. Panel (b) shows accumulation and release periods. Panel (c) displays the net accumulated or released volume after two consecutive accumulation and release periods. Panel (d) presents the accumulated storage in the LAR after adding the volumes in panel (c).
Second, we calculated changes in water storage between transitions, Δ(SL+SA), by integrating the differences between R and Q over time, i.e., by solving
which represents accumulation within or release from () the basin's LAR over the period between τ1 and τ2, with τ1 and τ2 being the onset and end of each accumulation or release period, respectively. Accumulation (green shaded bands in Fig. 2a and b and Figs. A1–A6) occurs during prolonged periods (lasting from several days to months) when the atmospheric water converging into the LAR exceeds the river discharge (i.e., Q>R so ). Similarly, release (orange shaded bands in Fig. 2a and b and Figs. A1–A6) occurs when discharge exceeds atmospheric water convergence (i.e., Q<R so ).
Third, we obtained the net accumulated or released volume from the onset of an accumulation period and the end of the next release period by adding consecutive volumes of accumulation and release (Fig. 2c). Finally, we obtained the long-term trends in the LAR's water storage by adding net accumulated or released volumes over time.
The accumulated storage shown in Fig. 2d was calculated from data for R and our estimates for Q. For convenience, the following discussion refers to these values as nominal values and includes bars in the variable names to emphasize their meaning (i.e., and ). However, these values are uncertain, and their uncertainty propagates through the storage calculations. We used a Monte Carlo analysis informed by the uncertainty metrics described for R and Q to estimate the uncertainty in our storage calculations and gain perspective regarding the robustness of our analyses and conclusions. This method is outlined in the following.
For each basin, we generated 1000 random realizations of the R and Q time series that preserve their correlation and error structure. Then, for each random realization of these fluxes, we identified the accumulation and release periods and estimated the corresponding storage change, rate of storage change, and accumulated storage. These new LAR storage metrics allowed us to bound the uncertainty in our estimates.
Individual realizations of the flux time series were generated by assuming that, at any given time (t), the random variables Rt and Qt are described by a multivariate normal distribution:
with covariance matrix
Here, for any time (t), and are the nominal discharge and moisture convergence values, while δRt and δQt are their absolute errors. Recall the two scenarios of relative errors in discharge that we considered: (i) 5 % or and (ii) 25 % or . Lastly, ρRQ is Pearson's correlation coefficient, defined as follows:
where 〈R〉 and 〈Q〉 correspond to the time average of the nominal values for both quantities. The difference 〈Q〉–〈R〉 corresponds to the average LAR storage change, a quantity estimated from the mean annual cycles of Q and R in each basin (Fig. A10).
2.4 Estimating the annual cycle
We calculated the annual cycles of Q and R for each basin (Fig. A10) by transforming the time series to the phase domain. The phase associated with each point in the time series was calculated as an iterative optimization process, where we started with an arbitrary initial time, t0, and assumed a cycle duration, T (we used the tropical year duration of 365.24 d as an initial guess). Then, we divided the signal into time windows with a duration of T days. In the nth time window, which is contained between and , the value of the phase for each point in the series is computed as . After folding the signal, we found the average (solid lines in Fig. A10) and the envelope (maximum and minimum value of the signal). For a given pair of the free parameters, t0 and T, we computed the area of the envelope as a measure of the goodness of folding (GoF), which minimizes seasonal variability. Finally, we minimized the GoF with respect to t0 and T for each basin and plotted the resulting envelopes.
2.5 Constraining groundwater discharge to the ocean
Our conceptual framework assumes that net groundwater fluxes leaving (or entering) the LAR control volume are small compared with (atmospheric) moisture convergence and discharge. Given that most of the fluxes exiting the large basins likely discharge into the ocean as submarine groundwater discharge (SGD), we present a back-of-the-envelope estimate to support our assumption. First, reported values of SGD are sparse, given the complexity when estimating these fluxes with environmental tracers, modeling, or a combination of both. Here, to obtain an order-of-magnitude estimate, we used an analysis by Sawyer et al. (2016) in which annual volumetric discharge per unit length of the coast was estimated for the contiguous United States. In their analysis, the upper limit of the SGD is of the order of 103 m2 yr−1. As an example, the coast length of the projected Amazon Basin is of the order of 106 m. With these two values, we estimate that a reasonable upper limit for the groundwater flux leaving the Amazon's LAR control volume and discharging to the ocean is of the order of 1 km3 yr−1. This order of magnitude is consistent for all of the basins.
3.1 The LAR in some of the world's largest basins
Figure 3a shows periods of net accumulation (green bars) and release (orange bars) for the Amazon Basin and the corresponding change in water storage estimated with Eq. (10). Figures A11–A15 show the same results but for the other basins. The alternation between accumulation and release periods reflects seasonality in the basin, which is characterized by the occurrence of one wet and one dry season in the Amazon over a period that is close to a year (Fig. A10a). Changes in this seasonality are expected under global change (Costa and Pires, 2010; Fu et al., 2013; Wright et al., 2017), potentially altering the LAR dynamics and, therefore, the discharge regime. Accumulation and release periods and their corresponding storage changes are not mirror images of each other. Every pair of consecutive accumulation and release periods produces a net change in water storage (Fig. 3b) that, if imbalanced over time, produces long-term trends of accumulation (Fig. 3c) or release. If accumulation and release periods were always balanced, there would not be long-term trends.
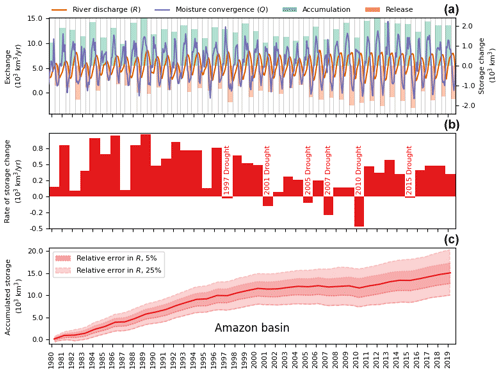
Figure 3LAR dynamics in the Amazon Basin. Panel (a) presents monthly river discharge R and net atmospheric convergence Q (left axis). Green and orange bars show the extent and volume (right axis) of the respective accumulation and release periods. Panel (b) shows net change in the LAR water storage after pairs of consecutive storage and release periods. Panel (c) displays the cumulative change in the LAR water storage, including the corresponding errors in convergence and estimated discharge uncertainties (shaded bands).
We found significant trends indicating that water storage has changed over the recent decades in the LAR of all basins (Fig. 4), with a marked latitudinal contrast: water storage has been increasing in low-latitude basins and decreasing in high-latitude basins. These trends result from the accumulated imbalance between the LAR water influx (Q) and efflux (R) (Eq. 2). The initial storage value is uncertain, so these trends have to be interpreted as changes in water storage relative to this initial value, similar to the interpretation of TWS in GRACE studies.
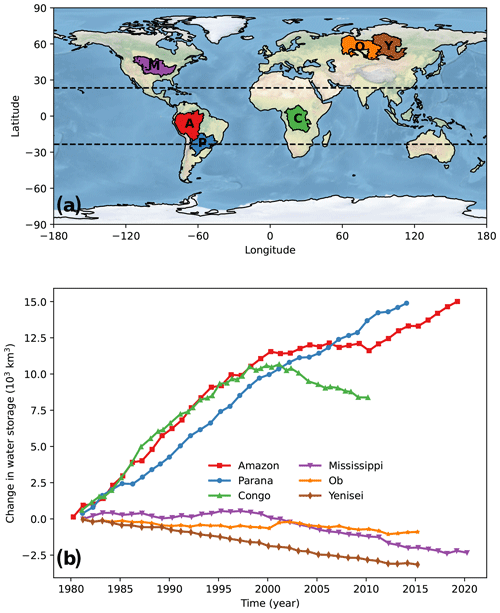
Figure 4Changing water storage in the LAR of large basins. Panel (a) outlines the large basins in this study. Panel (b) presents the cumulative change in the LAR water storage over time.
GRACE studies serve as a reference for contextualizing LAR storage trends. Notice, however, that, even though they are related, TWS and LAR storage are state variables describing the dynamics of different control volumes. Therefore, temporal trends in these state variables do not have to be the same for a given basin. In a global study using three different GRACE products for the 2002–2014 period, Scanlon et al. (2018) reported TWS trends in our study basins that varied from −5 km3 yr−1 in the Ob Basin to 44 km3 yr−1 in the Amazon Basin. This is roughly equivalent to −200 to 1760 km3 over 40 years, which is about 1 order of magnitude less than changes in the LAR water storage over 1980–2020 (Fig. 4). Our results coincide with Scanlon et al. (2018) in that the Amazon and Paraná basins have been accumulating water after 2002, but our findings diverge from Scanlon et al. (2018) for the Congo Basin, where TWS has been slightly increasing (Scanlon et al., 2018) while the LAR water storage has been decreasing (Fig. 4). GRACE data are available only after 2002; thus, in this comparison between GRACE and LAR results, we are considering only the trends shown in Fig. 4 after that year. In high-latitude basins, results coincide for the Ob Basin (decreasing trend) but not for the Yenisei Basin (increasing TWS trend). The results from Scanlon et al. (2018) for the Mississippi are mixed: they found positive and negative trends in different subbasins. Discrepancies between different GRACE products are common for large basins, can be highly contrasting (e.g., positive versus negative trends), and remain a matter of investigation (Jing et al., 2019).
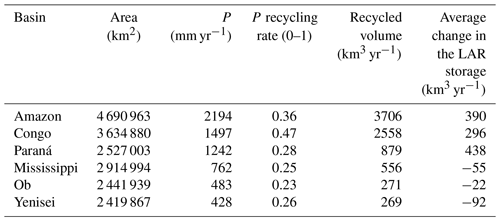
As TWS excludes the atmosphere (Wahr et al., 2004), it does not account for the water storage through LMR that depends on atmospheric water and dynamics. In contrast to the land reservoir and TWS measurements, the LAR water storage inherently includes water circulation via LMR (Fig. 1). Annual recycled precipitation represents a water volume that is always greater in magnitude than the average change in LAR water storage (Table 1), meaning that changes in LMR, including those driven by anthropogenic effects (te Wierik et al., 2021; Ruiz-Vásquez et al., 2020) or climate variability (Posada-Marín et al., 2023), are potentially enough to explain the trends shown in Fig. 4. The amount of water involved in LMR annually (recycled volume in Table 1) exceeds the average rates in TWS trends (Scanlon et al., 2018) by 1–2 orders of magnitude. Further, in the global water budget, the amount of atmospheric water entering the continents from the ocean (≈40 000 km3 yr−1) (Trenberth et al., 2007) is 2–3 orders of magnitude greater than the average change in the LAR storage (Table 1). These numbers show that, although seemingly counterintuitive, the idea that LMR can represent a significant part of a large basin's LAR water storage and contribute to explaining the observed trends is plausible. Notice that this claim depends on the order of magnitude of the recycling ratio, which does not generally vary among studies (e.g., Dominguez et al., 2022), rather than on its “true” value, which is uncertain and currently not directly measurable for vast regions.
Table 1Estimates of the recycled volume of water in each basin. Data sources: Pvalues were obtained from Schneider et al. (2020); the P recycling rate was sourced from Tuinenburg et al. (2020). LAR averages correspond to Fig. A10.
3.2 Confidence and uncertainty
The true value of Q, R, and is unknown and difficult, if not impossible, to obtain with direct observations. We cannot measure SA, SL, or Q directly and globally; even R is hard to measure in vast rivers like the ones studied here. Further, TWS estimates can be contradictory among different GRACE products for reasons that remain unclear (Jing et al., 2019). The best that we have are estimates based on different inherently uncertain techniques. However, our uncertainty estimates indicate that the LAR trends are statistically robust (see uncertainty bands in Figs. 3 and A11–A15). The uncertainty bands in panel (c) of these figures result from the uncertainty analysis explained in Sect. 2. The solid line represents the mean value of the accumulated storage, while the uncertainty bands present the 5th and 95th percentiles of the Monte Carlo realizations for a relative error in R of 5 % and 25 %. Hence, the width of these uncertainty bands is a measure of the uncertainty in our estimates of storage and how errors in the fluxes propagate through the analysis. Despite the uncertainties, the trends in accumulated storage remain.
Besides the uncertainty estimates, we have several reasons to think that the LAR trends are plausible and indicative of important phenomena requiring attention. Every basin on Earth is under the influence of climate change, which, by definition, means trends and imbalance. The Earth's climate system has been imbalanced over the last centuries and will remain so over the coming decades, altering the water budgets globally (Xiong et al., 2022; Zaitchik et al., 2023).
Contrary to the widely used assumption that changes in a basin water storage are negligible “in the long-term” (e.g., Poveda et al., 2007; Wang-Erlandsson et al., 2018; Hoek van Dijke et al., 2022), a growing body of literature shows that water fluxes entering and exiting the world's river basins are not necessarily balanced, so trends in water storage are not only plausible but also likely. Wetting and drying trends are underway worldwide (Pan et al., 2012; Scanlon et al., 2018; Zhang et al., 2019; Pabón-Caicedo et al., 2020; Li et al., 2022; Xiong et al., 2022; Zaitchik et al., 2023). An example of such findings is the study by Scanlon et al. (2018), who showed temporal changes in water storage inferred from GRACE data. The reduction in water storage due to permafrost thawing in large Siberian basins is consistent with LAR storage reductions in the Ob and Yenisei basins. Moreover, a recent paper by Li et al. (2022) reported that basins draining from the Tibetan Plateau face drastic water availability reductions due to water storage losses, which implies long-term water budget imbalance in such basins.
The signal of droughts in the Amazon is notorious (Fig. 3): the basin's LAR has released water during documented droughts in the last 2 decades, including the events of 1996–1997, 2001, 2004–2005, 2007, 2010, and 2015–2016 (Nepstad et al., 2004; Marengo et al., 2011; Tomasella et al., 2011; Jiménez-Muñoz et al., 2016; Tyukavina et al., 2017; Libonati et al., 2021). The largest release of water coincides with the record-breaking drought of 2010 (Marengo et al., 2011). This coincidence between LAR release dynamics and severe droughts in the Amazon is unlikely a random error or systematic bias.
Also, the latitudinal contrast in the LAR trends is unlikely to be a random error or systematic bias. This contrast implies that 〈Q〉 is larger than 〈R〉 in the south (low-latitude basins) and 〈Q〉 is smaller than 〈R〉 in the north (high-latitude basins), where the angle brackets represent long-term averages. If there was a systematic bias in our estimates based on ERA5 data, Q should be consistently overestimated or underestimated. The latitudinal contrast suggests that this would be the case only if ERA5 also has a latitude-dependent water budget bias, which would be an unknown bias requiring new evidence from future studies.
We also found temporal changes in the LAR trends. The most conspicuous case occurs in the Congo Basin, where the slope changes sign (Fig. 4). If the trend does not reflect an actual phenomenon and ERA5 consistently overestimates or underestimates Q for this basin, then there would not be a change in the trend slope. This change indicates that 〈Q〉 is larger than 〈R〉 during a period and that 〈Q〉 is smaller than 〈R〉 afterward.
Overall, our uncertainty analysis reinforces our main general conclusions about temporal changes in the LAR water storage for some of the world's largest basins. The trends that we found are plausible and statistically robust, providing fundamental insight into the water storage dynamics constraining these big rivers' sustainability.
3.3 Why the latitudinal contrast
We hypothesize that the latitudinal contrast in the trends is caused mainly by land–atmosphere exchanges and atmospheric processes currently affected by climate change. Compared with high latitudes, the low-latitude atmosphere is thicker and wetter, and its warming due to climate change increases its capacity to hold water. This is consistent with an increased capacity of the low-latitude LAR to store water. High-latitude basins are warming, too, due to climate change. However, in such basins, the increased capacity of the atmosphere to hold water does not compensate for surface water losses due to snow and ice melting, leading to glacier retreat and permafrost thawing. We hypothesize that high-latitude basins are losing more water due to these surface processes than they can gain due to atmospheric warming. Low-latitude glaciers are also retreating (Poveda and Pineda, 2009), but they are concentrated in high-altitude mountains, and their size is too small to govern the storage dynamics in large basins like the Amazon, Congo, and Paraná. In contrast, snow and ice dynamics are much more significant in high-latitude basins.
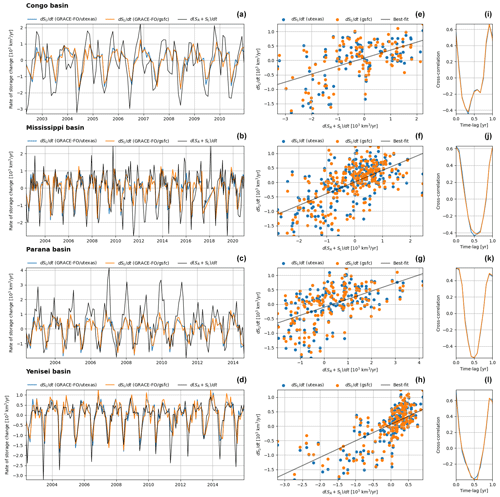
Figure 5 shows a comparison between based on our Eq. (2) and estimated from two different GRACE products in the Amazon and Ob basins (Fig. A16 shows the other basins). These figures (Figs. 5 and A16) show three ideas that we want to highlight. First, there is a high correlation between the LAR storage change estimated with our Eq. (2) and the land reservoir storage change obtained from GRACE. Although the LAR and land reservoir storages are not the same, they are related; therefore, this correlation between time series obtained from substantially different sources helps validate our results. Second, there are two types of basins, as illustrated in Fig. 5. In a basin like the Amazon, storage variations in the LAR are wider in amplitude than the corresponding variations in the land reservoir. In contrast, in the Ob Basin, LAR storage variations largely coincide with variations in the land reservoir storage. Our interpretation is that, in the first type of basin, land–atmosphere exchanges and atmospheric processes play a more prominent role in the storage dynamics than in the second type, where TWS largely controls these dynamics. Third, low-latitude basins pertain to the first type, whereas high-latitude basins are closer to the second type. This lends additional support to our hypothesis about the latitudinal contrast in the trends, as, from this perspective, low-latitude basins seem more sensitive to atmospheric changes (e.g., warming due to climate change) than high-latitude basins that are more sensitive to changes in terrestrial water (e.g., snow and ice loss).
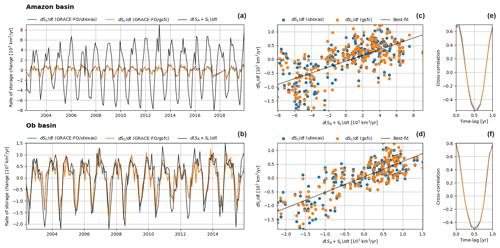
Figure 5Comparison between the storage dynamics in the LAR and land reservoir. Panels (a) and (b) present the rate of storage change in the LAR () from Eq. (2) and the corresponding estimates for the land reservoir () based on two different GRACE products, the GRACE University of Texas and GRACE GSFC (Goddard Space Flight Center), for the Amazon and Ob basins. Panels (c) and (d) and panels (e) and (f) show respective scatterplots and cross-correlations for different time lags between the LAR and land reservoir storage time series. Figure A16 shows the same results but for the other basins.
3.4 Why the focus on large basins
In principle, the LAR dynamics can be studied at any scale. No theoretical limitation exists, including that LMR can occur in basins of any size. However, there are theoretical and practical reasons for focusing on large basins. Whereas the LAR is crucial for understanding large basins, it might be unnecessary for small basins where external factors (e.g., large-scale wind patterns) largely impose precipitation. If so, LMR is possibly negligible; therefore, the traditional land reservoir framework is a parsimonious representation that works well without the complications of including the atmosphere in the control volume for the water budget computations. That is why we focused on the largest basins on Earth, where LMR involves water amounts comparable in magnitude to other fluxes in the basin's water budget. Indeed, Table 1 shows that, for the studied basins, LMR represents between 23 % and 47 % of precipitation, which is comparable to evapotranspiration and river discharge in the same basins. In contrast, we do not expect that LMR represents such a significant fraction of precipitation in small basins. This means that using the LAR to study small basins should not produce significantly different results than the traditional land reservoir. Establishing the limiting scale is an intriguing study direction for future research. Furthermore, studying small basins through the LAR lens is limited by the availability of atmospheric convergence estimates at the same scale. One could obtain these estimates with high-resolution atmospheric models, but they are not widely available, such as reanalysis data for large basins.
3.5 The reservoir analogy
We use an artificial reservoir as an analogy to interpret our results. An artificial reservoir regulates river discharge either by mitigating floods through water accumulation or by enhancing low flows through water release, changing the river discharge regime. This reservoir's capacity to regulate discharge depends on the available volume to accumulate water during wet seasons and floods or to release previously stored water during dry seasons and droughts. Analogously, a basin's LAR can accumulate or release water, leading to discharge regulation.
A basin's capacity to regulate river discharge depends on a complex and dynamic balance between accumulation and release processes (e.g., Fig. 3a) occurring within the whole LAR, not just within the land reservoir alone. When a basin receives excessive water from the exterior (e.g., wet season) due to climate forcing (e.g., climate change or variability), discharge regulation manifests through temporal storage of water within the LAR, leading to discharge reduction, e.g., flood mitigation. Conversely, if the external water input is small (e.g., dry season or drought linked to reduced Q), regulating discharge (increasing low flow) requires the basin to release previously stored water.
The discovered trends (Fig. 4) affect these basins' regulation capacity, potentially compromising their river discharge regimes and sustainability. As the regulation capacity requires available volume to store water during wet seasons (increased Q), a prolonged positive trend in LAR water accumulation (as we found in low-latitude basins) tends to reduce the LAR's capacity to store water. If continued, this trend will weaken the low-latitude basins' capacity to regulate river discharge by accumulating water. Such reduced storage capacity can combine with precipitation intensification due to climate change (Westra et al., 2013; Zhang et al., 2013) to weaken the low-latitude basins' capacity to mitigate (regulate) floods. We think that this regulation weakening in the LAR is a previously unknown mechanism behind the marked increase in very severe floods observed over recent decades in the Amazon (Marengo and Espinoza, 2016; Barichivich et al., 2018), related but not limited to a reduced land reservoir storage capacity (Reager and Famiglietti, 2009).
The trend reversal in the Congo Basin (around the year 2000, the trend slope changes from positive to negative; Fig. 4) suggests the possibility of longer-scale transitions between accumulation and release periods, possibly leading to regulation patterns at the scale of centuries. The possibility of confirming this is limited by the length of available records. Regardless of the case, decadal trends and their impacts can strongly affect river discharge regimes and should be monitored.
The negative trend in the LAR water storage reduces the high-latitude basins' capacity to enhance low flow by releasing previously stored water. Hence, if continued, these negative trends can combine with more extreme droughts due to climate change (Mann and Gleick, 2015) to weaken these basins' capacity to regulate low flows. Continuous storage reduction in the Ob and Yenisei rivers coincides with permafrost thawing, which is a driver of discharge increase in these Siberian basins, especially in winter (Wang et al., 2021) (see also Fig. A10e, f). Analogously, our results suggest that the observed increase in the Mississippi River discharge (Shi et al., 2019) has occurred at the expense of a storage reduction that is noticeable in the LAR (Fig. 4). Non-perennial rivers and streams are common in the Mississippi, Ob, and Yenisei basins (Messager et al., 2021) and will become more common if the LAR drying trends continue.
This reservoir analogy and the foundations of the LAR concept were inspired by the works of Sivapalan (2006, 2018) and McDonnell et al. (2007), among other publications of these same authors and collaborators. Three critical ideas of such perspectives about the evolution of hydrology, which we applied in developing the LAR framework, are as follows:
-
River basins are complex systems with emergent properties and patterns that can be observable despite their inherent complexity and heterogeneity.
-
Water storage and release are two basic functions of any river basin; these functions depend on a combination of processes that can only be partially disentangled (e.g., by simplifying them in a model) but somehow summarize basins' complexity and heterogeneity and produce large-scale patterns such as the LAR trends.
-
We can learn about basins using a “top-down approach” that considers large-scale patterns (e.g., a trend in the LAR) first and then advances toward understanding the processes behind them. That is why we presented the hypothesis of different climate change effects, possibly explaining the latitudinal contrast in the trends.
3.6 Future directions
Going deeper with respect to explaining the LAR trends could be done in two ways. One way is to develop new models that use the LAR as a starting point for defining the control volume. This simple step leads to substantial changes relative to hydrological models developed with the land reservoir as the control volume. For instance, whereas precipitation is an external input in the latter, it is an internal flow in the former. Another way is to conduct basin-specific studies to explore the reasons for the LAR trends further. For instance, why there is a change in the trend in the Mississippi and Congo basins. This search for answers requires more specific studies of these basins.
We hope that the LAR framework will be relevant for different disciplines interested in rivers and basins, including catchment hydrology. Future directions might include the following ideas:
- i.
Water storage dynamics in large basins – which is critical for the sustainability of terrestrial ecosystems and societies – is not a terrestrial but, rather, a land–atmosphere dynamics, as explicitly incorporated into the LAR framework.
- ii.
The LAR trends should be monitored and discussed as a possible manifestation of climate change.
- iii.
Catchment hydrologists should consider whether the traditional land reservoir framework is enough for a specific study or whether the LAR is needed. In principle, the LAR is needed for large basins with powerful LMR, which are still often studied using the traditional land reservoir (e.g., see the examples reviewed by Posada-Marín and Salazar, 2022).
- iv.
The LAR highlights the importance of LMR for the water budget of large basins, emphasizing the link between LULC change, including tropical deforestation; river discharge; and, more broadly, water security.
- v.
Linking river discharge to LMR through the LAR contributes to current debates about the hydrological role of forests and deforestation impacts (e.g., the contrast between the supply- and demand-side thinking described by Ellison et al., 2011); the biotic pump concept (Makarieva and Gorshkov, 2007; Makarieva et al., 2013); the existence of forest-related tipping points affecting the atmospheric moisture transport (Zemp et al., 2014; Molina et al., 2019); and, therefore, the LAR storage dynamics.
We studied the water budget of six of the largest river basins on Earth (the Amazon, Paraná, Congo, Mississippi, Ob, and Yenisei) through the lens of the LAR. The LAR is a control volume that explicitly includes land–atmosphere interactions, such as moisture recycling, as part of these basins' internal dynamics. This definition contrasts with the more traditional perspective, which we described as the land reservoir, that considers the atmosphere external to river basins and precipitation as an external forcing.
Using observational and reanalysis data and the water budget equation for the LAR, we found trends in water storage within the studied basins' LAR, exhibiting a marked latitudinal contrast: while low-latitude basins are becoming wetter, high-latitude basins are becoming drier. These patterns result from long-term imbalances in which low-latitude basins have received more water through the atmosphere than they have released through river discharge. The opposite has occurred in high-latitude basins. As for our uncertainty analysis, these trends are robust.
If continued, the observed trends may disrupt the basins' river discharge regimes. More specifically, sustained long-term increases in the water storage of the low-latitude basin's LAR (wetting trends) could reduce these basins' capacity to mitigate floods through water storage during wet seasons. Likewise, drying trends can reduce the high-latitude basins' capacity to sustain low flows by releasing previously stored water during dry seasons or droughts. The LAR provides a framework for monitoring and further investigating these changes, which are critical for the sustainability of human societies and ecosystems in the face of climate change.
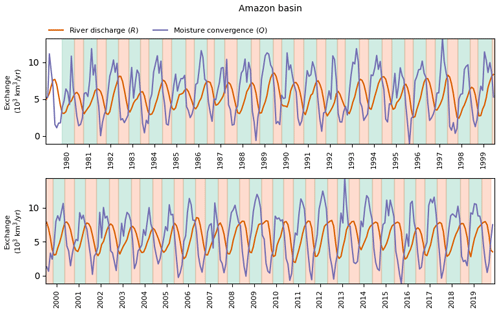
Figure A1Identification of the onset and end of accumulation (green) and release (orange) periods in the Amazon Basin.
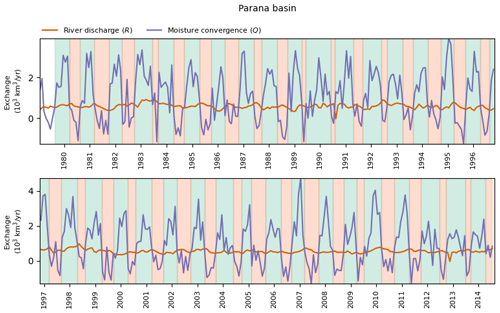
Figure A2Identification of the onset and end of accumulation (green) and release (orange) periods in the Paraná Basin.
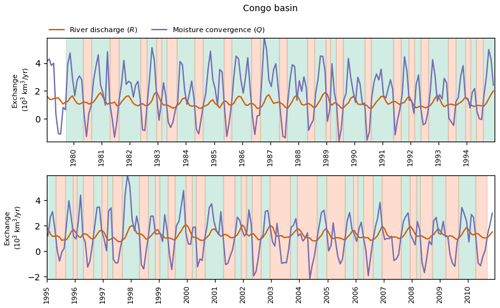
Figure A3Identification of the onset and end of accumulation (green) and release (orange) periods in the Congo Basin.
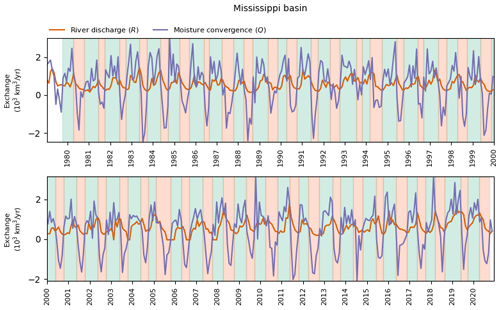
Figure A4Identification of the onset and end of accumulation (green) and release (orange) periods in the Mississippi Basin.
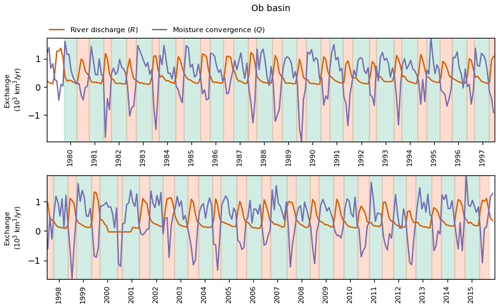
Figure A5Identification of the onset and end of accumulation (green) and release (orange) periods in the Ob Basin.
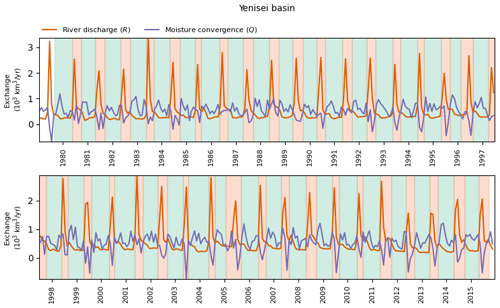
Figure A6Identification of the onset and end of accumulation (green) and release (orange) periods in the Yenisei Basin.
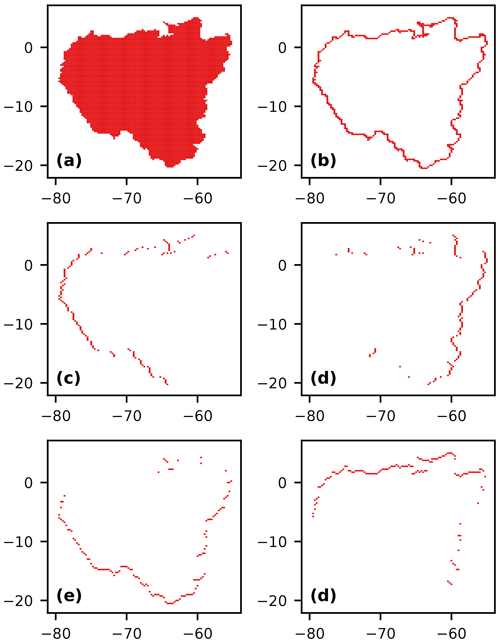
Figure A7Identification of the inflow and outflow edges used to compute moisture convergence in the Amazon Basin. Panel (a) shows the rasterization of the basin polygon with the ERA5 latitude–longitude rectangular grid. Panel (b) presents the identification of the basin contour edges. Panel (c) shows the inflow edges for eastward fluxes. Panel (d) presents the outflow edges for eastward fluxes. Panel (e) displays the inflow edges for northward fluxes. Panel (f) shows the outflow edges for northward fluxes.
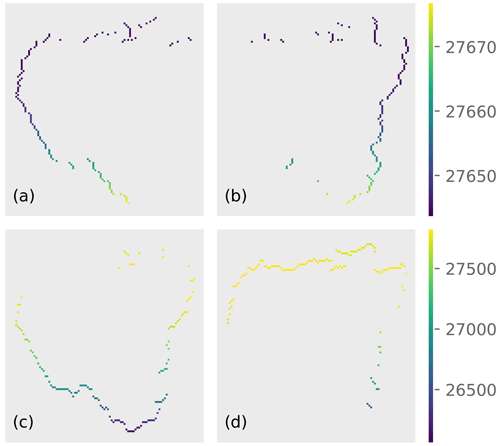
Figure A8Length (m) of the contour edges for the Amazon Basin. Panel (a) shows the inflow edges for eastward fluxes. Panel (b) presents the outflow edges for eastward fluxes. Panel (c) shows the inflow edges for northward fluxes. Panel (d) presents the outflow edges for northward fluxes.
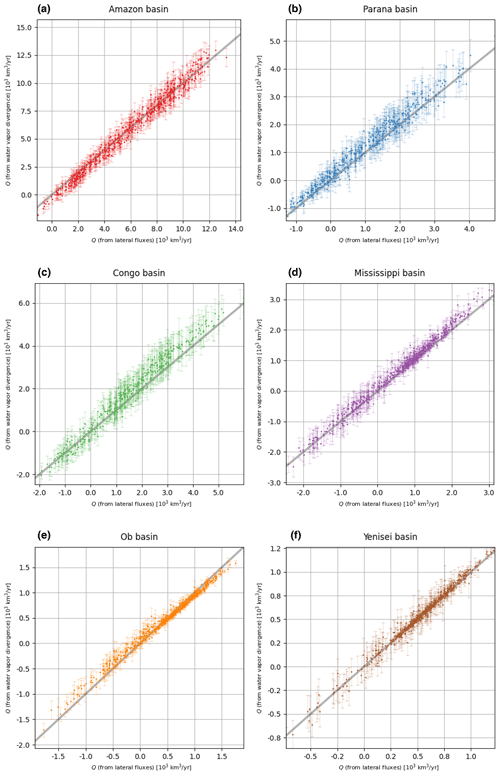
Figure A9Comparison of moisture convergence estimated from the vertically integrated water flux (Eq. 3; x axis) and vertical integral of the divergence of water vapor (Eq. 5; y axis) for all basins. Each point corresponds to the monthly average of Q(t) during the time span available in the ERA5 data products. Error bars are calculated with Eq. (8).
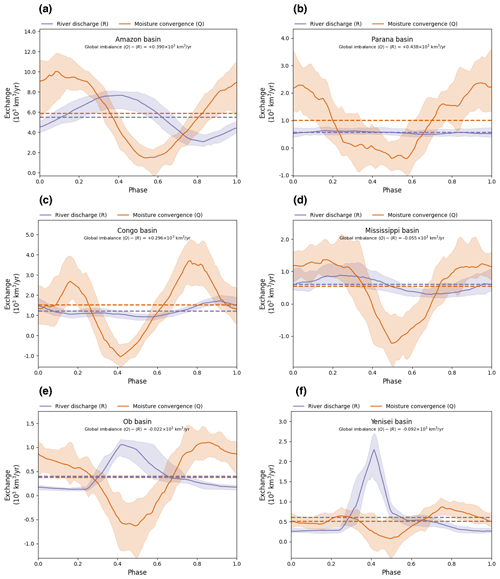
Figure A10Annual cycle of LAR exchanges for all basins. The solid line corresponds to the seasonal average and shaded area to the corresponding envelope. The dashed lines show the long-term average river discharge and moisture convergence.
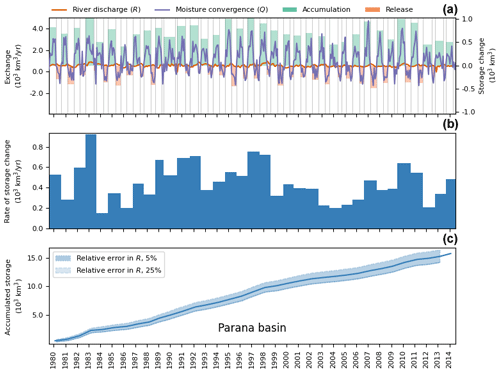
Figure A11LAR dynamics in the Paraná Basin. Panel (a) presents the monthly river discharge R and net atmospheric convergence Q (left axis). Green and orange bars show the extent and volume (right axis) of the respective accumulation and release periods. Panel (b) displays the net change in the LAR water storage after pairs of consecutive storage and release periods. Panel (c) presents the cumulative change in the LAR water storage, including the corresponding errors in convergence and estimated discharge uncertainties (shaded bands). The reader is referred to Sect. 2 for more details.
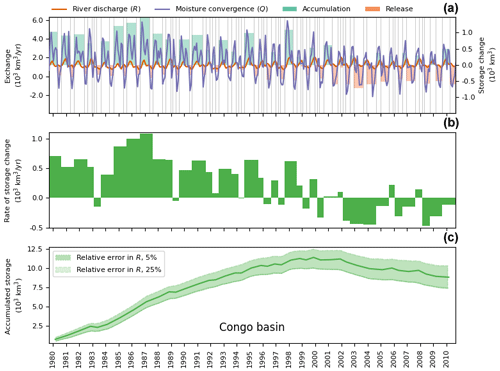
Figure A12LAR dynamics in the Congo Basin. Panel (a) presents the monthly river discharge R and net atmospheric convergence Q (left axis). Green and orange bars show the extent and volume (right axis) of the respective accumulation and release periods. Panel (b) displays the net change in the LAR water storage after pairs of consecutive storage and release periods. Panel (c) presents the cumulative change in the LAR water storage, including the corresponding errors in convergence and estimated discharge uncertainties (shaded bands). The reader is referred to Sect. 2 for more details.
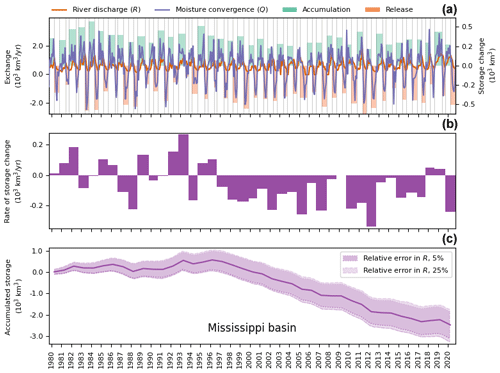
Figure A13LAR dynamics in the Mississippi Basin. Panel (a) presents the monthly river discharge R and net atmospheric convergence Q (left axis). Green and orange bars show the extent and volume (right axis) of the respective accumulation and release periods. Panel (b) displays the net change in the LAR water storage after pairs of consecutive storage and release periods. Panel (c) presents the cumulative change in the LAR water storage, including the corresponding errors in convergence and estimated discharge uncertainties (shaded bands). The reader is referred to Sect. 2 for more details.
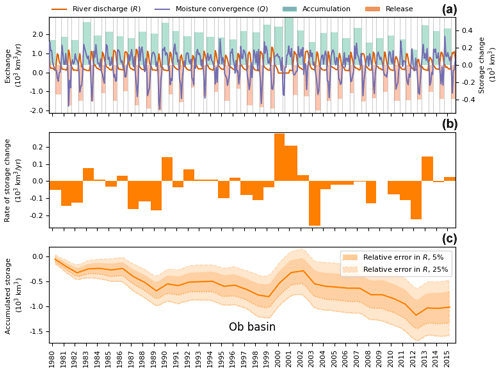
Figure A14LAR dynamics in the Ob Basin. Panel (a) presents the monthly river discharge R and net atmospheric convergence Q (left axis). Green and orange bars show the extent and volume (right axis) of the respective accumulation and release periods. Panel (b) displays the net change in the LAR water storage after pairs of consecutive storage and release periods. Panel (c) presents the cumulative change in the LAR water storage, including the corresponding errors in convergence and estimated discharge uncertainties (shaded bands). The reader is referred to Sect. 2 for more details.
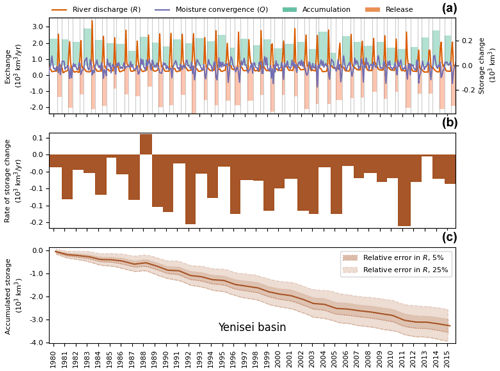
Figure A15LAR dynamics in the Yenisei Basin. Panel (a) presents the monthly river discharge R and net atmospheric convergence Q (left axis). Green and orange bars show the extent and volume (right axis) of the respective accumulation and release periods. Panel (b) displays the net change in the LAR water storage after pairs of consecutive storage and release periods. Panel (c) presents the cumulative change in the LAR water storage, including the corresponding errors in convergence and estimated discharge uncertainties (shaded bands). The reader is referred to Sect. 2 for more details.
The data used in this study are publicly available. ERA5 data were obtained from https://doi.org/10.24381/cds.f17050d7 (Hersbach et al., 2023), HYBAM data were obtained from https://hybam.obs-mip.fr/ (SO-HYBAM, 2023), and GRDC data were obtained from https://grdc.bafg.de/GRDC/EN/01_GRDC/13_dtbse/database_node.html (Global Runoff Data Centre, 2023).
The code (PyLAR) and data sets generated and/or analyzed by Juan F. Salazar, Ruben D. Molina, Jorge I. Zuluaga, and Jesus D. Gomez-Velez in this study are stored in a public repository: https://doi.org/10.5281/zenodo.12167661 (Solar, Earth and Planetary Physics Group, 2024).
JFS, RDM, JIZ, and JDG-V conceived the idea and methodological approach. JFS wrote the first draft of the manuscript. JFS, RDM, JIZ, and JDG-V ran the analyses and reviewed and edited the manuscript.
The contact author has declared that none of the authors has any competing interests.
Publisher's note: Copernicus Publications remains neutral with regard to jurisdictional claims made in the text, published maps, institutional affiliations, or any other geographical representation in this paper. While Copernicus Publications makes every effort to include appropriate place names, the final responsibility lies with the authors.
Juan F. Salazar (lead investigator), Ruben D. Molina,, and Jorge I. Zuluaga were funded by the Colombian Ministry of Science, Technology, and Innovation (Minciencias) through the SOS-Cuenca research program “SOStenibilidad de sistemas ecológicos y sociales en la CUENCA Magdalena-Cauca bajo escenarios de cambio climático y pérdida de bosques” (grant no. 1115-852-70719) with funds from “Patrimonio Autónomo Fondo Nacional de Financiamiento para la Ciencia, la Tecnología y la Innovación, Fondo Francisco José de Caldas”. Jesus D. Gomez-Velez was funded by the US Department of Energy, Office of Science, Biological and Environmental Research program. This work is a product of two programs: (i) the Environmental System Science Program, as part of the Watershed Dynamics and Evolution (WADE) science focus area (SFA) at ORNL and the IDEAS-Watersheds project, and (ii) the Data Management program, as part of the ExaSheds project. Additional support was provided by the National Science Foundation (grant nos. EAR-1830172, OIA-2020814, and OIA-2312326).
This research has been supported by the Ministerio de Ciencia, Tecnología e Innovación (MINCIENCIAS; grant no. 1115-852-70719), the National Science Foundation (grant nos. EAR-1830172, OIA-2020814, and OIA-2312326), and the US Department of Energy (the WADE SFA at Oak Ridge National Laboratory, the IDEAS-Watersheds project, and the ExaSheds project).
This paper was edited by Yongping Wei and reviewed by two anonymous referees.
Abbott, B. W., Bishop, K., Zarnetske, J. P., Minaudo, C., Chapin, F., Krause, S., Hannah, D. M., Conner, L., Ellison, D., Godsey, S. E., Plont, S., Marçais, J., Kolbe, T., Huebner, A., Frei, R. J., Hampton, T., Gu, S., Buhman, M., Sayedi, S. S., Ursache, O., Chapin, M., Henderson, K. D., and Pinay, G.: Human domination of the global water cycle absent from depictions and perceptions, Nat. Geosci., 12, 533–540, https://doi.org/10.1038/s41561-019-0374-y, 2019. a
Asch, M., Bocquet, M., and Nodet, M.: Data Assimilation, Fundamentals of Algorithms, Society for Industrial and Applied Mathematics, ISBN 978-1-61197-453-9, https://doi.org/10.1137/1.9781611974546, 2016. a
Barichivich, J., Gloor, E., Peylin, P., Brienen, R. J., Schöngart, J., Espinoza, J. C., and Pattnayak, K. C.: Recent intensification of Amazon flooding extremes driven by strengthened Walker circulation, Sci. Adv., 4, eaat8785, https://doi.org/10.1126/sciadv.aat8785, 2018. a, b
Best, J.: Anthropogenic stresses on the world's big rivers, Nat. Geosci., 12, 7–21, https://doi.org/10.1038/s41561-018-0262-x, 2019. a, b
Blyth, E. M., Arora, V. K., Clark, D. B., Dadson, S. J., De Kauwe, M. G., Lawrence, D. M., Melton, J. R., Pongratz, J., Turton, R. H., Yoshimura, K., Yuan, H.: Advances in land surface modelling, Curr. Clim. Change Rep., 7, 45–71, https://doi.org/10.1007/s40641-021-00171-5, 2021. a
Cochonneau, G., Sondag, F., Guyot, J.-L., Geraldo, B., Filizola, N., Fraizy, P., Laraque, A., Magat, P., Martinez, J.-M., Noriega, L., Oliveira, E., Ordonez, J., Pombosa, R., Seyler, F., Sidgwick, J., and Vauchel, P.: The Environmental Observation and Research project, ORE HYBAM, and the rivers of the Amazon basin, in: Climate variability and change: Hydrological impacts, edited by: Demuth, S., Gustard, A., Planos, E., Scatena, F., and Servat, E., IAHS Press, Havana, Cuba, 44–50, https://iahs.info/uploads/dms/13634.12-44-50-55-308-Cochonneau.pdf (last access: 28 September 2023), 2006. a
Coe, M. T., Costa, M. H., and Soares-Filho, B. S.: The influence of historical and potential future deforestation on the stream flow of the Amazon River–Land surface processes and atmospheric feedbacks, J. Hydrol., 369, 165–174, https://doi.org/10.1016/j.jhydrol.2009.02.043, 2009. a
Cohen, A. and Davidson, S.: The Watershed Approach: Challenges, Antecedents, and the Transition from Technical Tool to Governance Unit, Water Alternat., 4, 1–14, 2011. a
Costa, M. H. and Pires, G. F.: Effects of Amazon and Central Brazil deforestation scenarios on the duration of the dry season in the arc of deforestation, Int. J. Climatol., 30, 1970–1979, https://doi.org/10.1002/joc.2048, 2010. a
Devia, G. K., Ganasri, B. P., and Dwarakish, G. S.: A review on hydrological models, Aquat. Proced., 4, 1001–1007, https://doi.org/10.1016/j.aqpro.2015.02.126, 2015. a
Dominguez, F., Eiras-Barca, J., Yang, Z., Bock, D., Nieto, R., and Gimeno, L.: Amazonian moisture recycling revisited using WRF with water vapor tracers, J. Geophys. Res.-Atmos., 127, e2021JD035259, https://doi.org/10.1029/2021JD035259, 2022. a
Ellison, D., Futter, M. N., and Bishop, K.: On the forest cover-water yield debate: From demand- to supply-side thinking, Global Change Biol., 18, 806–820, https://doi.org/10.1111/j.1365-2486.2011.02589.x, 2011. a
Ellison, D., Futter, M. N., and Bishop, K.: On the forest cover–water yield debate: from demand-to supply-side thinking, Global Change Biol., 18, 806–820, 2012. a
Eltahir, E. A. B. and Bras, R. L.: Precipitation recycling in the Amazon basin, Q. J. Roy. Meteorol. Soc., 120, 861–880, https://doi.org/10.1002/qj.49712051806, 1994. a, b
Fu, R., Yin, L., Li, W., Arias, P. A., Dickinson, R. E., Huang, L., Chakraborty, S., Fernandes, K., Liebmann, B., Fisher, R., and Myneni, R. B.: Increased dry-season length over southern Amazonia in recent decades and its implication for future climate projection, P. Natl. Acad. Sci. USA, 110, 18110–18115, https://doi.org/10.1073/pnas.1302584110, 2013. a
Global Runoff Data Centre: GRDC, [data set], https://grdc.bafg.de/GRDC/EN/01_GRDC/13_dtbse/database_node.html, last access: 2 June 2023. a
Hersbach, H., Bell, B., Berrisford, P., Biavati, G., Horányi, A., Muñoz Sabater, J., Nicolas, J., Peubey, C., Radu, R., Rozum, I., Schepers, D., Simmons, A., Soci, C., Dee, D., and Thépaut, J.-N.: ERA5 monthly averaged data on single levels from 1979 to present, CDS [data set], https://doi.org/10.24381/cds.f17050d7, 2019. a
Hersbach, H., Bell, B., Berrisford, P., Hirahara, S., Horányi, A., Muñoz-Sabater, J., Nicolas, J., Peubey, C., Radu, R., Schepers, D., Simmons, A., Soci, C., Abdalla, S., Abellan, X., Balsamo, G., Bechtold, P., Biavati, G., Bidlot, J., Bonavita, M., De Chiara, G., Dahlgren, P., Dee, D., Diamantakis, M., Dragani, R., Flemming, J., Forbes, R., Fuentes, M., Geer, A., Haimberger, L., Healy, S., Hogan, R. J., Hólm, E., Janisková, M., Keeley, S., Laloyaux, P., Lopez, P., Lupu, C., Radnoti, G., de Rosnay, P., Rozum, I., Vamborg, F., Villaume, S., and Thépaut, J.-N.: The ERA5 global reanalysis, Q. J. Roy. Meteorol. Soc., 146, 1999–2049, https://doi.org/10.1002/qj.3803, 2020. a
Hersbach, H., Bell, B., Berrisford, P., Biavati, G., Horányi, A., Muñoz Sabater, J., Nicolas, J., Peubey, C., Radu, R., Rozum, I., Schepers, D., Simmons, A., Soci, C., Dee, D., and Thépaut, J.-N.: ERA5 monthly averaged data on single levels from 1940 to present, Copernicus Climate Change Service (C3S) Climate Data Store (CDS) [data set], https://doi.org/10.24381/cds.f17050d7, 2023. a
Hoek van Dijke, A. J., Herold, M., Mallick, K., Benedict, I., Machwitz, M., Schlerf, M., Pranindita, A., Theeuwen, J. J., Bastin, J.-F., and Teuling, A. J.: Shifts in regional water availability due to global tree restoration, Nat. Geosci., 15, 363–368, https://doi.org/10.1038/s41561-022-00935-0, 2022. a
Jiménez-Muñoz, J. C., Mattar, C., Barichivich, J., Santamaría-Artigas, A., Takahashi, K., Malhi, Y., Sobrino, J. A., and v. d. Schrier, G.: Record-breaking warming and extreme drought in the Amazon rainforest during the course of El Niño 2015–2016, Sci. Rep., 6, 1–7, https://doi.org/10.1038/srep33130, 2016. a
Jing, W., Zhang, P., and Zhao, X.: A comparison of different GRACE solutions in terrestrial water storage trend estimation over Tibetan Plateau, Sci. Rep., 9, 1765, https://doi.org/10.1038/s41598-018-38337-1, 2019. a, b, c
Keys, P. W., van der Ent, R. J., Gordon, L. J., Hoff, H., Nikoli, R., and Savenije, H. H. G.: Analyzing precipitationsheds to understand the vulnerability of rainfall dependent regions, Biogeosciences, 9, 733–746, https://doi.org/10.5194/bg-9-733-2012, 2012. a
Kuil, L., Carr, G., Viglione, A., Prskawetz, A., and Blöschl, G.: Conceptualizing socio-hydrological drought processes: The case of the Maya collapse, Water Resour. Res., 52, 6222–6242, https://doi.org/10.1002/2015WR018298, 2016. a, b
Lausier, A. M. and Jain, S.: Overlooked trends in observed global annual precipitation reveal underestimated risks, Sci. Rep., 8, 1–7, https://doi.org/10.1038/s41598-018-34993-5, 2018. a
Li, L., Ni, J., Chang, F., Yue, Y., Frolova, N., Magritsky, D., Borthwick, A. G., Ciai, P., Wang, Y., Zhen, C., and Walling, D. E.: Global trends in water and sediment fluxes of the world’s large rivers, Sci. Bull., 65, 62–69, https://doi.org/10.1016/j.scib.2019.09.012, 2020. a
Li, X., Long, D., Scanlon, B. R., Mann, M. E., Li, X., Tian, F., Sun, Z., and Wang, G.: Climate change threatens terrestrial water storage over the Tibetan Plateau, Nat. Clim. Change, 12, 801–807, https://doi.org/10.1038/s41558-022-01443-0, 2022. a, b
Libonati, R., Pereira, J., Da Camara, C., Peres, L., Oom, D., Rodrigues, J., Santos, F., Trigo, R., Gouveia, C., Machado-Silva, F., Enrich-Prast, A., and Silva, J. M. N.: Twenty-first century droughts have not increasingly exacerbated fire season severity in the Brazilian Amazon, Sci. Rep., 11, 1–13, https://doi.org/10.1038/s41598-021-82158-8, 2021. a
Makarieva, A. M. and Gorshkov, V. G.: Biotic pump of atmospheric moisture as driver of the hydrological cycle on land, Hydrol. Earth Syst. Sci., 11, 1013–1033, https://doi.org/10.5194/hess-11-1013-2007, 2007. a
Makarieva, A. M., Gorshkov, V. G., and Li, B.-L.: Revisiting forest impact on atmospheric water vapor transport and precipitation, Theor. Appl. Climatol., 111, 79–96, https://doi.org/10.1007/s00704-012-0643-9, 2013. a
Mann, M. E. and Gleick, P. H.: Climate change and California drought in the 21st century, P. Natl. Acad. Sci. USA, 112, 3858–3859, https://doi.org/10.1073/pnas.1503667112, 2015. a
Marengo, J. A. and Espinoza, J. C.: Extreme seasonal droughts and floods in Amazonia: Causes, trends and impacts, Int. J. Climatol., 36, 1033–1050, https://doi.org/10.1002/joc.4420, 2016. a
Marengo, J. A., Tomasella, J., Alves, L. M., Soares, W. R., and Rodriguez, D. A.: The drought of 2010 in the context of historical droughts in the Amazon region, Geophys. Res. Lett., 38, L12703, https://doi.org/10.1029/2011GL047436, 2011. a, b
McDonnell, J., Sivapalan, M., Vaché, K., Dunn, S., Grant, G., Haggerty, R., Hinz, C., Hooper, R., Kirchner, J., Roderick, M., Selker, J., and Weiler, M.: Moving beyond heterogeneity and process complexity: A new vision for watershed hydrology, Water Resour. Res., 43, W07301, https://doi.org/10.1029/2006WR005467, 2007. a, b
Mekonnen, M. M. and Hoekstra, A. Y.: Four billion people facing severe water scarcity, Sci. Adv., 2, e1500323, https://doi.org/10.1126/sciadv.1500323, 2016. a
Messager, M. L., Lehner, B., Cockburn, C., Lamouroux, N., Pella, H., Snelder, T., Tockner, K., Trautmann, T., Watt, C., and Datry, T.: Global prevalence of non-perennial rivers and streams, Nature, 594, 391–397, https://doi.org/10.1038/s41586-021-03565-5, 2021. a
Molina, R. D., Salazar, J. F., Martínez, J. A., Villegas, J. C., and Arias, P. A.: Forest-induced exponential growth of precipitation along climatological wind streamlines over the Amazon, J. Geophys. Res.-Atmos., 124, 2589–2599, https://doi.org/10.1029/2018jd029534, 2019. a
Nepstad, D., Lefebvre, P., Lopes da Silva, U., Tomasella, J., Schlesinger, P., Solórzano, L., Moutinho, P., Ray, D., and Guerreira Benito, J.: Amazon drought and its implications for forest flammability and tree growth: A basin-wide analysis, Global Change Biol., 10, 704–717, https://doi.org/10.1111/j.1529-8817.2003.00772.x, 2004. a
Pabón-Caicedo, J. D., Arias, P. A., Carril, A. F., Espinoza, J. C., Borrel, L. F., Goubanova, K., Lavado-Casimiro, W., Masiokas, M., Solman, S., and Villalba, R.: Observed and projected hydroclimate changes in the Andes, Front. Earth Sci., 8, 61, https://doi.org/10.3389/feart.2020.00061, 2020. a, b
Palmer, M. A., Reidy Liermann, C. A., Nilsson, C., Flörke, M., Alcamo, J., Lake, P. S., and Bond, N.: Climate change and the world's river basins: Anticipating management options, Front. Ecol. Environ., 6, 81–89, https://doi.org/10.1890/060148, 2008. a
Pan, M., Sahoo, A. K., Troy, T. J., Vinukollu, R. K., Sheffield, J., and Wood, E. F.: Multisource estimation of long-term terrestrial water budget for major global river basins, J. Climate, 25, 3191–3206, https://doi.org/10.1175/JCLI-D-11-00300.1, 2012. a, b, c, d
Posada-Marín, J. A. and Salazar, J. F.: River flow response to deforestation: Contrasting results from different models, Water Secur., 15, 100115, https://doi.org/10.1016/j.wasec.2022.100115, 2022. a, b, c, d, e, f, g
Posada-Marín, J. A., Arias, P. A., Jaramillo, F., and Salazar, J. F.: Global impacts of El Niño on terrestrial moisture recycling, Geophys. Res. Lett., 50, e2023GL103147, https://doi.org/10.1029/2023GL103147, 2023. a, b
Poveda, G. and Pineda, K.: Reassessment of Colombia's tropical glaciers retreat rates: Are they bound to disappear during the 2010–2020 decade?, Adv. Geosci., 22, 107–116, https://doi.org/10.5194/adgeo-22-107-2009, 2009. a
Poveda, G., Vélez, J. I., Mesa, O. J., Cuartas, A., Barco, J., Mantilla, R. I., Mejía, J. F., Hoyos, C. D., Ramírez, J. M., Ceballos, L. I., Zuluaga, M. D., Arias, P. A., Botero, B. A., Montoya, M. I., Giraldo, J. D., and Quevedo, D. I.: Linking long-term water balances and statistical scaling to estimate river flows along the drainage network of Colombia, J. Hydrol. Eng., 12, 4–13, https://doi.org/10.1061/(ASCE)1084-0699(2007)12:1(4), 2007. a
Reager, J. T. and Famiglietti, J. S.: Global terrestrial water storage capacity and flood potential using GRACE, Geophys. Res. Lett., 36, L23402, https://doi.org/10.1029/2009GL040826, 2009. a
Ruiz-Vásquez, M., Arias, P. A., Martínez, J. A., and Espinoza, J. C.: Effects of Amazon basin deforestation on regional atmospheric circulation and water vapor transport towards tropical South America, Clim. Dynam., 54, 4169–4189, https://doi.org/10.1007/s00382-020-05223-4, 2020. a, b
Salazar, J. F., Villegas, J. C., Rendón, A. M., Rodríguez, E., Hoyos, I., Mercado-Bettín, D., and Poveda, G.: Scaling properties reveal regulation of river flows in the Amazon through a “forest reservoir”, Hydrol. Earth Syst. Sci., 22, 1735–1748, https://doi.org/10.5194/hess-22-1735-2018, 2018. a
Sawyer, A. H., David, C. H., and Famiglietti, J. S.: Continental patterns of submarine groundwater discharge reveal coastal vulnerabilities, Science, 353, 705–707, https://doi.org/10.1126/science.aag1058, 2016. a
Scanlon, B. R., Zhang, Z., Save, H., Sun, A. Y., Schmied, H. M., Van Beek, L. P., Wiese, D. N., Wada, Y., Long, D., Reedy, R. C., Longuevergne, L., Döll, P., and Bierkens, M. F. P.: Global models underestimate large decadal declining and rising water storage trends relative to GRACE satellite data, P. Natl. Acad. Sci. USA, 115, E1080–E1089, https://doi.org/10.1073/pnas.1704665115, 2018. a, b, c, d, e, f, g, h, i
Schneider, U., Becker, A., Finger, P., Rustemeier, E., and Ziese, M.: GPCC Full Data Monthly Product Version 2020 at 0.25°: Monthly Land-Surface Precipitation from Rain-Gauges built on GTS-based and Historical Data, DWD, https://doi.org/10.5676/DWD_GPCC/FD_M_V2020_025, 2020. a
Shi, X., Qin, T., Nie, H., Weng, B., and He, S.: Changes in major global river discharges directed into the ocean, Int. J. Environ. Res. Publ. Health, 16, 1469, https://doi.org/10.3390/ijerph16081469, 2019. a
Sivapalan, M.: Pattern, process and function: elements of a unified theory of hydrology at the catchment scale, in: Encyclopedia of Hydrological Sciences, edited by: Anderson, M. G., Wiley, https://doi.org/10.1002/0470848944.hsa012, 2005. a
Sivapalan, M.: Pattern, process and function: elements of a unified theory of hydrology at the catchment scale, Encyclopedia of hydrological sciences, https://doi.org/10.1002/0470848944.hsa012, 2006. a
Sivapalan, M.: From engineering hydrology to Earth system science: milestones in the transformation of hydrologic science, Hydrol. Earth Syst. Sci., 22, 1665–1693, https://doi.org/10.5194/hess-22-1665-2018, 2018. a
SO-HYBAM: Amazon basin water resources observation service: HYBAM data, https://hybam.obs-mip.fr/, last access: 2 June 2023. a
Solar, Earth and Planetary Physics Group: seap-udea/pylar: First public release (v0.0.1), Zenodo [code], https://doi.org/10.5281/zenodo.12167661, 2024 . a
Sood, A. and Smakhtin, V.: Global hydrological models: a review, Hydrolog. Sci. J., 60, 549–565, https://doi.org/10.1080/02626667.2014.950580, 2015. a
Staal, A., Tuinenburg, O. A., Bosmans, J. H., Holmgren, M., van Nes, E. H., Scheffer, M., Zemp, D. C., and Dekker, S. C.: Forest-rainfall cascades buffer against drought across the Amazon, Nat. Clim. Change, 8, 539–543, https://doi.org/10.1038/s41558-018-0177-y, 2018. a
Syed, T., Famiglietti, J., Chen, J., Rodell, M., Seneviratne, S. I., Viterbo, P., and Wilson, C.: Total basin discharge for the Amazon and Mississippi River basins from GRACE and a land-atmosphere water balance, Geophys. Res. Lett., 32, L24404, https://doi.org/10.1029/2005GL024851, 2005. a
Taylor, J. R.: An Introduction to Error Analysis: The Study of Uncertainties in Physical Measurements, in: 2nd Edn., University Science Books, ISBN 9780935702750, 1997. a, b
te Wierik, S. A., Cammeraat, E. L., Gupta, J., and Artzy-Randrup, Y. A.: Reviewing the Impact of Land Use and Land-Use Change on Moisture Recycling and Precipitation Patterns, Water Resour. Res., 57, e2020WR029234, https://doi.org/10.1029/2020WR029234, 2021. a, b, c
Tomasella, J., Borma, L. S., Marengo, J. A., Rodriguez, D. A., Cuartas, L. A., A. Nobre, C., and Prado, M. C.: The droughts of 1996–1997 and 2004–2005 in Amazonia: Hydrological response in the river main-stem, Hydrol. Process., 25, 1228–1242, https://doi.org/10.1002/hyp.7889, 2011. a
Trenberth, K. E., Smith, L., Qian, T., Dai, A., and Fasullo, J.: Estimates of the Global Water Budget and Its Annual Cycle Using Observational and Model Data, J. Hydrometeorol., 8, 758–769, https://doi.org/10.1175/jhm600.1, 2007. a, b
Tuinenburg, O. A., Theeuwen, J. J., and Staal, A.: High-resolution global atmospheric moisture connections from evaporation to precipitation, Earth Syst. Sci. Data, 12, 3177–3188, https://doi.org/10.5194/essd-12-3177-2020, 2020. a, b, c
Tyukavina, A., Hansen, M. C., Potapov, P. V., Stehman, S. V., Smith-Rodriguez, K., Okpa, C., and Aguilar, R.: Types and rates of forest disturbance in Brazilian Legal Amazon, 2000–2013, Sci. Adv., 3, e1601047, https://doi.org/10.1126/sciadv.1601047, 2017. a
van der Ent, R. J., Savenije, H. H., Schaefli, B., and Steele-Dunne, S. C.: Origin and fate of atmospheric moisture over continents, Water Resour. Res., 46, W09525, https://doi.org/10.1029/2010WR009127, 2010. a
Vörösmarty, C. J., McIntyre, P. B., Gessner, M. O., Dudgeon, D., Prusevich, A., Green, P., Glidden, S., Bunn, S. E., Sullivan, C. A., Liermann, C. R., and Davies, P. M.: Global threats to human water security and river biodiversity, Nature, 467, 555–561, https://doi.org/10.1038/nature09440, 2010. a
Wahr, J., Swenson, S., Zlotnicki, V., and Velicogna, I.: Time-variable gravity from GRACE: First results, Geophys. Res. Lett., 31, L11501, https://doi.org/10.1029/2004GL019779, 2004. a
Wang, P., Huang, Q., Pozdniakov, S. P., Liu, S., Ma, N., Wang, T., Zhang, Y., Yu, J., Xie, J., Fu, G., Frolova, N. L., and Liu, C.: Potential role of permafrost thaw on increasing Siberian river discharge, Environ. Res. Lett., 16, 034046, https://doi.org/10.1088/1748-9326/abe326, 2021. a
Wang-Erlandsson, L., Fetzer, I., Keys, P. W., Van Der Ent, R. J., Savenije, H. H., and Gordon, L. J.: Remote land use impacts on river flows through atmospheric teleconnections, Hydrol. Earth Syst. Sci., 22, 4311–4328, https://doi.org/10.5194/hess-22-4311-2018, 2018. a, b
Wang-Erlandsson, L., Tobian, A., van der Ent, R. J., Fetzer, I., te Wierik, S., Porkka, M., Staal, A., Jaramillo, F., Dahlmann, H., Singh, C., Greve, P., Gerten, D., Keys, P. W., Gleeson, T., Cornell, S. E., Steffen, W., Bai, X., and Rockström, J.: A planetary boundary for green water, Nat. Rev. Earth Environ., 3, 380–392, https://doi.org/10.1038/s43017-022-00287-8, 2022. a
Westra, S., Alexander, L. V., and Zwiers, F. W.: Global increasing trends in annual maximum daily precipitation, J. Climate, 26, 3904–3918, https://doi.org/10.1175/JCLI-D-12-00502.1, 2013. a
Wright, J. S., Fu, R., Worden, J. R., Chakraborty, S., Clinton, N. E., Risi, C., Sun, Y., and Yin, L.: Rainforest-initiated wet season onset over the southern Amazon, P. Natl. Acad. Sci. USA, 114, 8481–8486, https://doi.org/10.1073/pnas.1621516114, 2017. a
Xiong, J., Guo, S., Abhishek, Chen, J., and Yin, J.: Global evaluation of the “dry gets drier, and wet gets wetter” paradigm from a terrestrial water storage change perspective, Hydrol. Earth Syst. Sci., 26, 6457–6476, https://doi.org/10.5194/hess-26-6457-2022, 2022. a, b, c
Zaitchik, B. F., Rodell, M., Biasutti, M., and Seneviratne, S. I.: Wetting and drying trends under climate change, Nat. Water, 1, 502–513, https://doi.org/10.1038/s44221-023-00073-w, 2023. a, b
Zemp, D. C., Schleussner, C.-F., Barbosa, H. M. J., van der Ent, R. J., Donges, J. F., Heinke, J., Sampaio, G., and Rammig, A.: On the importance of cascading moisture recycling in South America, Atmos. Chem. Phys., 14, 13337–13359, https://doi.org/10.5194/acp-14-13337-2014, 2014. a
Zhang, M., Liu, N., Harper, R., Li, Q., Liu, K., Wei, X., Ning, D., Hou, Y., and Liu, S.: A global review on hydrological responses to forest change across multiple spatial scales: Importance of scale, climate, forest type and hydrological regime, J. Hydrol., 546, 44–59, https://doi.org/10.1016/j.jhydrol.2016.12.040, 2017. a, b
Zhang, X., Wan, H., Zwiers, F. W., Hegerl, G. C., and Min, S.-K.: Attributing intensification of precipitation extremes to human influence, Geophys. Res. Lett., 40, 5252–5257, https://doi.org/10.1002/grl.51010, 2013. a
Zhang, Y., He, B., Guo, L., Liu, J., and Xie, X.: The relative contributions of precipitation, evapotranspiration, and runoff to terrestrial water storage changes across 168 river basins, J. Hydrol., 579, 124194, https://doi.org/10.1016/j.jhydrol.2019.124194, 2019. a, b, c


