the Creative Commons Attribution 4.0 License.
the Creative Commons Attribution 4.0 License.
 | 21 Jun 2024
The development of an operational system for estimating irrigation water use reveals socio-political dynamics in Ukraine
Paolo Filippucci
Luca Brocca
Irrigation is the main driver of crop production in many agricultural regions across the world. The estimation of irrigation water has the potential to enhance our comprehension of the Earth system, thus providing crucial data for food production.
In this study, we have created a unique operational system for estimating irrigation water using data from satellite soil moisture, reanalysis precipitation, and potential evaporation. As a proof of concept, we implemented the method at a high resolution (1 km) during the period of 2015–2023 over the area south of the Kakhovka Dam in Ukraine, which collapsed on 6 June 2023. The selected study area enabled us to showcase that our operational system is able to track the effect of the pandemic and conflict on the irrigation water supply. Significant decreases of 63 % and 44 % in irrigation water compared to the mean irrigation water between 2015 and 2023 have been identified as being linked to the collapse of the dam and, potentially, to the COVID-19 pandemic, respectively.
- Article
(7218 KB) - Full-text XML
- BibTeX
- EndNote


In recent years, Europe has experienced a number of catastrophic events, including the COVID-19 pandemic and the conflict in Ukraine. The effects of these events are far-reaching and impact all sectors of society, including agriculture and food production (Van Tricht et al., 2023). Ukraine is among the largest wheat producers in Europe and is indeed known as the breadbasket of Europe. It is crucial to comprehend the impact of these catastrophic events on crop production in Ukraine, particularly in the conflict-affected Kherson region. Crop production in the Kherson area south of the Kakhovka Dam heavily depends on irrigation that is facilitated by the Kakhovka Reservoir. As the Kakhovka Dam's collapse on 6 June 2023 is anticipated to have had a significant impact on crop production, it could be evaluated by examining the variability over time of irrigation water use in the area.
Thanks to the advances in satellite technology, such as, for instance, the launch of the Sentinel constellation under the Copernicus program, remote sensing has recently enabled the acquisition of irrigation water use measurements (Massari et al., 2021; McDermid et al., 2023), enabling large areas to be monitored in a consistent and equitable manner. This circumstance opens unprecedented perspectives in water resources management in human-altered basins. In fact, irrigation represents the largest component of anthropogenic water use (Foley et al., 2011; Dorigo et al., 2021), with impacts on several components of the Earth system and social dynamics (McDermid et al., 2023). In general, satellite observations of hydrological variables that can be a proxy for irrigation occurrence are used to estimate irrigation volumes as long as the condition of a matching between the spatio-temporal resolution of the observational data and the spatial and temporal scales of irrigation dynamics is satisfied (Dari et al., 2022a; Zappa et al., 2022). Specifically, approaches based on satellite soil moisture (e.g., Lawston et al., 2017; Brocca et al., 2018; Dari et al., 2020) and evaporation (e.g., Bretreger et al., 2022; Brombacher et al., 2022; Kragh et al., 2023) products have been developed in recent years. An example integrating both soil moisture and evaporation products is the inversion approach based on soil moisture (SM) developed by Dari et al. (2023) as an evolution of the SM2RAIN (Soil Moisture to RAINfall) algorithm, which was originally designed to estimate rainfall from satellite soil moisture (Brocca et al., 2014). Promising preliminary results were shown by Brocca et al. (2018) and Filippucci et al. (2020) by means of a coarse-resolution satellite and in situ soil moisture, respectively. Concurrently, a few studies demonstrated the importance of considering the evapotranspiration term within the algorithm structure together with SM (Jalilvand et al., 2019; Dari et al., 2020, 2022b). The first implementation with high-resolution satellite soil moisture as an input was proposed by Dari et al. (2020). The authors produced a data set of irrigation estimates at 1 km spatial resolution over a heavily irrigated portion of the Ebro Basin in Spain, covering the period 2011–2017. Recently, the SM-based inversion approach has been implemented under the European Space Agency (ESA) Irrigation+ project for producing the first regional-scale, high-resolution data sets over three major basins worldwide (Dari et al., 2023). In a nutshell, the SM-based inversion approach proved itself to be a useful tool for estimating irrigation water use across scales; the following natural step is the exploration of the possibility of building an operational system based on it, as currently no operational services for monitoring large-scale irrigation are available.
In this study, we have developed for the first time an operational system for monitoring irrigation water use, with a 10 d latency, relying on the SM-based inversion approach forced with operational-satellite-based surface soil moisture data and precipitation and evaporation data from reanalysis.
As a proof of concept, the operational system for monitoring irrigation water use from satellite data has been implemented over a cold semi-arid area (Beck et al., 2018) that encloses a heavily irrigated portion fed by the Kakhovka Reservoir on the Dnieper River (approximate length of 2200 km and average flow at the outlet of 53 km3 yr−1 under natural conditions) in Ukraine, which collapsed on 6 June 2023. Under operating conditions, the store capacity was of 18.2 km3, corresponding to an extent of water surface equal to 2155 km2. We selected a box of almost 4000 km2 whose extension ranges from 33.30 to 34.45° in longitude and from 46.15 to 46.50° in latitude. This is the area fed by the Kakhovsky Canal, which originates just upstream of the dam and delivers water to five irrigation districts through an efficient and automated network; the districts are equipped with a dense system of center pivot that was mainly realized between the late 1970s and 1980s as part of the development of the Kakhova system, which was completed in 1990 (Kuns, 2018) and represents one of the largest irrigated areas in Europe. The dense system of center-pivot irrigation equipment can be observed by visual inspection of satellite maps (see, e.g., Fig. 1a). For the selected area, the latest version of the Global Map of Irrigated Areas (GMIA) (Mehta et al., 2022) reports peaks of up to 60 % in terms of the percentage of area equipped for irrigation. The data set refers to cells characterized by a spatial resolution of 5 arcmin (about 10 km at the Equator). Reznik et al. (2016) report a percentage of irrigated areas equal to 83.3 % of the total available area in 2015. Based on statistical surveys, the main cropping season for cereal and other annual crops in Ukraine is from May to August (Portmann et al., 2008).
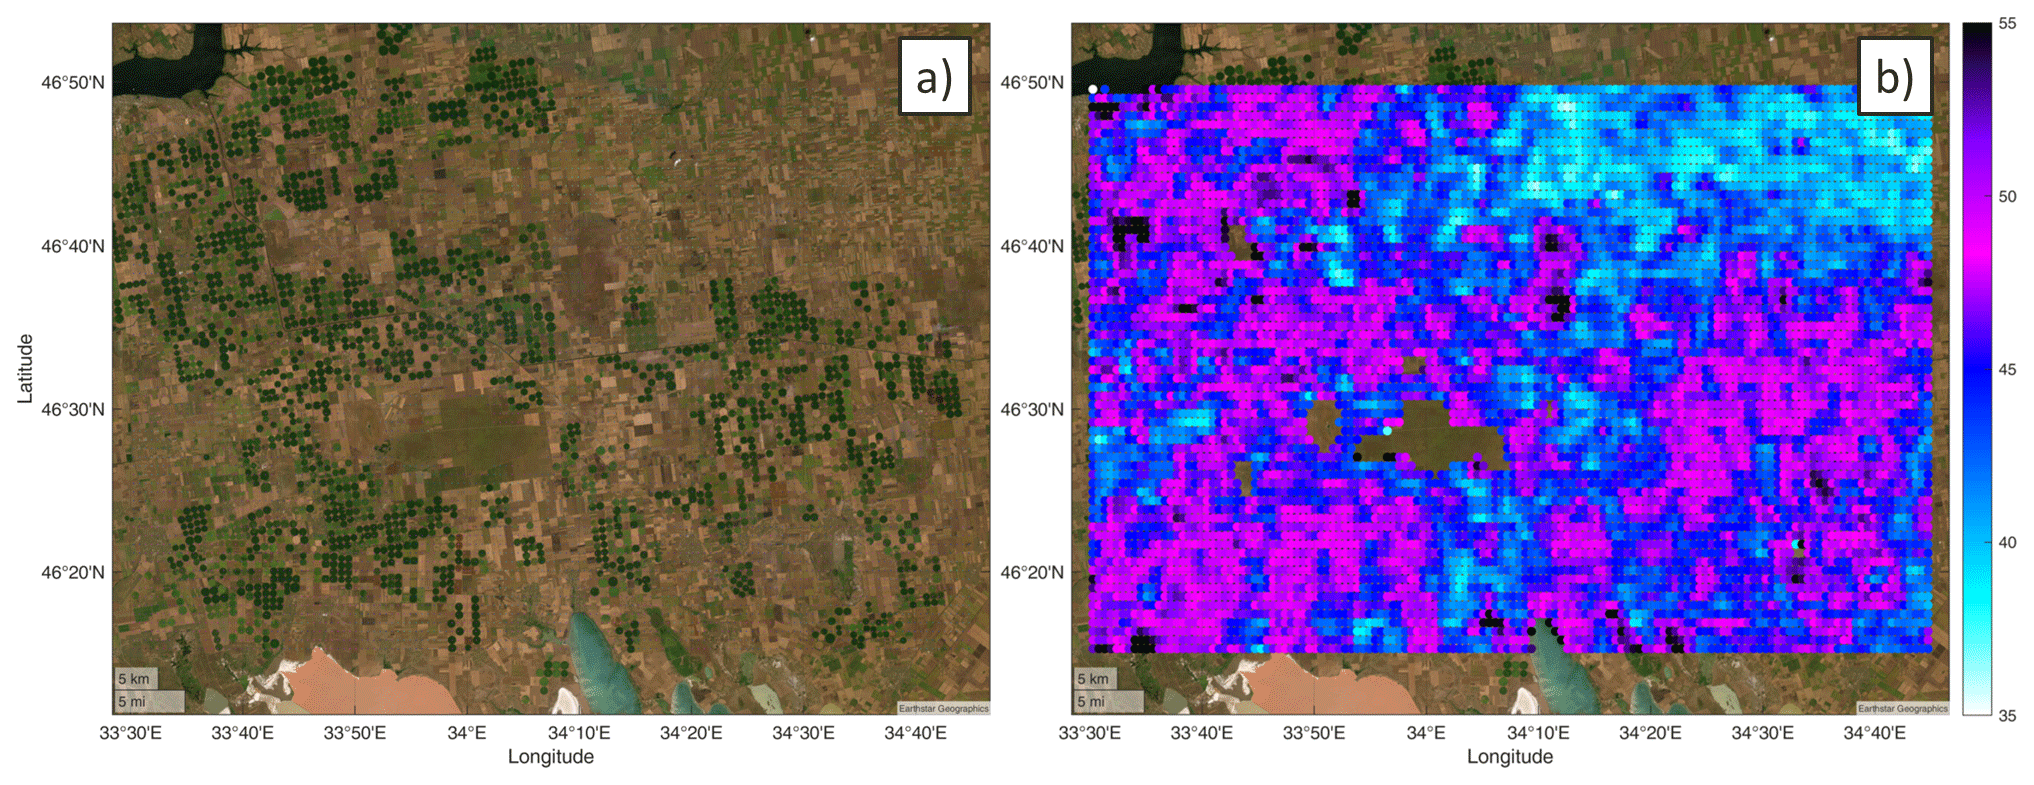
Figure 1(a) Satellite map of the study area (Earthstar Geographics), in which green circles represent the center-pivot irrigation equipment. (b) Mean soil moisture map as obtained from the Sentinel-1 CGLS product. Areas with mean values greater than 45 % are in very good agreement with the presence of center-pivot irrigation equipment.
3.1 The SM-based inversion approach
Irrigation water use has been estimated using the SM-based inversion approach (Brocca et a., 2018; Dari et al., 2020, 2023) over a time span ranging from 1 January 2015 to 30 September 2023. The core idea behind the method is the inversion of the soil water balance for backward estimating the total water input, generally represented by the sum of rainfall and irrigation. By expressing the soil water balance as
where Z∗ [mm] is the water capacity of the soil layer, S(t) [-] is the relative soil moisture (i.e., ranging between 0 and 1), t [d] indicates the time, i(t) is the irrigation rate [mm d−1], r(t) [mm d−1] is the rainfall rate, g(t) [mm d−1] is the drainage term, sr(t) [mm d−1] is the surface runoff, and e(t) [mm d−1] is the evapotranspiration rate. Equation (1) is equivalent to
where Win(t) is the total amount of water entering into the soil, i.e., the sum of rainfall and irrigation. As thoroughly explained in previous studies by the authors, the following assumptions can be adopted: (i) g(t)=aS(t)b (Brocca et al., 2014), (ii) sr(t)=0 (Brocca et al., 2015), and (iii) (Dari et al., 2023). Hence, Eq. (2) can be rewritten as
After estimating the total amount of water entering the soil, irrigation rates can be derived by removing rainfall rates from the total, resulting in i(t) = Win(t) − r(t). Negative irrigation rates, if any, are imposed equal to zero (Jalilvand et al., 2019). A threshold value for the ratio between weekly estimated irrigation and weekly rainfall equal to 0.2 is adopted to discard negligible irrigation amounts due to random errors.
The parameters a, b, Z∗, and F of Eq. (3) are the model parameters. The parameters a, b, and Z∗ were calibrated against rainfall (i.e., the method performances in properly reproducing rainfall amounts were optimized) by masking out days with no rainfall rate during the irrigation seasons (hence, potential irrigation days). The F parameter was set to be equal to 0.3, as explained in Sect. 3.2. For further details on the method, the reader is referred to Dari et al. (2023).
3.2 Data and processing
The algorithm requires soil moisture, rainfall, and potential evapotranspiration (PET) data as input. We used Sentinel-1 surface soil moisture observations from the Copernicus Global Land Service (https://land.copernicus.eu/global/products/ssm, last access: 9 October 2023) (Bauer-Marschallinger et al., 2019), which have a spatial resolution of 1 km and a 2 to 6 d revisit time depending on the region of interest and the number of satellites available in orbit (two satellites from October 2016 to December 2021, and one satellite from October 2014 to October 2016 and from January 2022 to September 2023 due to the failure of Sentinel-1B). Before running the algorithm, the noise in the soil moisture signal was reduced by computing the soil water index (SWI) according to the exponential filter proposed by Albergel et al. (2008). Precipitation and PET were obtained from the fifth land reanalysis of the European Centre for Medium-Range Weather Forecasts (ECMWF ERA5-Land, https://cds.climate.copernicus.eu/cdsapp{#}!/dataset/reanalysis-era5-land?tab=overview, last access: 9 October 2023), characterized by a native spatial resolution of 9 km and hourly temporal resolution (Muñoz-Sabater et al., 2021). As PET from ERA5-Land represents pan evaporation, i.e., open water evaporation, we rescaled the data to obtain the same mean value in the common period using potential evaporation from the Global Land Evaporation Amsterdam Model (GLEAM v3.6a, https://www.gleam.eu/, last access: 24 March 2023) (Miralles et al., 2011; Martens et al., 2017) that was used in previous studies (e.g., Dari et al., 2023), but it is not available with short latency. The applied scaling value is equal to 30 %. Precipitation and PET data were resampled over the same spatial grid of Sentinel-1 with the nearest-neighbor approach and aggregated at a daily timescale. Therefore, irrigation water use estimates were produced on the 1 km grid of Sentinel-1 surface soil moisture data, with a temporal resolution of 15 d.
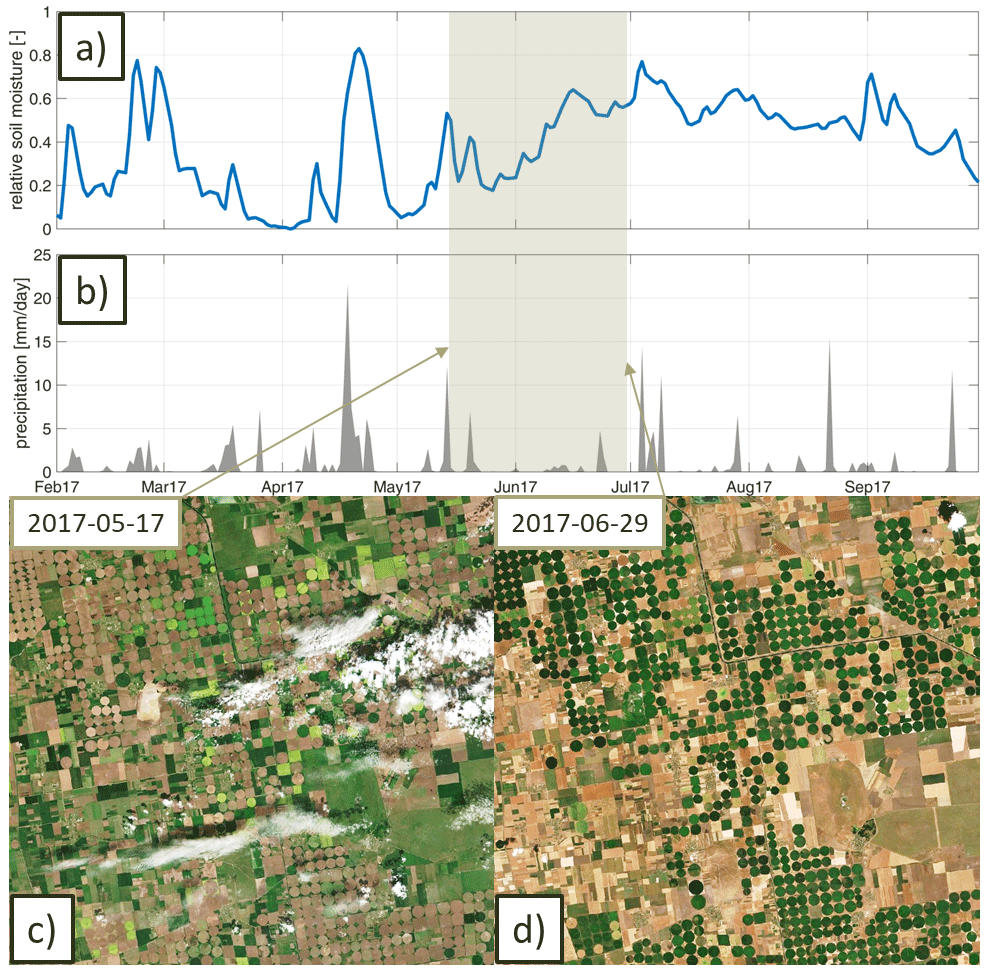
Figure 2The time series in the top panels represent the (a) spatial mean relative soil moisture from the Sentinel-1 CGLS product and (b) precipitation from ERA5-Land in the period from February to September 2017. The spatial average is computed for pixels with average soil moisture greater than 45 %, as shown in Fig. 1. The two maps in the bottom panels show true-color Sentinel-2 images acquired on 17 May and 29 June 2017 (obtained from the Sentinel Hub EO Browser service). Starting from mid-May to the end of June, the increase in soil moisture in panel (a) is not associated with precipitation events shown in panel (b). Therefore, it is likely due to irrigation application, as can be also inferred from Sentinel-2 images, which show that the center-pivot areas are much greener at the end of June, with respect to mid-May.
To assess irrigation water use from satellite observations of soil moisture (or evaporation), the observations must detect the increase in soil water associated with irrigation application. As highlighted in previous studies (see, e.g., Dari et al., 2022a; Zappa et al., 2022), three prerequisites are needed: (1) spatial resolution comparable to irrigated fields, (2) temporal resolution with at least one observation per week, and (3) good accuracy. If any of these conditions are not met, irrigation cannot be estimated accurately. In this research, Sentinel-1 soil moisture data were used as they are characterized by an actual spatial resolution of 1 km and a revisiting time of 4 to 5 d in the study area, in accordance with the specifications.
To assess the reliability of the Sentinel-1 soil moisture product for estimating irrigation, we computed the mean soil moisture over the months from June to August, corresponding to the main watering season, during the whole study period. Figure 1 displays a satellite map of the study area (on the left) and the mean soil moisture (on the right). The correlation between the regions with center-pivot irrigation equipment and those with mean relative soil moisture exceeding 45 % is clearly apparent. Consequently, we can confidently stipulate that Sentinel-1 soil moisture data are capable of detecting the irrigation signal in space with good precision.
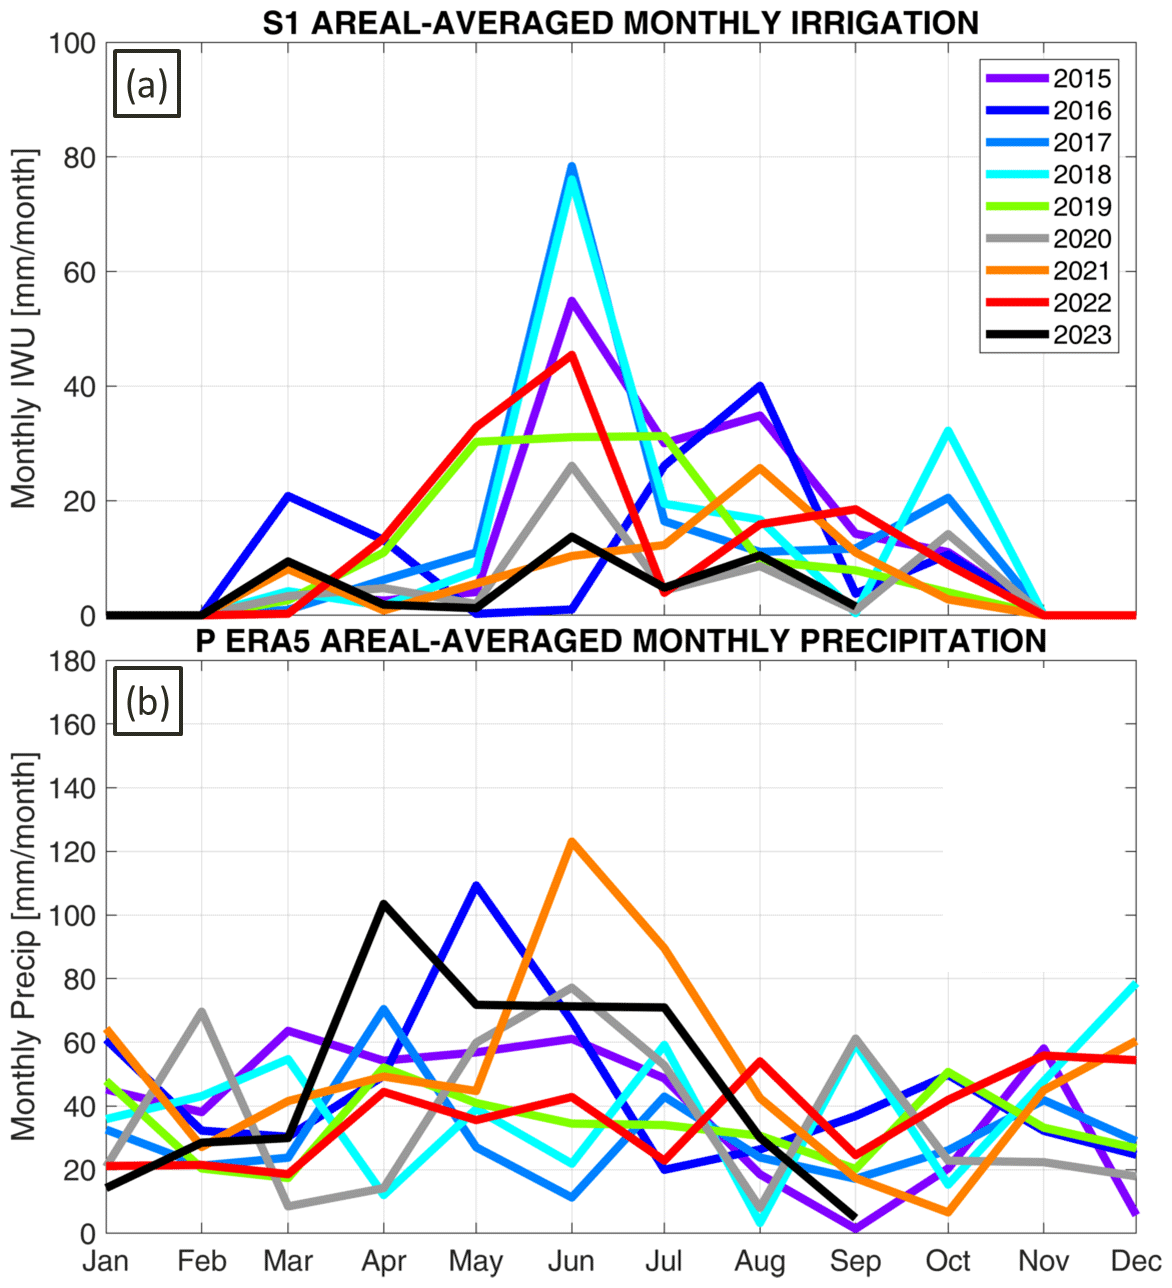
Figure 3Monthly values from 2015 to 2023 for the selected irrigated region for (a) irrigation water use and (b) precipitation. The comparison between irrigation water use and precipitation data provides important insights into, for instance, the very low irrigation in 2023, notwithstanding the high precipitation in April and May.
The temporal accuracy assessment is then carried out from 2015 to 2023 by comparing the spatial average of soil moisture and precipitation over pixels in which the mean soil moisture is greater than 45 % (Fig. 1). To facilitate the visual assessment, we show a single year here, whereas all years are available in the Appendix (Fig. A1). Figure 2 shows the analysis for the year 2017, with true-color Sentinel-2 images acquired on 17 May, and 29 June 2017 as well. Starting from mid-May to the end of June, the increase in soil moisture in Fig. 2a is not associated with precipitation events (see Fig. 2b), and it should be attributed to irrigation water application, as can be also inferred from Sentinel-2 images, which show that the center-pivot areas are much greener at the end of June, with respect to mid-May. Conversely, the non-irrigated green areas in May are brown-colored at the end of June due to the absence of precipitation. The Appendix shows the climatology of soil moisture and precipitation, including modeled soil moisture data as well (Fig. A2). The strong increase in soil moisture for the month of June and the slow decrease in July and August is another point of evidence for irrigation application. The simulated soil moisture does not show this signal as an irrigation module is not included.
As Sentinel-1 soil moisture is considered suitable to estimate irrigation water use in the study area, the approach developed by Dari et al. (2023) was applied for all irrigated pixels (for a total of 4059 pixels) in the investigated area. For each pixel, the irrigation water use every 15 d was computed, and monthly aggregated values are shown in Fig. 3 together with monthly precipitation. The maximum values of irrigation are estimated in the month of June, as expected from the analysis of soil moisture time series (Fig. 2). For some years, 2019 and 2022, irrigation starts earlier already in April and May, whereas for the year 2016, irrigation occurred mostly in July and August. The estimated irrigation in March and October might be due to errors or real irrigation signals in the case of late-spring or winter crops, and it deserves to be further investigated by looking at ground information (currently not available to the authors).
The annual values of irrigation water use are shown in Fig. 4 together with the map of annual irrigation averaged over the 9 years of the analysis; the yearly maps of irrigation water use are shown in Fig. A3 in the Appendix. As expected, in 2023, the irrigation water use was the lowest due to Kakhovka Dam's collapse, with a mean value equal to 43 mm (±55 mm), which is much lower than the average in the area equal to 115 mm (±65 mm) (see the comparison between true-color Sentinel-2 images of 2017 and 2023 in Fig. A4 in the Appendix). Indeed, in 2023, the climatic conditions were good thanks to the large amount of precipitation in the months of April and May (Fig. 3b). In 2020, with 64 mm (±42 mm), the second-lowest value was recorded, probably due to not only difficulties introduced by the COVID-19 pandemic, but also very low precipitation in the months of March and April that are crucial to store water for irrigation (Fig. 3b). We should note that the low availability of Sentinel-1 data in July 2020 might have also impacted the results. In 2017 and 2018, the maximum values obtained were equal to 156 mm (±64 mm) and 158 mm (±67 mm), respectively.
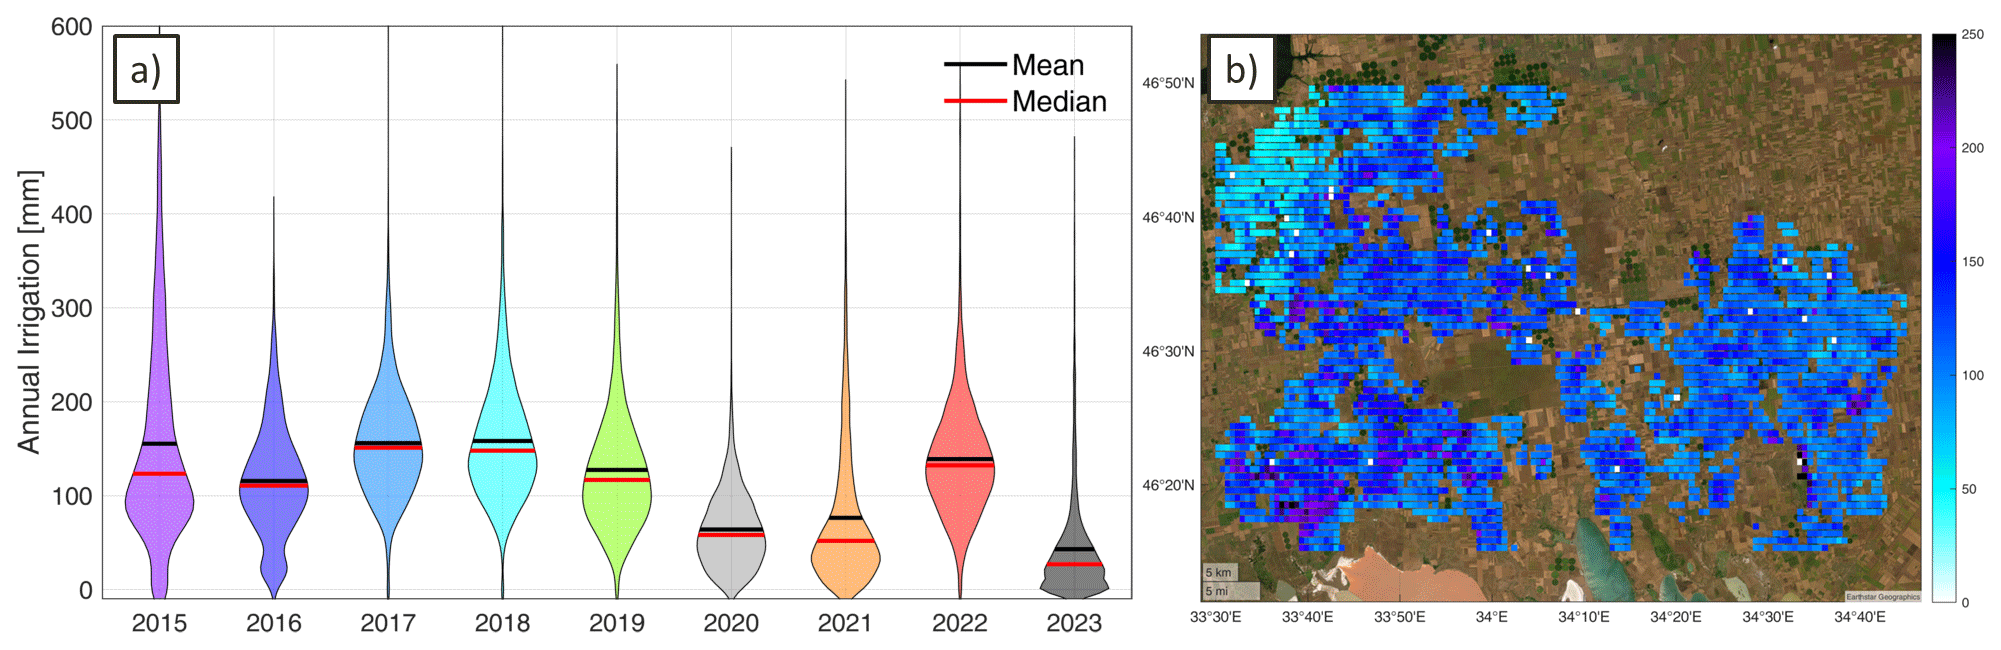
Figure 4(a) A violin plot of the annual values of irrigation water use from 2015 to 2023 and (b) a mean annual irrigation water use map (background satellite image from Earthstar Geographics). In 2023, due to the Kakhovka Dam's collapse, the lowest value was obtained.
This study presents an innovative method for operational irrigation water use estimation without relying on ground observations. The method can be implemented in any location with accessible soil moisture, evaporation, and precipitation data. The soil moisture product is the most pertinent data set, and the suitability of Sentinel-1 satellite(s) to accurately ascertain irrigation water use has been clearly demonstrated, owing to the high temporal and spatial resolutions offered. The current temporal coverage of Sentinel-1-derived observations may be a limitation, but the continuity foreseen for the mission will offer the possibility of creating long-term time series of irrigation water use in the upcoming years.
The newly developed irrigation water use data set offers important insights into the socio-political dynamics in Ukraine. Indeed, the impact of Kakhovka Dam's collapse was devastating for the possibility of irrigating the agricultural fields in 2023. Notwithstanding the good amount of precipitation in April and May, the dam's collapse prevented the use of water for irrigation, with significant impacts on crop production. The possible impact of the COVID-19 pandemic is also highlighted.
Nowadays, advancements in high-resolution satellite technology have provided an opportunity to monitor the environment with greater accuracy. This has led to the creation of new products which are essential for assessing the impact of natural and human disasters on the socio-political dynamics of our Earth system.
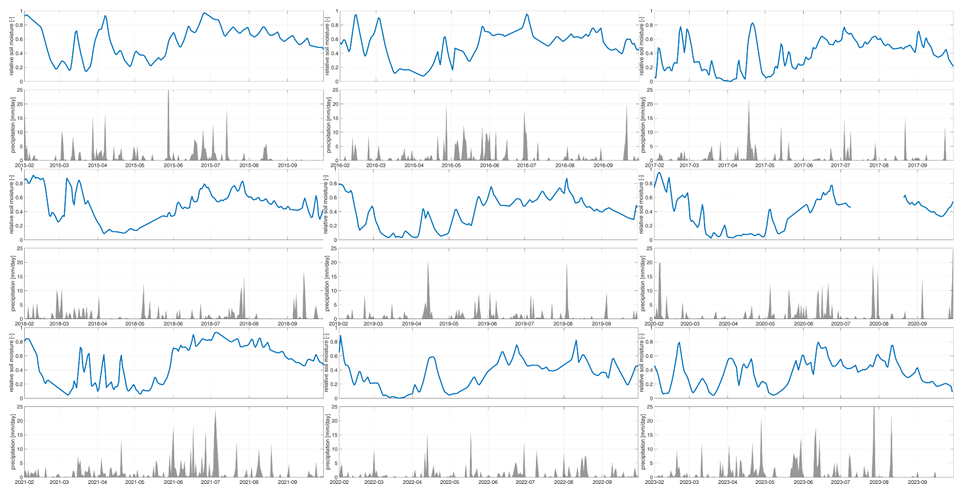
Figure A1Time series of spatially averaged relative soil moisture from the Sentinel-1 CGLS product (blue lines) and precipitation from ERA5-Land (light-grey shaded areas) during the whole study period. The spatial average is computed for pixels with average soil moisture greater than 45%.
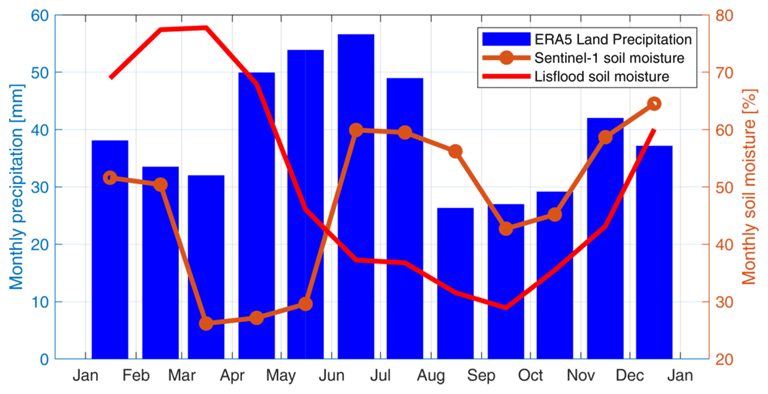
Figure A2Climatology of precipitation from ERA5-Land, satellite soil moisture from the Sentinel-1 CGLS product, and modeled soil moisture from LISFLOOD.
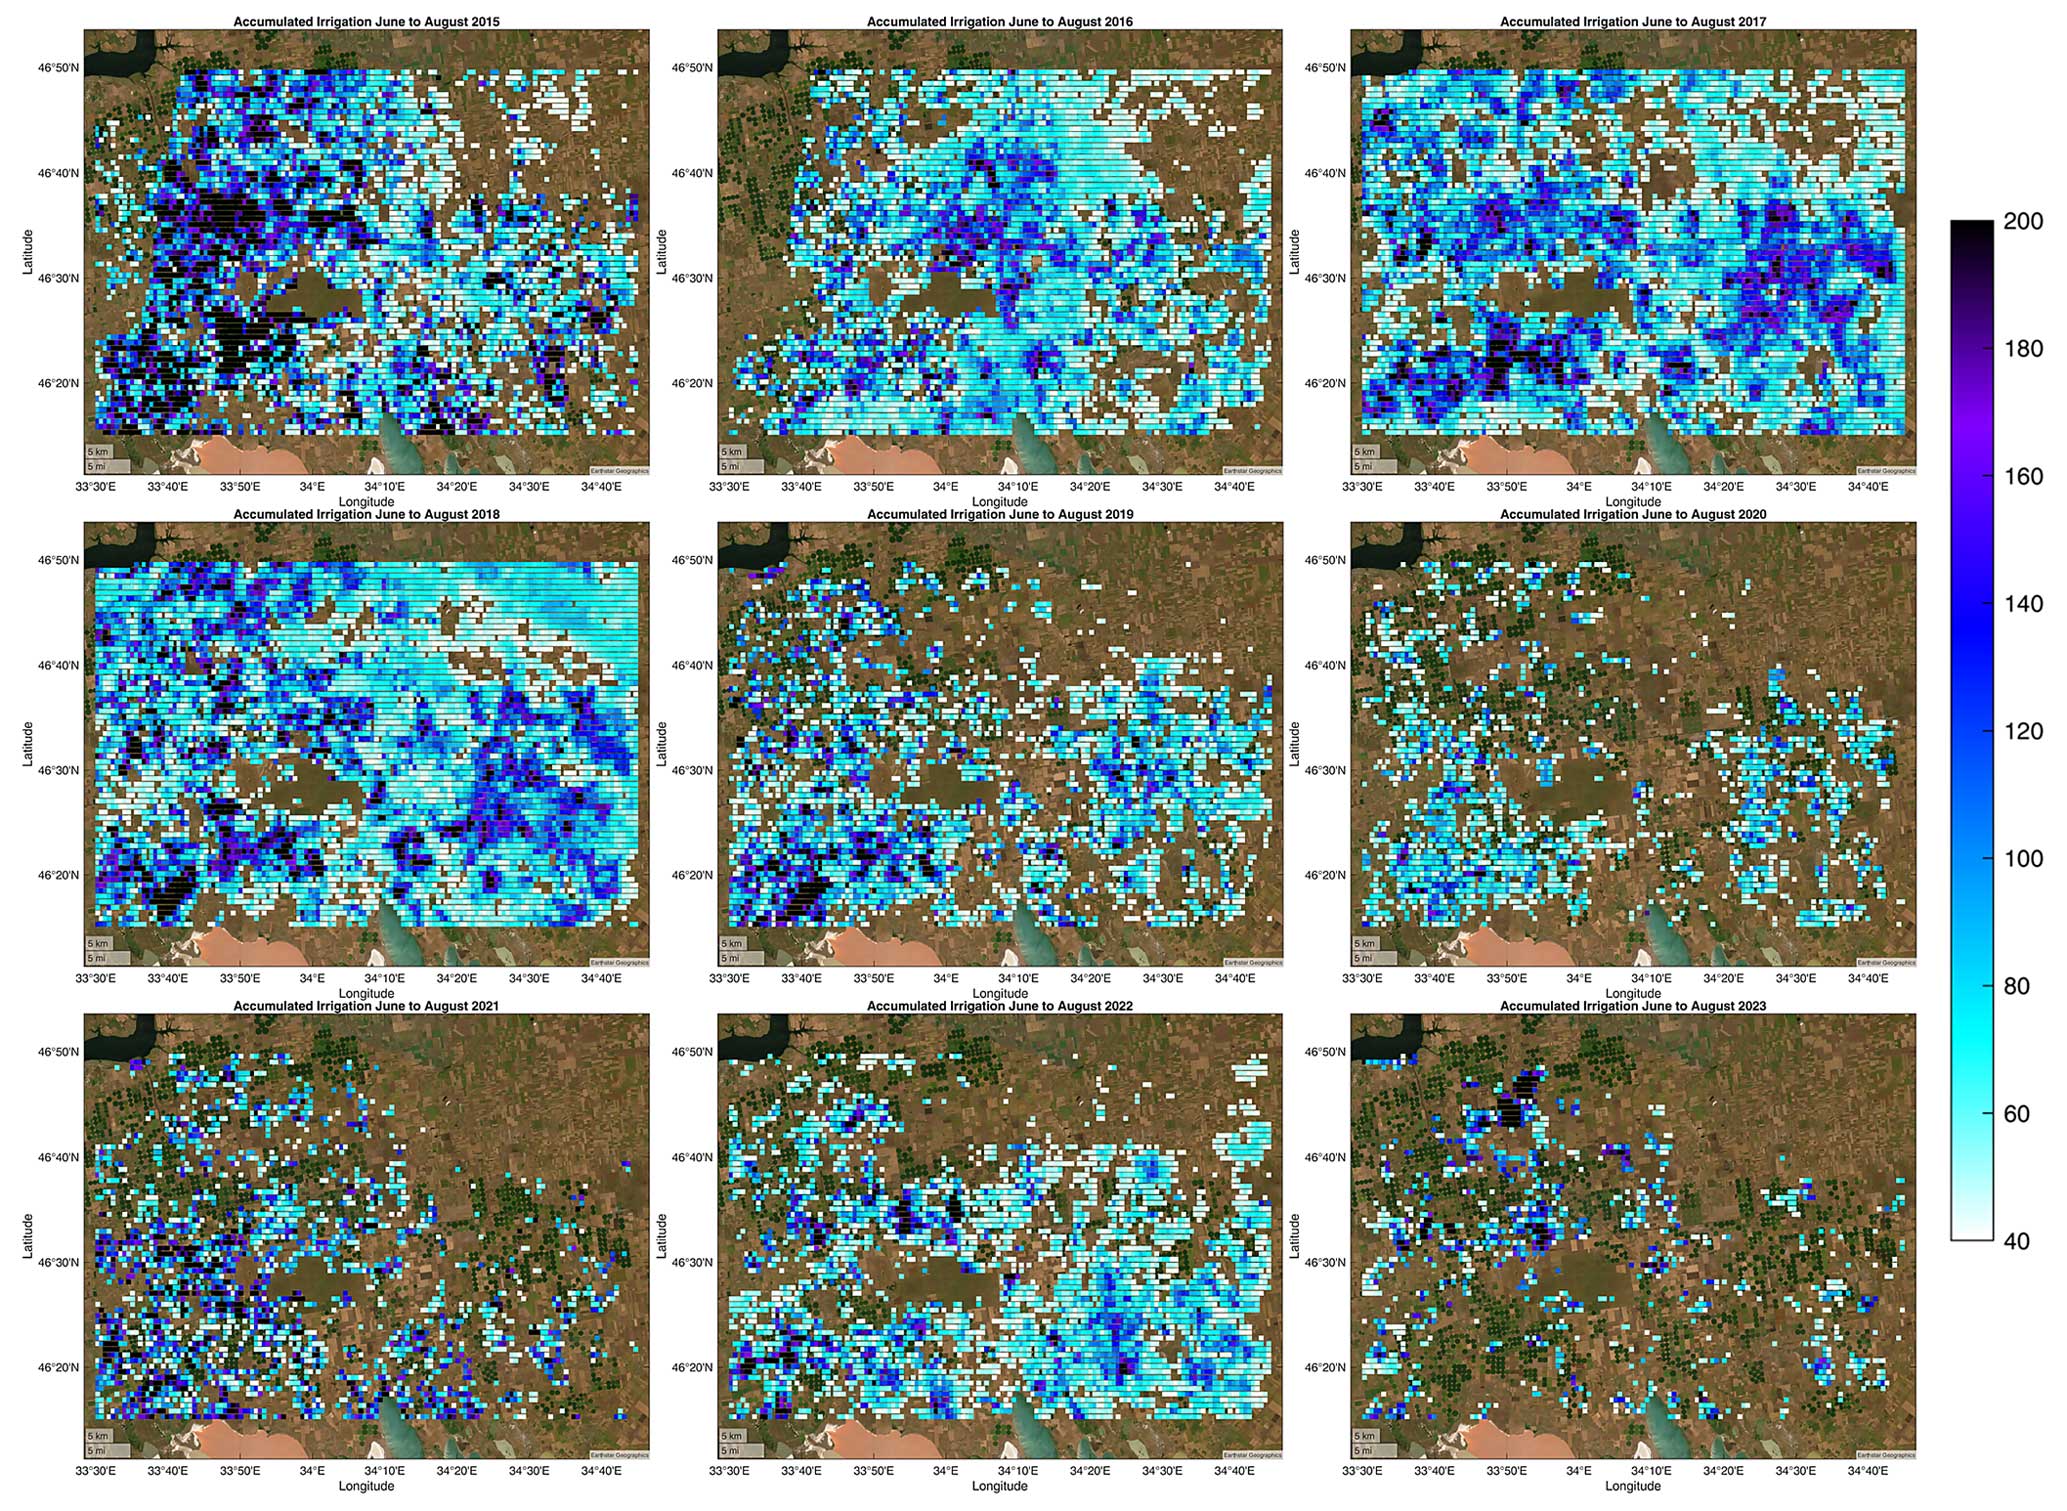
Figure A3Accumulated irrigation in the period from June to August of each year, from 2015 to 2023, as obtained by the SM-based inversion approach (background satellite image from Earthstar Geographics).
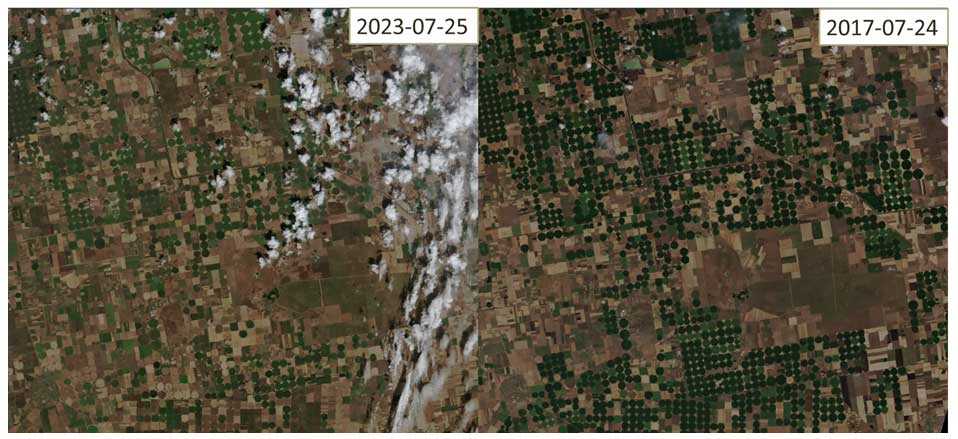
Figure A4Comparison between true-color Sentinel-2 images of 2017 and 2023 (obtained from the Sentinel Hub EO Browser service).
The Python code of the SM-based inversion approach is available from the corresponding author upon reasonable request.
Sentinel-1 surface soil moisture observations from the Copernicus Global Land Service (CGLS) are available at https://land.copernicus.eu/global/products/ssm (Bauer-Marschallinger et al., 2019). Precipitation and PET from the fifth land reanalysis of the European Centre for Medium-Range Weather Forecasts (ECMWF ERA5 Land) can be downloaded at https://doi.org/10.24381/cds.e2161bac (Muñoz Sabater, 2019). The Global Land Evaporation Amsterdam Model (GLEAM) v3.6a data set is available at https://www.gleam.eu/ (Miralles et al., 2011; Martens et al., 2017).
JD: methodology, software, validation, investigation, and writing (original draft preparation and review and editing). PF: resources, methodology, investigation, validation, and writing (review and editing). LB: conceptualization, methodology, software, validation, formal analysis, investigation, and writing (original draft preparation, supervision, and visualization).
The contact author has declared that none of the authors has any competing interests.
Publisher’s note: Copernicus Publications remains neutral with regard to jurisdictional claims made in the text, published maps, institutional affiliations, or any other geographical representation in this paper. While Copernicus Publications makes every effort to include appropriate place names, the final responsibility lies with the authors.
The authors acknowledge support from the European Space Agency (ESA) projects IRRIGATION+ (contract no. 4000129870/20/I-NB) and 4DMED-Hydrology (contract no. 4000136272/21/I-EF).
This research has been supported by the European Space Agency (contract nos. 4000129870/20/I-NB and 4000136272/21/I-EF).
This paper was edited by Yongping Wei and reviewed by three anonymous referees.
Albergel, C., Rüdiger, C., Pellarin, T., Calvet, J.-C., Fritz, N., Froissard, F., Suquia, D., Petitpa, A., Piguet, B., and Martin, E.: From near-surface to root-zone soil moisture using an exponential filter: an assessment of the method based on in-situ observations and model simulations, Hydrol. Earth Syst. Sci., 12, 1323–1337, https://doi.org/10.5194/hess-12-1323-2008, 2008.
Bauer-Marschallinger, B., Freeman, V., Cao, S., Paulik, C., Schaifler, S., Stachl, T., Modanesi, S., Massari, C., Ciabatta, L., Brocca, L., and Wagner, W.: Toward Global Soil Moisture Monitoring With Sentinel-1: Harnessing Assets and Overcoming Obstacles, IEEE T. Geosci. Remote, 57, 520–539, https://doi.org/10.1109/TGRS.2018.2858004, 2019.
Beck, H. E., Zimmermann, N. E., McVicar, T. R., Vergopolan, N., Berg, A., and Wood, E. F.: Present and future Köppen-Geiger climate classification maps at 1-km resolution, Sci. Data, 5, 180214, https://doi.org/10.1038/sdata.2018.214, 2018.
Bretreger, D., Yeo, I. Y., and Hancock, G.: Quantifying irrigation water use with remote sensing: Soil water deficit modelling with uncertain soil parameters, Agr. Water Manage., 260, 107299, https://doi.org/10.1016/j.agwat.2021.107299, 2022.
Brocca, L., Ciabatta, L., Massari, C., Moramarco, T., Hahn, S., Hasenauer, S., Kidd, R., Dorigo, W., Wagner, W., and Levizzani, V.: Soil as a natural rain gauge: Estimating global rainfall from satellite soil moisture data, J. Geophys. Res., 119, 5128–5141, https://doi.org/10.1002/2014JD021489, 2014.
Brocca, L., Massari, C., Ciabatta, L., Moramarco, T., Penna, D., Zuecco, G., Pianezzola, L., Borga, M., Matgen, P., and Martínez-Fernández, J.: Rainfall estimation from in situ soil moisture observations at several sites in Europe: an evaluation of the SM2RAIN algorithm, J. Hydrol. Hydromechan., 63, 201–209, https://doi.org/10.1515/johh-2015-0016, 2015.
Brocca, L., Tarpanelli, A., Filippucci, P., Dorigo, W., Zaussinger, F., Gruber, A., and Fernández-Prieto, D.: How much water is used for irrigation? A new approach exploiting coarse resolution satellite soil moisture products, Int. J. Appl. Earth Observ. Geoinform., 73C, 752–766, https://doi.org/10.1016/j.jag.2018.08.023, 2018.
Brombacher, J., Rezende de Oliveira Silva, I., Degen, J., and Pelgrum H.: A novel evapotranspiration based irrigation quantification method using the hydrological similar pixels algorithm, Agr. Water Manage., 267, 107602, https://doi.org/10.1016/j.agwat.2022.107602, 2022.
Dari, J., Brocca, L., Quintana-Seguí, P., Escorihuela, M. J., Stefan, V., and Morbidelli, R.: Exploiting high-resolution remote sensing soil moisture to estimate irrigation water amounts over a Mediterranean region, Remote Sens., 12, 2593, https://doi.org/10.3390/rs12162593, 2020.
Dari, J., Brocca, L., Quintana-Seguí, P., Casadei, S., Escorihuela, M.J., Stefan, V., and Morbidelli, R.: Double-scale analysis on the detectability of irrigation signals from remote sensing soil moisture over an area with complex topography in central Italy, Adv. Water Res., 161, 104130, https://doi.org/10.1016/j.advwatres.2022.104130, 2022a.
Dari, J., Quintana-Seguí, P., Morbidelli, R., Saltalippi, C., Flammini, A., Giugliarelli, E., Escorihuela, M. J., Stefan, V., and Brocca, L.: Irrigation estimates from space: implementation of different approaches to model the evapotranspiration contribution within a soil-moisture-based inversion algorithm, Agr. Water Manage., 265, 107537, https://doi.org/10.1016/j.agwat.2022.107537, 2022b.
Dari, J., Brocca, L., Modanesi, S., Massari, C., Tarpanelli, A., Barbetta, S., Quast, R., Vreugdenhil, M., Freeman, V., Barella-Ortiz, A., Quintana-Seguí, P., Bretreger, D., and Volden, E.: Regional data sets of high-resolution (1 and 6 km) irrigation estimates from space, Earth Syst. Sci. Data, 15, 1555–1575, https://doi.org/10.5194/essd-15-1555-2023, 2023.
Dorigo, W., Dietrich, S., Aires, F., Brocca, L., Carter, S., Cretaux, J.-F., Dunkerley, D., Enomoto, H., Forsberg, R., Güntner, A., Hegglin, M.I., Hollmann, R., Hurst, D.F., Johannessen, J.A., Kummerow, C., Lee, T., Luojus, K., Looser, U., Miralles, D.G., Pellet, V., Recknagel, T., Vargas, C.R., Schneider, U., Schoeneich, P., Schröder, M., Tapper, N., Vuglinsky, V., Wagner, W., Yu, L., Zappa, L., Zemp, M., and Aich, V.: Closing the water cycle from observations across scales: where do we stand?, B. Am. Meteorol. Soc., 102, E1897–E1935, https://doi.org/10.1175/BAMS-D-19-0316.1, 2021.
Filippucci, P., Tarpanelli, A., Massari, C., Serafini, A., Strati, V., Alberi, M., Raptis, K. G. C., Mantovani, F., and Brocca, L.: Soil moisture as a potential variable for tracking and quantifying irrigation: a case study with proximal gamma-ray spectroscopy data, Adv. Water Resour., 136, 103502, https://doi.org/10.1016/j.advwatres.2019.103502, 2020.
Foley, J. A., Ramankutty, N., Brauman, K. A., Cassidy, E. S., Gerber, J. S., Johnston, M., Mueller, N. D., O’Connell, C., Ray, D. K., West, P. C., Balzer, C., Bennett, E. M., Carpenter, S. R., Hill, J., Monfreda, C., Polasky, S., Rockström, J., Sheehan, J., Siebert, S., Tilman, D., and Zaks, D. P.: Solutions for a cultivated planet, Nature, 478, 337–342, https://doi.org/10.1038/nature10452, 2011.
Jalilvand, E., Tajrishy, M., Hashemi, S. A. G., and Brocca, L.: Quantification of irrigation water using remote sensing of soil moisture in a semi-arid region, Remote Sens. Environ., 231, 111226, https://doi.org/10.1016/j.rse.2019.111226, 2019.
Kuns, B.: “In These Complicated Times”: An Environmental History of Irrigated Agriculture in Post-Communist Ukraine, Water Altern., 11, 866–892, 2018.
Kragh, S. J., Fensholt, R., Stisen, S., and Koch, J.: The precision of satellite-based net irrigation quantification in the Indus and Ganges basins, Hydrol. Earth Syst. Sci., 27, 2463–2478, https://doi.org/10.5194/hess-27-2463-2023, 2023.
Lawston, P. M., Santanello Jr., J. A., and Kumar, S. V.: Irrigation signals detected from SMAP soil moisture retrievals, Geophys. Res. Lett., 44, 11–860, https://doi.org/10.1002/2017GL075733, 2017.
Martens, B., Miralles, D. G., Lievens, H., van der Schalie, R., de Jeu, R. A. M., Fernández-Prieto, D., Beck, H. E., Dorigo, W. A., and Verhoest, N. E. C.: GLEAM v3: satellite-based land evaporation and root-zone soil moisture, Geosci. Model Dev., 10, 1903–1925, https://doi.org/10.5194/gmd-10-1903-2017, 2017.
Massari, C., Modanesi, S., Dari, J., Gruber, A., De Lannoy, G.J.M., Girotto, M., Quintana-Seguí, P., Le Page, M., Jarlan, L., Zribi, M., Ouaadi, N., Vreugdenhil, M., Zappa, L., Dorigo, W., Wagner, W., Brombacher, J., Pelgrum, H., Jaquot, P., Freeman, V., Volden, E., Fernandez Prieto, D., Tarpanelli, A., Barbetta, S., and Brocca, L.: A review of irrigation information retrievals from space and their utility for users, Remote Sens., 13, 4112, https://doi.org/10.3390/rs13204112, 2021.
McDermid, S., Nocco, M., Lawston-Parker, P., Keune, J., Pokhrel, Y., Jain, M., Jägermeyr, J., Brocca, L., Massari, C., Jones, A. D., Vahmani, P., Thiery, W., Yao, Y., Bell, A., Chen, L., Dorigo, W., Hanasaki, N., Jasechko, S., Lo, M.-H., Mahmood, R., Mishra, V., Mueller, N. D., Niyogi, D., Rabin, S. S., Sloat, L., Wada, Y., Zappa, L., Chen, F., Cook, B. I., Kim, H., Lombardozzi, D., Polcher, J., Ryu, D., Santanello, J., Satoh, Y., Seneviratne, S., Singh, D., and Yokohata, T.: Irrigation in the Earth system, Nat. Rev. Earth Environ., 4, 435–453, https://doi.org/10.1038/s43017-023-00438-5, 2023.
Mehta, P., Siebert, S., Kummu, M., Deng, Q., Ali, T., Marston, L., Xie, W., and Davis, K.: Global Area Equipped for Irrigation Dataset 1900–2015 v3.0, Zenodo [data set], https://doi.org/10.5281/zenodo.6886564, 2022.
Miralles, D. G., Holmes, T. R. H., De Jeu, R. A. M., Gash, J. H., Meesters, A. G. C. A., and Dolman, A. J.: Global land-surface evaporation estimated from satellite-based observations, Hydrol. Earth Syst. Sci., 15, 453–469, https://doi.org/10.5194/hess-15-453-2011, 2011.
Muñoz Sabater, J.: ERA5-Land hourly data from 1950 to present, Copernicus Climate Change Service (C3S) Climate Data Store (CDS) [data set], https://doi.org/10.24381/cds.e2161bac, 2019.
Muñoz-Sabater, J., Dutra, E., Agustí-Panareda, A., Albergel, C., Arduini, G., Balsamo, G., Boussetta, S., Choulga, M., Harrigan, S., Hersbach, H., Martens, B., Miralles, D. G., Piles, M., Rodríguez-Fernández, N. J., Zsoter, E., Buontempo, C., and Thépaut, J.-N.: ERA5-Land: a state-of-the-art global reanalysis dataset for land applications, Earth Syst. Sci. Data, 13, 4349–4383, https://doi.org/10.5194/essd-13-4349-2021, 2021.
Portmann, F., Siebert, S., Bauer, C., and Döll, P.: Global data set of monthly growing areas of 26 irrigated crops, Version 1.0, Frankfurt Hydrol. Pap. 06, Inst. of Phys. Geogr., Univ. of Frankfurt, Frankfurt, Germany, 179–180 pp., 2008.
Reznik, V. S., Morozova, O. S., Morozov, O. V., Jaskulska, I., and Kamieniarz, J.: Current state of irrigation in the Kherson steppe zone of Ukraine and in the Kujawsko-Pomorskie province in Poland, Acta Sci. Pol. Agr., 15, 73–83, 2016.
Van Tricht, K., Degerickx, J., Gilliams, S., Zanaga, D., Battude, M., Grosu, A., Brombacher, J., Lesiv, M., Bayas, J. C. L., Karanam, S., Fritz, S., Becker-Reshef, I., Franch, B., Mollà-Bononad, B., Boogaard, H., Pratihast, A. K., Koetz, B., and Szantoi, Z.: WorldCereal: a dynamic open-source system for global-scale, seasonal, and reproducible crop and irrigation mapping, Earth Syst. Sci. Data, 15, 5491–5515, https://doi.org/10.5194/essd-15-5491-2023, 2023.
Zappa, L., Schlaffer, S., Brocca, L., Vreugdenhil, M., Nendel, C., and Dorigo, W.: How accurately can we retrieve irrigation timing and water amounts from (satellite) soil moisture?, Int. J. Appl. Earth Obs., 113, 102979, https://doi.org/10.1016/j.jag.2022.102979, 2022.