the Creative Commons Attribution 4.0 License.
the Creative Commons Attribution 4.0 License.
 | 28 May 2024
Elevational control of isotopic composition and application in understanding hydrologic processes in the mid Merced River catchment, Sierra Nevada, California, USA
Fengjing Liu
Martha H. Conklin
Glenn D. Shaw
Mountain snowpack has been declining and more precipitation has fallen as rainfall than snowfall, particularly in the western US. Isotopic composition in stream water, springs, groundwater, and precipitation was examined to understand the impact of declining snowpack on hydrologic processes in the mid Merced River catchment (1873 km2), Sierra Nevada, California. Mean isotopic values in small tributaries (catchment area < 122 km2), rock glacier outflows, and groundwater from 2005 to 2008 were strongly correlated with mean catchment elevation (R2= 0.96 for δ2H, n= 16, p < 0.001), with an average isotopic lapse rate of −1.9 ‰ per 100 m for δ2H and −0.22 ‰ per 100 m for δ18O in meteoric water. The lapse rate did not change much over the seasons and was not strongly affected by isotopic fractionation. A catchment-characteristic isotopic value, representing the catchment arithmetic mean isotopic signature in meteoric water, was thus established for each sub-catchment based on the lapse rate to elucidate hydrometeorologic and hydrologic processes such as the duration and the magnitude of snowmelt events and elevational water sources of streamflow and groundwater for ungauged catchments. Compared to Tenaya Creek without water falls, the flow and flow duration of Yosemite Creek appear to be much more sensitive to seasonal temperature increases during the baseflow period due to a strong evaporation effect caused by waterfalls, suggesting a possible prolonged dry-up period of Yosemite Falls in the future. Groundwater in Yosemite Valley (∼ 900–1200 m) was recharged primarily from the upper snow–rain transition zone (2000–2500 m), suggesting its strong vulnerability to shifts in the snow–rain ratio. The information gained from this study helps advance our understanding of hydrologic responses to climate change in snowmelt-fed river systems.
- Article
(5099 KB) - Full-text XML
- BibTeX
- EndNote


With an increase in global temperature, snow cover extent has decreased in the Northern Hemisphere, especially in spring (Vaughan et al., 2013). In the mountain regions of the western US, less precipitation falls as snow (e.g., Mote et al., 2005; Knowles et al., 2006), and the melting of snow starts earlier (e.g., Stewart et al., 2004). Even without any changes in precipitation amount, observations and modeling results have shown that less snow and earlier snowmelt lead to a shift in peak river runoff toward late winter and early spring, away from summer when water demand is highest (e.g., Dettinger and Cayan, 1995; Barnett et al., 2005; Stewart et al., 2005). A decrease in the snow–rain ratio also reduces groundwater recharge within the mountain block (Earman et al., 2006; Earman and Dettinger, 2011; Penna et al., 2014). It is anticipated that these changes in snow conditions and subsequent responses of streamflow and groundwater recharge are strongest in the snow–rain transition zone (e.g., Tennant et al., 2015), which is 1500–2500 m in Sierra Nevada, California, based on Hunsaker et al. (2012).
However, our present knowledge of watershed hydrology is still not sufficient to fully understand the impact of these changes on streamflow and groundwater recharge (Kundzewicz and Doll, 2009; Alley, 2006; Fayad et al., 2017). Particularly for catchments with a Mediterranean climate such as those in Sierra Nevada, California, and in Europe, where precipitation is low after the snowmelt season in spring and early summer, it is unclear how the changes in snow conditions in spring affect baseflow (streamflow after the snowmelt period or low flow) in late summer and fall (Fayad et al., 2017). This problem is primarily caused by a lack of accurate hydrologic measurements in mountains (Bales et al., 2006) and adequate techniques to determine groundwater recharge generated from snowmelt and rainwater (Wilson and Guan, 2004; Manning and Solomon, 2005; Manning and Caine, 2007).
Stable isotopes of oxygen and hydrogen in the water molecule have become an important tool for studies of atmospheric processes (e.g., Gat, 1996; Friedman et al., 2002; Peng et al., 2016; Balagizi et al., 2018), paleoclimate (e.g., Thompson et al., 2000), and watershed hydrology (e.g., Araguas-Araguas et al., 2000). In watershed hydrology, the isotopic composition has been widely applied to study the origin and dynamics of stream water and groundwater across varying climates and land covers, from snow-dominated catchments in high elevations to forested catchments in temperate regions (e.g., Kendall and McDonnell, 1998; Wen et al., 2016; Penna et al., 2017). The distinctness of isotopic composition among source waters (endmembers) is the basis for the studies of watershed hydrology and enables identification and even quantification of the contributions of source waters to streamflow (e.g., Sklash et al., 1976; Liu et al., 2004; Penna et al., 2016). It is also well known that elevation exerts a strong control on isotopic composition in meteoric water (e.g., Jodar et al., 2016; Peng et al., 2016), stream water (e.g., Jeelani et al., 2013; Voss et al., 2020), and groundwater (e.g., Ingraham and Taylor, 1991). The isotopic lapse rate, the change in isotopic composition over elevations (usually in δ per 100 m), was used to reconstruct paleoelevations (e.g., Poage and Chamberlain, 2001) and determine groundwater recharge zones (e.g., O'Driscoll et al., 2005; Jeelani et al., 2010; Koeniger et al., 2017). However, the isotopic lapse rate in meteoric water and stream water may be complicated by isotopic fractionation during snow formation and snowmelt processes (e.g., Taylor et al., 2001), seasonal variations in climate (e.g., Voss et al., 2020), and evaporation processes and sublimation of snow (e.g., Peng et al., 2015). The success of the applications using stable isotopes hinges on our understanding of the processes or factors that control the isotopic composition in the subject studied (e.g., stream water, groundwater, water vapor, and snow).
As the first step in an ongoing effort to quantify how change in the snow–rain proportion affects streamflow and groundwater recharge in a snowmelt-fed river system, the objectives of this study were to understand the processes or factors that control the spatiotemporal variation in the isotopic composition in precipitation, stream water, and groundwater and how such information could be used to advance our understanding of hydrometeorologic and hydrologic processes in a snowmelt-fed river system. Specifically, we examined (1) how well elevation controls isotopic composition in snow, stream water, and groundwater; (2) how to establish a lapse rate of isotopic composition in meteoric water (e.g., using precipitation samples or stream samples); (3) how the lapse rate varies with season and isotopic fractionation; and (4) how one can best use the lapse rate in understanding the impact of the shifts in snow–rain on groundwater recharge and other hydrologic processes. This study was conducted in the Merced River above Briceburg (mid Merced River catchment) (Fig. 1), a representative snowmelt-fed river system for central and southern Sierra Nevada, California. Isotopic data were acquired from precipitation, springs, groundwater, and stream water during the 2005–2008 period, which includes a very wet year (2006) and a very dry year (2007). The data from this period thus provide us with an excellent opportunity to examine the variability in stable isotopic composition of surface water and groundwater with precipitation extremes in the mid Merced River catchment.
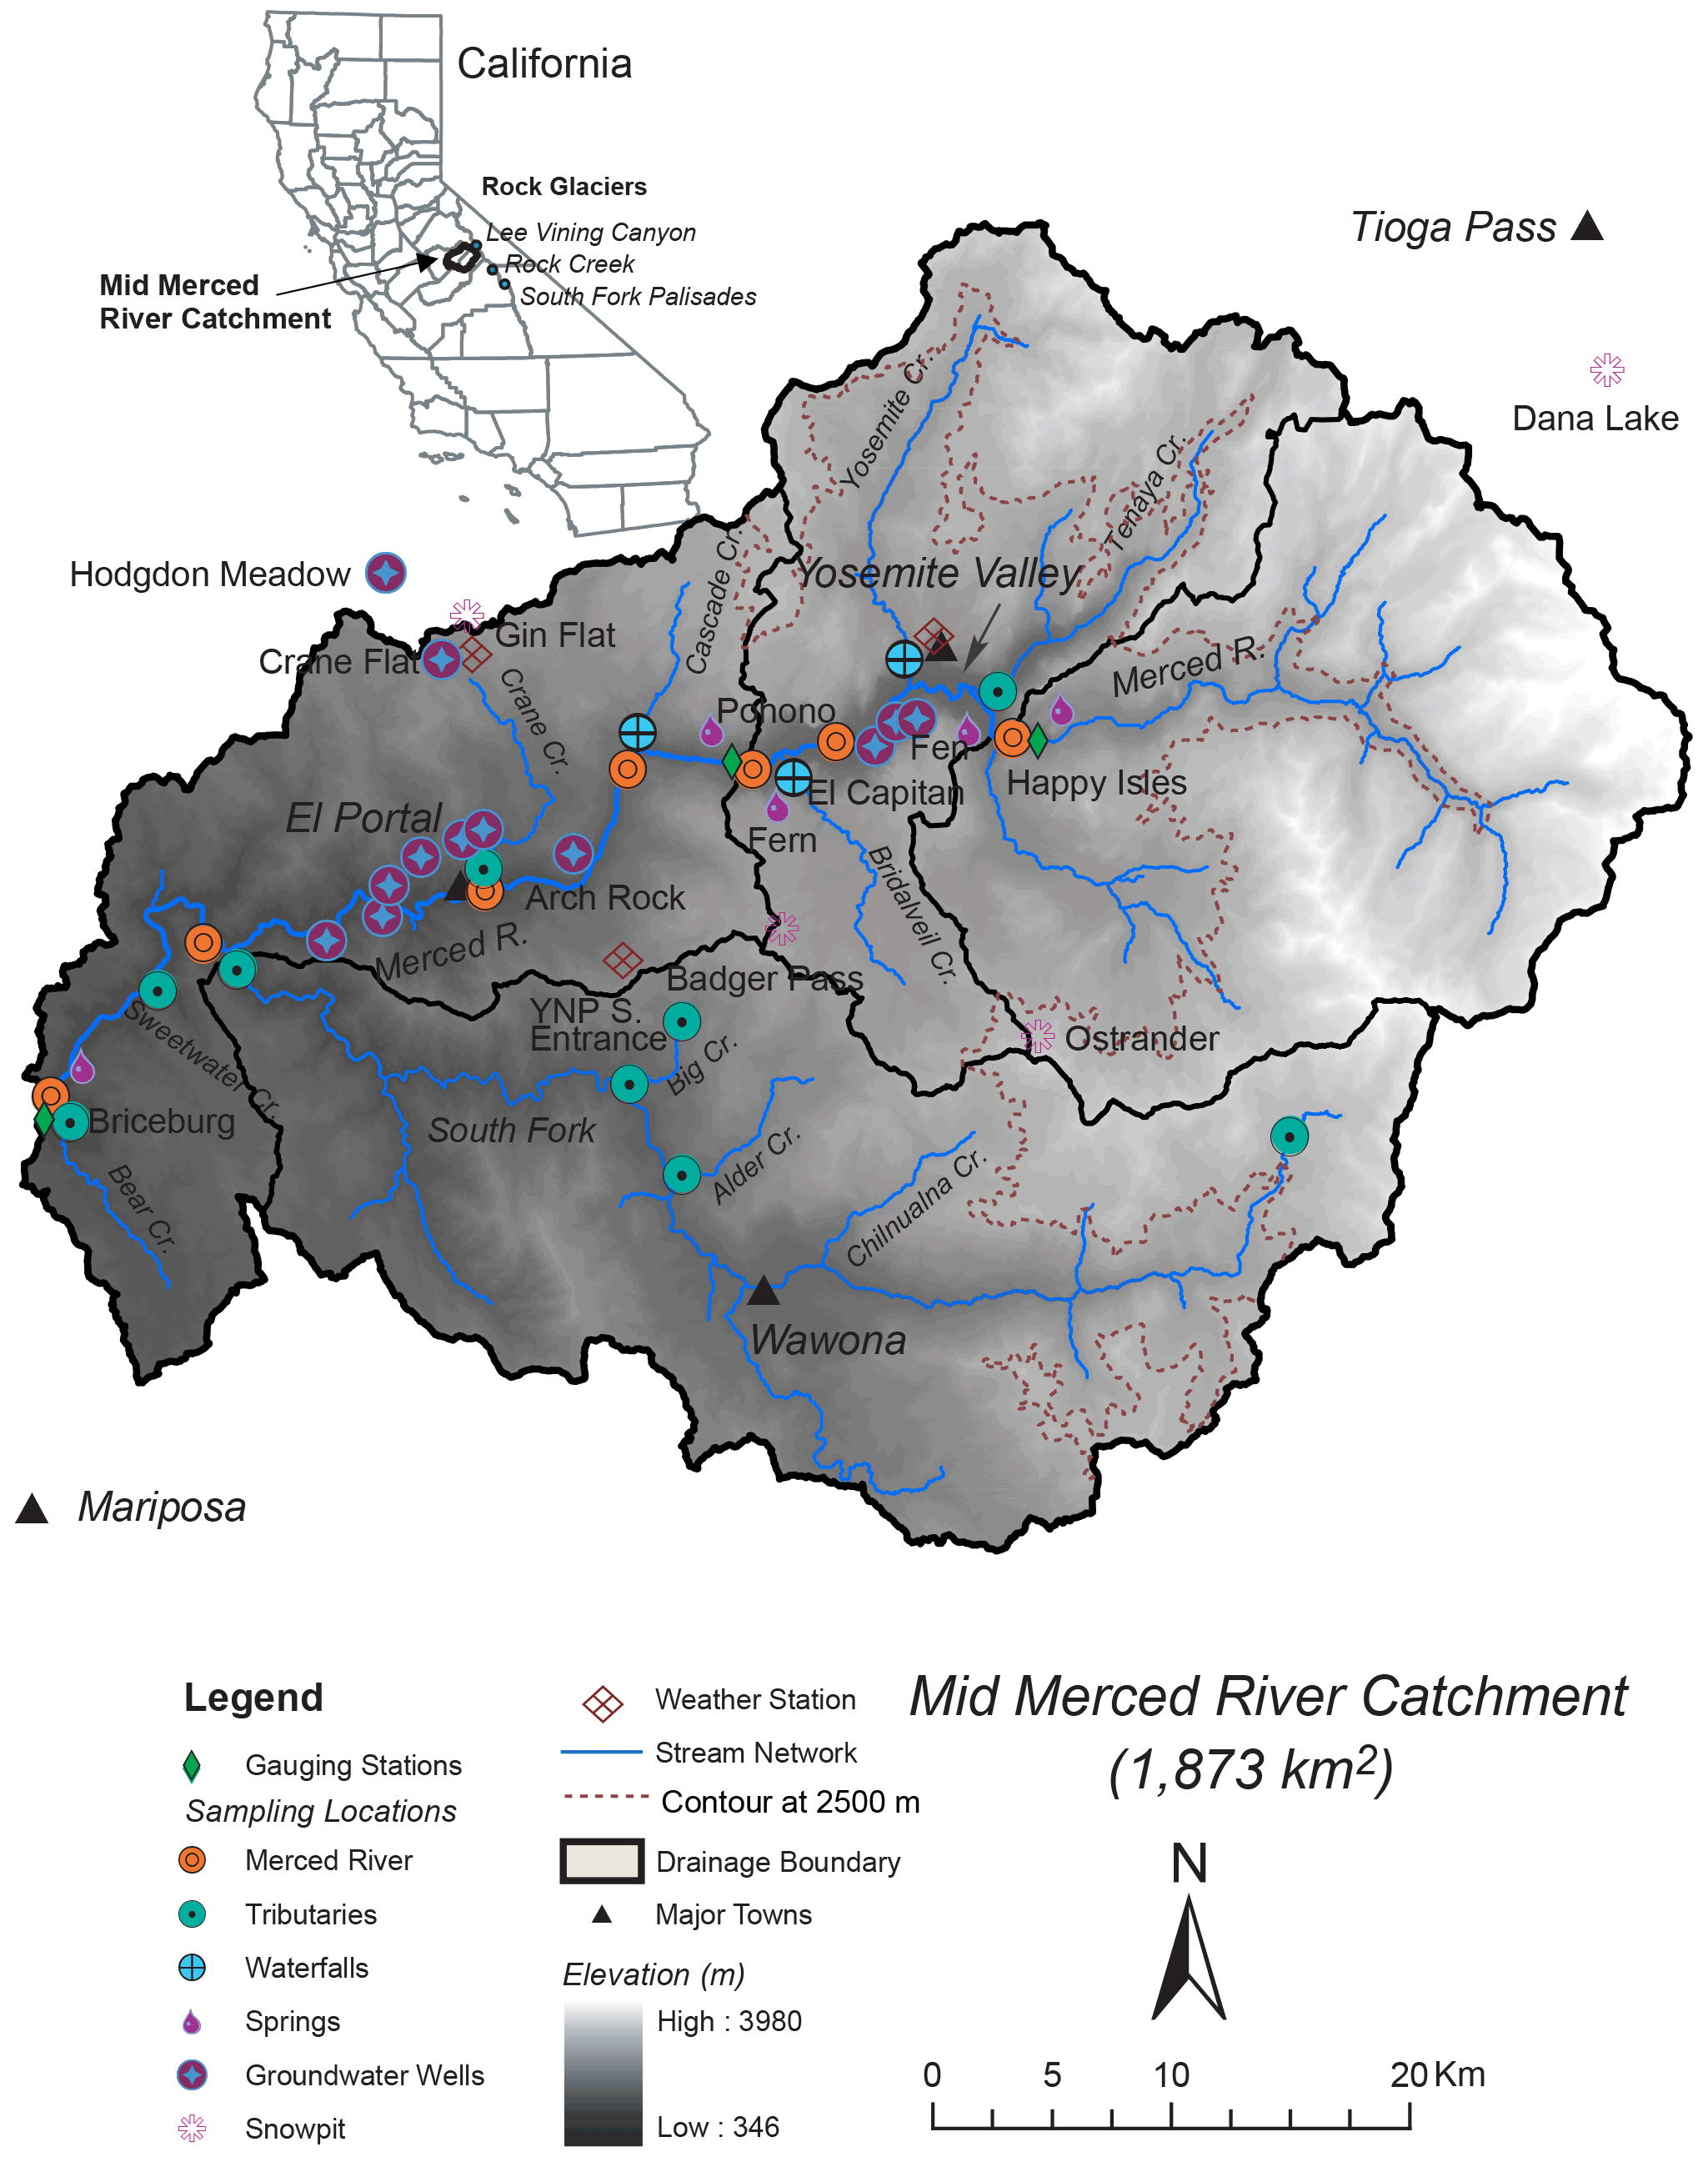
Figure 1Sampling locations for snow, stream water, spring water, and groundwater in the mid Merced River catchment along with stream gauges and meteorological stations, topography, stream network, and drainage boundary. The inset map shows the locations of the mid Merced River catchment in California and the rock glaciers outside the catchment. The elevation contour at 2500 m (dashed brown line) is also marked to show the upper boundary of the snow–rain transition zone.
The study was conducted in the mid Merced River catchment above Briceburg, including Yosemite Valley (Fig. 1). The mid Merced River catchment drains 1873 km2 and ranges in elevation from 346 m at Briceburg to 3993 m eastward at the crest. The drainage is relatively undisturbed by human activities such as dams, much of it within Yosemite National Park (YNP). The mid Merced River was designated a Wild and Scenic River in 1987 by the US Congress.
The mid Merced River catchment is characterized by a Mediterranean climate, with moderately wet, cold winters and dry, warmer summers. The mean annual precipitation in Yosemite Valley (Fig. 1) has been 916 mm, based on data from 1917 to 2008. Precipitation in the region occurs primarily from October to April, mainly as snow above 2500 m and as rain below 1500 m, as shown by meteorological data at a neighboring site in the southern Sierra Nevada, about 160 km south of the Merced River (Hunsaker et al., 2012). Precipitation from May to October accounted for only 25 % of the annual mean precipitation. Air temperature gradually decreased with elevation, with a lapse rate of approximately 1 °C per 100 m, while snow water equivalent (SWE) increased with elevation (Rice et al., 2011). Combining the measured SWE and remotely sensed snow covers, Rice et al. (2011) estimated that SWE increased by 11.0 cm per 100 m with elevation in 2004 and 2005.
Like most of the Sierra Nevada range, the mid Merced River catchment is underlain by granitic rocks of the Sierra Nevada batholith. Most of the rocks are part of the Tuolumne Intrusive Suite, a group of four concentrically arranged plutonic bodies within which are all granites and granodiorites (Bateman, 1992). Vegetation covers approximately 45 % of the catchment and includes a red fir forest that grades into a mixed subalpine forest above 2750 m (Fites-Kaufman et al., 2007). Above the timberline (∼ 3200 m), the vegetation consists of low-lying tundra plants and alpine meadow vegetation. Surficial deposits cover about 20 % of the catchment above Happy Isles, and valleys are covered primarily by glacial tills that occur in valley bottoms as lateral and recessional moraines (Clow et al., 1996). Wells drilled in Yosemite Valley indicate that the deposit is about 300 m, consistent with Gutenberg et al. (1956), which is dominated by unconsolidated sands from land surface to about 20 m below, mainly silt from 20 to 70 m, granitic gravels in silt from 70 to 80 m, and chiefly boulders and sands below 80 m. The deposit in the lower section of the catchment from El Portal to Briceburg is approximately 20 m in depth, consisting of gravels, cobbles, decomposed granite, sand, and silt.
3.1 Hydrologic and meteorological data
Hydrologic and meteorological data were downloaded from the California Data Exchange Center (CDEC; https://cdec.water.ca.gov, last access: 17 August 2023). Streamflow was measured at Happy Isles and Pohono Bridge (data also available for both sites at https://waterdata.usgs.gov/usa/nwis, last access: 17 August 2023) (Fig. 1) by the United States Geological Survey (USGS), and daily mean discharges were used in the study. Happy Isles is a USGS Hydrologic Benchmark Network site; this network was developed, in part, for its utility as a long-term monitoring network designed for the detection of trends in streamflow and chemistry in response to changes in climate (Mast and Clow, 2000). Note that streamflow at Briceburg was measured by the Merced Irrigation District. The stage sensor at Briceburg is located inside a stilling well from which water is pumped out to supply water for the city of Mariposa, which may cause the water level to drop several feet during short periods. The streamflow data at Briceburg was thus used with care in this study. Precipitation was measured in Yosemite Valley, Gin Flat, and Wawona by the Yosemite National Park and the California Department of Water Resources. Snow depth was measured by snow courses, operated by the California Department of Water Resources and US Natural Resource Conservation Service, and the daily values at Gin Flat, Ostrander, and Tioga Pass were selected. Daily snow water equivalent (SWE) data were not available for all stations and thus snow depth was used in this study. Snow depth data from other stations in the catchment were not selected because daily values were not available. Tioga Pass, located just outside the catchment, was selected because it is the only one located above 3000 m in the region.
3.2 Sample collection
Samples of stream water, groundwater, and spring water were collected during the 2005–2008 period through extensive field campaigns in the mid Merced River catchment (Fig. 1 and Table 1). Stream water samples were collected weekly to biweekly at about 20 locations along the Merced River, including gauges at Happy Isles, Pohono Bridge, Briceburg, and major tributaries. Note that samples of the Merced River at the Cascade picnic area were collected from a spot right after the confluence of Cascade Creek (Fig. 1). The Merced River channel is wide open in that section, and the sampling spot is on the same side as Cascade Creek. Water from Merced River and Cascade Creek may not be well mixed at the sampling spot due to the short distance to the confluence, but a well-mixed spot cannot be established due to local landscape, safety, and logistic issues. In addition, an earlier study showed that this area is a groundwater discharge zone (Shaw et al., 2014). Therefore, data from this site were used and interpreted cautiously.
Table 1Mean δ18O and δ2H values with ±1σ (one standard deviation) in streams, glacier outflows, spring water, groundwater, and precipitation in the mid Merced River catchment and vicinity, along with catchment characteristics.
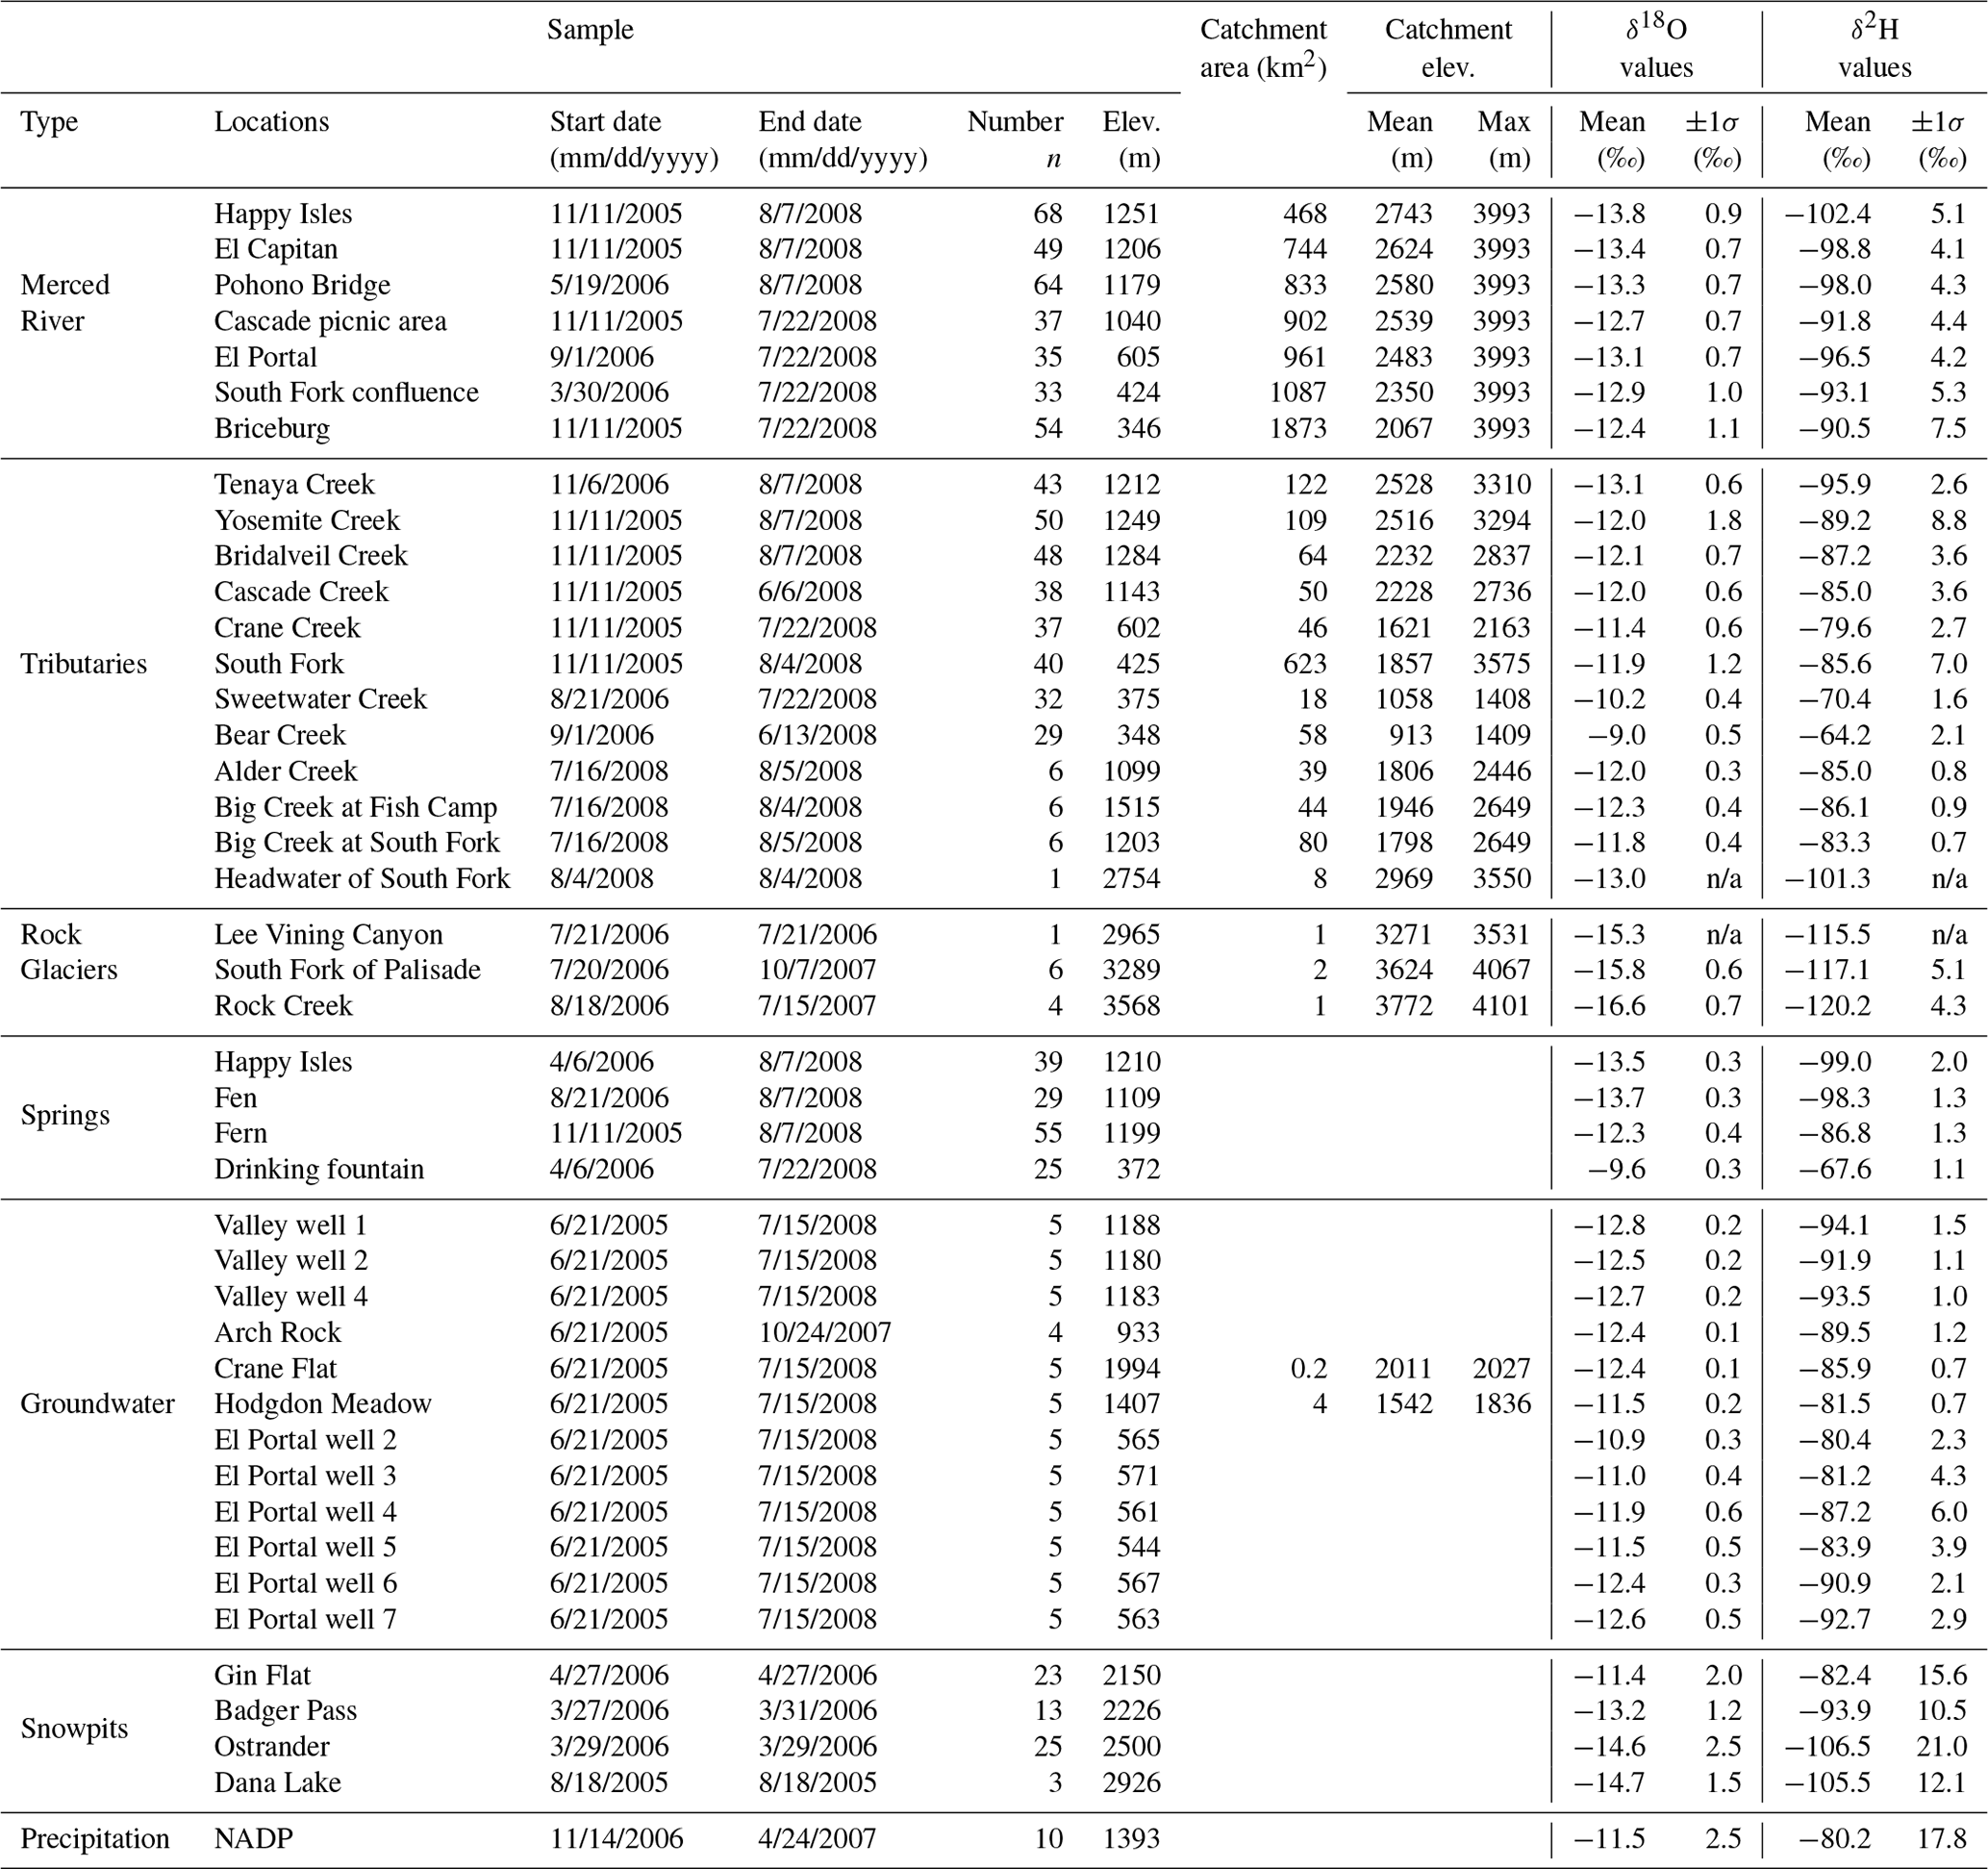
Note: n/a means ”not applicable”, as standard deviation cannot be calculated with a single sample.
Water samples were collected from four springs located near the Merced River between Happy Isles and Briceburg (Fig. 1), with a frequency varying from weekly to monthly. Water samples were also collected bi-annually during snowmelt and off-snowmelt seasons from 2005 to 2008 from drinking water wells located in Yosemite Valley, El Portal, Crane Flat, and Hodgdon Meadow (Fig. 1). The depths of wells range from 100 to 120 m in Yosemite Valley and from 20 to 30 m at El Portal. Information on the depth of other wells was not available. Samples were taken directly from the sampling ports.
Water samples were also collected at the outflows of three rock glaciers at the South Fork of Palisade River, Rock Creek, and Lee Vining Canyon, just outside the mid Merced River catchment (Fig. 1). These samples were collected between one and four times from July 2006 to October 2007.
Snow and rain samples were collected at the National Atmospheric Deposition Program (NADP) site (Site ID = CA99, elevation = 1393 m) in Yosemite National Park from November 2006 through April 2007. These samples were collected from a rain gauge right after storms and only from relatively large storms when there was enough water left over after the NADP samples were collected. These samples were from snowfall, rainfall, and a mixture of snowfall and rainfall based on the collector's notes.
Three snowpits were excavated near the maximum snow accumulation in late March and early April 2006 at Badger Pass, Gin Flat, and Ostrander near Yosemite Valley (Fig. 1; Table 1). The depth of the snowpits ranges from 1.5 to 2.5 m. Snow samples were collected continuously every 10 cm throughout the entire pit at Badger Pass, Ostrander, and Gin Flat. Three snow-core samples were collected in summer 2005 at Dana Lake, just below the crest on the eastern side of Sierra Nevada and outside the mid Merced River catchment. Snow samples were stored in plastic bags pre-rinsed with deionized water (DI) and washed by sampling snow at the time of collection. Snow samples were melted at room temperature immediately upon arrival at the laboratory.
All liquid water samples were stored in 30 mL glass vials with snap-on caps. All samples were checked for the absence of air bubbles. After collection, samples were transported to the University of California, Merced, and kept refrigerated at 4 °C until analysis.
3.3 Sample analysis
The stable isotope ratios (18O 16O and 2H 1H) of all samples are expressed as δ (per mil, expressed as ‰ ) variation in the ratio of the sample relative to Vienna Standard Mean Ocean Water (VSMOW). Samples collected in 2005 and 2006 were analyzed at the University of California, Berkeley, using a VG PRISM isotope ratio mass spectrometer, with a precision of 0.05 ‰ for δ18O and 0.3 ‰ for δ2H. Samples collected in 2007 and 2008 were analyzed using a Los Gatos LTD100 Isotopic Analyzer at the University of California, Merced. This analyzer is based on continuous laser absorption spectroscopy (LAS). The precision of this instrument was comparable to that of a conventional mass spectrometer (L. Wang et al., 2009), with our data showing 1σ (standard deviation) precision better than 0.2 ‰ for δ18O and 0.3 ‰ for δ2H, consistent with Berman et al. (2009). The precision was slightly better for δ2H than for δ18O because the measurement of 18O 16O was more sensitive to varying room temperatures (Manish Sharma, Los Gatos Company, personal communication, 2009). For this reason, δ2H values are primarily presented in this study where both δ18O and δ2H values did not have to be used.
3.4 Drainage delineation
Drainage above a gauge or a sampling point was delineated using a 30 m digital elevation model (DEM) following the standard procedure described in the ArcGIS 10.0 manual (ESRI Inc.). The 30 m DEM data were acquired from a USGS website (https://www.usgs.gov/the-national-map-data-delivery/gis-data-download). The geographic location of a gauge or a sampling point was used as a pour point. After the delineation, the mean elevation for the drainage was calculated as the arithmetic average of all raster grid elevations within the drainage.
4.1 Hydrometeorology
Hydrologic conditions were very different in water years (1 October in the previous year to 30 September) 2006, 2007, and 2008 (all referring to water years or WY hereinafter; otherwise stated). Precipitation and snow depth were much higher in 2006 than in 2008 and particularly in 2007 (Fig. 2a and b). Annual precipitation was 1247, 1472, and 1957 mm in Yosemite Valley, Wawona, and Gin Flat in 2006, respectively, compared to 568, 631, and 736 mm in 2007 (Fig. 2a). Annual precipitation was 1039 mm in 2008 at Wawona. The annual precipitation records in 2008 were incomplete for Yosemite Valley and Gin Flat. Precipitation primarily occurred from October to April or May each year, and little occurred during summer and early fall (Fig. 2a).
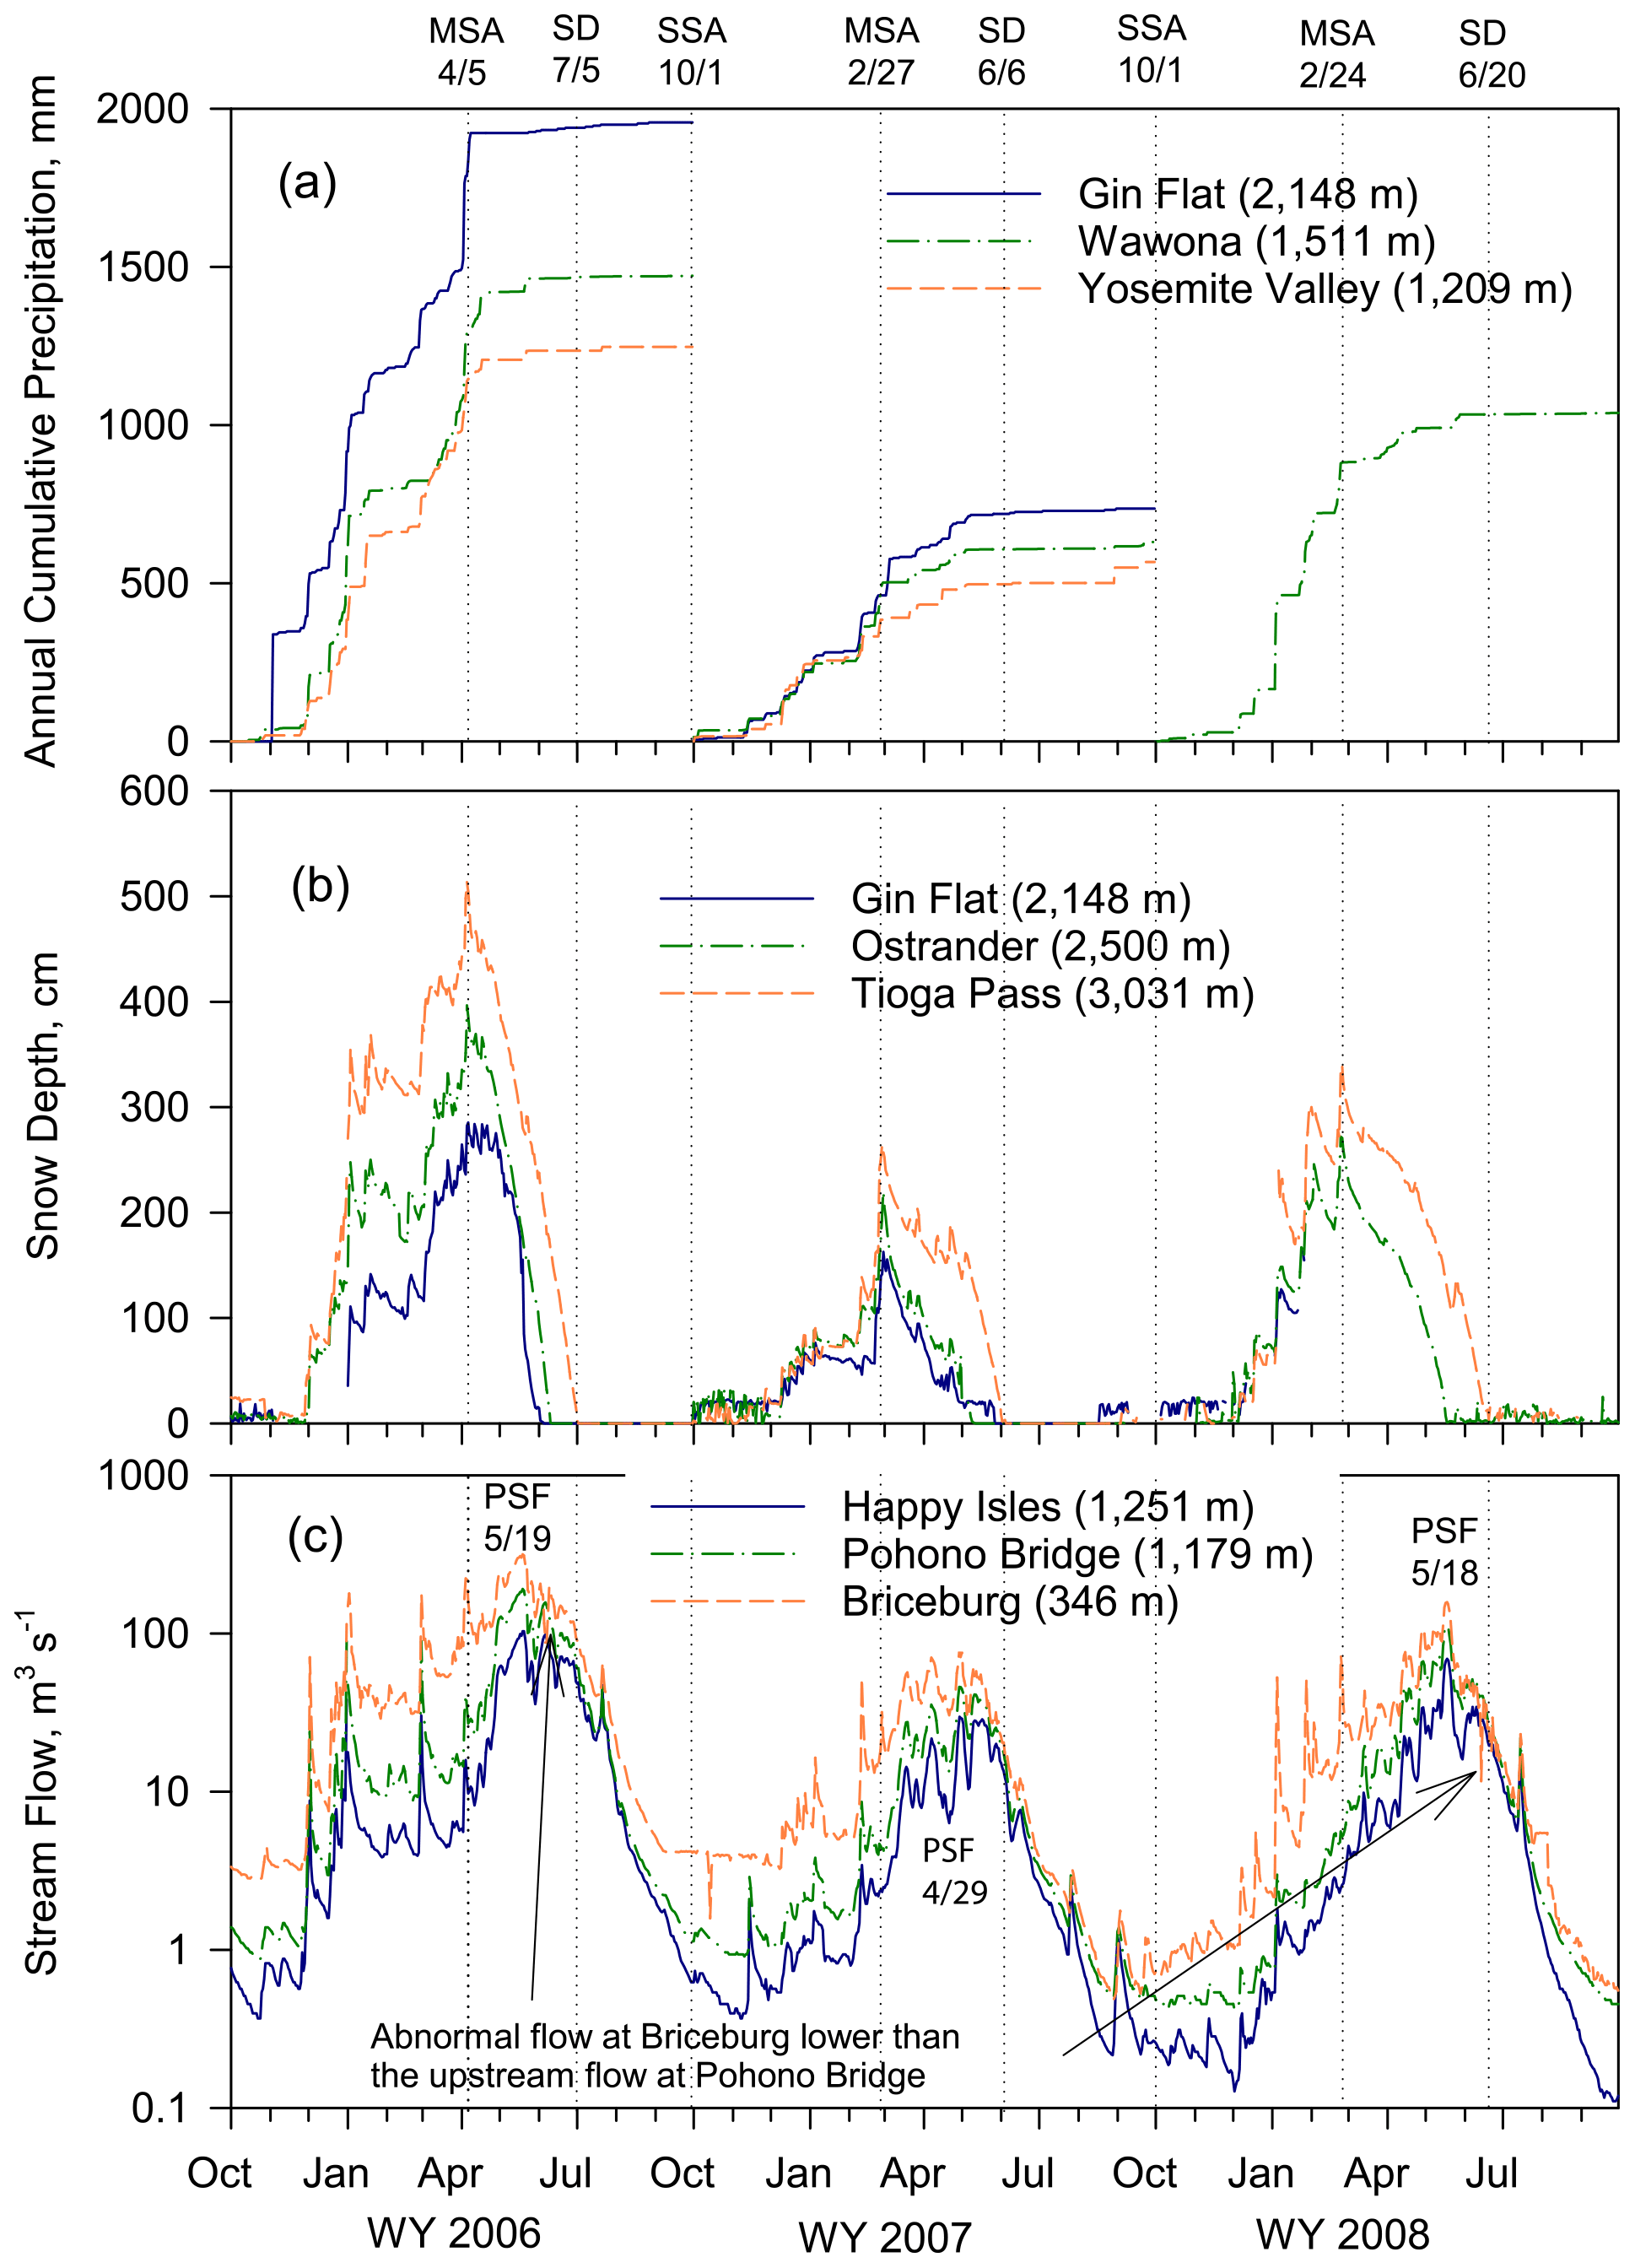
Figure 2Hydrometeorology of the mid Merced River catchment for (a) daily accumulated precipitation, (b) daily snow depth, and (c) daily streamflow. Note the abnormal flow occasionally measured at Briceburg, which is lower than upstream flow at Pohono Bridge. Also note the lack of precipitation data in 2008 at Gin Flat and Yosemite Valley and snow depth data in most of 2008 at Gin Flat and in February 2008 at Tioga Pass. The vertical dotted gray grids mark the dates of the maximum snow accumulation (MSA), snow depletion (SD) at Tioga Pass, and start of snow accumulation (SSA) as 1 October each year. Dates of peak streamflow (PSF) are also marked in (c). Other than Gin Flat, the two other sites are not the same in (a) and (b), as precipitation and snow depth data were not available for the same sites.
Maximum snow accumulation occurred on 5 April in 2006, with a depth of 282 cm at Gin Flat, 396 cm at Ostrander, and 514 cm at Tioga Pass (Fig. 2b). The snowpack was depleted at the three sites by 5 June, 11 June, and 5 July, respectively. Maximum snow accumulation occurred on 27 February in 2007, about 5 weeks earlier than in 2006, with maximum snow depths of 142, 192, and 264 cm at Gin Flat, Ostrander, and Tioga Pass, respectively, which is approximately 50 % of the depth in 2006. Snowpack depletion occurred in late May and early June of 2007 at all snow course sites. Snowpack reached a maximum depth on 24 February in 2008, similar to 2007, but with a much deeper snowpack (272 and 339 cm at Ostrander and Tioga Pass, respectively; note that snow depth data were not available for most of 2008 at Gin Flat). Snowpack was mostly depleted by late May and June in 2008 at Ostrander and Tioga Pass, respectively.
The hydrograph in the Merced River follows a typical pattern of a snowmelt-dominated hydrologic system of the western US, steadily increasing in early spring, peaking in mid spring or late spring, and then gradually decreasing (Fig. 2c). Peak stream runoff occurred on 19 May in 2006, measured at 103 and 191 m3 s−1 at Happy Isles and Pohono Bridge, respectively. Peak flows higher than these values have been recorded only 13 times from 1916 to 2008 at the same gauges. Peak flows occurred earlier in drier 2007 on 29 April, with only 30 and 46 m3 s−1 at Happy Isles and Pohono Bridge, respectively. Peak flows below these values have been recorded only 11 times from 1916 to 2008. The flow condition in 2008 was intermediate, with peak flows of 69 and 112 m3 s−1 on 18 May 2008 at Happy Isles and Pohono Bridge, respectively. Several flow spikes usually occurred before the peak flow, apparently driven by rainfall events. The flows at Briceburg were occasionally lower than the upstream location at Pohono Bridge (Fig. 2c), showing the occasional problems in flow measurements at Briceburg, as mentioned earlier.
Based on the information above, a water year is divided into four periods to facilitate our understanding of the temporal variability in isotopic composition of stream water in the following sections. The four periods are the (1) snow accumulation period from 1 October (previous calendar year) to maximum snow accumulation (MSA) in spring at Tioga Pass, (2) snowmelt rising period from MSA to peak streamflow (PSF) at Happy Isles and Pohono Bridge, (3) snowmelt receding period from PSF to snow depletion (SD) at Tioga Pass, and (4) baseflow period from SD to 30 September. Snow depletion dates at Tioga Pass were chosen considering the entire mid Merced River catchment. Snow depletion occurred several weeks earlier in lower elevations (e.g., Gin Flat) than Tioga Pass (Fig. 2b). The snow depletion dates at Tioga Pass would be too late to mark the end of snow cover for many small catchments, which are mostly located below 2500 m – the upper limit of the snow–rain transition zone (Fig. 1). However, snow at the observation sites melted several weeks before the basin itself was free of snow (Rice et al., 2011). In addition, snowpack was much deeper in higher elevations than in lower elevations (Fig. 2b), and the depletion of snowpack in the areas above Tioga Pass should occur much later than that at Tioga Pass. Therefore, using snow depletion dates at Tioga Pass to represent the entire mid Merced River catchment appears to be a balanced consideration following the rule of thumb.
4.2 Isotopic composition in precipitation, stream water, and groundwater
Mean isotopic values varied significantly over locations in precipitation, stream water, and groundwater and from precipitation to stream water and groundwater (Table 1). The mean δ2H values ranged from −80.2 ‰ to −106.5 ‰ in snowpits excavated at the maximum snow accumulation in spring 2006 (Dana Lake samples not included) and in precipitation collected at the NADP site from November 2006 to April 2007, with an elevation range of 1393–2500 m. The mean δ2H values varied from −90.5 ‰ to −102.4 ‰ in stream water along the Merced River above Briceburg and from −64.2 ‰ to −101.3 ‰ in tributaries, with a mean drainage elevation ranging from 913 to 2969 m. The mean δ2H values in four springs varied between −67.6 ‰ and −99.0 ‰, with sampling locations ranging in elevation from 372 to 1210 m, and between −80.4 ‰ and −94.1 ‰ in groundwater, with sampling ports ranging in elevation from 544 to 1994 m.
Temporal variability in δ2H values, as illustrated by 1σ values in Table 1, was the greatest in snow and precipitation, with 1σ ranging from 10.5 ‰ to 21.0 ‰, and generally the lowest in spring and in groundwater, with 1σ < 3.0 ‰ for most sites. The 1σδ2H value varied from 4.1 ‰ to 7.5 ‰ for stream water samples collected in the Merced River above Briceburg and was < 3.6 ‰ for all tributaries except Yosemite Creek and South Fork (8.8 ‰ and 7.0 ‰, respectively).
δ2H values in snow and precipitation varied significantly between storms. δ2H values in precipitation at the NADP site in Yosemite National Park ranged from −109.9 ‰ to −54.3 ‰ from November 2006 to April 2007 at an elevation of 1393 m (Fig. 3a). δ2H values in snowpits at much higher elevations also changed significantly over depth, with a range of −126.8 ‰ to −72.6 ‰ at Badger Pass (elev. 2226 m) and −159.4 ‰ to −71.6 ‰ at Ostrander (elev. 2500 m) (Fig. 3b and c). It was impossible in this study to associate the variation in δ2H values over snow depth with storm history; nevertheless, it approximately reflected the temporal changes in δ2H values in snowfall over time.
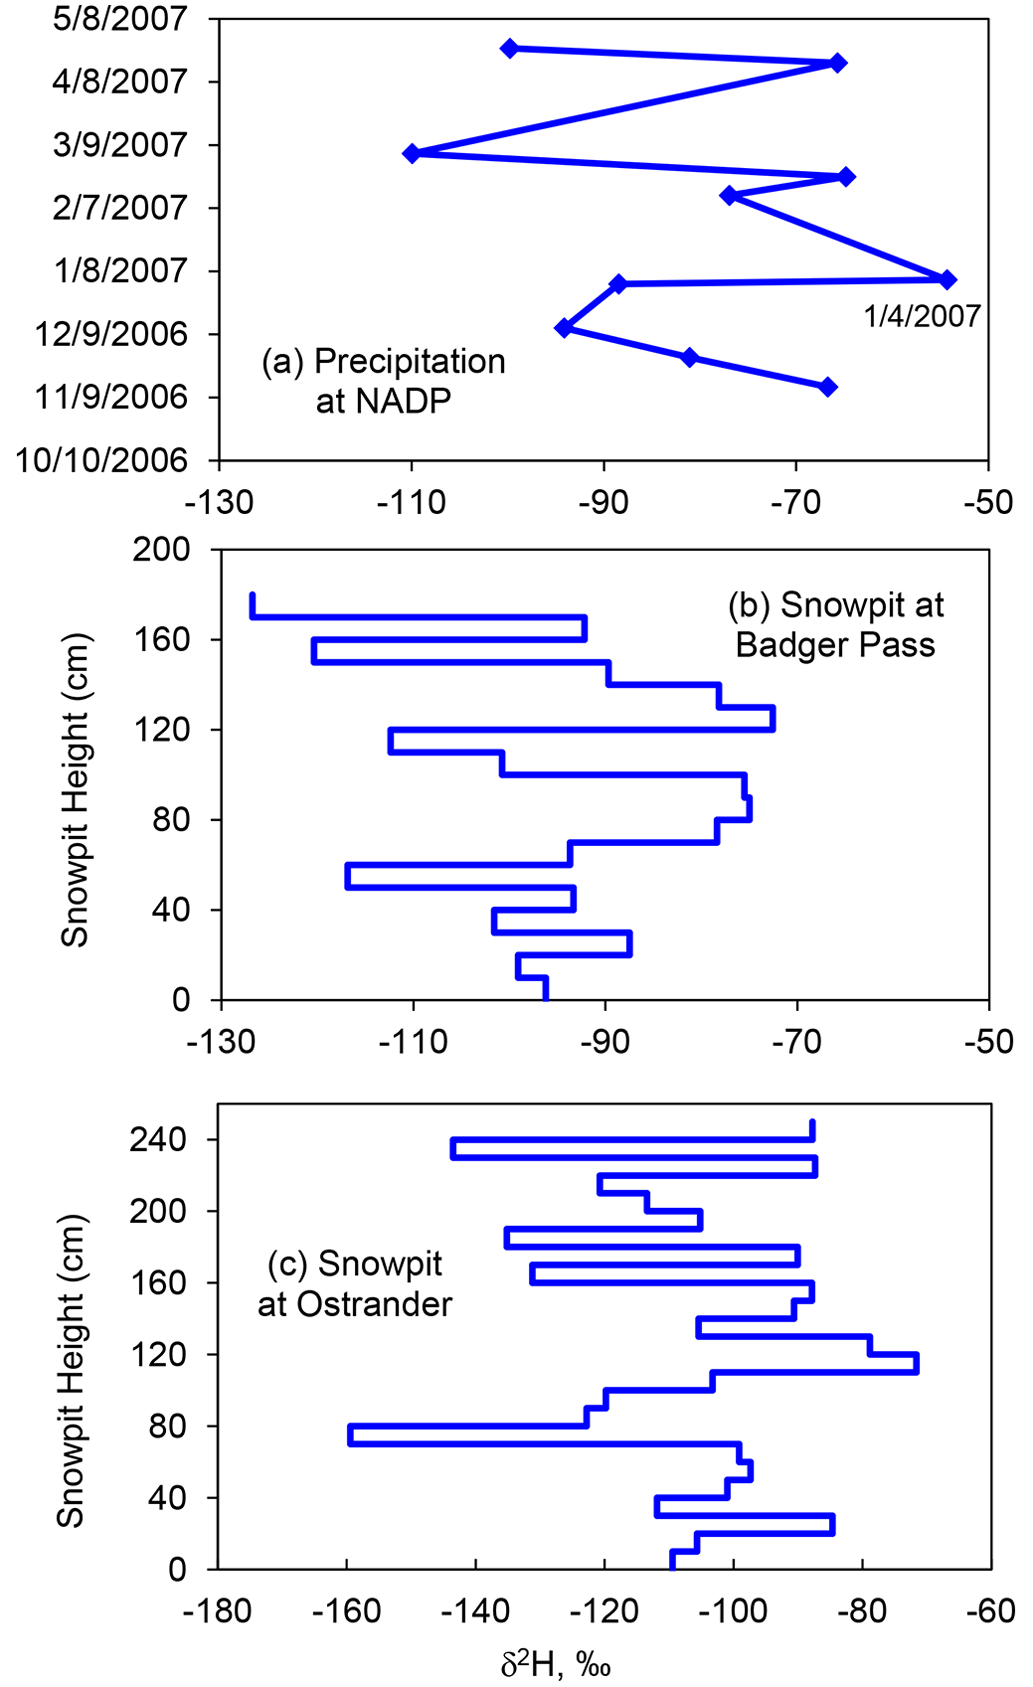
Figure 3(a) Temporal variation in δ2H in precipitation at the National Atmospheric Deposition Program (NADP) site located in Yosemite Valley; (b) and (c) δ2H profiles in snowpits excavated at the maximum snow accumulation at Badger Pass and Ostrander, respectively.
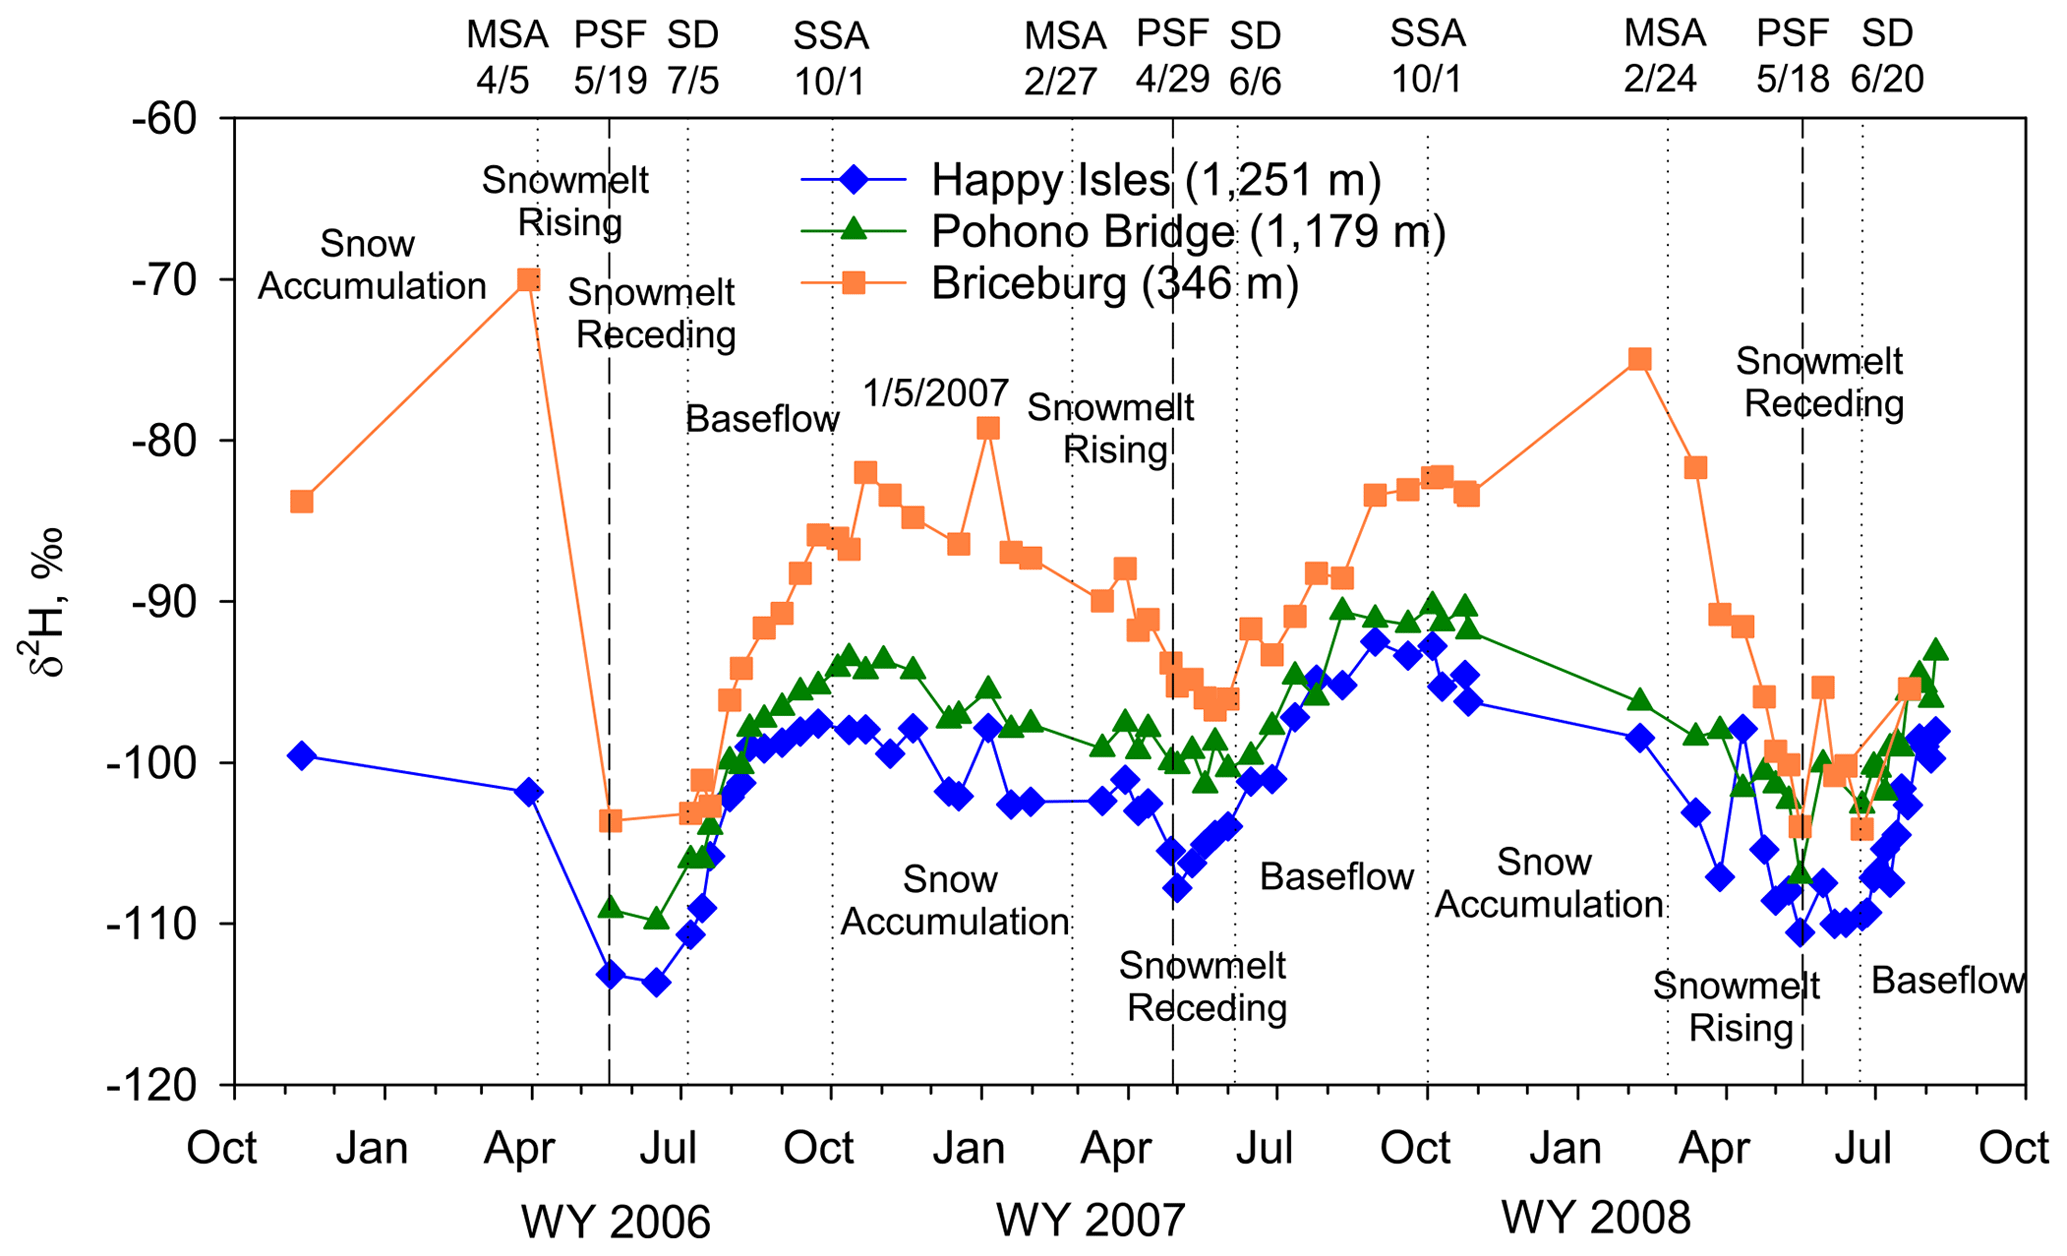
Figure 4Variation in δ2H values in stream water from water years 2006 to 2008 at Happy Isles, Pohono Bridge, and Briceburg. Dates marked by vertical dotted gray grids are the same as in Fig. 2 with the addition of peak streamflow (PSF) with dashed lines. Four periods are also marked wherever space allows.
δ2H values in stream water along the Merced River varied over time, with more depleted (lower) values during the snowmelt period (snowmelt rising + receding periods) and more enriched values (higher) during the snow accumulation and baseflow periods (Fig. 4). δ2H values in stream water along the Merced River became more enriched with an increase in drainage areas or a decrease in sampling elevations, with the lowest values at Happy Isles and the highest values at Briceburg consistently from 2006 to 2008 except for a couple of samples.
During the snow accumulation period, isotopic composition in the Merced River tended to become gradually depleted at Happy Isles, Pohono Bridge, and Briceburg (Fig. 4). For example, δ2H values were −98.0 ‰ on 12 October 2006 and −102.4 ‰ on 31 January 2007 at Happy Isles. There were isolated spikes in isotopic values during the period, e.g., a spike on 5 January 2007 at all three gauges and on 8 February 2008 at Briceburg. These isolated spikes appear to be caused by rain events with a more enriched isotopic composition. For example, a major rain event occurred on 4 January 2007, with 12 mm recorded in Yosemite Valley and a δ2H value of −54.3 ‰ at the NADP site (Fig. 3a), which increased streamflow (Fig. 2c) and δ2H values in stream water abruptly the next day at all three gauges (Fig. 4). During this period, δ2H values decreased significantly (p < 0.05) with an increase in streamflow by a logarithmic function at Happy Isles and Pohono Bridge but increased significantly (p < 0.05) at Briceburg (Fig. 5). The increase was apparently a result of greater rainwater inputs with more enriched isotopic signature. The magnitude of streamflow spikes was much higher at Briceburg than at the other higher-elevation gauges during the snow accumulation periods, suggesting much more rainfall inputs from lower elevations at Briceburg (Fig. 2c), causing an increase in isotopic values in stream water with an increase in streamflow.
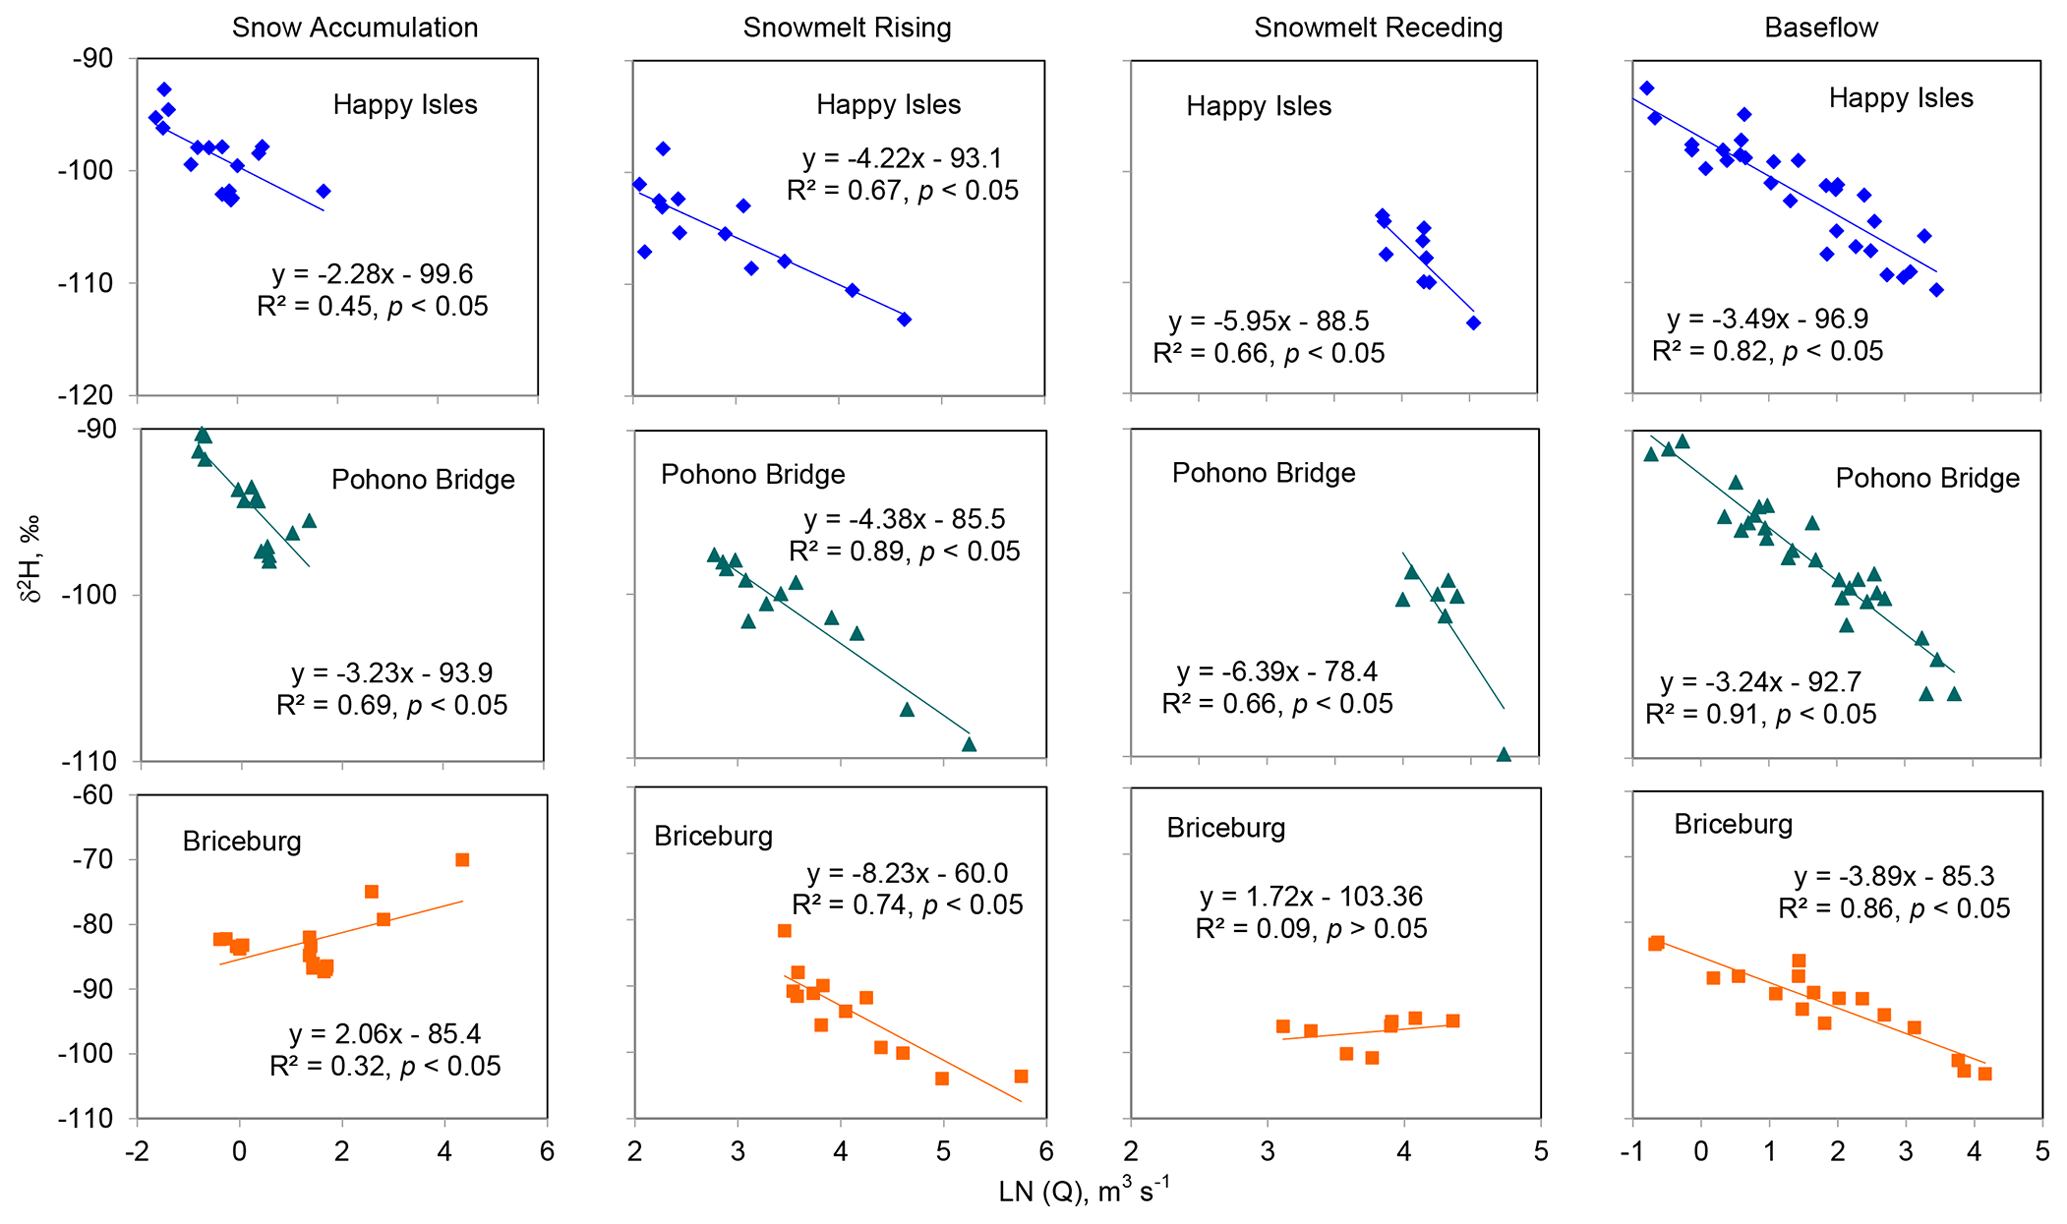
Figure 5Correlation between δ2H values in stream water and streamflow (natural logarithmic values) during four periods at Happy Isles, Pohono Bridge, and Briceburg.
During the snowmelt period (snowmelt rising + receding periods), the variation in δ2H values over time followed the shape of a trough (Fig. 4). In fact, the variation can be described by a parabolic function, particularly for 2006 and 2008 at Happy Isles (R2= 0.98 and 0.91, respectively; curves not shown). The lowest values, which occurred at peak flows, were significantly inversely correlated with peak flows (R2= 1.0, n = 3, p < 0.05) and varied over years, e.g., −113.7 ‰ in 2006, −107.8 ‰ in 2007, and −110.6 ‰ in 2008 at Happy Isles. During this period, isotopic composition became depleted with an increase in streamflow (p < 0.05), consistent between the snowmelt rising and receding periods for the Happy Isles and Pohono Bridge gauges (Fig. 5). Similar to the snow accumulation period, however, isotopic composition became more enriched with an increase in streamflow during the snowmelt receding period at Briceburg as a result of the rainfall effect.
During the baseflow period, isotopic composition became enriched over time (Fig. 4). The isotopic enrichment over time during this period occurred much more rapidly (steeper slopes) than the isotopic depletion during the snow accumulation period. Also, the enrichment was much stronger at Briceburg (again steeper slopes) than at Happy Isles and Pohono Bridge, particularly in 2006 and 2007. During this period, δ2H values decreased significantly with an increase in streamflow (p < 0.05) at all three Merced River gauges (Fig. 5).
4.3 Local meteoric water line and local evaporation line in stream water and groundwater
A local meteoric water line (LMWL) of δ2H versus δ18O was established using 71 snow and rain samples collected at the NADP site and snowpits (each 10 cm snow sample treated as an individual sample for this purpose) excavated at Badger Pass, Gin Flat, and Ostrander (Fig. 6a). The slope and intercept of the LMWL were 7.88 and 9.39 (R2= 0.96, p < 0.001), respectively, which are very close to those (8 and 10, respectively) of the global meteoric water line (GMWL) of Craig (1961).
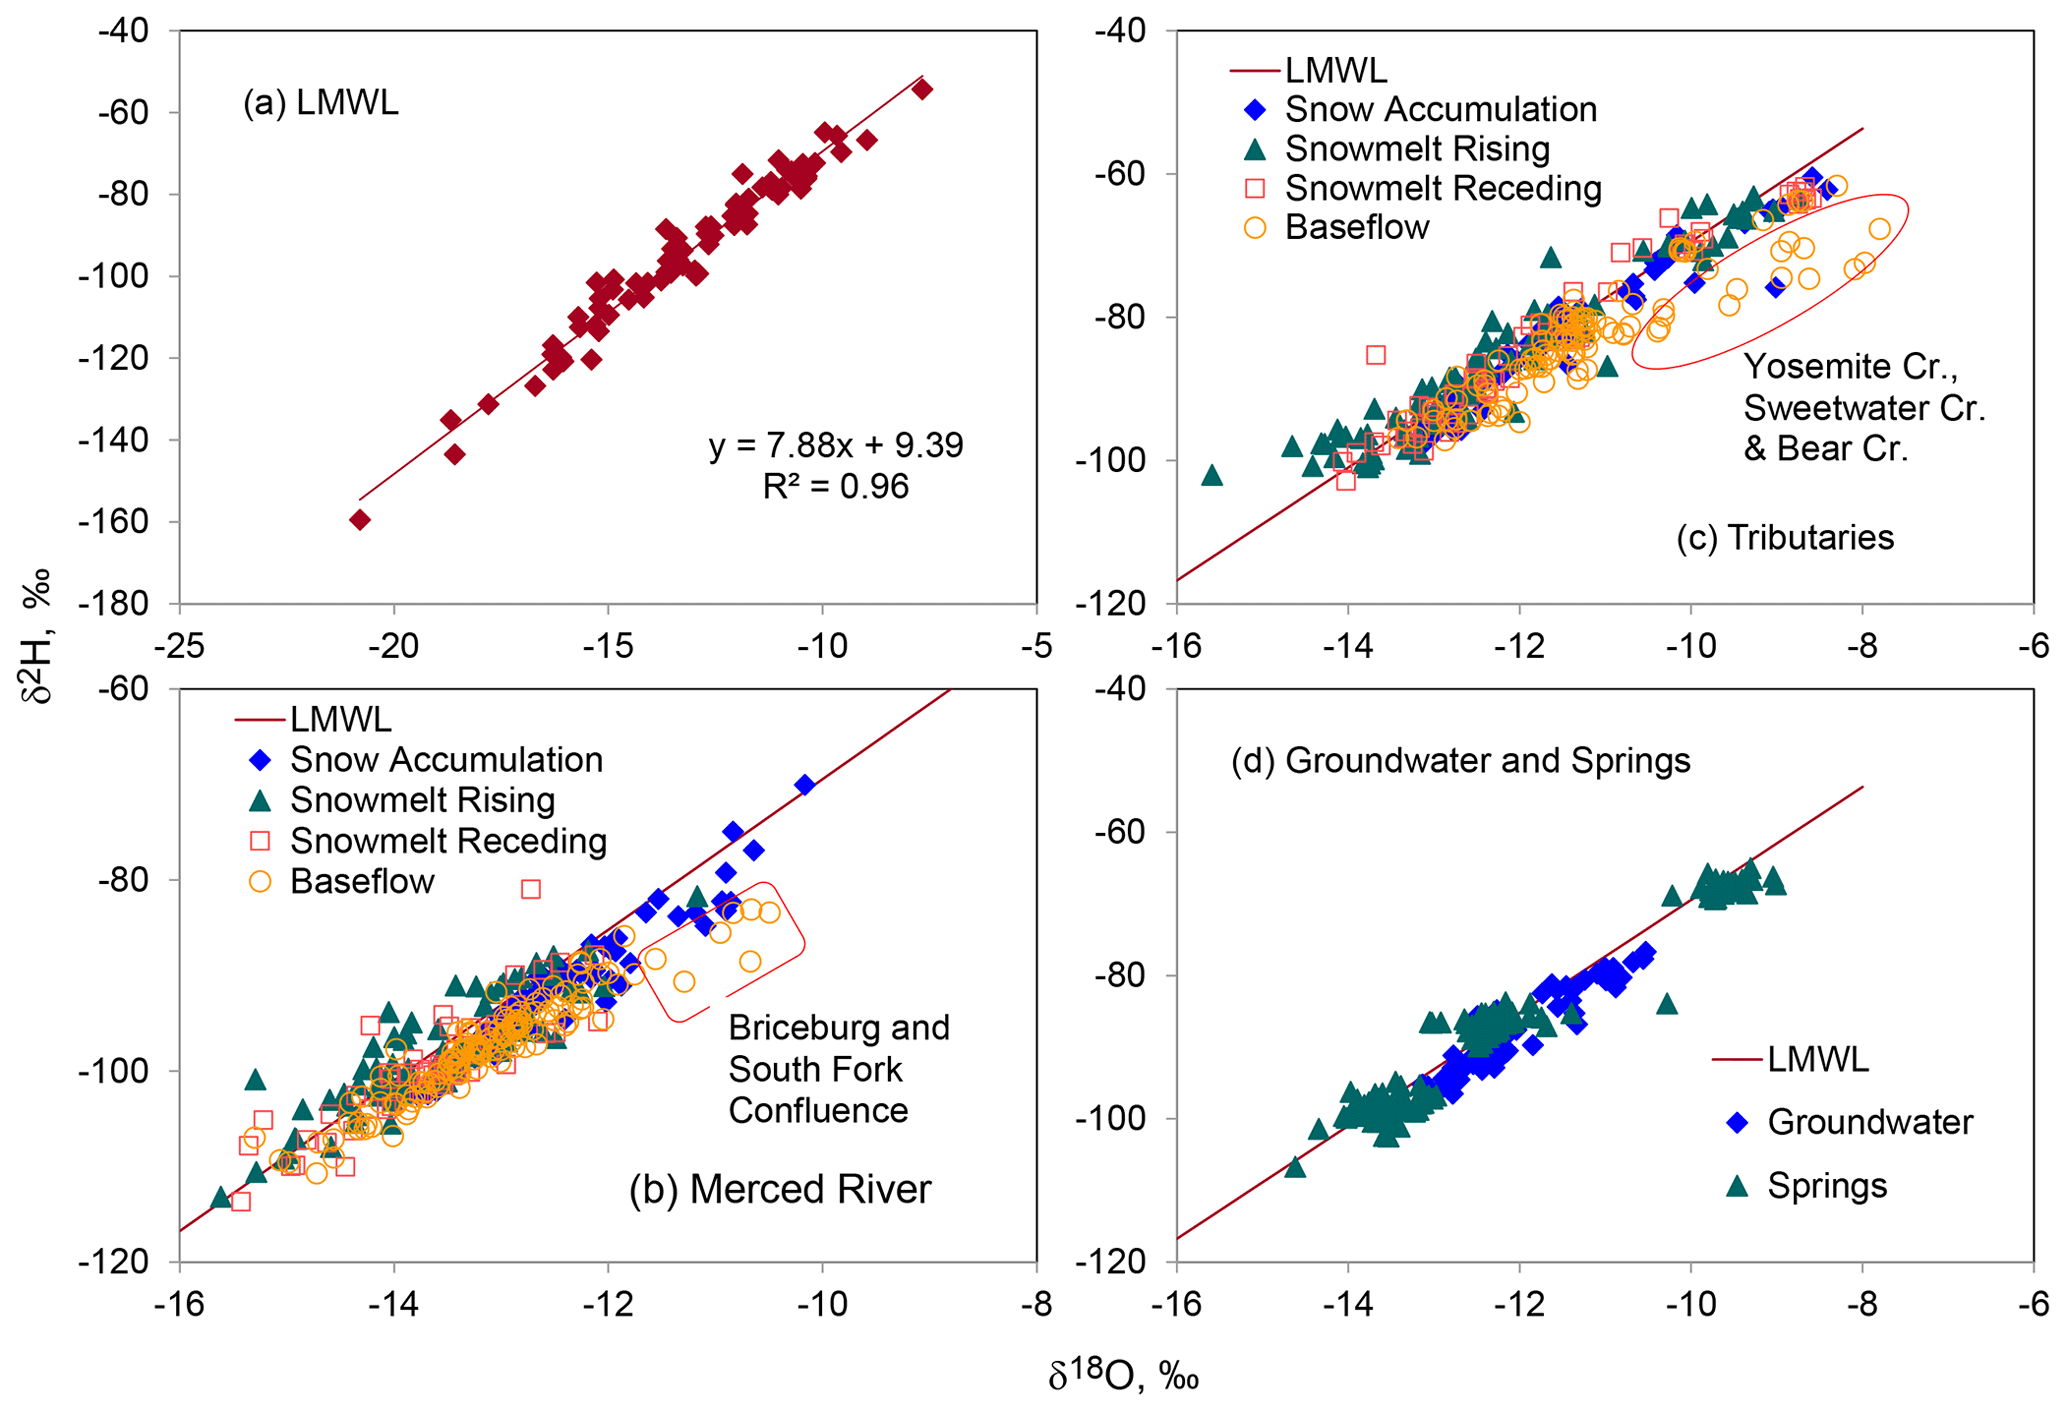
Figure 6Relationship between δ2H and δ18O values in (a) precipitation (rain and snow), in stream water samples collected during the four periods defined in Fig. 4 for (b) Merced River at all locations listed in Table 1, (c) in all tributaries listed in Table 1, and (d) in groundwater and spring water collected at all sites.
Most stream water samples collected along the Merced River and its tributaries fall near the LMWL on the δ2H-δ18O plot (Fig. 6b and c). However, the slopes of δ2H-δ18O linear trends for individual sites were lower than the slope of the LMWL and varied over locations (Table 2), indicating an evaporation effect. The slope was lower than 6.13 for all Merced River locations, with the intercept being less than −14.7. For tributaries, the slope and intercept were even lower, e.g., slope < 5.0 in seven of eight tributaries and intercept mostly less than −30.0 (Table 2). R2 values varied from 0.73 to 0.90 for all Merced River locations except the Cascade picnic area (0.48) but were lower than 0.76 for all tributaries except Yosemite Creek (0.95) and South Fork (0.94).
Table 2Local meteoric water line (LMWL), local evaporation line (LEL), and isotopic composition at the intersection of the LEL and LMWL.
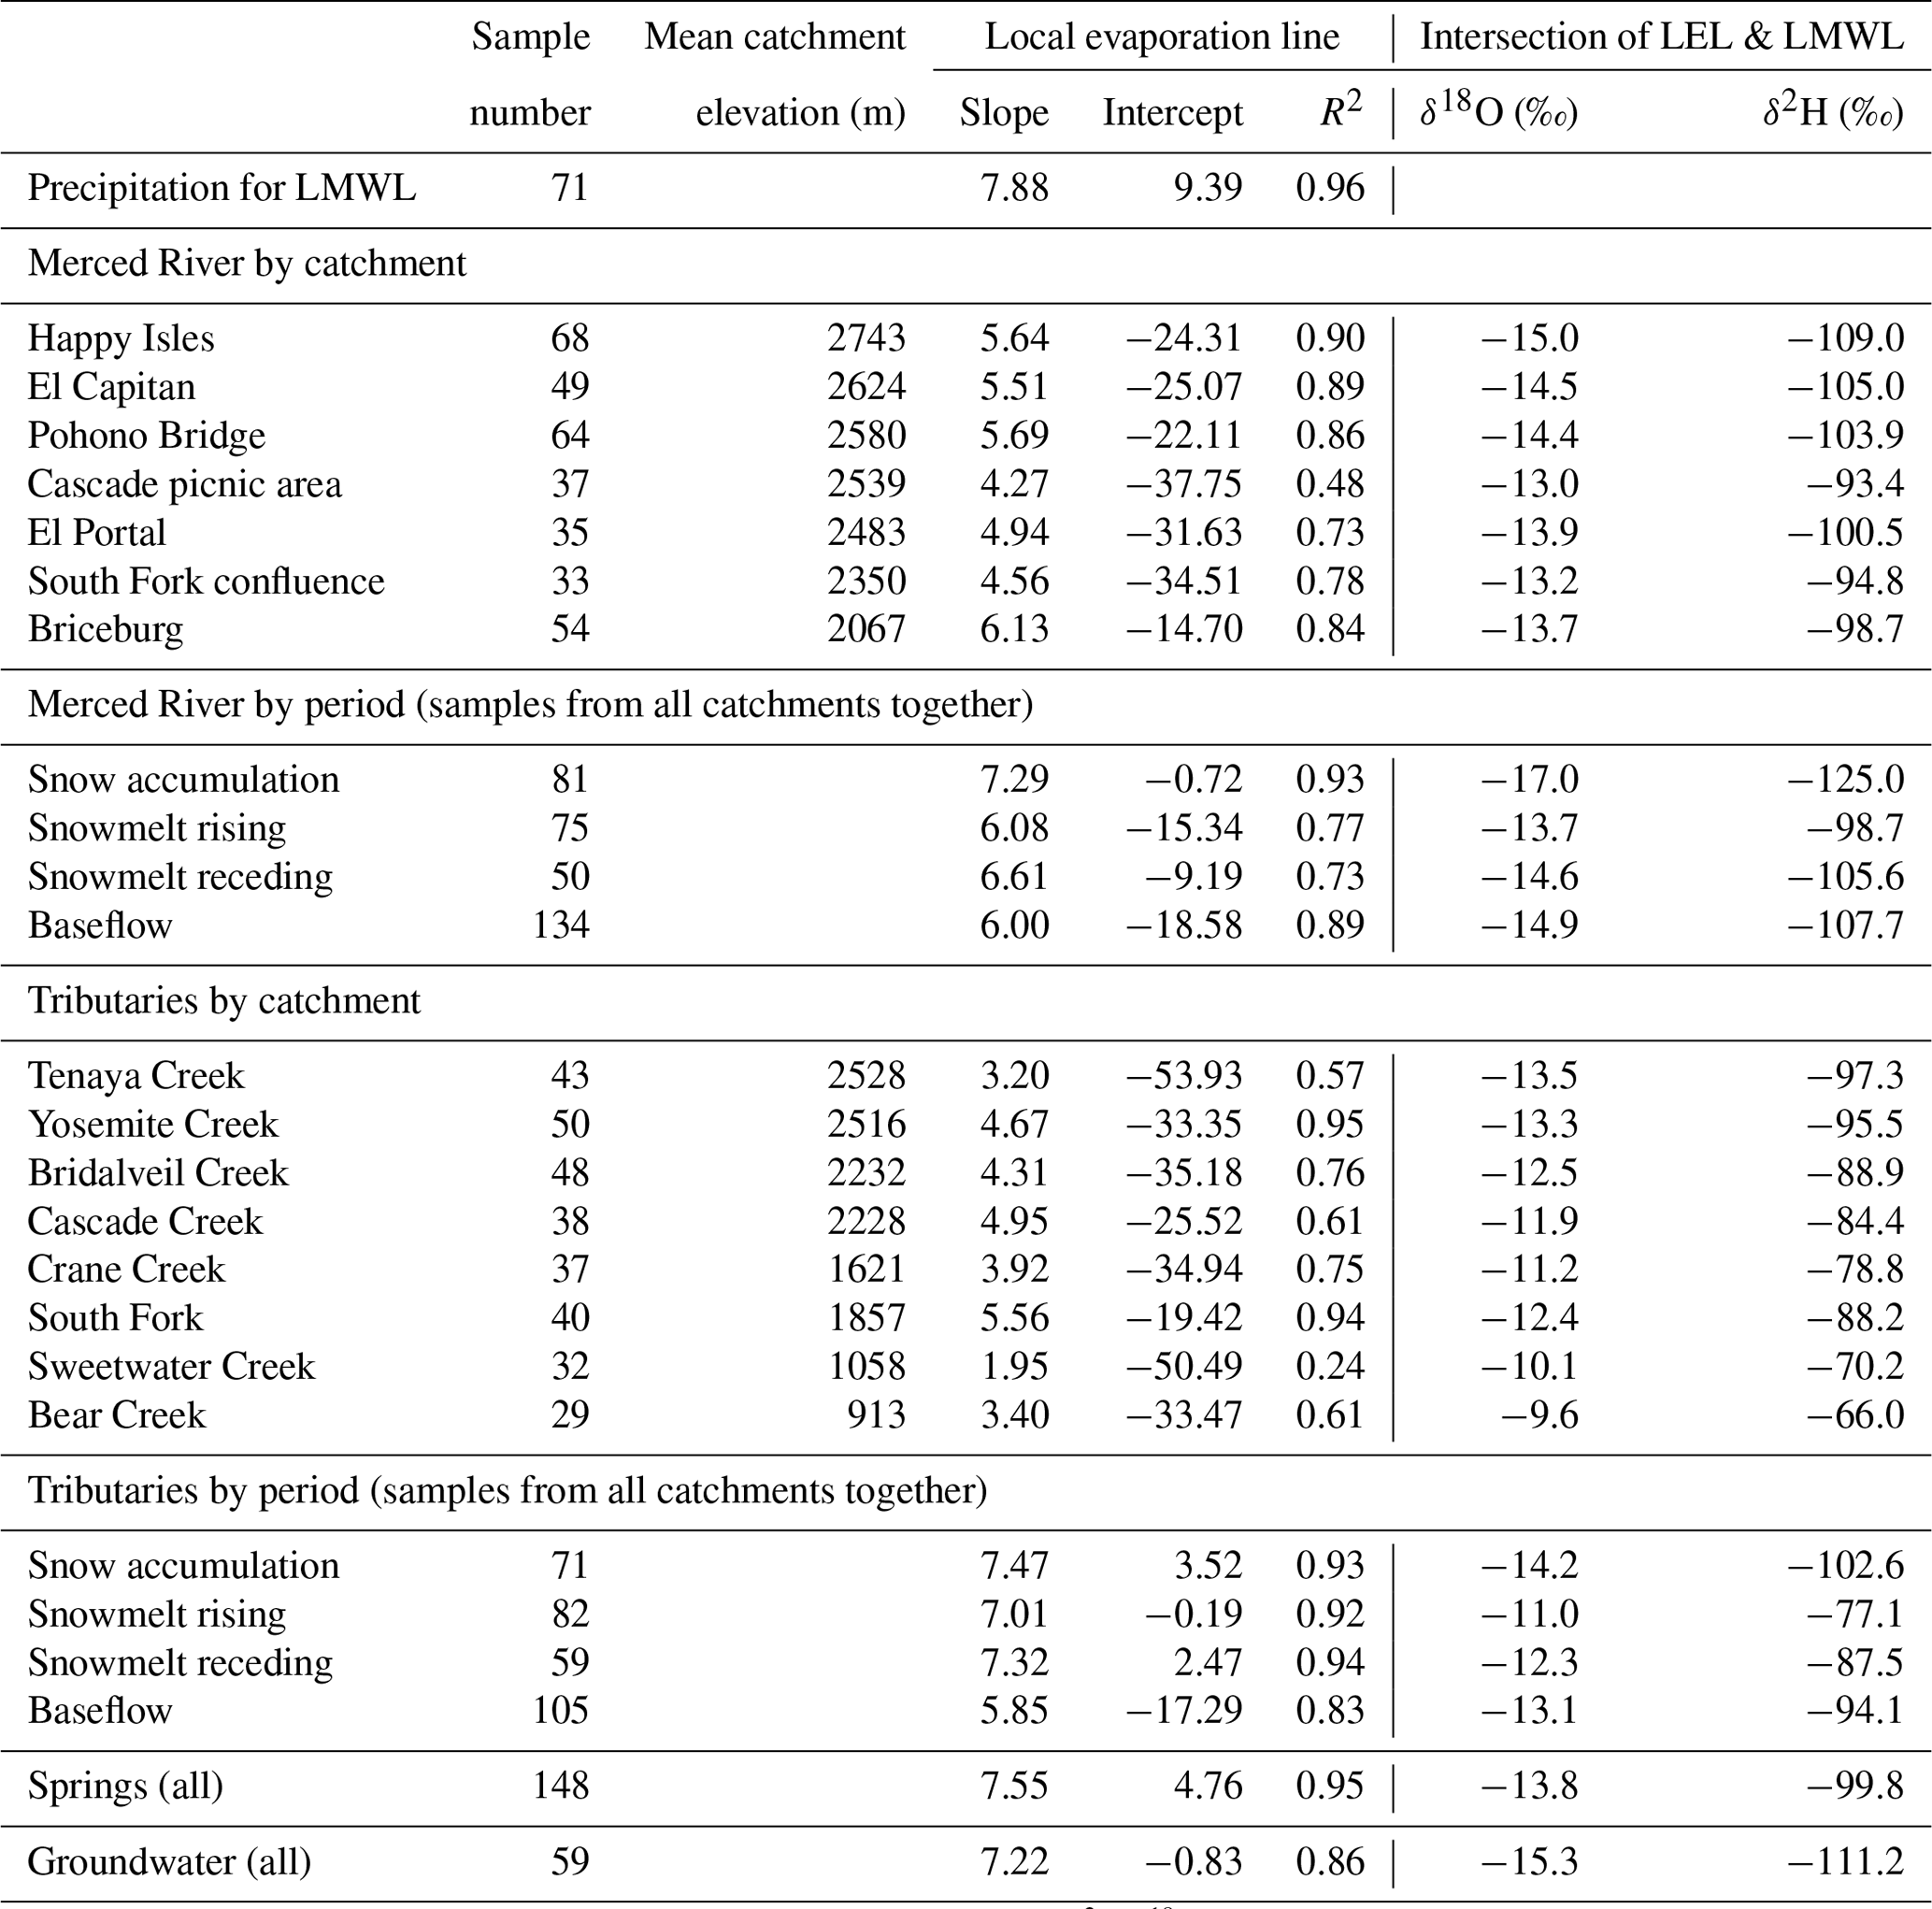
Note that the last four tributaries listed in Table 1 were not included here because their δ2H–δ18O relationship was not significant (p > 0.05) due to the lack of samples. Also, see text for discussion about the division of four periods for a water year. All R2 values are significant with p < 0.01. Both δ2H and δ18O values at the intersection of the LEL and LMWL were mathematically determined by finding the solution of simultaneous equations of the LEL and LMWL.
Almost all Merced River samples collected during the snow accumulation period are located right below the LMWL (Fig. 6b), showing a local evaporation line (LEL) with a slope of 7.29 and an intercept of −0.72 (n = 81, R2= 0.93) (Table 2). Merced River samples collected during the snowmelt rising period are scattered near the LMWL except for one outlier on the lower left of the LMWL (Fig. 6b), with a slope of 6.08 and an intercept of −15.34 (n = 75, R2= 0.77) for the LEL (Table 2). During the snowmelt receding period, most samples were below the LMWL (Fig. 6b), and the slope and intercept of the LEL were 6.61 and −9.19 (n = 50, R2= 0.73), respectively (Table 2). During the baseflow period, all samples other than a few were below the LMWL (Fig. 6b), and the slope and intercept of the LEL were 6.00 and −18.58 (n = 134, R2= 0.89), respectively (Table 2). The samples, highlighted in an orange rectangle in Fig. 6b, were further away from the LMWL and collected in the Merced River at Briceburg and the South Fork confluence during the baseflow period.
Compared to the Merced River, the result for tributaries by periods was somewhat different. Other than the baseflow period (particularly those circled by an orange oval), samples are scattered more closely around the LMWL during all periods (Fig. 6c). The slope of the LEL was greater than 7.0 and noticeably higher than that of the Merced River (Table 2). The intercept was also higher, ranging from −0.19 to 3.52, and R2 values were higher than 0.92. During the baseflow period, the slope and intercept were significantly lower, i.e., 5.85 and −17.29, respectively, with an R2 of 0.83, which was primarily attributed to samples collected at Yosemite Creek, Sweetwater Creek, and Bear Creek at extremely low flows (circled in Fig. 6c). It is the baseflow samples that caused the lower slopes for individual catchments rather than those during the other three periods (Table 2).
The δ2H–δ18O relation in groundwater and springs was closer to the LMWL than in stream water (Fig. 6d and Table 2). The slope and intercept of the evaporation lines were 7.22 and −0.83 for groundwater and 7.55 and 4.76 for spring water, respectively.
4.4 Variation in isotopic values in stream water, groundwater, and precipitation with elevation
Mean isotopic values of stream water from relatively small catchments (8–122 km2; including all those listed under tributaries in Table 1 except South Fork), groundwater, and rock glacier outflows were highly correlated with the mean elevations of their catchment areas (Fig. 7a and b). The slope and intercept were −0.0022 and −7.57 for δ18O (R2= 0.91, n = 16, p < 0.001), respectively, and −0.019 and −48.7 for δ2H (R2= 0.96, n = 16, p < 0.001). The Crane Flat and Hodgdon Meadow wells are located near the mid Merced River divide (inside and outside, respectively) and far away from major streams (Fig. 1). Groundwater in these wells was deemed to be derived from precipitation in the drainage area above each well. These drainage areas, along with the mean drainage elevations, were computed the same as for a stream sampling location using well locations as pour points. The result indicates that elevations vary narrowly from the well locations to the drainage summit at Crane Flat and Hodgdon Meadow, with a relief of only 33 and 429 m, respectively (Table 1). A similar analysis cannot be performed for the other groundwater wells due to the complex topography and their proximity to the Merced River, and thus samples from those wells were excluded in this analysis.
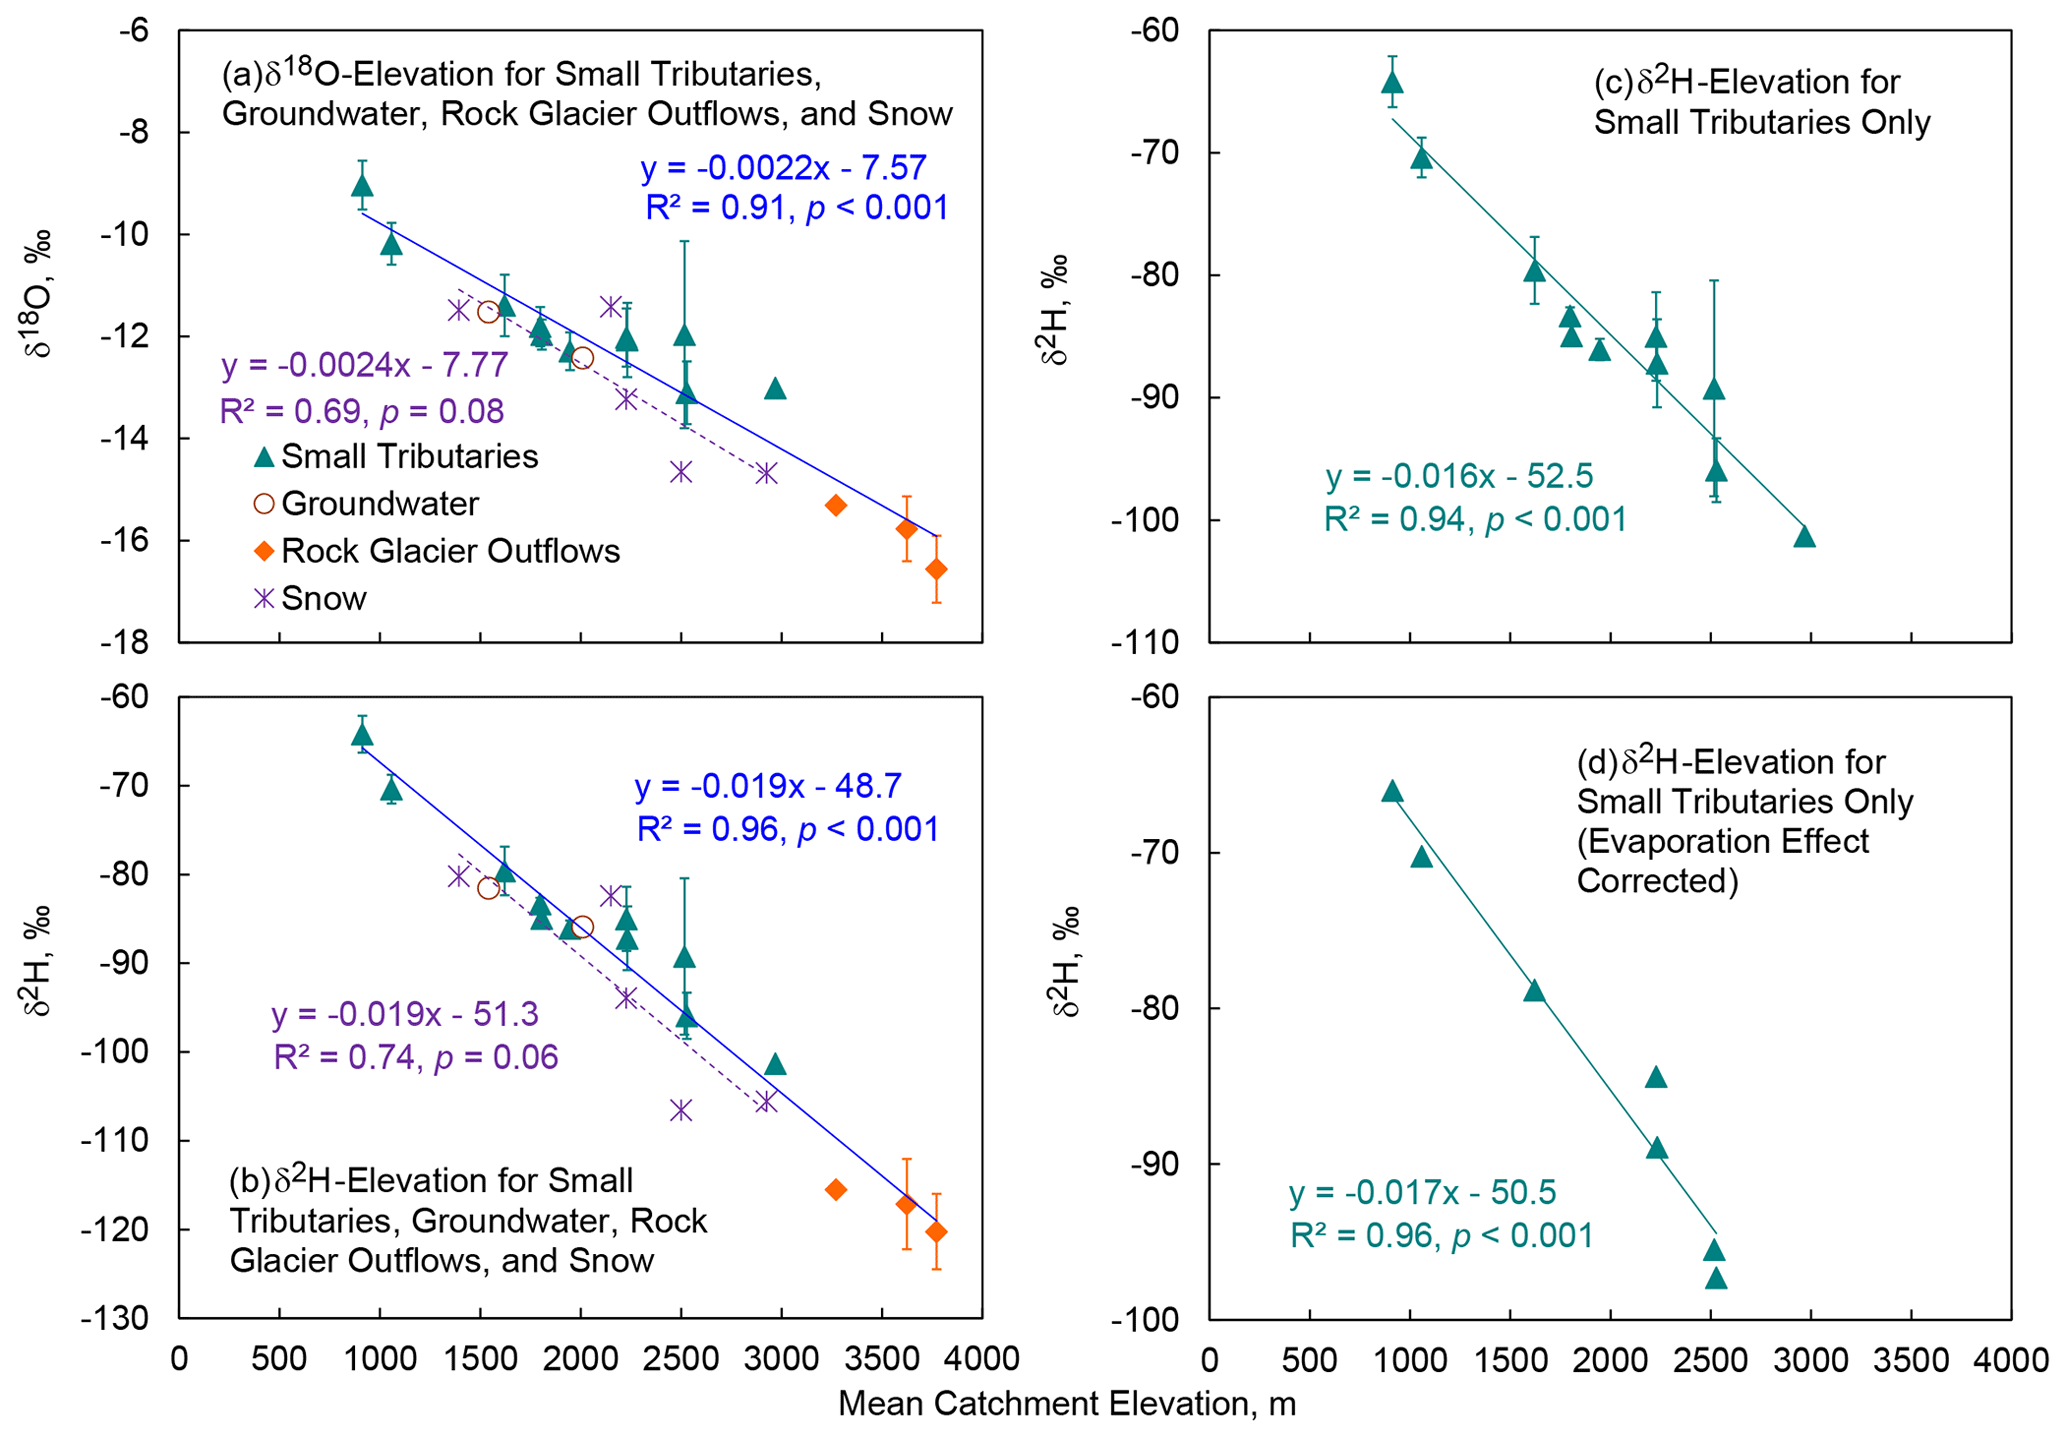
Figure 7Variation in isotopic composition with mean catchment elevations: (a) and (b) for δ18O and δ2H values, respectively, in small tributaries (catchment area < 122 km2), groundwater with estimated source water elevations (Crane Flat and Hodgdon Meadow), and rock glacier outflows, along with snow and rain samples (the solid blue line shows the linear trend for small tributaries, groundwater, and rock glacier outflows and the dashed purple line for snow and rain samples); (c) for δ2H values in small tributaries without groundwater and rock glacier outflows; and (d) for δ2H values in small tributaries with evaporation effect corrected by the local meteoric water line. The number of samples in (d) is less than in (c) due to the lack of samples to establish a significant relationship between δ2H and δ18O values for the last four tributaries listed in Table 1.
Variation in isotopic values in snow with sampling elevation was examined using mean isotopic values from four snowpits excavated along an elevation gradient and a rain gauge located in Yosemite Valley (Fig. 7a and b). The slope of the δ2H–elevation linear relationship was identical to that of small streams, groundwater, and rock glacier outflows, and the intercept was also very close (−51.3 versus −48.7), even though its R2 value was much lower (R2= 0.74, n = 5, p = 0.06).
An analysis was also conducted to exclude samples of two groundwater wells and three rock glacier outflows outside the mid Merced River catchment (Fig. 7c). The result indicated that the δ2H–elevation relationship did not change significantly, with a slope of −0.016 and an intercept of −52.5 (R2= 0.94, n = 11, p < 0.001).
To examine whether evaporation affected the isotope–elevation relationship, the mean isotopic values in stream water were corrected using both the LMWL and LEL (Table 2). Using the isotopic values at the intersection between the LMWL and LEL, the isotope–elevation relationship was still significant for small streams (R2= 0.96 for δ2H, n = 7, p < 0.001) and yielded a similar slope (−0.017) and intercept (−50.5) (Fig. 7d).
Seasonal variation in the δ2H–elevation relationship was examined using samples collected in small tributaries, groundwater, and rock glacier outflows during the four periods defined earlier (Fig. 8). The slopes and intercepts of the δ2H–elevation linear relationship varied over the periods but not remarkably. The slope varied between −0.015 and −0.021 and the intercept values between −40.3 and −55.0 for all these periods except the snow accumulation period and the snowmelt rising period in 2006. Samples were not collected in tributaries in spring and summer of 2006, and the samples collected in the snow accumulation period in 2006 did not cover a wide range of elevations. The slope and intercept did not appear to change significantly from the snowmelt rising period to the snowmelt receding period in 2007 and 2008. Merced River samples are also plotted independently in Fig. 8. It is apparent that Merced River samples collected over seasons followed closely the trend of small tributaries, groundwater, and rock glacier outflows.
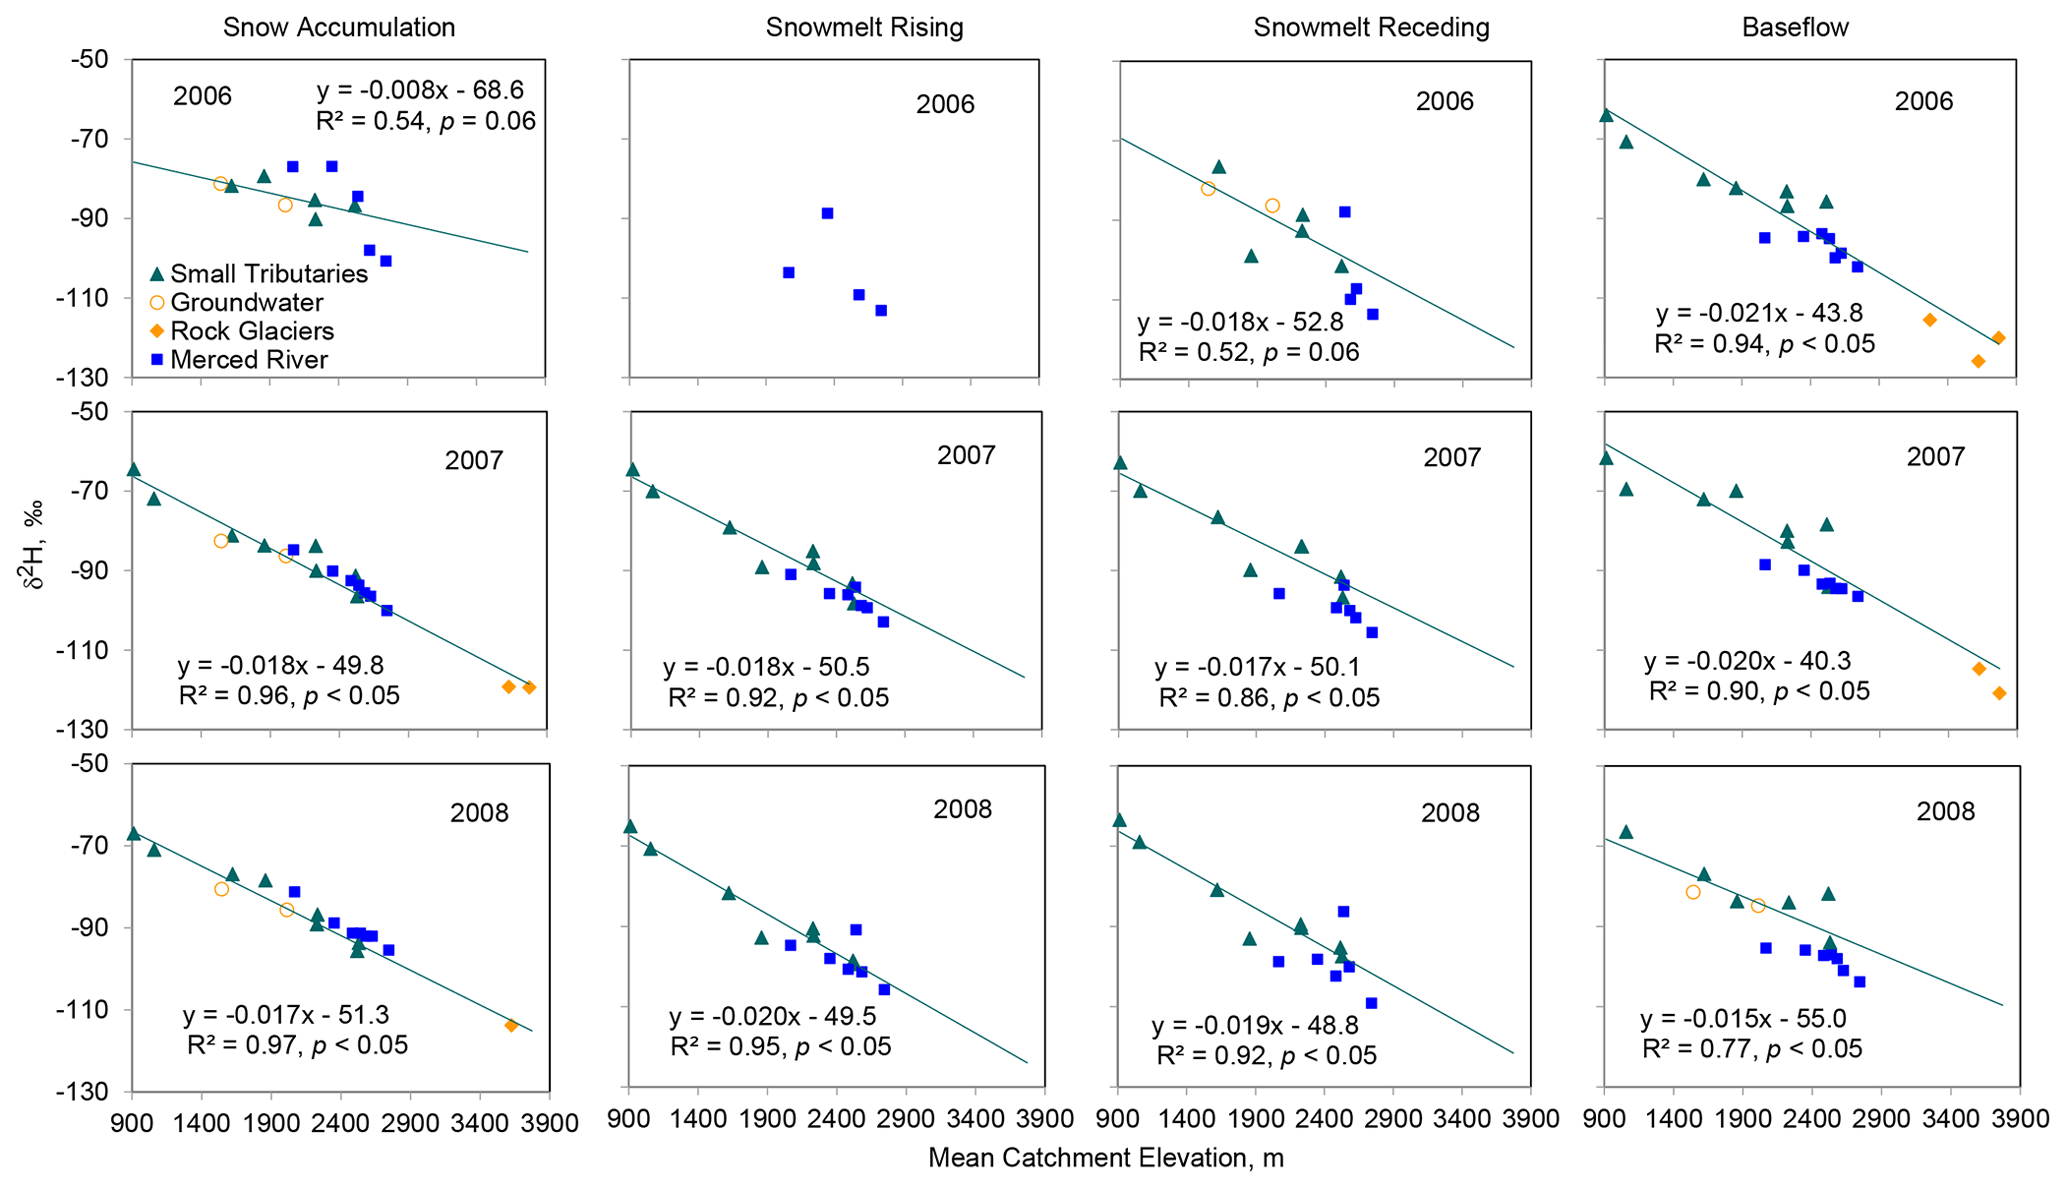
Figure 8Seasonal variation in the δ2H–elevation relationship in small tributaries, groundwater, and rock glacier outflows, with a linear trend (green). Samples from Merced River are also plotted but not included in establishing the trend line. Four periods are defined, the same as in Fig. 4. The number of samples for each analysis varies depending on the availability of samples. Note that no samples were available for tributaries, groundwater, and rock glacier outflows during the snowmelt rising period in 2006 due to the road blockage caused by a massive landslide.
5.1 Controls on isotopic composition in stream water and groundwater
5.1.1 Elevation effect
Elevation exerts a major control on the mean isotopic values in stream water at small catchments (including rock glacier outflows) and groundwater in the mid Merced River catchment (Fig. 7a and b), which is consistent with Jeelani et al. (2010). Unlike monsoon precipitation samples collected along an elevation gradient in India (Kumar et al., 2010), the slopes and intercepts of the correlations did not vary much over seasons and years with dramatically different hydrologic and climatic conditions (Fig. 8). The elevation gradient determined by those samples, e.g., −0.22 ‰ per 100 m for δ18O and −1.9 ‰ per 100 m for δ2H on average (Fig. 7a and b), essentially represents a lapse rate of isotopic composition in meteoric water in the mid Merced River catchment. This lapse rate is corroborated with the lapse rate for temperature and caused by Rayleigh distillation, as the heavier isotopes are concentrated in the precipitation, resulting in clouds progressively becoming isotopically lighter when ascending to higher elevations or moving further away from the ocean (Poage and Chamberlain, 2001; Clark and Fritz, 1997). The mean lapse rate of this study is reasonably close to that obtained elsewhere around the world, which averaged −0.28 ‰ per 100 m for δ18O, as reviewed by Poage and Chamberlain (2001). The lapse rate of δ18O is identical to that of precipitation in a south Ecuadorian montane cloud forest catchment (San Francisco catchment, 1800–2800 m) (Windhorst et al., 2013) and almost the same as that of precipitation in the upper Heihe River in northwestern China (1674–5103 m), where a gradient of −0.18 ‰ per 100 m was obtained (N. Wang et al., 2009). It is also very close to the gradient in northern California, where δ2H values in groundwater changed from −40 ‰ to −120 ‰ from the coast to the Sierra Nevada crest with a relief of 4000 m and a lapse rate of −2.0 ‰ per 100 m (Ingraham and Taylor, 1991). Since the isotopic lapse rate did not change longitudinally in Sierra Nevada (Friedman and Smith, 1970), this lapse rate may be applicable to the western slope of the entire Sierra Nevada.
However, this lapse rate is significantly lower than that (−4 ‰ per 100 m for δ2H) reported earlier by Friedman and Smith (1970) using snow-core samples collected around 1 April 1969 in the western slope of Sierra Nevada. The lapse rate of Friedman and Smith (1970) also does not agree with the result of our snow samples (Fig. 7a and b). The discrepancy in the results between our snow samples and those of Friedman and Smith (1970) is primarily caused by significant temporal variability in the isotopic composition of snowpack over seasons and years and uneven temporal variation over elevation bands, as found by Jodar et al. (2016) for the European Alps. For example, the δ2H value in a snowpit at Gin Flat (elevation = 2150 m) was −103 ‰ as reported by Friedman and Smith (1970) but −81.5 ‰ in this study, with a difference of 21.5 ‰. The δ2H value was −139 ‰ at Big Whitney Meadow (elevation = 2,970 m) in 1969, whereas it was −105.5 ‰ at similar elevation (2926 m) at Dana Lake in 2006, with an even greater difference than at Gin Flat at 33.5 ‰. It was very wet in 1969, with an annual precipitation of 1649 mm compared to 1247 mm in 2006 in Yosemite Valley. Information on snowfall amount or snow depth in 1969 was not available, but heavier storms usually result in lighter stable isotopes in snow (Ingraham, 1998). In addition, snow is usually subject to isotopic fractionation if sublimation and melting occur (Taylor et al., 2001; Earman et al., 2006; Frisbee et al., 2010). Dettinger et al. (2004) demonstrated that melting and sublimation occurred in the snowpack in Sierra Nevada before 1 April. It is not possible to evaluate how significant isotopic fractionation has affected the isotopic composition in the snow samples collected by Friedman and Smith (1970), as δ18O was not analyzed in their study. However, the isotopic composition in the snow samples of this study, which was mostly collected at the maximum accumulation, was very close to GMWL reported by Craig (1961) (Fig. 6a), indicating that the isotopic fractionation effect due to sublimation was not evident in our snow samples.
Using samples from precipitation, the lapse rate may vary significantly over years and seasons and is not always reliable (Hemmerle et al., 2021). Gamboa et al. (2022) demonstrated that the lapse rate of δ2H varied from −1.4 ‰ to −3.5 ‰ per 100 m using precipitation samples collected during intermittent periods from 1984 to 2017 in the Atacama Desert of northern Chile. From the same study, the lapse rate of δ2H was −1.6 ‰ per 100 m using groundwater samples and the mean sub-basin elevations, which is very close to ours. Furthermore, the lapse rate may vary dramatically with different climates, particularly when precipitation samples are used. For example, the lapse rate of δ2H was −0.8 ‰ per 100 m (summer) and −0.9 ‰ per 100 m (winter) in the arid and semi-arid Tucson Basin in the southern Basin and Range Province of Arizona and New Mexico (Eastoe and Wright, 2019), −0.7 ‰ per 100 m in the humid Great Lakes region in the eastern Democratic Republic of the Congo (Balagizi et al., 2018), and −3.4 ‰ per 100 m in the Juncal River basin of central Chile (2200–3000 m) (Ohlanders et al., 2013).
5.1.2 Evaporation effect
All samples of the Merced River, tributaries, groundwater, and spring water were very close to the LMWL in the δ2H–δ18O bivariate plots, except for some that were collected during the baseflow period (Fig. 6). The slopes of the local evaporation lines in groundwater and spring water were only slightly lower than the LMWL slope (Table 2), indicating that evaporation during groundwater recharge was not very strong. However, the slopes of the LEL in the Merced River and tributaries were noticeably lower than the slope of the LMWL (Table 2), showing an apparent evaporation effect, consistent with Jeelani et al. (2013) and Reckerth et al. (2017).
Both the slope and R2 values of the LEL were generally lower in tributaries than in the Merced River except for R2 values at Yosemite Creek and the South Fork, when LELs were constructed using data from individual catchments (Table 2). The lower slopes in tributaries were primarily caused by samples collected during low flows in later summer and fall, particularly those with waterfalls such as Yosemite Creek and wider but shallower channels such as South Fork (Fig. 6c). When all samples were grouped into four periods, the slopes and R2 values of the LEL in tributaries became much higher and closer to the LMWL than those in the Merced River during all periods other than the baseflow period (Table 2). Apparently, evaporation was stronger in the Merced River than in the tributaries during all of the periods other than the baseflow period. During the baseflow period, stronger evaporation occurred in tributaries, particularly in Yosemite Creek (Fig. 6c). However, the isotope–elevation relation established using small tributaries and groundwater was not strongly affected by evaporation, and the isotopic composition in the Merced River was still primarily controlled by source waters from various elevations even during the baseflow period (Fig. 8).
5.1.3 Snowmelt and isotopic fractionation effects
The temporal variability in the isotopic values of snow was much higher than that of stream water (Figs. 3 and 4; Table 1). The isotopic composition in stream water over 3 water years with very different precipitation amounts has attenuated much of the temporal variability in stable isotopes in precipitation, consistent with the observations of Kendall and Coplen (2001), Dutton et al. (2005), Jeelani et al. (2013), and Reckerth et al. (2017). The variability attenuation primarily explains why the isotope–elevation relation did not vary dramatically when stream samples were used (Fig. 8). Compared to the variability in isotopic composition of groundwater and spring water, however, the isotopic composition in stream water still varied significantly over seasons (with respect to 1σ values in Table 1). During snowmelt, δ2H values in stream water at Happy Isles, Pohono Bridge, and Briceburg were much lower than during the other periods (Fig. 4). This result was apparently caused by the snowmelt contribution to streams from melting snowpack, as supported by Shaw et al. (2014) and Liu et al. (2017). However, the seasonality did not significantly change the slopes of the δ2H–elevation relationship over seasons (Fig. 8). Also, δ2H values in stream water were consistently distinct from 2006 to 2008 over sampling locations at Happy Isles, Pohono Bridge, and Briceburg except for a few samples that were affected by rainfall events (Fig. 4). It is suggested that even during snowmelt, elevation still exerts a major control on the isotopic composition in stream water in the mid Merced River catchment.
Studies have shown that snowmelt becomes isotopically enriched over time due to isotopic fractionation between ice and liquid water (e.g., Taylor et al., 2001; Earman et al., 2006). As a result, isotopic values in snowmelt from a snowmelt lysimeter were significantly lower than those in the bulk snowpack before the peak snowmelt and higher after that, resulting in a monotonic curve with isotopic values gradually increasing over time in snowmelt and stream water (Liu et al., 2004). The variation in δ2H values during the snowmelt period in the Merced River followed a parabolic curve (the curve is not shown, but the trend can be seen in Fig. 4) instead of a monotonic one. In addition, the difference between the snowmelt rising and receding periods was not evident for the δ2H–flow relationship at the higher elevations, δ2H–δ18O relationship, and δ2H–elevation relationship (Figs. 5, 6, and 8). These results suggest that isotopic fractionation between ice and liquid water in snowmelt did not appear to affect much the isotopic signature of stream water at the catchment scales involved in this study.
5.2 Applications and implications
The lapse rate of stable isotopes (or the isotope–elevation relation) in meteoric water acquired in this study would be useful for paleoelevation studies, as demonstrated for Sierra Nevada of California by Mulch et al. (2006) and the Himalayas by Hren et al. (2009). This information is also very useful for understanding source waters (e.g., Jean-Baptiste et al., 2020; Jeelani et al., 2013) and the sensitivity of streamflow in response to climate change. For the latter, for example, streamflow during the baseflow period at lower elevations (e.g., Briceburg of this study) is more strongly affected by rainfall and thus more sensitive to changes in the snow–rain ratio in the future, as alluded by Fig. 5 and the relevant text in Sect. 4.2. In the following section are two additional examples of its applications in watershed hydrology and hydrometeorology.
5.2.1 Building conceptual understanding on hydrometeorologic processes
Based on the discussion in Sect. 5.1, a catchment characteristic isotopic value (CCIV) of source waters – isotopic composition at the mean catchment elevation that represents source waters from the entire catchment – can be defined by the isotope–elevation relation for all sub-catchments in the mid Merced River catchment (Fig. 9). This characteristic value was simply calculated by the isotopic value–elevation function using the arithmetic mean of catchment elevations. In combination with the local meteoric water line, CCIV helps elucidate hydrometeorologic processes over seasons. In the Merced River at Happy Isles, for example, the δ2H value was below CCIV starting on 30 March 2006 and near CCIV again on 7 August 2006 after a trough-shape turn (Fig. 9a). These two dates approximately match the start and end of the snowmelt season for 2006 based on streamflow. The start date was also very close to the maximum snow accumulation date (Figs. 2b and 9a). The end date was about 4 weeks later than the snow depletion date at Tioga Pass, which is consistent with the findings of Rice et al. (2011) that snow at the observation sites melted out several weeks before the catchment itself was free of snow. Therefore, the end date also appears to match the end of snowmelt. The snowmelt duration determined this way in 2007 and 2008 also agrees reasonably well with that determined by streamflow. Similarly, the results from Pohono Bridge and Briceburg (not shown) are consistent with Happy Isles. The intersection of the CCIV line and the isotopic time series curve marks reasonably well the snowmelt duration. Since isotopic values are highly correlated with streamflows (Fig. 5), the lowest isotopic value during the snowmelt period can additionally be used to infer the relative magnitude of snowmelt event. The lower the isotopic value at the bottom of the trough, the higher the magnitude of the snowmelt event. This approach seems to be a powerful tool for determining the duration and relative magnitude of snowmelt events for ungauged basins without streamflow measurements.
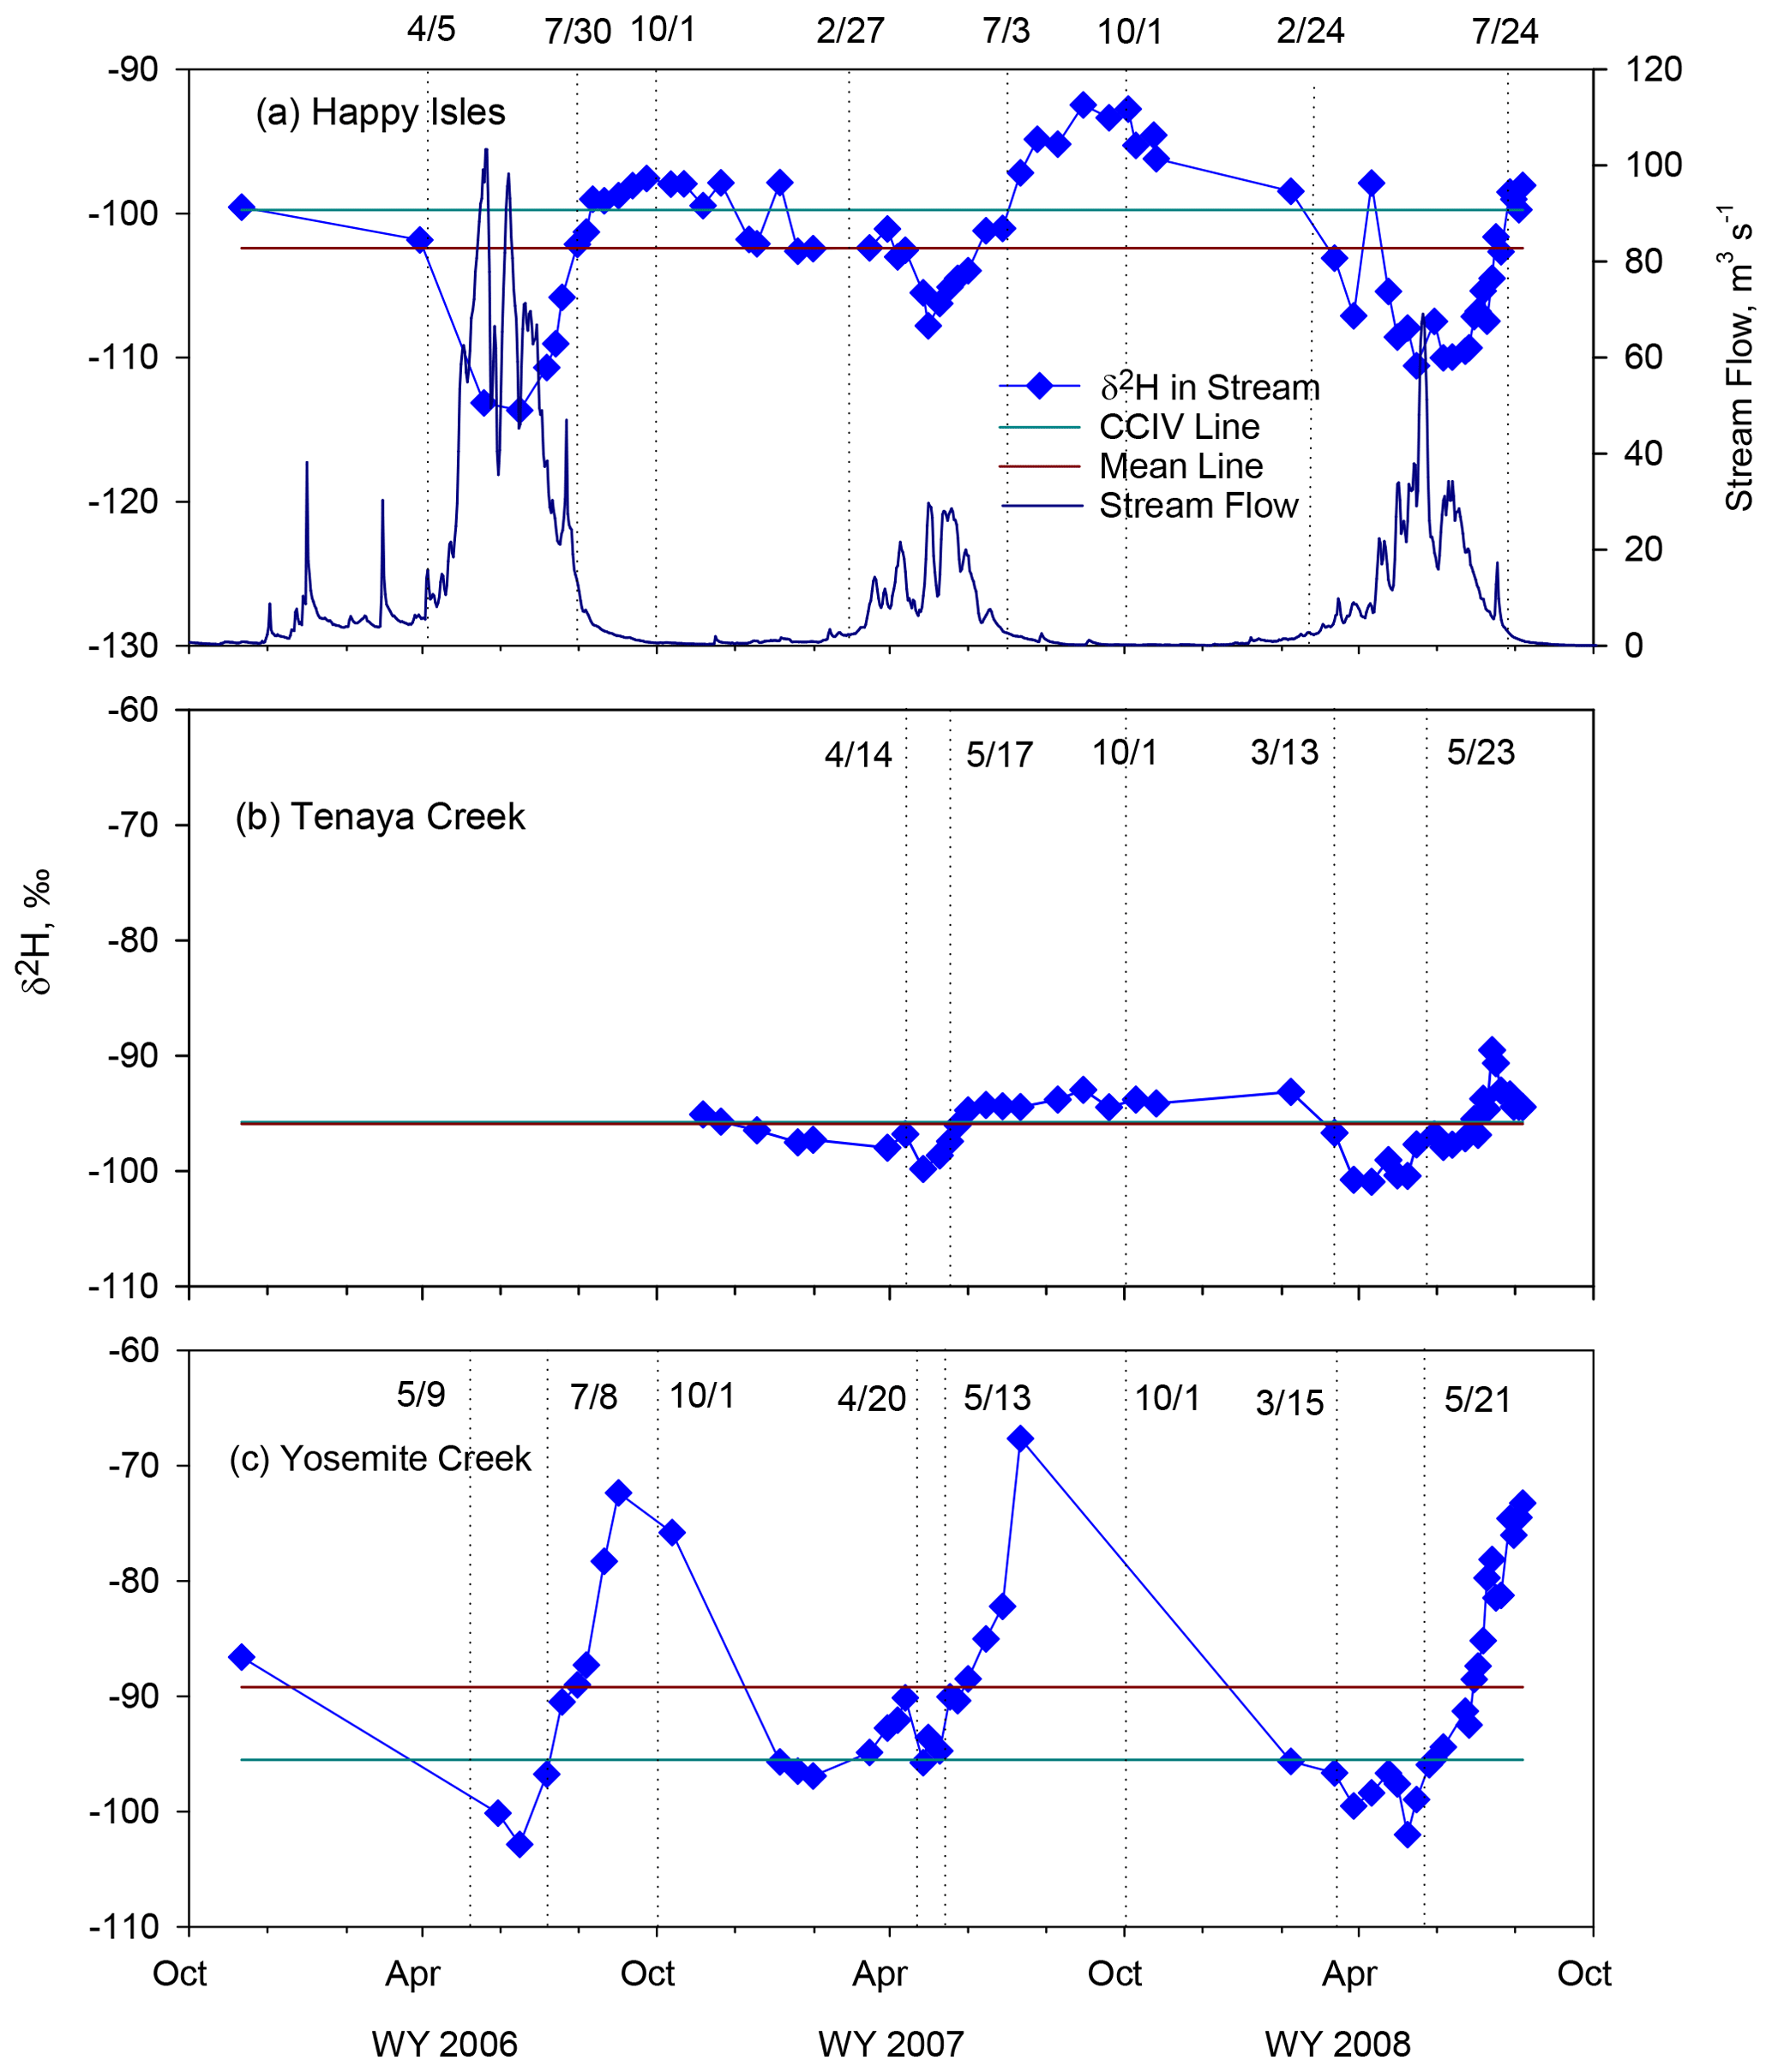
Figure 9δ2H values in stream water in (a) Merced River at Happy Isles, with streamflow, (b) Tenaya Creek, and (c) Yosemite Creek, along with the catchment characteristic isotopic value (CCIV) of δ2H and a line determined by the mean δ2H value in samples. Dates in (a) mark the start and end of the snowmelt season determined by hydrography at Happy Isles and 1 October; dates in (b) and (c) mark the start and end of the snowmelt season using the intersections of the time series curve and CCIV. Note that the mean and CCIV lines overlap in (b).
In the Merced River at Happy Isles, δ2H values were above the CCIV line during the baseflow periods and below the line during the snow accumulation periods (Fig. 9a), reflecting the shift of source water elevations, evaporation, and occasional rainfall effects, as discussed earlier. The local meteoric water line and evaporation line of groundwater could be used to assist in differentiating the dominant processes during these periods. For example, δ2H values were 5 ‰–8 ‰ more enriched during the baseflow period in 2007 than in 2006 (Fig. 9a). The enrichment for these samples is deemed to be primarily caused by evaporation rather than by a shift in source water elevation. These samples collected in 2007 are located below and further to the right of the LMWL and LEL of groundwater than the samples collected in 2006 (Fig. 10a), indicating a stronger evaporation effect. Although the shift in source water elevation and evaporation cannot be quantitatively determined, the CCIV line helps build a conceptual understanding of hydrometeorologic processes.
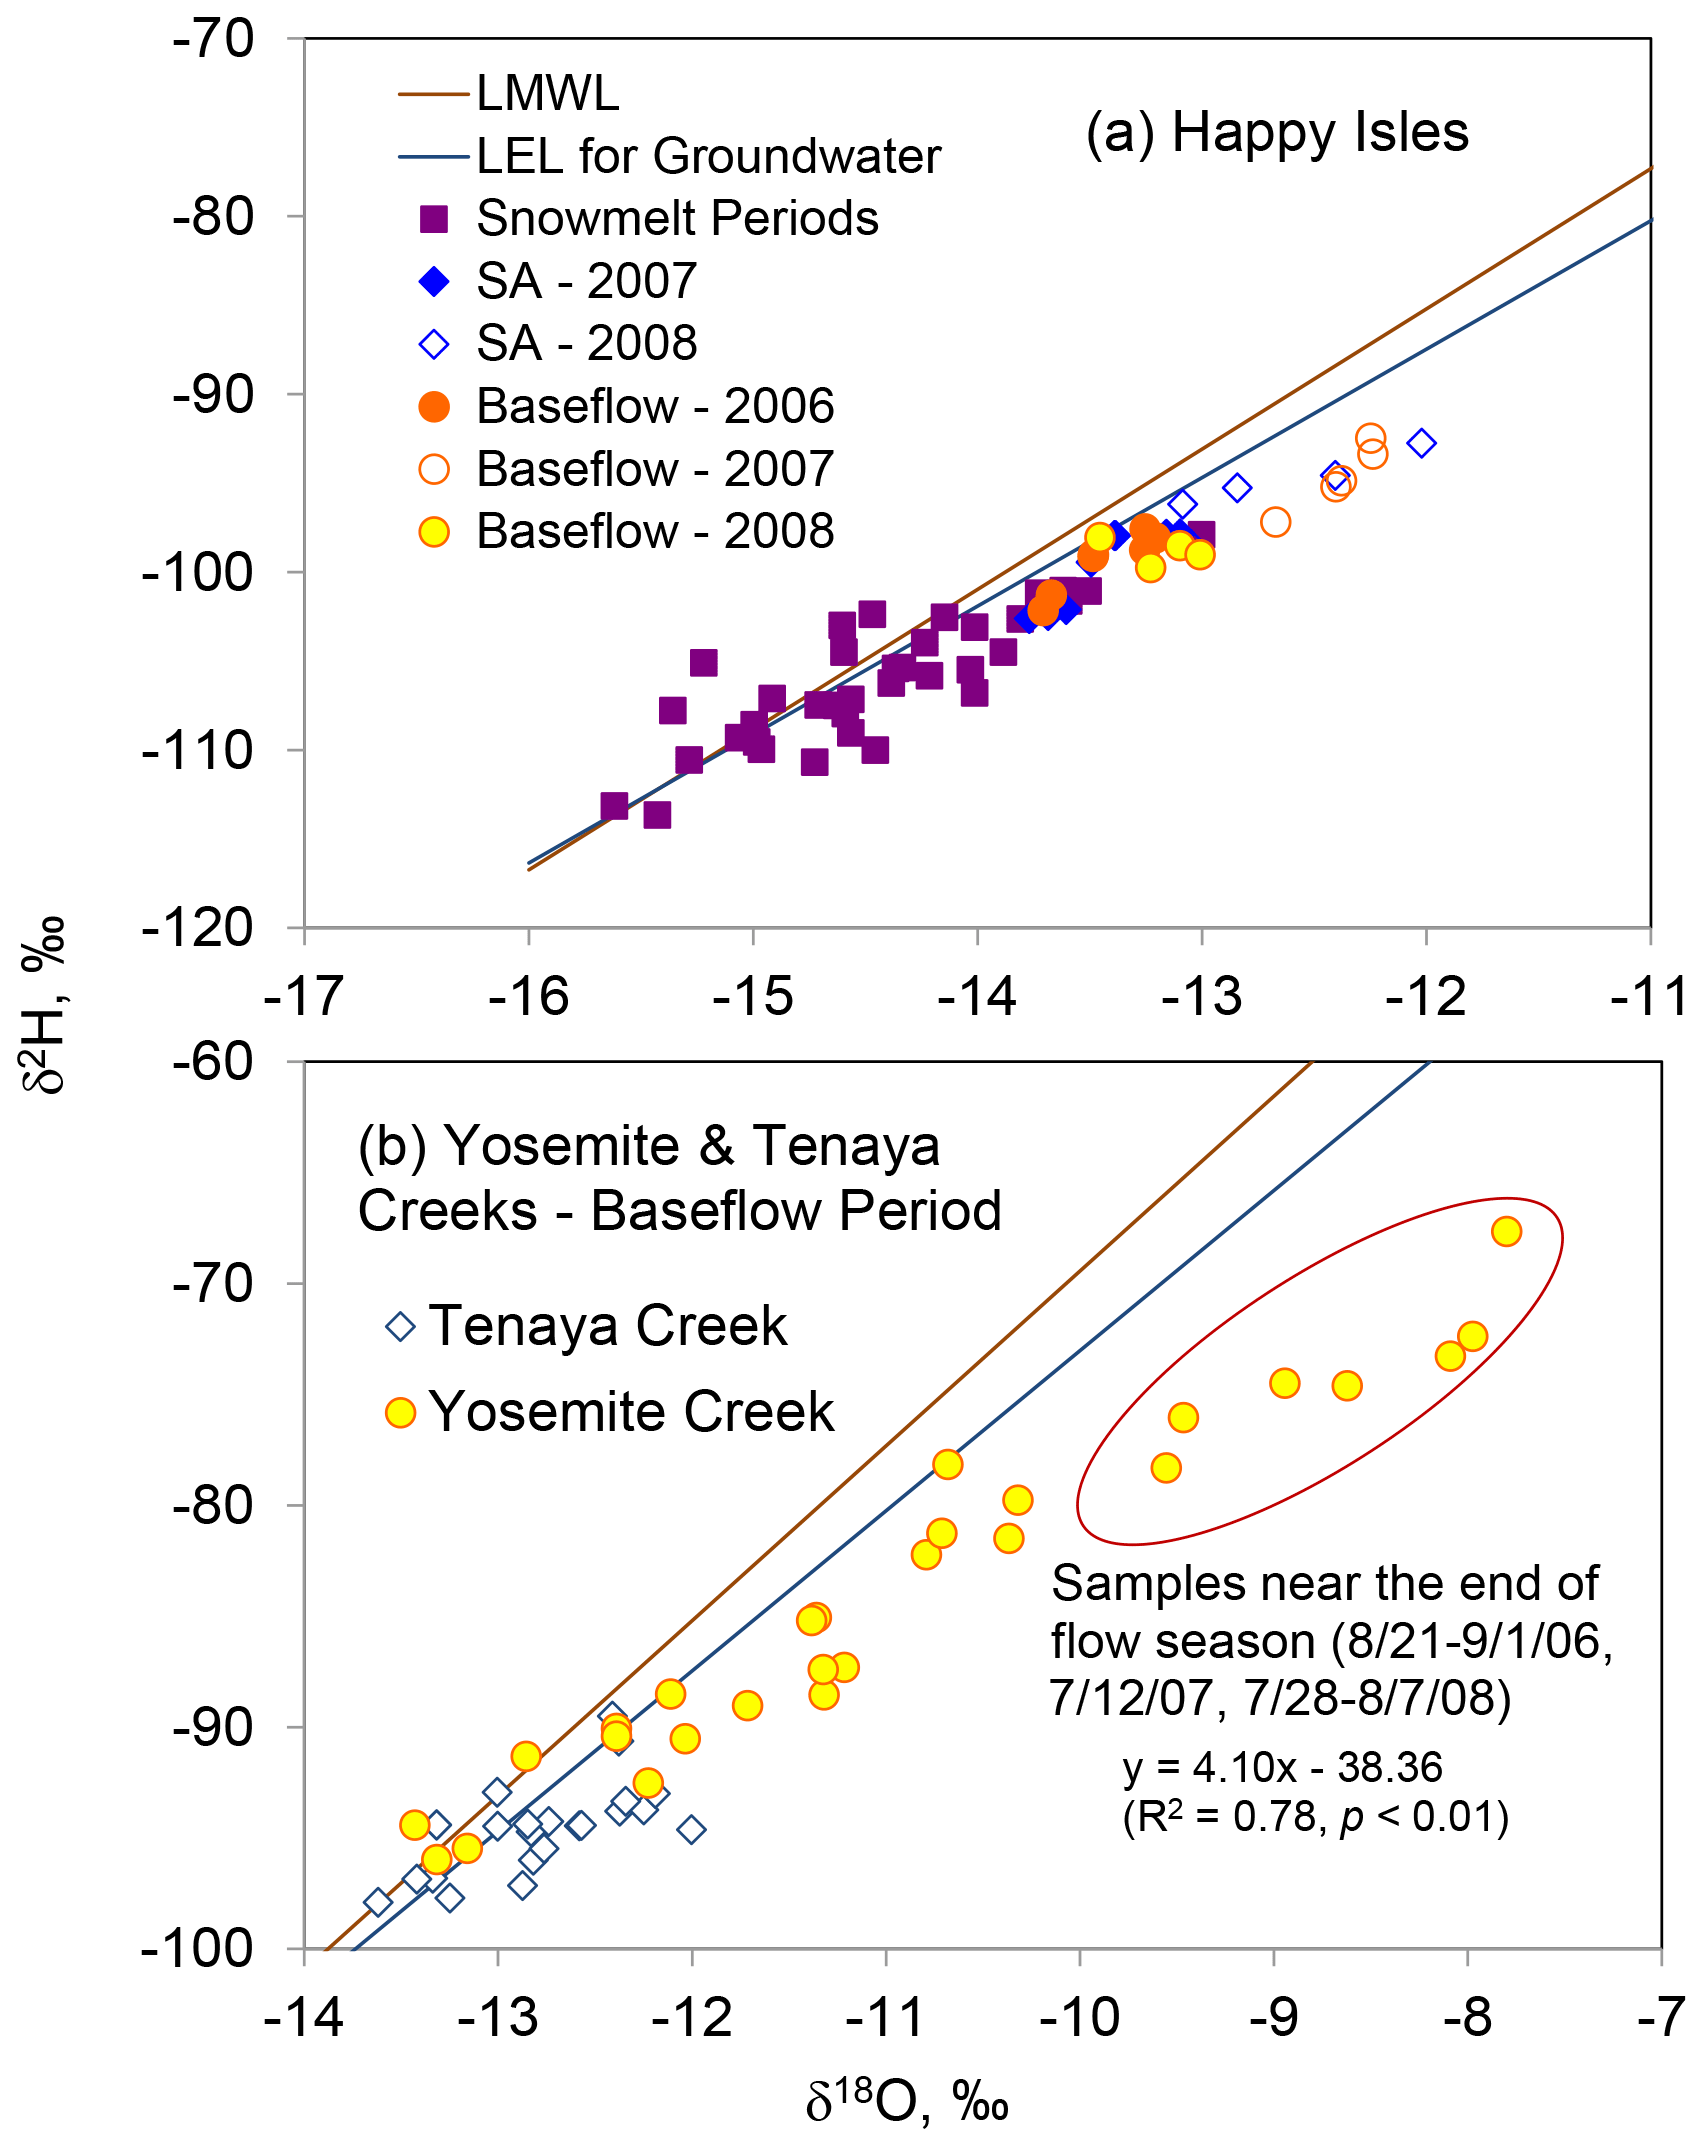
Figure 10Scatter plot of δ2H vs. δ18O for (a) Merced River at Happy Isles during different periods and (b) comparison between Tenaya Creek and Yosemite Creek during the baseflow period. The local meteoric water line (LMWL) and evaporation line (LEL) of groundwater are also shown as references. Highlighted by a red oval are samples collected in Yosemite Creek near the end of flow seasons from 2006 to 2008, along with a linear regression equation. Samples collected in Tenaya Creek near the end of flow seasons at Yosemite Creek did not have a significant relationship (R2= 0.09, p = 0.47) between δ2H and δ18O.
Comparing the temporal variation in δ2H values relative to the CCIV line between Yosemite Creek and Tenaya Creek, two ungauged streams, reveals more interesting results (Fig. 9b and c). The two adjacent basins share many similarities, e.g., basin area, elevation ranges, and mean basin elevations (Table 1 and Fig. 1), except for Yosemite Creek terminating with two cascading waterfalls (739 m high) in Yosemite Valley. Indeed, the lowest δ2H values were close and occurred at about the same time, indicating that peak snowmelt occurred with similar magnitudes at about the same time in these catchments. The dates when the CCIV line and time series curve intersected were similar, suggesting that the duration of snowmelt events appears to be close as well. However, the variation in δ2H values relative to the CCIV line was very different, with most samples, particularly those collected in the baseflow periods, far above the line in Yosemite Creek (Fig. 9b and c). Compared to Tenaya Creek, the samples collected near the end of flow seasons from 2006 to 2008 in Yosemite Creek were plotted far below and further to the right of the LMWL and LEL of groundwater, with a slope of 4.10 (R2= 0.76, p < 0.01) (Fig. 10b). The samples collected at Tenaya Creek during the same periods did not have a significant relationship for δ2H-δ18O, most likely due to relatively small changes among samples compared with the analytical accuracy, particularly of δ18O. Nevertheless, this result indicates that evaporation was much stronger in Yosemite Creek than in Tenaya Creek, and the shifting of the source water toward lower elevations was not the main reason. It is suggested that Yosemite Creek is much more sensitive to climate warming than Tenaya Creek. Flow in Yosemite Creek was intermittent in drier years (e.g., it dried up starting mid-July in 2007). Without even considering any effect of other factors (e.g., shift in snow–rain ratio and the earlier onset of snowmelt), an increase in air temperature alone would increase evaporation, reduce flow, and further shorten the duration of flow in Yosemite Creek. This trend is certainly not good news for Yosemite National Park tourists, as Yosemite Falls are one of the most attractive features in the park.
One would argue that a simple horizontal line using the arithmetic mean isotopic value from samples collected in the same catchment could serve the same purpose as the CCIV line. The mean line could work if the number of samples was large enough and evaporation was known to be neglectable a priori, such as at Tenaya Creek (Fig. 9b). However, it would not work for catchments with strong evaporation such as Yosemite Creek. Since the arithmetic mean line is about 5 ‰ above the CCIV line in Yosemite Creek (Fig. 9c), the duration and magnitude of snowmelt events will be very exaggerated and the evaporation effect will be greatly understated.
Based on the above analysis, a guideline is developed to identify hydrometeorologic processes using the time series of stable isotopes and the CCIV line for the mid Merced River catchment, which we think is applicable to other snowmelt-fed catchments. If isotopic values in stream water are on or near the CCIV line, it indicates that the source waters of streamflow are likely from all elevations, with an approximately equal discharge rate from higher and lower elevations. If the isotopic values are far below the line, stream water during the period is dominated by source waters from snowmelt and perhaps from higher elevations as well. If the isotopic values are far above the line, stream water most likely experiences strong evaporation or a shift in source waters to lower elevations.
5.2.2 Determining mean elevations of source waters for springs and groundwater
Information on recharge areas of springs and groundwater is paramount for the protection of their quantity and quality (e.g., Yanggen and Born, 1990) and for the assessment of climate change effects (Taylor et al., 2013) but usually remains unknown in most catchments (e.g., Chen et al., 2004) or a challenge (Koeniger et al., 2017). Using the isotope–elevation relation (Fig. 7), the mean elevations of source waters (recharges) were calculated for springs and groundwater in the mid Merced River catchment (Fig. 11) following the same approach as Jeelani et al. (2010). For example, the mean source water elevation for Fern Spring was 2035 m based on its mean δ2H values in Table 1 and the equation shown in Fig. 7b. This calculation was verified by a 30 m DEM using a GIS. The geographic location of Fern Spring was used as a pour point to delineate a drainage area following the same procedure as for groundwater at Hodgdon Meadow and Crane Flat. The mean catchment elevation determined with DEM is 2108 m for Fern Spring (its catchment ranging in elevation from 1199 to 2277 m). The difference in the mean catchment elevation between the two methods is only 73 m, which is less than the 1σ value determined by the isotope–elevation relation (Fig. 11). The mean source water elevation for the drinking fountain, which was calculated to be 1014 m by the isotopic approach, can also be verified anecdotally. The drinking fountain (372 m) is located between Sweetwater Creek and Bear Creek in the low mountain areas (Fig. 1). The mean drainage elevation determined by DEM is 1058 m for Sweetwater Creek and 913 m for Bear Creek, which are slightly higher and lower, respectively, than the mean source water elevation of the drinking fountain determined by the isotope method. These results demonstrate the reliability of the isotopic method and further validate the isotope–elevation relationship established using small streams, rock glacier outflows, and groundwater, as these sites were not included in the analysis of the isotope–elevation relationship.
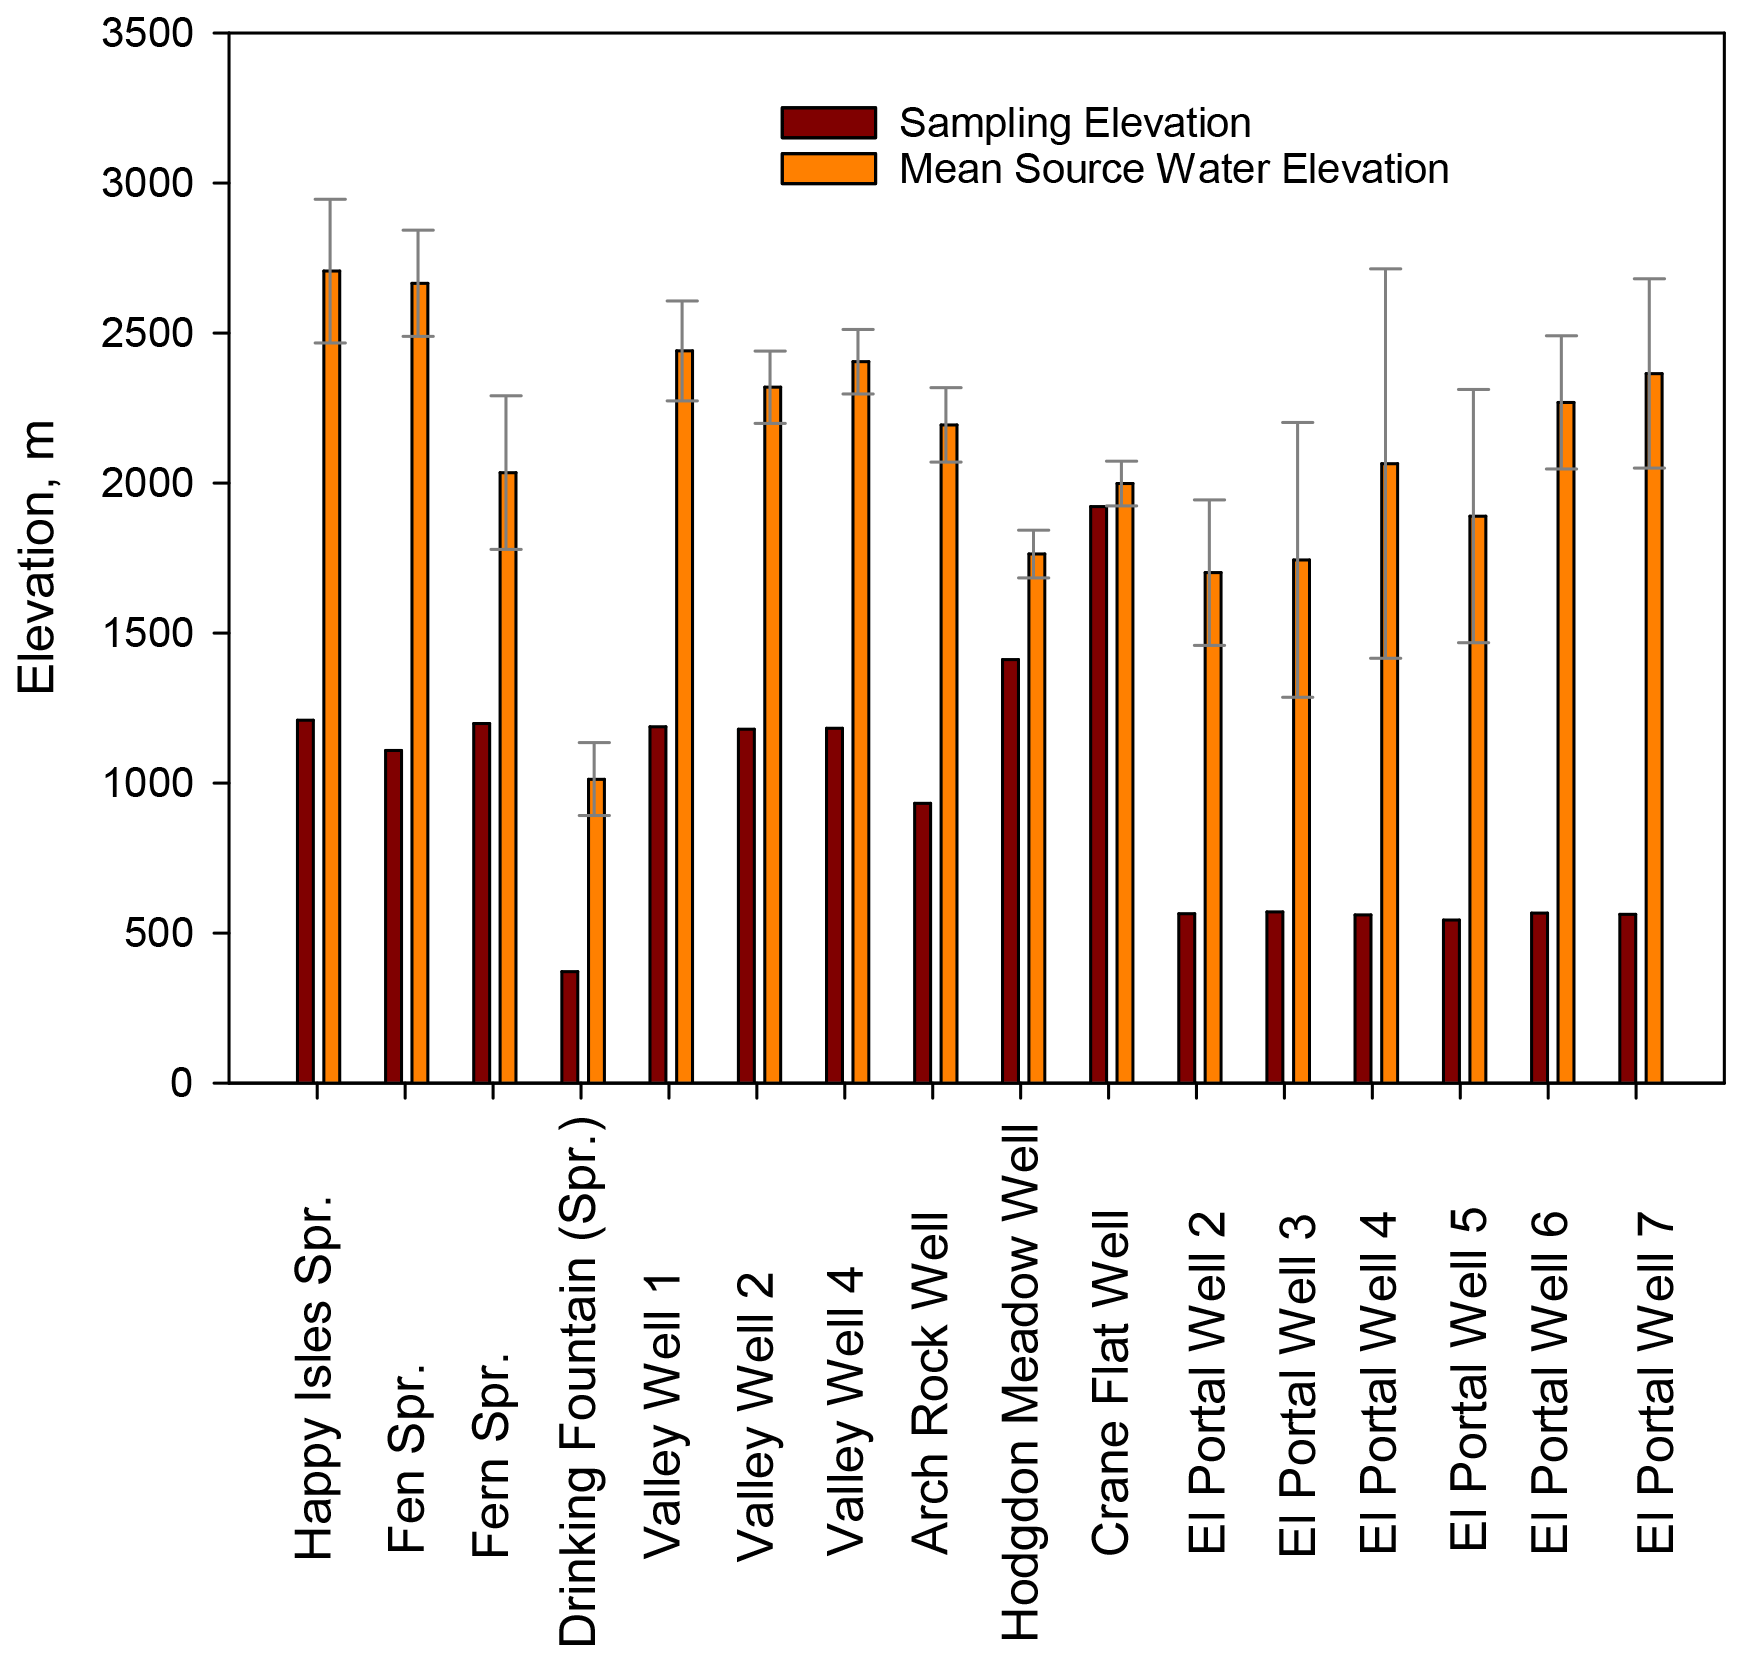
Figure 11Mean elevations of recharge areas for springs and groundwater calculated by the δ2H–elevation relation, along with 1σ standard deviations and sampling elevations.
Based on the δ2H–elevation relation, the mean source water elevation for springs at Happy Isles and Fen in Yosemite Valley is higher than 2500 m, approximately 1500 m above their resurfacing (sampling) locations (Fig. 11). The mean source water elevation is close to 2500 m for deep wells in Yosemite Valley and close to 2000 m for shallow wells at El Portal. The mean source water elevations for these springs and groundwater are around the present and future threshold elevations (2181 m for 1995–2004 and 2486 m for 2085–2094 in Sierra Nevada) determined by Scalzitti et al. (2016), below which the variability in snowpack is primarily determined by temperature and above which, by precipitation. The source waters of these springs and groundwater will likely be subject to the impact of both temperature increase and precipitation pattern changes in the future.
These springs, including Fern Spring, one of the most attractive touring sites in the valley, could be negatively impacted by the shift in snow–rain proportion in the future, as their recharge areas are centered in the upper snow–rain transition zone. The same applies to the groundwater storage and water table dynamics in both Yosemite Valley and El Portal. However, the response is certainly more sensitive in the valley than in El Portal, as the source water area of groundwater in the valley extends from ∼ 1180 m (where wells are located) to > 2500 m, with more areas located in the snow-covered area than the source water area of groundwater in El Portal (which extends from < 500 to > 2000 m).
Note that the estimated source water (recharge) elevations for groundwater in the valley and El Portal refer to elevations where water originated. The pathways of source waters, e.g., whether via direct underground flow paths, as in the case of Frisbee et al. (2011) or by mixing of groundwater recharge and river water, as suggested by Shaw et al. (2014), cannot be elucidated by stable isotopic data alone but can be done by combining isotopes and geochemical tracers, as demonstrated by Liu et al. (2004). Unlike Adomako et al. (2010), moreover, the recharge rates of groundwater and spring water cannot be determined due to the lack of a lapse rate of runoff depth with elevation in our study. However, the recharge elevation ranges help improve our understanding of the sensitivity of climate change impact on groundwater recharge.
The stable isotopic composition of stream water and groundwater is strongly controlled by elevations in source waters in the mid Merced River catchment, with an average isotopic lapse rate of −1.9 ‰ per 100 m for δ2H and −0.22 ‰ per 100 m for δ18O in meteoric water. This lapse rate, determined by small streams, groundwater, and rock glacier outflows, is more robust than the one established earlier using snow samples collected in Sierra Nevada. The temporal variability in the isotopic compositions of stream water and groundwater was significantly attenuated compared to that in precipitation. Evaporation had little effect on the isotopic signature of precipitation, spring water, and groundwater but affected stream water, particularly during low flows in summer and fall. The isotopic composition of stream water was most depleted during the snowmelt periods as a result of significant contributions of snowmelt runoff. However, the isotope–elevation relation was not significantly affected by evaporation and snowmelt effects nor by isotopic fractionation between ice and liquid water in snowmelt. The isotopic composition in stream water in the Merced River consistently becomes more enriched with decreasing sampling elevations (or increasing in drainage area) for all seasons. Using the isotope–elevation relation, a catchment characteristic isotopic value (CCIV) was established based on the mean drainage elevation. The CCIV, in combination with the local meteoric water line and local evaporation line, helps elucidate the hydrometeorologic processes at different stages or seasons and the sensitivities of streamflow in response to climate warming. The analysis suggests that Yosemite Creek is most sensitive to climate warming due to strong evaporation associated with waterfalls. It is also suggested that the evaporation effect on streamflow must be considered in understanding how climate change impacts streamflow. Based on the isotope–elevation relation, it was determined that groundwater in the valley is from drainage areas centered in the upper snow–rain transition zone (2000–2500 m). It is suggested that groundwater (including spring water) in the valley is very vulnerable to the shift in the snow–rain ratio. Continuous and frequent monitoring of changes in stable isotopes in stream water and groundwater along an elevation gradient is a very powerful tool in watershed hydrology for major snowmelt-fed river systems in regions such as the western US, which will greatly help advance our understanding of how streamflow responds to temperature rise and shifts in the snow–rain ratio.
The isotopic data set that supported this study can be accessed at https://doi.org/10.4211/hs.1cafaccac14a4748a5260faf88f04781 (Liu and Conklin, 2024). Hydrologic and meteorological data sets used in this study are publicly available from the California Data Exchange Center (for precipitation: https://cdec.water.ca.gov/snow_rain.html, California Data Exchange Center, 2023a; for snow depth: https://cdec.water.ca.gov/snow/current/snow/index.html, California Data Exchange Center, 2023b; for streamflow: https://cdec.water.ca.gov/riv_flows.html, California Data Exchange Center, 2023c). The 30 m digital elevation model (DEM) is available through the US Geological Survey (https://www.usgs.gov/the-national-map-data-delivery/gis-data-download, US Geological Survey, 2023).
FL and MHC designed the experiments and FL and GDS carried them out. FL performed data analyses and developed all figures and tables. FL prepared the manuscript with contributions from all co-authors.
The contact author has declared that none of the authors has any competing interests.
Publisher’s note: Copernicus Publications remains neutral with regard to jurisdictional claims made in the text, published maps, institutional affiliations, or any other geographical representation in this paper. While Copernicus Publications makes every effort to include appropriate place names, the final responsibility lies with the authors.
The authors thank Robert Rice and Peter Kirchner for taking rock glacier outflow samples, Katy Warner at the Yosemite National Park for taking precipitation samples, and Denise Melendez for processing meteorological data and analyzing samples. Two undergraduate students, Dannique Aalbu from the University of California, Merced, and Clifford Tonsberg Jr. from the University of Tennessee, helped with sampling in summer 2008, supported by the NSF's Research Experience for Undergraduates (REU) program.
This research has been supported by the California Energy Commission (grant no. 500-02-004), the Michigan Technological University (grant no. Start-up for Fengjing Liu), the Directorate for Geosciences (grant nos. EAR-0725097 and EAR1331939), and the National Institute of Food and Agriculture (grant nos. 2011-38821-30956, 2013-38821-21461, 0225140, and 1007239).
This paper was edited by Hongkai Gao and reviewed by two anonymous referees.
Adomako, D., Maloszewski, P., Stumpp, C., Osae, S., and Akiti, T. T.: Estimating groundwater recharge from water isotope (δ2H, δ18O) depth profiles in the Densu River basin, Ghana, Hydrolog. Sci. J., 55, 1405–1416, https://doi.org/10.1080/02626667.2010.527847, 2010.
Alley, W. M.: Tracking US groundwater – Reserves for the future?, Environment, 48, 10–25, https://doi.org/10.3200/ENVT.48.3.10-25, 2006.
Araguas-Araguas, L., Froehlich, K., and Roozanski, K.: Deuterium and oxygen-18 isotope composition of precipitation and atmospheric moisture, Hydrol. Process., 14, 1341–1355, 2000.
Balagizi, C. M., Kasereka, M. M., Cuoco, E., and Liotta, M.: Influence of moisture source dynamics and weather patterns on stable isotopes ratios of precipitation in Central-Eastern Africa, Sci. Total Environ., 628–629, 1058–1078, https://doi.org/10.1016/j.scitotenv.2018.01.284, 2018.
Barnett, T. P., Adam, J. C., and Lettenmaier, D. P.: Potential impacts of a warming climate on water availability in snow-dominated regions, Nature, 438, 303–309, https://doi.org/10.1038/nature04141, 2005.
Bateman, P. C.: Plutonism in the Central Part of the Sierra Nevada Batholith, California, USGS Professional Paper 1483, 186 pp., https://pubs.usgs.gov/pp/1483/report.pdf (last access: 2 May 2024), 1992.
Berman, E. S., Gupta, M., Gabrielli, C., Garland, T., and McDonnell, J. J.: High-frequency filed-deployable isotope analyzer for hydrological applications, Water Resour. Res., 45, W10201, https://doi.org/10.1029/2009WR008265, 2009.
Bales, R. C., Molotch, N. P., and Dozier, J.: Mountain hydrology of the western United States, Water Resour. Res., 42, W08432, https://doi.org/10.1029/2005WR004387, 2006.
California Data Exchange Data Center: California Data Exchange Center – Precipitation, California Data Exchange Data Center [data set], https://cdec.water.ca.gov/snow_rain.html (last access: 17 August 2023), 2023a.
California Data Exchange Data Center: California Data Exchange Center – Snow, California Data Exchange Data Center [data set], https://cdec.water.ca.gov/snow/current/snow/index.html (last access: 17 August 2023), 2023b.
California Data Exchange Data Center: California Data Exchange Center – River Stages/Flow, California Data Exchange Data Center[data set], https://cdec.water.ca.gov/riv_flows.html (last access: 17 August 2023), 2023c.
Chen, J. S., Li, L., Wang, J. Y., Barry, D. A., Sheng, X. F., Gu, W. Z., Zhao, X., and Chen, L.: Water resources: Groundwater maintains dune landscape, Nature, 432, 459–460, https://doi.org/10.1038/432459a, 2004.
Clark, I. D. and Fritz, P.: Environmental Isotopes in Hydrogeology, CRC Press, 342 pp., ISBN 9781566702492, 1997.
Clow, D. W., Mast, M. A., and Campbell, D. H.: Controls on surface water chemistry in the Upper Merced River Basin, Yosemite National Park, California, Hydrol. Process., 10, 727–746, 1996.
Craig, H.: Isotopic variations in meteoric waters, Science, 133, 1702–1703, 1961.
Dettinger, M. D. and Cayan, D. R.: Large-scale atmospheric forcing of recent trends toward early snowmelt runoff in California, J. Climate, 8, 606–623, https://doi.org/10.1175/1520-0442(1995)008<0606:LSAFOR>2.0.CO;2, 1995.
Dettinger, M. D., Cayan, D. R., Meyer, M. K., and Jeton, A. E.: Simulated hydrologic responses to climate variations and changes in the Merced, Carson, and American River basins, Sierra Nevada, California, 1900–2099, Climatic Change, 62, 283–317, 2004.
Dutton, A., Wilkinson, B. H., Welker, J. M., Bowen, G. J., and Lohmann, K. C.: Spatial distribution and seasonal variation in 18O 16O of modern precipitation and river water across the conterminous USA, Hydrol. Process., 19, 4121–4146, 2005.
Earman, S., Campbell, A. R., Phillips, F. M., and Newman, B. D.: Isotopic exchange between snow and atmospheric water vapor: Estimation of the snowmelt component of groundwater recharge in the southwestern United States, J. Geophys. Res.-Atmos., 111, D09302, https://doi.org/10.1029/2005JD006470, 2006.
Earman, S. and Dettinger, M.: Potential impacts of climate change on groundwater resources: a global review, J. Water Clim. Change, 2, 213–229, https://doi.org/10.2166/wcc.2011.034, 2011.
Eastoe, C. J. and Wright, W. E.: Hydrology of Mountain Blocks in Arizona and New Mexico as Revealed by Isotopes in Groundwater and Precipitation, Geosciences, 9, 461, https://doi.org/10.3390/geosciences9110461, 2019.
Fayad, A., Gascoin, S., Faour, G., Lopez-Moreno, J. I., Drapeau, L., Le Page, M., and Escadafal, R.: Snow hydrology in Mediterranean mountain regions: A review, J. Hydrol., 551, 374–396, 2017.
Fites-Kaufman, J. A., Rundel, P., Stephenson, N., and Weixelman, D. A.: Montane and subalpine vegetation of the Sierra Nevada and Cascade Ranges, in Terrestrial Vegetation of California, 3rd Edn., edited by: Barbour, M., 456–501, https://doi.org/10.1525/california/9780520249554.003.0017, 2007.
Friedman, I. and Smith, I. S.: Deuterium content of snow cores from Sierra Nevada area, Science, 169, 467–470, 1970.
Friedman, I., Harris, J. M., Smith, G. I., and Johnson, C. A.: Stable isotope composition of waters in the Great Basin, United States 1. Air-mass trajectories, J. Geophys. Res., 107, 4400, https://doi.org/10.1029/2001JD000565, 2002.
Frisbee, M. D., Phillips, F. M., Campbell, A. R., and Hendrickx, J. M. H.: Modified passive capillary samplers for collecting samples of snowmelt infiltration for stable isotope analysis in remote, seasonally inaccessible watersheds 1: laboratory evaluation, Hydrol. Process., 24, 825–833, https://doi.org/10.1002/hyp.7523, 2010.
Frisbee, M. D., Phillips, F. M., Campbell, A. R., Liu, F., and Sanchez, S. A.: Streamflow generation in a large, alpine watershed in the southern Rocky Mountains of Colorado: Is streamflow generation simply the aggregation of hillslope runoff responses?, Water Resour. Res., 47, W06512, https://doi.org/10.1029/2010WR009391, 2011.
Gamboa, C., Godfrey, L., Urrutia, J., Herrera, C., Lu, X., and Jordan, T.: Conditions of groundwater recharge in the hyperarid southern Atacama Desert, Global Planet. Change, 217, 103931, https://doi.org/10.1016/j.gloplacha.2022.103931, 2022.
Gat, J. R.: Oxygen and hydrogen isotopes in the hydrologic cycle, Annu. Rev. Earth Pl. Sc., 24, 225–262, 1996.
Gutenberg, B., Buwalda, J. P., and Sharp, P.: Seismic explorations on the floor of Yosemite Valley, California, Bull. Geol. Soc. Am., 67, 1051–1078, https://doi.org/10.1130/0016-7606(1956)67[1051:SEOTFO]2.0.CO;2, 1956.
Hemmerle, H., van Geldern, R., Juhlke, T. R., Huneau, F., Garel., E., Santoni, S., and Barth, J. A. C.: Altitude isotope effects in Mediterranean high-relief terrains: a correction method to utilize stream water data, Hydrolog. Sci. J., 66, 1409–1418, https://doi.org/10.1080/02626667.2021.1928672, 2021.
Hren, M. T., Bookhagen, B., Blisniuk, P. M., Booth, A. L., and Chamberlain, C. P.: δ18O and δD of streamwaters across the Himalaya and Tibetan Plateau: Implications for moisture sources and paleoelevation reconstructions, Earth Planet. Sc. Lett., 288, 20–32, 2009.
Hunsaker, C. T., Whitaker, T. W., and Bales, R. C.: Snowmelt runoff and water yield along elevation and temperature gradients in California's southern Sierra Nevada, J. Am. Water Resour. As., 48, 1–12, https://doi.org/10.1111/j.1752-1688.2012.00641.x, 2012.
Ingraham, N. L.: Isotopic variations in precipitation, in: Isotope Tracers in Catchment Hydrology, edited by: Kendall, C. and McDonnell, J. J., Elsevier Science B. V., Amsterdam, 839 pp., ISBN 9780444501554, 1998.
Ingraham, N. L. and Taylor, B. E.: Light stable isotope systematics of large-scale hydrologic regimes in California and Nevada, Water Resour. Res., 27, 77–90, 1991.
Jeelani, G., Bhat, N. A., and Shivanna, K.: Use of δ18O tracer to identify stream and spring origins of a mountainous catchment: A case study from Liddar watershed, Western Himalaya, India, J. Hydrol., 393, 257–264, https://doi.org/10.1016/j.jhydrol.2010.08.021, 2010.
Jeelani, G., Kumar, U. S., and Kumar, B.: Variation of δ18O and δD in precipitation and stream waters across the Kashmir Himalaya (India) to distinguish and estimate the seasonal sources of stream flow, J. Hydrol., 481, 157–165, https://doi.org/10.1016/j.jhydrol.2012.12.035, 2013.
Jean-Baptiste, J., Le Gal Salle, C., and Verdoux, P.: Water stable isotopes and volumetric discharge rates to monitor the Rhone water's seasonal origin, Heliyon, 6, e04376, https://doi.org/10.1016/j.heliyon.2020.e04376, 2020.
Jodar, J., Custodio, E., Lamban, L. J., Herrera, C., Martos-Rossilo, S., Sapriza, G., and Rigo, T.: Correlation of the seasonal isotopic amplitude of precipitation with annual evaporation and altitude in alpine regions, Sci. Total Environ., 550, 27–37, https://doi.org/10.1016/j.scitotenv.2015.12.034, 2016.
Kendall, C. and Coplen, T. B.: Distribution of oxygen-18 and deuterium in river waters across the United States, Hydrol. Process., 15, 1363–1393, 2001.
Kendall, C. and McDonnell, J. J. (Eds.): Isotope Tracers in Catchment Hydrology, Elsevier Science B. V., Amsterdam, 839 pp., ISBN 9780444501554, 1998.
Knowles, N., Dettinger, M. D., and Cayan, D. R.: Trends in snowfall versus rainfall in the Western United States, J. Climate, 19, 4545–4559, 2006.
Koeniger, P., Margane, A., Abi-Rizk, J., and Himmelsbach, T.: Stable isotope-based mean catchment altitudes of springs in the Lebanon Mountains, Hydrol. Process., 31, 3708–3718, https://doi.org/10.1002/hyp.11291, 2017.
Kumar, B., Rai, S. P., Saravana Kumar, U., Verma, S. K., Garg, P., Vijaya Kumar, S. V., Jaiswal, R., Purendra, B. K., Kumar, S. R., and Pande, N. G.: Isotopic characteristics of Indian precipitation, Water Resour. Res., 46, W12548, https://doi.org/10.1029/2009WR008532, 2010.
Kundzewicz, Z. W. and Doll, P.: Will groundwater ease freshwater stress under climate change?, Hydrolog. Sci. J., 54, 665–675, https://doi.org/10.1623/hysj.54.4.665, 2009.
Liu, F. and Conklin, M.: Isotopic Composition in Streamflow, Groundwater, and Precipitation in the Merced River, Sierra Navada, California, USA, HydroShare [data set], https://doi.org/10.4211/hs.1cafaccac14a4748a5260faf88f04781, 2024.
Liu, F., Williams, M. W., and Caine, N.: Sources waters and flow paths in an alpine catchment, Colorado Front Range, USA, Water Resour. Res., 40, W09401, https://doi.org/10.1029/2004WR003076, 2004.
Liu, F., Conklin, M. H., and Shaw, G. D.: Insights into hydrologic and hydrochemical processes based on concentration-discharge and end-member mixing analyses in the mid-Merced River Basin, Sierra Nevada, California, Water Resour. Res., 53, 832–850, https://doi.org/10.1002/2016WR019437, 2017.
Mast, M. A. and Clow, D. W.: Environmental characteristics and water quality of Hydrologic Benchmark Stations in the western United States, 1963–95: U.S. Geological Survey 1173-D, 114 pp., https://doi.org/10.3133/cir1173D, 2010.
Manning, A. H. and Caine, J. S.: Groundwater noble gas, age, and temperature signature in an Alpine watershed: Valuable tools in conceptual model development, Water Resour. Res., 43, W04404, https://doi.org/10.1029/2006WR005349, 2007.
Manning, A. H. and Solomon, D. K.: An integrated environmental tracer approach to characterizing groundwater circulation in a mountain block, Water Resour. Res., 41, W12412, https://doi.org/10.1029/2005WR004178, 2005.
Mote, P. W., Hamlet, A. M., Clark, M. P., and Lettenmaier, D. P.: Declining mountain snowpack in western North America, B. Am. Meteorol. Soc., 86, 1–39, 2005.
Mulch, A., Graham, S. A., and Chamberlain, C. P.: Hydrogen isotopes in Eocene river gravels and paleoelevation of the Sierra Nevada, Science, 313, 87–89, 2006.
O'Driscoll, M. A., DeWalle, D. R., McGuire, K. J., and Gburek, W. J.: Seasonal 18O variations and groundwater recharge for three landscape types in central Pennsylvania, USA, J. Hydrol., 303, 108–124, 2005.
Ohlanders, N., Rodriguez, M., and McPhee, J.: Stable water isotope variation in a Central Andean watershed dominated by glacier and snowmelt, Hydrol. Earth Syst. Sci., 17, 1035–1050, https://doi.org/10.5194/hess-17-1035-2013, 2013.
Peng, T. R., Chen, K. Y., and Tong, L. T. J.: Use of stable water isotopes to identify hydrological processes of meteoric water in montane catchments, Hydrol. Process., 29, 4957–4967, https://doi.org/10.1002/hyp.10557, 2015.
Peng, T. R., Huang, C. C., Chen, C. T., Chen, J. E., and Liang, W. J.: Using stable hydrogen and oxygen isotopes to reveal monsoonal and related hydrological effects on meteoric water in the Western Pacific monsoon region: A case study of the Ilan region, northeastern Taiwan, J. Asian Earth Sci., 128, 105–115, https://doi.org/10.1016/j.jseaes.2016.06.024, 2016.
Penna, D., Engel, M., Mao, L., Dell'Agnese, A., Bertoldi, G., and Comiti, F.: Tracer-based analysis of spatial and temporal variations of water sources in a glacierized catchment, Hydrol. Earth Syst. Sci., 18, 5271–5288, https://doi.org/10.5194/hess-18-5271-2014, 2014.
Penna, D., van Meerveld, H. J., and Borga, M.: Hydrological response of an Alpine catchment to rainfall and snowmelt events, J. Hydrol., 537, 382–397, https://doi.org/10.1016/j.jhydrol.2016.03.040, 2016.
Penna, D., Engel, M., Bertoldi, G., and Comiti, F.: Towards a tracer-based conceptualization of meltwater dynamics and streamflow response in a glacierized catchment, Hydrol. Earth Syst. Sci., 21, 23–41, https://doi.org/10.5194/hess-21-23-2017, 2017.
Poage, M. A. and Chamberlain, C. P.: Empirical relationships between elevation and the stable isotope composition of precipitation and surface waters: Consideration for studies of paleoelevation change, Am. J. Sci., 301, 1–15, 2001.
Reckerth, A., Stichler, W., Schmidt, A., and Stumpp, C.: Long-term data set analysis of stable isotopic composition in German rivers, J. Hydrol., 552, 718–731, https://doi.org/10.1016/j.jhydrol.2017.07.022, 2017.
Rice, R., Bales, R. C., Painter, T. H., and Dozier, J.: Snow water equivalent along elevation gradients in the Merced and Tuolumne River basins of the Sierra Nevada, Water Resour. Res., 47, W08515, https://doi.org/10.1029/2010WR009278, 2011.
Scalzitti, J., Strong, C., and Kochanski, A.: Climate change impact on the roles of temperature and precipitation in western U.S. snowpack variability, Geophys. Res. Lett., 43, 5361–5369, https://doi.org/10.1002/2016GL068798, 2016.
Shaw, G. D., Conklin, M. H., Nimz, G. J., and Liu, F.: Ground water and surface water flow to the Merced River, Yosemite Valley, California: 36Cl and Cl− evidence, Water Resour. Res., 50, 1943–1959, https://doi.org/10.1002/2013WR014222, 2014.
Sivapalan, M., Takeuchi, K., Franks, S. W., Gupta, V. K., Karambiri, H., Lakshmi, V., Liang, X., McDonnell, J. J., Mendiondo, E. M., O'Connell, P. E., Oki, T., Pomeroy, J. W., Schertzer, D., Uhlenbrook, S., and Zehe, E.: IAHS Decade on Predictions in Ungauged Basins (PUB), 2003–2012: Shaping an exciting future for the hydrological sciences, Hydrolog. Sci. J., 48, 857–880, https://doi.org/10.1623/hysj.48.6.857.51421, 2003.
Sklash, M. G., Farvolden, R. N., and Fritz, P.: A conceptual model of watershed response to rainfall, developed through the use of oxygen-18 as a natural tracer, Can. J. Earth Sci., 13, 271–283, 1976.
Stewart, I. T., Cayan, D. R., and Dettinger, M. D.: Changes in snowmelt runoff timing in western North America under a `business as usual' climate change scenario, Climatic Change, 62, 217–232, https://doi.org/10.1023/B:CLIM.0000013702.22656.e8, 2004.
Stewart, I. T., Cayan, D. R., and Dettinger, M. D.: Changes toward earlier streamflow timing across western North America, J. Climate, 18, 1136–1155, 2005.
Taylor, S., Feng, X., Kirchner, J. W., Osterhuber, R., Klaue, B., and Renshaw, C. E.: Isotopic evolution of a seasonal snowpack and its melt, Water Resour. Res., 37, 759–769, 2001.
Taylor, R. G., Scanlon, B., Döll, P., Rodell, M., van Beek, R., Wada, Y., Longuevergne, L., Leblanc, M., Famiglietti, J. S., Edmunds, M., Konikow, L., Green, T. R., Chen, J., Taniguchi, M., Bierkens, M. F. P., MacDonald, A., Fan, Y., Maxwell, R. M., Yechieli, Y., Gurdak, J. J., Allen, D. M., Shamsudduha, M., Hiscock, K., Yeh, P. J. F., Holman, I., and Treidel, H.: Groundwater and Climate Change, Nat. Clim. Change, 3, 322–329, https://doi.org/10.1038/nclimate1744, 2013.
Tennant, C. J., Crosby, B. T., and Sarah S. E.: Elevation-dependent responses of streamflow to climate warming, Hydrol. Process., 29, 991–1001, https://doi.org/10.1002/hyp.10203, 2015.
Thompson, L. G., Mosley-Thompson, E., and Henderson, K. A.: Ice-core palaeoclimate records in tropical South America since the Last Glacial Maximum, J. Quaternary Sci., 15, 377–394, 2000.
US Geological Survey: The National Map-Data Delivery, US Geological Survey [data set], https://www.usgs.gov/the-national-map-data-delivery/gis-data-download, last access: 17 August 2023.
Vaughan, D. G., Comiso, J. C., Allison, I., Carrasco, J., Kaser, G., Kwok, R., Mote, P., Murray, T., Paul, F., Ren, J., Rignot, E., Solomina, O., Steffen K., and Zhang, T.: Observations: Cryosphere, in: Climate Change 2013: The Physical Science Basis, Contribution of Working Group I to the Fifth Assessment Report of the Intergovernmental Panel on Climate Change, edited by: Stocker, T. F., Qin, D., Plattner, G.-K., Tignor, M., Allen, S. K., Boschung, J., Nauels, A., Xia, Y., Bex, V., and Midgley, P. M., Cambridge University Press, Cambridge, United Kingdom and New York, NY, USA, https://doi.org/10.1017/CBO9781107415324.012, 2013.
Voss, K. A., Bookhagen, B., Sachse, D., and Chadwick, O. A.: Variation of deuterium excess in surface waters across a 5000-m elevation gradient in eastern Nepal, J. Hydrol., 586, 124802, https://doi.org/10.1016/j.jhydrol.2020.124802, 2020.
Wang, L., Caylor, K. K., and Dragoni, D.: On the calibration of continuous, high-precision δ18O and δ2H measurements using an off-axis integrated cavity output spectrometer, Rapid Commun. Mass Sp., 23, 530–536, https://doi.org/10.1002/rcm.3905, 2009.
Wang, N., Zhang, S., He, J., Pu, J., Wu, X., and Jiang, X.: Tracing the major source area of the mountainous runoff generation of the Heihe River in northwest China using stable isotope technique, Chinese Sci. Bull., 54, 2751–2757, https://doi.org/10.1007/s11434-009-0505-8, 2009.
Wen, R., Tian, L., Liu, F., and Qu, D.: Lake water isotope variation linked with in-lake water cycle of the alpine Bangong Co, arid western Tibetan Plateau, Arct. Antarct. Alp. Res., 48, 563–579, https://doi.org/10.1657/AAAR0015-028, 2016.
Wilson, J. L. and Guan, H.: Mountain-block hydrology and mountain-front recharge, in: Groundwater Recharge in a Desert Environment: The Southwestern United States, Water Sci. Appl. Ser., 9, edited by: Hogan, J., Phillips, F. M., and Scanlon, B., AGU, Washington, D.C., 113–137, https://doi.org/10.1029/009WSA08, 2004.
Windhorst, D., Waltz, T., Timbe, E., Frede, H.-G., and Breuer, L.: Impact of elevation and weather patterns on the isotopic composition of precipitation in a tropical montane rainforest, Hydrol. Earth Syst. Sci., 17, 409–419, https://doi.org/10.5194/hess-17-409-2013, 2013.
Yanggen, D. A. and Born, S.: Protecting groundwater quality by managing local land use, J. Soil Water Conserv., 45, 207–210, 1990.