the Creative Commons Attribution 4.0 License.
the Creative Commons Attribution 4.0 License.
Terrestrial water loss at night: global relevance from observations and climate models
Lukas Gudmundsson
Dominik Michel
Sonia I. Seneviratne
Nocturnal water loss (NWL) from the surface into the atmosphere is often overlooked because of the absence of solar radiation to drive evapotranspiration and the measuring difficulties involved. However, growing evidence suggests that NWL – and particularly nocturnal transpiration – represents a considerable fraction of the daily values. Here we provide a global overview of the characteristics of NWL based on latent heat flux estimates from the FLUXNET2015 dataset, as well as from simulations of global climate models. Eddy-covariance measurements at 99 sites indicate that NWL represents 6.3 % of total evapotranspiration on average. There are six sites where NWL is higher than 15 %; these sites comprise mountain forests with considerable NWL during winter that is related to snowy and windy conditions. Higher temperature, vapor pressure deficit, wind speed, soil moisture, and downward longwave radiation are related to higher NWL, although this is not consistent across all of the sites. On the other hand, the global multi-model mean of terrestrial NWL is 7.9 % of the total evapotranspiration. The spread of the model ensemble, however, is greater than 15.8 % over half of the land grid cells. Finally, NWL is projected to increase everywhere with an average of 1.8 %, although with a substantial inter-model spread. Changes in NWL contribute substantially to projected changes in total evapotranspiration. Overall, this study highlights the relevance of water loss during the night and opens avenues to explore its influence on the water cycle and the climate system under present and future conditions.
- Article
(3938 KB) - Full-text XML
-
Supplement
(905 KB) - BibTeX
- EndNote
Water is lost from the surface to the atmosphere through evapotranspiration (ET). This process interlinks the water, energy, and carbon cycles and, therefore, influences climate, ecology, agriculture, and economy (e.g., Betts et al., 1996; Fisher et al., 2017; Zhang et al., 2015). Although daytime ET, which is mainly driven by solar radiation, represents the majority of the contribution to total water loss, nighttime ET is likely non-negligible. Nocturnal water loss may occur as evaporation from the soil and canopy, snow sublimation, or plant transpiration through stomatal and cuticular conductance. It is also recognized that vapor pressure deficit, temperature, wind speed, longwave radiation, and surface resistance influence nocturnal ET (Monteith, 1965; Penman, 1948). The prevalence of nocturnal water loss and its significance for the surface water and energy balance, however, remains overlooked and unclear.
In recent years there has been a growing body of evidence regarding the occurrence of nocturnal ET, with a specific focus on transpiration (Tr). Observations of nocturnal stomatal conductance across hundreds of species have challenged the assumption of stomatal closure in the absence of photosynthetically active radiation (e.g., Daley and Phillips, 2006; Dawson et al., 2007; Lombardozzi et al., 2017; Snyder et al., 2003). Possible advantages of nocturnal sap flow include capacitance refilling, embolism removal, nutrient uptake, hydraulic redistribution, and oxygen supply (Zeppel et al., 2014), whereas it remains unclear if Tr with no associated carbon gain has any benefits for vegetation or is simply unavoidable. Total water loss through ET, however, is more relevant than Tr from a water balance perspective as it additionally includes evaporation or snow sublimation from the ground and canopy. Nocturnal ET can be measured with lysimeters or eddy-covariance (EC) flux systems. A summary of previously reported nocturnal water loss estimates of both Tr and ET is provided in Table 1.
Table 1Nocturnal transpiration (Tr) and evapotranspiration (ET) estimates reported in the literature.

Water is not only lost from the surface during night, but it can also be gained by dew formation. For example, dew and hoar frost comprise 4.2 %–6.4 % of annual precipitation at three humid grass sites in Austria and Germany (Groh et al., 2018, 2019) and were found to occur on approximately 30 % of the nights in a forest in central Colorado (Berkelhammer et al., 2013) and 70 % of the nights in a grassland in the Netherlands (Jacobs et al., 2006). ET and dew formation correspond to a latent heat flux and might both occur, e.g., within the same hour, which makes it difficult to quantify them separately if the temporal resolution of the data is insufficient. Thus, in the present study, we focus on the net latent heat flux or net nocturnal water loss (NWL), which is defined as ET minus dew formation.
Climate models generally represent latent heat flux as a function of the air–surface gradient in specific humidity and a resistance to water vapor transfer. This total resistance can include an aerodynamic resistance, a resistance to diffusion through the soil, a leaf boundary layer resistance, and stomatal resistance. Stomatal resistance or conductance is parameterized in most large-scale land surface models similarly to the Ball–Woodrow–Berry model (Ball et al., 1987; Ball, 1988; Collatz et al., 1991; Leuning, 1995; Medlyn et al., 2011; Sellers et al., 1996), i.e., as a linear function where the intercept is assumed to represent nocturnal conductance (see explanation in Lombardozzi et al., 2017). Meanwhile, new evidence suggests that nocturnal stomatal conductance is actively controlled, and that it is not equivalent to minimum conductance (Duursma et al., 2019). Underestimation of nocturnal stomatal conductance would lead to lower transpiration and, hence, lower NWL. Previous research has noted that land surface models, dynamic global vegetation models, and ecophysiological models continue to commonly assume that virtually no transpiration takes place at night, despite evidence suggesting otherwise (e.g., Lombardozzi et al., 2017; Zeppel et al., 2014). By adjusting the nocturnal stomatal conductance of the Community Land Model (CLM; version 4.5) based on empirical evidence, Lombardozzi et al. (2017) obtain an increase of up to 5 % in global transpiration, as well as significant effects on soil moisture availability and carbon uptake. In another study, Vinukollu et al. (2011) reported a mean nocturnal ET from the VIC land surface model of 9.6 % relative to daytime ET. It is also known that simple land evaporation models are not well suited for nocturnal conditions (Ershadi et al., 2014). Finally, to our knowledge, no studies have been undertaken that have analyzed NWL estimates from an ensemble of global climate models.
The goal of this study is to provide an overview of the magnitude and variability of NWL across the globe as well as to explore its relationship to different meteorological and land cover conditions. An improved understanding of this overlooked flux is relevant for the surface water and energy balance. Until now, most research about NWL has stemmed from the plant physiology community; however, the relevance of their results for hydrological and climate studies is yet to be fully explored. Here we analyze observations of NWL from a lysimeter and a global network of EC measurements as well as estimates from a climate model ensemble for present and projected future conditions. We conclude with a comparison of the observed and modeled data, while keeping the difference in spatial resolution in mind.
2.1 Observations
2.1.1 Co-located lysimeter and EC station
Water fluxes are measured by a co-located weighing lysimeter and EC tower (2 m height) at the Rietholzbach pre-Alpine catchment in northeastern Switzerland (47.38∘ N, 8.99∘ E; 795 ; see Seneviratne et al., 2012 for site details). The sensors are thoroughly described by Hirschi et al. (2017). Given that the focus is on sensor comparison in this case, day and night are distinguished using a simple threshold of 10 W m−2 for measured incoming solar radiation; below this threshold, it is assumed that no photosynthesis occurs (Hirschi et al., 2017). Data from 2010 to 2018 are used to compare NWL estimates from these two independent measurement techniques.
For the lysimeter, changes in the total system mass (i.e., its weight plus accumulated seepage) are quantified every 5 min and correspond to water lost as ET or gained by precipitation, including dew. We apply an adaptive window and adaptive threshold (AWAT) filter to the total system mass of the lysimeter to reduce noise in the time series (Peters et al., 2014; Ruth et al., 2018). A minimum of 5 min and a maximum of 45 min are assumed for the moving-average window, and a minimum of 0.01 mm and a maximum of 0.25 mm are assumed for the threshold values to distinguish signal from noise. A piecewise cubic Hermitian spline is used to interpolate between points of significant mass change (Peters et al., 2016), after applying an 85th percentile “snap routine” at inflection points (Peters et al., 2017). We estimate dew formation from hourly weight increases in the lysimeter when a co-located rain gauge does not record precipitation in that hour or the next. Note that very light precipitation might not be recorded due to the 0.1 mm rain gauge resolution. On those rare occasions when estimated dew surpasses a maximum formation rate of 0.07 mm h−1 (Monteith and Unsworth, 1990), it is instead attributed to rain or snow. NWL is calculated as ET minus dew. Lysimeter data from December to March are discarded because the quality is strongly affected by the formation of snow bridges and the occurrence of snow drift. In addition, data from the following months are also omitted due to cases with unrealistic lysimeter weight and/or seepage measurements: July–September 2017, August 2014 and 2016, and November 2010, 2011, and 2016.
The EC data are processed using EddyPro (Fratini and Mauder, 2014; LI-COR, 2018) to obtain a latent heat flux time series with a temporal resolution of 30 min. Values are discarded for intervals when rain occurs, when the tower is in the upwind direction affecting the air flow (see Hirschi et al., 2017), and for cases with overly low turbulence (median threshold for friction velocity) based on Wutzler et al. (2018). The resulting gaps are filled according to Reichstein et al. (2005). Latent heat flux is converted into water volume by dividing by the latent heat of vaporization; here we assume .
2.1.2 Global network of EC stations
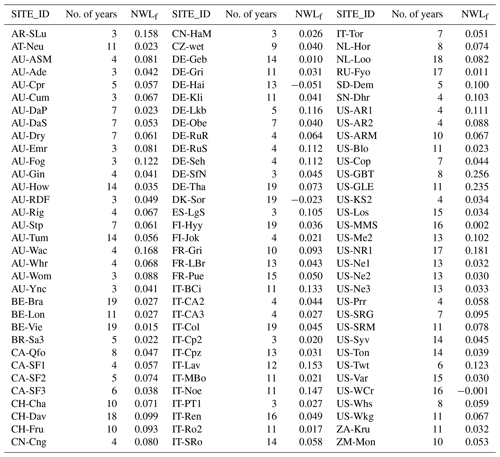
To obtain a broader picture of NWL across the globe, we employ the FLUXNET2015 Tier 1 dataset, which provides EC measurements of latent heat flux as well as numerous other meteorological variables from a global network of 166 sites. We further select only those stations that contain at least 3 years of data in order to obtain a more accurate climatology of NWL. The temporal resolution of the data is 30 min. There are implemented tailored steps for quality assurance and quality control (Pastorello et al., 2014). A quality flag at each time interval indicates whether the data were measured or gap-filled based on marginal distribution sampling (Reichstein et al., 2005). Moreover, there is an energy balance closure correction factor applied to the data based on the assumption that the Bowen ratio is correct. A joint uncertainty estimate that combines a random uncertainty component and an energy balance closure component is provided at each time step. Full details regarding the data processing are available at https://fluxnet.fluxdata.org/data/fluxnet2015-dataset/data-processing/ (last access: 13 February 2020). Even though the dataset distinguishes between daytime and nighttime intervals based on potential incoming solar radiation, we additionally determine the total number of nighttime hours by calculating the sunset and sunrise time of each day (see https://www.esrl.noaa.gov/gmd/grad/solcalc/calcdetails.html, last access: 13 February 2020). Finally, this study uses data from 99 sites (see Table A1 in the Appendix) that include energy-balance-corrected measurements of latent heat flux as well as the uncorrected fluxes.
Here we assume that the provided uncertainty for latent heat flux at each time step i is the standard deviation (σi) of a normal distribution; thus, we propagate it to obtain the uncertainty of the accumulated flux (σsum) over n time steps as follows:
where ρjk corresponds to the Pearson correlation between the estimates of time steps j and k. Because there is no information available to compute this correlation, we assume an average ρjk=0 in accordance with the FLUXNET2015 data processing. In addition, note that EC measurements do not account for latent heat storage in the air between the ground and measurement level. Lastly, it is important to be aware that the reliability of EC measurements decreases during the night due to low and intermittent turbulence (e.g., Baldocchi, 2003; Moffat et al., 2007). Nonetheless, on average across all analyzed sites, latent heat flux is measured in 60 % of all nighttime intervals, whereas gap-filling is required in the remaining 40 %.
2.2 Climate models
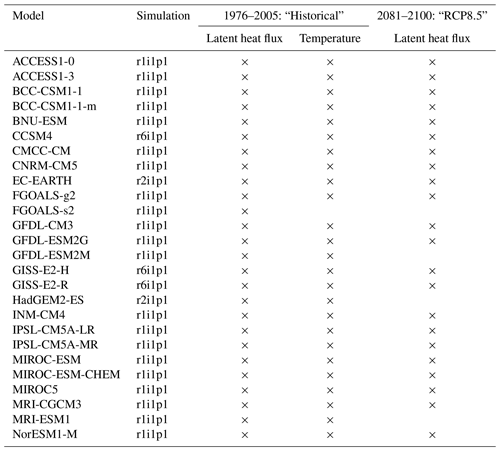
Sub-daily climate model output is required to study NWL. Here we analyze an ensemble of climate model simulations of Phase 5 of the Coupled Model Intercomparison Project (CMIP5) that provide 3-hourly estimates of latent heat flux. As for the EC data, we obtain NWL by dividing it by the latent heat of vaporization λ. For present conditions, we use data from historical simulations during the period from 1976 to 2005, whereas for the future period from 2081 to 2100, we use data from simulations with the “business as usual” RCP8.5 emissions scenario (Moss et al., 2010). The ensemble employed comprises 26 different models (or model configurations) with one initial condition simulation (see Table A2). Data from all models are bilinearly interpolated to a common grid. Grid cells with data from less than two-thirds of all models are not considered.
To estimate total NWL, we obtain the average flux from all 3-hourly intervals that are exclusively night and then extrapolate this value based on the complete number of nocturnal hours. To achieve this, we compute the time of sunset and sunrise for each day at the center of each individual grid cell using the solar time equations without accounting for topography. Note that this extrapolation approach could lead to inaccuracies if the NWL rate from periods immediately following sunset or just prior to sunrise systematically differ from the NWL rate during the middle of the night.
3.1 Observed nocturnal water loss
Monthly NWL from the co-located lysimeter and EC system show a Pearson correlation of 0.5 or 0.57, depending on how dew is estimated from the lysimeter data (L1 vs. L2, see Fig. 1a and b, respectively). For L1 (Fig. 1a), the default threshold of 0.07 mm h−1 is used (Sect. 2.1.1). In the case of L2 (Fig. 1b), here we select a second threshold of 0.035 mm h−1 as a sensitivity test, i.e., half of the defined value of 0.07 mm h−1 for maximum dew formation, when processing the lysimeter data. Note that the correlations may be affected by the difference in the footprint of the sensors and periods with gap-filled EC data. Also, in this case, there is no energy balance closure correction factor applied to the EC data. The agreement between EC and lysimeter improves if the NWL monthly climatology is analyzed. Moreover, in months when one of the lysimeter estimates of NWL is either too high or too low relative to the EC data, the other lysimeter estimate generally has a much better agreement. Overall, these results suggest that EC measurements can provide meaningful estimates of NWL. The annual climatology of EC-based NWL at this particular grassland site in Switzerland is 34.3 mm, which is equivalent to 5.8 % of annual ET.
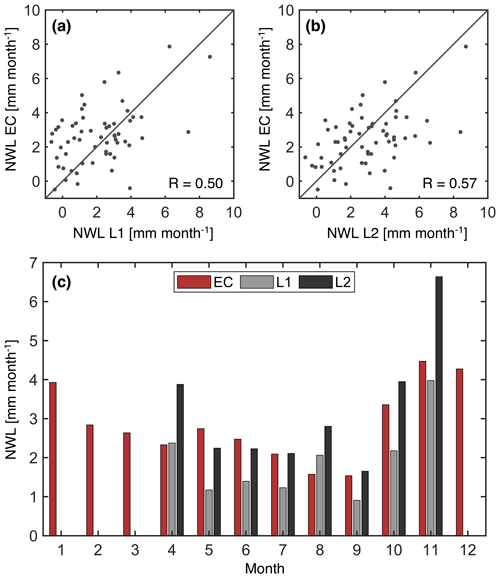
Figure 1Comparison of nocturnal water loss (NWL) measured by the co-located lysimeter and EC system at Rietholzbach. The comparison of individual months is shown in panels (a) and (b) with the Pearson correlation coefficient denoted as R, whereas a comparison of the climatology from the period from 2010 to 2018 is shown in panel (c). L1 corresponds to the lysimeter estimate with a maximum dew formation threshold of 0.07 mm h−1, and L2 corresponds to the lysimeter estimate with a threshold of 0.035 mm h−1. Lysimeter data from December to March are discarded due to measurements issues when snow is present.
An overview of observed NWL at the analyzed FLUXNET sites is presented in Fig. 2. Mean annual NWL based on energy-balance-corrected fluxes is 44.2 mm on average over all 99 stations, whereas the 5th and 95th percentiles of the distribution are 4.5 and 140.9 mm, respectively. There is a positive Spearman correlation coefficient of 0.61 between total ET and NWL, indicating generally higher NWL at sites with higher ET. The net nocturnal water loss as a fraction of total ET, i.e., NWLf= NWL∕ET, provides more insight into the relevance of the nocturnal water flux. Average NWLf across all of the stations is 6.3 %, the 5th percentile is 1 %, and the 95th percentile is 15.6 %. These annual mean values are computed from monthly climatologies obtained by omitting months with half or more of the latent heat flux data missing. There is practically no difference in the distribution of NWLf with and without energy balance closure correction, whereas NWL is generally lower when based on uncorrected fluxes. Furthermore, the uncertainty of the annual mean NWLf per site, given by 2σ (∼95 % confidence interval), is rather small with an average of ±0.15 %. When assuming a more conservative value of ρjk=0.1 in Eq. (1), the average uncertainty across sites increases to ±1.7 %.
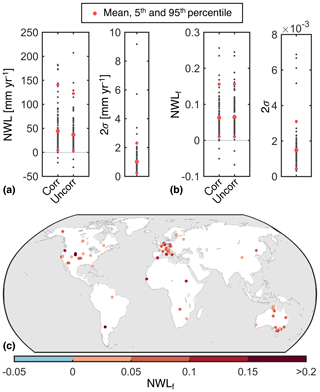
Figure 2Nocturnal water loss (NWL) at 99 FLUXNET sites as the annual NWL (a) and as the fraction of total evapotranspiration NWLf (b). Values from individual sites are shown in black, whereas the mean, 5th percentile, and 95th percentile are shown in red. Both energy-balance-corrected values (Corr) and uncorrected values (Uncorr) are shown. Uncertainty estimates are given by 2σ, which correspond to a confidence interval of approximately 95 %. The uncertainty of total ET is small and, therefore, neglected when computing the uncertainty of NWLf. (c) The location of sites with their estimated NWLf.
Interannual variability of NWLf, represented by the standard deviation, is 2.4 % on average from all of the sites. To analyze seasonality, we compute NWL for the trimesters of December–February (DJF), March–May (MAM), June–August (JJA), and September–November (SON) at all 81 sites located above 30∘ N, where seasonal differences are clearer, and for which data are available. The most common season with the highest NWL is winter (35.8 % of the sites) followed by autumn (25.9 %), summer (23.5 %), and spring (14.8 %); for the lowest NWL, in contrast, the most common season is summer (37 %) and the least common is autumn (13.6 %). Note that this is partly related to an increase in the total nocturnal hours as we go from summer to autumn and winter.
The variability in NWLf across sites cannot be easily explained by annual average climate conditions (temperature and precipitation) or land cover (Fig. 3). Nonetheless, deciduous broadleaf forests (DBFs) have an overall lower NWLf, whereas evergreen needleleaf forests (ENFs) include most cases with higher NWLf. An ANOVA test (differences in the mean) for the land cover categories has a p value of 0.038, and a Kruskal–Wallis test (differences in the distribution) has a p value of 0.055. The three sites with negative NWLf (dew is greater than nocturnal ET) are Hainich (Germany), Soroe (Sorø, Denmark), and Willow Creek (WI, USA). These are all DBFs with typically lower vapor pressure deficit and higher soil moisture than approximately 75 % of all of the other sites. Moreover, it may be more difficult to accurately measure EC latent heat flux at DBF sites with large trees that reduce the ground–atmosphere coupling. Conversely, there are six sites with a NWLf greater than 15 %: GLEES (WY, USA), GLEES Brooklyn tower (WY, USA), Niwot Ridge Forest (CO, USA), Lavarone (Italy), Wallaby Creek (Australia), and San Luis (Argentina). These are four ENFs, an evergreen broadleaf forest (EBF) and a mixed forest (MF) in mountainous areas. NWL during winter is approximately twice as much as NWL during summer at the four ENF sites. Snowier and windier conditions at these sites may suggest a considerable contribution of sublimation to NWL. The percentage of gap-filled data for these sites with relatively high or low NWL values is not particularly different than for all of the other sites.
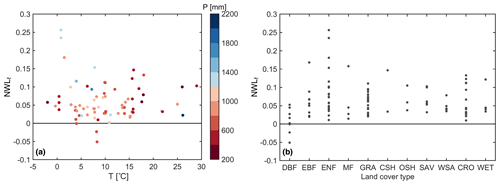
Figure 3Relation of NWLf with (a) the mean annual temperature (T) and precipitation (P) as well as with (b) land cover type at the FLUXNET sites. Precipitation and temperature data are available for 73 of the 99 FLUXNET sites. The land cover types are deciduous broadleaf forest (DBF), evergreen needleleaf forest (ENF), evergreen broadleaf forest (EBF), mixed forest (MF), grassland (GRA), closed shrubland (CSH), open shrubland (OSH), savanna (SAV), woody savanna (WSA), cropland (CRO), and wetland (WET).
At most sites there is a positive correlation of NWL with local air temperature (T), vapor pressure deficit (VPD), wind speed (WS), soil moisture (SM), and downward longwave radiation (LWd) for the 30 min non-gap-filled data (Fig. 4). Correlations with net radiation (Rn) and ground heat flux (G) are also positive on average, although smaller. As expected, higher incoming energy (LWd, Rn, and G), evaporative demand (T and VPD), aerodynamical conductance (related to WS) and water supply (related to SM) generally favor higher NWL. In addition, there is a tendency to have lower NWL (i.e., latent heat flux) when sensible heat flux (SH) is higher, which is consistent with the partitioning of available energy. However, Spearman correlations at the majority of sites are smaller than 0.3. Reasons for this may include confounding effects among the analyzed drivers of NWL, observational uncertainty, and a possible physiological control on nocturnal transpiration; for example, the relationship of VPD with NWL might not increase monotonically if stomatal conductance decreases when VPD is high. Although there is no clear dependency of the correlations on land cover, we note that croplands (some of them irrigated) often exhibit higher correlations with VPD and WS, whereas higher correlations with SM and LWd often correspond to short vegetation types. When analyzing data from summer months only, we find that correlations with VPD increase at forest sites, in particular in DBFs. Also, the four sites with the highest correlations with SM are located in southern Arizona, which is an arid zone.
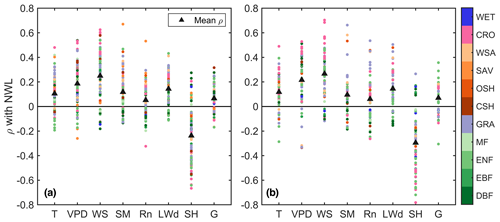
Figure 4Spearman correlation (ρ) of 30 min non-gap-filled nocturnal water loss (NWL) with air temperature (T), vapor pressure deficit (VPD), wind speed (WS), soil moisture (SM), net radiation (Rn), downward longwave radiation (LWd), sensible heat flux (SH), and ground heat flux (G) at the FLUXNET sites. Panel (a) is for all data and panel (b) is for summer months (JJA) at sites located above 30∘ N. Land cover types are deciduous broadleaf forest (DBF), evergreen needleleaf forest (ENF), evergreen broadleaf forest (EBF), mixed forest (MF), grassland (GRA), closed shrubland (CSH), open shrubland (OSH), savanna (SAV), woody savanna (WSA), cropland (CRO), and wetland (WET).
3.2 Climate model estimates of nocturnal water loss
The multi-model mean depicts an average NWLf of 7.9 % across all land grid cells excluding desert regions and Greenland (Fig. 5). The 5th percentile of the spatial distribution without deserts and Greenland is 1.8 %, and the 95th percentile is 13.2 %. In tropical regions NWLf is generally below the global average, although NWL can surpass 80 mm yr−1, e.g., in parts of the Amazon. Central and northern Europe, the USA, China, and India show similar regional averages of approximately 9 %. The models also suggest a high relevance of nocturnal water fluxes in Australia, with an average NWLf of 13.1 %, and in the Mediterranean, with an average NWLf of 12 %. In most of Greenland and parts of Egypt, the amount of dew or hoar frost is greater than the water lost through ET during the night. Interannual variability of NWLf, given by the standard deviation of the 30-year time series from the multi-model mean, is below 2 % on 95 % of land grid cells (excluding deserts and Greenland). Finally, we focus on the northern midlatitudes (30–60∘ N) to analyze seasonality. The multi-model mean indicates that autumn (SON) is the season with the highest NWL on average (50.4 % of grid cells), whereas the lowest NWL typically corresponds to winter (DJF; 73 % of grid cells).

Figure 5Map of multi-model mean NWLf (a) and NWL (b) on average over the period from 1976 to 2005. Desert regions and Greenland are masked in panel (a) due to division by small numbers.
There are large discrepancies in NWLf between the different climate models (Fig. 6). The 95th percentile of the model ensemble is higher than 15 % over most of the globe, whereas the 5th percentile even shows negative values (i.e., dew is greater than nocturnal ET) in parts of the tropics and at high latitudes. The central 90 % spread of the ensemble is larger than 10 % almost everywhere, and it is even greater than 20 % in southern South America, eastern Africa, India, and Australia. This means that some models simulate NWLf to be approximately zero at certain locations, whereas estimates from other models are higher than 20 %. Even though the model differences in NWLf can originate from differences in total ET (e.g., in India), we also find differences in NWL generally ranging from 50 to 150 mm yr−1 (see Fig. S1 in the Supplement).

Figure 6NWLf uncertainty within the climate model ensemble. (a) Map of the 95th percentile of the ensemble. (b) Map of the 5th percentile of the ensemble. Desert regions and Greenland are masked due to division by small numbers.
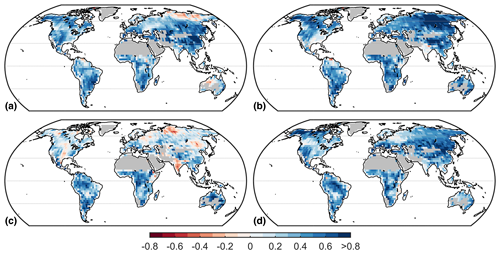
Figure 7Pearson correlation at each grid cell between the average NWL and the nocturnal near-surface air temperature of climate models. Data correspond to the period from 1976 to 2005 from historical simulations. Correlations are computed separately for each season: (a) December–February, (b) March–May, (c) June–August, and (d) September–November. Desert regions and Greenland are masked for consistency.
The complexity of CMIP5 models (and the fact that not all models are equally well documented) hinders a straightforward assessment of potential factors contributing to the large inter-model differences in NWL. Nonetheless, we find a positive relation of climatological NWL and nighttime near-surface air temperatures across models (Fig. 7), indicating that models with high temperatures also tend to simulate high NWL. This correlation is present throughout the world and during the different seasons, although it decreases substantially in the Northern Hemisphere during summer (JJA). Furthermore, we note that INM-CM4, EC-EARTH, NorESM1-M, and CNRM-CM5 are models with systematically low values of NWL throughout the globe, whereas GISS-E2-R, GISS-E2-H, and MIROC5 tend to simulate the highest values of NWL (see Fig. S2).

Figure 8Multi-model mean of projected changes in NWLf (a) and NWL (b) for the period from 2081 to 2100 relative to the period from 1976 to 2005. Desert regions and Greenland are masked in panel (a) due to division by small numbers.
Terrestrial NWLf is projected to increase towards the end of the century throughout the globe (Fig. 8). The average increase in the multi-model mean is 1.8 %, neglecting deserts and Greenland. While NWL is projected to increase almost everywhere, this is not the case for total ET. The increase in NWLf in the Amazon, Central America, southern Africa, and the Mediterranean is favored by a projected decrease in total ET. It is important to note that the spread of the model ensemble even reduces confidence in the sign of projected changes in NWL and total ET (Fig. S3). Lastly, we highlight the contribution of the nocturnal flux to projected changes in total ET. In more than half of all land grid cells, the projected change in NWL corresponds to 20 % or more of the absolute change in ET.
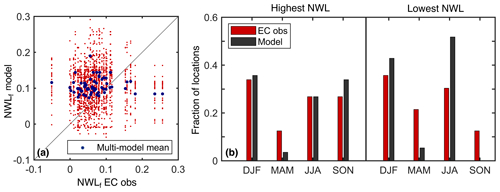
Figure 9Comparison of observations with climate model simulations at the corresponding grid cells. (a) NWLf from EC observations vs. model simulations at 64 locations. (b) Fraction of the 56 locations (i.e., FLUXNET sites or grid cells) above 30∘ N where each season has the highest or lowest NWL on average. Seasons are defined by the following trimesters: December–February (DJF), March–May (MAM), June–August (JJA), and September–November (SON).
3.3 Comparison of observed and simulated nocturnal water loss
We compare the site-level EC observations to model estimates from the corresponding grid cells, despite the large difference in spatial resolution. Modeled NWLf generally shows an overestimation, although there are a few exceptions (Fig. 9a) – the average from the considered grid cells is 10.6 %, whereas the observational average is 7 %. Note once again the large discrepancies between individual models with an average spread of 20.5 % across locations, which is calculated as the difference between the 97.5th percentile and 2.5th percentile. In contrast, the estimated 95 % confidence interval of the EC observations is ±0.15 % on average across sites. Interestingly, the multi-model mean has a smaller spread across sites than the observations. This is partly explained by strong local discrepancies between individual models causing little variability in the multi-model mean; nonetheless, it could also be related to smoothing of cross-site differences in the much coarser spatial resolution of the models. At locations above 30∘ N, where most stations are found and seasonal differences are clearer, the simulated seasonal behavior generally agrees well with that of the EC data (Fig. 9b, see also Fig. S4). However, there is a noteworthy overestimation of the cases where the multi-model mean shows the lowest NWL occurring in summer, which is compensated for by an underestimation in autumn and spring.
Our average estimate of net nocturnal water loss relative to total evapotranspiration from 99 FLUXNET sites is 6.3 %. This is smaller than reported values of around 10 %–25 % from published physiological studies (Zeppel et al., 2014). However, it is important to distinguish that our focus is on the net flux, i.e., evapotranspiration minus dew, whereas physiological studies refer only to transpiration. The results agree with the expectation of lower NWLf when dew is taken into account. In addition, we recall that nocturnal measurements at FLUXNET stations can be affected by low-turbulence conditions; therefore, gap-filled and energy-balance-corrected data are used in the analysis. Future work could aim to disentangle the distinct fluxes of transpiration, evaporation from soil and canopy, sublimation, and dew during the night.
We find that higher air temperature, vapor pressure deficit, wind speed, soil moisture, and downward longwave radiation tend to favor higher NWL, although the correlations are rather low. Similar results were reported by Groh et al. (2019) at two sites in Germany. In addition, Dawson et al. (2007) found clear positive relationships between these conditions and nocturnal sap flow in woody plant species from different ecosystems; however, nocturnal sap flow could occur with no NWL, e.g., for capacitance refilling. Meanwhile, Zeppel et al. (2014) point to plant functional type, ecosystem type, and biotic temporal characteristics, like leaf or stand age, as possible additional factors influencing NWL. Conversely, de Dios et al. (2015) found no temporal relation with vapor pressure deficit because of endogenous circadian regulation in an experiment with crops under controlled environmental conditions. Additionally, an increase in nocturnal sap flow and stomatal conductance was reported in two tree species under an increased atmospheric CO2 concentration, given sufficient soil moisture (Zeppel et al., 2011, 2012). Further research on the controls of NWL, in particular nocturnal transpiration, is required.
The climate model ensemble has an average NWLf of 7.9 % over land, which is slightly higher than the observational estimate. Moreover, the overestimation is greater when considering only grid cells that contain FLUXNET sites. These relatively high multi-model mean estimates of NWLf are surprising given the literature that suggests models underestimate nocturnal stomatal conductance (e.g., Lombardozzi et al., 2017; Zeppel et al., 2014). Note that increasing model nocturnal stomatal conductance would likely lead to even higher values of simulated NWLf. Thus, it is possible that even if the mean simulated magnitude of nocturnal water loss is relatively accurate, the underlying processes may be misrepresented.
Our analysis indicates strong discrepancies between individual models with respect to simulated NWLf, which are much larger than the spatial and interannual variability. These discrepancies are related to differences in the average nighttime temperature between models. Simulations that disentangle nocturnal transpiration, evaporation (sublimation) from soil and canopy, and dew would be highly relevant to study the inter-model differences. Note that differences in NWL can represent a substantial fraction of model differences in total ET. Furthermore, these biases could affect boundary layer evolution and precipitation timing in models. Inter-model uncertainty also reduces confidence in the direction of change in NWL under global warming, despite the multi-model mean showing a projected increase throughout the world.
In conclusion, our study provides a comprehensive global overview of NWL – defined as nocturnal evapotranspiration minus dew formation – from observations and climate models. The magnitude of this flux suggests it can be important for the surface energy and water balances and, therefore, relevant to consider in hydroclimate analyses. Future research about NWL focused on seasonal and shorter timescales could address its influence on climate impacts during extreme conditions (e.g., Duarte et al., 2016; Groh et al., 2019). Finally, ongoing development and expansion in sensing water and energy fluxes are expected to help address the uncertainties we have highlighted around NWL through continued research on this topic.
Table A1FLUXNET sites from the FLUXNET2015 dataset employed for the analysis. Included sites provide energy-balance-corrected measurements of latent heat flux during at least 3 years. The FLUXNET2015 “SITE_ID” is indicated here, whereas a full description of each site is available at https://fluxnet.fluxdata.org/sites/site-list-and-pages/ (last access: 13 February 2020). Additionally, the number of years of data and the average energy-balance-corrected NWLf for each site are provided.
The FLUXNET2015 Tier 1 dataset is available at https://fluxnet.fluxdata.org/data/fluxnet2015-dataset/ (FLUXNET, 2020). Table A1 indicates the specific sites considered for the analysis. The CMIP5 data used in this study are available at https://esgf-node.llnl.gov/projects/esgf-llnl/ (CMIP, 2020). Detailed inputs for the search query are as follows: model (see Table A2), experiment (Historical and RCP85), time frequency (3 h), ensemble (see Table A2), and variable (hfls and tas). Processed hourly data from the co-located lysimeter and EC tower at Rietholzbach, accompanying meteorological data, and scripts used for the analysis are available at https://doi.org/10.3929/ethz-b-000370968 (Padrón et al., 2019).
The supplement related to this article is available online at: https://doi.org/10.5194/hess-24-793-2020-supplement.
RSP, LG, and SIS conceived the idea and designed the study. SIS acquired the funding to carry out the research. DM collected and processed the co-located lysimeter and EC data from the Swiss site. RSP processed the FLUXNET2015 and CMIP5 data. RSP performed the analysis and wrote the paper with contributions from all authors. All authors discussed the results and read and reviewed the paper.
The authors declare that they have no conflict of interest.
We acknowledge partial support from the H2020 CRESCENDO project (grant agreement no. 641816), and from the European Research Council (ERC) DROUGHT-HEAT project funded by the European Community's Seventh Framework Programme (grant agreement no. FP7-IDEAS-ERC-617518). This work used eddy-covariance data acquired and shared by the FLUXNET community, including the following networks: AmeriFlux, AfriFlux, AsiaFlux, CarboAfrica, CarboEuropeIP, CarboItaly, CarboMont, ChinaFlux, Fluxnet-Canada, GreenGrass, ICOS, KoFlux, LBA, NECC, OzFlux-TERN, TCOS-Siberia, and USCCC. The ERA-Interim reanalysis data are provided by ECMWF and processed by LSCE. The FLUXNET eddy-covariance data processing and harmonization was carried out by the European Fluxes Database Cluster, the AmeriFlux Management Project, and the Fluxdata project of FLUXNET, with support from the CDIAC and ICOS Ecosystem Thematic Center, and the OzFlux, ChinaFlux, and AsiaFlux offices. We appreciate the substantial and exhaustive work carried out to provide best estimates of the fluxes in the FLUXNET2015 dataset. We acknowledge the World Climate Research Program's Working Group on Coupled Modelling, which is responsible for the Coupled Model Intercomparison Project (CMIP), and we thank the climate modeling groups for producing their model output and making it available. For CMIP, the US Department of Energy's Program for Climate Model Diagnosis and Intercomparison provides coordinating support and led development of the software infrastructure in partnership with the Global Organization for Earth System Science Portals. We thank Urs Beyerle for downloading the CMIP5 data.
This research has been supported by the European Research Council H2020 CRESCENDO (grant no. 641816) and FP7 Ideas DROUGHT-HEAT (grant no. 617518) programs.
This paper was edited by Stan Schymanski and reviewed by three anonymous referees.
Baldocchi, D. D.: Assessing the eddy covariance technique for evaluating carbon dioxide exchange rates of ecosystems: past, present and future, Glob. Change Biol., 9, 479–492, https://doi.org/10.1046/j.1365-2486.2003.00629.x, 2003.
Ball, J. T.: An Analysis of Stomatal Conductance, PhD Thesis, Stanford University, Stanford, CA, 1988.
Ball, J. T., Woodrow, I. E., and Berry, J. A.: A Model Predicting Stomatal Conductance and its Contribution to the Control of Photosynthesis under Different Environmental Conditions, in: Progress in Photosynthesis Research, edited by: Biggins, J., Springer Netherlands, Dordrecht, https://doi.org/10.1007/978-94-017-0519-6_48, 221–224, 1987.
Berkelhammer, M., Hu, J., Bailey, A., Noone, D. C., Still, C. J., Barnard, H., Gochis, D., Hsiao, G. S., Rahn, T., and Turnipseed, A.: The nocturnal water cycle in an open-canopy forest, J. Geophys. Res.-Atmos., 118, 10225–10242, https://doi.org/10.1002/jgrd.50701, 2013.
Betts, A. K., Ball, J. H., Beljaars, A. C. M., Miller, M. J., and Viterbo, P. A.: The land surface-atmosphere interaction: A review based on observational and global modeling perspectives, J. Geophys. Res.-Atmos., 101, 7209–7225, https://doi.org/10.1029/95JD02135, 1996.
Caird, M. A., Richards, J. H., and Donovan, L. A.: Nighttime stomatal conductance and transpiration in C3 and C4 plants, Plant Physiol., 143, 4–10, https://doi.org/10.1104/pp.106.092940, 2007.
Collatz, G. J., Ball, J. T., Grivet, C., and Berry, J. A.: Physiological and environmental regulation of stomatal conductance, photosynthesis and transpiration: a model that includes a laminar boundary layer, Agr. Forest Meteorol., 54, 107–136, https://doi.org/10.1016/0168-1923(91)90002-8, 1991.
Coupled Model Intercomparison Project (CMIP): CMIP5 Dataset, available at: https://esgf-node.llnl.gov/projects/esgf-llnl/, last access: 18 February 2020.
Daley, M. J. and Phillips, N. G.: Interspecific variation in nighttime transpiration and stomatal conductance in a mixed New England deciduous forest, Tree Physiol., 26, 411–419, https://doi.org/10.1093/treephys/26.4.411, 2006.
Dawson, T. E., Burgess, S. S. O., Tu, K. P., Oliveira, R. S., Santiago, L. S., Fisher, J. B., Simonin, K. A., and Ambrose, A. R.: Nighttime transpiration in woody plants from contrasting ecosystems, Tree Physiol., 27, 561–575, https://doi.org/10.1093/treephys/27.4.561, 2007.
de Dios, V. R., Roy, J., Ferrio, J. P., Alday, J. G., Landais, D., Milcu, A., and Gessler, A.: Processes driving nocturnal transpiration and implications for estimating land evapotranspiration., Sci. Rep.-UK, 5, 10975, https://doi.org/10.1038/srep10975, 2015.
Duarte, A. G., Katata, G., Hoshika, Y., Hossain, M., Kreuzwieser, J., Arneth, A., and Ruehr, N. K.: Immediate and potential long-term effects of consecutive heat waves on the photosynthetic performance and water balance in Douglas-fir, J. Plant Physiol., 205, 57–66, https://doi.org/10.1016/J.JPLPH.2016.08.012, 2016.
Duursma, R. A., Blackman, C. J., Lopéz, R., Martin-StPaul, N. K., Cochard, H., and Medlyn, B. E.: On the minimum leaf conductance: its role in models of plant water use, and ecological and environmental controls, New Phytol., 221, 693–705, https://doi.org/10.1111/nph.15395, 2019.
Ershadi, A., McCabe, M. F., Evans, J. P., Chaney, N. W., and Wood, E. F.: Multi-site evaluation of terrestrial evaporation models using FLUXNET data, Agr. Forest Meteorol., 187, 46–61, https://doi.org/10.1016/J.AGRFORMET.2013.11.008, 2014.
Fisher, J. B., Baldocchi, D. D., Misson, L., Dawson, T. E., and Goldstein, A. H.: What the towers don't see at night: nocturnal sap flow in trees and shrubs at two AmeriFlux sites in California, Tree Physiol., 27, 597–610, https://doi.org/10.1093/treephys/27.4.597, 2007.
Fisher, J. B., Melton, F., Middleton, E., Hain, C., Anderson, M., Allen, R., McCabe, M. F., Hook, S., Baldocchi, D., Townsend, P. A., Kilic, A., Tu, K., Miralles, D. D., Perret, J., Lagouarde, J.-P., Waliser, D., Purdy, A. J., French, A., Schimel, D., Famiglietti, J. S., Stephens, G., and Wood, E. F.: The future of evapotranspiration: Global requirements for ecosystem functioning, carbon and climate feedbacks, agricultural management, and water resources, Water Resour. Res., 53, 2618–2626, https://doi.org/10.1002/2016WR020175, 2017.
FLUXNET: FLUXNET2015 Dataset, available at: https://fluxnet.fluxdata.org/data/fluxnet2015-dataset/, last access: 18 February 2020.
Fratini, G. and Mauder, M.: Towards a consistent eddy-covariance processing: an intercomparison of EddyPro and TK3, Atmos. Meas. Tech., 7, 2273–2281, https://doi.org/10.5194/amt-7-2273-2014, 2014.
Groh, J., Slawitsch, V., Herndl, M., Graf, A., Vereecken, H., and Pütz, T.: Determining dew and hoar frost formation for a low mountain range and alpine grassland site by weighable lysimeter, J. Hydrol., 563, 372–381, https://doi.org/10.1016/J.JHYDROL.2018.06.009, 2018.
Groh, J., Pütz, T., Gerke, H. H., Vanderborght, J., and Vereecken, H.: Quantification and Prediction of Nighttime Evapotranspiration for Two Distinct Grassland Ecosystems, Water Resour. Res., 55, WR024072, https://doi.org/10.1029/2018WR024072, 2019.
Hirschi, M., Michel, D., Lehner, I., and Seneviratne, S. I.: A site-level comparison of lysimeter and eddy covariance flux measurements of evapotranspiration, Hydrol. Earth Syst. Sci., 21, 1809–1825, https://doi.org/10.5194/hess-21-1809-2017, 2017.
Jacobs, A. F. G., Heusinkveld, B. G., Kruit, R. J. W., and Berkowicz, S. M.: Contribution of dew to the water budget of a grassland area in the Netherlands, Water Resour. Res., 42, W03415, https://doi.org/10.1029/2005WR004055, 2006.
Leuning, R.: A critical appraisal of a combined stomatal-photosynthesis model for C3 plants, Plant Cell Environ., 18, 339–355, https://doi.org/10.1111/j.1365-3040.1995.tb00370.x, 1995.
LI-COR Biosciences: Eddy Covariance Processing Software (Version 6.2.2) [Software], available at: https://www.licor.com/EddyPro (last access: 14 February 2020), 2018.
Lombardozzi, D. L., Zeppel, M. J. B., Fisher, R. A., and Tawfik, A.: Representing nighttime and minimum conductance in CLM4.5: global hydrology and carbon sensitivity analysis using observational constraints, Geosci. Model Dev., 10, 321–331, https://doi.org/10.5194/gmd-10-321-2017, 2017.
Medlyn, B. E., Duursma, R. A., Eamus, D., Ellsworth, D. S., Prentice, I. C., Barton, C. V. M., Crous, K. Y., De Angelis, P., Freeman, M., and Wingate, L.: Reconciling the optimal and empirical approaches to modelling stomatal conductance, Glob. Change Biol., 17, 2134–2144, https://doi.org/10.1111/j.1365-2486.2010.02375.x, 2011.
Moffat, A. M., Papale, D., Reichstein, M., Hollinger, D. Y., Richardson, A. D., Barr, A. G., Beckstein, C., Braswell, B. H., Churkina, G., Desai, A. R., Falge, E., Gove, J. H., Heimann, M., Hui, D., Jarvis, A. J., Kattge, J., Noormets, A., and Stauch, V. J.: Comprehensive comparison of gap-filling techniques for eddy covariance net carbon fluxes, Agr. Forest Meteorol., 147, 209–232, https://doi.org/10.1016/J.AGRFORMET.2007.08.011, 2007.
Monteith, J. L.: Evaporation and environment, Symp. Soc. Exp. Biol., 19, 205–234, 1965.
Monteith, J. L. and Unsworth, M. H.: Principles of Environmental Physics, Arnold, London, UK, xii, p. 291, 1990.
Moss, R. H., Edmonds, J. A., Hibbard, K. A., Manning, M. R., Rose, S. K., van Vuuren, D. P., Carter, T. R., Emori, S., Kainuma, M., Kram, T., Meehl, G. A., Mitchell, J. F. B., Nakicenovic, N., Riahi, K., Smith, S. J., Stouffer, R. J., Thomson, A. M., Weyant, J. P., and Wilbanks, T. J.: The next generation of scenarios for climate change research and assessment, Nature, 463, 747–756, https://doi.org/10.1038/nature08823, 2010.
Novick, K. A., Oren, R., Stoy, P. C., Siqueira, M. B. S., and Katul, G. G.: Nocturnal evapotranspiration in eddy-covariance records from three co-located ecosystems in the Southeastern U.S.: Implications for annual fluxes, Agr. Forest Meteorol., 149, 1491–1504, https://doi.org/10.1016/j.agrformet.2009.04.005, 2009.
Padrón, R. S., Gudmundsson, L., Michel, D., and Seneviratne, S. I.: Data for the article “Terrestrial Water Loss at Night: Global Relevance from Observations and Climate Models, https://doi.org/10.3929/ethz-b-000370968, 2019.
Pastorello, G. Z., Agarwal, D. A., Papale, D., Samak, T., Trotta, C., Ribeca, A., Poindexter, C. M., Faybishenko, B., Gunter, D. K., Hollowgrass, R., Canfora, E.: Observational Data Patterns for Time Series Data Quality Assessment, Proc. 10th IEEE International Conference on e-Science (e-Science'2014), Sao Paulo, 271–278, https://doi.org/10.1109/eScience.2014.45, 2014.
Penman, H. L.: Natural evaporation from open water, bare soil and grass, Philos. T. R. Soc. A, 193, 120–145, 1948.
Peters, A., Nehls, T., Schonsky, H., and Wessolek, G.: Separating precipitation and evapotranspiration from noise – a new filter routine for high-resolution lysimeter data, Hydrol. Earth Syst. Sci., 18, 1189–1198, https://doi.org/10.5194/hess-18-1189-2014, 2014.
Peters, A., Nehls, T., and Wessolek, G.: Technical note: Improving the AWAT filter with interpolation schemes for advanced processing of high resolution data, Hydrol. Earth Syst. Sci., 20, 2309–2315, https://doi.org/10.5194/hess-20-2309-2016, 2016.
Peters, A., Groh, J., Schrader, F., Durner, W., Vereecken, H., and Pütz, T.: Towards an unbiased filter routine to determine precipitation and evapotranspiration from high precision lysimeter measurements, J. Hydrol., 549, 731–740, https://doi.org/10.1016/J.JHYDROL.2017.04.015, 2017.
Reichstein, M., Falge, E., Baldocchi, D., Papale, D., Aubinet, M., Berbigier, P., Bernhofer, C., Buchmann, N., Gilmanov, T., Granier, A., Grunwald, T., Havrankova, K., Ilvesniemi, H., Janous, D., Knohl, A., Laurila, T., Lohila, A., Loustau, D., Matteucci, G., Meyers, T., Miglietta, F., Ourcival, J.-M., Pumpanen, J., Rambal, S., Rotenberg, E., Sanz, M., Tenhunen, J., Seufert, G., Vaccari, F., Vesala, T., Yakir, D., and Valentini, R.: On the separation of net ecosystem exchange into assimilation and ecosystem respiration: review and improved algorithm, Glob. Change Biol., 11, 1424–1439, https://doi.org/10.1111/j.1365-2486.2005.001002.x, 2005.
Ruth, C. E., Michel, D., Hirschi, M., and Seneviratne, S. I.: Comparative Study of a Long-Established Large Weighing Lysimeter and a State-of-the-Art Mini-lysimeter, Vadose Zone J., 17, 170026, https://doi.org/10.2136/vzj2017.01.0026, 2018.
Sellers, P. J., Randall, D. A., Collatz, G. J., Berry, J. A., Field, C. B., Dazlich, D. A., Zhang, C., Collelo, G. D., Bounoua, L., Sellers, P. J., Randall, D. A., Collatz, G. J., Berry, J. A., Field, C. B., Dazlich, D. A., Zhang, C., Collelo, G. D., and Bounoua, L.: A Revised Land Surface Parameterization (SiB2) for Atmospheric GCMS. Part I: Model Formulation, J. Clim., 9, 676–705, https://doi.org/10.1175/1520-0442(1996)009<0676:ARLSPF>2.0.CO;2, 1996.
Seneviratne, S. I., Lehner, I., Gurtz, J., Teuling, A. J., Lang, H., Moser, U., Grebner, D., Menzel, L., Schroff, K., Vitvar, T., and Zappa, M.: Swiss prealpine Rietholzbach research catchment and lysimeter: 32 year time series and 2003 drought event, Water Resour. Res., 48, W06526, https://doi.org/10.1029/2011WR011749, 2012.
Snyder, K. A., Richards, J. H., and Donovan, L. A.: Night-time conductance in C3 and C4 species: do plants lose water at night?, J. Exp. Bot., 54, 861–865, https://doi.org/10.1093/jxb/erg082, 2003.
Vinukollu, R. K., Wood, E. F., Ferguson, C. R., and Fisher, J. B.: Global estimates of evapotranspiration for climate studies using multi-sensor remote sensing data: Evaluation of three process-based approaches, Remote Sens. Environ., 115, 801–823, https://doi.org/10.1016/J.RSE.2010.11.006, 2011.
Wutzler, T., Lucas-Moffat, A., Migliavacca, M., Knauer, J., Sickel, K., Šigut, L., Menzer, O., and Reichstein, M.: Basic and extensible post-processing of eddy covariance flux data with REddyProc, Biogeosciences, 15, 5015–5030, https://doi.org/10.5194/bg-15-5015-2018, 2018.
Zeppel, M. J. B., Lewis, J. D., Medlyn, B., Barton, C. V. M., Duursma, R. A., Eamus, D., Adams, M. A., Phillips, N., Ellsworth, D. S., Forster, M. A. and Tissue, D. T.: Interactive effects of elevated CO2 and drought on nocturnal water fluxes in Eucalyptus saligna, Tree Physiol., 31, 932–944, https://doi.org/10.1093/treephys/tpr024, 2011.
Zeppel, M. J. B., Lewis, J. D., Chaszar, B., Smith, R. A., Medlyn, B. E., Huxman, T. E., and Tissue, D. T.: Nocturnal stomatal conductance responses to rising [CO2], temperature and drought, New Phytol., 193, 929–938, https://doi.org/10.1111/j.1469-8137.2011.03993.x, 2012.
Zeppel, M. J. B., Lewis, J. D., Phillips, N. G., and Tissue, D. T.: Consequences of nocturnal water loss: a synthesis of regulating factors and implications for capacitance, embolism and use in models, Tree Physiol., 34, 1047–1055, https://doi.org/10.1093/treephys/tpu089, 2014.
Zhang, K., Kimball, J. S., Nemani, R. R., Running, S. W., Hong, Y., Gourley, J. J., and Yu, Z.: Vegetation Greening and Climate Change Promote Multidecadal Rises of Global Land Evapotranspiration, Sci. Rep.-UK, 5, 15956, https://doi.org/10.1038/srep15956, 2015.


