the Creative Commons Attribution 4.0 License.
the Creative Commons Attribution 4.0 License.
Evaporation from a large lowland reservoir – (dis)agreement between evaporation models from hourly to decadal timescales
Femke A. Jansen
Adriaan J. Teuling
Accurate monitoring and prediction of surface evaporation become more crucial for adequate water management in a changing climate. Given the distinct differences between characteristics of a land surface and a water body, evaporation from water bodies requires a different parameterization in hydrological models. Here we compare six commonly used evaporation methods that are sensitive to different drivers of evaporation, brought about by a different choice of parameterization. We characterize the (dis)agreement between the methods at various temporal scales ranging from hourly to 10-yearly periods, and we evaluate how this reflects in differences in simulated water losses through evaporation of Lake IJssel in the Netherlands. At smaller timescales the methods correlate less (r=0.72) than at larger timescales (r=0.97). The disagreement at the hourly timescale results in distinct diurnal cycles of simulated evaporation for each method. Although the methods agree more at larger timescales (i.e. yearly and 10-yearly), there are still large differences in the projected evaporation trends, showing a positive trend to a more (i.e. Penman, De Bruin–Keijman, Makkink, and Hargreaves) or lesser extent (i.e. Granger–Hedstrom and FLake). The resulting discrepancy between the methods in simulated water losses of the Lake IJssel region due to evaporation ranges from −4 mm (Granger–Hedstrom) to −94 mm (Penman) between the methods. This difference emphasizes the importance and consequence of the evaporation method selection for water managers in their decision making.
- Article
(4330 KB) - Full-text XML
- BibTeX
- EndNote
Surface evaporation is the second largest component (after precipitation) of the global hydrological cycle, and it couples the Earth's water and energy cycle (Beer et al., 2018). This hydrological cycle is projected to intensify in the future as a consequence of global warming (Huntington, 2006; Oki and Kanae, 2006; Jung et al., 2010). This intensification will result in higher and more extreme precipitation and enhanced surface evaporation, which can threaten our drinking water resources and increase the vulnerability of natural ecosystems and agricultural production (Arnell, 1999; Vörösmarty, 2000; Middelkoop et al., 2001; Verburg and Hecky, 2009; Trenberth et al., 2014). To avoid or alleviate negative consequences of droughts and floods and to guarantee ample access to high-quality freshwater resources, an efficient water management system is required. In a changing climate, the ability to accurately monitor and predict surface evaporation therefore becomes even more crucial for adequate water management. However, there can be considerable uncertainty even in the signs of hydrological projections depending on model parameterization or structure (Melsen et al., 2018). This becomes particularly important in densely populated and hydrologically sensitive areas such as the low-lying Netherlands.
The Netherlands is an example of a region for which many studies have been dedicated to a better understanding of the processes driving the terrestrial part of surface evaporation, including forested, agricultural, and urban areas (de Bruin and Lablans, 1998; Dolman et al., 1998; Elbers et al., 2010; Vermeulen et al., 2015; Teuling, 2018). Resulting from the differences in surface characteristics, the dynamics of surface evaporation, as well as its sensitivity to different atmospheric drivers, will differ over various land use types. For forests, Moors (2012) found that surface evaporation is mainly driven by the vapour pressure deficit (VPD). In contrast, surface evaporation over grasslands is typically driven by available energy through radiation, with little to no sensitivity to VPD (Makkink, 1957). This direct relation between net radiation and surface evaporation was also found by Beljaars and Bosveld (1997) for the grassland area around Cabauw, the Netherlands. For urban areas, Jacobs et al. (2015) found a clear negative relation between observed surface evaporation and days since the last precipitation event. This can be attributed to the almost immediate drying of the fast impermeable surfaces, suggesting urban environments are strongly water-limited. In the case of open water bodies wind speed was found to be the most important driver of evaporation according to Granger and Hedstrom (2011). Despite the fact that water bodies comprise a large share of the total area in the Netherlands (∼17 %, Huisman, 1998) and therefore form a crucial element in our water management system, in the past only a few studies in the Netherlands focussed on open water evaporation (Keijman and Koopmans, 1973; de Bruin and Keijman, 1979; Abdelrady et al., 2016; Solcerova et al., 2019), and few observations of open water evaporation are available.
Water surfaces have different surface properties than land surfaces, which leads to a difference in behaviour of the turbulent exchange, which can be seen from the main drivers of this exchange, namely the temperature and vapour pressure gradient (see Fig. 1). One important difference is that solar radiation is able to penetrate a water surface, in contrast to a land surface, which is not transparent. Therefore the energy balance is not preserved at the water surface, which entails heat storage in the water body. As a consequence of this thermal inertia, it was found that on shorter timescales the turbulent fluxes are not directly coupled to global radiation and that the diurnal cycle of turbulent fluxes is smaller (Kleidon and Renner, 2017) and shifted in time compared to land surfaces (Venäläinen et al., 1999; Blanken et al., 2011). Blanken et al. (2000) found, similarly to Granger and Hedstrom (2011), a relation between evaporation and the product of horizontal wind and vapour pressure gradient on daily timescales. In contrast, Nordbo et al. (2011) found the vapour pressure deficit alone to be more strongly correlated with evaporation rather than the product of wind and vapour pressure deficit. On intraseasonal timescales, Lenters et al. (2005) found evaporation to be a function of the thermal lag between temperatures of air and water. Resulting from the difference in properties and consequently its behaviour, the simulation of evaporation from lakes requires a different parameterization than land surface evaporation in current traditional hydrological models, and with that accounting for the relevant driving processes at the timescale of interest.
To illustrate the difference between open water evaporation and evaporation above land surfaces, we used observations from a short measurement campaign. During this measurement campaign in August/September 1967 the vertical gradients of vapour pressure and temperature were measured at the water surface and at 2 and 4 m above the former Lake Flevo (Wieringa, 2019). It is assumed that the sign of these gradients can be used as a proxy for the sign of the turbulent exchange between the surface and the atmosphere. This proxy is used because there are no direct measurements available of open water evaporation (Ewater) during the 1967 measurement campaign. To analyse the difference between turbulent exchange above land surface and open water, the observations of this measurement campaign above Lake Flevo were compared to observations conducted above a grassland in Cabauw. The results show distinct differences despite the similar behaviour of global radiation, which is generally regarded as the main driver of evaporation. It demonstrates that both the temperature and vapour pressure gradients above the lake are positive throughout most of the day and night. This refers to unstable situations which become strongest during the night when the air cools faster than the water surface. The continuous positive gradient of vapour pressure above the lake indicates that evaporation continues during the night, which is in contrast to what is found above land. Another distinct difference between land and lake surfaces can be found in the timing of the peak of the temperature and vapour pressure gradients, which are a few hours earlier above land than over the lake. From this experiment it directly becomes clear that we can distinguish a difference in behaviour of the turbulent exchange above land compared to over a lake, which therefore should be acknowledged in hydrological models.
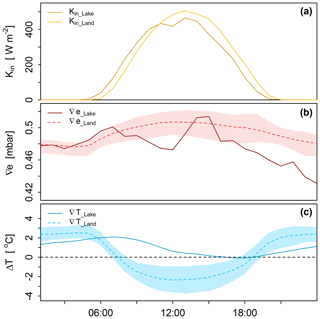
Figure 1Illustration of the mean diurnal cycle of turbulent exchange over land compared to open water. Lake data are obtained above Lake Flevo during the Flevo experiment in August/September 1967. Data above land originate from observations in Cabauw and are based on 10 August/September months of consecutive years (2009–2018): the solid line represents the average and the shaded bands represent the range in these 10 years. The top panel presents the diurnal cycle of global radiation (a). The middle and bottom panels display the vertical gradients of vapour pressure and temperature for the lake and land surface (b and c, respectively).
Given the importance of open-water evaporation in short-term prediction and long-term projection, the process should be parameterized realistically in operational hydrological models. Depending on the parameterization strategy of a model to capture the process of evaporation at the relevant timescale, different decisions are made to parameterize evaporation. In the past, most studies have focussed on the parameterization of open-water evaporation on weekly or even longer timescales (Finch, 2001; Zhan et al., 2019), where often potential evapotranspiration (PET) is improperly used as a proxy for lake evaporation neglecting heat storage (La, 2015; Duan and Bastiaanssen, 2017). However, parameterizations at the hourly and daily timescales have remained underexplored. The effect of the parameterization strategy on the short-term prediction and long-term projection of evaporation can likely lead to profound differences in model results and therefore in (local) water management decisions. Our aim therefore is to study the effects of various parameterizations of evaporation on shorter-term local water management and to investigate how these parameterization decisions affect long-term hydrologic projections. To this end, we compare to what extent six commonly used evaporation parameterizations (dis)agree at various temporal scales and look at the impact of the different methods under projected climate change.
2.1 Evaporation methods
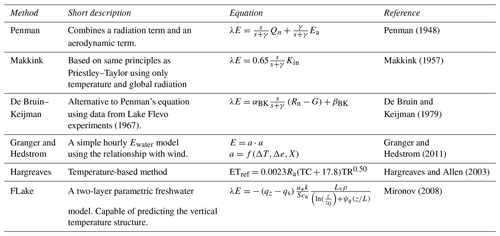
There is a wide variety of methods that are used to estimate evaporation from water bodies. They can be subdivided into five major types of approach, namely the pan method, water balance method, energy budget approaches, bulk transfer models, and combination methods (Finch and Calver, 2008; Abtew and Melesse, 2013). In this study, we will systematically compare six methods that are commonly used to estimate surface evaporation and that are sensitive to different forcings (Table 1; see Table A1b for explanations of all the variables).
The Penman method (Penman, 1948) has been chosen because it was originally developed for wet surfaces and because it is the most commonly used method globally to estimate evaporation. The method developed by de Bruin and Keijman (1979) finds its origin in Penman's method, but has been based on observations done at Lake Flevo, the Netherlands, which we will focus on in this study as well (see Sect. 2.2). Makkink's method (Makkink, 1957) is an even more simplified derivation of Penman's equation and is currently used in operational hydrological models in the Netherlands, which is why it is included in our comparison. To be able to compare it to methods that use other types of forcing, the methods of Granger and Hedstrom (2011), using wind speed as the main forcing, and the Hargreaves (1975) method, using solely air temperature, are incorporated. To also include a more physically based method, FLake (Mironov, 2008) is used in this study. Below we will give a short description of the models that are used, and in Appendix A a more detailed description is given of the methods, including the assumptions that are made, and the input data that are needed for them (see Table A1).
2.1.1 Penman
The Penman method is a combination equation and is based on the two fundamental factors that determine evaporation, namely, available energy and atmospheric demand (see Table 1). The effect of these factors combined is captured by the turbulent transfer and energy balance equations for a wet surface (Brutsaert, 1982; Tanny et al., 2008; Moene and van Dam, 2014). Starting from the energy balance principle combined with the flux-gradient approach, the following form of Penman's equation is derived:
in which s is the slope of the saturated vapour pressure curve, γ the psychrometric constant, Rn the net radiation, G the water heat flux, ρ air density, cp the specific heat of air, ra the aerodynamic resistance, and (esat−ea) the vapour pressure deficit of the air. In Penman's derivation, it was assumed that the available energy (Qn) is equal to the net radiation, assuming other terms of the energy budget equation into the water body to be negligible, e.g. the water heat flux. This flux is difficult to measure, especially at smaller timescales, and is therefore often ignored (van Emmerik et al., 2013). However, for water bodies it is essential to account for heat storage changes as its storage capacity is significantly larger compared to land surfaces. Not accounting for heat storage changes can lead to (i) overestimation of Ewater in spring (Northern Hemisphere) when incoming radiation is used to warm up the water body instead of immediate release through Ewater and (ii) underestimation of Ewater during autumn (Northern Hemisphere) when additional heat that was stored in the water body is released through Ewater. The Penman equation requires standard meteorological variables (net radiation, air temperature, wind speed, and humidity) at one height.
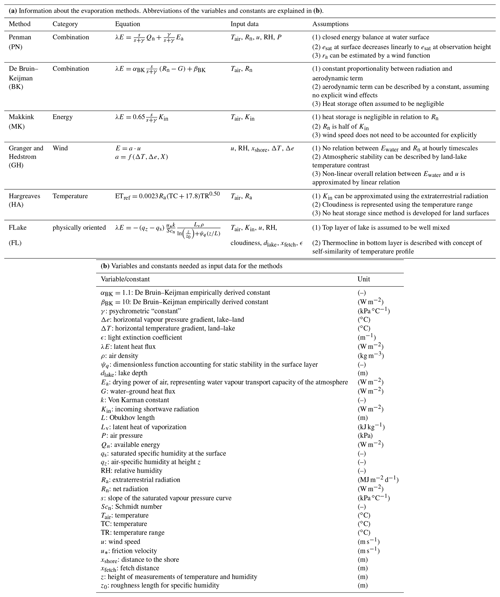
Penman (1948)Makkink (1957)Hargreaves and Allen (2003)Mironov (2008)Table 1Methods used to calculate open water evaporation. Explanations of all the variables can be found in Table A1(b).
2.1.2 De Bruin–Keijman
A similar expression to determine reference evaporation was proposed by de Bruin and Keijman (1979). They applied the Priestley–Taylor method to the former Lake Flevo in the Netherlands. The Priestley–Taylor method is a derivation of Penman's method where the aerodynamic term in Penman's equation was found to be a constant proportion of the radiation term (Priestley and Taylor, 1972). de Bruin and Keijman (1979) adjusted this empirical relation to determine evaporation, namely, that the aerodynamic term is linearly proportional to the radiation term with an additional constant added to that. These two parameters were found to vary during the year, but they are mostly taken as constants.
2.1.3 Makkink
Another method that is based on Priestley–Taylor is the method of Makkink, which was developed for grassland areas in summertime in the Netherlands (Makkink, 1957). It only requires observations of global radiation and temperature, since it assumes that the water heat flux can be neglected with respect to net radiation and that net radiation is about half of global radiation. The first assumption is only valid for land surfaces, and the second assumption considers average summers in the Netherlands. Makkink is currently used in operational hydrological models in the Netherlands and is applied to open water using a correction factor.
2.1.4 Granger–Hedstrom
None of the methods described above includes wind explicitly, although wind speed is recognized as an important driving factor for evaporation. Granger and Hedstrom (2011) found the most significant correlation to exist between Ewater and wind speed at hourly timescales, and no direct relation was found with net radiation. The authors developed a simple model to quantify Ewater in which the key variables and parameters are wind speed, land–water contrasts in temperature and humidity, and downwind distance from the shore.
2.1.5 Hargreaves
The Hargreaves method is an example of a simple and highly empirical temperature-based model (Hargreaves, 1975; Hargreaves and Allen, 2003). Global surface radiation is frequently not readily available; therefore, the Hargreaves method uses the extra-terrestrial radiation, which depends on the angle between the direction of solar rays and the axis perpendicular to the atmosphere's surface, to simulate its seasonality. Furthermore, it incorporates the range in maximum and minimum temperatures as a proxy to estimate the level of cloudiness. The method was originally designed for land surfaces at longer temporal scales and does not account for lake heat storage. However, previous studies have also shown that temperature-based models can perform reasonably well over lake surfaces at larger timescales (Rosenberry et al., 2007).
2.1.6 FLake
A more physically oriented model is FLake, which has been developed by Mironov (2008). This one-dimensional freshwater model is designed to simulate the vertical temperature structure and the energy budget of a lake. It consists of an upper mixed layer, of which the temperature is assumed to be uniform, and an underlying stratified layer of which the curve is parameterized using the concept of self-similarity (assumed shape) (Kitaigorodskii and Miropolskii, 1970). The same concept is used to represent the thermal structure of the ice and snow cover and of the thermally active layer of the bottom sediments.
2.2 Study area
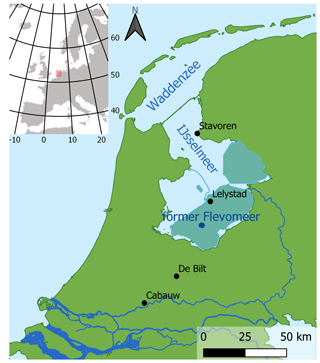
This research study focusses on the IJsselmeer, also referred to as Lake IJssel, which is the largest freshwater lake in the Netherlands, bordering the provinces of Flevoland, Friesland, and Noord-Holland. In the north Lake IJssel is closed off from the Waddenzee by the Afsluitdijk embankment and in the south-west by the Houtribdijk embankment. The lake receives its freshwater supply (∼340 m3 s−1) from the IJssel River and from the neighbouring polder systems, whereas the main outflow of the lake occurs at the sluices of the Afsluitdijk under gravity. Covering an area of 1100 km2 with an average depth of 5.5 m, Lake IJssel can be considered a large shallow lake. The lake has an important hydrological function in the low-lying Netherlands in both flood prevention and freshwater supply for agricultural and drinking water purposes.
2.3 Data input sources
The models were forced with observed historical hourly data (1960–2018), as well as with simulated 3-hourly future climate projections (2019–2100), resulting from a regional climate model (RCM). In this study we systematically compare the models; therefore, we chose to give preference to a long-term dataset of observed meteorological variables above land, rather than a shorter-term dataset of the same variables in closer proximity to Lake IJssel. Following from this, we used the long-term hourly meteorological data observed in De Bilt, the Netherlands, situated at approximately 50 km distance, rather than using the stations nearby in Stavoren or Lelystad. The latter stations have only measured all needed variables since the end of 2002, and in Stavoren air pressure was never measured, while in De Bilt all variables required for the models have been measured since 1960. We compared the stations of Stavoren and Lelystad to station De Bilt. This showed that temperature, relative humidity, air pressure, and global radiation are comparable, while the wind speed is lower in De Bilt compared to Stavoren and Lelystad. However, there is no substantial difference in the daily cycle and frequency distribution of wind speed between the locations (not shown).
Depending on each evaporation model (see Table A1), data that were used from station De Bilt include air temperature (Tair), global radiation (Kin), air pressure (P), wind speed (u), wind direction, relative humidity (RH), and cloud cover. Furthermore, water surface temperature (WST) is required as a variable in the Granger–Hedstrom model as well as to calculate outgoing longwave radiation. WST is not operationally measured at a regular base in the Netherlands; however, the Dutch water authority (RWS) has measured hourly water temperature at a depth of about 1 m in Lake IJssel since 2014. Another source of WST measurements is an experiment done in 1967 (Keijman and Koopmans, 1973; Wieringa, 2019) in the former Lake Flevo before that part of Lake IJssel was reclaimed. This experiment includes 4 weeks of data of amongst others WST, average water temperature, and Tair and vapour pressure at 2 and 4 m height. Furthermore, FLake generates WST simulations as well. Remotely sensed satellite products inferring WST were not considered because of its low temporal resolution, but will be used in upcoming studies to infer the spatio-temporal distribution of Ewater. Comparing the different sources (not shown) and considering the availability of the data, we have chosen to use the FLake simulations of WST for further analysis.
To quantify the (dis)agreement between the models in the long-term projection of Ewater, we used climate projections generated with the RCM RACMO2 (van Meijgaard et al., 2008) driven by global climate model (GCM) EC-EARTH 2.3 (Hazeleger et al., 2012). This long-term simulation covers the period 1950–2100 and consists of 16 ensemble members at a spatial resolution of 0.11∘ (∼12 km) available at 3-hourly time steps (Aalbers et al., 2017). Each member of the ensemble has a slightly different atmospheric initial state perturbed in 1850, and the members can thus be considered independent realizations. EC-EARTH was forced with historical emissions until 2005 and future projections (2006–2100) were generated using a substantial greenhouse gas emission scenario (RCP8.5). We used a grid cell representing location De Bilt. Direct evaporation observations from an eddy-covariance instrument at 10 min time resolution made in Cabauw, the Netherlands, from 1986 to 2018 (Beljaars and Bosveld, 1997) are used to validate the climate change signal of E.
2.4 Diurnal cycle
Methods that are sensitive to different types of forcings show a distinct diurnal signal of simulated evaporation. A wide variety of evaporation methods use Kin as a driving force to simulate the diurnal cycle of evaporation, partly because Kin affects temperature, vapour pressure deficit (VPD), and wind speed, which are all driving forces of evaporation. Therefore, an analysis of the diurnal signals and possible phase shift of these variables provides information on how these driving forces relate to each other and to the simulated evaporation.
We depict the diurnal cycle as function of time for 1 specific day where no clouds were present, as well as for the average diurnal cycle for the period 1960–2018 using data from De Bilt, the Netherlands (see Fig. 2 and Sect. 2.3). Another way that we will use to analyse and illustrate the diurnal cycle and the relation to other evaporation methods is to plot evaporation as a function of Kin similarly to Renner et al. (2019). When this cycle appears as a hysteresis loop, it indicates a phase difference between the addressed variable and Kin. The size of the loop quantifies the magnitude of the phase lag, and the direction of the loop denotes whether the phase lag is negative or positive. The method of Hargreaves will be omitted in these diurnal cycle analyses. This method requires a temperature maximum and minimum (see Appendix A) over the considered time period. Therefore, it is not possible to calculate hourly simulated evaporation for this method with the given hourly observations of temperature.
2.5 Long-term trends
To explore how evaporation has been changing in the last decades (1960–2018) and how it is projected to change in the future (2019–2100) in a changing climate, we will force the methods with historical observations and simulated future projections of meteorological variables resulting from regional climate model RACMO, for which the spatial grid cell of the RACMO model is used that represents the location of De Bilt (Sect. 2.3). The trend of the yearly averaged simulated evaporation rates will be detected based on weighted local regression, using the LOcally WEighted Scatter-plot Smoother (LOWESS) method (Cleveland, 1979). This method is applied to the observational data for the historical period and to the average of the 16 RACMO members (Sect. 2.3) for the future period. Mean and standard deviation are calculated using the average of the RACMO members, where the standard deviation is calculated based on the de-trended time series.
2.6 Model (dis)agreement
A difference in sensitivity of the methods to drivers of evaporation can help to explain the (dis)agreement found in the behaviour of simulated evaporation. To compare this sensitivity a perturbation of 1 % will be imposed one by one on the daily observational data from De Bilt of four key variables, namely air temperature, solar radiation, wind speed, and vapour pressure, without changing the other variables. For this, the percentage difference of simulated evaporation with perturbation of one of the variables to the simulation of the baseline situation without any perturbation will be calculated.
The correlations between the simulated evaporation using the different methods and various meteorological variables using data from De Bilt will be calculated based on Pearson's parametric correlation method, measuring the linear dependency between two variables. We will calculate the correlations for all the timescales ranging from hourly to 10-yearly periods, all based on hourly data. To ensure that the number of data points in the calculation does not influence the results, we will apply bootstrapping to artificially create the same number of data points for each timescale.
3.1 Simulation of the diurnal cycle
The diurnal signals of several meteorological variables and simulated and observed evaporation are depicted in Fig. 3. The solid lines are the results from a sunny day without any clouds in March 2016, while the dotted lines reflect the average diurnal cycles. It can be seen that net radiation (Rn) peaks between 13:00 and 14:00 LT, which coincides with the peaks of evaporation simulated using the radiation-based methods, i.e. Penman (PN), de Bruin–Keijman (BK), and Makkink (MK). The peaks of these radiation-based methods are simulated 2 h later than the observed evaporation peak in Cabauw. Simulated evaporation becomes negative during the night following net radiation in the cases of the PN and BK methods. However, this is not realistic given the fact that the energy balance is not preserved at the water surface, which is assumed by these methods, and the energy released from heat stored in the water can exceed the net radiation at night. This will drive both a positive evaporation and sensible heat flux. Evaporation simulated with the wind-driven Granger–Hedstrom (GH) method is damped relative to the radiation-based methods, and it is rather constant throughout the day, with a small peak following the signal of the wind speed. The signal of evaporation resulting from FLake (FL) is damped as well, and its peak lags 2 h behind relative to Rn, induced by a combination of Kin, wind speed, and Tair. The total average diurnal evaporation is significantly lower than for the radiation-based methods. This can be explained by the remaining heat storage term of the energy balance in FL, which is used to warm up the water. This heat storage capacity is explicitly accounted for in FL. Hargreaves' temperature-based method (HA) is not depicted in the graph because the method does not allow us to calculate evaporation at hourly timescales given the available data (see Sect. 2.4). The diurnal range of the water temperature (Twater) is small but shows a distinct peak 4 h lagging behind the peak of Rn, which indicates that during the day heat is stored in the water, which partly is released back during the night. The dotted line illustrating the average diurnal cycle of Twater was artificially lowered by 7.5 ∘C in this graph, merely to show its diurnal course and the timing of the peak.
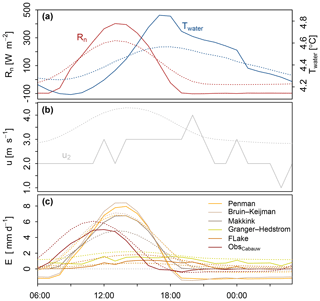
Figure 3Illustration of the diurnal response of simulated evaporation. (a) Diurnal cycle of net radiation and water temperature (b) of wind speed and (c) of the different evaporation methods. Solid lines represent a sunny day in March 2016, while the dotted lines indicate the average diurnal cycle based on the years 1960–2018, and for observed values in Cabauw this is based on the years 1986–1997 and 2001–2018. The dotted line was lowered by 7.5 ∘C to facilitate comparison of its dynamics to the cycle of the single sunny day.
Figure 4 illustrates the diurnal cycle of the (a) latent heat flux, (b) vapour pressure, and (c) temperature, which are plotted as a function of Kin for a sunny day without any clouds in March 2007. It can be seen that evaporation simulated using the MK method is almost in phase with Kin (phase lag is 7 min), which may be expected from a method that uses Kin as the main driving force of evaporation. The largest phase lag (=114 min) results from the simulation with FL; this can be explained by the fact that this method explicitly accounts for heat storage changes, resulting in a less direct response of evaporation to Kin. The analysis of diurnal patterns thus shows that Kin explains most of the variance in evaporation for methods PN, BK, and MK. However, the methods that incorporate WST (method GH) and heat storage capacity (FL) as explaining variables show less variation in evaporation during the day and therefore do not relate directly to Kin.

Figure 4Phase differences of evaporation variables in response to global radiation, illustrating latent heat flux (a), vapour pressure (b), and temperature (c) responses to global radiation. Differences are calculated for one day in March 2007. The legend displays the daily phase lag in minutes. The directions of all hysteresis loops are anti-clockwise, indicating a positive phase lag with respect to global radiation, except for the two loops that have a clockwise direction indicated by a black arrow.
Air temperature shows a pronounced anti-clockwise (ACW) loop when plotted as a function of global radiation, which indicates that heat is stored in the lower part of the atmospheric boundary layer. However, the water surface temperature shows very little response to Kin. This combination leads to another distinct hysteresis loop of the driving force of sensible heat flux, namely, the gradient Ts−Ta, which has a clockwise (CW) direction. This implies that the latent heat flux is preceded by the sensible heat flux. The vapour pressure is rather constant throughout the day and does not display a clear hysteresis loop. However, the saturated vapour pressure, which is a function of Tair, displays pronounced ACW hysteresis. As a result, VPD also has a large ACW hysteresis loop, which is the key driver of E in the PN method.
Following the analyses of the diurnal cycle the occurrence of storage and release of heat in the water body are demonstrated through the diurnal cycle of Twater and should therefore be accounted for by an evaporation method. FL is the method that mimics this thermal inertia effect most clearly in its diurnal cycle, which is also supported through its phase lag to Kin. This makes the FL method the most realistic method to use at this timescale.
3.2 Long-term simulations and projections
For each method the simulated evaporation rates based either on observations in De Bilt or on RACMO realizations are shown in Fig. 5 for the historical (1960–2018) and future (2019–2100) periods (note that the values on the y axes differ). The grey lines indicate the 16 realizations of the RCM RACMO members, while the black line is the simulation resulting from observational data measured in De Bilt. The dotted blue line represents the trend of this black line. Following the positive trend of evaporation as was observed in Cabauw (red line in the lowest panel), all the methods, except for the GH method, also simulate a positive trend in the historical time period when using observations from De Bilt (black line). Apart from methods GH, HA, and FL, the RACMO realizations resulting from the RCM simulations also show positive trends in the historical period. However, these trends are not as strong as the trends resulting from the simulations which use observations from De Bilt. For the future period these RACMO realizations have a stronger positive trend compared to the historical period for all the methods, again except for GH and FL. This implies that the RACMO simulations do not always agree with the simulations which are based on observations; however, they do demonstrate the differences between the six methods regarding predicted future trends.
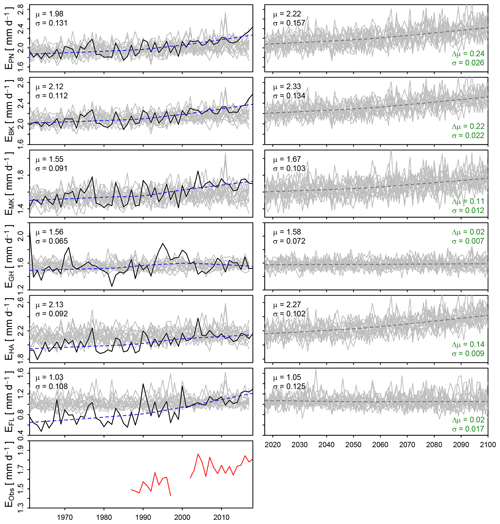
Figure 5Trends of simulated evaporation for the historical and future periods. Black line indicates yearly averaged simulated historical evaporation rates based on data from De Bilt. The dotted blue line represents the trend in this line. The grey lines indicate the yearly averaged simulations from RACMO climate projections. Mean and standard deviation of the RACMO simulations are given in each panel in black. The differences of these statistics between the historical and future periods are given in green. In the lowest panel the yearly averaged observed evaporation at meteorological site Cabauw is presented in red.
The results from the GH and FL methods differ from the other methods in the sense that the RACMO realizations do not result in a significant trend in either the simulated historical or projected future periods, while in the historical period the simulation based on observations presents a positive trend when using the FL method. The latter can be explained by the fact that the FL method is most sensitive to Kin, Tair, and wind speed, of which for both Kin and wind speed the RACMO realizations do not show any trend (not shown here). The mismatch in the historical period for FL between the simulations based on observations and the simulations based on RACMO realizations can be attributed to the inability of RACMO to capture the trend in Kin. This inability will also influence the simulations made by the radiation-based models, which implies that for these methods simulated trends in the future period are likely to be stronger than demonstrated in Fig. 5. This will lead to even larger disagreement of simulated evaporation between the six methods.
Comparison between the methods of the overall positive trend that is projected to continue in the future period reveals that not only the average simulated evaporation of all RACMO members (μ) will increase in the future for all the methods, ranging from an increase of 0.02 mm d−1 (GH and FL) to 0.24 mm d−1 (PN), but also that the variability (σ) is projected to increase (see Fig. 5). This is also demonstrated in Fig. 6 for both the historical (orange) and future (blue) periods. Here the spread is defined as the difference between the yearly average maximum and minimum values of the 16 RACMO members based on daily evaporation rates. For each method the average and the spread are projected to increase in the future; however, the rates at which this happens differ significantly between the methods. The largest difference in spread can be found between the GH method, which has a spread of 0.32 mm d−1, and the PN method with a spread of 0.69 mm d−1 in the historical period, and increases to a range that varies from 0.36 mm d−1 (GH) to 0.94 mm d−1 (PN) in the future period. The methods that resemble each other most, and differ least in spread, are the PN and BK methods during both the historical and future periods.
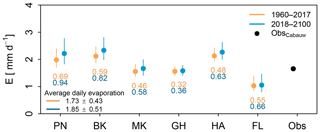
Figure 6Impact of parameterization on mean current and future evaporation. Coloured dots indicate the mean of all RACMO members for each method for both the historical and future periods. Coloured numbers below each method indicate the spread within the method. Here spread within the methods is defined as the difference between the average maximum and minimum values of all RACMO members for both periods, based on yearly average daily evaporation rates (see Fig. 5). The black dot represents the averaged observed evaporation in Cabauw over the period 1986–2017.
3.3 Model (dis)agreement at various timescales
Figure 7 displays the difference in percentage of simulated evaporation with the baseline situation without any perturbation. The upper and lower sets of panels depict the same information arranged per variable or per method, respectively. Most of the methods show the largest sensitivity to Tair and Kin. The purely temperature-driven HA method is only sensitive Tair. The wind-driven GH method is the method most sensitive to wind (1% difference), which is expected, but FL is also sensitive to wind, showing a difference of 0.5 % compared to the baseline situation without any perturbation. This implies that the behaviour of these models would start to deviate more from the other methods if for instance the wind speed regime were to change in the future. In general FL is the most sensitive method, and therefore this method will start to differentiate more from the other methods when these four meteorological variables were to change in the future.
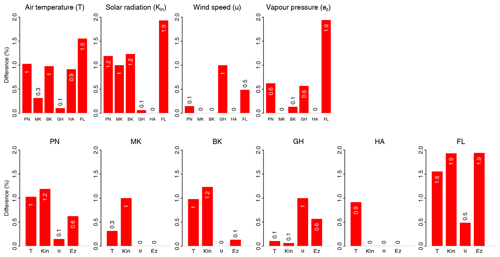
Figure 7Sensitivity of simulated evaporation to meteorological drivers. This effect is expressed as the percentual difference between a perturbed simulation and the baseline as indicated by the white numbers plotted in the bars (rounded to one decimal). Upper set of panels arranged per variable. The lower set of panels displays the same information but clustered per method.
Figure 8 displays to what extent the evaporation methods and four meteorological variables correlate at (a) hourly, (b) daily, (c) weekly, (d) monthly, (e) yearly, and (f) 10-yearly timescales based on data from De Bilt. The colours indicate the direction and magnitude of the correlations. From our data the HA method can only be calculated at a daily timescale or coarser, hence the empty boxes at the hourly timescale. It becomes apparent that at hourly timescales there is a positive correlation between wind and simulated E ranging from 0.12 for the MK method to 0.84 for the GH method. At larger timescales, this correlation becomes negative, except for the wind-driven GH method, and for FL it remains positive until a daily timescale. At the two largest timescales considered here (Fig. 8e and f), the correlation with wind increases again, but these are statistically insignificant except for the GH method. The correlation between net radiation and simulated E remains high at all timescales, except for the GH method. The latter method shows low correlations with the other methods and most meteorological variables, which mostly become statistically insignificant (indicated by the numbers in grey) from weekly timescales and larger. The correlation between net radiation and E simulated using FL increases steadily from 0.63 to 0.94 with an increasing timescale. Regarding the correlation between E and Tair, and E and VPD, the matrices show that the correlations increase steadily for all evaporation methods, again with the exception of the GH method. However, it should be noticed that there is a dip in the correlation at yearly timescales. Furthermore, the correlation between the meteorological variables Rn, Tair, and VPD was found to increase with an increasing timescale.
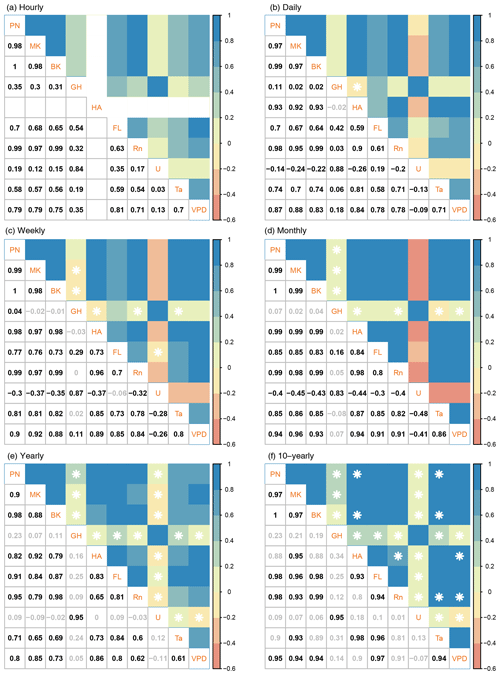
Figure 8Correlation between simulated evaporation and meteorological variables at different timescales. Correlations are shown for (a) hourly, (b) daily, (c) weekly, (d) monthly, (e) yearly, and (f) 10-yearly timescales. The colours indicate the sign and strength of the correlation. A white star and the corresponding grey number mark insignificant correlations (α=0.01).
The radiation-based methods agree highly with each other, as can be expected, over the entire range of timescales, with correlation values above 0.9. The GH method deviates most in terms of correlation from the other methods, which could be attributed to the difference in sensitivity to wind speed. The HA method shows the largest increase in agreement with the radiation-based methods with increasing timescales. This can be attributed to the increasing correlation between temperature and net radiation, which are the main driving forces of the HA and the radiation-based methods, respectively. Comparing the average correlations between the models for each timescale reveals that the correlation increases with increasing timescale from 0.72 at an hourly timescale to 0.97 at a 10-yearly timescale. This increase implies that the methods on average tend to agree more with each other at coarser timescales, which means that at smaller timescales the consequence of model choice becomes more apparent. The average correlation at the daily timescale is lowered mainly as a consequence of the low correlations of the GH method with the radiation-based methods. It should be noted that insignificant values were not incorporated in the calculation of the average correlations.
In Fig. 9 the correlations (r) between simulated evaporation and VPD, Tair, and Rn, respectively, are depicted to further explore the (dis)agreement between the methods over the range of timescales. This correlation has been calculated based on observational data from De Bilt. In general there is a high correlation (r>0.75) between simulated E and VPD, which increases with increasing timescales, up to a correlation of 0.97 at the 10-yearly timescale. However, there is a small drop at the yearly timescale, which is also visible in Fig. 8. We were not able to determine the exact cause of this, but it could be a result of cross-correlation in the data. The GH method deviates in behaviour compared to the other five methods, since it is the only method that does not explicitly include Tair, and with that VPD through the saturated vapour pressure, which is a function of temperature. The GH method only includes a temperature gradient, which is determined using water temperature resultant from the FL model and air temperature from De Bilt, as additional information to wind speed. The correlation between simulated E and Tair increases from 0.57 at the hourly timescale up to 0.98 at the 10-yearly timescale, again with a small drop at the yearly timescale. Furthermore, similar to the correlation with VPD, the GH method again demonstrates a different behaviour compared to the other methods. There is a strong increase in the correlation at the yearly and 10-yearly timescales for this method, which could be related to a change in the sign to positive values for the correlation between wind speed and Tair at these timescales (see Fig. 8). The correlations with Rn demonstrate clearly the resemblance between the radiation-based methods PN, BK, and MK. The HA method shows similar correlations as well, except for the largest two timescales where the correlation is lower. The FL method correlates better with Rn with increasing timescales, confirming that at small timescales Rn is not a direct driver of E as a result of heat storage. The correlation between Rn and E simulated by the GH method is close to zero for daily timescales and larger. However, at the hourly timescale the correlation is 0.32. This corresponds to the larger correlation between wind speed and Rn at this timescale.
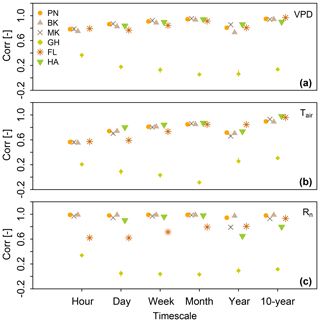
Figure 9(Dis)agreement between simulated evaporation and meteorological forcings at different timescales. This correlation is shown for VPD (a), Tair (b), and Rn (c).
The general increase in the correlations with the meteorological variables that was found with increasing timescales implies that ultimately these variables act as driving forces of potential evaporation. However, at the shorter timescales some of these methods may fail because the wrong controlling variables are used to simulate actual evaporation. This is especially the case for methods that use Rn as a driver of evaporation and that omit the effect of thermal inertia as a result of heat storage.
3.4 Implications for water resource management
Table 3 presents for several years the water loss through evaporation expressed as water depths in millimetres for the Lake IJssel region. Meteorological data from De Bilt were used to force the evaporation methods, and although there likely will be variation in the spatial distribution of the evaporation rate over the lake, until now it is unknown to which degree this variation exists. The following results thus will merely show the difference between the methods rather than the spatial distribution when applied to the Lake IJssel region. For this we considered 2 average years (1986 and 2009) and the 2 dry years (1976 and 2003). For the years 2000 and 2100 projected evaporation was based on the 16 RACMO members. During average years the water level of Lake IJssel would decrease by 649 mm on average as a result of evaporation only; in the case it would not be compensated by incoming fluxes through precipitation (P) and water supply by rivers (Qriver). Except for evaporation other sources of output are the discharge of water towards the surrounding provinces (Qprov) for agricultural purposes and discharge to the Waddenzee (QWad) for water-level regulations. Values of these annual inputs and outputs are obtained from operational LHM model simulations (De Lange et al., 2014) and are used as a reference only (see Table 2).
Table 2Average annual inputs and outputs for the Lake IJssel region in millimetres. Values are obtained from operational LHM model simulations. Note that Qriver can be much smaller during dry summer periods.

Table 3Water losses through evaporation for the Lake IJssel region under different conditions. Water losses are expressed as water depths in millimetres.
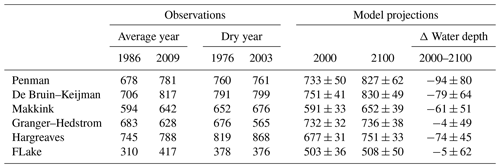
Large differences were found between the evaporation methods in terms of the amount of water losses through evaporation annually. The HA method and FL are at both ends of the spectrum, where HA simulates the largest losses through evaporation (745 mm), while FL simulates less than half of that (310 mm) in 1986. During dry years the total water loss through evaporation increases to on average 677 mm, but within a specific year, e.g. 2003, it ranges from 868 mm using the HA method to 376 mm using FL to simulate evaporation. Due to the large differences in simulated evaporation between the various methods, the result of the simulated water balance of the lake could be positive or negative. This means that based on the method used to simulate evaporation, the water managers would make different decisions on whether to stop the water inlet to the surrounding land for agricultural purposes or not, for instance, or whether more or less water needs to be discharged to the Waddenzee to keep the level of the Lake IJssel region within a safe range. And because there are no direct operational measurements of evaporation available in the Lake IJssel region, this stresses even more that the knowledge of the discrepancy between the methods is of great importance for water managers in their decision making.
Based on the results of the RACMO realizations, it is demonstrated that the discrepancy between the methods is projected to increase from the years 2000 to 2100. The radiation-based and temperature methods show a growing water loss through evaporation, while for GH and FL the water loss remains similar. All the methods show increasing evaporation rates leading to lower water availability in the region, where the change in mean water depth from the years 2000 to 2100 ranges from −4 mm (GH) to −94 mm (PN). This means that when water managers rely on the PN method rather than on the GH method for instance, they will have to decide for instance to supply less water to the surrounding agricultural land.
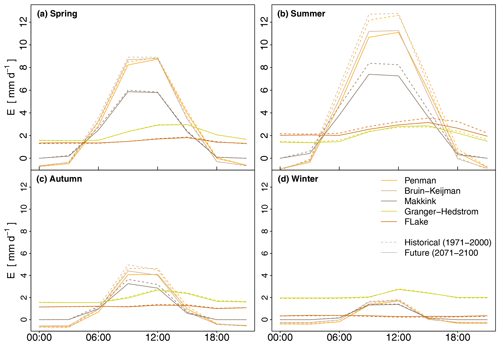
The effect of the projected changes in evaporation in the future was found to be largest in summer (Fig. 10), which coincides with the period that has the highest evaporation rates. This summer period is therefore most critical regarding water resource management, also considering the fact that more extreme periods of drought are expected to occur more frequently. During summer, evaporation is thus projected to increase, and at the same time it is likely that with increasing temperatures the river discharge from the IJssel will decrease (Görgen et al., 2010). So less water will be available during summer, while the water demand from the surrounding land surfaces will increase for agricultural purposes. Therefore, the trade-offs that water managers need to make become very precarious, especially knowing that their decision is based on a certain chosen method that can differ significantly from another method in total predicted evaporation.
The aim of this study was to explore the effect of various conceptualizations of evaporation on shorter-term local water management and long-term hydrologic projections. We focussed on timescales ranging from hourly to 10-yearly periods, where we have (i) elaborated on the differences found in the diurnal cycle but also (ii) quantified the (dis)agreement between the methods over the range of timescales in terms of correlations. And moreover, we studied how the evaporation rates according to the various methods are projected to change in the future.
Our study characterized that there is a large effect of the type of forcing that is used by the evaporation method, especially on the simulated diurnal cycle. This difference is reflected in the total average daily evaporation, the timing of the evaporation peak, and the day–night cycle. The methods that use the radiation approach (PN, BK, and MK) follow the diurnal cycle of the net radiation, where MK becomes zero at night, and PN and BK negative. The simulated evaporation resulting from the GH and FL methods is more constant throughout the day, and on average they show a continuation of evaporation during the night. Data of Twater demonstrated heat storage during the day and release of heat during the night. FL is the method that mimics this effect of thermal inertia most clearly in its diurnal cycle. This makes the FL method the most realistic method to use at this timescale. At larger timescales we found a disagreement between the methods in the trend of yearly averaged daily evaporation rates for both the historical (1960–2018) and future (2019–2100) periods. Although both the average and the variability of all methods are projected to increase in the future, the rate at which this happens differs significantly between the methods. The average evaporation rate increase ranges from 0.02 mm d−1 (GH and FL) to 0.24 mm d−1 (PN).
A discrepancy at the whole range of evaluated timescales, from hourly to 10-yearly, is especially present between the radiation and temperature methods (PN, BK, MK, and HA) and the wind-driven (GH) and physically based lake (FL) methods. However, this disagreement generally decreases with an increasing timescale, which is to be expected considering that ultimately evaporation is constrained by the energy input in the system and the transport of water vapour. However, the difference at yearly timescales is still significant. The difference between the methods at yearly timescales is also demonstrated when the total yearly water losses through evaporation for Lake IJssel are calculated. For an average year this can range between 417 mm (FL) and 817 mm (BK). During a sensitive dry year this discrepancy can result in water levels being simulated to either rise or drop, solely depending on the evaporation method that is used. When considering future simulations, the projected change in mean water losses through evaporation, expressed as water depths, ranges from −4 mm (GH) to −94 mm (PN) when comparing the years 2000 to 2100. This means that when water managers would rely on the PN method rather than on the GH method, they might have to decide to supply less water to the surrounding land in the future. Therefore, owing to the disagreement between the methods, it reveals that the choice of method is of great importance for water managers in their decision making. To gain confidence in which method is most reliable to use, now and in the future, we suggest performing long-term direct observations of Ewater at high temporal resolution. This will help to improve optimal parameterization of Ewater in hydrological models.
Meteorological forcing data from De Bilt are available through https://www.knmi.nl/nederland-nu/klimatologie/uurgegevens (KNMI, 2020), climate projections from regional climate model RACMO2 are generated and archived by the Royal Netherlands Meteorological Institute (KNMI) (van Meijgaard et al., 2008) and meteorological forcing data from Cabauw are available upon request at the KNMI (http://www.cesar-database.nl/, last access: 12 December 2019; CESAR, 2018), water temperature data were obtained from https://waterinfo.rws.nl/#!/kaart/watertemperatuur/ (last access: 27 February 2020) (Rijkswaterstaat, 2020), and measurement data from the field campaign at Lake Flevo in 1967 are available upon request at the KNMI (https://www.knmi.nl/home, contact person: Fred Bosveld) (Wieringa, 2019).
FAJ and AJT designed the study. FAJ carried out the study, analysed the data, and wrote the manuscript. AJT contributed to the writing and the interpretation of the results.
The authors declare that they have no conflict of interest.
The authors would like to thank Bart J. J. M. van den Hurk and Ruud T. W. L. Hurkmans for their discussions of the results and Jon Wieringa for digging up the data of the Flevo experiment which he conducted with colleagues in 1967.
This research has been supported by the Dutch Research Council (NWO) (grant no. ALWTW.2016.049).
This paper was edited by Nunzio Romano and reviewed by one anonymous referee.
Aalbers, E. E., Lenderink, G., van Meijgaard, E., and van den Hurk, B. J. J. M.: Local-Scale Changes in Mean and Heavy Precipitation in Western Europe, Climate Change or Internal Variability?, Clim. Dynam., 50, 4745–4766, https://doi.org/10.1007/s00382-017-3901-9, 2017. a
Abdelrady, A. R., Timmermans, J., Vekerdy, Z., and Salama, M. S.: Surface Energy Balance of Fresh and Saline Waters: AquaSEBS, Remote Sens., 8, 583, https://doi.org/10.3390/rs8070583, 2016. a
Abtew, W. and Melesse, A. M.: Evaporation and Evapotranspiration: Measurements and Estimations, Springer Netherlands, 2013. a
Arnell, N. W.: Climate Change and Global Water Resources, Global Environ. Change, 9, S31–S49, https://doi.org/10.1016/S0959-3780(99)00017-5, 1999. a
Beer, T., Li, J., and Alverson, K.: Global Change and Future Earth: The Geoscience Perspective, Cambridge University Press, Cambridge, 2018. a
Beljaars, A. C. M. and Bosveld, F. C.: Cabauw Data for the Validation of Land Surface Parameterization Schemes, J. Climate, 10, 1172–1193, https://doi.org/10.1175/1520-0442(1997)010<1172:CDFTVO>2.0.CO;2, 1997. a, b
Blanken, P. D., Rouse, W. R., Culf, A. D., Spence, C., Boudreau, L. D., Jasper, J. N., Kochtubajda, B., Schertzer, W. M., Marsh, P., and Verseghy, D.: Eddy Covariance Measurements of Evaporation from Great Slave Lake, Northwest Territories, Canada, Water Resou. Res., 36, 1069–1077, https://doi.org/10.1029/1999WR900338, 2000. a
Blanken, P. D., Spence, C., Hedstrom, N., and Lenters, J. D.: Evaporation from Lake Superior: 1. Physical Controls and Processes, J. Great Lakes Res., 37, 707–716, https://doi.org/10.1016/j.jglr.2011.08.009, 2011. a
Brutsaert, W.: Evaporation into the Atmosphere: Theory, History and Applications, Springer Netherlands, 1982. a
CESAR: Cabauw experimental site for atmospheric research, available at: http://www.cesar-database.nl/ (last access: 12 December 2019), 2018. a
Cleveland, W. S.: Robust Locally Weighted Regression and Smoothing Scatterplots, J. Am. Stat. Assoc., 74, 829–836, https://doi.org/10.1080/01621459.1979.10481038, 1979. a
de Bruin, H. A. R. and Keijman, J. Q.: The Priestley–Taylor Evaporation Model Applied to a Large Shallow Lake in The Netherlands, J. Appl. Meteorol., 18, 898–903, 1979. a, b, c, d
de Bruin, H. A. R. and Lablans, W. N.: Reference Crop Evapotranspiration Determined with a Modified Makkink Equation, Hydrol. Process., 12, 1053–1062, https://doi.org/10.1002/(SICI)1099-1085(19980615)12:7<1053::AID-HYP639>3.0.CO;2-E, 1998. a
De Lange, W. J., Prinsen, G. F., Hoogewoud, J. C., Veldhuizen, A. A., Verkaik, J., Oude Essink, G. H. P., van Walsum, P. E. V., Delsman, J. R., Hunink, J. C., Massop, H. T. L., and Kroon, T.: An Operational, Multi-Scale, Multi-Model System for Consensus-Based, Integrated Water Management and Policy Analysis: The Netherlands Hydrological Instrument, Environ. Model. Softw., 59, 98–108, https://doi.org/10.1016/j.envsoft.2014.05.009, 2014. a
Dolman, A. J., Moors, E. J., Elbers, J. A., and Snijders, W.: Evaporation and Surface Conductance of Three Temperate Forests in the Netherlands, Annales des sciences forestières, 55, 255–270, 1998. a
Duan, Z. and Bastiaanssen, W. G. M.: Evaluation of Three Energy Balance-Based Evaporation Models for Estimating Monthly Evaporation for Five Lakes Using Derived Heat Storage Changes from a Hysteresis Model, Environ. Res. Lett., 12, 024005, https://doi.org/10.1088/1748-9326/aa568e, 2017. a
Elbers, J., Moors, E., and Jacobs, C.: Gemeten Actuele Verdamping Voor Twaalf Locaties in Nederland, Alterra-rapport 1920, Alterra, Wageningen, 36 pp., 2017. a
Finch, J. W.: A Comparison between Measured and Modelled Open Water Evaporation from a Reservoir in South-East England, Hydrol. Process., 15, 2771–2778, https://doi.org/10.1002/hyp.267, 2001. a
Finch, J. W. and Calver, A.: Methods for the Quantification of Evaporation from Lakes, World Meteorological Organisation's Commission for Hydrology, NERC/Centre for Ecology & Hydrology, Wallingford, UK, 47 pp., 2008. a
Görgen, K., Beersma, J., Brahmer, G., Buiteveld, H., Carambia, M., de Keizer, O., Krahe, P., Nilson, E., Lammersen, R., Perrin, C., and Volken, D.: Assessment of Climate Change Impacts on Discharge in the Rhine River Basin: Results of the RheinBlick2050 Project, no. 23 in CHR Report 1, Secretariat CHR/KHR, Lelystad, 2010. a
Granger, R. J. and Hedstrom, N.: Modelling Hourly Rates of Evaporation from Small Lakes, Hydrol. Earth Syst. Sci., 15, 267–277, https://doi.org/10.5194/hess-15-267-2011, 2011. a, b, c, d
Hargreaves, G. H.: Moisture Availability and Crop Production, T. ASAE, 18, 0980–0984, https://doi.org/10.13031/2013.36722, 1975. a, b
Hargreaves, G. H. and Allen, R. G.: History and Evaluation of Hargreaves Evapotranspiration Equation, J. Irrig. Drain. Eng., 129, 53–63, https://doi.org/10.1061/(ASCE)0733-9437(2003)129:1(53), 2003. a, b
Hazeleger, W., Wang, X., Severijns, C., Ştefănescu, S., Bintanja, R., Sterl, A., Wyser, K., Semmler, T., Yang, S., van den Hurk, B., van Noije, T., van der Linden, E., and van der Wiel, K.: EC-Earth V2.2: Description and Validation of a New Seamless Earth System Prediction Model, Clim. Dynam., 39, 2611–2629, https://doi.org/10.1007/s00382-011-1228-5, 2012. a
Huisman, P.: Water in the Netherlands, no. 3 in NHV-Special, Netherlands Institute of Applied Geoscience, Delft, 1998. a
Huntington, T. G.: Evidence for Intensification of the Global Water Cycle: Review and Synthesis, J. Hydrol., 319, 83–95, https://doi.org/10.1016/j.jhydrol.2005.07.003, 2006. a
Jacobs, C., Elbers, J., Brolsma, R., Hartogensis, O., Moors, E., Rodríguez-Carretero Márquez, M. T., and van Hove, B.: Assessment of Evaporative Water Loss from Dutch Cities, Build. Environ., 83, 27–38, https://doi.org/10.1016/j.buildenv.2014.07.005, 2015. a
Jung, M., Reichstein, M., Ciais, P., Seneviratne, S. I., Sheffield, J., Goulden, M. L., Bonan, G., Cescatti, A., Chen, J., de Jeu, R., Dolman, A. J., Eugster, W., Gerten, D., Gianelle, D., Gobron, N., Heinke, J., Kimball, J., Law, B. E., Montagnani, L., Mu, Q., Mueller, B., Oleson, K., Papale, D., Richardson, A. D., Roupsard, O., Running, S., Tomelleri, E., Viovy, N., Weber, U., Williams, C., Wood, E., Zaehle, S., and Zhang, K.: Recent Decline in the Global Land Evapotranspiration Trend Due to Limited Moisture Supply, Nature, 467, 951–954, https://doi.org/10.1038/nature09396, 2010. a
Keijman, J. Q. and Koopmans, R. W. R.: A Comparison of Several Methods of Estimating the Evaporation of Lake Flevo, Int. Assoc. Hydrol. Sci. Publ., 109, 225–232, 1973. a, b
Kitaigorodskii, S. A. and Miropolskii, Y. Z.: On the Theory of the Open Ocean Active Layer, Izv. Atmos. Ocean. Phys., 6, 97–102, 1970. a
Kleidon, A. and Renner, M.: An Explanation for the Different Climate Sensitivities of Land and Ocean Surfaces Based on the Diurnal Cycle, Earth Syst. Dynam., 8, 849–864, https://doi.org/10.5194/esd-8-849-2017, 2017. a
KNMI: Uurgegevens van het weer in Nederland, available at: https://www.knmi.nl/nederland-nu/klimatologie/uurgegevens, last access: 2 March 2020. a
La, Z.: Quantifying Evaporation and Its Decadal Change for Lake Nam Co, Central Tibetan Plateau, AGU Fall Meeting Abstracts, 23, GC23L-1256, 2015. a
Lenters, J. D., Kratz, T. K., and Bowser, C. J.: Effects of Climate Variability on Lake Evaporation: Results from a Long-Term Energy Budget Study of Sparkling Lake, Northern Wisconsin (USA), J. Hydrol., 308, 168–195, https://doi.org/10.1016/j.jhydrol.2004.10.028, 2005. a
Makkink, G. F.: Testing the Penman Formula by Means of Lysimeters, J. Inst. Water Eng., 11, 277–288, 1957. a, b, c, d
Melsen, L. A., Addor, N., Mizukami, N., Newman, A. J., Torfs, P. J. J. F., Clark, M. P., Uijlenhoet, R., and Teuling, A. J.: Mapping (Dis)Agreement in Hydrologic Projections, Hydrol. Earth Syst. Sci., 22, 1775–1791, https://doi.org/10.5194/hess-22-1775-2018, 2018. a
Middelkoop, H., Daamen, K., Gellens, D., Grabs, W., Kwadijk, J. C. J., Lang, H., Schulla, J., and Wilke, K.: Impact of Climate Change on Hydrological Regimes and Water Resources Management in the Rhine Basin, Climatic Change, 49, 105–128, 2001. a
Mironov, D. V.: Parameterization of Lakes in Numerical Weather Prediction – Description of a Lake Model, COSMO Technical Report No. 11, Deutscher Wetterdienst, Offenback am Main, Germany, 2008. a, b, c
Moene, A. F. and van Dam, J. C.: Transport in the Atmosphere-Vegetation-Soil Continuum, Cambridge University Press, Cambridge, 2014. a
Moors, E. J.: Water Use of Forests in The Netherlands, PhD Thesis, Vrije Universiteit Amsterdam, Amsterdam, 2012. a
Nordbo, A., Launiainen, S., Mammarella, I., Leppäranta, M., Huotari, J., Ojala, A., and Vesala, T.: Long-Term Energy Flux Measurements and Energy Balance over a Small Boreal Lake Using Eddy Covariance Technique, J. Geophys. Res.-Atmos., 116, D02119, https://doi.org/10.1029/2010JD014542, 2011. a
Oki, T. and Kanae, S.: Global Hydrological Cycles and World Water Resources, Science, 313, 1068–1072, https://doi.org/10.1126/science.1128845, 2006. a
Penman, H. L.: Natural Evaporation from Open Water, Bare Soil and Grass, P. Roy. Soc. Lond. A, 193, 120–145, 1948. a, b
Priestley, C. H. B. and Taylor, R. J.: On the Assessment of Surface Heat Flux and Evaporation Using Large-Scale Parameters, Mon. Weather Rev., 100, 81–92, https://doi.org/10.1175/1520-0493(1972)100<0081:OTAOSH>2.3.CO;2, 1972. a
Renner, M., Brenner, C., Mallick, K., Wizemann, H.-D., Conte, L., Trebs, I., Wei, J., Wulfmeyer, V., Schulz, K., and Kleidon, A.: Using phase lags to evaluate model biases in simulating the diurnal cycle of evapotranspiration: a case study in Luxembourg, Hydrol. Earth Syst. Sci., 23, 515–535, https://doi.org/10.5194/hess-23-515-2019, 2019. a
Rijkswaterstaat: Waterinfo van watertemperatuur, available at: https://waterinfo.rws.nl/#!/kaart/watertemperatuur/, last access: 27 February 2020. a
Rosenberry, D. O., Winter, T. C., Buso, D. C., and Likens, G. E.: Comparison of 15 Evaporation Methods Applied to a Small Mountain Lake in the Northeastern USA, J. Hydrol., 340, 149–166, https://doi.org/10.1016/j.jhydrol.2007.03.018, 2007. a
Solcerova, A., van de Ven, F., and van de Giesen, N.: Nighttime Cooling of an Urban Pond, Front. Earth Sci., 7, 156, https://doi.org/10.3389/feart.2019.00156, 2019. a
Tanny, J., Cohen, S., Assouline, S., Lange, F., Grava, A., Berger, D., Teltch, B., and Parlange, M. B.: Evaporation from a Small Water Reservoir: Direct Measurements and Estimates, J. Hydrology, 351, 218–229, https://doi.org/10.1016/j.jhydrol.2007.12.012, 2008. a
Teuling, A. J.: A Forest Evapotranspiration Paradox Investigated Using Lysimeter Data, Vadose Zone J., 17, 170031, https://doi.org/10.2136/vzj2017.01.0031, 2018. a
Trenberth, K. E., Dai, A., van der Schrier, G., Jones, P. D., Barichivich, J., Briffa, K. R., and Sheffield, J.: Global Warming and Changes in Drought, Nat. Clim. Change, 4, 17–22, https://doi.org/10.1038/nclimate2067, 2014. a
van Emmerik, T., Rimmer, A., Lechinsky, Y., Wenker, K., Nussboim, S., and van de Giesen, N.: Measuring Heat Balance Residual at Lake Surface Using Distributed Temperature Sensing: Measuring Lake Heat Balance Residual Using DTS, Limnol. Oceanogr.: Meth., 11, 79–90, https://doi.org/10.4319/lom.2013.11.79, 2013. a
van Meijgaard, E., van Ulft, L. H., van de Berg, W. J., Bosveld, F. C., van den Hurk, B. J. J. M., Lenderink, G., and Siebesma, A. P.: The KNMI Regional Atmospheric Climate Model RACMO, Version 2.1, Technical Report TR-302, KNMI, De Bilt, 2008. a, b
Venäläinen, A., Frech, M., Heikinheimo, M., and Grelle, A.: Comparison of Latent and Sensible Heat Fluxes over Boreal Lakes with Concurrent Fluxes over a Forest: Implications for Regional Averaging, Agr. Forest Meteorol., 98–99, 535–546, https://doi.org/10.1016/S0168-1923(99)00100-8, 1999. a
Verburg, P. and Hecky, R. E.: The Physics of the Warming of Lake Tanganyika by Climate Change, Limnol. Oceanogr., 54, 2418–2430, https://doi.org/10.4319/lo.2009.54.6_part_2.2418, 2009. a
Vermeulen, M. H., Kruijt, B. J., Hickler, T., and Kabat, P.: Modelling Short-Term Variability in Carbon and Water Exchange in a Temperate Scots Pine Forest, Earth Syst. Dynam., 6, 485–503, https://doi.org/10.5194/esd-6-485-2015, 2015. a
Vörösmarty, C. J.: Global Water Resources: Vulnerability from Climate Change and Population Growth, Science, 289, 284–288, https://doi.org/10.1126/science.289.5477.284, 2000. a
Wieringa, J.: Metingen van het Flevo-1967 verdampingsonderzoek, Technisch rapport, KNMI, De Bilt, 9 pp., 2019. a, b, c
Zhan, S., Song, C., Wang, J., Sheng, Y., and Quan, J.: A Global Assessment of Terrestrial Evapotranspiration Increase Due to Surface Water Area Change, Earth's Future, 7, 266–282, https://doi.org/10.1029/2018EF001066, 2019. a


