the Creative Commons Attribution 4.0 License.
the Creative Commons Attribution 4.0 License.
Estimating daily evapotranspiration based on a model of evaporative fraction (EF) for mixed pixels
Fugen Li
Zhiqing Peng
Qinhuo Liu
Currently, applications of remote sensing evapotranspiration (ET) products are limited by the coarse resolution of satellite remote sensing data caused by land surface heterogeneities and the temporal-scale extrapolation of the instantaneous latent heat flux (LE) based on satellite overpass time. This study proposes a simple but efficient model (EFAF) for estimating the daily ET of remotely sensed mixed pixels using a model of the evaporative fraction (EF) and area fraction (AF) to increase the accuracy of ET estimate over heterogeneous land surfaces. To accomplish this goal, we derive an equation for calculating the EF of mixed pixels based on two key hypotheses. Hypothesis 1 states that the available energy (AE) of each sub-pixel is approximately equal to that of any other sub-pixels in the same mixed pixel within an acceptable margin of error and is equivalent to the AE of the mixed pixel. This approach simplifies the equation, and uncertainties and errors related to the estimated ET values are minor. Hypothesis 2 states that the EF of each sub-pixel is equal to that of the nearest pure pixel(s) of the same land cover type. This equation is designed to correct spatial-scale errors for the EF of mixed pixels; it can be used to calculate daily ET from daily AE data. The model was applied to an artificial oasis located in the midstream area of the Heihe River using HJ-1B satellite data with a 300 m resolution. The results generated before and after making corrections were compared and validated using site data from eddy covariance systems. The results show that the new model can significantly improve the accuracy of daily ET estimates relative to the lumped method; the coefficient of determination (R2) increased to 0.82 from 0.62, the root mean square error (RMSE) decreased to 1.60 from 2.47 MJ m−2(decreased approximately to 0.64 from 0.99 mm) and the mean bias error (MBE) decreased from 1.92 to 1.18 MJ m−2 (decreased from approximately 0.77 to 0.47 mm). It is concluded that EFAF can reproduce daily ET with reasonable accuracy; can be used to produce the ET product; and can be applied to hydrology research, precision agricultural management and monitoring natural ecosystems in the future.
- Article
(5510 KB) - Full-text XML
- BibTeX
- EndNote
Large-scale remotely sensed evapotranspiration (ET) estimates generally have a resolution that is too coarse for use in critical applications (e.g. drought assessment, water management or agricultural monitoring) (McCabe et al., 2017). Classical satellite-based models such as the Surface Energy Balance Algorithm for Land (SEBAL) (Bastiaanssen et al., 1998), Surface Energy Balance System (SEBS) (Su, 2002), Atmosphere-Land Exchange Inverse (ALEXI) and an associated flux disaggregation technique (DisALEXI) (Norman et al., 2003; Anderson et al., 2011, 2012), and temperature-sharpening and flux aggregation scheme (TSFA) (Peng et al., 2016) have been developed to monitor land–atmosphere energy balance flux interactions; and in most cases, spatially variable inputs and parameters are based on assumptions of homogeneity of land and atmospheric surfaces (Sharma et al., 2016). However, surface characteristics such as land cover types, land surface temperatures, surface albedo values, downward shortwave radiation and other factors are spatially discrete. Studies have shown that different landscapes (Blyth and Harding, 1995; Moran et al., 1997; Bonan et al., 2002; McCabe and Wood, 2006) and sub-pixel variations of surface variables, such as stomatal conductance (Bin and Roni, 1994) or leaf area index (LAI; Bonan et al., 1993; El Maayar and Chen, 2006), can cause errors in heat flux estimations. Therefore, models of ET estimates that perform well for fine-resolution remote sensing data (e.g. 30 m resolution Landsat data) may not be appropriate for coarser-resolution data (e.g. 1 km resolution MODIS and AVHRR data). The spatial-scale errors in remotely sensed ET (and other parameters derived from remote sensing data) arise primarily from the combination of two factors, i.e. nonlinear models and surface heterogeneity, the latter of which is more likely to take place in coarser-resolution data (Hu and Islam, 1997; Gottschalk et al., 1999; Tian et al., 2002; Garrigues et al., 2006; McCabe and Wood, 2006; Jin et al., 2007; Xin et al., 2012; Li et al., 2013). To address the scale effect on energy fluxes, many studies have compared distributed calculations with lumped calculations. Distributed calculations are retrieved at fine resolutions and then aggregated to a coarser resolution, which is assumed to provide correct calculations in common scaling studies because the fine-resolution calculation closely represents actual conditions, whereas lumped calculations are based on single values retrieved at coarser resolutions. Distributed calculations and lumped calculations may not be the same at different scales. Thus, their differences can be considered scale effects. Other studies have noted discrepancies between multi-sensor data aggregations. Moran et al. (1997) found a significant error of over 50 % in sensible heat estimations of mixed pixels by comparing lumped and distributed surface fluxes for semi-arid rangeland in Arizona. Hong et al. (2009) found that peak values of ET at the pixel scale increased by 10 %–25 % following the upscaling of surface fluxes retrieved by SEBAL from Landsat ETM+ at a 30 m resolution to MODIS at 250, 500 and 1000 m resolutions. Ershadi et al. (2013) reported that input aggregation underestimated ET at the satellite image scale, with up to 15 % fewer retrievals, and at the pixel scale by up to 50 % relative to using an original fine-resolution Landsat image. These results suggest that the spatial characteristics obtained from data of a specific resolution can only reflect characteristics observed at that resolution. For the heterogeneity of the geo-surface, RS data can synthetically reflect surface information. However, regardless of the spatial resolution, RS data inevitably neglect certain details due to the individual value of each pixel. Moreover, for fine-resolution data, the process of upscaling during smoothing inevitably results in the loss of geo-surface information, reducing the heterogeneity and leading to scale effects. Thus, at the pixel scale, determining whether the physical mechanism is suitable for application, identifying the applicable conditions and determining how to correct the scale effects are the three critical issues for remotely sensed ET estimates (Li and Wang, 2013).
Some studies have shown that the presence of different land cover types among sub-pixels can generate greater errors in surface flux (Moran et al., 1997; Kimball et al., 1999). Blyth and Harding (1995) proposed a patch model for estimating ET weighted by the area fraction (AF) of soil and vegetation at the pixel scale; the model hypothesizes that the heat transfer process involves significant levels of horizontal fluxes and that interactions among patches can be disregarded. This model structure is relatively simple and has been widely used to map ET on a large scale (Norman et al., 1995) considering the contributions of surface fluxes from different components (vegetation and soil). Norman et al. (2003) proposed an approach called the DisALEXI model to estimate surface ET with the combination of low- and high-resolution remotely sensed data with little subjective endmember selection. Anderson et al. (2011) achieved upscaling of remotely sensed ET estimates by combining geostationary satellites and polar-orbiting satellite data and verified the consistency of ET estimates from high- to low-resolution based on the DisALEXI model. However, such models only identify vegetation and soil when estimating ET and do not consider contributions from other land cover types (e.g. water bodies, buildings and snow) or vegetation types (e.g. trees, grasses and crops). When scaling RS measurements over terrestrial surfaces, the scale effect caused by a density change is almost negligible; in general, mixed land cover types in a pixel are the major source of scaling errors (Chen, 1999). El Maayar and Chen (2006) proposed an empirical algorithm that uses sub-pixel information on the spatial variability of leaf area index, land cover and surface topography to correct ET estimates at coarse spatial resolutions. However, an obvious weakness of this approach is that the coefficients must be adjusted for different models and study areas, which limits its applicability. Other studies that combine coarse-resolution parameters with land cover maps have used different schemes for different land cover types to estimate ET at the regional scale (Mu et al., 2007, 2011; Hu and Jia, 2015; Peng et al., 2016). However, at the pixel scale, the low calculation efficiency of this method limits its application at a larger scale because the ET of each pixel must be estimated using sophisticated algorithms. Moreover, this method presents difficulties accurately describing surface information due to the coarse resolution of land cover maps.
Each of the above approaches reduces the error in ET estimates based on spatial disparities rather than both spatial and temporal disparities. Temporal-scale extrapolation of instantaneous latent heat flux (LE) from satellite overpass time to daily ET is also crucial for applications of RS products. At present, the major temporal-scale extrapolation methods include the method based on incoming solar radiation (Jackson et al., 1983; Zhang and Lemeur, 1995), the evaporative fraction (EF) method (Sugita and Brutsaert, 1991; Nichols and Cuenca, 2010) and the reference evaporative fraction method (Allen et al., 2007a, b). The method based on incoming solar radiation uses a sine function to connect the instantaneous ET with the 24 h trend in solar radiation, with the function expressing the relationship between instantaneous ET and daily ET. The EF method, which is the most widely used, extrapolates the instantaneous EF to the daily EF based on the characteristics of EF that remain constant over 1 day. The reference evaporative fraction method assumes that the instantaneous reference evaporative fraction, which is calculated as the ratio of the computed instantaneous ET at the satellite overpass time from each pixel to the reference crop's (such as alfalfa's) ET, is the same as the average reference evaporative fraction over the 24 h average, and it then uses the reference crop's accumulated daily ET to obtain the daily ET. Chávez et al. (2008) compared different ET temporal-scale extrapolation methods and found that the EF method generates values that are most consistent with the measured values.
Therefore, we propose a simple but efficient model (EFAF) to estimate the daily ET of mixed pixels. In this method, the daily ET of the heterogeneous land surface is estimated by calculating the EF of mixed pixels, and it only requires the AF of sub-pixels, which can be obtained from a high-resolution land cover type map. The model was applied to an artificial oasis in the midstream area of the Heihe River. HJ-1B satellite data were used to estimate the lumped fluxes at the scale of 300 m after resampling the 30 m resolution datasets to 300 m resolution, which was used to perform the key step of the model, i.e. correction of mixed-pixel EF and calculation of daily ET. Next, the EF of each pixel at a 300 m resolution was calculated using 300 m net radiation, soil heat flux, sensible heat flux and LE data at the satellite overpass time. The daily ET of the mixed pixels was retrieved from the EF of the mixed pixels and the available energy (AE) after temporal-scale extrapolation.
2.1 LE algorithm
Surface thermal dynamics control energy partitioning and ET. However, the spatial resolution of thermal-infrared (TIR) images is usually not as high as the spatial resolution of visible near-infrared (VNIR) bands because the energy of VNIR photons is higher than the energy of thermal photons (Peng et al., 2016). The input parameter upscaling (IPUS), a widely used one-source energy balance model that can handle the upscaling of all surface variables to a large scale before calculating the heat flux and does not consider the surface heterogeneities at all, is used as the lumped method in this study. This model was designed to simulate the remote sensed images or products that have identical spatial resolutions in both the VNIR and TIR bands and is described in detail in Peng et al. (2016). The energy flux components net radiation (Rn), soil heat flux (G), sensible heat flux (H) and LE are shown as below (Jiao et al., 2014; Peng et al., 2016).
Rn is the difference between incoming and outgoing radiation, as follows:
where Sd is downward shortwave radiation, α is the surface albedo, εs is the emissivity of land surface, Ld is the downward atmospheric longwave radiation, W m−2 K−4 is the Stefan–Boltzmann constant, and Trad is the surface radiation temperature.
G is commonly estimated through the derivation of empirical equations that employ surface parameters such as Rn as follows (Su, 2002):
where Γs is equal to 0.315 for a bare soil situation, Γc is equal to 0.05 for a full vegetation canopy, and fc is fractional canopy coverage.
The sensible heat flux (H) is calculated based on gradient diffusion theory:
where ρ is the density of air, cp is the specific heat of air constant pressure, Taero is the aerodynamic surface temperature obtained by extrapolating the logarithmic air temperature profile to the roughness length for heat transport, Ta is the air temperature at the reference height, and ra is the aerodynamic resistance that influence the heat transfer between the source of turbulent heat flux and the reference height. Finally, LE is calculated as a residual item of the energy balance equation (Eq. 4).
Further details can be found in Peng et al. (2016).
2.2 EF of mixed pixels
(1) Equation for EF of mixed pixels
The EF is the ratio of LE and AE (Rn−G), as follows:
Studies have shown that the EF is quite stable over time and thus is well suited to denoting the status of the surface energy balance for a certain period. For example, the EF is nearly constant during the daytime (Sugita and Brutsaert, 1991; Nichols and Cuenca, 2010) and thus can be used for temporal-scale extrapolation, i.e. from instantaneous LE at the satellite overpass time to daily ET. EF is widely used to estimate daily ET with RS data in different methods – e.g. the feature space of the land surface temperature and vegetation index (LST-VI) (Carlson, 2007; Long and Singh, 2012) and SEBS (Su, 2002) models.
In this section, the EF of mixed pixels is investigated and a novel approach is derived to estimate the daily ET of mixed pixels. In other words, EF is used for temporal-scale extrapolation and spatial-scale correction of the remotely sensed LE and ET at a coarse-resolution scale at the same time.
Because turbulence transferred by advection is always neglected in RS data, we only consider vertical turbulence. Therefore, the accurate LE (with scaling effects taken into consideration) of a mixed pixel can be weighted by the LE of its sub-pixels as follows:
where LE denotes the accurate LE of mixed pixels, si the AF of sub-pixel i, and LEi the LE of sub-pixel i. Equations (5) and (6) can be combined as follows:
where EFi and (Rn−G)i denote the EF and AE of sub-pixel i in a certain mixed pixel respectively.
At this step, a simplification is performed as described in Hypothesis 1 – here, Hypothesis 1 is proposed as follows:
The AE of each sub-pixel is approximately equal to that of any other sub-pixels in the same mixed pixel within an acceptable margin of error (e.g. 50 W m−2; Seguin et al., 1999; Kustas and Norman, 2000; Sánchez et al., 2008) and is equivalent to the AE of the mixed pixel.
Therefore, Eq. (7) can be transformed into the following expression:
where denotes the latent heat flux in mixed pixels based on Hypothesis 1. There is a minor difference between and LE that can be regarded as an error of Hypothesis 1, and it will be analysed below.
Rearranging Eq. (8) yields the following:
Therefore, we have
where denotes the EF of the mixed pixel, including the error of Hypothesis 1, which is quite small and can be neglected based on a data analysis (see Sect. 4.3.1). Hence Eq. (10) can be used as the solution to the EF of mixed pixels.
Using Eq. (10) makes calculating the EF of mixed pixels straightforward since it only needs the AF of each land cover in the pixel, which can be easily obtained using a fine-resolution land cover map, as well as the EFi of its sub-pixels, which requires a specific technique to get in operations.
(2) Calculating EF of mixed pixels
The EFi of sub-pixels is required in Eq. (10); however, it is not available with coarse-resolution data. In order to utilize Eq. (10), Hypothesis 2 is proposed:
The EF of each sub-pixel in a mixed pixel is approximately equal to the EF of the nearest pure pixel(s) of the same land cover type.
The concept of “nearest” in this study is refers to the shortest distance between the centre point of the mixed pixel where the sub-pixel is located and the centre point(s) of the pure pixel(s) with the same land cover type as the sub-pixel in the study area. The concept is illustrated in Fig. 1.
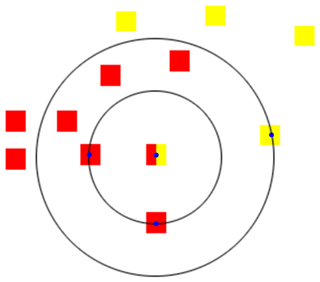
Figure 1A sample graph of sub-pixel in a mixed pixel and its nearest pure pixel(s) of the same land cover type. There are two land cover types: yellow and red. The centre pixel, which is a mixed pixel, contains a red sub-pixel and a yellow sub-pixel. The red pixels with blue centres are the nearest pure pixels of the red sub-pixel and the yellow pixel with blue centre is the nearest pure pixel of the yellow sub-pixel for this mixed pixel.
In Fig. 1, there are two land cover types: yellow and red. The centre pixel, which is a mixed pixel, contains a red sub-pixel and a yellow sub-pixel. Hypothesis 2 examines which pixel is the nearest neighbour. From Fig. 1, it is clear that the red sub-pixel has two nearest neighbours (red pixels with blue centres); thus, the EF of the red sub-pixel equals the mean EF of the two nearest pure pixels according to Hypothesis 2. The yellow sub-pixel has one nearest neighbour (yellow pixel with blue centre); thus, the EF of the yellow sub-pixel equals the EF of the yellow pure pixel. This process can be easily and rapidly implemented by a computer programme with matrix operation and nearest-neighbour search (NNS) (Andrews, 2001; Zezula et al., 2006).
This hypothesis is based on Tobler's first law (TFL) (Miller, 2004; Tobler, 2004; Li et al., 2007), which states that “everything is related to everything else, but near things are more related than distant things”. In other words, the most similar conditions, phenological patterns and physical characteristics exist between a sub-pixel surface and nearby (pure pixel) surfaces given the same land cover. Accordingly, the EF of sub-pixel i can be determined using EF of pure pixel(s) at coarse-resolution scale based on Hypothesis 2.
Therefore, Eq. (8) may be reduced as above to the following:
Equation (10) and Hypothesis 2 together can be used to calculate the EF of mixed pixels and therefore the daily ET. Equations (10) and (11) can be used together to correct the spatial-scale errors of the instantaneous LE at the overpass time.
In summary, by employing two key hypotheses, the EFAF methodology is able to realize temporal-scale extrapolation and spatial-scale correction for remotely sensed LE and ET at a coarse-resolution scale at the same time. The EF of a mixed pixel is expressed as the area-weighted EFi of its sub-pixels with acceptable simplifications, which simplified the calculations, increased the accuracy and facilitated its use for daily operations.
2.3 Estimation of daily LE
We use the EF method to extrapolate the temporal scaling of the LE. The EF method is based on the basic assumption that each component of the energy balance model remains relatively constant during the day and that the relative components of LE and AE (Rn−G) are constant (Sugita and Brutsaert, 1991; Nichols and Cuenca, 2010). Therefore, the daily LE can be expressed as follows:
where the subscripts “daily” and “inst” indicate daily cumulative and instantaneous values, respectively. To calculate the daily total ET from Eq. (13), it is necessary to determine the EF and the daytime total AE (Zhang and Lemeur, 1995). The daytime net radiation is obtained from the parameterization proposed by Bisht et al. (2005), in which the average daytime net radiation and then its integral are calculated as follows:
where DANR is the average daytime net radiation, Rn,daily is the daytime cumulative net radiation, tovp is the satellite imaging time, and trise and tset are local sunrise and sunset times, respectively, representing times at which the net radiation shifts from positive to negative.
The daytime G is calculated from the DANR and Eq. (2).
The flowchart of the EFAF shown below illustrates the (1) calculation of LE without a scale effect, (2) calculation of the EF of mixed pixels and (3) extrapolation of the temporal scale (Fig. 2).
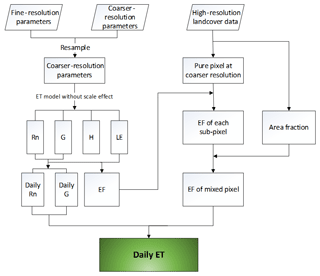
Figure 2 Flowchart of the EFAF, where trapezoids represent the input variables or parameters, and rectangles represent variables or parameters. The inputs of EFAF encompass the remotely sensed variables or parameters and meteorological forcing dataset. The abbreviations are defined as follows – Rn: net radiation; G: soil heat flux; H: sensible heat flux; LE: latent heat flux; EF: evaporative fraction; ET: evapotranspiration.
3.1 Study area
The study area is located in the Heihe River watershed in west-central Gansu Province, north-western China (Fig. 3). The Heihe River watershed has a land surface area of approximately 128 000 km2 and is the second largest inland watershed in north-western China (Gu et al., 2008). The Heihe River watershed includes the Zhangye sub-watershed, which covers a total land area of approximately 31 100 km2. The natural landscape of the study area is heterogeneous, including mountains, oasis areas and desert (Ma and Veroustraete, 2006). The oasis is a typical farmland ecosystem located 8 km south of the city of Zhangye in which maize and wheat are the major crops. Large expanses of desert and mountains surround the central oasis. In this area, annual precipitation ranges from 100 to 250 mm, but potential ET levels reach approximately 1200–1800 mm yearly (Li et al., 2013).
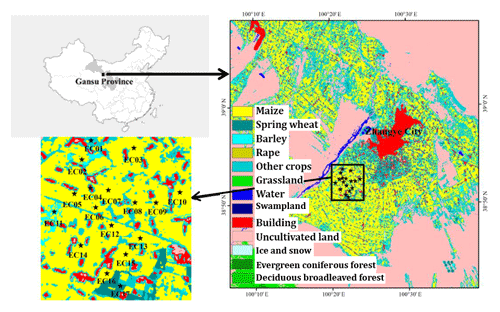
Figure 3Distribution of in situ stations and land use classifications in our study area (revised based on Peng et al., 2016).
Since 2012, an eco-hydrological experiment referred to as the Heihe Watershed Allied Telemetry Experimental Research (HiWATER) has been conducted in the area. An observation matrix composed of 17 eddy covariance (EC) systems and automatic meteorological stations (AMSs) was established across the landscape (Li et al., 2013).
The percentage of the numbers of land cover types (Yu et al., 2016) (Fig. 4) for the study area were extracted at a 300 m scale with 30 m land cover classifications developed by Zhong et al. (2014a) based on HJ-1/CCD (charge-coupled device) time series. The pure pixels at 300 m scale are entirely made up of one particular land cover type, and the mixed pixels are made up of two or more land cover types according to the land cover datasets with a spatial resolution of 30 m. It has been shown that pure pixels account for 41.74 % and mixed pixels account for 58.26 % of the area. Such an area, with more mixed than pure pixels but with many of both, represents an optimal place to test the proposed method.
3.2 Remote sensing data
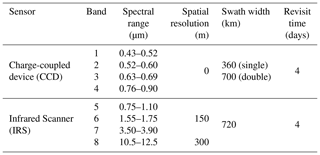
The HJ-1B satellite (Table 1) was successfully launched on 6 September 2008 and follows a quasi-sun-synchronous orbit at an altitude of 650 km. After geometric correction, radiometric calibration and atmosphere correction (Zhang et al., 2013; Zhong et al., 2014b), the image quality of the HJ-1B data is the same as that of Landsat-5 TM, and the data can be used for applications including environmental and disaster monitoring (Jiang et al., 2013). The calculation of ET levels represents one of the most important applications of the HJ-1B satellite data.
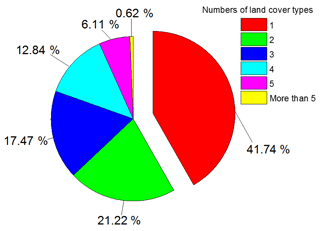
Figure 4Percentage of the number of land cover types for the study at 300 m scale with 30 m land cover images.
The algorithms for most surface parameters used to estimate ET are applicable under clear-sky conditions. Therefore, nine images were selected for the study area under clear or partly cloudy conditions based on data quality metrics and artificial visual interpretation from June to September 2012, i.e. 30 June, 8 July, 27 July, 3 August, 15 August, 22 August, 29 August, 2 September and 13 September.
In this study, each component of the energy balance algorithm used to estimate the daily ET of mixed pixels was retrieved using the lumped method based on HJ-1B data (CCD/IRS). These components included surface albedo (Liang et al., 2005; Liu et al., 2013), downward shortwave radiation (Li et al., 2011), land surface emissivity (Valor and Caselles, 1996), land surface temperature (Li et al., 2010), the normalized difference vegetation index (NDVI), fractional vegetation coverage (FVC) (Peng et al., 2016) and LAI (Nilson, 1971; He et al., 2012).
Furthermore, 30 m resolution land cover classifications derived from HJ-1/CCD time series were used. Highly accurate 30 m land cover classifications for June to September 2012 based on HJ-1B data were developed by Zhong et al. (2014a). The major land use types included cropland for maize, wheat and vegetables (according to experiential knowledge, although it is considered as other crops in this classification); uncultivated land (including bare soils and Gobi Desert); water bodies; grassland; forests; and buildings.
3.3 HiWATER experiment in situ dataset
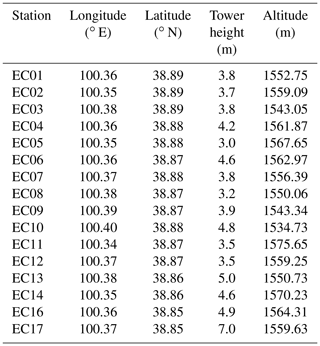
In situ data were provided by the HiWATER Multi-Scale Observation Experiment on Evapotranspiration (MUSOEXE) over heterogeneous land surfaces of the HiWATER campaign, which was carried out at an artificial oasis in the Zhangye Heihe River watershed. During the HiWATER-MUSOEXE campaign, 17 EC towers and AMSs were arranged in two nested observation matrices (Li et al., 2013) to obtain ground measurements of radiation fluxes, meteorological parameters, and soil and turbulent heat flux. Details regarding the ground towers are shown in Table 2, and the tower distribution is shown in Fig. 3.
The in situ data are considered reliable based on various quality control measures. For example, prior to the main campaign, the performance of the instruments was compared in the Gobi Desert (Xu et al., 2013). After basic processing, including spike removal and corrections for density fluctuations (Webb–Pearman–Leuning, WPL, correction), a four-step quality control procedure was applied to the EC data. The EC data were based on 30 min intervals; additional information regarding system setup, data processing and quality control can be found in previous reports (Yang and Wang, 2008; Liu et al., 2011, 2016; Xu et al., 2013).
Energy imbalance is common in ground flux observations conducted over long periods. Common methods for forcing the energy balance include conservation of the Bowen ratio (H ∕ LE) and the residual closure technique. Studies have suggested that computing the LE as a residual may be a better method for energy balance closure when the LE is large (with small or negative Bowen ratios due to strong advection) (Kustas et al., 2012). Therefore, the residual closure method was used in this study, because there was a distinct “oasis effect” on clear days (Liu et al., 2011).
Because this study focuses on mixed pixels of heterogeneous surfaces, we exclude some stations (EC 07, EC 08, EC 10, and EC 15) from our discussion, because they are located in areas with pure pixels. In addition, EC17 is in an area dominated by orchards. Orchards are considered other crops in our classification, and the complex vertical structure of orchard ecosystems can result in large gaps that are difficult to analyse. Therefore, EC17 is also excluded from our discussion.
Regarding the other observations, we conducted interpolation to fill null values in the observations. Linear interpolation (Liu et al., 2012) was used for missing values over intervals smaller than 2 h, and the mean diurnal variation (MDV) method (Falge et al., 2001) was used for missing values over intervals greater than 2 h. Next, energy residual methods were used to conduct the closure process. Finally, a Eulerian analytic footprint model (Kormann and Meixner, 2001) was used to calculate the source region and extract ground observation values, which can express the LE of the heterogeneous surface.
4.1 Results of the EFAF
The EFAF study was performed on crops that mainly grew during June, July, August and September. We selected two days in different growing phases, 8 July (Fig. 5) and 22 August (Fig. 6), and compared the changes in lumped EF, EFAF EF, lumped LE, and EFAF LE on these days. The results showed similar changes in EF and LE.
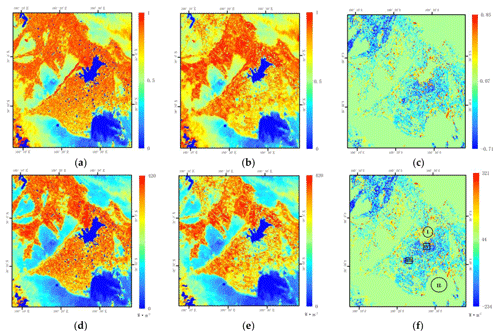
Figure 5 Maps of (a) lumped EF, (b) EFAF EF, (c) difference between EFAF and lumped EF (EFAF EF minus lumped EF), (d) lumped daily LE, (e) EFAF daily LE, and (f) difference between EFAF and lumped LE (EFAF LE minus lumped LE) on 8 July 2012.
Overall, there were no differences in EF and daily LE on either day between the city and the desert area that could be distinguished based on land cover data, because of the homogeneous surface of both land cover types (Figs. 5 and 6). For example, Area I in Fig. 7 represents the city of Zhangye, and Area II in Fig. 7 represents uncultivated land. The EFAF EF and EFAF LE values of both areas are the same as the lumped EF and lumped LE values because pure pixels were not corrected in this study.
However, the boundaries became blurred between buildings, which were given an LE of 0 in this study (Peng et al., 2016), and farmland; thus, the intersection of these land cover types resulted in “buffer pixels”. For example, in Area III in Fig. 7, the EF and daily LE of pixels dominated by buildings (village areas with many villages) appears blue, denoting low EF and LE values without scaling correction; these areas appear orange after considering agriculture areas around the buildings. For the same reason, in the suburbs surrounding the city of Zhangye (Area IV in Fig. 7), an area of mixed pixels dominated by buildings appears blue, with low lumped LE values; the same area appears yellow or pale blue after considering the presence of vegetables.
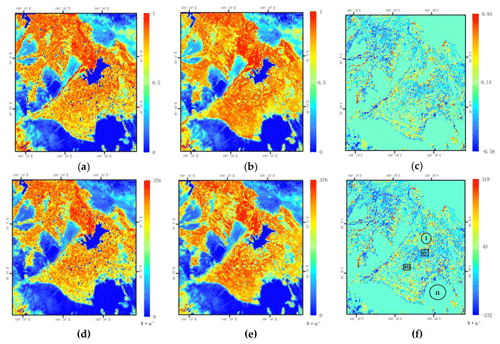
Figure 6Maps of (a) lumped EF, (b) EFAF EF, (c) difference between EFAF and lumped EF (EFAF EF minus lumped EF), (d) lumped daily LE, (e) EFAF daily LE and (f) difference between EFAF and lumped LE (EFAF LE minus lumped LE) on 22 August 2012.
The EF and LE values for pixels dominated by agriculture and including buildings decreased, likely because the area included villages whose EF was set to zero. For instance, in region IV (Fig. 7), pixels dominated by buildings and including cropland and pixels dominated by cropland and including buildings account for 20 % and 80 %, respectively, and the spatially averaged daily LE decreased from 8.98 to 7.39 MJ m−2 (decreased approximately from 3.57 to 2.97 mm, the latent heat of vaporization is approximately 2.49×10⁶ W m−2 mm−1 (Pan and Liu, 2003), the same below) on 8 July 2012. However, for pixels dominated by buildings, the spatially averaged daily LE increased from 0 to 4.70 MJ m−2 (increased from approximately 0 to 1.80 mm).
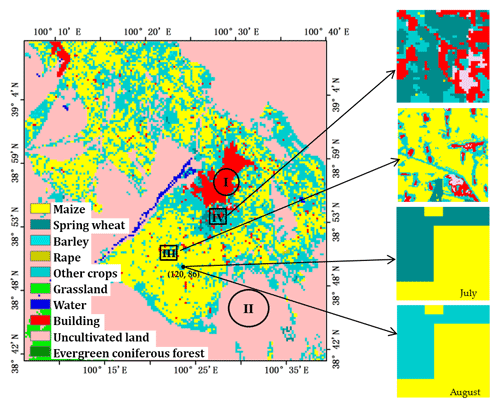
Figure 7Land cover maps of the study area at 300 m resolution and certain regions at 30 m resolution. Area I and II represent the area of pure pixels, Area III and IV represent the area of mixed pixels, and (120, 86) represents an example point of different land cover types in different months.
In addition, the EF and daily LE decreased significantly on 8 July when the EFAF method was applied in the north-western and southern oasis areas of the study area. This change was less pronounced on 22 August. The EF and daily LE decreased slightly in the north-western parts of the study area and increased slightly in the south-central oasis area. The reason for this difference could be that the mixed pixels in this area mainly included maize, spring wheat, and barley. In July, spring wheat and barley were in a ripening stage, which is characterized by lower ET. However, by August, the spring wheat and barley had been harvested and replaced by vegetables, and the maize had entered its dough stage, which is characterized by reduced ET. The ET of vegetables was higher than that of the spring wheat and barley in July (Wu et al., 2006). These differences could have resulted in the increase in the EF and daily LE after the EFAF method was applied.
For example, the point located at coordinates (120, 86) (Fig. 7) included maize (58 %) and spring wheat (42 %). The mean EF of the pure pixels closest to the maize was 0.75, and the mean EF of pure pixels closest to the spring wheat was 0.65. Therefore, application of the EFAF method resulted in a decrease in the EF from 0.81 to 0.71 and in a decrease in the daily LE from 14.25 to 12.37 MJ m−2 (approximately 5.72 to 4.97 mm). In contrast, on 22 August, this pixel included maize (58 %) and vegetables (42 %). The mean EF of the pure pixels closest to the maize was 0.81, and the mean EF of the pure pixels closest to the vegetables was 0.86. Thus, application of the EFAF method resulted in an increase in the EF of 0.79 to 0.83 and an increase in the daily LE of 12.33 to 13.00 MJ m−2 (approximately 4.95 to 5.22 mm). Another reason for these minor changes could be related to irrigation, which occurred in the southern oasis area on 22 August (Peng et al., 2016). The EF of bare soil would likely increase because of greater soil moisture due to irrigation. As a result, the difference in EF values between agricultural land and bare soil decreased, as indicated in Fig. 6a and b.
4.2 Validation of daily LE
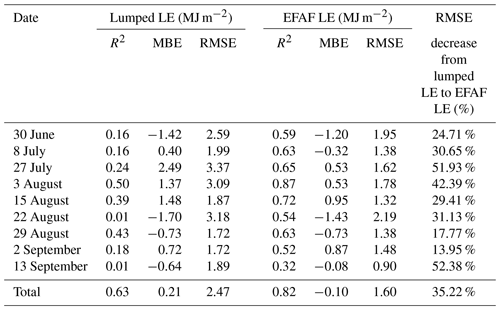
Daily EC measurements for LE were aggregated using a range of time series data based on the time at which net radiation shifted from positive to negative values. The simulated EC measurements were averaged over the estimated upwind source area for each flux tower. The results (Table 3) indicate that in general, the EFAF LE values are more consistent with the EC measurements than the lumped LE values. Comparing the lumped and EFAF methods shows that the coefficient of determination (R2) increased from 0.62 to 0.82; the root mean square error (RMSE) decreased from 2.47 to 1.60 MJ m−2 (0.99 to 0.64 mm), a decrease of approximately 35.22 %; and the mean bias error (MBE) decreased from 1.92 to 1.18 MJ m−2 (0.77 to 0.47 mm).
Table 3 also presents the lumped LE and EFAF LE results against the EC measurements for each day. The EFAF LE better reproduced the EC measurements than the lumped LE on all nine days. Combining the EFAF LE with EC data on 29 August resulted in a slightly more accurate LE estimate, with an RMSE of 1.38 MJ m−2 (0.55 mm), relative to the lumped LE, with an RMSE of 1.72 MJ m−2 (0.69 mm); the accuracy increased by approximately 13.95 % according to the RMSE. This difference is likely related to the fact that the slight heterogeneity in land surface temperature decreased the scale error that resulted from thermal dynamics. In addition, the EFAF LE results for 13 September were more accurate, yielding an RMSE of 0.90 MJ m−2 (0.36 mm), relative to the lumped LE, which had an RMSE of 1.89 MJ m−2 (0.76 mm); the RMSE decreased by approximately 52.38 %. This improvement may result from the greater landscape heterogeneity, which created obvious scale effects in the LE results; ripe maize, growing vegetables, withered grass and bare soils coexisted in the study area on that day.
However, uncertainties resulting from scale mismatches between RS data and the EC footprint could reduce the confidence and skill of the EFAF method. A unique aspect of the present study is that the EC data are consistent across the simulations on all nine days; this feature minimizes tower uncertainties by ensuring that the retrieved LE can be assessed against each EC tower record individually (Fig. 8). The results (Fig. 8) show that the EFAF LE had smaller RMSE values and higher R2 values than the lumped LE for all EC sites, indicating that the EFAF method improved the accuracy of daily LE estimates. However, this improvement in accuracy differed across sites.
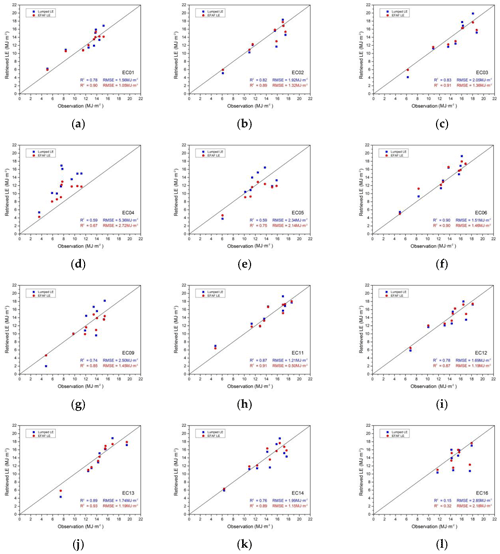
Figure 8Scatter plots of the lumped LE (blue) and EFAF LE (red) against the EC measurement LE at each site.
The correction effect of the EFAF method was most distinct at the EC04 site, and the RMSE at EC04 decreased from 5.36 to 2.72 MJ m−2 (2.15 to 1.09 mm) (a decrease of approximately 49.25 %); this improvement stemmed from the fact that EC04 had the highest complexity of all sites. Maize-dominated pixels in EC04 included maize, vegetables, buildings and bare soil, at a ratio of , respectively. We conclude that maize and vegetables were land cover types with a high EF, while bare soil had a low EF. For buildings, the EF value was 0 in this study. For example, on 30 June, the EF of mixed pixels in EC04 was 0.81. However, the average EF values of the pure pixels positioned closest to maize and vegetables among the sub-pixels were 0.88 and 0.88, respectively, and that of bare soil was 0.65. Therefore, when scale effects were taken into consideration, the EF of the mixed pixels was 0.70. Using the EFAF method, the daily LE of the mixed pixel where EC04 was located decreased from 13.57 to 11.78 MJ m−2 (5.45 to 4.73 mm). Similarly, the difference between these estimates and the EC measurements also declined from 4.12 to 2.32 MJ m−2 (1.67 to 0.93 mm) (a decrease of approximately 43.3 %). Additionally, there were large discrepancies between the observed and retrieved LE values at EC04. Specifically, there are two points far from the 1:1 line in Fig. 8d, with values of 8.36 MJ m−2 (3.36 mm) on 27 July and 9.33 MJ m−2 (3.75 mm) on 3 August. Even after the EFAF method was applied, these values were 5.20 MJ m−2 (2.09 mm) and 4.59 MJ m−2 (1.84 mm), respectively, because EC04 was positioned in a maize-dominated pixel and the EC tower was located in a built-up area, thus generating errors associated with temperature retrieval that would create further errors in estimating Rn. For example, on 27 July and 3 August, the Rn observed by AWS for the EC station was 15.95 and 15.35 MJ m−2, respectively, while the retrieved Rn of the pixels was 18.14 and 18.80 MJ m−2, respectively. The remaining larger errors in such pixels are a reminder that this method has limitations under certain extreme conditions. More complex models should be built for such circumstances and more information other than land cover should be included when considering subsurface heterogeneity to obtain results that are as accurate as those obtained for homogeneous sites.
The correction effect was not significant for sites such as EC02, EC06, EC12 and EC14; these sites had minimal surface heterogeneity, with only two land cover types present in the mixed pixels. These pixels also included a mixture of maize and other crops with similar EF values. However, the accuracy of daily LE was improved based on the effects of mixed pixels on EF. For example, EC12 was a maize-dominated pixel, with a 74:26 ratio of maize to other crops in July. On 27 July, the mean EF of the pure pixels closest to the maize area was 0.97; for the other crops, the EF of the pure pixels was 0.84. The EF of this mixed pixel changed from 0.96 to 0.94 when the EFAF method was used, and the daily LE decreased from 18.00 to 17.24 MJ m−2 (7.23 to 6.92 mm). Compared to the value of 16.52 MJ m−2 (6.63 mm) found for EC, the EFAF LE was more accurate.
4.3 Error analysis
4.3.1 Error analysis of Hypothesis 1
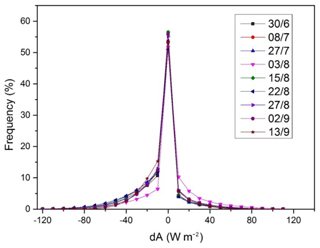
Hypothesis 1 states that the AE of each sub-pixel is approximately equal to that of any other sub-pixels in the same mixed pixel within an acceptable margin of error (e.g. 50 W m−2; Seguin et al., 1999; Kustas and Norman, 2000; Sánchez et al., 2008) and is equivalent to the AE of the mixed pixel. To quantify the error associated with Hypothesis 1 for ET estimation, each lumped AE (Rn−G) was compared to the original 30 m pixel located within it, i.e. the pixel values of a lumped 300 m resolution were compared to the 10×10 set of 30 m pixels that they were drawn from. The difference AE (dA) and percent frequency of difference were measured from the 30 m resolution sub-pixels (Asub) with the same values as the lumped AE measured at a 300 m resolution from each mixed pixel, relative to the original 30 m of distributed AE (Ad) for the nine days.
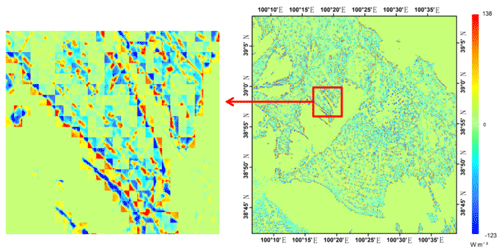
In all cases, the peak of the histogram is positioned at approximately 0 W m−2 (Fig. 9). This result indicates that the differences between the lumped and distributed AE range from −5 to 5 W m−2, so the errors caused by Hypothesis 1 were minor for the AE estimations of most of the mixed pixels.
Furthermore, the frequency distribution of the difference in AE follows a generally symmetric distribution, approximately 0 W m−2 at a range of ±120 W m−2, though the frequency was low when the differences in AE were greater than 10 W m−2 or less than −20 W m−2 (less than 10 %) (Fig. 9). The difference in frequency for values ±60 W m−2 was extremely poor (less than 1 %) and thus could be ignored.
In addition, larger dA values occurred mainly at the transition zones between oasis areas and uncultivated land because advection and its influences are not considered in EFAF. Addressing vertical and horizontal transport (such as oasis effects) at the same time would be excessively complex, and to our knowledge, such a process remains a huge challenge in the remote sensing of heat fluxes. However, as we can see, large positive and negative dA values existed in the same mixed pixel effectively (for example, the dA value on 2 September; Fig. 10). This result indicated that Hypothesis 1 results in large errors in the transition zones between oasis areas and uncultivated land, but these errors often cancel one another out because large negative and positive errors exist in a mixed pixel.
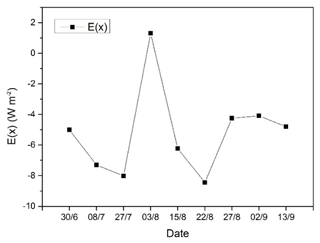
To evaluate the errors in the study area as a result of Hypothesis 1, the expected value (E(x)) of error was measured based on the dA and its frequency. Figure 11 shows the expected values of error based on Hypothesis 1 (dA) for the nine days studied. Small expected values of less than 10 W m−2 were observed when Hypothesis 1 was tested. A maximum error value of −8.44 W m−2 was found on 22 August. The mean EF of pure pixels for maize, grass, bare soils and vegetables was 0.77, 0.59, 0.22 and 0.81, respectively, on the same day. This result suggests that the LE estimation errors resulting from Hypothesis 1 for maize, grass, bare soils and vegetables were approximately −6.50, −4.98, −1.86 and −6.84 W m−2, respectively. We consider these errors to be acceptable (Seguin et al., 1999; Kustas and Norman, 2000; Sánchez et al., 2008).
4.3.2 Error analysis of Hypothesis 2
Hypothesis 2 states that the EF of each sub-pixel in a mixed pixel is approximately equal to the EF of the nearest pure pixel(s) of the same land cover type. It is indicated that the EF of a pure pixel can be regarded as the correct value. Therefore, we can choose each pure-pixel EF of whole image to compare to the mean EF of its nearest pure pixel(s) to analyse the errors caused by Hypothesis 2. The RMSE, MBE and R2 values were calculated for each maize, grass, bare soil and vegetable land cover type (Fig. 12).
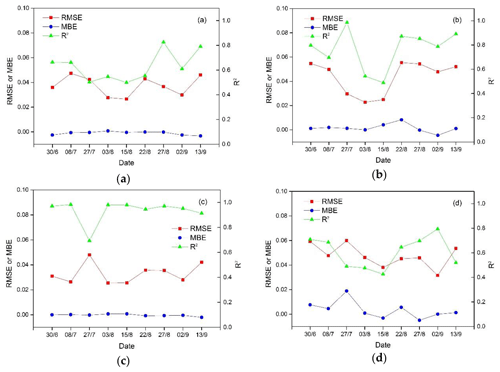
Figure 12The RMSE, MBE and R2 values of pure pixels based on the nearest pure pixel(s) for four land cover types: (a) maize, (b) grassland, (c) bare soils and (d) vegetables.
The EF of pure pixels appears to be well reproduced by Hypothesis 2; the overall RMSE is less than 0.06, indicating that Hypothesis 2 results in little error in the EF of sub-pixel estimations. For each land cover type, the maximum RMSEs were 0.047 for maize on 8 July, 0.055 for grass on 22 August, 0.048 for bare soils on 27 July and 0.059 for vegetables on 27 July, respectively. The simple averaged AE for the entire study area was 315.46 W m−2 on 8 July, 324.05 W m−2 on 27 July and 309.05 W m−2 on 22 August. This means that the maximum error in the LE estimates caused by Hypothesis 2 for maize, grass, bare soil and vegetables was approximately 14.83, 17.00, 15.55 and 19.12 W m−2, respectively. Considering that most mixed pixels were closer to their nearest pure pixels than pure pixels were to their nearest pure pixels, the error in LE estimation caused by Hypothesis 2 might actually be lower.
The MBEs of EF for four land cover types were less than 0.01. These low values indicate that using Hypothesis 2 does not have adverse effects on calculating the EF of sub-pixels. Greater MBEs were observed in vegetables, ranging from −0.0050 to 0.019, and in grasslands, ranging from −0.0045 to 0.0083; in comparison, the MBE of maize ranged from −0.0037 to 0.00076 and the MBE of bare soil ranged from −0.0020 to 0.00075. These differences are likely related to the accuracy of classification. Areas with vegetables and grasses may include different species with various phenological patterns; in contrast, the phenological patterns of maize varied less and the bare soils were relatively homogeneous.
However, the R2 value differed between maize, grassland and vegetables.
The lower correlations were mainly caused by the uncertainty associated with positive or negative differences between the EF of a pure pixel and the mean EF of its nearest pure pixel(s); this uncertainty arises because of the heterogeneity in surface roughness and other variables among vegetation land cover types. For bare soils, there was a lower R2 value on 27 July. This value can be attributed to the higher RMSE, which may have been caused by a brief cloudy period on that day that was not properly identified in the cloud detection process over uncultivated land.
In summary, Hypothesis 2 reproduces the EF of sub-pixels with an RMSE less than 0.06, resulting in errors of within 0–20 W m−2 for LE estimation in this study. We consider such errors to be acceptable in surface flux estimation (Seguin et al., 1999; Kustas and Norman, 2000; Sánchez et al., 2008).
4.4 Sensitivity analysis of the land cover map
An accurate high-resolution map of land cover types is essential when calculating the mixed-pixel EF using EFAF. Incorrect specification of the underlying land cover is particularly critical because the EF and AF of sub-pixels are based on the land cover map.
To assess the sensitivity of the land cover map and AE, reference values were obtained from the retrieved dataset on 27 July; these values indicate a wider range of phenological conditions and thermal dynamics. Other days had relatively homogeneous phenology conditions and thermal dynamics; at these times, the sensitivity analysis is conservatively estimated. The simple averaged pure-pixel EF was calculated to investigate the sensitivity of the seven main land cover types in the study area, i.e. maize, grass, bare soil, wheat, vegetables, buildings and water bodies. Of these, the EFs of buildings and water bodies were defined as 0 and 1, respectively.
Table 4 shows the difference in EF between the correct and incorrect classifications; the “+” and “−`” symbols indicate overestimation and underestimation, respectively. The results demonstrate that little error was introduced by misclassifications among maize, grass and vegetables, because they have similar phenological conditions during the period of high water use efficiency, which is especially true of grass and vegetables because of their similar roughness length.
Table 4Differences in EF and LE caused by incorrect classification. The “+” and “−” symbols indicate overestimation and underestimation, respectively. The average AE was 324.05 W m−2 over the entire study area.
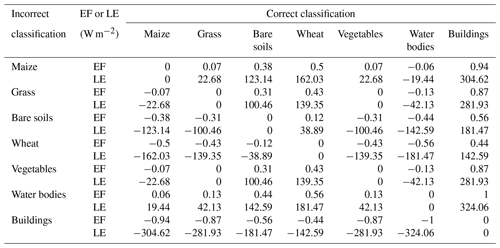
Conversely, a greater error, with an absolute difference of 0.5 in EF, occurred because of misclassification between wheat and other vegetation types. As ripe wheat changes colour from green to yellow or brown, its water use efficiency decreases; this resulted in a error of 162.03 W m−2 for the LE estimation. Additionally, incorrectly classifying bare soils as maize, grass or vegetables (or vice versa) also induced a greater error; the absolute difference in EF ranged from 0.31 to 0.38 and the absolute difference in LE ranged from 100.46 to 123.14 W m−2. However, incorrectly classifying bare soils as wheat (or vice versa) resulted in lower error, with an absolute difference in EF of approximately 0.12.
Furthermore, while misclassifications between water bodies and bare soils could result in a higher error in LE estimation, this rarely occurred because of the unique spectral characteristics of water and bare soils. Similarly, misclassification between buildings and other land cover types would induce a greater error because the EF of buildings was set to 0 in this study.
The most significant contribution of EFAF is related to its capacity to correct spatial-scale errors in the EF of mixed pixels; it can be used to calculate daily ET from daily AE data based on two hypotheses. This attribute could be beneficial in global ET mapping and water resources management compared to models that do not consider spatial-scale effects. Validation of the EFAF results against EC measurements across the HiWATER experimental sites demonstrates that EFAF can reproduce the LE of mixed pixels with an RMSE of 1.60 MJ m−2 (0.64 mm); without the EFAF, RMSE is 2.47 MJ m−2 (0.99 mm). The two hypotheses result in lower error, within 0–10 W m−2 for Hypothesis 1 and 20 W m−2 for Hypothesis 2. These results suggest that EFAF is reliable and has a considerable application potential. In particular, EFAF has the following advantages:
-
EFAF is uniquely able to identify the ET values of different land cover types in mixed pixels. This represents an improvement relative to single-source models that assume homogeneous land cover and two-source models that only distinguish bare surfaces from vegetated surfaces. Single-source models generate significant errors when applied to partially vegetated surfaces because they represent the surface as a single uniform layer (Timmermans et al., 2007). Two-source models are influenced by the characteristics of different vegetation species, including canopy height and phenological conditions, and cannot distinguish other land cover types, including water bodies, buildings and ice. In contrast, EFAF functions over heterogeneous surface can identify different land cover types (e.g. maize, grass, bare soil, vegetables, water bodies and buildings) from high-resolution land cover images.
-
EFAF reduces the uncertainties associated with both spatial scale and temporal scale. The EFAF method is based on the EF model, which is widely accepted for temporal extrapolation between data collected at satellite overpass time and daily ET. In the EFAF, the algorithm used to calculate the EF of mixed pixels is based on two hypotheses. The case study results presented in Sect. 4.1 and 4.2 demonstrate that the EFAF could significantly reduce the errors caused by the heterogeneous surfaces in a watershed located in north-western China, as well as reproduce the daily LE, particularly the spatial distribution of daily LE. Therefore, EFAF can be used for regional, continental or even global applications.
-
EFAF is easy to apply. In EFAF, calculating the mixed-pixel EF only involves determining the AF of sub-pixels, which can be obtained from a high-resolution map of land cover types. Furthermore, the module for inhomogeneous surfaces is independent and easy to embed in traditional RS algorithms of heat fluxes; these algorithms were mainly designed to calculate LE or ET under unsaturated conditions and did not consider heterogeneities in the land surface.
-
EFAF is robust in terms of the mechanism of ET, especially through its two hypotheses. Hypothesis 1 is based on the theory of low spatial-scale effects for AE. Hypothesis 2 is based on TFL, which ensures the maximum likelihood estimation of ET in land cover, phenology, surface topography and roughness length.
-
EFAF requires relatively few inputs, at most two or three. The first type of input is remotely sensed ET or LE images with no consideration of the spatial-scale effect. These images can be obtained from ET products or calculated using RS algorithms of heat fluxes that were mainly designed to calculate LE or ET under unsaturated conditions and do not consider heterogeneities in the land surface (including single-source and two-source models). The second type of input is high-spatial-resolution land cover images, which are readily available. For example, GlobeLand30 is a global land cover data with a 30 m resolution, which can be downloaded free of charge from the following website: http://www.globallandcover.com/GLC30Download/index.aspx (last access: February 2019). The third type of input is daily AE, which is available directly from LE products in the first type of input or can be calculated using forcing data and heat flux algorithms.
However, similar to other remotely sensed ET models, EFAF has several limitations:
-
Incorrect classifications directly impact the EF of mixed-pixel estimates. As discussed in Sect. 4.4, relatively small errors resulted from the misclassification of vegetation with similar phenological conditions; however, larger errors resulted from the misclassification of vegetation with different phenological conditions and misclassification between vegetation and water bodies. Major errors resulted from the misclassification of buildings, bare soils and vegetation and of buildings, bare soils and water, though this was less common.
-
LE and EF retrievals are limited to clear-sky conditions. Clouds limit TIR observations of land surface temperatures and of the downward shortwave radiation, which control energy partitioning and ET (Bastiaanssen et al., 1998; Allen et al., 2007a; Ershadi et al., 2013). For example, TIR measurements of up to 1 K uncertainty allow ET estimates to have a relative error of up to 10 % (Hook et al., 2004; Blonquist et al., 2009; Cammalleri et al., 2012; Hulley et al., 2012; Fisher et al., 2013). If a cloud covers a mixed-pixel area, the EFAF can reduce the effects of the cloud, but there will be a large error in the pure pixels covered by clouds.
-
Mismatch between the footprint of the EC measurement mismatches and the satellite image pixels is likely to increase the uncertainties in validation and create discrepancies between the retrieved LE and EC measurements, which are especially relevant for the LE or ET of heterogeneous surfaces. This problem is beyond the scope of this study and should be addressed in future work.
-
The underlying assumption and starting point of this method is that the pure pixel is truly the actual “purity” of the pure pixels; therefore, the EF of pure pixels is representative of at least the surrounding mixed pixels. Only land cover information was used to define pure pixels; therefore, subsurface heterogeneity in pure pixels caused by other aspects (such as variations in the surface variables) may have certain influences on the results. Including additional features in the definition of pure pixels may increase the complexity of the model and the difficulties of its application significantly.
-
Mixed land cover types in a pixel are the major source of scaling errors in ET estimates (Chen, 1999). However, spatial patterns of other surface variables, such as land surface temperature, surface albedo values, downward shortwave radiation and other factors, are also inherently heterogeneous, which cannot be ignored. For example, Norman et al. (2003) proposed the DisALEXI model to increase the accuracy of estimating surface ET considering scale effects that arise from the use of atmospheric temperature. And Peng et al. (2016) proposed a temperature-sharpening and flux aggregation scheme (TSFA) model to capture the influence of land surface temperatures of sub-pixels for ET estimates. EFAF has increased the accuracy of ET estimates by considering the scale effects that arise from land cover types. The scale effects caused by the heterogeneity of the surface variables for ET estimates require further investigation in EFAF. Addressing these issues forms the foundation of our ongoing work.
This study aimed to develop an operational model for estimating the daily ET of heterogeneous surfaces that is capable of reproducing daily ET with reasonable accuracy but easy to apply. A simple model (EFAF) was developed to calculate the ET of mixed pixels based on the EF and AF from a high-resolution map of land cover types. Temporal-scale extrapolation of the instantaneous latent heat flux (LE) at satellite overpass time to daily ET depends on the widely accepted EF model. For heterogeneous surfaces, an equation was derived to calculate the EF of mixed pixels based on two key hypotheses. Hypothesis 1 states that the AE of each sub-pixel is approximately equal to that of any other sub-pixels in the same mixed pixel within an acceptable margin of error and is equivalent to the AE of the mixed pixel. Hypothesis 2 states that the EF of each sub-pixel is equal to the EF of the nearest pure pixel(s) of the same land cover type. Determination of the EF of mixed pixels also depends on high-resolution land cover data to calculate the AF and the position of pure pixels. Daily ET is calculated by combining the EF of mixed pixels and the daily AE, which can be obtained from energy flux products or retrieved using forcing data.
The EFAF method was applied to an artificial oasis in the midstream area of the Heihe River using HJ-1B satellite data at a spatial resolution of 300 m. The results show that the EFAF can improve the accuracy of daily ET estimation relative to the lumped method. Validations at 12 sites with EC systems during 9 days of HJ-1B overpass showed that the R2 increased from 0.62 to 0.82, the RMSE decreased from 2.47 to 1.60 MJ m−2 (0.99 to 0.64 mm), and the MBE decreased from 1.92 to 1.18 MJ m−2 (0.77 to 0.47 mm), which are a significant improvements.
Error analysis suggests that the two key hypotheses of the model induce relatively little error. The expected value of the absolute error in AE due to Hypothesis 1 was within 0–7 W m−2, and the maximum RMSE of the EF for each land cover type due to Hypothesis 2 was 0.047 for maize, 0.055 for grass, 0.048 for bare soil and 0.059 for vegetables. However, we note that the results arise from a single study site and the model should be tested and validated in other areas.
In brief, the estimated LE of pure pixels is considered accurate and used to calculate its EF. Based on this parameter, the equation for the EF of mixed pixels was established with two key hypotheses. A finer-resolution land cover map is needed to search for “pure pixels” as well as to calculate the area ratio of each land cover type in mixed pixels. This process can derive the daily ET from coarse-resolution remote sensing data with acceptable accuracy, and no other finer resolution data are needed in the EFAF method. Thus, this method may be applicable on a daily basis with daily coarse-resolution imagery, such as MODIS, and only one finer resolution land cover map for a certain length of time, i.e. a week, month or season, as long as the land cover change is not extreme in that period. It is quite convenient for regional applications that need long-term running. This method can also be used as a correcting technique for LE estimations or remote sensing products since calculating the EF of mixed pixels is carried out after calculating heat fluxes that could be based on an energy balance equation or other methods at the very beginning. However, the application of the EFAF could be limited with very coarse-resolution data since the probability of pure pixels becomes very low. In these circumstances, a compromise may have to be made between the “purity” of pure pixels and the searching distance for the pure pixels. Additional investigations are needed to evaluate the performance of this method with different remote sensing products.
The HJ-1B data can be accessed at CRESDA via http://218.247.138.119:7777/DSSPlatform/productSearch.html (CRESDA, 2012). The land cover maps of the Heihe River basin are available on the website of CARD via http://card.westgis.ac.cn/data/6bbf9a3f-e7d8-4255-9ecb-131e1543316d (CARD, 2016a). The HiWATER experiment in situ dataset is accessible from CARD via http://card.westgis.ac.cn/hiwater/mso (CARD, 2016b).
FL and XX provided the ideas for this work; FL, XX and ZP designed the experiments; FL prepared the manuscript and performed the experiments; ZP collected and processed the data. QL participated in discussions and revising the manuscript; FL wrote the paper.
The authors declare that they have no conflict of interest.
We thank all of the scientists and engineers who took part in the HiWATER
experiment. We also thank the editors and reviewers for their generous help
in revising the paper. This study was jointly supported by the Chinese
Natural Science Foundation Project (grant no. 41871252 and no. 41371360) and
the Special Fund from the Chinese Academy of Sciences (KZZD-EW-TZ-18).
Edited by: Graham Jewitt
Reviewed by: Joris Timmermans and one anonymous referee
Allen, R. G., Tasumi, M., Morse, A., Trezza, R., Wright, J. L., Bastiaanssen, W., Kramber, W., Lorite, I., and Robison, C. W.: Satellite-based energy balance for mapping evapotranspiration with internalized calibration (METRIC)-applications, J. Irrig. Drain. Eng., 133, 395–406, 2007a.
Allen, R. G., Tasumi, M., and Trezza, R.: Satellite-based energy balance for mapping evapotranspiration with internalized calibration (METRIC) – Model, J. Irrig. Drain. Eng., 133, 380–394, 2007b.
Anderson, M. C., Kustas, W. P., Norman, J. M., Hain, C. R., Mecikalski, J. R., Schultz, L., González-Dugo, M. P., Cammalleri, C., d'Urso, G., Pimstein, A., and Gao, F.: Mapping daily evapotranspiration at field to continental scales using geostationary and polar orbiting satellite imagery, Hydrol. Earth Syst. Sci., 15, 223–239, https://doi.org/10.5194/hess-15-223-2011, 2011.
Anderson, M. C., Allen, R. G., Morse, A., and Kustas, W. P.: Use of Landsat thermal imagery in monitoring evapotranspiration and managing water resources, Remote Sens. Environ., 122, 50–65, 2012.
Andrews, L.: A template for the nearest neighbor problem, C/C Users J., 19, 40–49, 2001.
Bastiaanssen, W. G., Menenti, M., Feddes, R., and Holtslag, A.: A remote sensing surface energy balance algorithm for land (SEBAL). 1. Formulation, J. Hydrol., 212, 198–212, 1998.
Bin, L. and Roni, A.: The Impact of Spatial Variability of Land-Surface Characteristics on Land-Surface Heat Fluxes, J. Climate, 7, 527–537, 1994.
Bisht, G., Venturini, V., Islam, S., and Jiang, L.: Estimation of the net radiation using MODIS (Moderate Resolution Imaging Spectroradiometer) data for clear sky days, Remote Sens. Environ., 97, 52–67, 2005.
Blonquist Jr, J., Norman, J., and Bugbee, B.: Automated measurement of canopy stomatal conductance based on infrared temperature, Agr. Forest Meteorol., 149, 2183–2197, 2009.
Blyth, E. M. and Harding, R. J.: Application of aggregation models to surface heat flux from the Sahelian tiger bush, Agr. Forest Meteorol., 72, 213–235, 1995.
Bonan, G. B., Pollard, D., and Thompson, S. L.: Influence of Subgrid-Scale Heterogeneity in Leaf Area Index, Stomatal Resistance, and Soil Moisture on Grid-Scale Land–Atmosphere Interactions, J. Climate, 6, 1882–1897, 1993.
Bonan, G. B., Levis, S., Kergoat, L., and Oleson, K. W.: Landscapes as patches of plant functional types: An integrating concept for climate and ecosystem models, Global Biogeochem. Cy., 16, 5-1–5-23, 2002.
Cammalleri, C., Anderson, M., Ciraolo, G., D'urso, G., Kustas, W., La Loggia, G., and Minacapilli, M.: Applications of a remote sensing-based two-source energy balance algorithm for mapping surface fluxes without in situ air temperature observations, Remote Sens. Environ., 124, 502–515, 2012.
CARD – World Data System for Cold and Arid Regions: http://card.westgis.ac.cn/data/ 6bbf9a3f-e7d8-4255-9ecb-131e1543316d (last access: 18 January 2016), 2016a.
CARD – World Data System for Cold and Arid Regions: http://card. westgis.ac.cn/hiwater/mso (last access: 4 July 2016), 2016b.
Carlson, T.: An overview of the “triangle method” for estimating surface evapotranspiration and soil moisture from satellite imagery, Sensors, 7, 1612–1629, 2007.
Chávez, J. L., Neale, C. M. U., Prueger, J. H., and Kustas, W. P.: Daily evapotranspiration estimates from extrapolating instantaneous airborne remote sensing ET values, Irrig. Sci., 27, 67–81, 2008.
Chen, J. M.: Spatial scaling of a remotely sensed surface parameter by contexture, Remote Sens. Environ., 69, 30–42, 1999.
CRESDA – China Centre for Resources Satellite Data and Application: http://218.247.138.119:7777/DSSPlatform/productSearch.html, 2012.
El Maayar, M. and Chen, J. M.: Spatial scaling of evapotranspiration as affected by heterogeneities in vegetation, topography, and soil texture, Remote Sens. Environ., 102, 33–51, 2006.
Ershadi, A., Mccabe, M. F., Evans, J. P., and Walker, J. P.: Effects of spatial aggregation on the multi-scale estimation of evapotranspiration, Remote Sens. Environ., 131, 51–62, 2013.
Falge, E., Baldocchi, D., Olson, R., Anthoni, P., Aubinet, M., Bernhofer, C., Burba, G., Ceulemans, R., Clement, R., and Han, D.: Gap filling strategies for defensible annual sums of net ecosystem exchange, Agr. Forest Meteorol., 107, 43–69, 2001.
Fisher, J., Mallick, K., Lee, J., Hulley, G., Hughes, C., and Hook, S.: Uncertainty in evapotranspiration from uncertainty in land surface temperature, American Meteorological Society, Austin, Texas, 2013.
Garrigues, S., Allard, D., Baret, F., and Weiss, M.: Quantifying spatial heterogeneity at the landscape scale using variogram models, Remote Sens. Environ., 103, 81–96, 2006.
Gottschalk, L., Batchvarova, E., Gryning, S. E., Lindroth, A., Melas, D., Motovilov, Y., Frech, M., Heikinheimo, M., Samuelsson, P., and Grelle, A.: Scale aggregation – comparison of flux estimates from NOPEX, Agr. Forest Meteorol., 98–99, 103–119, 1999.
Gu, J., Li, X., and Huang, C.: Land Cover Classification in Heihe River Basin with Time Series – MODIS NDVI Data, in: International Conference on Fuzzy Systems and Knowledge Discovery, 18–20 October 2008, Jinan, Shandong, China, 477–481, 2008.
He, L., Chen, J. M., Pisek, J., Schaaf, C. B., and Strahler, A. H.: Global clumping index map derived from the MODIS BRDF product, Remote Sens. Environ., 119, 118–130, 2012.
Hong, S. H., Hendrickx, J. M. H., and Borchers, B.: Up-scaling of SEBAL derived evapotranspiration maps from Landsat (30 m) to MODIS (250 m) scale, J. Hydrol., 370, 122–138, 2009.
Hook, S. J., Chander, G., Barsi, J. A., Alley, R. E., Abtahi, A., Palluconi, F. D., Markham, B. L., Richards, R. C., Schladow, S. G., and Helder, D. L.: In-flight validation and recovery of water surface temperature with Landsat-5 thermal infrared data using an automated high-altitude lake validation site at Lake Tahoe, IEEE T. Geosci. Remote, 42, 2767–2776, 2004.
Hu, G. and Jia, L.: Monitoring of evapotranspiration in a semi-arid inland river basin by combining microwave and optical remote sensing observations, Remote Sensing, 7, 3056–3087, 2015.
Hu, Z. L. and Islam, S.: A framework for analyzing and designing scale invariant remote sensing algorithms, T. IEEE Geosci. Remote, 35, 747–755, 1997.
Hulley, G. C., Hughes, C. G., and Hook, S. J.: Quantifying uncertainties in land surface temperature and emissivity retrievals from ASTER and MODIS thermal infrared data, J. Geophys. Res.-Atmos., 117, D23113, https://doi.org/10.1029/2012JD018506, 2012.
Jackson, R. D., Hatfield, J. L., Reginato, R. J., Idso, S. B., and Jr, P. J. P.: Estimation of daily evapotranspiration from one time-of-day measurements, Agr. Water Manage., 7, 351–362, 1983.
Jiang, B., Liang, S., Townshend, J. R., and Zan, M. D.: Assessment of the Radiometric Performance of Chinese HJ-1 Satellite CCD Instruments, IEEE J. Select. Top. Appl. Earth Obs. Remote Sens., 6, 840–850, 2013.
Jiao, J., Xin, X., Shanshan, Y. U., Zhou, T., and Peng, Z.: Estimation of surface energy balance from HJ-1 satellite data, J. Remote Sens., 18, 1048–1058, 2014.
Jin, Z., Tian, Q., Chen, J. M., and Chen, M.: Spatial scaling between leaf area index maps of different resolutions, J. Environ. Manage., 85, 628–637, 2007.
Kimball, J. S., Running, S. W., and Saatchi, S. S.: Sensitivity of boreal forest regional water flux and net primary production simulations to sub-grid-scale land cover complexity, J. Geophys. Res.-Atmos., 104, 27789–27801, 1999.
Kormann, R. and Meixner, F. X.: An Analytical Footprint Model For Non-Neutral Stratification, Bound.-Lay. Meteorol., 99, 207–224, 2001.
Kustas, W. P. and Norman, J. M.: Evaluating the effects of subpixel heterogeneity on pixel average fluxes, Remote Sens. Environ., 74, 327–342, 2000.
Kustas, W. P., Moran, M. S., and Meyers, T. P.: The Bushland Evapotranspiration and Agricultural Remote Sensing Experiment 2008 (BEAREX08) Special Issue, Adv. Water Resour., 50, 1–3, 2012.
Li, H., Liu, Q., Zhong, B., Du, Y., Wang, H., and Wang, Q.: A single-channel algorithm for land surface temperature retrieval from HJ-1B/IRS data based on a parametric model, in: 2010 IEEE International Geoscience and Remote Sensing Symposium (IGARSS), Honolulu, Hawaii, USA, 2448–2451, 2010.
Li, L., Xin, X. Z., Su, G. L., and Liu, Q. H.: Photosynthetically active radiation retrieval based on HJ-1A/B satellite data, Sci. China Earth Sci., 53, 81–91, 2011.
Li, X. and Wang, Y.: Prospects on future developments of quantitative remote sensing, Acta Geogr. Sin., 68, 1163–1169, https://doi.org/10.11821/dlxb201309001, 2013.
Li, X., Cao, C., and Chang, C.: The first law of geography and spatial temporal proximity, Chin. J. Nat., 29, 69–71, 2007.
Li, X., Cheng, G., Liu, S., Xiao, Q., Ma, M., Jin, R., Che, T., Liu, Q., Wang, W., and Qi, Y.: Heihe Watershed Allied Telemetry Experimental Research (HiWATER): Scientific Objectives and Experimental Design, B. Am. Meteorol. Soc., 94, 1145–1160, 2013.
Li, Z. L., Tang, B. H., Wu, H., Ren, H., Yan, G., Wan, Z., Trigo, I. F., and Sobrino, J. A.: Satellite-derived land surface temperature: Current status and perspectives, Remote Sens. Environ., 131, 14–37, 2013.
Liang, S., Stroeve, J., and Box, J. E.: Mapping daily snow/ice shortwave broadband albedo from Moderate Resolution Imaging Spectroradiometer (MODIS): The improved direct retrieval algorithm and validation with Greenland in situ measurement, J. Geophys. Res.-Atmos., 110, D10109, https://doi.org/10.1029/2004JD005493, 2005.
Liu, D., Li, J., Yu, Q., Tong, X., and Ouyang, Z.: Energy balance closure and its effects on evapotranspiration measurements with the eddy covariance technique in a cropland, Acta Ecol. Sin., 32, 5309–5317, 2012.
Liu, Q., Wang, L., Qu, Y., Liu, N., Liu, S., Tang, H., and Liang, S.: Preliminary evaluation of the long-term GLASS albedo product, Int. J. Digit. Earth, 6, 69–95, 2013.
Liu, S., Xu, Z., Song, L., Zhao, Q., Ge, Y., Xu, T., Ma, Y., Zhu, Z., Jia, Z., and Zhang, F.: Upscaling evapotranspiration measurements from multi-site to the satellite pixel scale over heterogeneous land surfaces, Agricultural & Forest Meteorology, 230, 97-113, 2016.
Liu, S. M., Xu, Z. W., Wang, W. Z., Jia, Z. Z., Zhu, M. J., Bai, J., and Wang, J. M.: A comparison of eddy-covariance and large aperture scintillometer measurements with respect to the energy balance closure problem, Hydrol. Earth Syst. Sci., 15, 1291–1306, https://doi.org/10.5194/hess-15-1291-2011, 2011.
Long, D. and Singh, V. P.: A two-source trapezoid model for evapotranspiration (TTME) from satellite imagery, Remote Sens. Environ., 121, 370–388, 2012.
Ma, M. and Veroustraete, F.: Interannual variability of vegetation cover in the Chinese Heihe River Basin and its relation to meterological parameters, Int. J. Remote Sens., 27, 3473–3486, 2006.
McCabe, M. F. and Wood, E. F.: Scale influences on the remote estimation of evapotranspiration using multiple satellite sensors, Remote Sens. Environ., 105, 271–285, https://doi.org/10.1016/j.rse.2006.07.006, 2006.
McCabe, M. F., Rodell, M., Alsdorf, D. E., Miralles, D. G., Uijlenhoet, R., Wagner, W., Lucieer, A., Houborg, R., Verhoest, N. E. C., Franz, T. E., Shi, J., Gao, H., and Wood, E. F.: The future of Earth observation in hydrology, Hydrol. Earth Syst. Sci., 21, 3879–3914, https://doi.org/10.5194/hess-21-3879-2017, 2017.
Miller, H. J.: Tobler's First Law and Spatial Analysis, Ann. Assoc. Am. Geogr., 94, 284–289, 2004.
Moran, M. S., Humes, K. S., and Pinter Jr., P. J.: The scaling characteristics of remotely-sensed variables for sparsely-vegetated heterogeneous landscapes, J. Hydrol., 190, 337–362, 1997.
Mu, Q., Heinsch, F. A., Zhao, M., and Running, S. W.: Development of a global evapotranspiration algorithm based on MODIS and global meteorology data, Remote Sens. Environ., 111, 519–536, 2007.
Mu, Q., Zhao, M., and Running, S. W.: Improvements to a MODIS global terrestrial evapotranspiration algorithm, Remote Sens. Environ., 115, 1781–1800, 2011.
Nichols, W. E. and Cuenca, R. H.: Evaluation of the evaporative fraction for parameterization of the surface energy balance, Water Resour. Res., 29, 3681–3690, 2010.
Nilson, T.: A theoretical analysis of the frequency of gaps in plant stands, Agricult. Meteorol., 8, 25–38, 1971.
Norman, J. M., Kustas, W. P., and Humes, K. S.: Source approach for estimating soil and vegetation energy fluxes in observations of directional radiometric surface temperature, Agr. Forest Meteorol., 77, 263–293, 1995.
Norman, J. M., Anderson, M. C., Kustas, W. P., French, A. N., Mecikalski, J., Torn, R., Diak, G. R., Schmugge, T. J., and Tanner, B. C. W.: Remote sensing of surface energy fluxes at 101-m pixel resolutions, Water Resour. Res., 39, 1221, https://doi.org/10.1029/2002WR001775, 2003.
Pan, Z. and Liu, G.: Evapotranspiration Research of Yellow River Delta Using Remote Sensing Method, Geo-Inform. Sci., 3, 91–96, 2003.
Peng, Z. Q., Xin, X., Jiao, J. J., Zhou, T., and Liu, Q.: Remote sensing algorithm for surface evapotranspiration considering landscape and statistical effects on mixed pixels, Hydrol. Earth Syst. Sci., 20, 4409–4438, https://doi.org/10.5194/hess-20-4409-2016, 2016.
Sánchez, J., Kustas, W., Caselles, V., and Anderson, M.: Modelling surface energy fluxes over maize using a two-source patch model and radiometric soil and canopy temperature observations, Remote Sens. Environ., 112, 1130–1143, 2008.
Seguin, B., Becker, F., Phulpin, T., Gu, X., Guyot, G., Kerr, Y., King, C., Lagouarde, J., Ottlé, C., and Stoll, M.: IRSUTE: a minisatellite project for land surface heat flux estimation from field to regional scale, Remote Sens. Environ., 68, 357–369, 1999.
Sharma, V., Kilic, A., and Irmak, S.: Impact of scale/resolution on evapotranspiration from Landsat and Modis images, Water Resour. Res., 52, 1207–1221, 2016.
Su, Z.: The Surface Energy Balance System (SEBS) for estimation of turbulent heat fluxes, Hydrol. Earth Syst. Sci., 6, 85–100, https://doi.org/10.5194/hess-6-85-2002, 2002.
Sugita, M. and Brutsaert, W.: Daily evaporation over a region from lower boundary layer profiles measured with radiosondes, Water Resour. Res., 27, 747–752, 1991.
Tian, Y., Woodcock, C. E., Wang, Y., Privette, J. L., Shabanov, N. V., Zhou, L., Zhang, Y., Buermann, W., Dong, J., and Veikkanen, B.: Multiscale analysis and validation of the MODIS LAI product: I. Uncertainty assessment, Remote Sens. Environ., 83, 414–430, 2002.
Timmermans, W. J., Kustas, W. P., Anderson, M. C., and French, A. N.: An intercomparison of the surface energy balance algorithm for land (SEBAL) and the two-source energy balance (TSEB) modeling schemes, Remote Sens. Environ., 108, 369–384, 2007.
Tobler, W.: On the First Law of Geography: A Reply, Ann. Assoc. Am. Geogr., 94, 304–310, 2004.
Valor, E. and Caselles, V.: Mapping land surface emissivity from NDVI: application to European, African, and South American areas, Remote Sens. Environ., 57, 167–184, 1996.
Wu, J., Ding, Y., Wang, G., Yamazaki, Y., and Kubota, J.: Evapotranspiration of intercropping field in an artifical oasis in arid region, T. Chin. Soc. Agr. Eng., 22, 16–20, 2006.
Xin, X., Liu, Y., and Liu, Q.: Spatial-scale error correction methods for regional fluxes retrieval using MODIS data, J. Remote Sens., 16, 207–231, 2012.
Xu, Z. W., Liu, S. M., Li, X., Shi, S. J., Wang, J. M., Zhu, Z. L., Xu, T. R., Wang, W. Z., and Ma, M. G.: Intercomparison of surface energy flux measurement systems used during the HiWATER-MUSOEXE, J. Geophys. Res.-Atmos., 118, 13140–13157, https://doi.org/10.1002/2013JD020260, 2013.
Yang, K. and Wang, J. M.: A temperature prediction-correction method for estimating surface soil heat flux from soil temperature and moisture data, Sci. China Earth Sci., 51, 721–729, 2008.
Yu, W., Li, J., Liu, Q., Zeng, Y., Yin, G., Zhao, J., and Xu, B.: Extraction and Analysis of Land Cover Heterogeneity over China, Adv. Earth Sci., 31, 1067–1077, 2016.
Zezula, P., Amato, G., Dohnal, V., and Batko, M.: Similarity search: the metric space approach, Springer Science & Business Media, Heidelberg, 2006.
Zhang, L. and Lemeur, R.: Evaluation of daily evapotranspiration estimates from instantaneous measurements, Agr. Forest Meteorol., 74, 139–154, 1995.
Zhang, X., Zhao, X., Liu, G., Qian, K., and Wu, D.: Radioactive Quality Evaluation and Cross Validation of Data from the HJ-1A/B Satellites' CCD Sensors, Sensors, 13, 8564–8576, 2013.
Zhong, B., Ma, P., Nie, A., Yang, A., Yao, Y., Lü, W., Zhang, H., and Liu, Q.: Land cover mapping using time series HJ-1/CCD data, Sci. China Earth Sci., 57, 1790–1799, 2014a.
Zhong, B., Zhang, Y., Du, T., Yang, A., Lv, W., and Liu, Q.: Cross-Calibration of HJ-1/CCD Over a Desert Site Using Landsat ETM+ Imagery and ASTER GDEM Product, IEEE T. Geosci. Remote, 52, 7247–7263, 2014b.


